Submitted:
04 November 2024
Posted:
06 November 2024
Read the latest preprint version here
Abstract
This work aims to analyze the responses of eight floating wind turbines. From this perspective, this paper will compare the response offset regarding the motions of the six degrees of freedom of the respective floating wind turbines. The applied forces these analyses consider mainly come from constant wind forces applied on the wind turbines’ blades, as well as forces from waves and currents. Different values are considered and compared regarding the constant wind speeds, as well as the velocities of waves and currents. This paper also considers a wide range of innovative references related to floating wind turbine analyses and software. Validation and verification studies are left for future work due to the complexity of the data provided in this paper.
Keywords:
renewable energy
; offshore wind
; floating platforms
; marine environment
1. Introduction
Floating wind turbines have recently become the topic of interest in the fields of naval architecture and renewable energy. Therefore, conducting an analysis illustrating their response offsets is very important. From this perspective, this paper will cover the six-degree-of-freedom motion amplitudes for each of the eight floating wind turbines considered in the study throughout this paper. Figure 1 shows the four floating wind turbine types which cover the analyzed eight floating wind turbine concepts throughout this paper.
Barges are not as popular as the other floating wind turbine concepts (Spar, Semi-submersible, and TLP) and therefore they are not included in this study. However, they are expected to share amplitude values of relevance to the semi-submersible floating wind turbines. The eight floating wind turbines considered in the study were also included in a previously published paper by the authors covering a complete and up-to-date review and aspects of relevance to modern floating wind turbines [1]. Figure 2, Figure 3, Figure 4, Figure 5, Figure 6, Figure 7, Figure 8 and Figure 9 show the eight floating wind turbines covered throughout this analysis. Figure 2 presents an illustration of one of the considered floating wind turbines (OO-Star).
Figures 2, 3, 4, 8, and 9 show semi-submersible floating wind turbine types (OO-Star, CSC, WindFloat, INO-WINDMOOR, and U-Maine Volturn-US respectively). The first three turbines have a power capacity of 10 MW each. While the latter two have 12 and 15 MW power capacity respectively. It is to be noted that floating wind turbines with a power capacity of 10 MW throughout this analysis have a rated wind speed of 11,4 m/s each. While the other wind turbines with 12 and 15 MW respectively have a rated wind speed of 10,6 m/s. It is also to be noted that all the presented floating wind turbines throughout this study implement upwind turbines except the INO-WINDMOOR 12 MW semi-submersible which implements a downwind turbine. This means that the latter floating wind turbine generates energy by allowing the wind to hit its blades from their backside (See Figure 8). Figure 5 and Figure 6 show floating wind turbines with a spar type. Both turbines have the same power capacity of 10 MW and share most characteristics including water depth with a slight modification in the height of their support structures (See Figure 5 and Figure 6 for further details). Figure 7 shows a floating wind turbine with a TLP type. This turbine has a conventional power capacity of 10 MW. Section 2 presents generic output values from Sima 4.2.0 software regarding the three degrees of freedom (Surge, Roll, and Pitch) of the eight floating wind turbines considered in the analyses of this paper.
The following reference presents the resource the eight floating wind turbine Sima models (geometries in Sima 4.2.0 software) were obtained from [4]. These models were used to carry out constant wind analyses, from which the output data is comprehensively presented throughout this paper.
The next section will present the materials and methods of relevance to the floating wind turbines’ response offset data presented in this paper.
2. Materials and Methods
This section presents the output data obtained through the analyses conducted on the eight floating wind turbines throughout this study in the Sima 4.2.0 software. As was mentioned in the preceding section, these analyses contain the response offset amplitudes for the three degrees of freedom (Surge, Roll, and Pitch) for the eight floating wind turbines considered in this study. Section 3 will provide further comparison of the obtained results. Section 3 will additionally include more results (not constrained to only three degrees of freedom, etc.) which will be compared with the results provided in section 2. Section 4 will provide discussions on the overall results. It is to be noted that the Sima 4.2.0 software used to conduct these analyses implements linear potential flow theory for generating the sea surface. Further details of the sea elevation equations implemented in this software can be consulted in corresponding literature sources. Further references can be consulted to review the relevant equations regarding the wind flow and the mooring lines physics.
As was just mentioned, this section only considers the three degrees of freedom response offset data for the “no wave and current” condition. The next section (Section 3) considers the response offset of the six degrees of freedom of the eight floating wind turbines analyzed in this study. It is to be noted that Section 2 only considers the three most important degrees of freedom (Surge, Roll, and Pitch). Section 3 considers all the six degrees of freedom of the floating wind turbines (Surge, Sway, Heave, Roll, Pitch, and Yaw). In other words, for the “only wind” analyses, only three degrees of freedom are studied (namely Surge, Roll, and Pitch). For the “wind, wave, and current” condition, all the degrees of freedom are studied (Namely Surge, Sway, Heave, Roll, Pitch, and Yaw).
Section 2 presents nine tables (Tables 1-9) including the response offset amplitudes for the three degrees of freedom of each of the eight floating wind turbines studied in this paper. After each table, its corresponding data was plotted in separate figure (Figures 10-18). The significant wave height (Hs) and the peak period (Tp) relevant to the analyses presented in this section were set to 0,001 m and 20 s respectively to eliminate any wave and current contribution of the eight floating wind turbines considered in this study. In other words, the sea surface will have a negligible water depth of 0,001 m and a sufficiently long peak period of 20 s which will not contribute to generating any forces from the waves and currents on the considered floating wind turbines. This is to merely study the effect of the different wind forces on the concerned floating wind turbines in the study in this section (Section 2). However, as was mentioned above, the succeeding section (Section 3) will include contributions from the waves by setting in more realistic significant wave heights and peak periods which will contribute to the response offset amplitudes of the concerned floating wind turbines. Concerning these nine tables, the response offset amplitude values presented in them for each of the three degrees of freedom for every presented floating wind turbine were taken from averaging the last 100 s from a total time series simulation time of 800 s for every degree of freedom. Although this simulation time of 800 s was not enough to eliminate transients from the time series of many of the degrees of freedom offset response amplitude time series and provide pure steady-state response values, it was considered that it still presents enough accurate and representative data bearing in mind that a small error should be expected. This flaw was accepted due to the nature of the analyses we are dealing with in this study, which include a very large set of analyzed data facilitating the study's feasibility. To obtain as accurate as possible data through this total simulation time for every response degree-of-freedom motion amplitude, the simulations’ time step was set to 0,005 s. In contrast, the wave/body response time step (time increment) was set equal to 0,1 s. It is to be noted that the data presented in Tables 10-17 consider valid significant wave height (Hs) and peak periods (Tp) values which contribute to the wave influence on each of the response offset amplitudes obtained for each of the degrees-of-freedom of the floating wind turbines. In these analyses we have increased the time series simulation time to 100 s, averaging the last 100 s and presenting the single averaged value for each of the degree-of-freedom response amplitude of the eight considered floating wind turbines in this study and presenting them in tables in a similar approach carried out in Tables 1-9 (but with only considering the rated wind speeds induced six response offsets). It is to be noted that the spectra used to generate the waves for the different significant wave heights (Hs) and peak periods (Tp) values for the different scenarios considered for each of the degrees-of-freedom for the eight floating wind turbines considered in this study is Jonswap (3 parameters). This was implemented in the Sima-4.2.0 software used to conduct this study. Furthermore, because we are considering only constant wind analyses in this paper, the stationary uniform wind option was implemented in the software.
Table 1 and Figure 10 present the surge response offset amplitudes for four out of the eight floating wind turbines considered in this study. Namely, three semi-submersibles (OO-Star, CSC, and WindFloat) and one TLP (TLPWT). They all share a power capacity of 10 MW each. The rated speed of all the 10 MW floating wind turbines studied in this paper is 11,4 m/s which is the speed at which these turbines generate maximum electricity. The analysis conducted in Section 2 covers 12 wind speed values ranging from a minimum wind speed of 4 m/s to a maximum wind speed of 24 m/s. It is to be noted from the tables that the rated wind speed (11,4 m/s) often has the highest response offset amplitudes. However, mainly due to the averaging technique used to present the data in this paper, the rated wind speed loses its highest amplitude in some cases.
According to Table 1 and Figure 10, the OO-Star semi-submersible floating wind turbine has surge amplitude values increasing from roughly 5 to 40,4 m for the wind speeds of 4 and 11,4 m/s respectively. Then the surge response offset amplitude goes down from 33,9 to 12,2 m for the wind speeds of 12 m/s and 24 m/s respectively.
CSC semi-submersible floating wind turbine has surge amplitude values increasing from roughly 1,6 to 11,7 m for the wind speeds of 4 and 11,4 m/s respectively. Then the surge response offset amplitude goes down from 9,6 to 4,5 m for the wind speeds of 12 m/s and 24 m/s respectively.
WindFloat semi-submersible floating wind turbine has surge amplitude values increasing from roughly 1,9 to 13,4 m for the wind speeds of 4 and 11,4 m/s respectively. Then the surge response offset amplitude goes down from 11,4 to 5 m for the wind speeds of 12 m/s and 24 m/s respectively.
TLPWT TLP floating wind turbine has surge amplitude values increasing from roughly 0,5 to 2,2 m for the wind speeds of 4 and 11,4 m/s respectively. Then the surge response offset amplitude goes down from 2,8 to 1,2 m for the wind speeds of 12 m/s and 24 m/s respectively.
According to Table 2 and Figure 11, the OO-Star Semi-submersible floating wind turbine has Roll amplitude values increasing from 0,02 to 0,4° for the wind speeds of 4 and 11,4 m/s respectively. Then the Roll response offset amplitude goes down from 0,4 to 0,3° for the wind speeds of 12 and 24 m/s respectively. It is to be noted that the Roll degree of freedom in this case has negligible amplitudes.
CSC Semi-submersible floating wind turbine has Roll amplitude values increasing from roughly 0,01 to 0,3° for the wind speeds of 4 and 11,4 m/s respectively. Then the Roll response offset amplitude ranges around 0,4° for the wind speeds of 12 and 24 m/s respectively. It is to be noted that the roll degree of freedom in this case has negligible amplitudes of less than 1°.
WindFloat semi-submersible floating wind turbine has Roll amplitude values increasing from roughly 0,009 to 0,3° for the wind speeds of 4 and 11,4 m/s respectively. Then the Roll response offset amplitude has values around 0,33° for the wind speeds of 12 and 24 m/s respectively. It is to be noted that the Roll degree of freedom in this case has negligible amplitudes of less than 1°.
TLPWT floating wind turbine has Roll amplitude values increasing from roughly -0,00001 to 0,001° for the wind speeds of 4 and 11,4 m/s respectively. Then the Roll response offset amplitude decreases from 0,001 to -0,002° for the wind speeds of 12 and 24 m/s respectively. It is to be noted that the Roll degree of freedom in this case has negligible amplitudes of way less than 1°.
According to Table 3 and Figure 12, the OO-Star Semi-submersible floating wind turbine has Pitch amplitude values increasing from roughly 0,7 to 6° for wind speeds of 4 and 11,4 m/s respectively. Then the Pitch response offset amplitude goes down from 4,5 to 2,3° for the wind speeds of 12 and 24 m/s respectively.
CSC Semi-submersible floating wind turbine has Pitch amplitude values increasing from roughly 0,7 to 6,8° for the wind speeds of 4 and 11,4 m/s respectively. Then the Pitch response offset amplitude goes down from 5,7 to 2,6° for the wind speeds of 12 and 24 m/s respectively.
WindFloat Semi-submersible floating wind turbine has Pitch amplitude values increasing from roughly 6,1 to 12° for the wind speeds of 4 and 11,4 m/s respectively. Then the Pitch response offset amplitude goes down from 11,5 to 8° for the wind speeds of 12 and 24 m/s respectively.
TLPWT floating wind turbine has Pitch amplitude values increasing from roughly 0,0007 to 0,005° for the wind speeds of 4 and 11,4 m/s respectively. Then the Pitch response offset amplitude goes down from 0,005 to 0,002° for the wind speeds of 12 and 24 m/s respectively. These are negligible values of less than 1°.
According to Table 4 and Figure 13, the IEA Volturn-US-S Semi-submersible floating wind turbine has Surge amplitude values increasing from roughly 4,2 to 16 m for the wind speeds of 4 and 10,6 m/s respectively. Then the Surge response offset amplitude goes down from 16 to 10 m for the wind speeds of 12 m/s and 24 m/s respectively.
INO-WINDMOOR Semi-submersible floating wind turbine has Surge amplitude values increasing from roughly 3,3 to 10,3 m for the wind speeds of 4 and 10,6 m/s respectively. Then the surge response offset amplitude goes down from 10,3 to 7,5 m for the wind speeds of 12 and 24 m/s respectively.
According to Table 5 and Figure 14, the IEA Volturn-US-S Semi-submersible floating wind turbine has Roll amplitude values increasing from roughly 0,02 to 0,3° for wind speeds of 4 and 10,6 m/s respectively. Then the Roll response offset amplitude goes down from 0,4 to 0,3° for the wind speeds of 12 and 24 m/s respectively.
INO-WINDMOOR semi-submersible floating wind turbine has Roll amplitude values increasing from roughly 0,07 to 0,5° for the wind speeds of 4 and 10,6 m/s respectively. Then the Roll response offset amplitude goes down from 0,6 to 0,4° for the wind speeds of 12 and 24 m/s respectively. These are negligible values of less than 1°.
According to Table 6 and Figure 15, the IEA Volturn-US-S Semi-submersible floating wind turbine has Pitch amplitude values increasing from roughly 0,6 to 2,6° for wind speeds of 4 and 10,6 m/s respectively. Then the Pitch response offset amplitude goes down from 2,6 to 0,9° for the wind speeds of 12 and 24 m/s respectively.
INO-WINDMOOR Semi-submersible floating wind turbine has Pitch amplitude values increasing from roughly 0,7 to 4,4° for the wind speeds of 4 and 10,6 m/s respectively. Then the pitch response offset amplitude goes down from 4,5 to 1,5° for the wind speeds of 12 and 24 m/s respectively.
According to Table 7 and Figure 16, the DTU Spar 1 floating wind turbine has Surge amplitude values increasing from roughly 6,1 to 37,9 m for the wind speeds of 4 and 11,4 m/s respectively. Then the Surge response offset amplitude goes down from 31,4 to 16,8 m for the wind speeds of 12 and 24 m/s respectively.
DTU Spar 2 floating wind turbine has surge amplitude values increasing from roughly 4,6 to 26,4 m for the wind speeds of 4 and 11.4 m/s respectively. Then the Surge response offset amplitude goes down from 29,6 to 13,6 m for the wind speeds of 12 and 24 m/s respectively.
According to Table 8 and Figure 17, the DTU Spar 1 floating wind turbine has Roll amplitude values increasing from roughly 0,01 to 0,2° for the wind speeds of 4 and 11.4 m/s respectively. Then the Roll response offset amplitude goes down from 0,3 to 0,2° for the wind speeds of 12 and 24 m/s respectively.
DTU Spar 2 spar floating wind turbine has roll amplitude values increasing from roughly 0,01 to 0,35° for the wind speeds of 4 and 11,4 m/s respectively. Then the Roll response offset amplitude goes down from 0,35 to 0,28° for the wind speeds of 12 and 24 m/s respectively. These are negligible values of less than 1°.
According to Table 9 and Figure 18, the DTU Spar 1 floating wind turbine has Pitch amplitude values increasing from roughly 1,08 to 7,6° for the wind speeds of 4 and 11,4 m/s respectively. Then the Pitch response offset amplitude goes down from 6,3 to 3,2° for the wind speeds of 12 and 24 m/s respectively.
DTU Spar 2 floating wind turbine has pitch amplitude values increasing from roughly 1,5 to 10,3° for the wind speeds 4 and 11,4 m/s respectively. Then the Pitch response offset amplitude goes down from 10,6 to 4,4° for the wind speeds of 12 and 24 m/s respectively.
3. Results
This section will compare the analyzed data in Section 2 (“no wind” analyses) with additional analysis results provided in this section (“wind, wave, and current” analyses) (See Tables 10-17). These tables present results concerning the six degrees of freedom and are not constrained to only three (Surge, Roll, and Pitch) as in Section 2. In contrast to Section 2, the results provided in this section will be constrained to only “Rated wind speed” induced response offsets. In other words, they will be constrained to only 11,6 m/s for 10 MW floating wind turbines and 10,6 m/s for 12 and 15 MW floating wind turbines.
Table 10 shows that the OO-Star surge motion has its highest value of 80,3 m for the “with wind, wave, and current” condition, compared to the “only wind” surge response offset value of 40,4 m.
The table also shows that the OO-Star roll rotation has its highest value of 0,3685° for the “only wind” condition compared to the other sea states. However, they all have similar and negligible values of less than 0,4°.
The table also shows that the OO-Star pitch rotation has its highest value of 6,0325° for the “with wind, wave, no current” condition, compared to the “only wind” pitch response offset value of 5,9357°. These values are very close and approximately identical.
Table 10 shows that all the degrees of freedom (except Surge and Pitch) of the OO-Star floating wind turbine have negligible values of less than 1 m and 1°.
Table 11 shows that the CSC surge motion has its highest value of 69,3 m for the “with wind, wave, and current” condition, compared to the “only wind” surge response offset value of 11,74 m.
The table also shows that the CSC roll rotation has its highest value of 0,3498° for the “with wind, wave, no current” condition, compared to the “only wind” roll response offset value of 0,3419°. These are negligible values of less than 1°.
The table also shows that the CSC pitch rotation has its highest value of 6,7632° for the “with wind, wave, no current” condition, compared to the “only wind” pitch response offset value of 6,7623°. These values are very similar and approximately identical.
Table 11 shows that all the degrees of freedom (except Surge, Heave, and Pitch) of the CSC floating wind turbine have negligible values of less than 1 m and 1°.
Table 12 shows that the WindFloat surge motion has its highest value of 65.42 m for the “with wind, wave, and current” condition, compared to the “only wind” surge response offset value of 13,4 m.
The table also shows that the WindFloat roll rotation has its highest value of 0,3022° for the “with wind, wave, no current” condition, compared to the “only wind” roll response offset value of 0,30039°. These are negligible values of less than 1°.
The table also shows that the WindFloat pitch rotation has its highest value of 12,4044° for the “only wind” condition compared to the other sea states. However, they all have similar values of less than 13°. These values are very similar and approximately identical.
Table 12 shows that all the degrees of freedom (except Surge, Heave, and Pitch) of the WindFloat floating wind turbine have negligible values of less than 1 m and 1°.
Table 13 shows that the TLPWT surge motion has its highest value of 13,34 m for the “with wind, wave, no current” condition, compared to the “only wind” surge response offset value of 2,2 m.
The table also shows that the TLPWT roll rotation has its highest value of 0,003265° for the “with wind, wave, with current” condition, compared to the “only wind” roll response offset value of 0,001644°. However, all the conditions have similar and negligible values around zero.
The table also shows that the TLPWT pitch rotation has its highest value of 0,006964° for the “with wind, wave, and current” condition, compared to the “only wind” pitch response offset value of 0,005398°. However, all the conditions have similar and negligible values around zero.
Table 13 shows that all the degrees of freedom (except Surge) of the TLPWT floating wind turbine have negligible values of less than 1 m and 1°.
Table 14 shows that the IEA VolturnUS-S surge motion has its highest value of 33,62 m for the “with wind, wave, and current” condition, compared to the “only wind” surge response offset value of 15,95 m. It is observed that the “only wind” condition has half the value of the “with wind, wave and current” condition.
The table also shows that the IEA VolturnUS-S roll rotation has its highest value of 0.3564° for the “with wind, wave, and current” condition, compared to the “only wind” roll response offset value of 0,3343°. However, all the conditions have similar and negligible values around 0,4°.
The table also shows that the IEA VolturnUS-S pitch rotation has its highest value of 2,60788° for the “with wind, wave, no current” condition, compared to the “only wind” pitch response offset value of 2,6074°. However, all the conditions have similar values less than 3°.
Table 14 shows that all the degrees of freedom (except Surge and Pitch) of the IEA Volturn US-S floating wind turbines have negligible values of less than 1 m and 1°.
Table 15 shows that the INO-WINDMOOR surge motion has its highest value of 44,84 m for the “with wind, wave, and current” condition, compared to the “only wind” surge response offset value of 10,33 m.
The table also shows that the INO-WINDMOOR roll rotation has its highest value of 0,5266° for the “only wind” condition compared to the other sea states. However, they all have similar and negligible values around 0,5°.
The table also shows that the INO-WINDMOOR pitch rotation has its highest value of 4,46472° for the “only wind” condition compared to the other sea states. However, they all have similar values of less than 5°.
Table 15 shows that all the degrees of freedom (except Surge, Heave, and Pitch) of the INO-WINDMOOR floating wind turbine have negligible values of less than 1 m and 1°.
Table 16 shows that the DTU Spar 1 surge motion has its highest value of 95,45 m for the “with wind, wave, and current” condition, compared to the “only wind” surge response offset value of 37,91 m.
The table also shows that the DTU Spar 1 roll rotation has its highest value of 0,24329° for the “only wind” condition compared to the other sea states. However, they all have similar and negligible values of less than 0,3°.
The table also shows that the DTU Spar 1 pitch rotation has its highest value of 9,35642° for the “with wind, wave, and current” condition, compared to the “only wind” pitch response offset value of 7,577696°.
Table 16 shows that all the degrees of freedom (except Surge, Heave, and Pitch) of the DTU Spar 1 floating wind turbine have negligible values of less than 1 m and 1°.
Table 17 shows that the DTU Spar 2 surge motion has its highest value of 81,63 m for the “with wind, wave, and current” condition, compared to the “only wind” surge response offset value of 26,39 m.
The table also shows that the DTU Spar 2 roll rotation has its highest value of 0,35256° for the “only wind” condition compared to the other sea states. However, they all have similar and negligible values of less than 0,4°.
The table also shows that the DTU Spar 2 pitch rotation has its highest value of 11,56718° for the “with wind, wave, no current” condition, compared to the “only wind” surge response offset value of 10,2703°.
Table 17 shows that all the degrees of freedom (except Surge, Heave, and Pitch) of the DTU Spar 2 floating wind turbine have negligible values of less than 1 m and 1°.
4. Discussions
This section will present conclusions from Section 3 as well as external references of relevance to the state-of-the-art software and articles relevant to floating wind turbine simulations.
This paper analyzed one TLP, two Spar, and five Semi-submersible floating wind turbines. From this perspective, it was seen throughout the paper that the most important degrees of freedom are Surge, Heave, and Pitch. The other degrees of freedom have shown values around 1 m and 1°.
More specifically, the TLPWT floating wind turbine (See Table 13) has shown negligible values for all the degrees of freedom (except Surge – maximum: 14,34 m (for the “with wind, wave, no current” sea state)).
DTU Spar 1 and DTU Spar 2 floating wind turbines (See Table 16 and Table 17) have shown negligible values for all the degrees of freedom (except Surge, Heave, and Pitch) (Surge – maximum: 95,45 m for the “with wind, wave, and current” sea state for DTU Spar 1).
INO-WINDMOOR semi-submersible floating wind turbine (See Table 15) has shown negligible values for all the degrees of freedom (except Surge, Heave, and Pitch) (Surge – maximum: 44,84 m for the “with wind, wave, and current” sea state).
IEA Volturn US-S semi-submersible floating wind turbine (See Table 14) has shown negligible values for all the degrees of freedom (except Surge) (Surge – maximum: 33,62 m for the “with wind, wave, and current” sea state).
WindFloat semi-submersible floating wind turbine (See Table 12) has shown negligible values for all the degrees of freedom (Surge, Heave, and Pitch) (Surge – maximum: 65,42 m for the “with wind, wave, and current” sea state).
CSC semi-submersible floating wind turbine (See Table 11) has shown negligible values for all the degrees of freedom (except Surge, Heave, and Pitch) (Surge – maximum: 69,3 m for the “with wind, wave, and current” sea state).
OO-Star semi-submersible floating wind turbine (See Table 10) has shown negligible values for all the degrees of freedom (Surge and Pitch) (Surge – maximum: 80,3 m for the “with wind, wave, and current” sea state).
Reference [5] presents a review of 86 different floating wind turbines.
References [6,7] present WINDMOOR 12 MW floating wind turbine hydrostatic stability and hydrodynamics analyses using SIMA, SIMO, RFLEX, and WAMIT software.
References [8,9] present structural analyses of relevance to the 15 MW VolturnUS-S Semi-submersible floating wind turbine using Bladed and SESAM software.
References [10,11,12,13,14] present innovative aspects of relevance to floating wind turbines’ building and classing standards and dynamic responses.
References [15,16,17,18,19,20,21,22] show innovative aspects of relevance to floating wind inter-array dynamic power cables’ analyses, design, and software, as well as information relevant to floating wind mooring systems.
References [23,14,24,25,26,27] present state-of-the-art aspects relevant to 5 MW OC3-Hywind Spar floating wind turbine aero-hydro-servo-elastic analyses, response analyses, multidisciplinary design optimization analyses, as well as relevant numerical simulations and experiments.
References [28,29] present 10 MW OC4 Semi-submersible floating wind turbines’ fully coupled Hydro-Servo-Aero-Elastic Analysis, upscaling design optimization, and verification methodology.
References [30,31,32,33,34] present innovative aspects relevant to floating wind turbines' operations, and structural design tools.
References [35,36,37,38,39,40,41,42,43,44] present floating wind turbine analysis software such as SESAM (GeniE, HydroD, Sima, etc.), Bladed, OrcaFlex, Riflex, and DeepC.
References [45,46,47,48,49,50,51,52,53] present 10 MW DTU wind turbine mounted on bottom-fixed turbines, as well as Spar, Semi-submersible, and TLP floating wind support structures and their corresponding designs and dynamic responses.
References [54,55,56] present bottom-fixed and floating wind turbines' failure analyses concerning their consisting components.
References [57,58,59,60] present floating wind turbines’ design aspects, response, reliability analyses, and similar aspects concerning their dynamic power cables.
References [61,62] present bottom-fixed and floating wind turbines' response analyses, software, and numerical tools.
References [63,64] present 15 MW Semi-submersible floating wind turbine time-domain stress analyses.
References [65,66] present floating wind farms and array-level floating wind turbines' innovative designs and challenges.
References [67,68] present 10 MW Spar floating wind turbines' optimization and efficient design modeling using frequency domain analyses.
References [69,70] present 5 MW CSC Semi-submersible floating wind turbine's design and response reduction analyses using SESAM software. As well as a 10 MW Semi-submersible mooring system design in shallow water relevant to the Hywind Scotland wind project.
References [71,72,73,74] present a review of multidisciplinary design optimization of relevance to Spar, Semi-submersible, and TLP floating wind turbines. As well as guidelines of relevance to the design of floating wind turbines. As well as an illustration of the SESAM software used for the design of floating wind turbines.
References [75,76,77] present floating wind turbines' responses in terms of aerodynamic and hydrodynamic domains. The analyses are conducted in the frequency domain in terms of combined wind and wave effects. As well as two-bladed Spar floating wind turbines coupled dynamic analyses. As well as experimental analyses of Spar, Semi-submersible, and TLP floating wind turbines.
References [78,79] present mooring line analyses of relevance to two connected Spar floating wind turbines. As well as the global responses of two 5 MW CSC Semi-submersible floating wind turbines with a shared mooring system.
References [80,81] present innovative aspects of relevance to floating wind turbine verification and design tools. As well as the design of installation vessels of relevance to floating wind turbines.
References [82,83,58] present floating wind turbines' components of replacement due to their failure. The considered components are mainly the blades as well as the drivetrain components including the nacelle, generator, and gearbox. As well as floating wind turbines' challenges relevant to their implementation in shallow water depths. As well as innovative reliability methods relevant to floating wind turbines' response analyses and experiments.
References [84,85,86] present 5 MW Tension-Leg-Buoy (TLB) validation using tank tests and coupled aero-hydro-servo-elastic numerical tools. As well as aero-hydro-servo-elastic analyses for a TLB floating wind turbine for benchmarking purposes. As well as 10 MW TLB floating wind turbine's coupled aero-hydro-servo-elastic analyses.
References [87,88] present the positive aspects regarding the OO-Star Semi-submersible floating wind turbine, as well as further predictions on the future of the 20 MW floating wind turbines. As well as a Semi-submersible floating wind turbine's support structure strength analysis using three-dimensional potential flow theory.
References [1,89] present a state-of-the-art review of the world's floating wind turbines and projects. As well as information relevant to floating wind turbines' station-keeping mooring system design, anchoring, and other innovative aspects of relevance.
References [90,91,92] present a study related to selecting suitable floating wind support structures from the point of view of their hydrodynamic and aerodynamic performances. As well as Hywind Demo floating wind turbine dynamic response analyses. As well as wind models' sensitivity analyses of relevance to the dynamic response of floating wind turbines.
References [93,94,73,95] present dynamic and fatigue analyses related to the power cables of connected floating wind turbines using OrcaFlex software. As well as dynamic power cables' fatigue analyses of relevance to floating wind turbines. As well as floating wind turbines' fatigue study of relevance to the floating support structure and tower composite materials using some software such as HydroStar, OPERA, and Python. As well as floating wind turbines' probabilistic fatigue design using Monte Carlo simulation.
References [96,97] present the Norwegian perspective on the European and global wind energy situation. As well as the positive stability effects controllers have on floating wind turbines implemented in high water depths.
References [98,99] present innovative qualification aspects relevant to 10 MW floating wind support structures with water depths higher than 50 m. As well as floating wind turbines' technical challenges of relevance to rotor blades, electrical components, and mooring lines.
References [100,101,102] present the positive effects of relevance to the repositioning of some floating wind turbines to optimize their electricity power output enhancement. As well as bottom-fixed and floating wind turbines' power performance as well as extreme load analyses. As well as predictions and challenges relevant to huge floating wind turbines.
5. Conclusions
This paper studied eight floating wind turbines' six degrees of freedom response offsets. This paper included constant wind analyses concerning “only wind” conditions and “wind, wave, and current” conditions. In terms of translational degrees of freedom, the analyses conducted in this paper conclude that the surge degree of freedom has the largest response offset of 95 m. Then comes heave (9,88609 m) and sway (0,25006 m). Regarding the rotational degrees of freedom, the pitch has the highest amplitude of 12,4044°. Then comes yaw (0,58993°) and roll (0,5266°).
A summary of the discussed data in Section 4 concerning the maximum response offsets is as follows. For Surge, the maximum response offset is 95,451764 m (DTU Spar 1). For Sway, it is 0,25006 m (DTU Spar 1). For Heave, it is 9,88609 m (DTU Spar 1). For Roll, it is 0,5266° (INO-WINDMOOR semi-submersible). For Pitch, it is 12,4044° (WindFloat semi-submersible). For yaw, it is 0,58993° (INO-WINDMOOR).
The TLPWT floating wind turbine has shown negligible values for all the degrees of freedom (except Surge – maximum: 13,34 m for the “with wind, wave, no current” sea state).
This paper also provided state-of-the-art references relevant to innovative analyses and software for floating wind turbines. Further work is to carry out similar analyses but using turbulent wind instead of constant wind on the same eight floating wind turbines. As well as carrying out decay test analyses of the same floating wind turbines. Due to the complexity of information in this study, validation and verification work aspects are left for future work.
Author Contributions
Conceptualization, M.M. and E.R.; methodology, M.M. and E.R.; software, M.M..; formal analysis, M.M.; investigation, M.M.; resources, M.M. and E.R.; data curation, M.M.; writing—original draft preparation, M.M.; writing—review and editing, M.M. and E.R.; supervision, E.R.; project administration, E.R. All authors have read and agreed to the published version of the manuscript.”
Funding
This research received no external funding
Conflicts of Interest
The authors declare no conflicts of interest.
References
- Maktabi, M., Rusu, E. 2024. A Review of Perspectives on Developing Floating Wind Farms. Inventions 9, 24. [CrossRef]
- Maktabi, M., Rusu, E. 2024. Constant Wind Analyses on Eight Floating Wind Turbines. SCIENTIFIC CONFERENCE OF DOCTORAL SCHOOLS - Perspectives and challenges in doctoral research (UDJG). Powerpoint presentation.
- DNV - Digital Solutions. Sima Software (Sima-4.2.0-Windows).
- Bachynski, E. E. 2022. TMR4505 - Marine Structures, Specialization Course: Integrated Dynamic Analysis of Wind Turbines (Course module (Course Project)). Department of Marine Technology (NTNU).
- Edwards, E. C., Holcombe, A., Brown, S., Ransley, E., Hann, M., Greaves, D. 2024. Trends in floating offshore wind platforms: A review of early-stage devices. Renewable and Sustainable Energy Reviews, Volume 193, 114271, ISSN 1364-0321. [CrossRef]
- Aboutalebi, P., Garrido, A. J., Garrido, I., Nguyen, D. T., Gao, Z. 2024. Hydrostatic stability and hydrodynamics of a floating wind turbine platform integrated with oscillating water columns: A design study. Renewable Energy, Volume 221, 119824, ISSN 0960-1481. [CrossRef]
- SINTEF Ocean AS. 2021. Definition of the INOWINDMOOR 12MW base case floating wind turbine. OC2020 A-044- Unrestricted. Report.
- Alexandre, A., Pan, Z. 2024. Frequency domain structural analysis for early design of floating wind systems using Sesam and Bladed. EERA DeepWind conference. Link: https://www.sintef.no/globalassets/project/eera-deepwind-2024/presentasjoner/substructures_dnv_pan_new.pdf. Accessed at 17.10.2024.
- Christopher, A., Viselli, A., Dagher, H., Goupee, A., Gaertner, E., Abbas, N., Hall, M., Barter, G. 2020. Definition of the UMaine VolturnUS-S Reference Platform Developed for the IEA Wind 15-Megawatt Offshore Reference Wind Turbine. Golden, CO: National Renewable Energy Laboratory. NREL/TP-5000-76773. https://www.nrel.gov/docs/fy20osti/76773.pdf.
- American Bureau of Shipping (ABS). 2012. Floating Wind Turbines. Report.
- American Bureau of Shipping (ABS). 2020. Guide for building and classing FLOATING OFFSHORE WIND TURBINES.
- Bachynski, E. E., Eliassen L. 2019. The effects of coherent structures on the global response of floating offshore wind turbines. Wind Energy. 22: 219–238. [CrossRef]
- BVG Associates. 2023. Guide to a Floating Offshore Wind Farm.
- Campaña-Alonso, G., Martín-San-Román, R., Méndez-López, B., Benito-Cia, P., Azcona-Armendáriz, J. 2023. OF2: coupling OpenFAST and OpenFOAM for high-fidelity aero-hydro-servo-elastic FOWT simulations. Wind Energ. Sci. (WES). [CrossRef]
- Beier, D., Schnepf, A., Van Steel, S., Ye, N., Ong, M. C. 2023. Fatigue Analysis of Inter-Array Power Cables between Two Floating Offshore Wind Turbines Including a Simplified Method to Estimate Stress Factors. J. Mar. Sci. Eng. 11, 1254. [CrossRef]
- Corewind. 2020. D3.1 Review of the state of the art of dynamic cable system desig.
- DNV. 2023. Optimizing mooring and dynamic cable design requirements for floating wind. Link: https://www.dnv.com/news/optimizing-mooring-and-dynamic-cable-design-requirements-for-floating-wind-238299. Accessed at 17.06.2024.
- Grøva, M. N.A. UFLEX – Stress Analysis of Power Cables and Umbilicals. Sintef. Link: https://www.sintef.no/en/software/uflex-stress-analysis-of-power-cables-and-umbilicals. Accessed at 17.06.2024.
- Guo, Z., Zhao, X., Ma, Q., Li, J., Wu., Z. 2024. Simulation Study on Methods for Reducing Dynamic Cable Curvature in Floating Wind Power Platforms. Journal of Marine Science and Engineering. 12. 334. [CrossRef]
- Okpokparoro, S., Sriramula, S. 2023. Reliability analysis of floating wind turbine dynamic cables under realistic environmental loads. Ocean Engineering, 278. 10.1016/j.oceaneng.2023.114594.
- Sobhaniasl, M., Petrini, F., Karimirad, M., Bontempi, F. 2020. Fatigue Life Assessment for Power Cables in Floating Offshore Wind Turbines. Energies. 13. 3096. 10.3390/en13123096.
- Young, D., Ng, C., Oterkus, S., Li, Q., Johanning, L. 2018. Predicting failure of dynamic cables for floating offshore wind.
- Bussemakers, P. J. M. 2020. Validation of aero-hydro-servo-elastic load and motion simulations in BHawC/OrcaFlex for the Hywind Scotland floating offshore wind farm. Master thesis. NTNU. Link: https://ntnuopen.ntnu.no/ntnu-xmlui/handle/11250/2780185. Accessed at 17.10.2024.
- Chen, J., Hu, Z., Liu, G., Wan, D. 2019. Coupled aero-hydro-servo-elastic methods for floating wind turbines. Renewable Energy, Volume 130, Pages 139-153, ISSN 0960-1481. [CrossRef]
- Jonkman, J., Matha, D. 2010. A Quantitative Comparison of the Responses of Three Floating Platforms. Conference Paper NREL/CP-500-46726.
- Ojo, A., Collu, M., Coraddu, A. 2022. Parametrisation Scheme for Multidisciplinary Design Analysis and Optimisation of a Floating Offshore Wind Turbine Substructure – OC3 5MW Case Study. Phys.: Conf. Ser. 2265-042009. 10.1088/1742-6596/2265/4/042009.
- Yang, Y., Bashir, M., Michailides, C., Li, C., Wang, J. 2020. Development and application of an aero-hydro-servo-elastic coupling framework for analysis of floating offshore wind turbines. Renewable Energy. 161. [CrossRef]
- Leimeister, M., Bachynski-Polić, E., Muskulus, M., Thomas, P. 2016. Design optimization and upscaling of a semi-submersible floating platform. WindEurope Summit Conference.
- Manolas, D. I., Riziotis, V. A., Papadakis, G. P., Voutsinas, S.G. 2020. Hydro-Servo-Aero-Elastic Analysis of Floating Offshore Wind Turbines. Fluids, 5, 200. [CrossRef]
- Chitteth Ramachandran, R., Desmond, C., Judge, F., Serraris, J. J., Murphy, J. 2022. Floating wind turbines: marine operations challenges and opportunities. WES. Review Article. [CrossRef]
- Collu, M., Borg, M. 2016. Design of floating offshore wind turbines. Book: Offshore Wind Farms, Chapter 15. [CrossRef]
- Cordle, A., Jonkman, J. 2011. State-of-the-art in Floating Wind Turbine Design Tools. Proceedings of the International Offshore and Polar Engineering Conference.
- De Souza, C. E. S., Bachynski-Polić, E. E. 2022. Design, structural modeling, control, and performance of 20 MW spar floating wind turbines. Marine Structures, Volume 84, 103182, ISSN 0951-8339. [CrossRef]
- DNV. 2022. FIXED OFFSHORE WIND STRUCTURE DESIGN. White Paper.
- DNV. N. A. Floating Foundations. Link: https://www.dnv.com/software/services/software-for-offshore-wind/floating-offshore-wind. Accessed at 17.10.2024.
- Elobeid, M., Tao, L., Ingram, D., Pillai., A. C., Mayorga, P., Hanssen, J. E. 2022. Hydrodynamic Performance of an Innovative Semisubmersible Platform With Twin Wind Turbines. Proceedings of the ASME 41st International Conference on Ocean, Offshore and Arctic Engineering. Volume 8: Ocean Renewable Energy. Hamburg, Germany. June 5–10, 2022. V008T09A032. ASME. [CrossRef]
- DNV. N. A. Floating structure design and modification - Sesam for floating structures. Link: https://www.dnv.com/services/floating-structure-design-and-modification-sesam-for-floating-structures-2410. Accessed at 17.10.2024.
- DNV. N. A. Marine operations and mooring analysis software - Sima. Link: https://www.dnv.com/services/marine-operations-and-mooring-analysis-software-sima-2324. Accessed at 17.10.2024.
- DNV. N. A. SE-28 Integrated analysis for floating offshore wind. Link: https://www.dnv.com/training/se-28-integrated-analysis-for-floating-offshore-wind. Accessed at: 17.10.2024.
- Mathias, T. 2022. Design and Numerical Analysis of Mooring Systems for Floating Wind Turbines – Comparison of Concepts for European Waters. Master Thesis. NTNU.
- Rønning, T., Bero, L. 2023. Installation analysis of a long floating pontoon bridge. Master Thesis. OsloMet University.
- SINTEF. N. A. SIMA. Link: https://www.sima.sintef.no. Accessed at 15.09.2024 at 22:03.
- SINTEF. N. A. SIMA. Link: https://www.sintef.no/en/software/sima. Accessed at 15.09.2024 at 22:03.
- Wang, S., Moan, T., Gao, Z. 2023. Methodology for global structural load effect analysis of the semi-submersible hull of floating wind turbines under still water, wind, and wave loads. Marine Structures, Volume 91, 103463, ISSN 0951-8339. [CrossRef]
- DTU Wind Energy. 2013. Description of the DTU 10 MW Reference Wind Turbine. Report-I-0092.
- Johannessen, M. 2018. Concept Study and Design of Floating Offshore Wind Turbine Support Structure. DEGREE PROJECT MECHANICAL ENGINEERING.
- Kim, T., Madsen, F. J., Bredmose, H., Pegalajar-Jurado, A. 2023. Numerical analysis and comparison study of the 1:60 scaled DTU 10 MW TLP floating wind turbine. Renewable Energy, Volume 202, Pages 210-221, ISSN 0960-1481. [CrossRef]
- Tian, X. 2016. Design, Numerical Modelling and Analysis of TLP Floater Supporting the DTU 10MW Wind Turbine. Master thesis. NTNU.
- Velarde, J., Bachynski, E. E. 2017. Design and fatigue analysis of monopile foundations to support the DTU 10 MW offshore wind turbine. Energy Procedia,Volume 137, Pages 3-13, ISSN 1876-6102. [CrossRef]
- Wang, Q. 2014. Design of a Steel Pontoon-type Semi-submersible Floater Supporting the DTU 10MW Reference Turbine. TU Delft. Master thesis.
- Xue, W. 2016. Design, numerical modelling and analysis of a spar floater supporting the DTU 10MW wind turbine. Master thesis. NTNU.
- Xuwen, W. 2019. Dynamic Analysis of Floating Wind Turbines Subjected to Deterministic Wind Gust. Master Thesis. NTNU.
- Zhou, Y., Feng, S., Guo, X., Tian, F., Han, X., Shi, W., Li, X. 2023. Initial Design of a Novel Barge-Type Floating Offshore Wind Turbine in Shallow Water. J. Mar. Sci. Eng. 11, 464. [CrossRef]
- Li, H., Díaz, H., Guedes Soares, C. 2021. A failure analysis of floating offshore wind turbines using AHP-FMEA methodology. Ocean Engineering, Volume 234, 109261, ISSN 0029-8018. [CrossRef]
- Li, H., Guedes Soares, C. 2022. Assessment of failure rates and reliability of floating offshore wind turbines. Reliability Engineering & System Safety, Volume 228, 108777, ISSN 0951-8320. [CrossRef]
- Li, H., Peng, W., Huang, C. G., Guedes Soares, C. 2022. Failure Rate Assessment for Onshore and Floating Offshore Wind Turbines. J. Mar. Sci. Eng. 10, 1965. [CrossRef]
- Marcollo, H., Efthimiou, L. 2024. Floating Offshore Wind Dynamic Cables: Overview of Design and Risks. World Forum Offshore Wind (WFO).
- Moan, T., Gao, Z., Bachynski, E. E., Nejad, A. R. 2019. Recent Advances in Response Analysis of Floating Wind Turbines in a Reliability Perspective. IOWTC. Draft.
- Moan, T., Gao, Z., Bachynski, E., Nejad, A. 2020. Recent Advances in Integrated Response Analysis of Floating Wind Turbines in a Reliability Perspective. Journal of Offshore Mechanics and Arctic Engineering. [CrossRef]
- Shafiee, M. Failure analysis of spar buoy floating offshore wind turbine systems. Innov. Infrastruct. Solut. 8, 28 (2023). [CrossRef]
- Etemaddar, M., Blanke, M., Gao, Z., Moan, T. 2016. Response analysis and comparison of a spar-type floating offshore wind turbine and an onshore wind turbine under blade pitch controller faults. Wind Energ., 19: 35–50. [CrossRef]
- Fadaei, S., Afagh, F. F., Langlois, R. G. 2024. A Survey of Numerical Simulation Tools for Offshore Wind Turbine Systems. Wind 4, 1-24. [CrossRef]
- Gaertner, E., Rinker, J., Sethuraman, L., Zahle, F., Anderson, B., Barter, G., Abbas, N., Meng, F., Bortolotti, P., Skrzypinski, W., Scott, G., Feil, R., Bredmose, H., Dykes, K., Shields, M., Allen, C., Viselli, A. 2020. Definition of the IEA 15-Megawatt Offshore Reference Wind. Golden, CO: National Renewable Energy Laboratory. NREL/TP-5000-75698. https://www.nrel.gov/docs/fy20osti/75698.pdf.
- Gao, Z., Merino, D., Han, K. J., Li, H., Fiskvik, S. 2023. Time-domain floater stress analysis for a floating wind turbine. Journal of Ocean Engineering and Science, Volume 8, Issue 4, Pages 435-445, ISSN 2468-0133. [CrossRef]
- Hall, M., Lozon, E., McAuliffe, F. D., Bessone, M. B., Bayati, I., Bowie, M., Bozonnet, P., Castagné, M., Feng, J., Housner, S., Janocha, M. J., Jiang, Z., Kim, Y. Y., Ko, D., Kölle, K., Lee, C. F., Lekkala, M. R., Liang, G., Mahfouz, M. Y., Mohan, M., O'Connell, D., Ong, M. C., Prieur, J., Rajasree, V. R. N., Schnepf, A., Snedker, T., Thurston-Keller, J., Wright, C.. 2024. IEA Wind TCP Task 49 - The IEA Wind Task 49 Reference Floating Wind Array Design Basis. NREL.
- Hong, S. McMorland, J., Zhang, H., Collu, M., Halse, K. H. 2024. Floating offshore wind farm installation, challenges and opportunities: A comprehensive survey. Ocean Engineering, Volume 304, 117793, ISSN 0029-8018. [CrossRef]
- Hegseth, J. M., Bachynski, E. E. 2019. A semi-analytical frequency domain model for efficient design evaluation of spar floating wind turbines. Marine Structures, Volume 64, Pages 186-210, ISSN 0951-8339. [CrossRef]
- Hegseth, J. M., Bachynski, E. E., Martins, R. R. A. 2020. Design Optimization of Spar Floating Wind Turbines Considering Different Control Strategies . J. Phys.: Conf. Ser. 1669-012010. [CrossRef]
- Tiril, S. 2018. Mooring System Design for a Large Floating Wind Turbine in Shallow Water. Master Thesis. NTNU.
- Vittori, F. E. 2015. Design and Analysis of Semi-submersible Floating Wind Turbines with focus on Structural Response Reduction. Master Thesis. NTNU.
- DNV and Risø. 2002. Guidelines for design of wind turbines. Second Edition.
- DNV. 2021. Floating Offshore Wind Turbine Analysis. Sesam Workshop.
- Müller, K., Cheng, P. W. 2018. Application of a Monte Carlo procedure for probabilistic fatigue design of floating offshore wind turbines. Wind Energ. Sci., 3, 149–162, 2018. [CrossRef]
- Ojo, M., Collu, M., Coraddu, A. 2022. Multidisciplinary design analysis and optimization of floating offshore wind turbine substructures: A review. Ocean Engineering, Volume 266, Part 1, 112727, ISSN 0029-8018. [CrossRef]
- Goupee, A. J., Koo, B., Kimball, R. W., Lambrakos, K. F., Dagher, H. J. 2012. Experimental Comparison of Three Floating Wind Turbine Concepts. Proceedings of the ASME 2012 31st International Conference on Ocean, Offshore and Arctic Engineering. Volume 7: Ocean Space Utilization; Ocean Renewable Energy. Rio de Janeiro, Brazil. pp. 467-476. ASME. [CrossRef]
- Lamei, A., Hayatdavoodi, M., Riggs, H. R. 2024. Hydro- and aero-elastic response of floating offshore wind turbines to combined waves and wind in frequency domain. J. Ocean Eng. Mar. Energy 10, 399–424. [CrossRef]
- Wu, Z., Wang, K., Jie, T., Wu, X. 2024. Coupled Dynamic Characteristics of a Spar-Type Offshore Floating Two-Bladed Wind Turbine with a Flexible Hub Connection. J. Mar. Sci. Eng. 12, 547. [CrossRef]
- Liang, G., Jiang, Z., Merz, K. 2021. Mooring Analysis of a Dual-Spar Floating Wind Farm With a Shared Line. ASME. J. Offshore Mech. Arct. Eng. 143(6): 062003. [CrossRef]
- Munir, H., Lee, C., Ong, M. 2021. Global analysis of floating offshore wind turbines with shared mooring system. IOP Conference Series: Materials Science and Engineering, 1201, 012024. [CrossRef]
- Halse, K. H., Hong, S., Ataei, B., Liu, T., Yuan, S., Hildre, H. P. 2024. Design of Floating Installation Vessel for Offshore Installation of Floating Offshore Wind Turbines. International Marine Design Conference. [CrossRef]
- SINTEF. N. A. Design and Verification of Offshore Wind Turbines. Link: https://www.sintef.no/en/expertise/ocean/design-and-verification-of-offshore-wind-turbines. Accessed at 17.10.2024.
- Galle, K. 2023. Major Component Replacement on Floating Wind Turbines. KTH. Master Thesis.
- Haga, M. S. B. 2019. Hydrodynamic Challenges of Floating Wind Turbines in Shallower Water Depth. Master Thesis. NTNU.
- Myhr, A. 2016. Developing Offshore Floating Wind Turbines: The Tension-Leg-Buoy Design. PhD Thesis. NMBU.
- Ramzanpoor, I., Nuernberg, M., Tao, L. 2023. Coupled aero-hydro-servo-elastic analysis of 10MW TLB floating offshore wind turbine. Journal of Ocean Engineering and Science, ISSN 2468-0133. [CrossRef]
- Ramzanpoor, I., Nuernberg, M., Tao, L. 2024. Benchmarking study of 10 MW TLB floating offshore wind turbine. J. Ocean Eng. Mar. Energy 10, 1–34. [CrossRef]
- Landbø, T. 2018. "OO-STAR WIND FLOATER THE FUTURE OF OFFSHORE WIND?". EERA DEEPWIND 2018. Presentation.
- Lin, J., Wu, W., Peng, Z. 2023. Overall Strength Analysis of Floating Offshore Wind Turbine Foundation. Journal of Physics: Conference Series. [CrossRef]
- WFO. 2023. CRASH COURSE – Floating Offshore Wind, a blog series (PART 3). Link: https://wfo-global.org/crash-course-floating-offshore-wind-a-blog-series-part-3. Accessed at 17.10.2024.
- Boge, S. N., Ekerhovd, D. W. 2022. A Hydro-Aerodynamic Analysis of a Floating Offshore Wind Turbine to Assist in Floater Selection. Master Thesis. NTNU.
- Myrtvedt, M. H., Nybø, A., Nielsen, F. G. 2020. The dynamic response of offshore wind turbines and their sensitivity to wind field models. J. Phys.: Conf. Ser. 1669-012013. [CrossRef]
- Neuenkirchen Godø, S. 2013. Dynamic Response of Floating Wind Turbines. Master thesis. NTNU.
- Beier, D. 2023. Dynamic and Fatigue Analyses of Suspended Power Cables for Multiple Floating Offshore Wind Turbines. Master thesis. University of Stavanger.
- University of Stuttgart. 2018. Qualification of innovative floating substructures for 10MW wind turbines and water depths greater than 50m. LIFES50+ project.
- CIGRE Colombia. N.A. Fatigue analysis of installed dynamic cable system for offshore floating wind farm. Link: http://www.cigrecolombia.org/Documents/Memorias/Paris%20CIGRE%20Session%202022/2.Presentations/2.GDM/SC%20B1%20Presentations%20Text%20Version/B1_PS1_Q4.03_KOYAMA_JP.pdf. Accessed at 10.06.2024.
- Pharindra, P. 2022. Fatigue Methodology for Floating Offshore Wind Power Platform and Turbine Tower in Composite Materials. Master Thesis. University of Liège.
- Statkraft. N. A. Vindkraft. Link: https://www.statkraft.no/var-virksomhet/vindkraft/?gad_source=1&gclid=EAIaIQobChMIxJPCyv2thwMVmFSRBR05UAtFEAMYASAAEgKn3_D_BwE. Accessed at: 17.10.2024.
- Stockhouse, D., Phadnis, M., Henry, A., Abbas, N., Sinner, M., Pusch, M., Pao, L. Y. 2023. Sink or Swim: A Tutorial on the Control of Floating Wind Turbines. American Control Conference (ACC). [CrossRef]
- Tillenburg, D. 2021. Technical challenges of floating offshore wind turbines - An overview. EGU Master Journal of Renewable Energy Short Reviews. [CrossRef]
- FastCompany. 2024. Floating, skyscraper-size wind turbines are the future—and an engineering challenge. Link: https://www.fastcompany.com/91067685/floating-wind-turbines-design-types. Accessed at 17.10.2024 (Further description of floating wind turbine types future size).
- Saadallah, N., Randeberg, E. 2020. Dynamic repositioning in floating wind farms. NORCE Energy.
- Wang, S., Xing, Y., Karuvathil, A., Gaidai, O. 2023. A comparison study of power performance and extreme load effects of large 10-MW offshore wind turbines. IET Renew. Power Gener. 17, 2195–2214. [CrossRef]
- DNVGL. 2020. Overview of offshore wind standards and certification requirements in selected countries. Report: 2020-1194, Rev. 01.
- Boru, M. E. 2021. VIV Fatigue of dynamic power cables applied in offshore wind turbines. Master thesis. NTNU.
Figure 1.
Four main floating wind turbine concepts. From left to right: barge (not considered in this study), semi-submersible, spar, and TLP. The authors designed the figure in accordance with the information presented in [1,2].
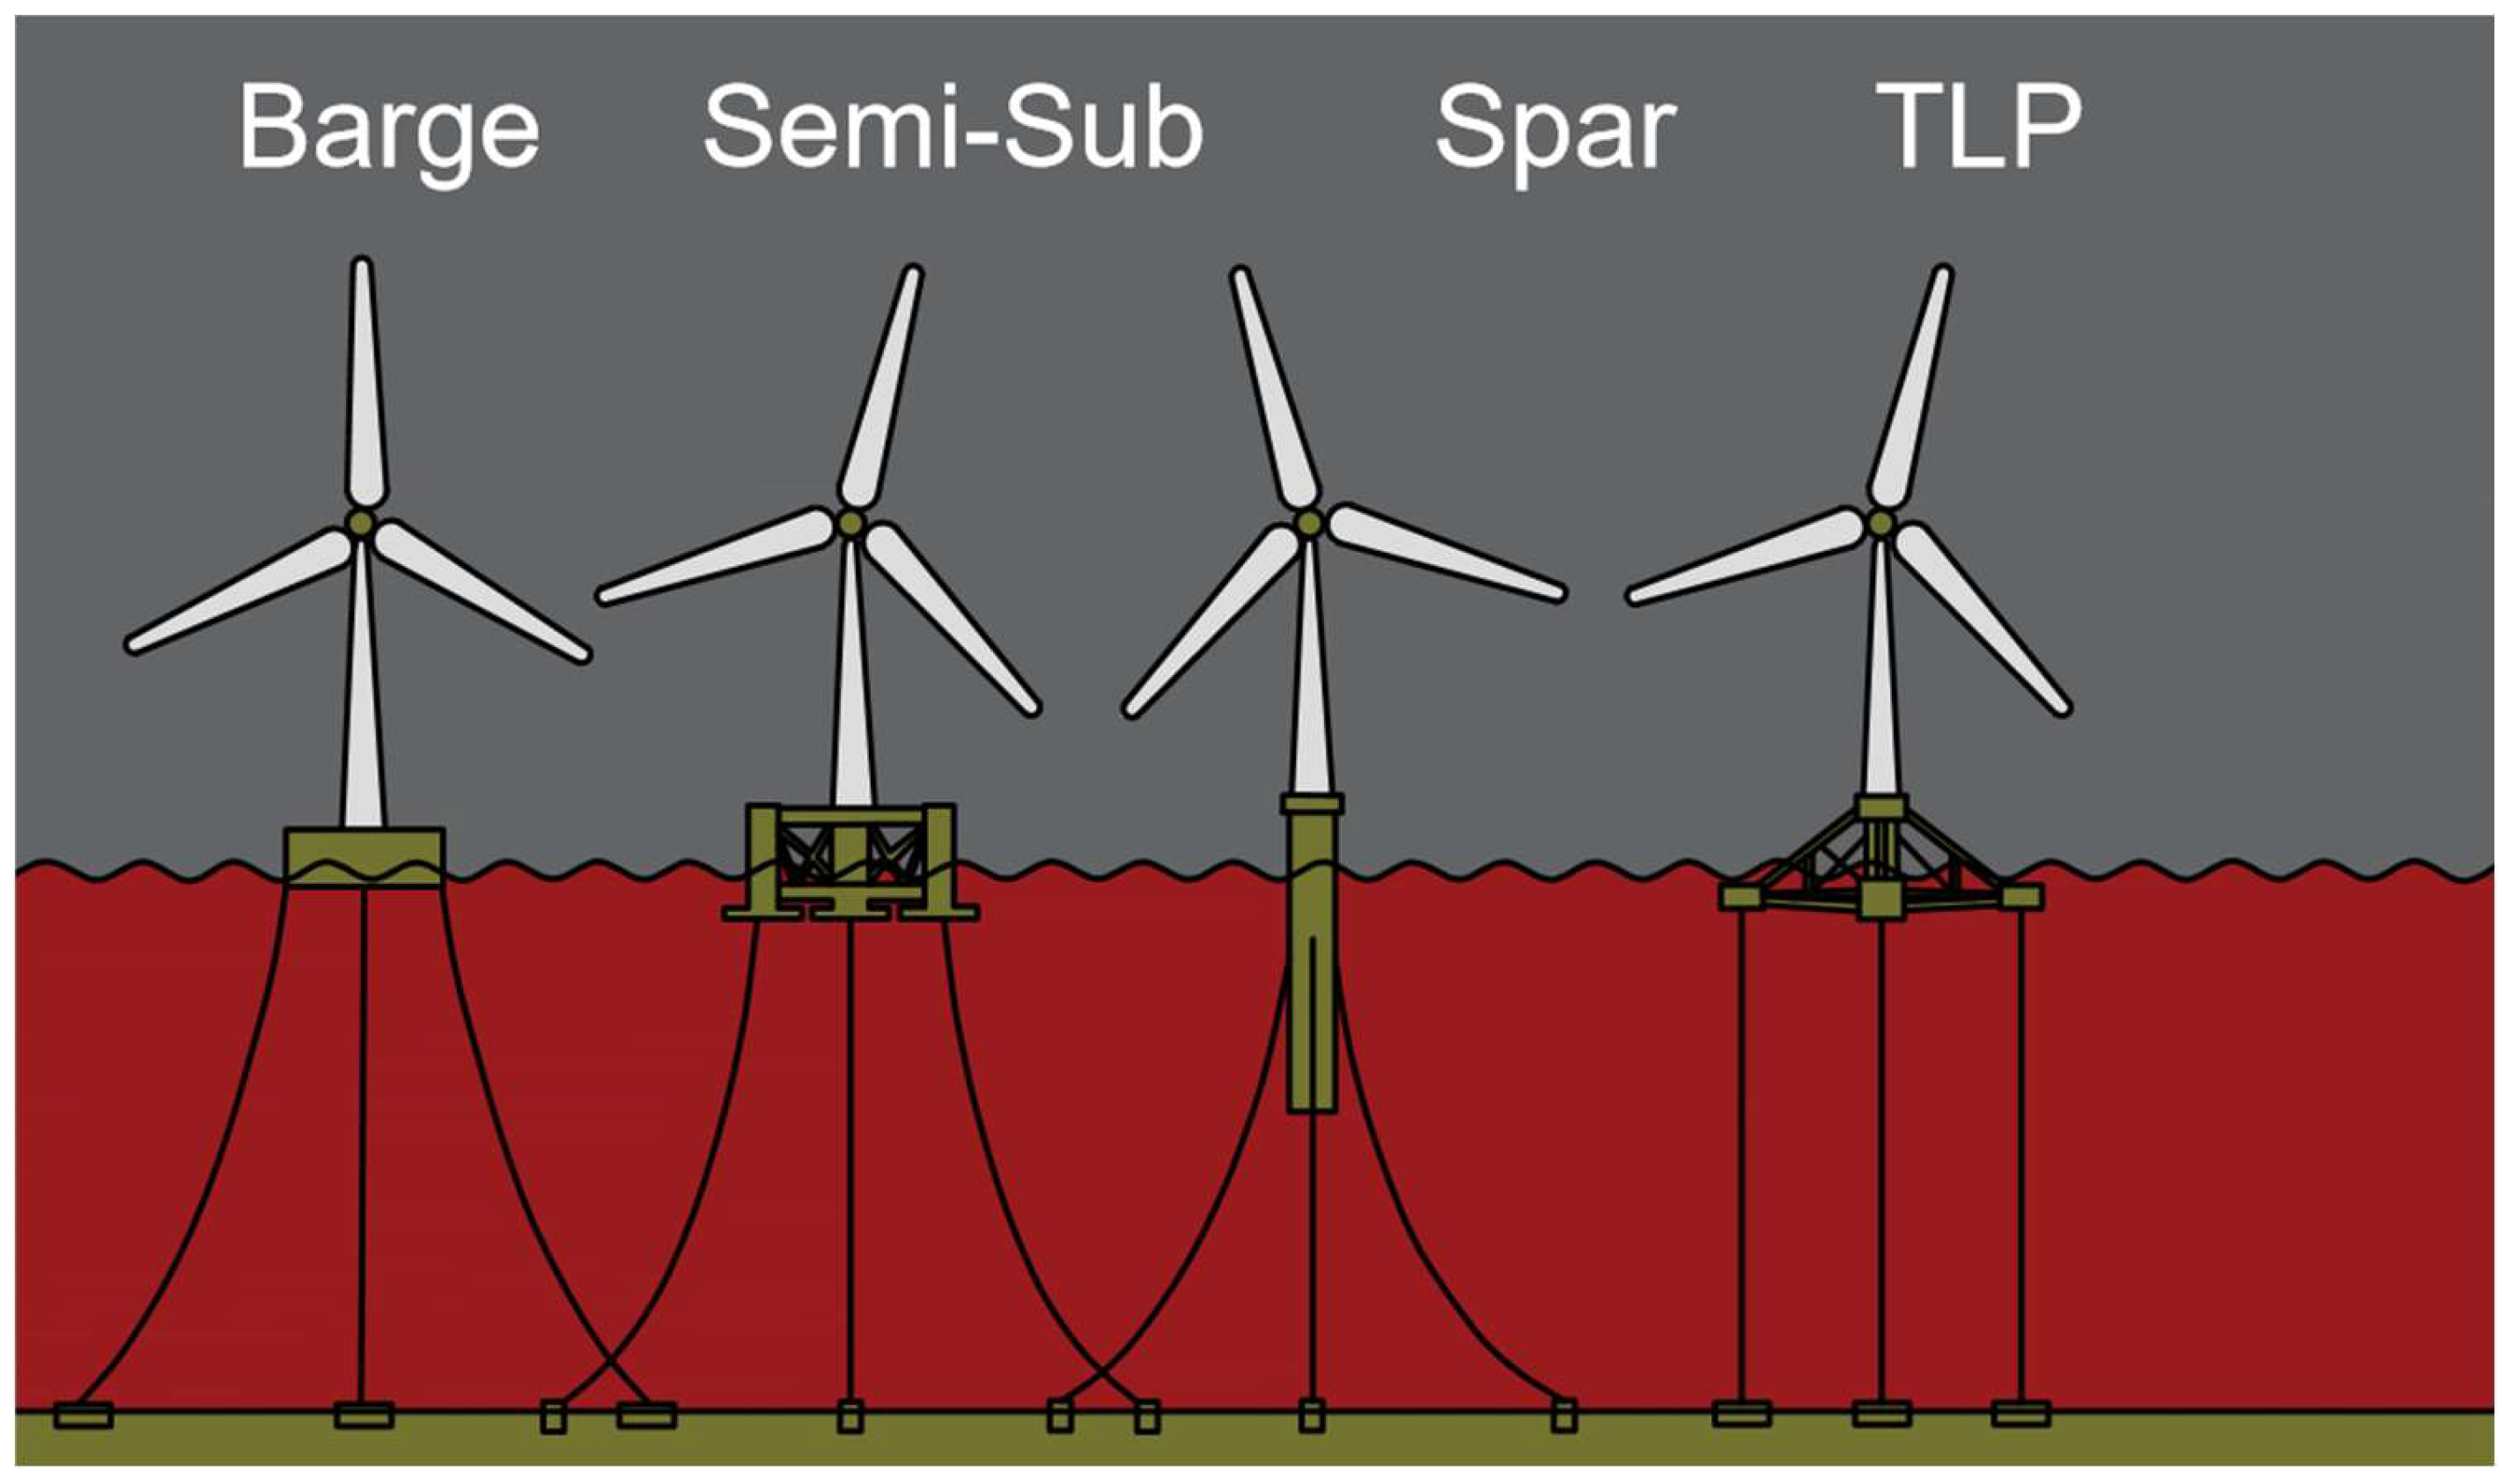
Figure 2.
OO-Star upwind semi-submersible floating wind turbine with 10 MW power capacity and 130 m water depth. The authors processed the figure in accordance with the information presented in [3].
Figure 2.
OO-Star upwind semi-submersible floating wind turbine with 10 MW power capacity and 130 m water depth. The authors processed the figure in accordance with the information presented in [3].
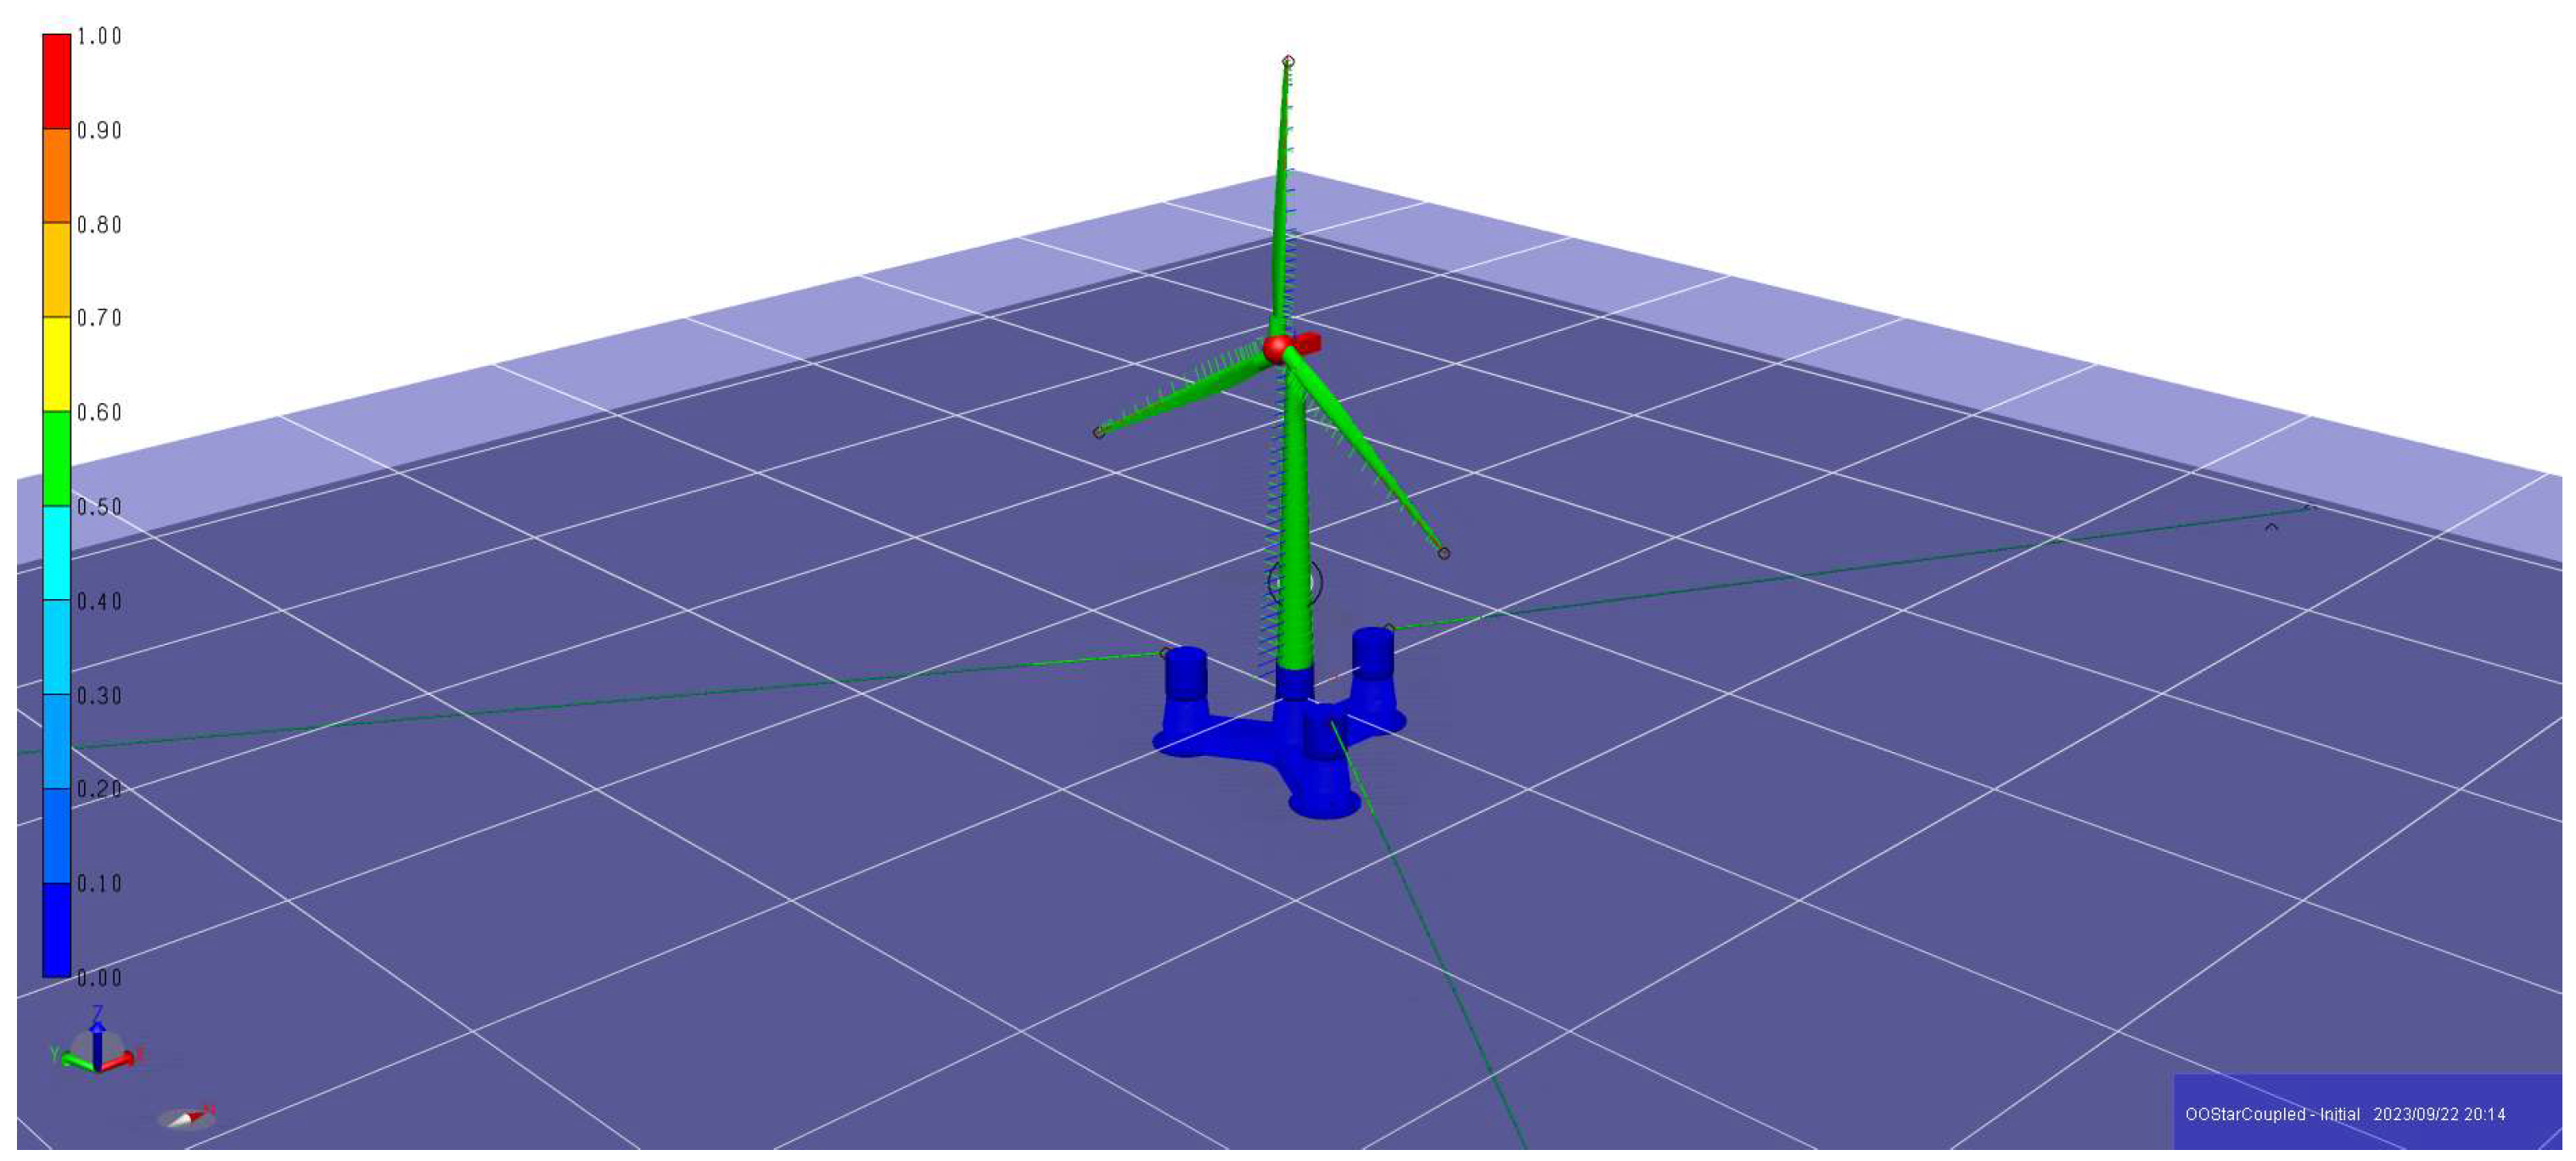
Figure 3.
CSC upwind semi-submersible floating wind turbine with 10 MW power capacity and 200 m water depth. The authors processed the figure in accordance with the information presented in [3].
Figure 3.
CSC upwind semi-submersible floating wind turbine with 10 MW power capacity and 200 m water depth. The authors processed the figure in accordance with the information presented in [3].
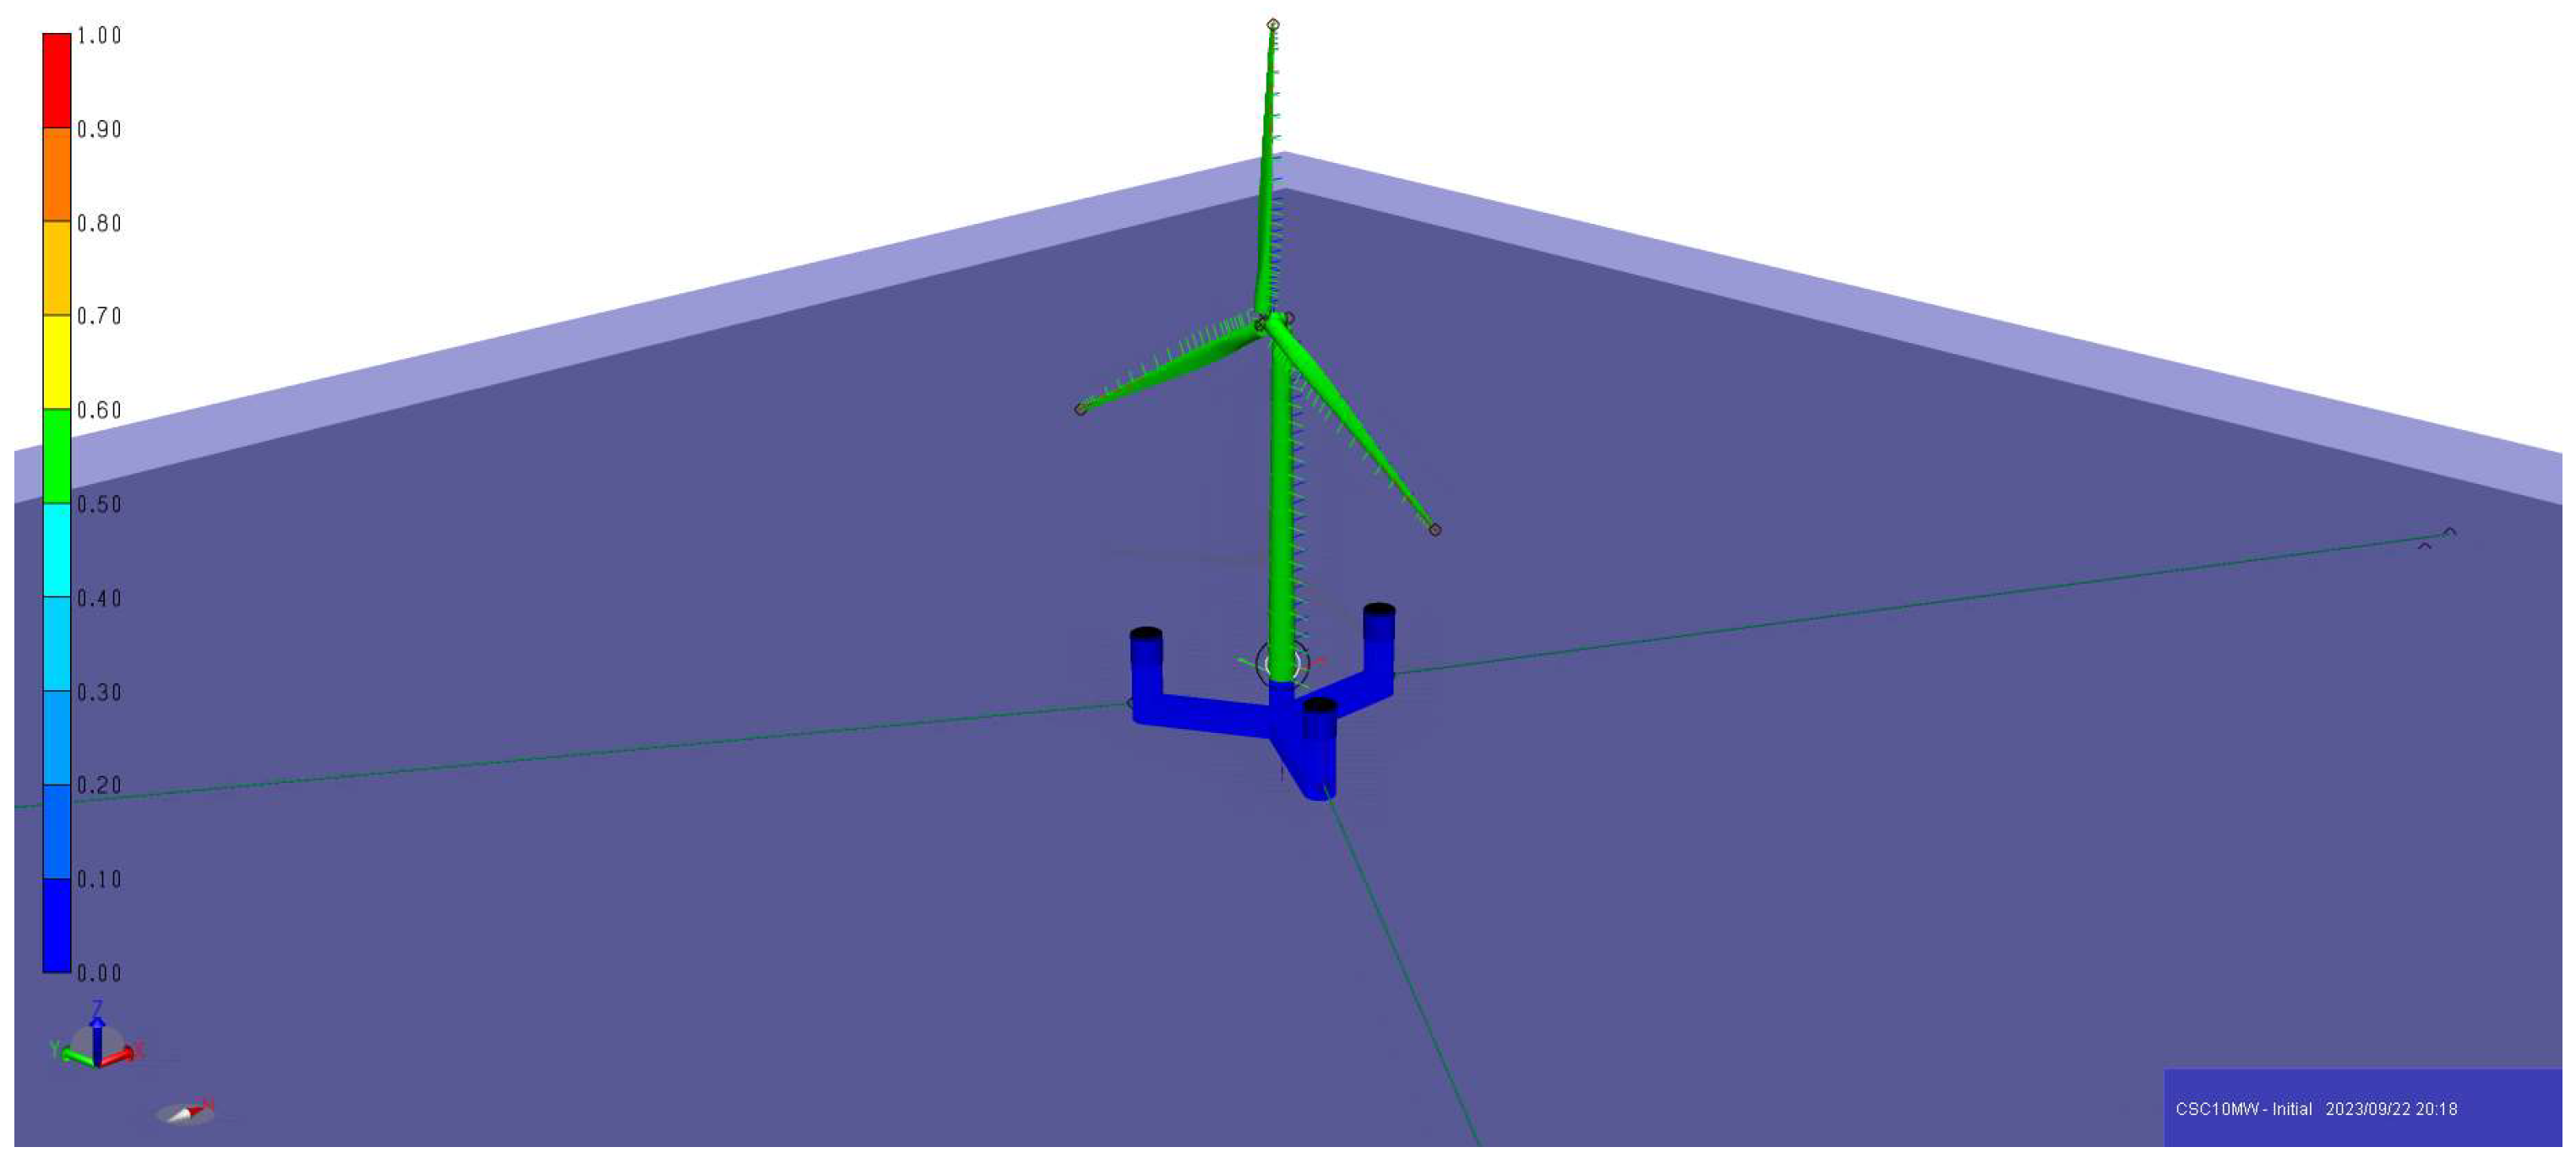
Figure 4.
WindFloat upwind semi-submersible floating wind turbine with 10 MW power capacity and 200 m water depth. The authors processed the figure in accordance with the information presented in [3].
Figure 4.
WindFloat upwind semi-submersible floating wind turbine with 10 MW power capacity and 200 m water depth. The authors processed the figure in accordance with the information presented in [3].
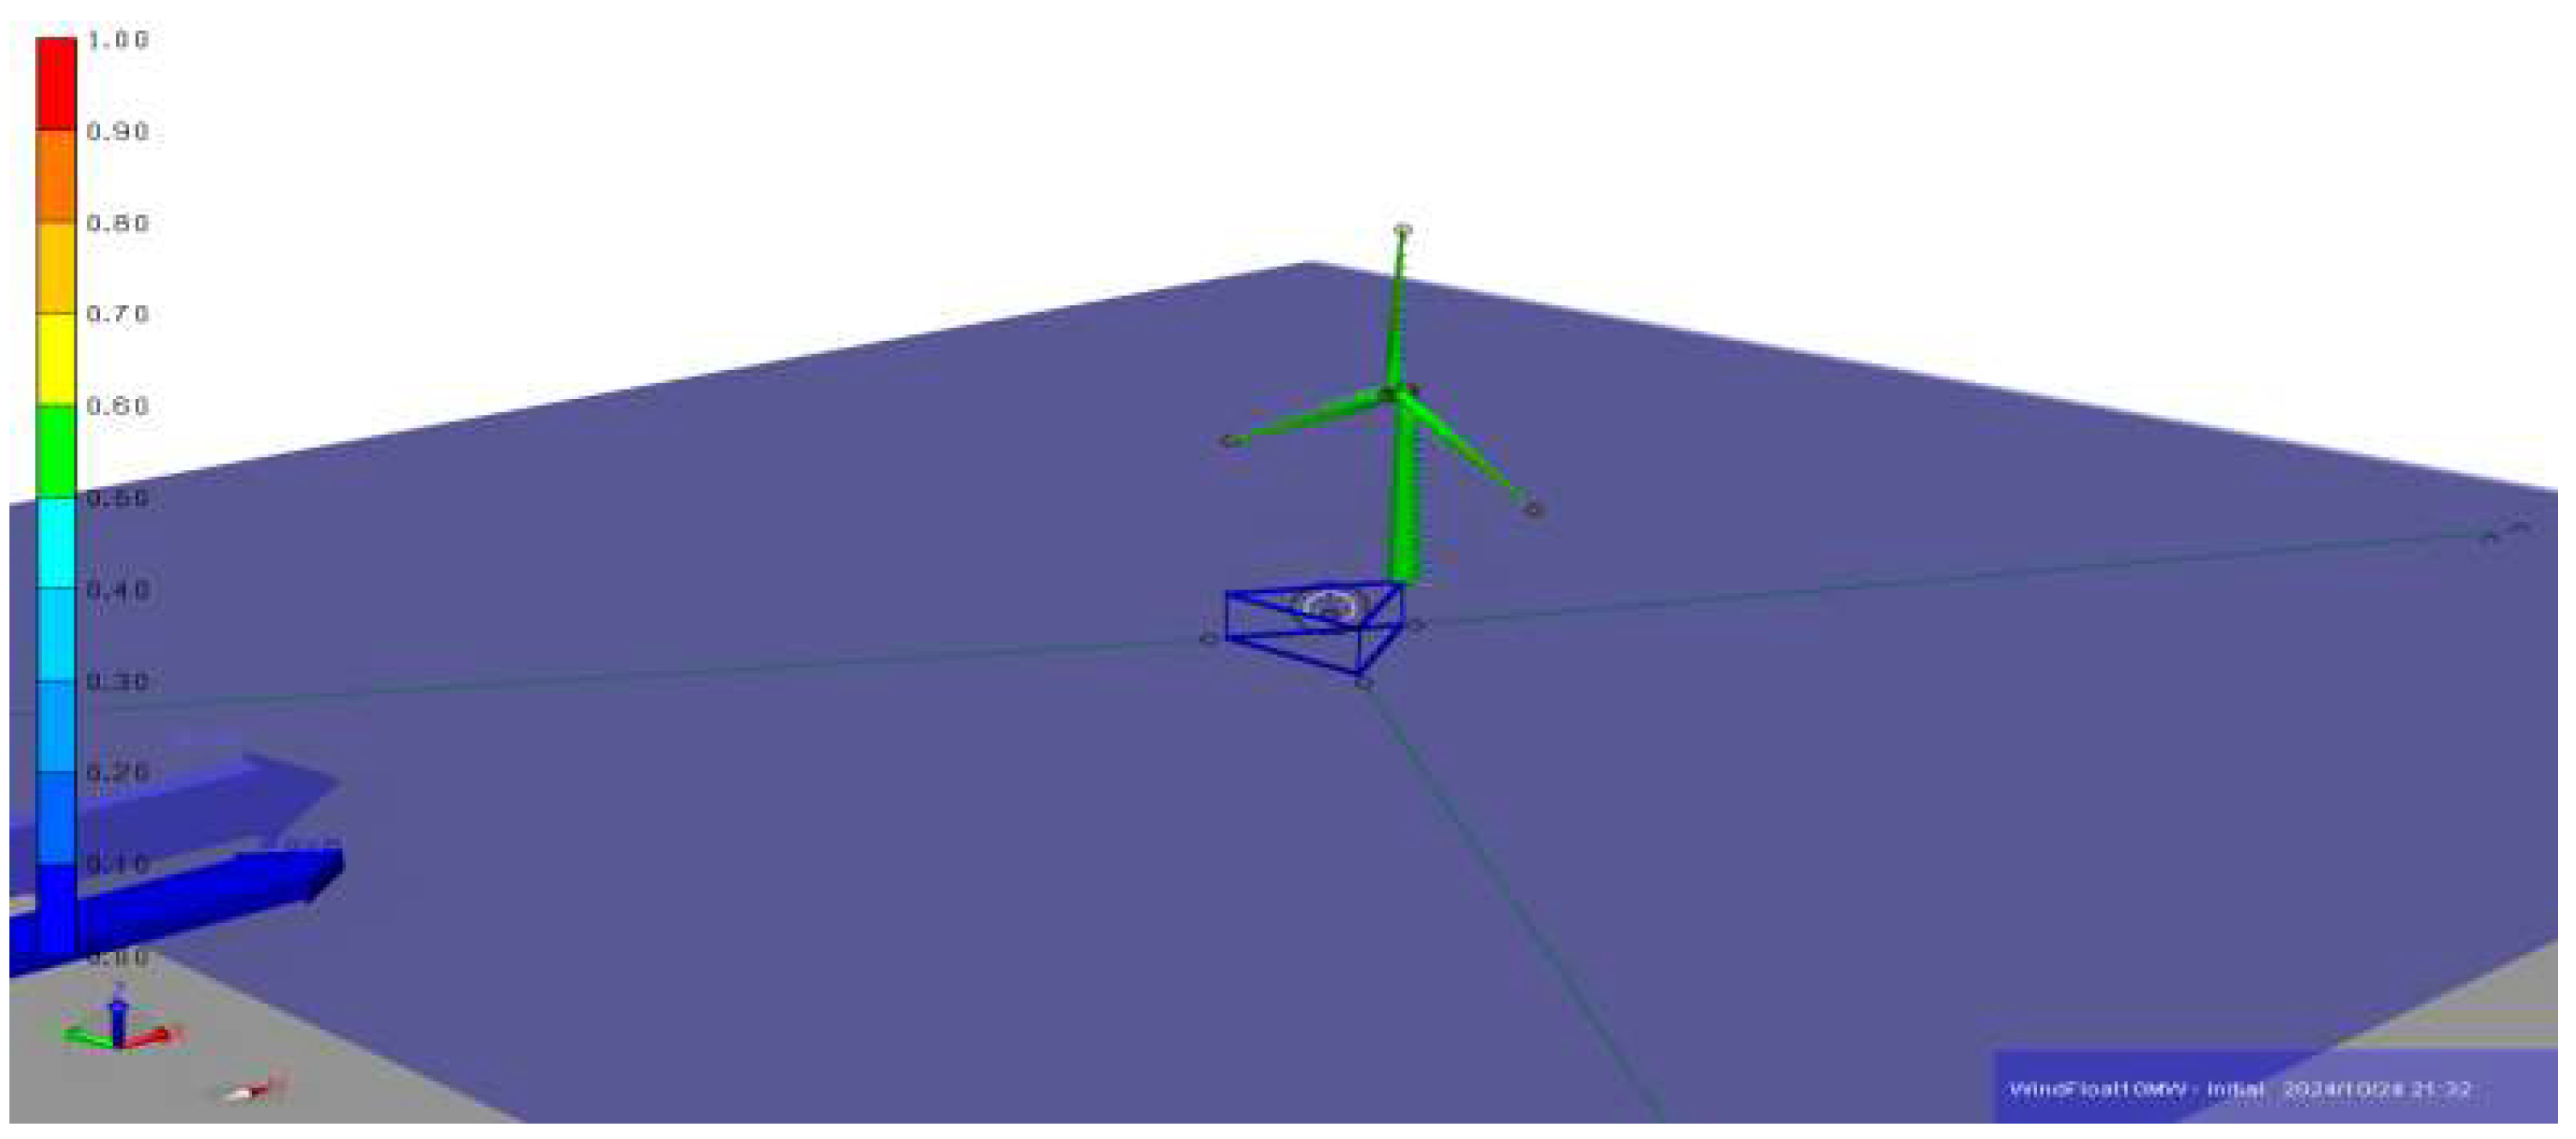
Figure 5.
DTU Spar 1 upwind floating wind turbine with 10 MW power capacity and 320 m water depth and support structure’s height of 108 m. The authors processed the figure in accordance with the information presented in [3].
Figure 5.
DTU Spar 1 upwind floating wind turbine with 10 MW power capacity and 320 m water depth and support structure’s height of 108 m. The authors processed the figure in accordance with the information presented in [3].
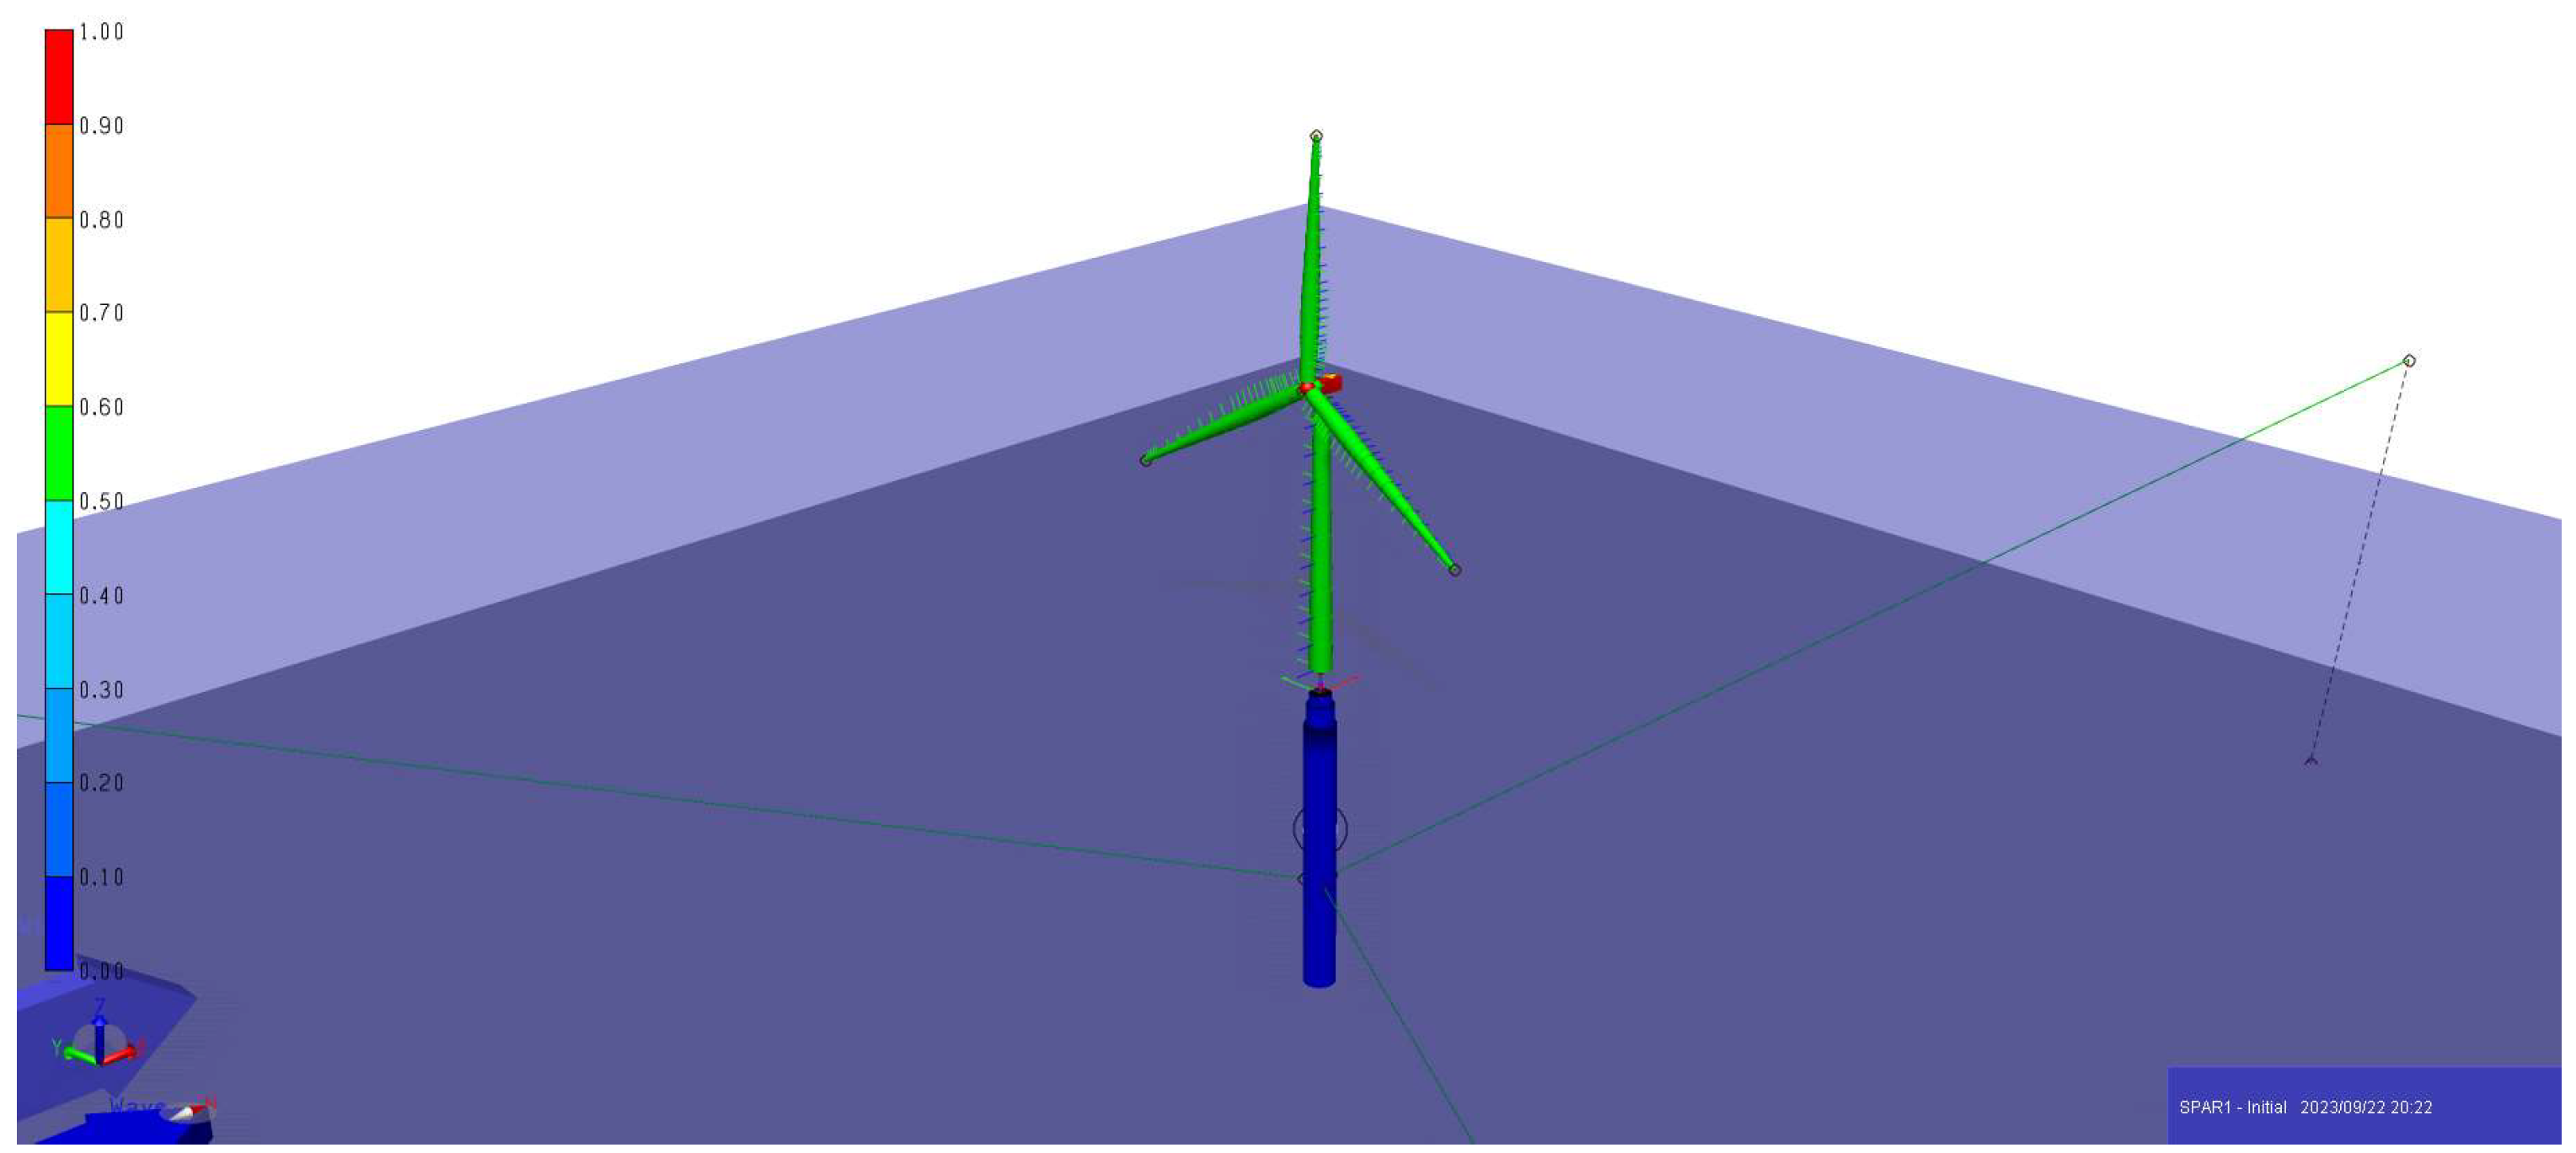
Figure 6.
DTU Spar 2 upwind floating wind turbine with 10 MW power capacity and 320 m water depth and support structure’s height of 78 m. The authors processed the figure in accordance with the information presented in [3].
Figure 6.
DTU Spar 2 upwind floating wind turbine with 10 MW power capacity and 320 m water depth and support structure’s height of 78 m. The authors processed the figure in accordance with the information presented in [3].
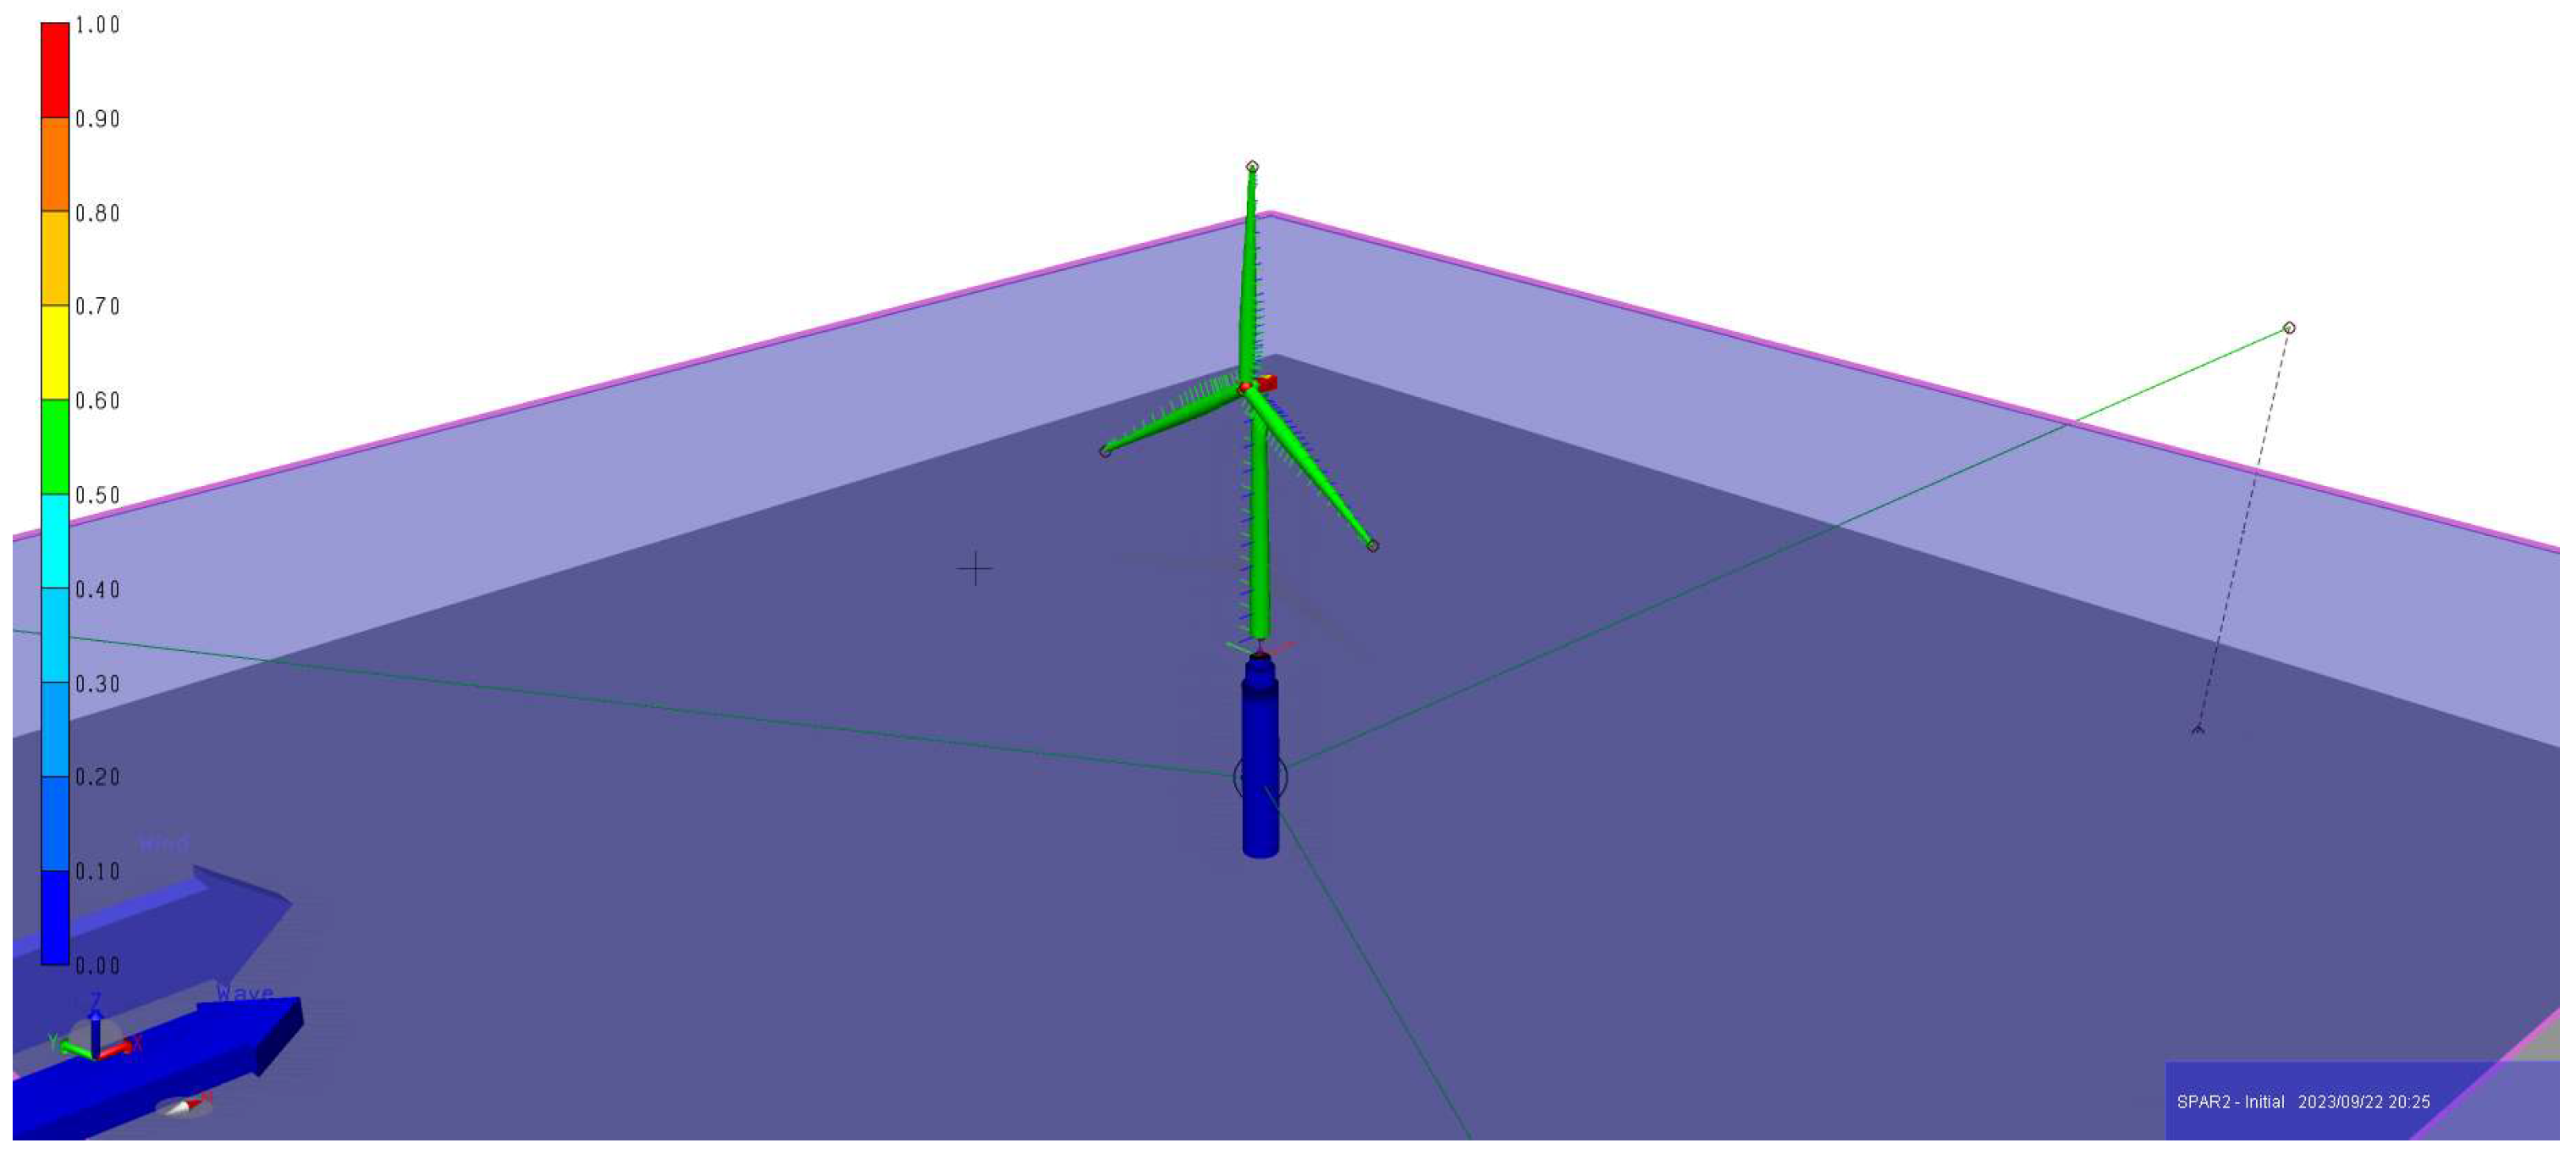
Figure 7.
TLP upwind floating wind turbine with 10 MW power capacity and 200 m water depth. The authors processed the figure in accordance with the information presented in [3].
Figure 7.
TLP upwind floating wind turbine with 10 MW power capacity and 200 m water depth. The authors processed the figure in accordance with the information presented in [3].
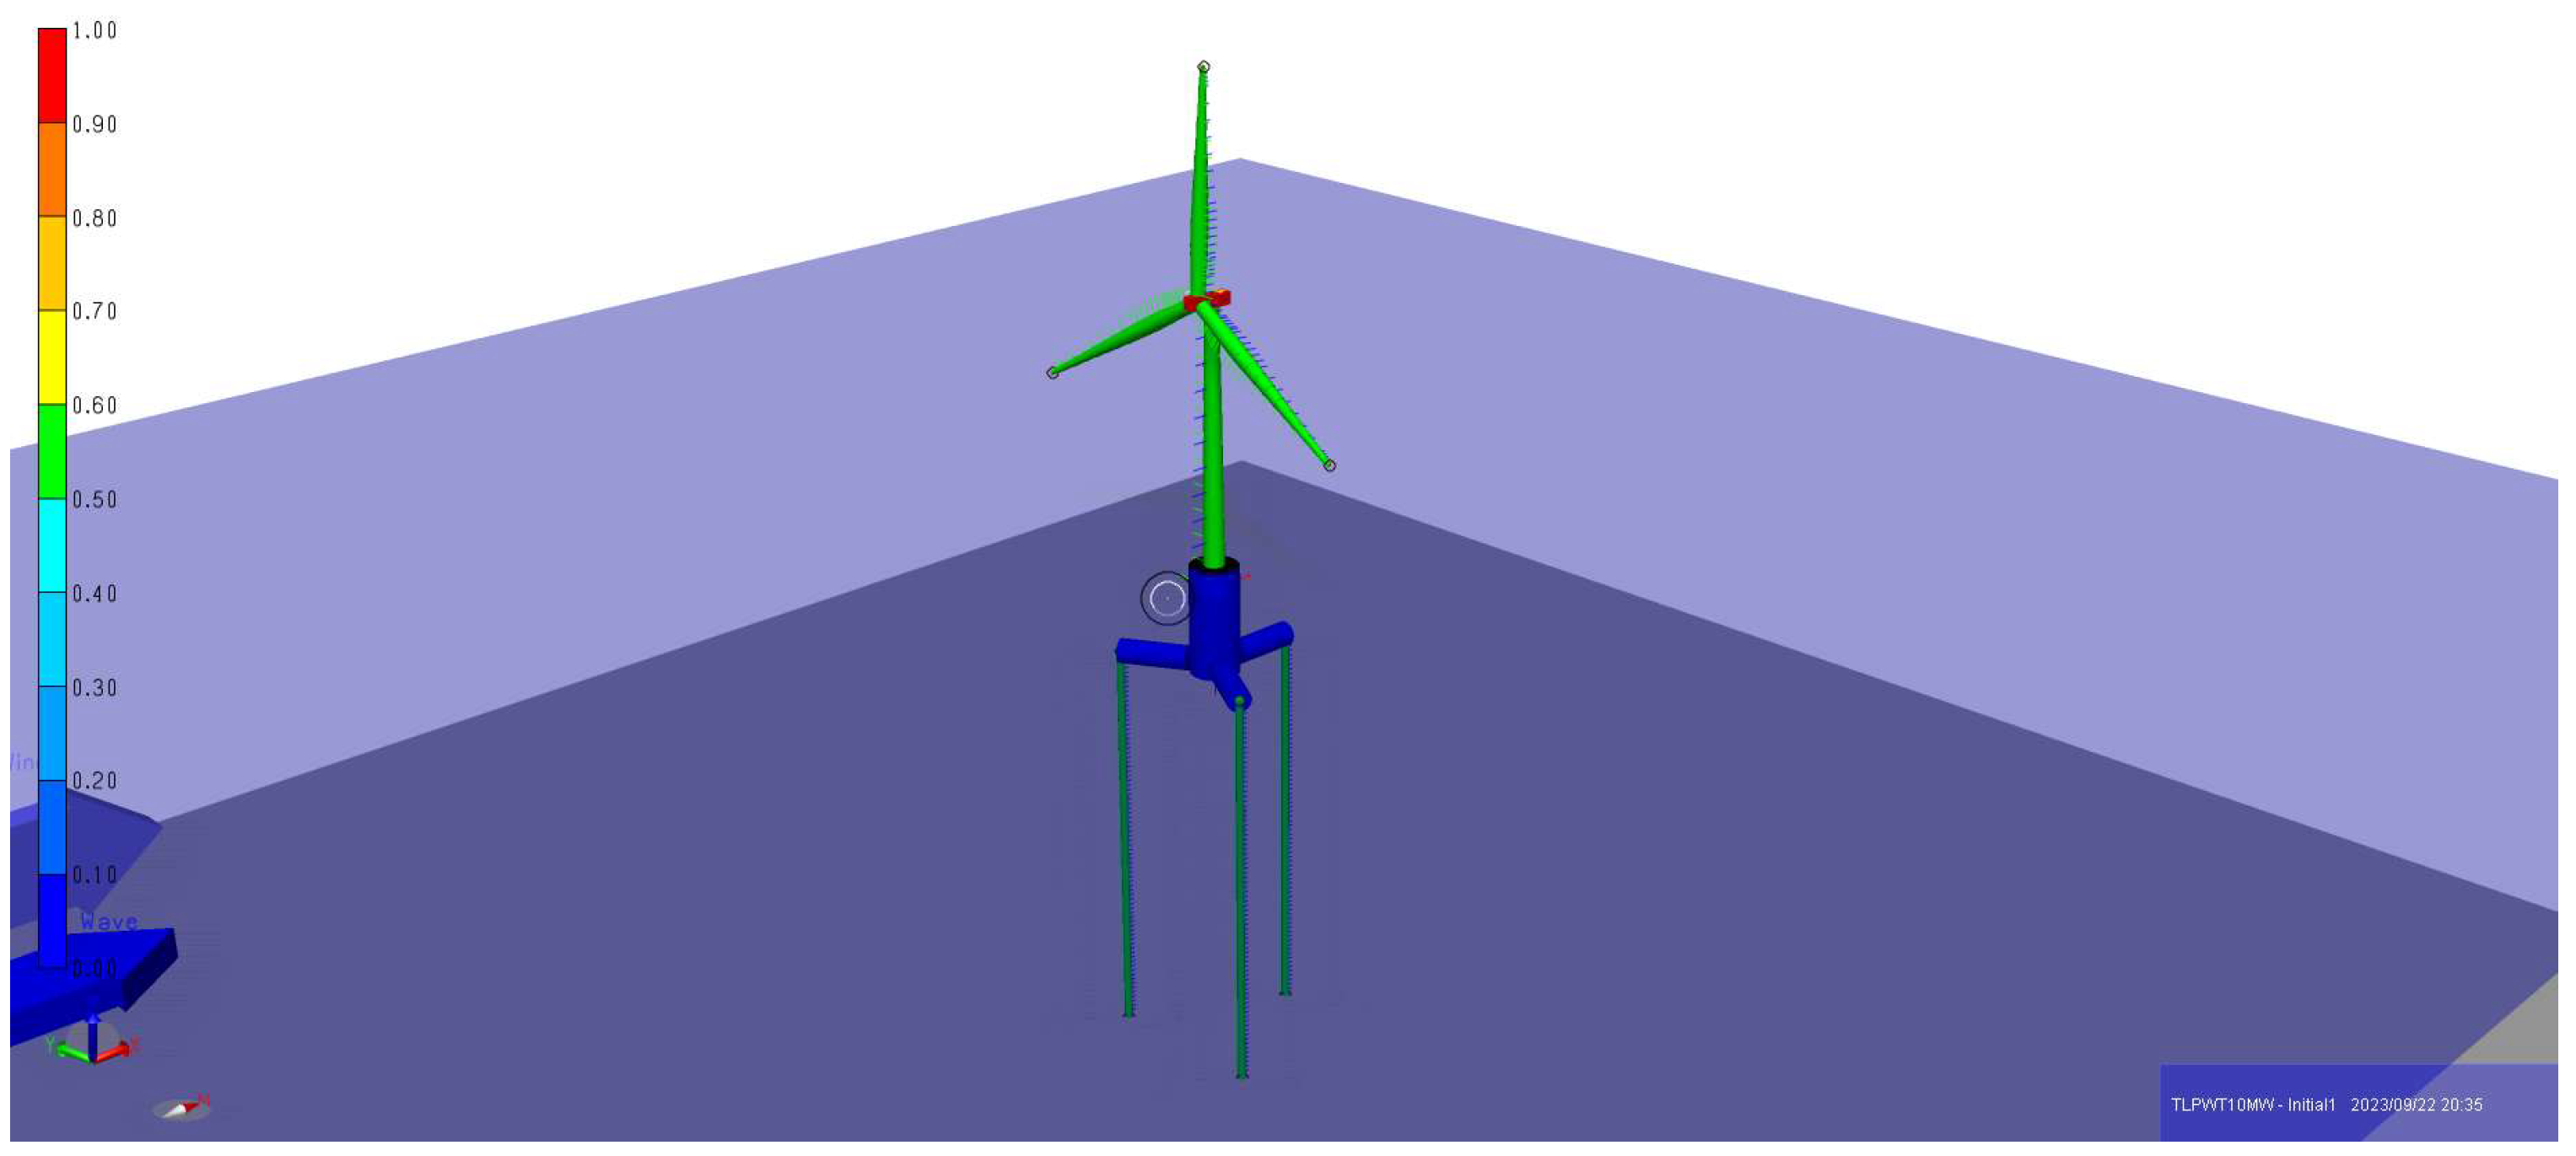
Figure 8.
INO-WINDMOOR downwind semi-submersible floating wind turbine with 12 MW power capacity and 150 m water depth. The authors processed the figure in accordance with the information presented in [3].
Figure 8.
INO-WINDMOOR downwind semi-submersible floating wind turbine with 12 MW power capacity and 150 m water depth. The authors processed the figure in accordance with the information presented in [3].
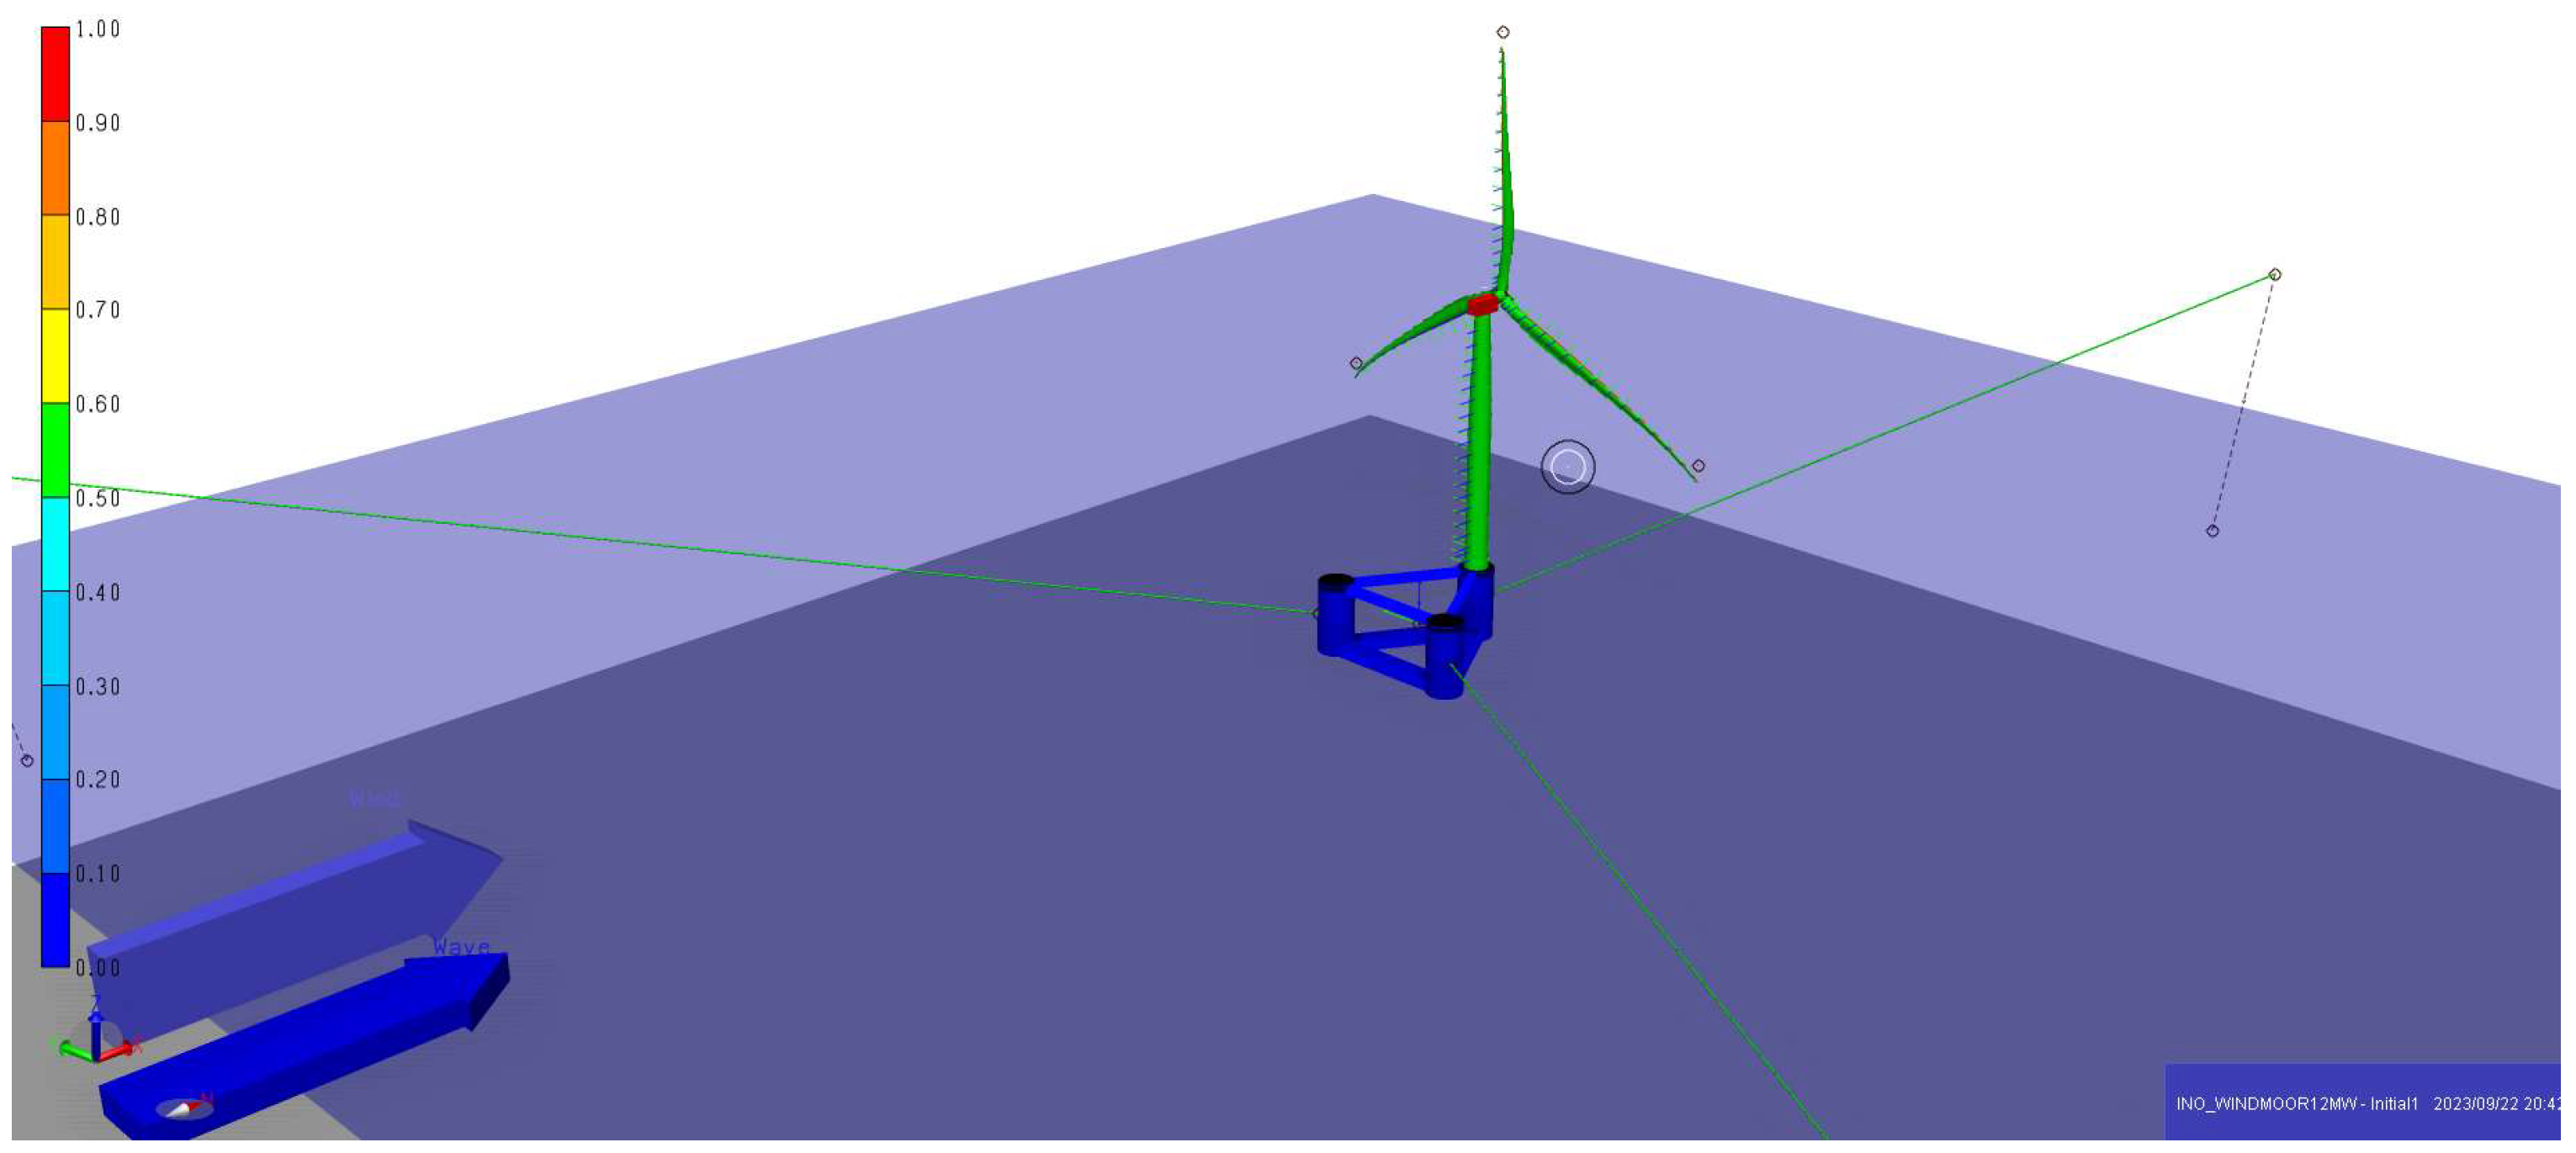
Figure 9.
UMaine VolturnUS-S upwind semi-submersible floating wind turbine with 15 MW power capacity and 200 m water depth. The authors processed the figure in accordance with the information presented in [3].
Figure 9.
UMaine VolturnUS-S upwind semi-submersible floating wind turbine with 15 MW power capacity and 200 m water depth. The authors processed the figure in accordance with the information presented in [3].
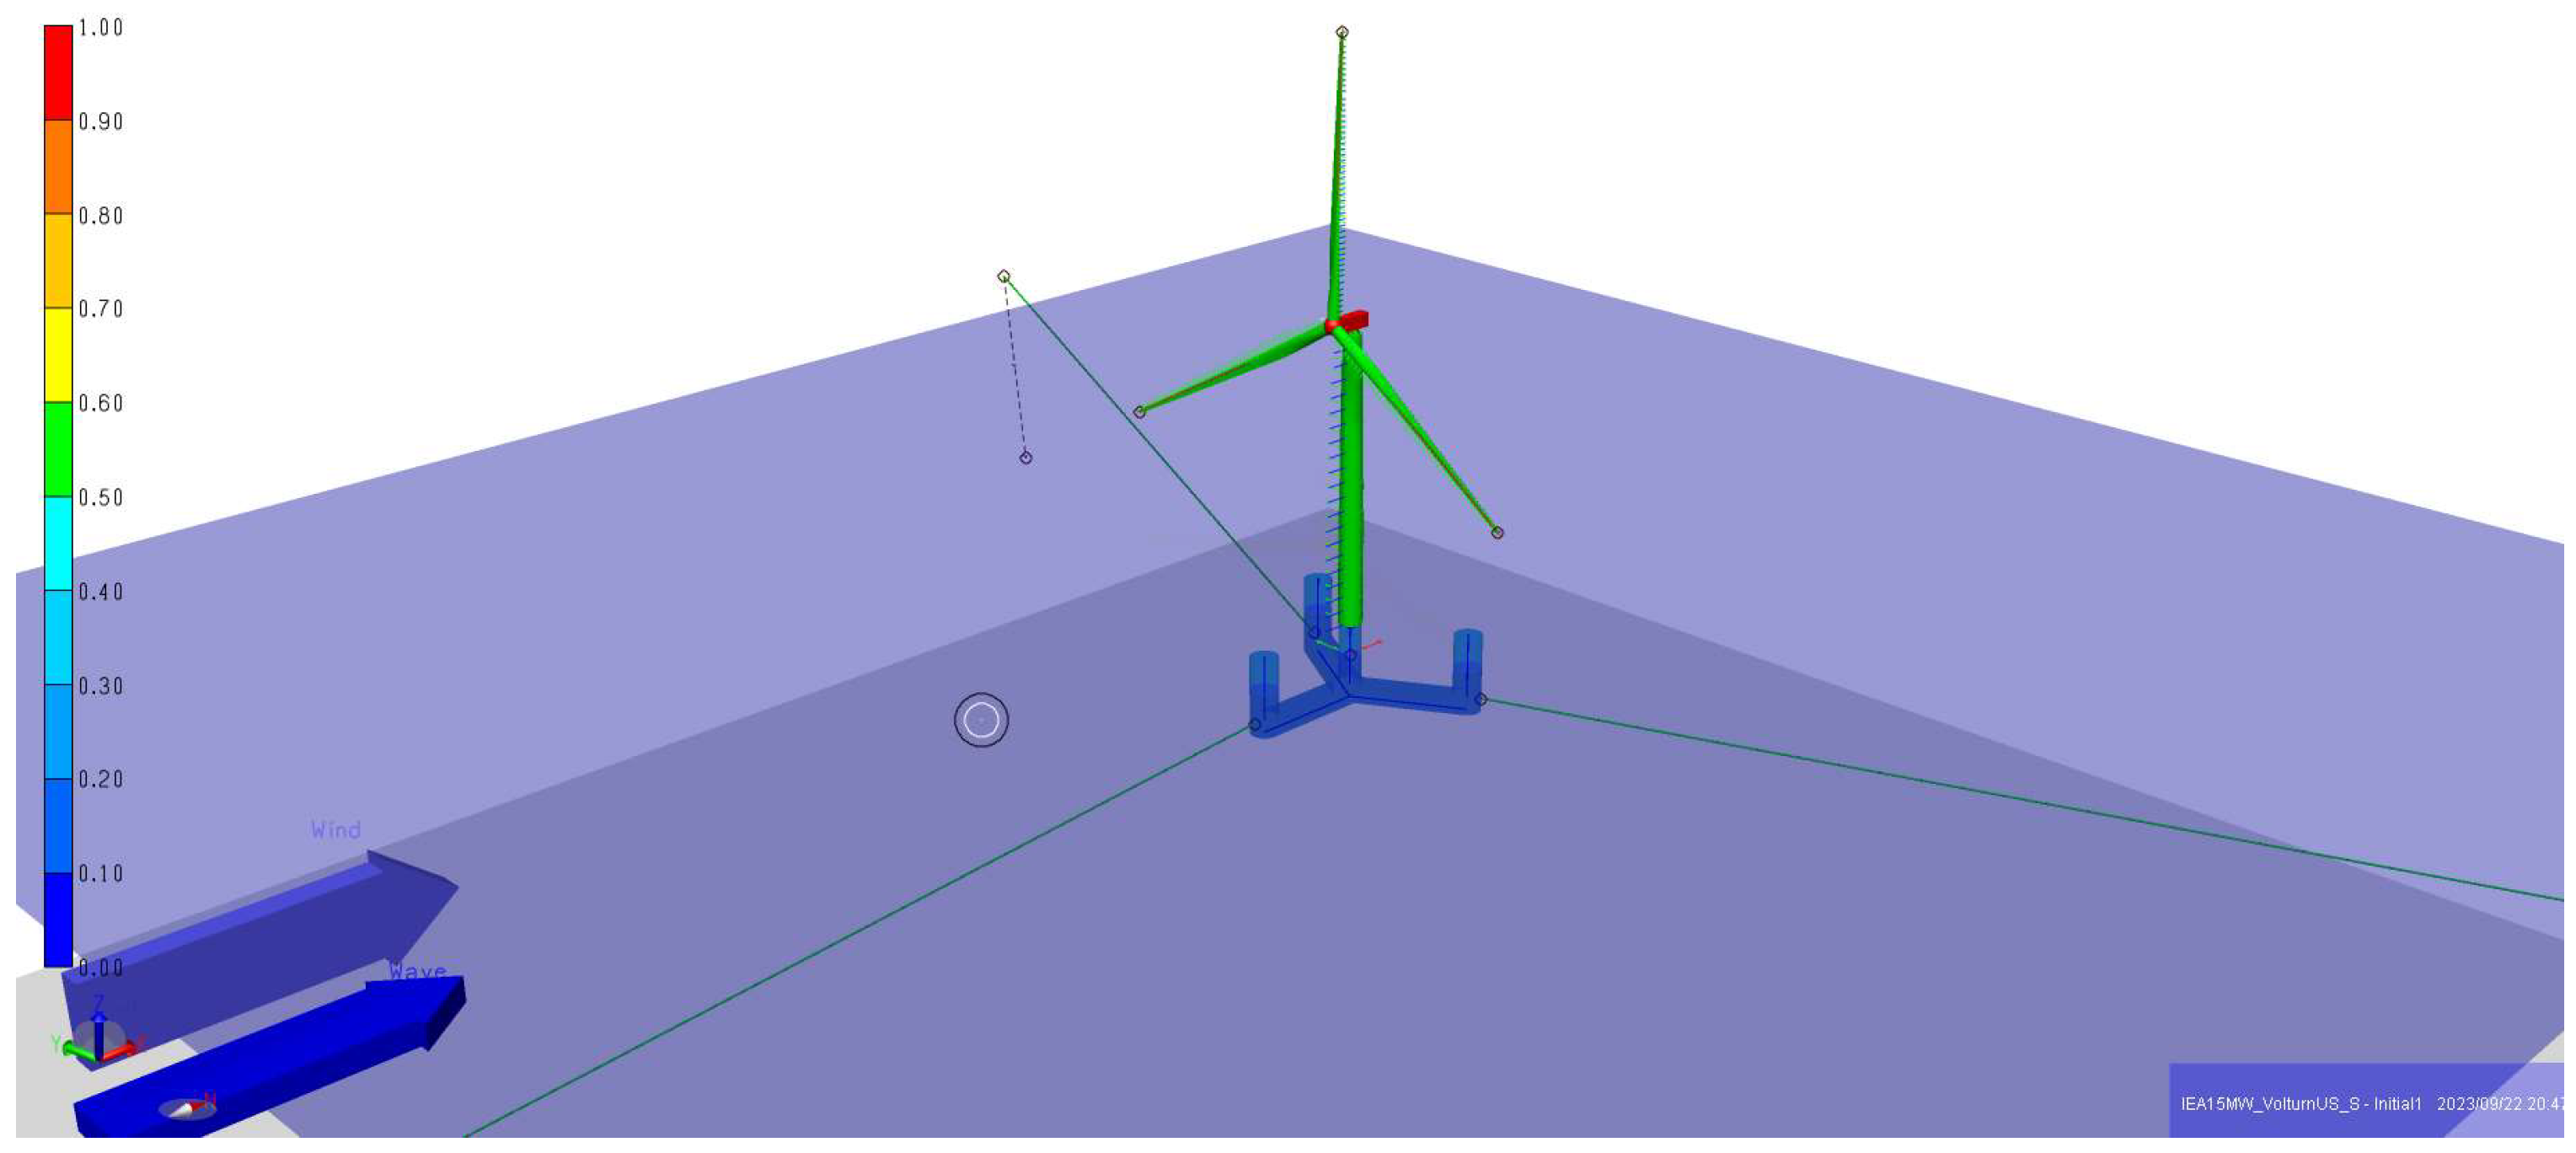
Figure 10.
10 MW Surge graph representing the data presented in Table 1 (x-axis: different wind speeds (m/s), y-axis: Surge offset (m)).
Figure 10.
10 MW Surge graph representing the data presented in Table 1 (x-axis: different wind speeds (m/s), y-axis: Surge offset (m)).
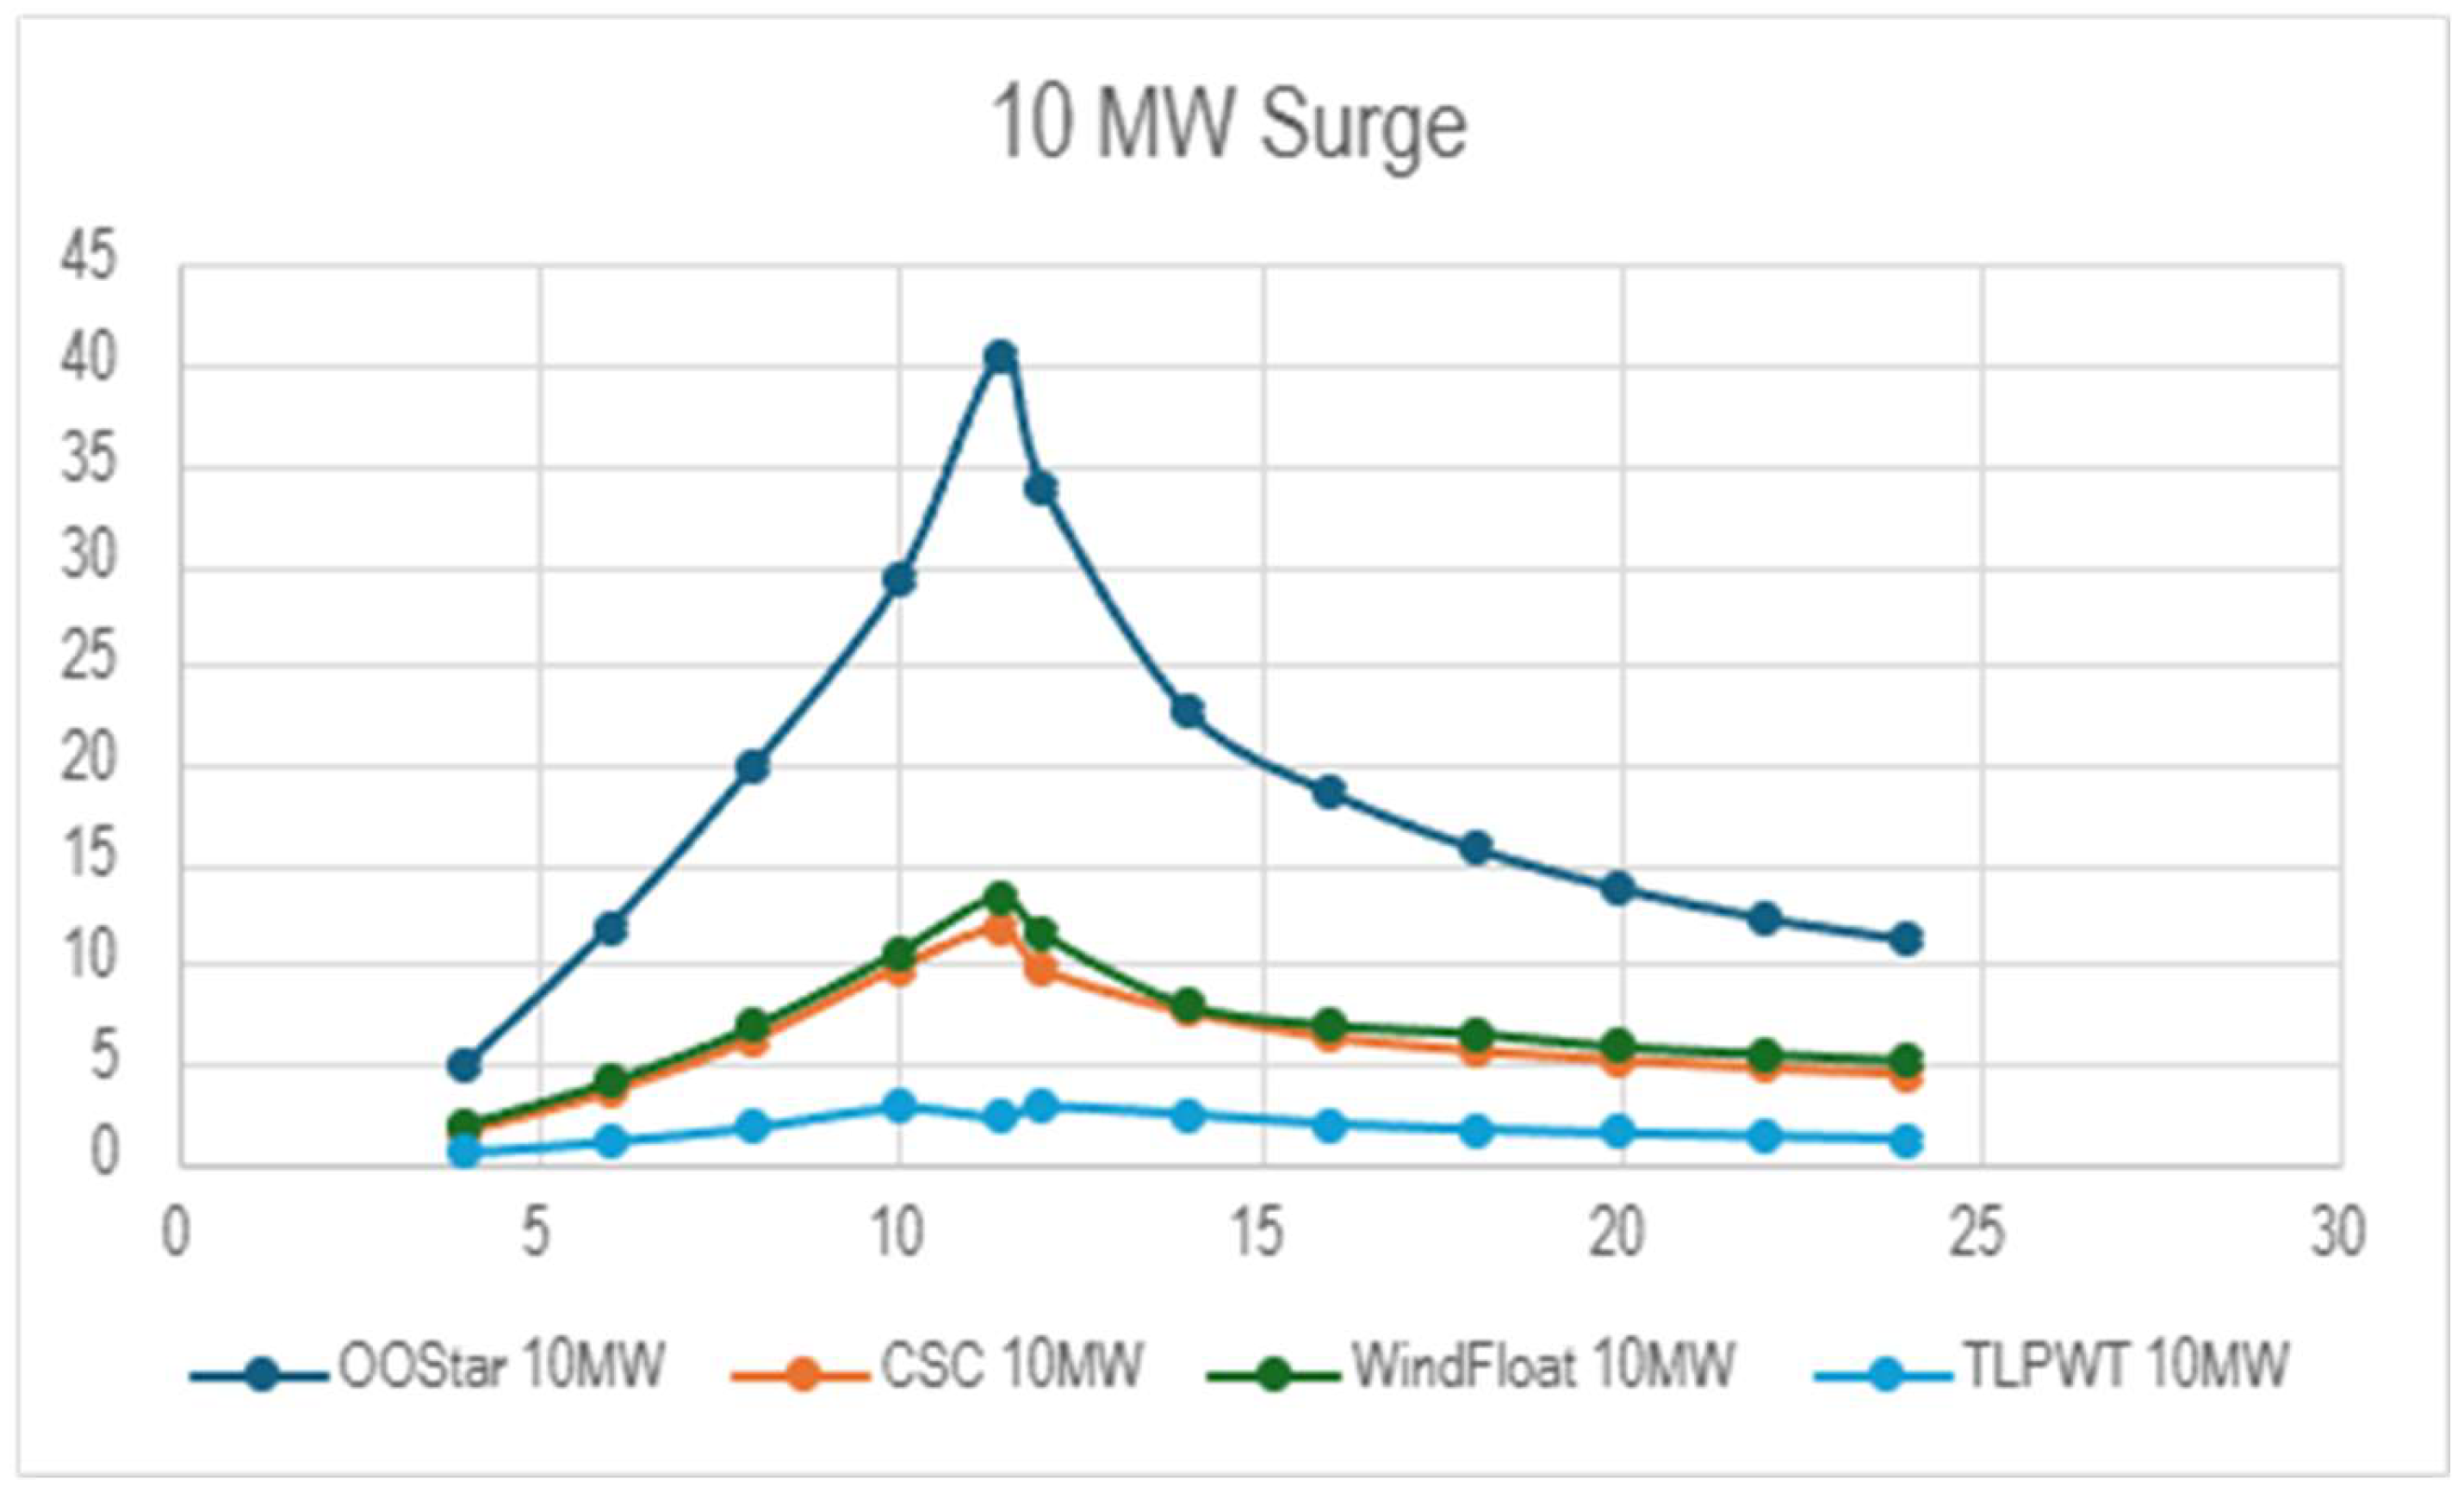
Figure 11.
10 MW Roll graph representing the data presented in Table 2 (x-axis: different wind speeds (m/s), y-axis: Roll offset (°)).
Figure 11.
10 MW Roll graph representing the data presented in Table 2 (x-axis: different wind speeds (m/s), y-axis: Roll offset (°)).
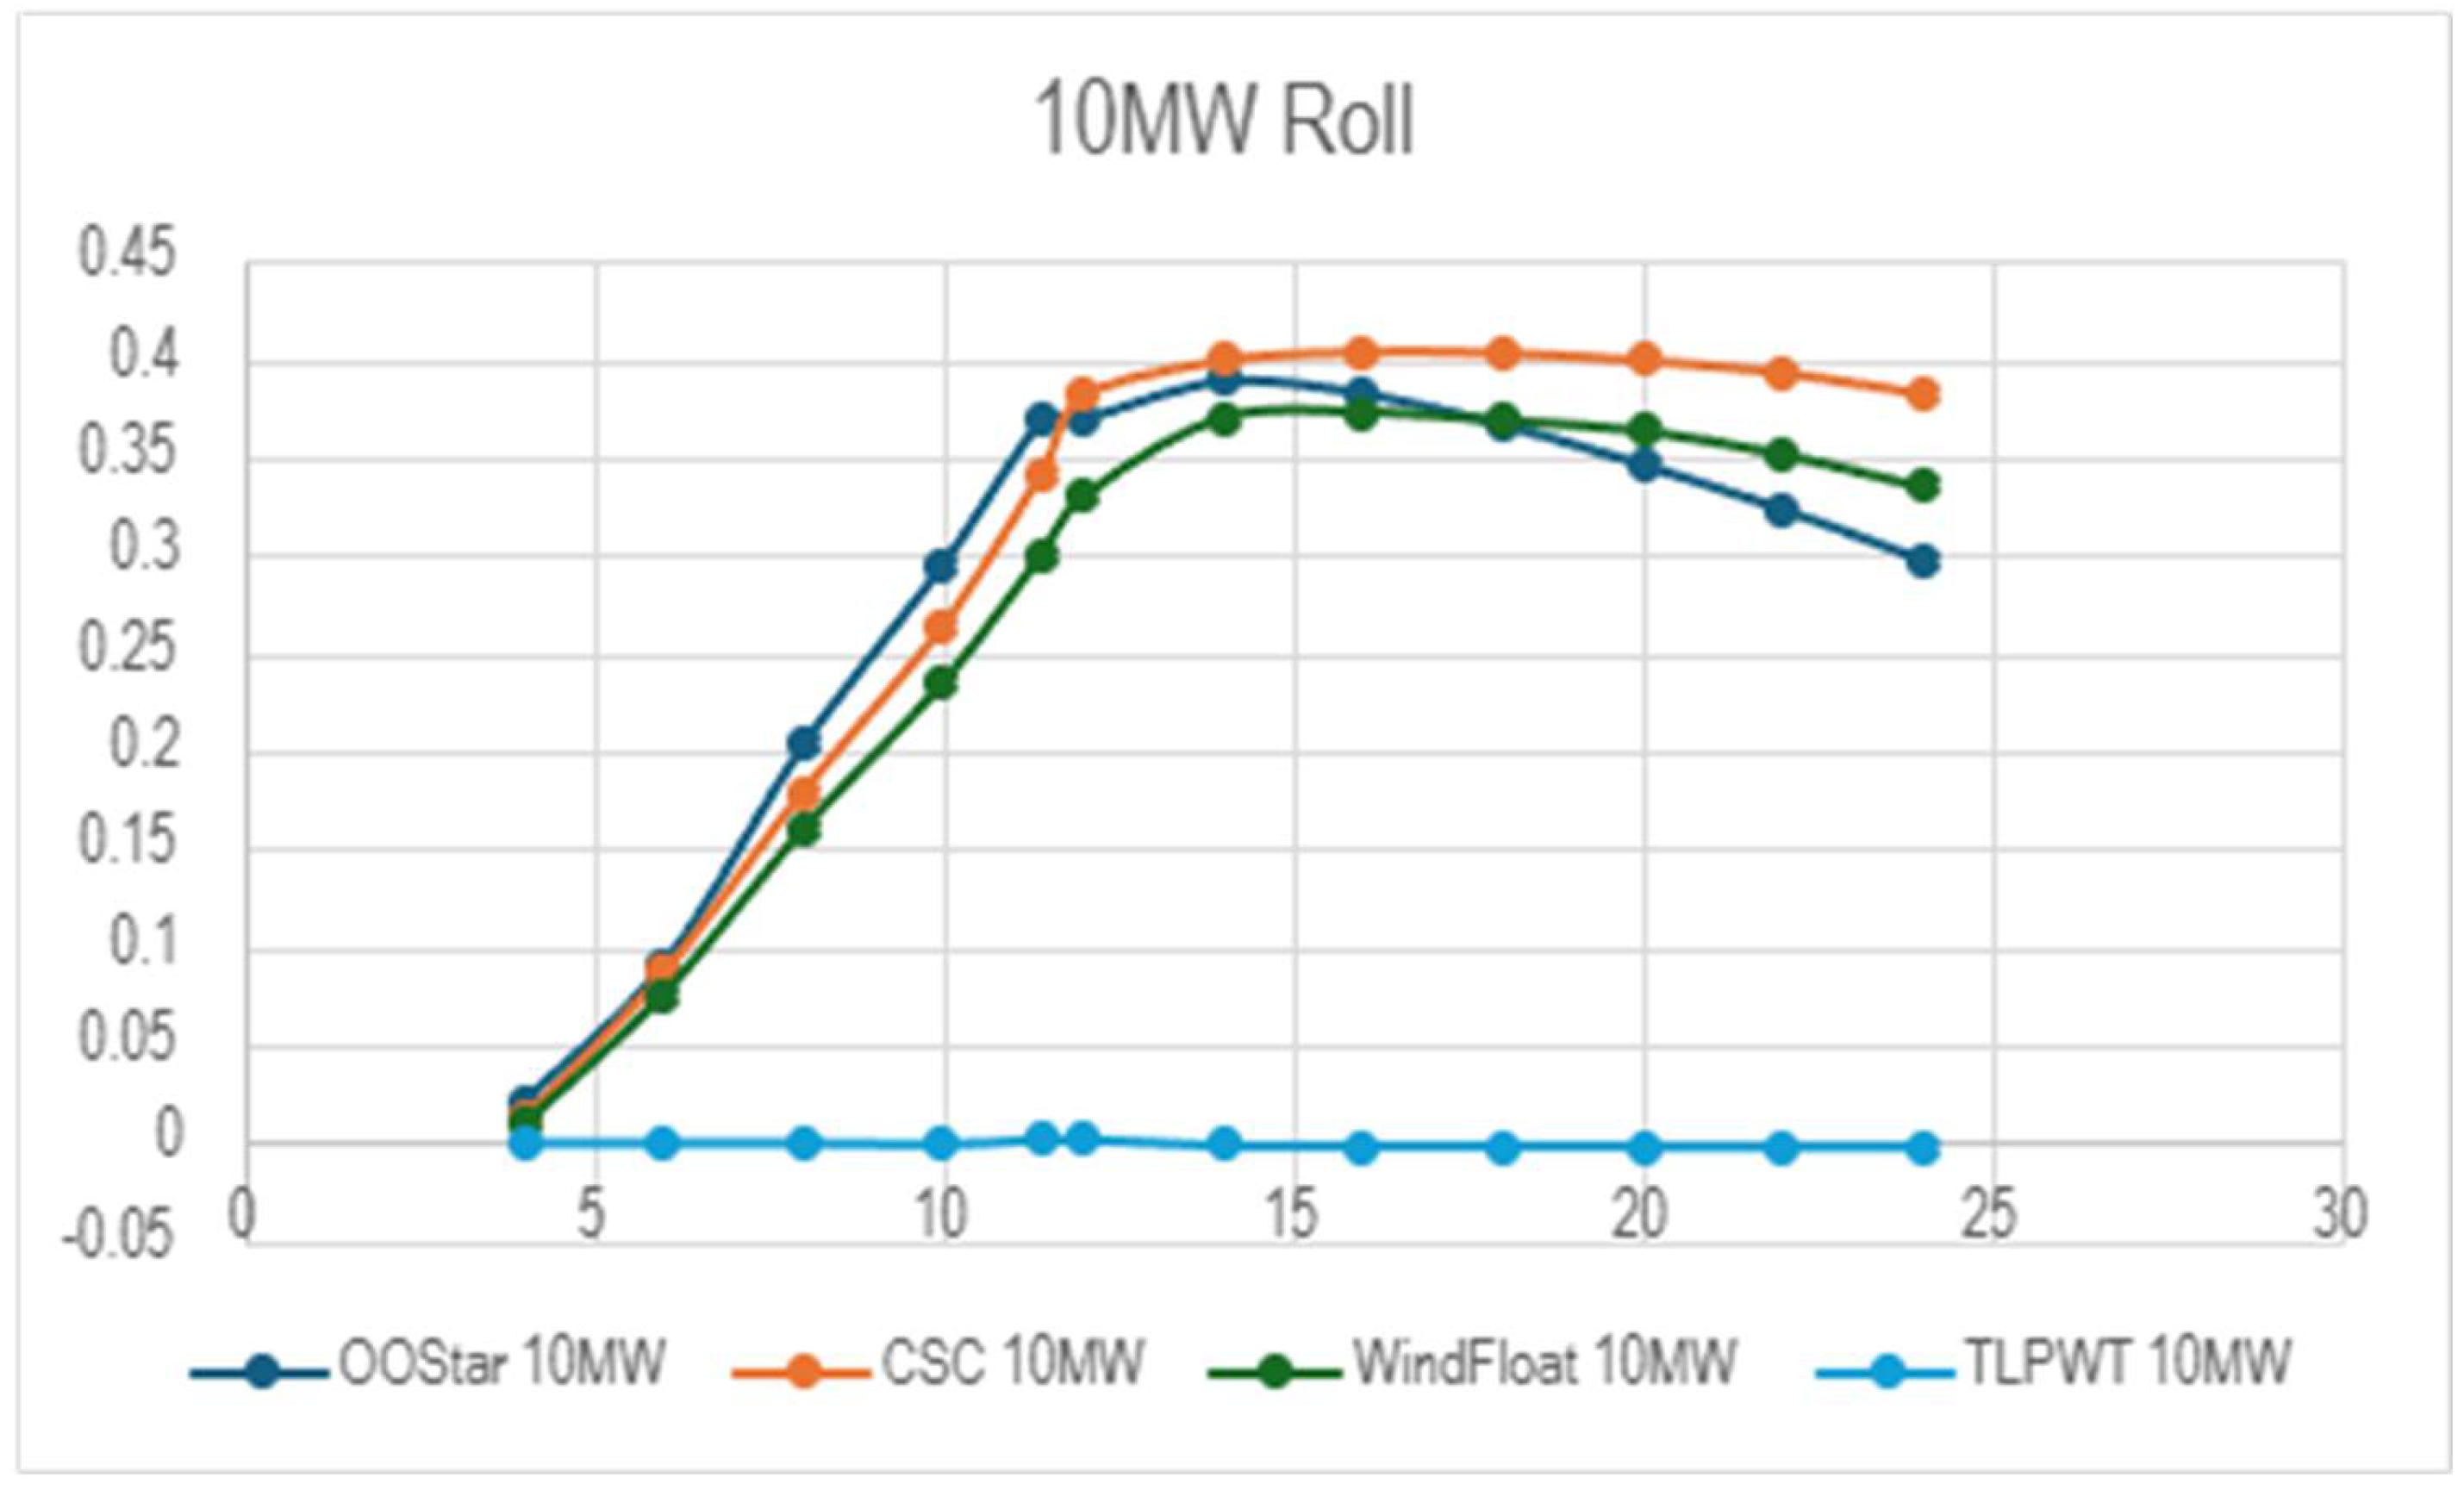
Figure 12.
10 MW Pitch graph representing the data presented in Table 3 (x-axis: different wind speeds (m/s), y-axis: Pitch offset (°)).
Figure 12.
10 MW Pitch graph representing the data presented in Table 3 (x-axis: different wind speeds (m/s), y-axis: Pitch offset (°)).
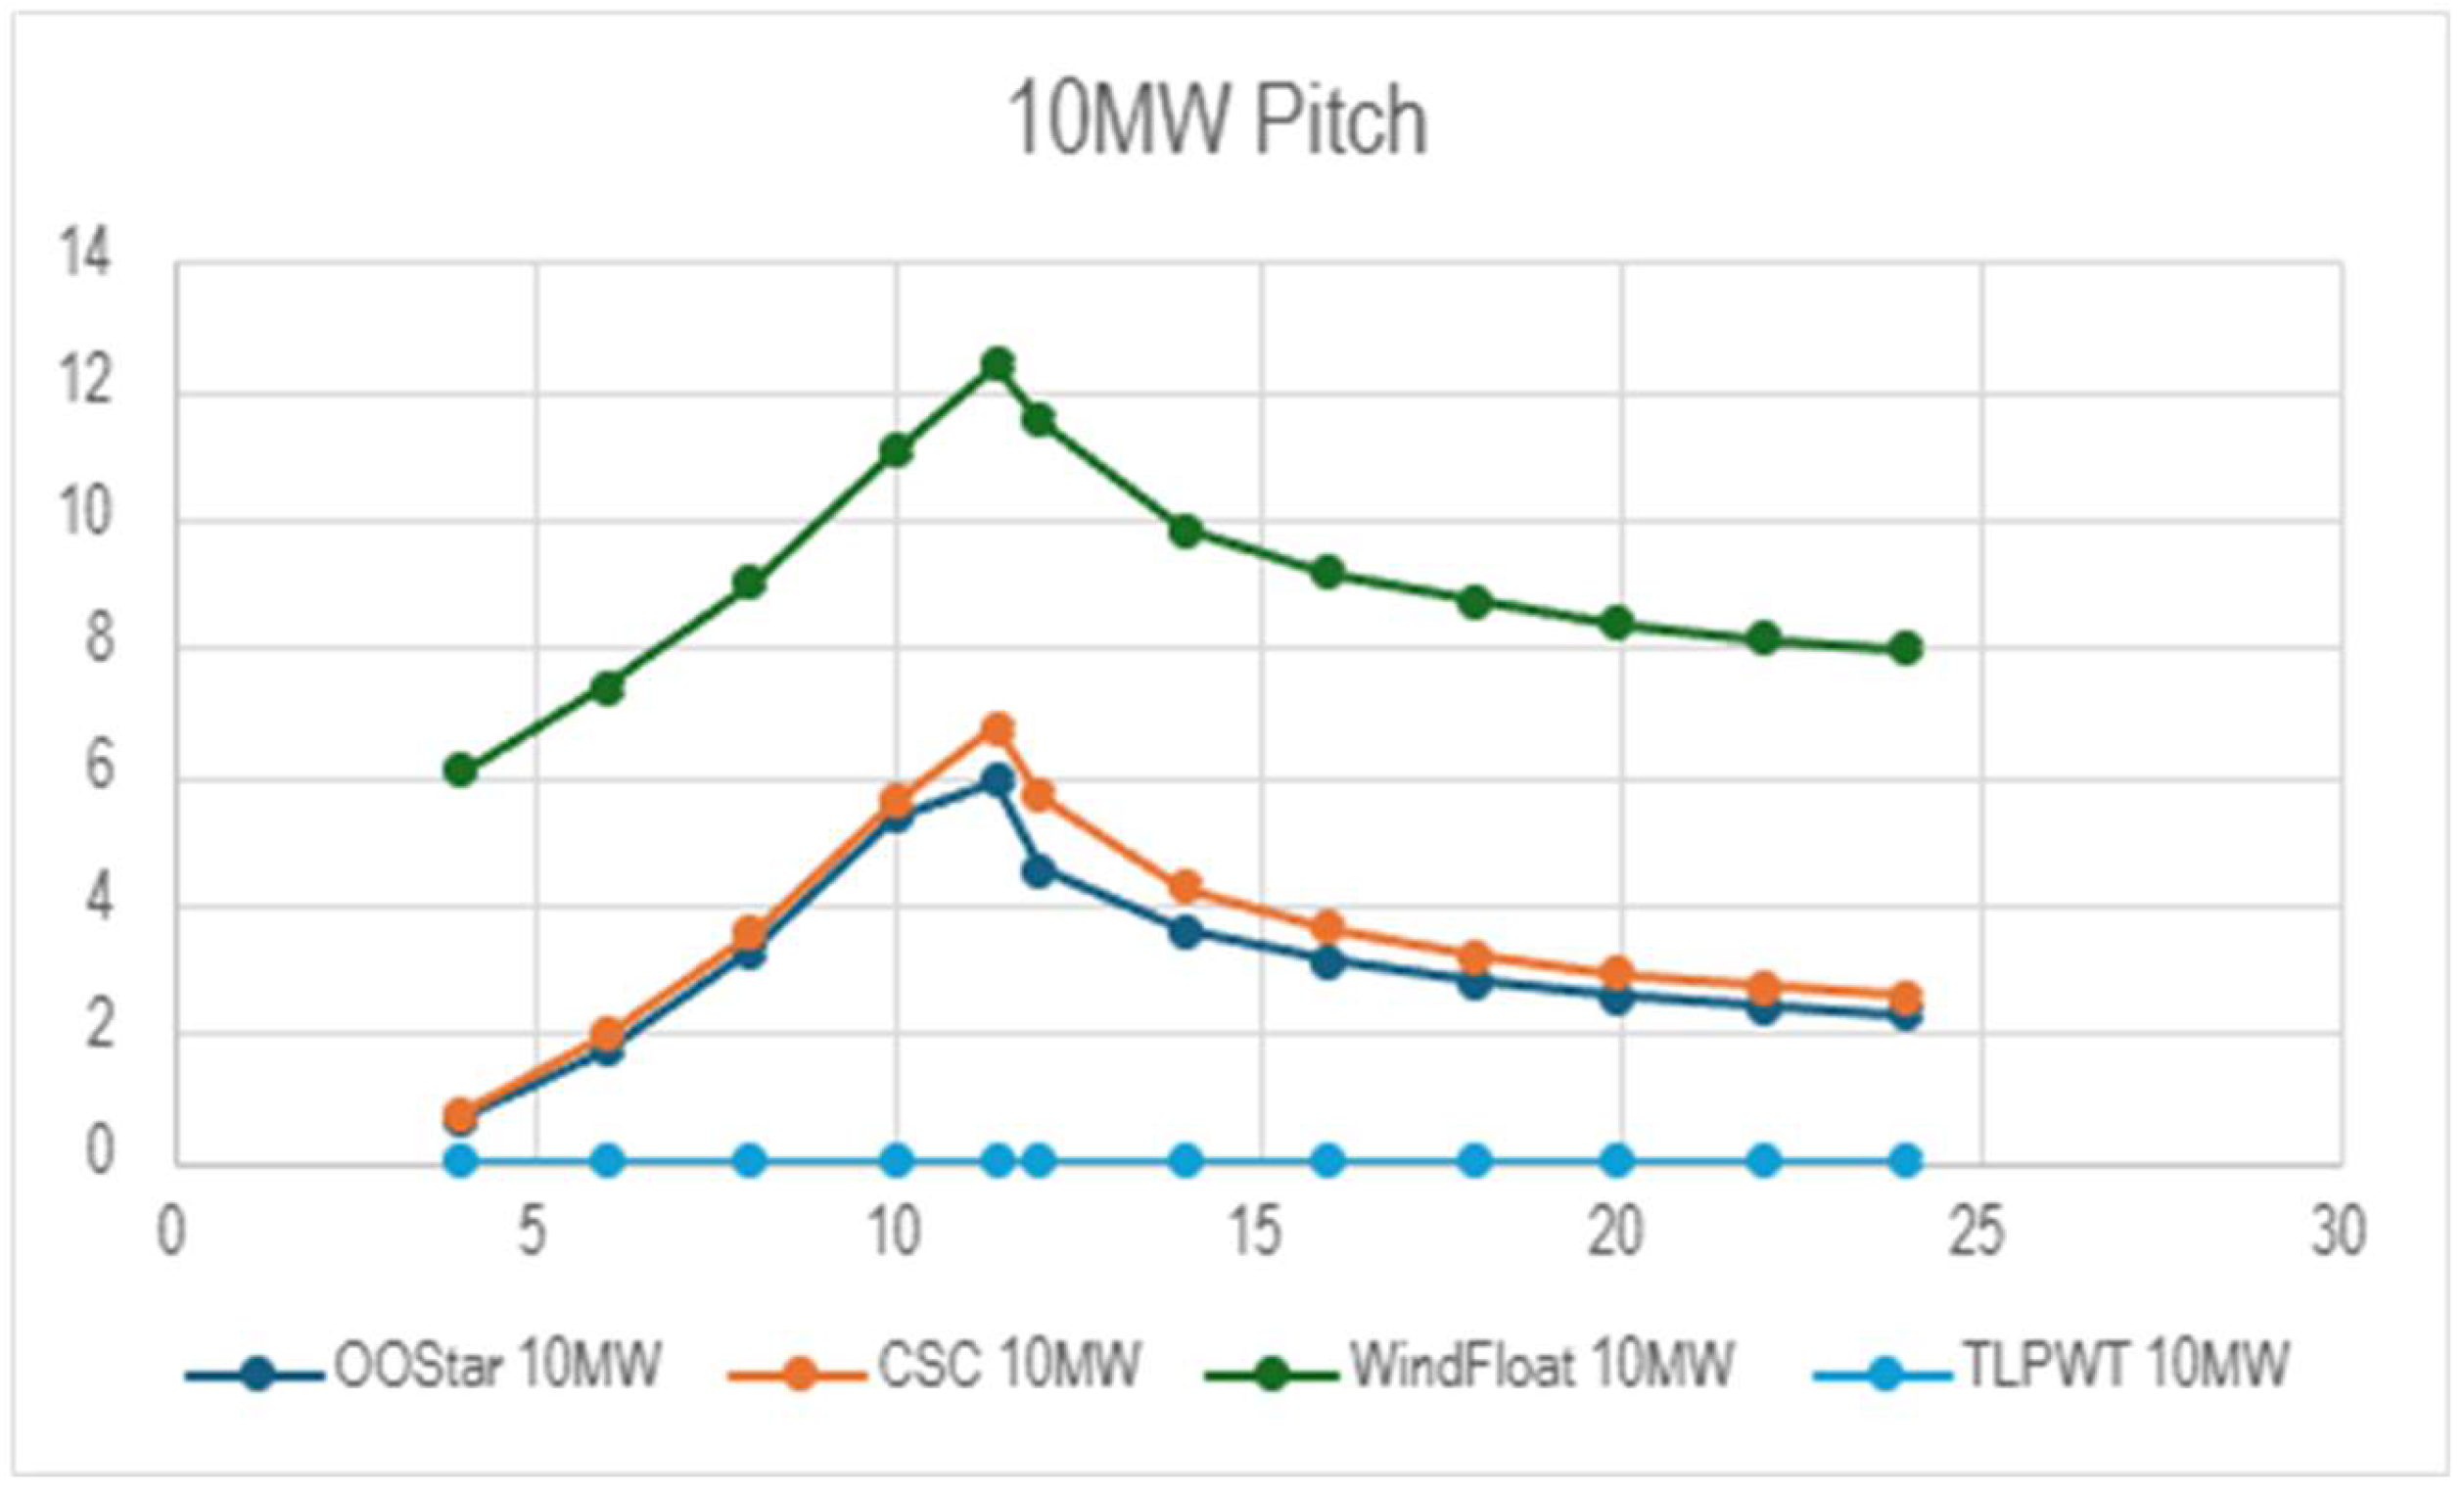
Figure 13.
15 MW and 12 MW Surge graph representing the data presented in Table 4 (x-axis: different wind speeds (m/s), y-axis: Surge offset (m)).
Figure 13.
15 MW and 12 MW Surge graph representing the data presented in Table 4 (x-axis: different wind speeds (m/s), y-axis: Surge offset (m)).
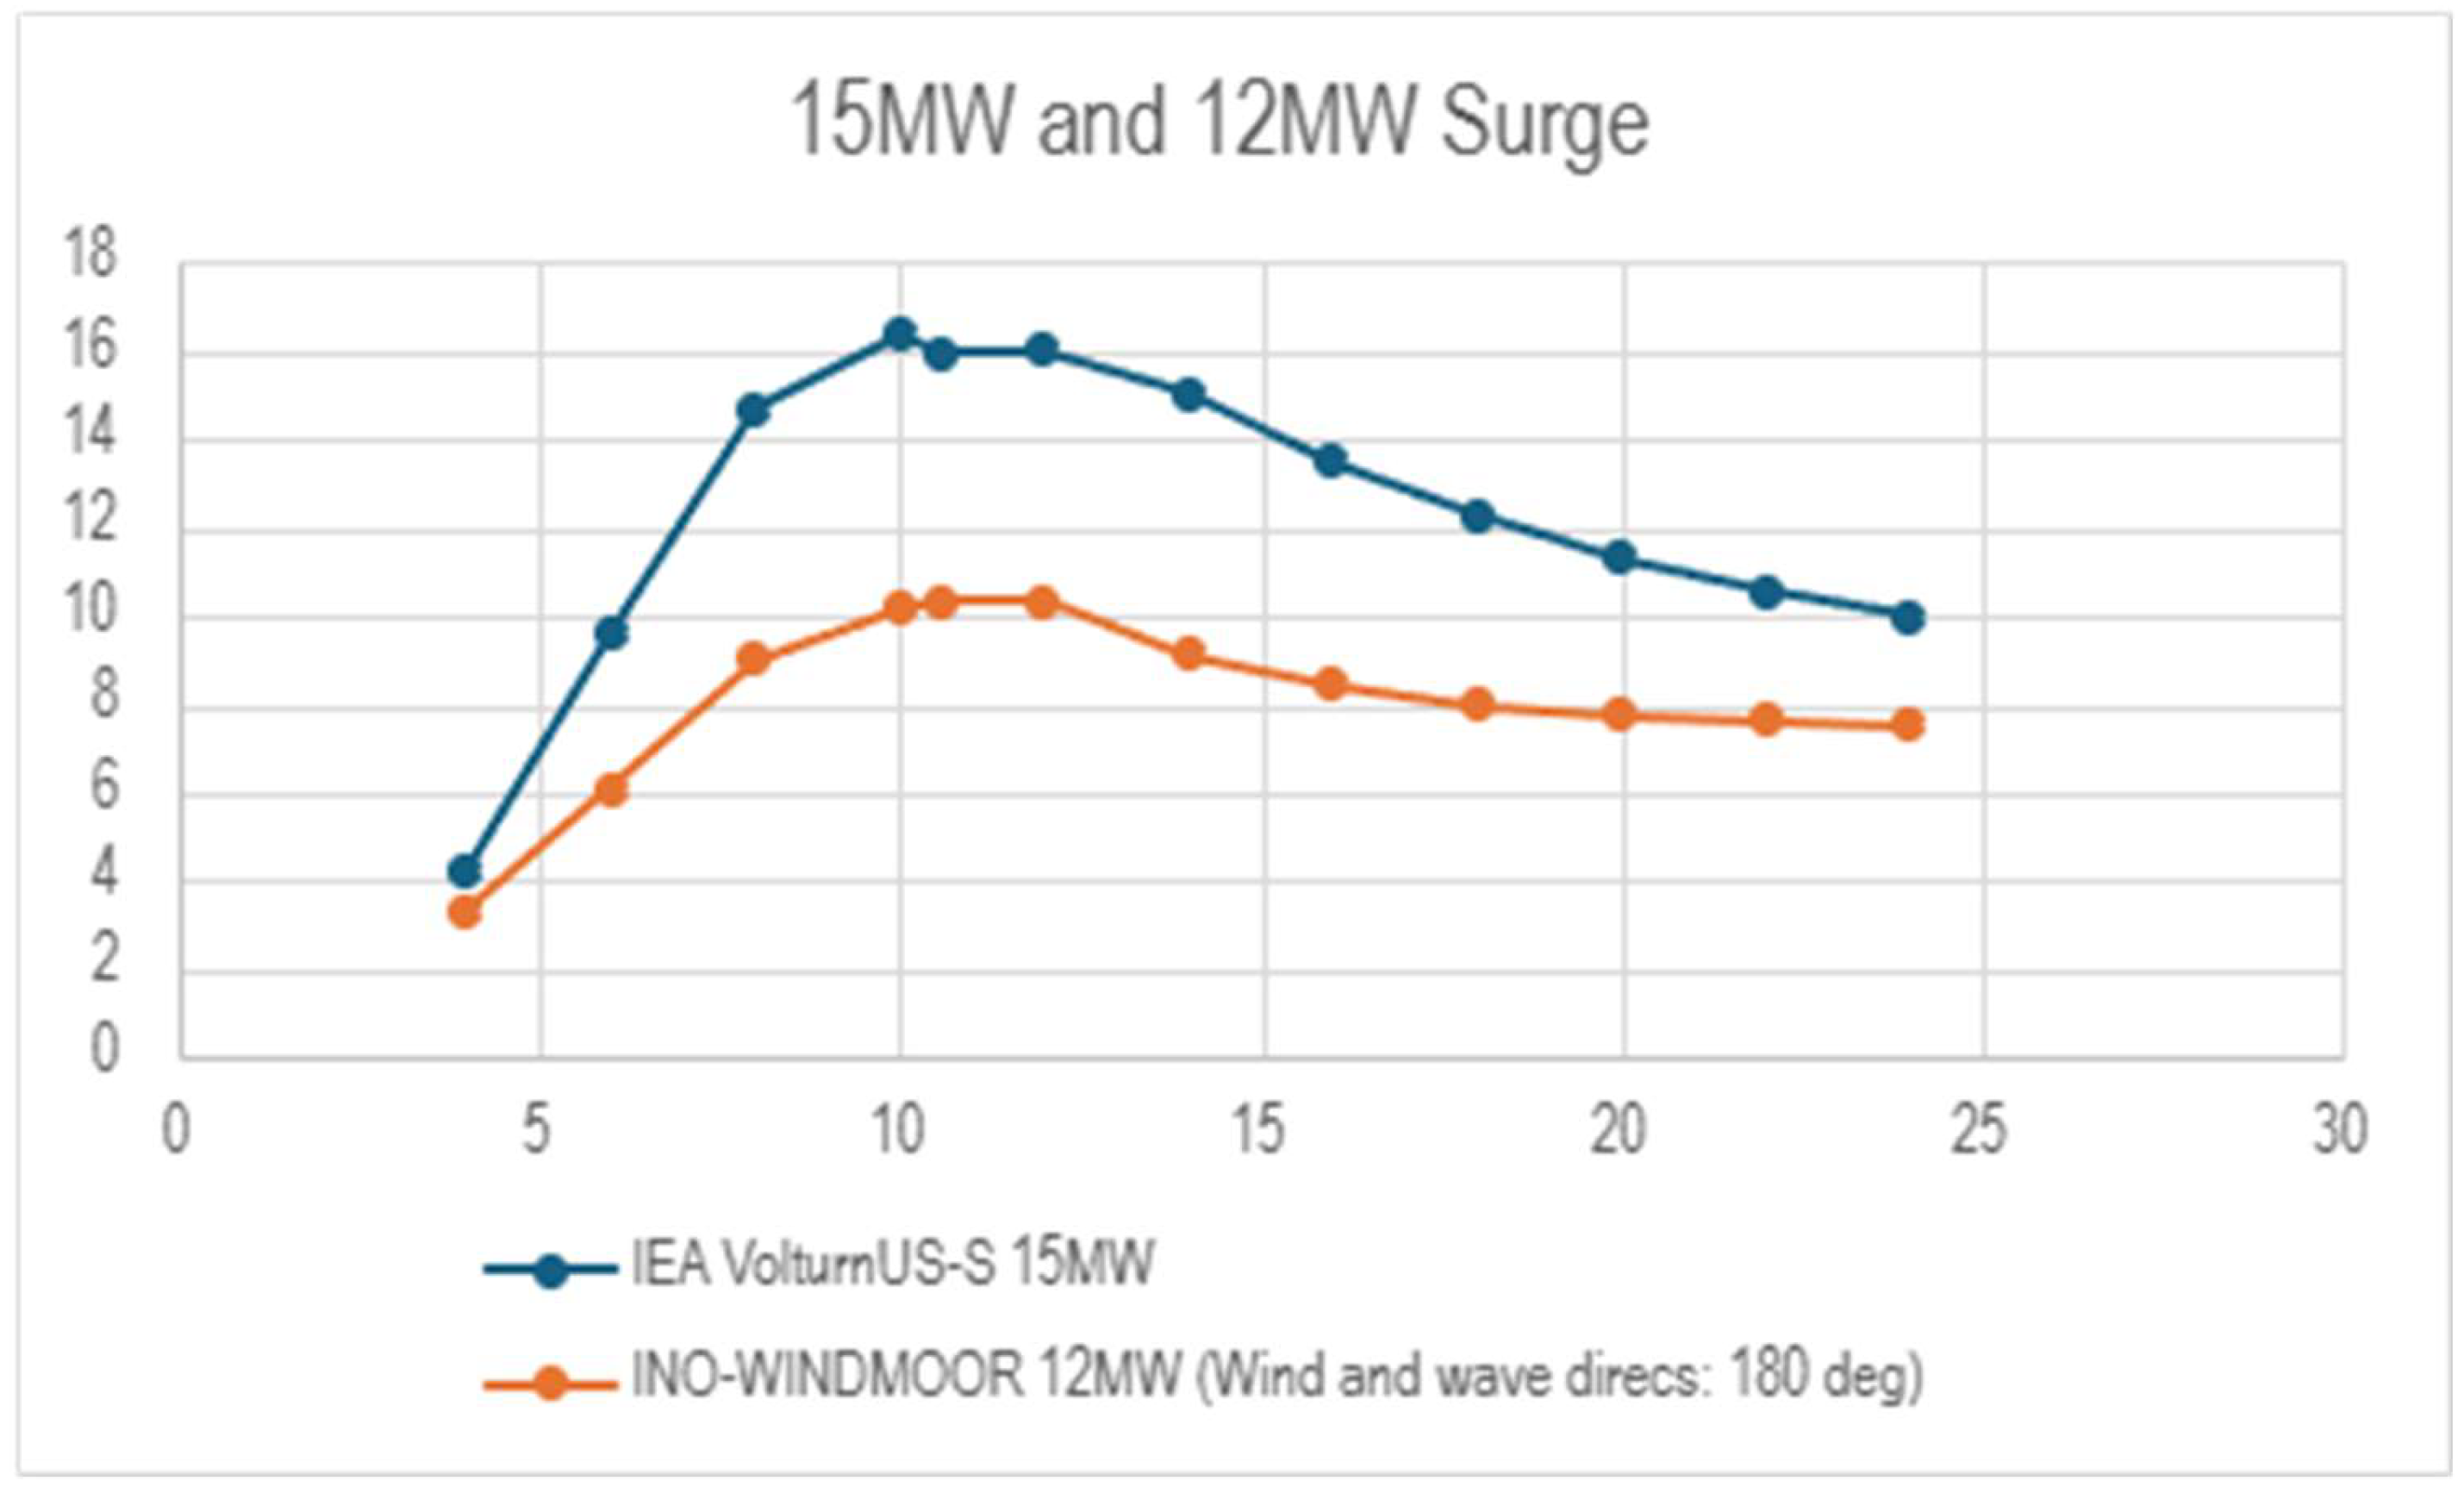
Figure 14.
15 MW and 12 MW Roll graph representing the data presented in Table 5 (x-axis: different wind speeds (m/s), y-axis: Roll offset (m)).
Figure 14.
15 MW and 12 MW Roll graph representing the data presented in Table 5 (x-axis: different wind speeds (m/s), y-axis: Roll offset (m)).
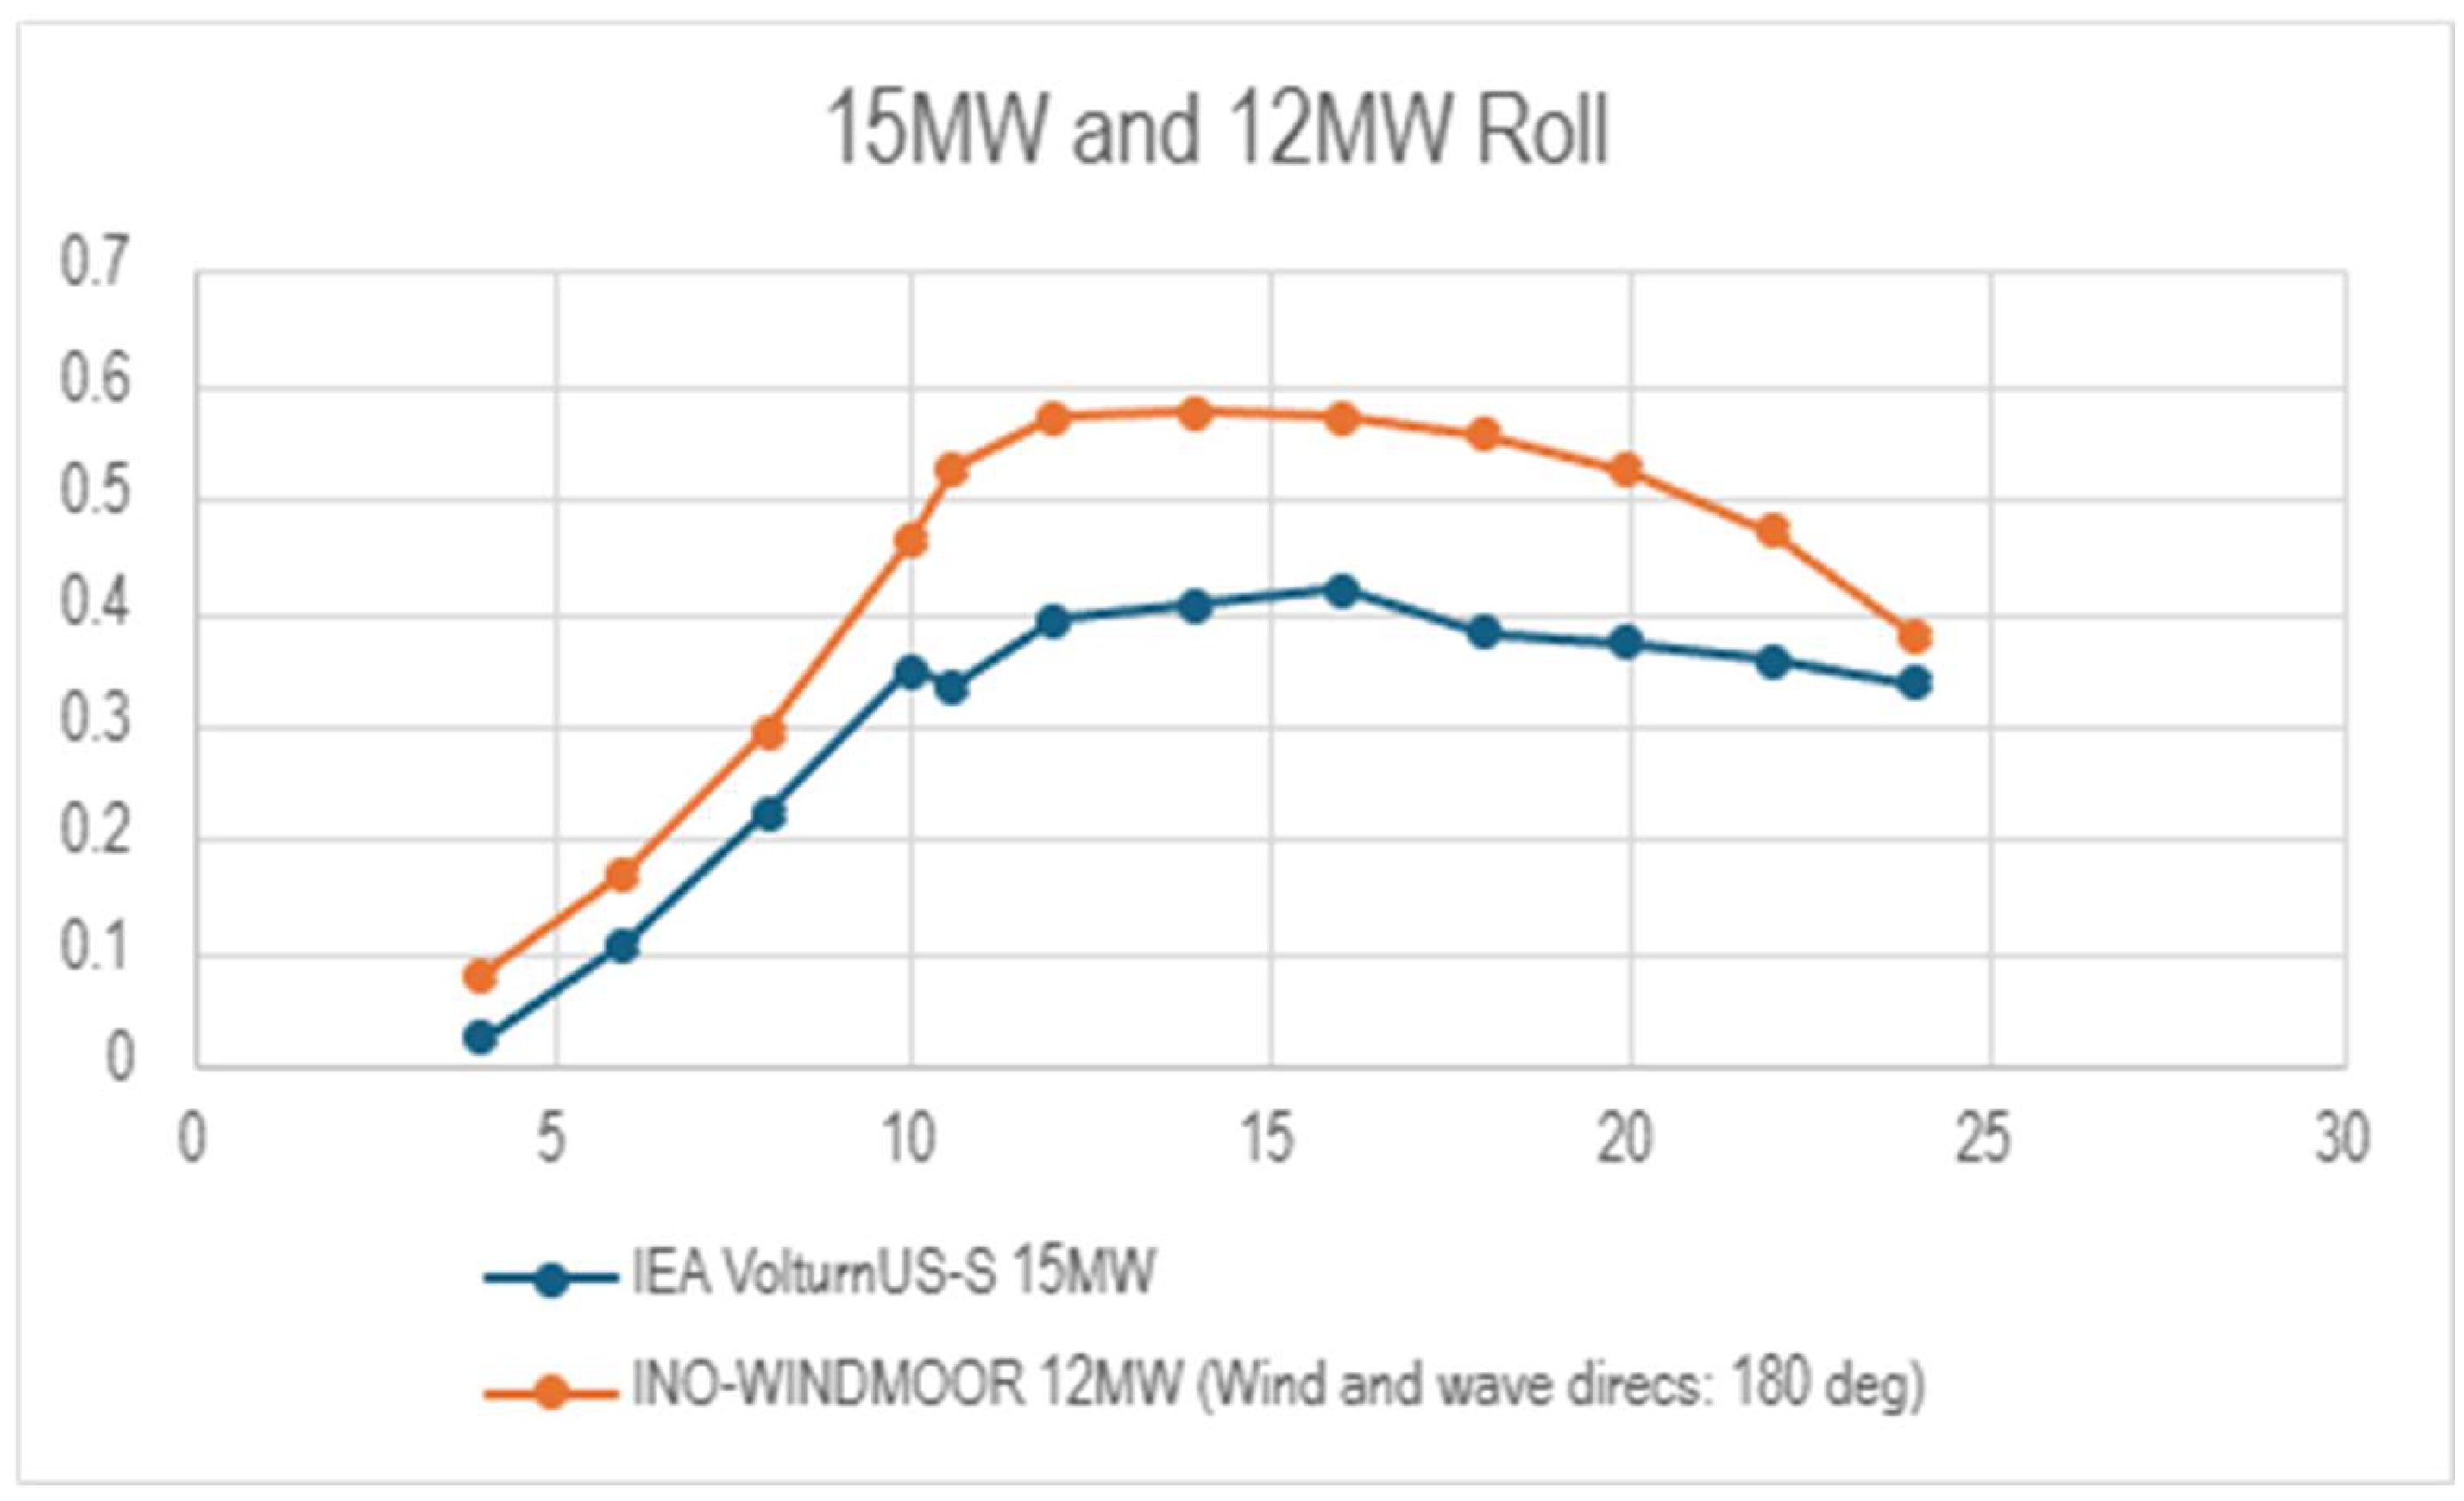
Figure 15.
15 MW and 12 MW Pitch graph representing the data presented in Table 6 (x-axis: different wind speeds (m/s), y-axis: Pitch offset (m)).
Figure 15.
15 MW and 12 MW Pitch graph representing the data presented in Table 6 (x-axis: different wind speeds (m/s), y-axis: Pitch offset (m)).
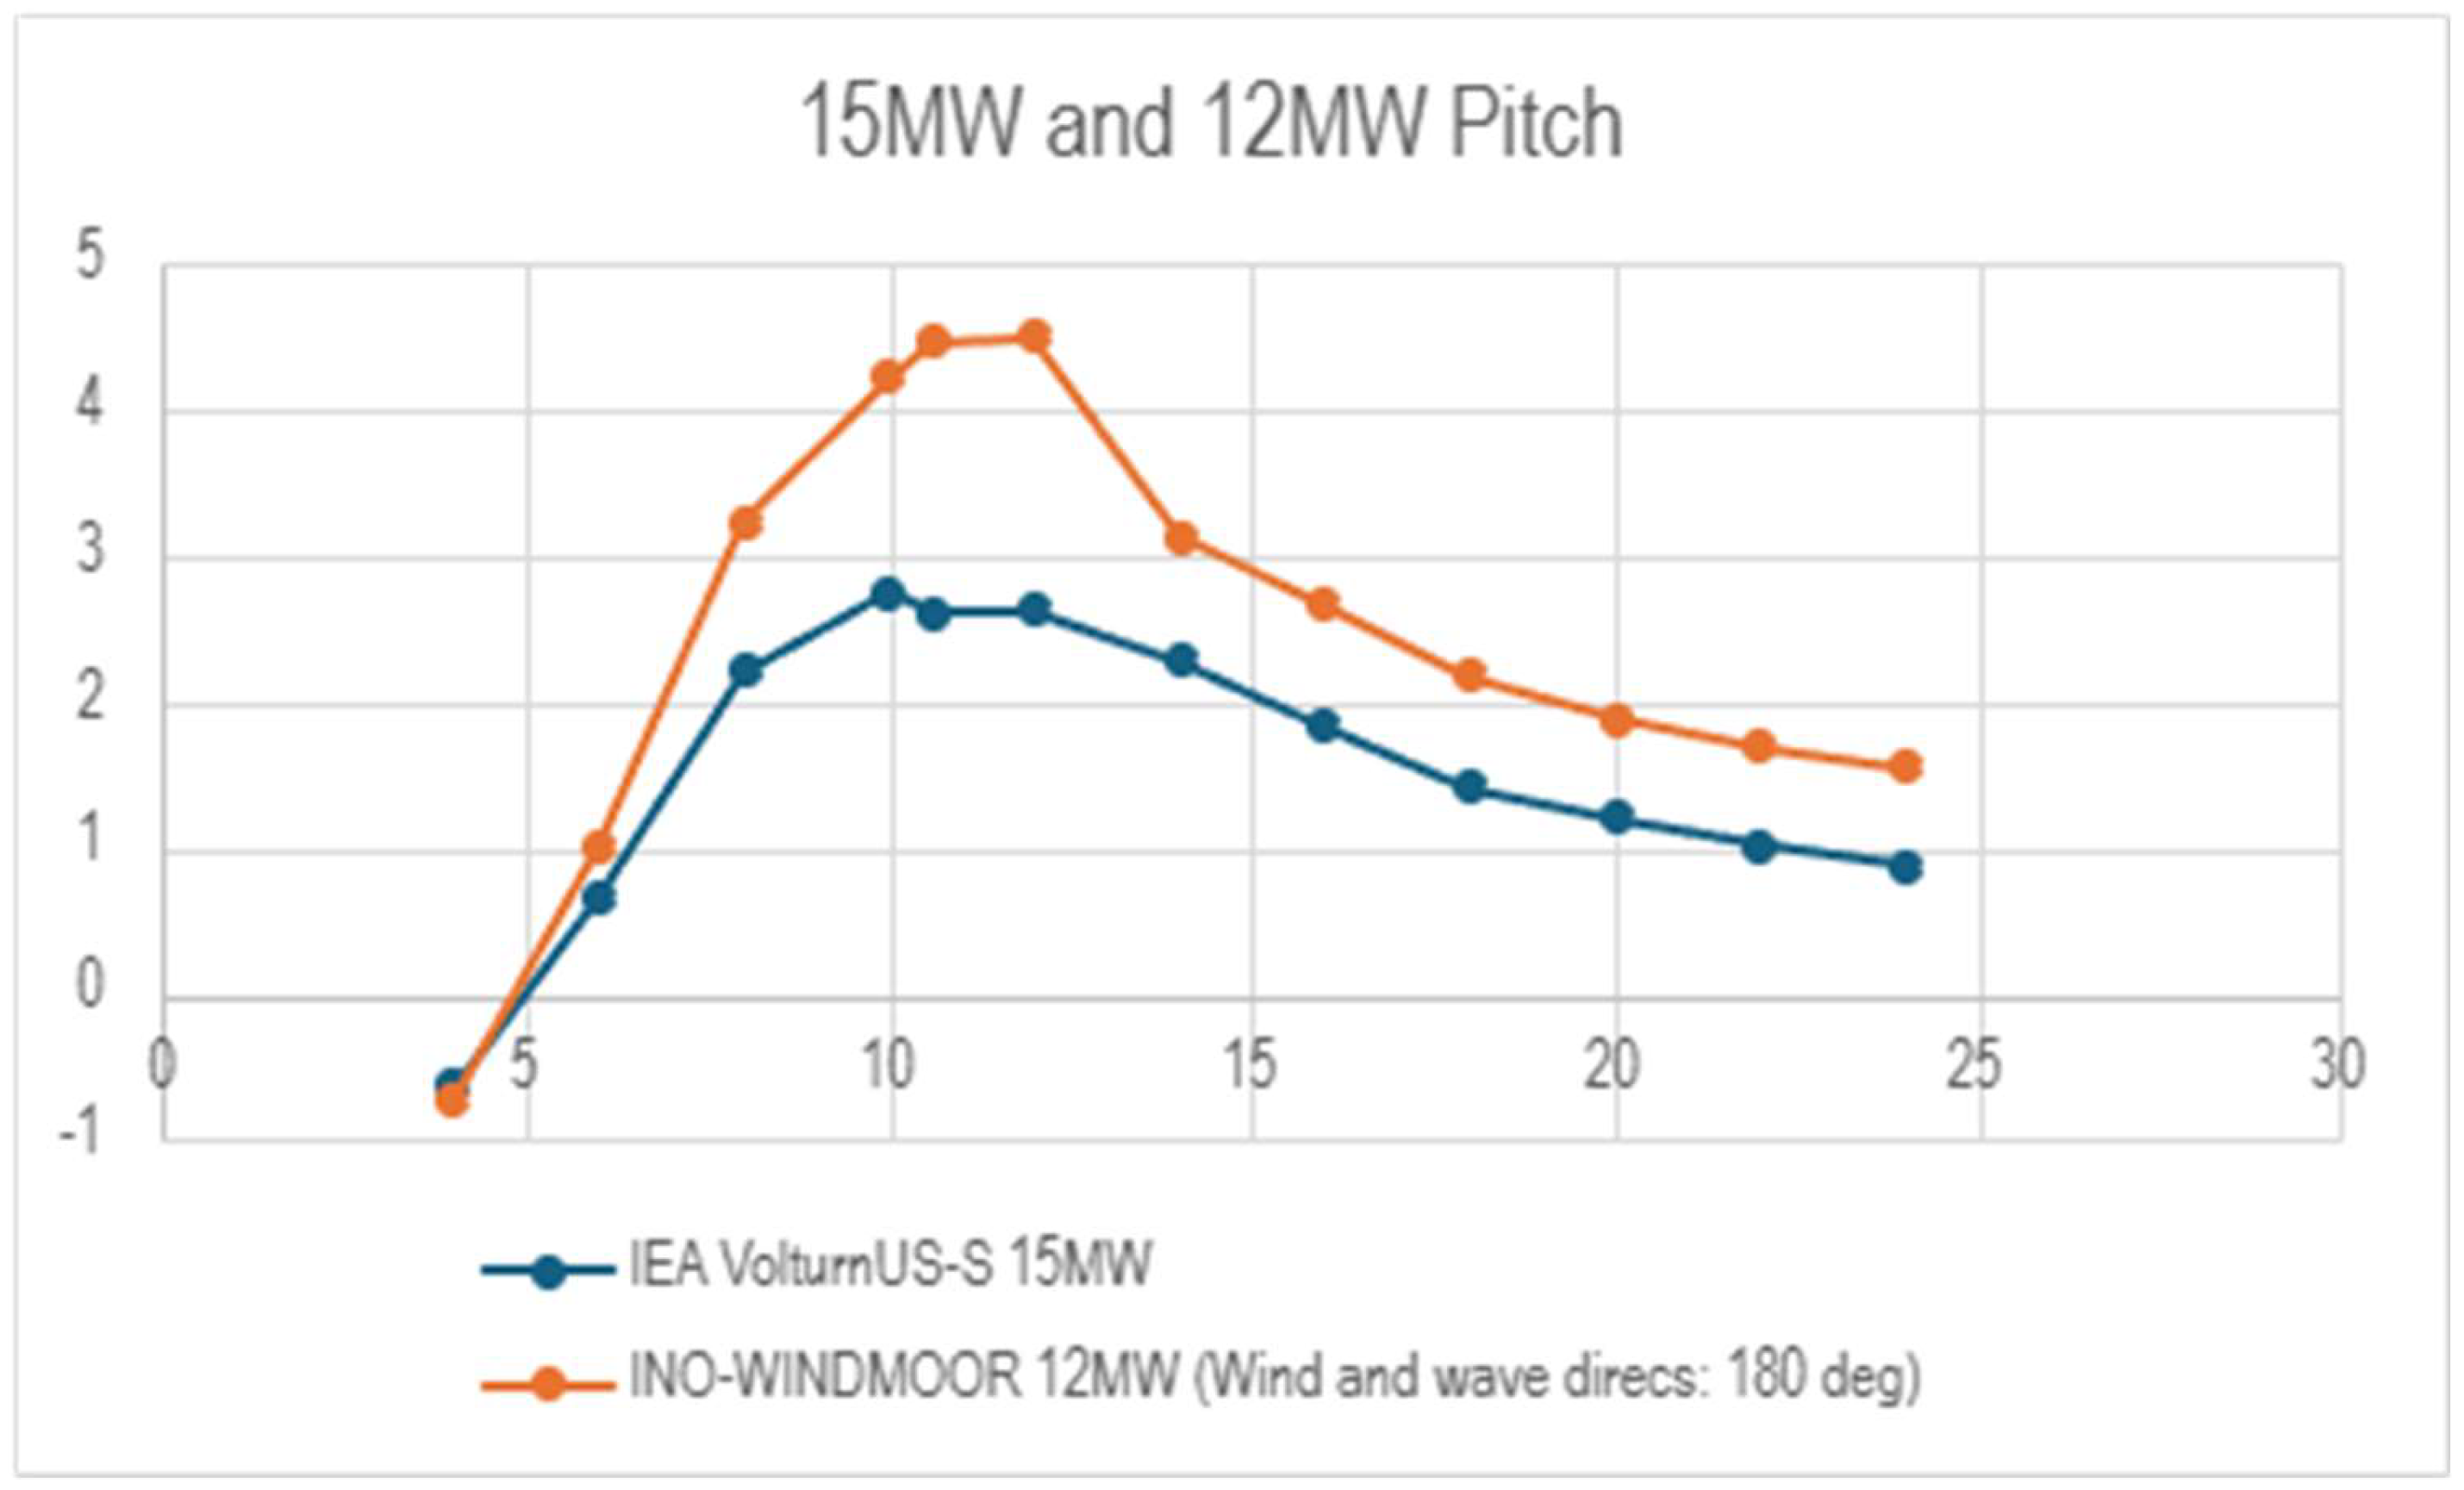
Figure 16.
10 MW Surge graph representing the data presented in Table 7 (x-axis: different wind speeds (m/s), y-axis: Surge offset (m)).
Figure 16.
10 MW Surge graph representing the data presented in Table 7 (x-axis: different wind speeds (m/s), y-axis: Surge offset (m)).
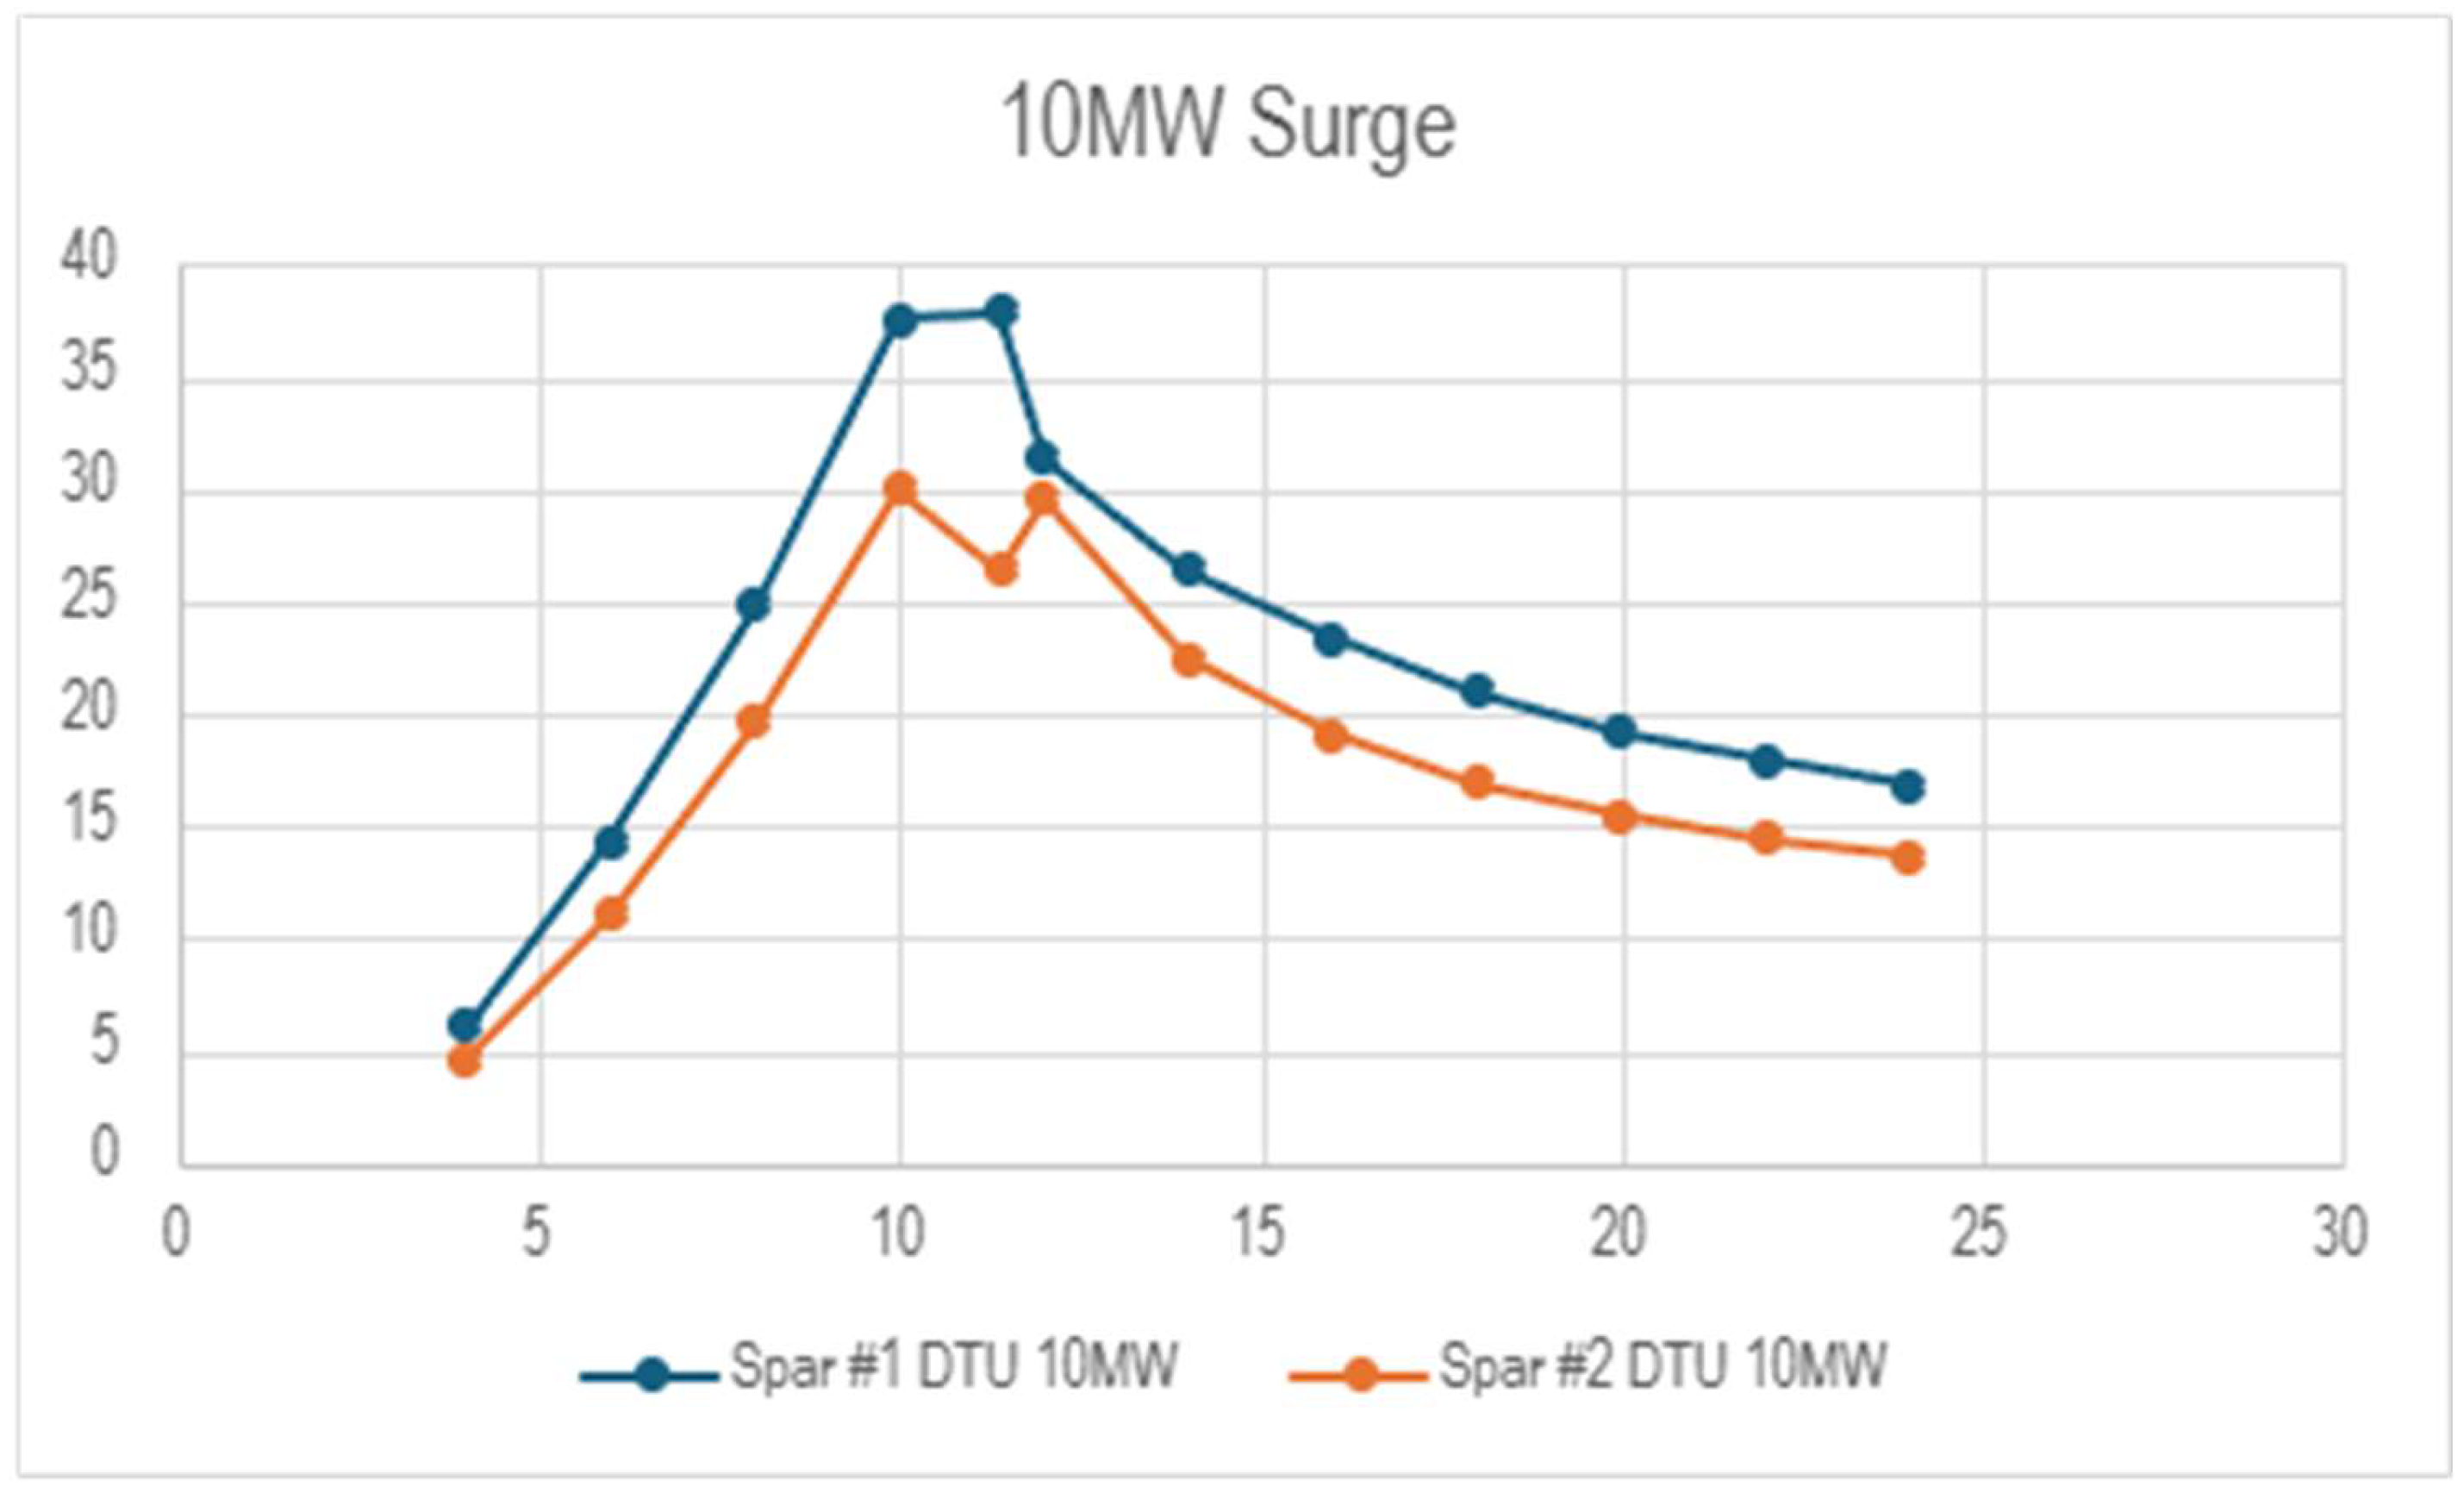
Figure 17.
10 MW Roll graph representing the data presented in Table 8 (x-axis: different wind speeds (m/s), y-axis: Roll offset (m)).
Figure 17.
10 MW Roll graph representing the data presented in Table 8 (x-axis: different wind speeds (m/s), y-axis: Roll offset (m)).
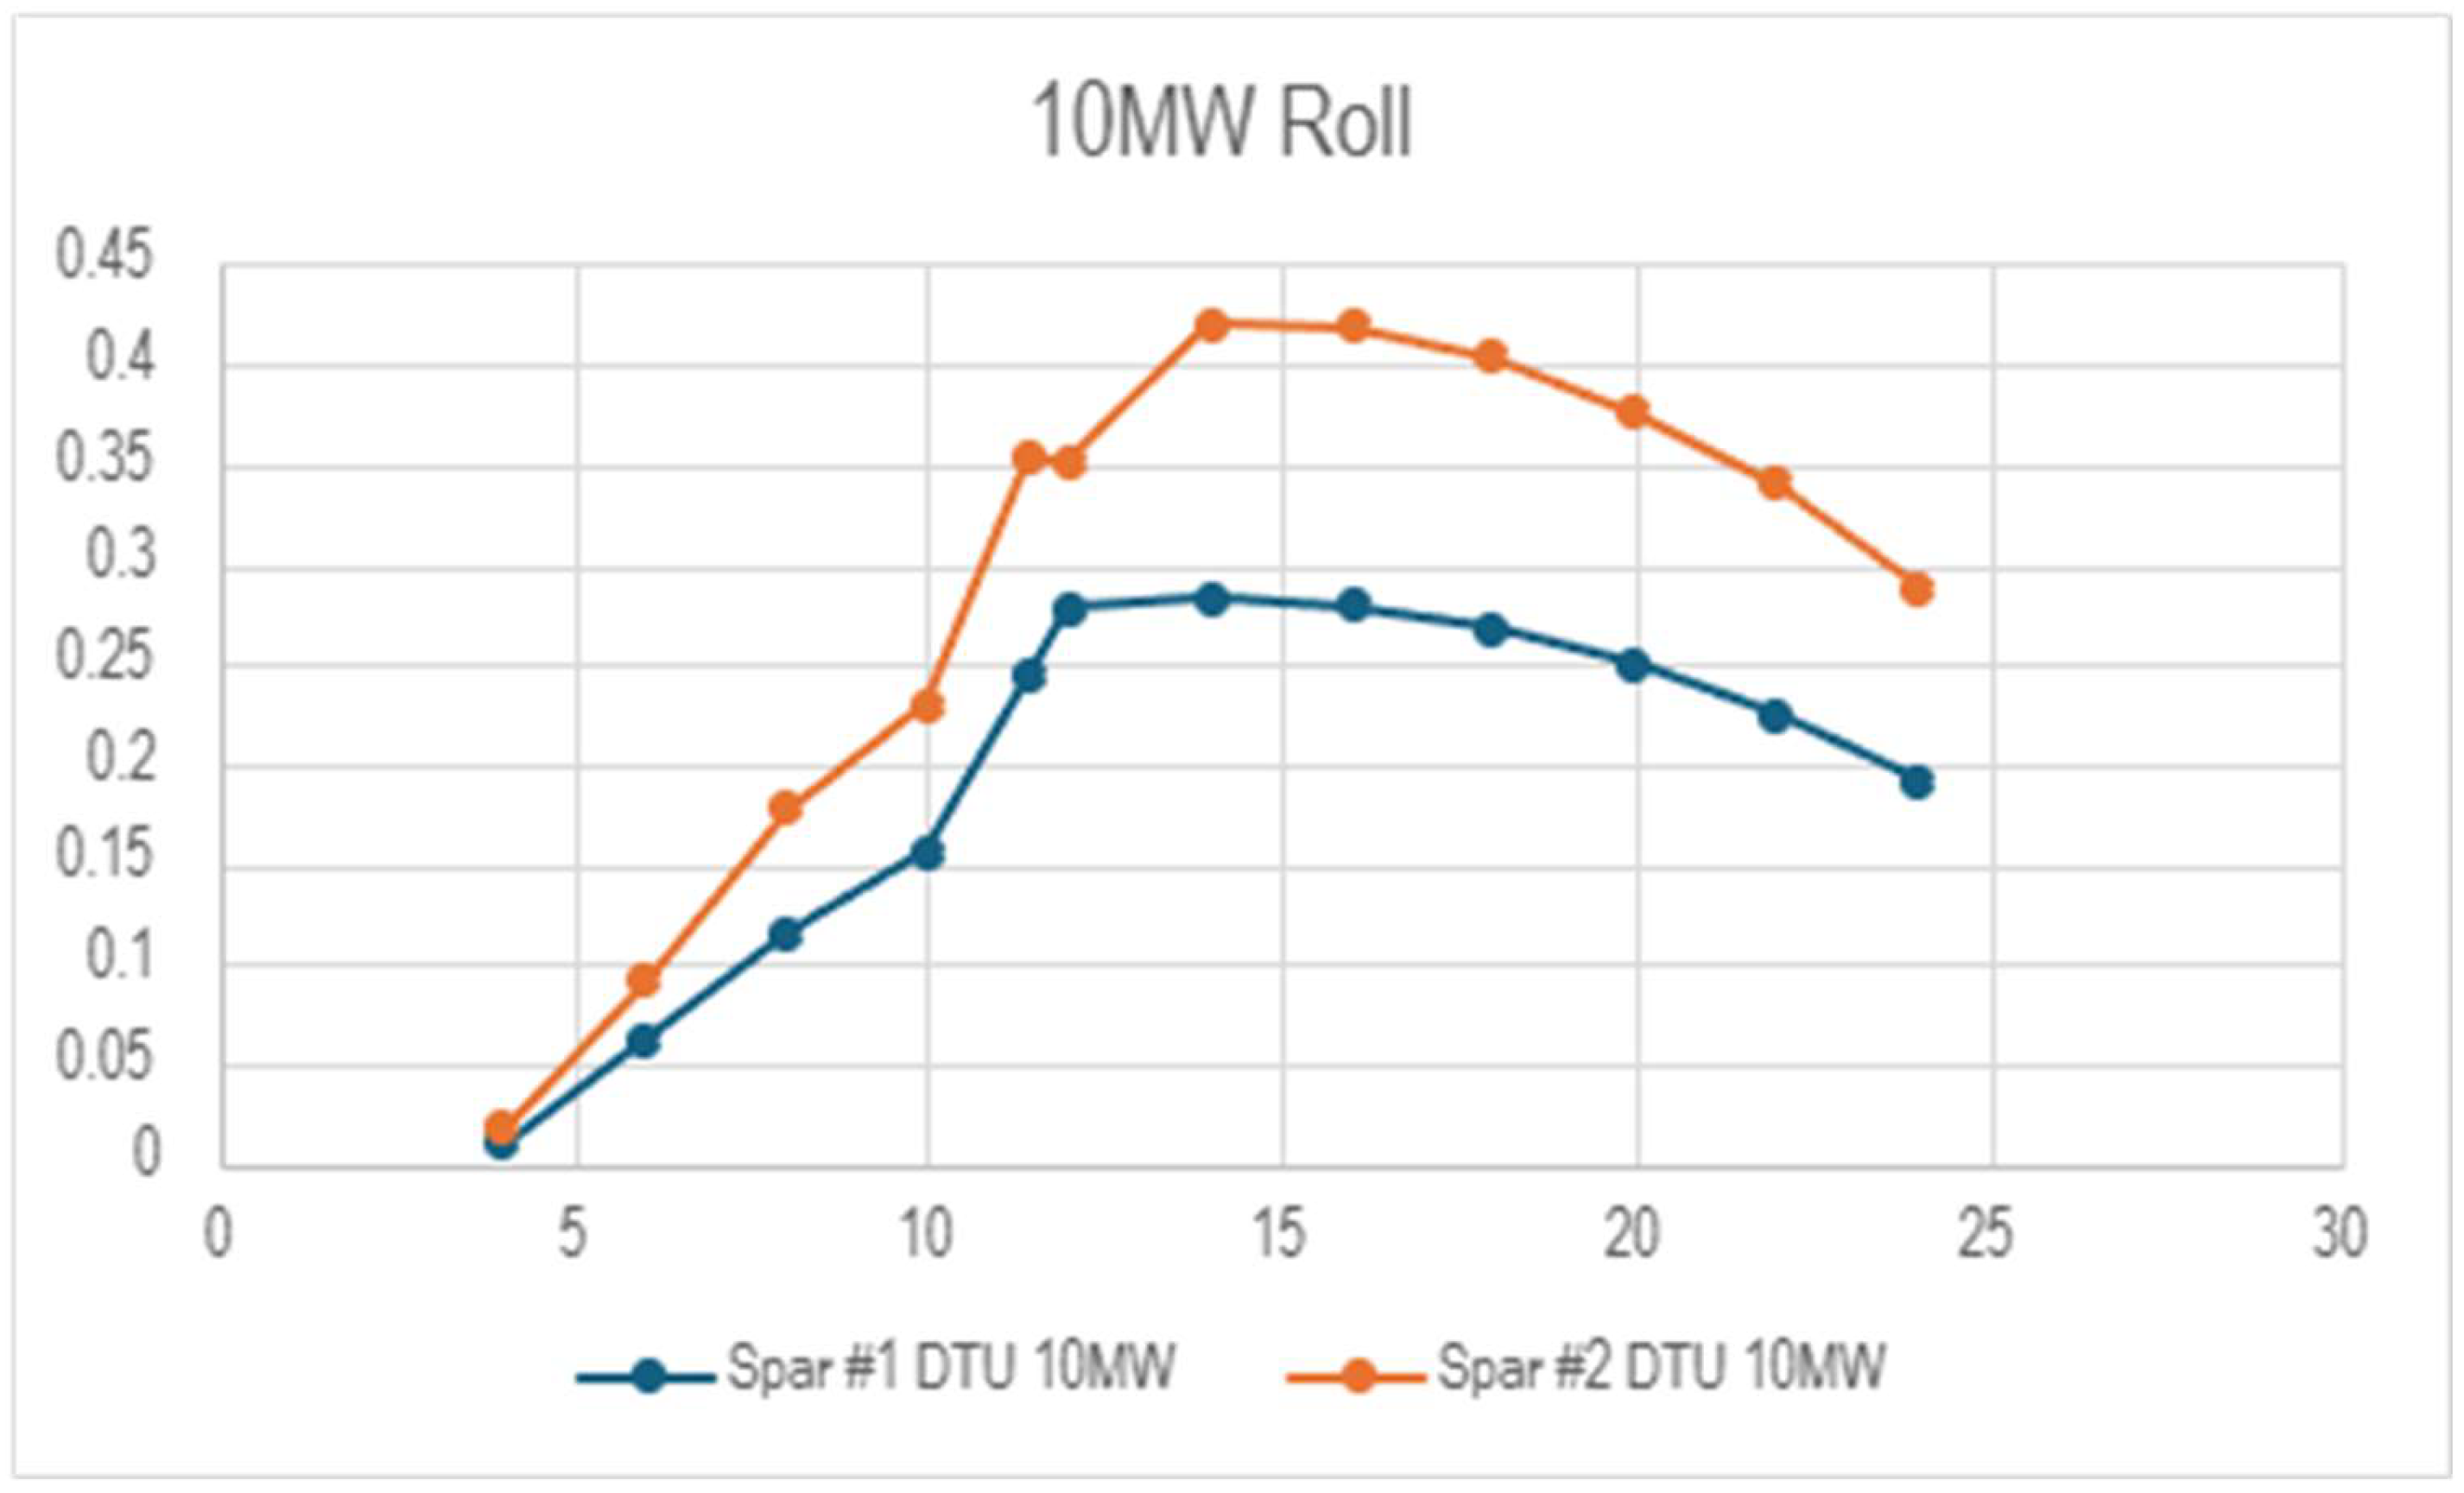
Figure 18.
10 MW Pitch graph representing the data presented in Table 8 (x-axis: different wind speeds (m/s), y-axis: Pitch offset (m)).
Figure 18.
10 MW Pitch graph representing the data presented in Table 8 (x-axis: different wind speeds (m/s), y-axis: Pitch offset (m)).
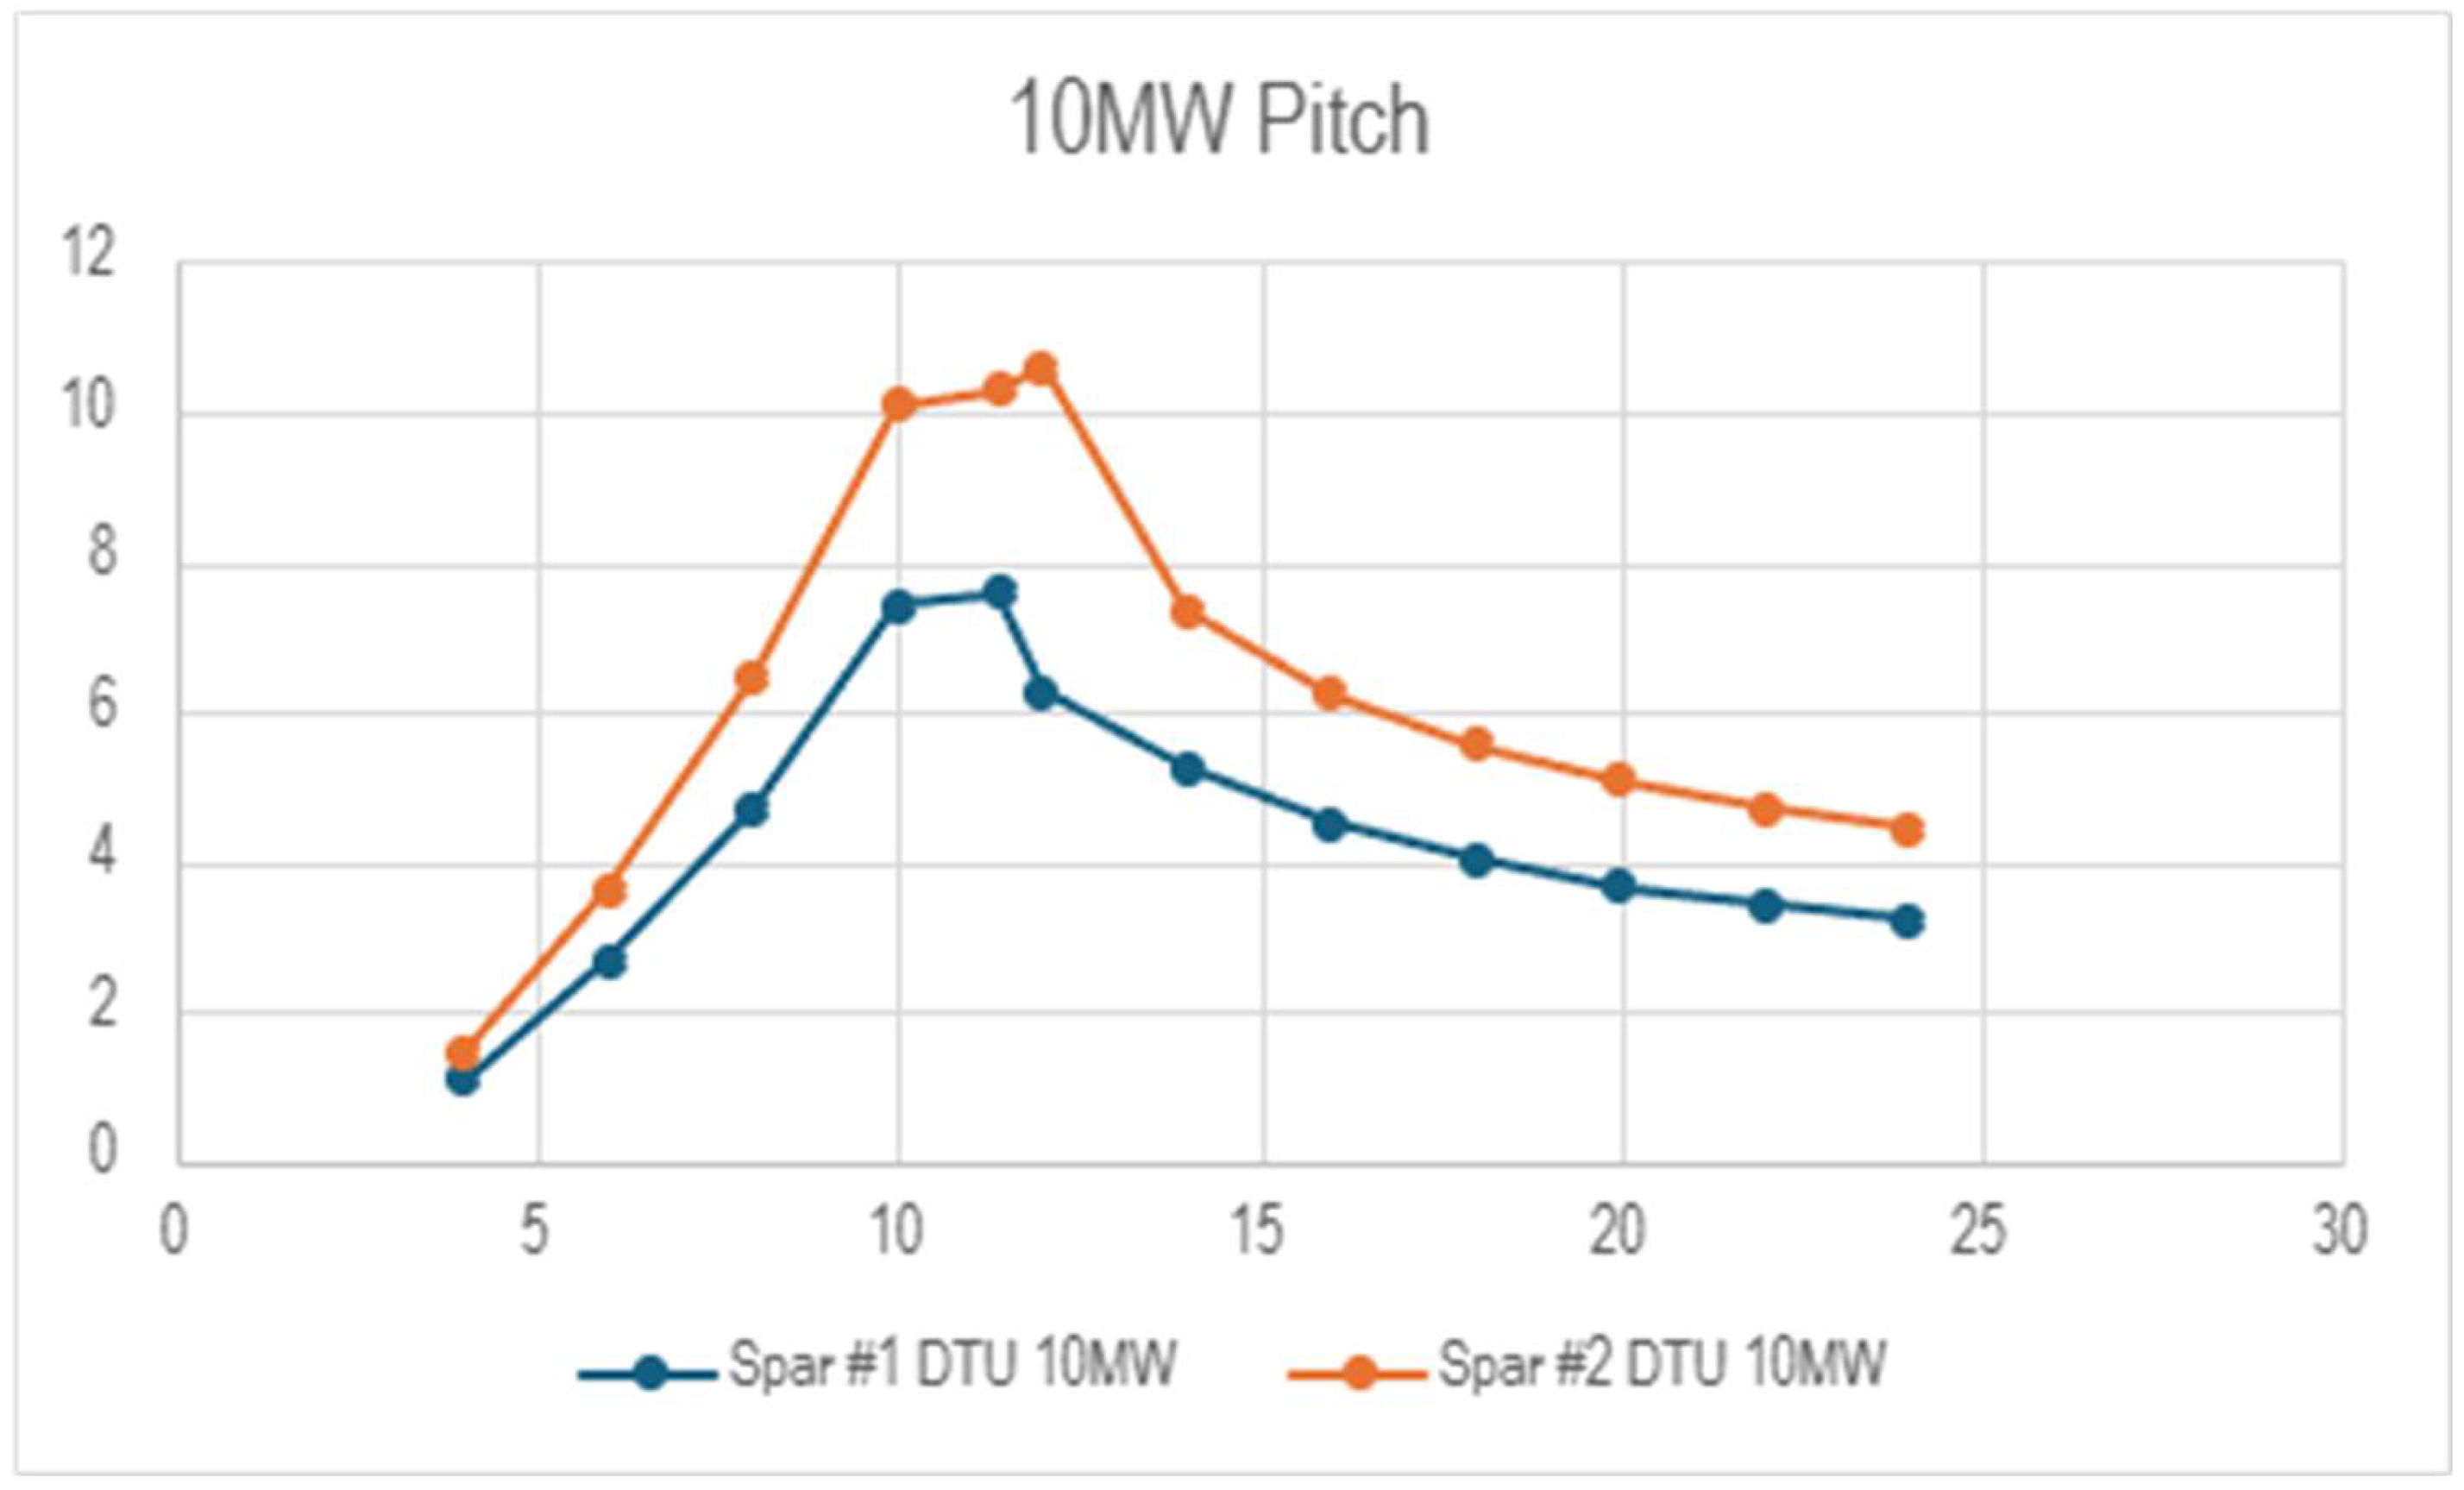

Table 1.
Surge offset for four 10 MW floating wind turbines (Hs=0,001m, Tp=20s, no current).
| Surge (m) – Hs=0.001m, Tp=20s, No current | ||||
|---|---|---|---|---|
| Wind speeds (m/s) | OO-Star 10 MW | CSC 10 MW | WindFloat 10 MW | TLPWT 10 MW |
| 4 | 4.9769748 | 1.5711603 | 1.8570507 | 0.46218206 |
| 6 | 11.8449967 | 3.5589209 | 4.0161631 | 1.02183122 |
| 8 | 19.941465 | 6.2407331 | 6.8134159 | 1.7443877 |
| 10 | 29.162013 | 9.8146428 | 10.548928 | 2.7244958 |
| 11,4 | 40.370077 | 11.7479565 | 13.367154 | 2.220202805 |
| 12 | 33.894862 | 9.6410925 | 11.4158108 | 2.797775841 |
| 14 | 22.644733 | 7.5495877 | 7.8324015 | 2.41575734 |
| 16 | 18.508847 | 6.2701501 | 6.8532543 | 1.937335402 |
| 18 | 15.715546 | 5.597804 | 6.438483 | 1.653312834 |
| 20 | 13.7118722 | 5.1229164 | 5.773129 | 1.467435292 |
| 22 | 12.2214989 | 4.7424055 | 5.4126289 | 1.325892473 |
| 24 | 11.1467641 | 4.4414538 | 5.0632492 | 1.186015891 |
Table 2.
Roll offset for four 10 MW floating wind turbines (Hs=0,001m, Tp=20s, no current).
| Roll (°) - Hs=0.001m, Tp=20s, No current | ||||
|---|---|---|---|---|
| Wind speeds (m/s) | OO-Star 10 MW | CSC 10 MW | WindFloat 10 MW | TLPWT 10 MW |
| 4 | 0.021196109 | 0.012586148 | 0.009501893 | -0.000014721580608 |
| 6 | 0.090533626 | 0.086641684 | 0.075987935 | -0.00000424099874 |
| 8 | 0.203026412 | 0.17955046 | 0.16041037 | -0.000072903915 |
| 10 | 0.29546251 | 0.26440143 | 0.23532584 | -0.00064384837 |
| 11,4 | 0.36856523 | 0.34193188 | 0.30039516 | 0.0016448749575 |
| 12 | 0.36976521 | 0.38156656 | 0.33008676 | 0.00175761643986 |
| 14 | 0.38924902 | 0.39964313 | 0.37065293 | -0.0012924914032 |
| 16 | 0.38267845 | 0.4039469 | 0.37340145 | -0.0015577809242 |
| 18 | 0.36671632 | 0.40334986 | 0.36903562 | -0.0016854162823 |
| 20 | 0.34632571 | 0.39955874 | 0.36356557 | -0.0018066855772 |
| 22 | 0.32359103 | 0.39325279 | 0.35156244 | -0.00192823478212 |
| 24 | 0.29778638 | 0.38253466 | 0.33492764 | -0.0020314286011 |
Table 3.
Pitch offset for four 10 MW floating wind turbines (Hs=0,001m, Tp=20s, no current).
| Pitch (°) - Hs=0.001m, Tp=20s, No current | ||||
|---|---|---|---|---|
| Wind speeds (m/s) | OO-Star 10 MW | CSC 10 MW | WindFloat 10 MW | TLPWT 10 MW |
| 4 | 0.67548305 | 0.72509617 | 6.0928229 | 0.00078066 |
| 6 | 1.7481751 | 1.9576922 | 7.3798083 | 0.001928665 |
| 8 | 3.2628353 | 3.5483993 | 8.9984904 | 0.003392921 |
| 10 | 5.3801791 | 5.6086633 | 11.057268 | 0.005418572 |
| 11,4 | 5.9357121 | 6.7623588 | 12.404409 | 0.005398305 |
| 12 | 4.5190515 | 5.6938586 | 11.5299299 | 0.005354787 |
| 14 | 3.5857863 | 4.2698229 | 9.8150873 | 0.003985467 |
| 16 | 3.1088003 | 3.6212972 | 9.1584622 | 0.003325698 |
| 18 | 2.7952024 | 3.2123087 | 8.7218381 | 0.002915725 |
| 20 | 2.5692443 | 2.9274001 | 8.3823518 | 0.002627699 |
| 22 | 2.4008846 | 2.7218655 | 8.1495079 | 0.002408272 |
| 24 | 2.2684396 | 2.574747 | 7.9690933 | 0.002237857 |
Table 4.
Surge offset for 15 MW and 12 MW floating wind turbines (Hs=0,001m, Tp=20s, no current).
| Surge (m) - Hs=0.001m, Tp=20s, No current | ||
|---|---|---|
| Wind speeds (m/s) | UMaine VolturnUS-S 15 MW | INO-WINDMOOR 12 MW (Wind and wave directions: 180°) |
| 4 | 4.2283157 | -3.3250485 |
| 6 | 9.5842102 | -6.0535959 |
| 8 | 14.687909 | -9.0343912 |
| 10 | 16.34325 | -10.1549682 |
| 10,6 | 15.957914 | -10.335691 |
| 12 | 16.035105 | -10.3091443 |
| 14 | 15.027325 | -9.1472944 |
| 16 | 13.466089 | -8.4195947 |
| 18 | 12.257901 | -7.9835125 |
| 20 | 11.3005219 | -7.7267096 |
| 22 | 10.5738875 | -7.6005481 |
| 24 | 9.9958327 | -7.5361433 |
Table 5.
Roll offset for 15 MW and 12 MW floating wind turbines (Hs=0,001m, Tp=20s, no current).
| Roll (°) – Hs=0.001m, Tp=20s, No current | ||
|---|---|---|
| Wind speeds (m/s) | UMaine VolturnUS-S 15 MW | INO-WINDMOOR 12 MW (Wind and wave directions: 180°) |
| 4 | 0.024738216 | -0.079730354 |
| 6 | 0.106482107 | -0.16951409 |
| 8 | 0.222529991 | -0.29386765 |
| 10 | 0.349024831 | -0.46293545 |
| 10,6 | 0.334377681 | -0.52665062 |
| 12 | 0.39369416 | -0.57149777 |
| 14 | 0.40640224 | -0.57558037 |
| 16 | 0.419718715 | -0.57208878 |
| 18 | 0.38150479 | -0.55544239 |
| 20 | 0.37371751 | -0.52424408 |
| 22 | 0.35727372 | -0.47040723 |
| 24 | 0.33781389 | -0.37925695 |
Table 6.
Pitch offset for 15 MW and 12 MW floating wind turbines (Hs=0,001m, Tp=20s, no current).
| Pitch (°) – Hs=0.001m, Tp=20s, No current | ||
|---|---|---|
| Wind speeds (m/s) | UMaine VolturnUS-S 15 MW | INO-WINDMOOR 12 MW (Wind and wave directions: 180°) |
| 4 | -0.6392493 | 0.72673546 |
| 6 | 0.64665182 | -0.9931595 |
| 8 | 2.2079926 | -3.2339473 |
| 10 | 2.7428275 | -4.2336455 |
| 10,6 | 2.6074107 | -4.4647282 |
| 12 | 2.6377763 | -4.4955361 |
| 14 | 2.2840643 | -3.12880719 |
| 16 | 1.833806158 | -2.6687901 |
| 18 | 1.41787403 | -2.1777331 |
| 20 | 1.203695 | -1.8891515 |
| 22 | 1.01479135 | -1.6857855 |
| 24 | 0.86969624 | -1.5455255 |
Table 7.
Surge offset for two 10 MW Spar floating wind turbines (Hs=0,001m, Tp=20s, no current).
| Surge (m) – Hs=0.001m, Tp=20s, No current | ||
|---|---|---|
| Wind speeds (m/s) | DTU Spar 1 (10 MW) | DTU Spar 2 (10 MW) |
| 4 | 6.1057331 | 4.6477189 |
| 6 | 14.320404 | 11.083265 |
| 8 | 24.83606 | 19.629442 |
| 10 | 37.565531 | 29.982764 |
| 11,4 | 37.911017 | 26.397656 |
| 12 | 31.3961 | 29.590691 |
| 14 | 26.412795 | 22.484385 |
| 16 | 23.291997 | 19.040911 |
| 18 | 20.952164 | 16.888591 |
| 20 | 19.204944 | 15.45742 |
| 22 | 17.876814 | 14.398339 |
| 24 | 16.822756 | 13.591669 |
Table 8.
Roll offset for two 10 MW Spar floating wind turbines (Hs=0,001m, Tp=20s, no current).
| Roll (°) – Hs=0.001m, Tp=20s, No current | ||
|---|---|---|
| Wind speeds (m/s) | DTU Spar 1 (10 MW) | DTU Spar 2 (10 MW) |
| 4 | 0.010289095 | 0.017350745 |
| 6 | 0.061706686 | 0.091092209 |
| 8 | 0.1152114 | 0.17795539 |
| 10 | 0.15603373 | 0.22974965 |
| 11,4 | 0.24329654 | 0.352566277 |
| 12 | 0.27734861 | 0.35101414 |
| 14 | 0.28256566 | 0.42017851 |
| 16 | 0.27873283 | 0.4182093 |
| 18 | 0.26759476 | 0.40352433 |
| 20 | 0.24943737 | 0.37523083 |
| 22 | 0.22411391 | 0.34027319 |
| 24 | 0.19116734 | 0.2877506 |
Table 9.
Pitch offset for two 10 MW Spar floating wind turbines (Hs=0,001m, Tp=20s, no current).
| Pitch (°) – Hs=0.001m, Tp=20s, No current | ||
|---|---|---|
| Wind speeds (m/s) | DTU Spar 1 (10 MW) | DTU Spar 2 (10 MW) |
| 4 | 1.0800594 | 1.4607542 |
| 6 | 2.6590329 | 3.6323676 |
| 8 | 4.7144675 | 6.4514713 |
| 10 | 7.4134843 | 10.096216 |
| 11,4 | 7.5776964 | 10.2703087 |
| 12 | 6.2698139 | 10.5926203 |
| 14 | 5.2402478 | 7.3503991 |
| 16 | 4.5053967 | 6.2380533 |
| 18 | 4.0210779 | 5.5411869 |
| 20 | 3.660919 | 5.0702994 |
| 22 | 3.4151146 | 4.6954448 |
| 24 | 3.2138405 | 4.4253116 |
Table 10.
OO-Star All degrees of freedom at rated wind speed (11.4 m/s).
| OO-Star Surge at rated wind speed (11.4 m/s) | |
| No waves and current sea state | 40.4 m |
| (Hs=2.5m, Tp=10s, no current) sea state | 39.9 m |
| (Hs=2.5m, Tp=10s, with current) sea state | 80.2 m |
| (Hs=4m, Tp=12s, no current) sea state | 39.3 m |
| (Hs=4m, Tp=12s, with current) sea state | 80.3 m |
| OO-Star Sway at rated wind speed (11.4 m/s) | |
| (Hs=2.5m, Tp=10s, no current) sea state | 0.2436 m |
| (Hs=2.5m, Tp=10s, with current) sea state | 0.09236 m |
| (Hs=4m, Tp=12s, no current) sea state | 0.2403 m |
| (Hs=4m, Tp=12s, with current) sea state | 0.09231 m |
| OO-Star Heave at rated wind speed (11.4 m/s) | |
| (Hs=2.5m, Tp=10s, no current) sea state | 0.5043 m |
| (Hs=2.5m, Tp=10s, with current) sea state | 0.8861 m |
| (Hs=4m, Tp=12s, no current) sea state | 0.5348 m |
| (Hs=4m, Tp=12s, with current) sea state | 0.8790 m |
| OO-Star Roll at rated wind speed (11.4 m/s) | |
| No waves and current sea state | 0.3685° |
| (Hs=2.5m, Tp=10s, no current) sea state | 0.3667° |
| (Hs=2.5m, Tp=10s, with current) sea state | 0.3123° |
| (Hs=4m, Tp=12s, no current) sea state | 0.3678° |
| (Hs=4m, Tp=12s, with current) sea state | 0.3133° |
| OO-Star Pitch at rated wind speed (11.4 m/s) | |
| No waves and current sea state | 5.9357° |
| (Hs=2.5m, Tp=10s, no current) sea state | 6.0325° |
| (Hs=2.5m, Tp=10s, with current) sea state | 1.5095° |
| (Hs=4m, Tp=12s, no current) sea state | 6.0114° |
| (Hs=4m, Tp=12s, with current) sea state | 1.5447° |
| OO-Star Yaw at rated wind speed (11.4 m/s) | |
| (Hs=2.5m, Tp=10s, no current) sea state | 0.21706° |
| (Hs=2.5m, Tp=10s, with current) sea state | 0.11361° |
| (Hs=4m, Tp=12s, no current) sea state | 0.21052° |
| (Hs=4m, Tp=12s, with current) sea state | 0.1138009° |
Table 11.
CSC All degrees of freedom at rated wind speed (11.4 m/s).
| CSC Surge at rated wind speed (11.4 m/s) | |
| No waves and current sea state | 11.74 m |
| (Hs=2.5m, Tp=10s, no current) sea state | 11.70 m |
| (Hs=2.5m, Tp=10s, with current) sea state | 69.3 m |
| (Hs=4m, Tp=12s, no current) sea state | 11.94 m |
| (Hs=4m, Tp=12s, with current) sea state | 69.3 m |
| CSC Sway at rated wind speed (11.4 m/s) | |
| (Hs=2.5m, Tp=10s, no current) sea state | 0.09276 m |
| (Hs=2.5m, Tp=10s, with current) sea state | 0.01904 m |
| (Hs=4m, Tp=12s, no current) sea state | 0.097003 m |
| (Hs=4m, Tp=12s, with current) sea state | 0.01862 m |
| CSC Heave at rated wind speed (11.4 m/s) | |
| (Hs=2.5m, Tp=10s, no current) sea state | 0.1824 m |
| (Hs=2.5m, Tp=10s, with current) sea state | 2.39906 m |
| (Hs=4m, Tp=12s, no current) sea state | 0.1762 m |
| (Hs=4m, Tp=12s, with current) sea state | 2.4109 m |
| CSC Roll at rated wind speed (11.4 m/s) | |
| No waves and current sea state | 0.3419° |
| (Hs=2.5m, Tp=10s, no current) sea state | 0.3495° |
| (Hs=2.5m, Tp=10s, with current) sea state | 0.23308° |
| (Hs=4m, Tp=12s, no current) sea state | 0.3498° |
| (Hs=4m, Tp=12s, with current) sea state | 0.2334° |
| CSC Pitch at rated wind speed (11.4 m/s) | |
| No waves and current sea state | 6.7623° |
| (Hs=2.5m, Tp=10s, no current) sea state | 6.6782° |
| (Hs=2.5m, Tp=10s, with current) sea state | 1.6148° |
| (Hs=4m, Tp=12s, no current) sea state | 6.7632° |
| (Hs=4m, Tp=12s, with current) sea state | 1.5853° |
| CSC Yaw at rated wind speed (11.4 m/s) | |
| (Hs=2.5m, Tp=10s, no current) sea state | 0.09469° |
| (Hs=2.5m, Tp=10s, with current) sea state | 0.077022° |
| (Hs=4m, Tp=12s, no current) sea state | 0.0900617° |
| (Hs=4m, Tp=12s, with current) sea state | 0.076291° |
Table 12.
WindFloat All degrees of freedom at rated wind speed (11.4 m/s).
| WindFloat Surge at rated wind speed (11.4 m/s) | |
| No waves and current sea state | 13.4 m |
| (Hs=2.5m, Tp=10s, no current) sea state | 13.3 m |
| (Hs=2.5m, Tp=10s, with current) sea state | 65.42 m |
| (Hs=4m, Tp=12s, no current) sea state | 13.2 m |
| (Hs=4m, Tp=12s, with current) sea state | 65.4 |
| WindFloat Sway at rated wind speed (11.4 m/s) | |
| (Hs=2.5m, Tp=10s, no current) sea state | 0.1422 m. |
| (Hs=2.5m, Tp=10s, with current) sea state | 0.05462 m |
| (Hs=4m, Tp=12s, no current) sea state | 0.1357 m |
| (Hs=4m, Tp=12s, with current) sea state | 0.05641 m |
| WindFloat Heave at rated wind speed (11.4 m/s) | |
| (Hs=2.5m, Tp=10s, no current) sea state | 1.3979 m |
| (Hs=2.5m, Tp=10s, with current) sea state | 2.4773 m |
| (Hs=4m, Tp=12s, no current) sea state | 1.3835 m |
| (Hs=4m, Tp=12s, with current) sea state | 2.5013 m |
| WindFloat Roll at rated wind speed (11.4 m/s) | |
| No waves and current sea state | 0.30039° |
| (Hs=2.5m, Tp=10s, no current) sea state | 0.3022° |
| (Hs=2.5m, Tp=10s, with current) sea state | 0.1672° |
| (Hs=4m, Tp=12s, no current) sea state | 0.3022° |
| (Hs=4m, Tp=12s, with current) sea state | 0.1719° |
| WindFloat Pitch at rated wind speed (11.4 m/s) | |
| No waves and current sea state | 12.4044° |
| (Hs=2.5m, Tp=10s, no current) sea state | 12.2746° |
| (Hs=2.5m, Tp=10s, with current) sea state | 9.6603° |
| (Hs=4m, Tp=12s, no current) sea state | 12.1906° |
| (Hs=4m, Tp=12s, with current) sea state | 9.4993° |
| WindFloat Yaw at rated wind speed (11.4 m/s) | |
| (Hs=2.5m, Tp=10s, no current) sea state | 0.04753° |
| (Hs=2.5m, Tp=10s, with current) sea state | 0.07578° |
| (Hs=4m, Tp=12s, no current) sea state | 0.02519° |
| (Hs=4m, Tp=12s, with current) sea state | 0.0792704° |
Table 13.
TLPWT All degrees of freedom at rated wind speed (11.4 m/s).
| TLPWT Surge at rated wind speed (11.4 m/s) | |
| No waves and current sea state | 2.2 m |
| (Hs=2.5m, Tp=10s, no current) sea state | 13.34 m |
| (Hs=2.5m, Tp=10s, with current) sea state | 10.6 m |
| (Hs=4m, Tp=12s, no current) sea state | 3.4 m |
| (Hs=4m, Tp=12s, with current) sea state | 10.6 m |
| TLPWT Sway at rated wind speed (11.4 m/s) | |
| (Hs=2.5m, Tp=10s, no current) sea state | 0.006532 m |
| (Hs=2.5m, Tp=10s, with current) sea state | 0.01369 m |
| (Hs=4m, Tp=12s, no current) sea state | 0.002973 m |
| (Hs=4m, Tp=12s, with current) sea state | 0.01387 m |
| TLPWT Heave at rated wind speed (11.4 m/s) | |
| (Hs=2.5m, Tp=10s, no current) sea state | 0.1919 m |
| (Hs=2.5m, Tp=10s, with current) sea state | 0.3409 m |
| (Hs=4m, Tp=12s, no current) sea state | 0.1934 m |
| (Hs=4m, Tp=12s, with current) sea state | 0.34008 m |
| TLPWT Roll at rated wind speed (11.4 m/s) | |
| No waves and current sea state | 0.001644° |
| (Hs=2.5m, Tp=10s, no current) sea state | 0.001608° |
| (Hs=2.5m, Tp=10s, with current) sea state | 0.0032405° |
| (Hs=4m, Tp=12s, no current) sea state | 0.00155° |
| (Hs=4m, Tp=12s, with current) sea state | 0.003265° |
| TLPWT Pitch at rated wind speed (11.4 m/s) | |
| No waves and current sea state | 0.005398° |
| (Hs=2.5m, Tp=10s, no current) sea state | 0.005702° |
| (Hs=2.5m, Tp=10s, with current) sea state | 0.006964° |
| (Hs=4m, Tp=12s, no current) sea state | 0.0057407° |
| (Hs=4m, Tp=12s, with current) sea state | 0.006963° |
| TLPWT Yaw at rated wind speed (11.4 m/s) | |
| (Hs=2.5m, Tp=10s, no current) sea state | 0.087983° |
| (Hs=2.5m, Tp=10s, with current) sea state | 0.056793° |
| (Hs=4m, Tp=12s, no current) sea state | 0.08851° |
| (Hs=4m, Tp=12s, with current) sea state | 0.057085° |
Table 14.
UMaine VolturnUS-S 15 MW All degrees of freedom at rated wind speed (10.6 m/s).
| UMaine VolturnUS-S Surge at rated wind speed (10.6 m/s) | |
| No waves and current sea state | 15.95 m |
| (Hs=2.5m, Tp=10s, no current) sea state | 16.03 m |
| (Hs=2.5m, Tp=10s, with current) sea state | 33.61 m |
| (Hs=4m, Tp=12s, no current) sea state | 16.102 m |
| (Hs=4m, Tp=12s, with current) sea state | 33.62 m |
| UMaine VolturnUS-S Sway at rated wind speed (10.6 m/s) | |
| (Hs=2.5m, Tp=10s, no current) sea state | 0.09768 m |
| (Hs=2.5m, Tp=10s, with current) sea state | 0.07574 m |
| (Hs=4m, Tp=12s, no current) sea state | 0.1036 m |
| (Hs=4m, Tp=12s, with current) sea state | 0.07732 m |
| UMaine VolturnUS-S Heave at rated wind speed (10.6 m/s) | |
| (Hs=2.5m, Tp=10s, no current) sea state | 0.0787 m |
| (Hs=2.5m, Tp=10s, with current) sea state | 0.5035 m |
| (Hs=4m, Tp=12s, no current) sea state | 0.0822 m |
| (Hs=4m, Tp=12s, with current) sea state | 0.5074 m |
| UMaine VolturnUS-S Roll at rated wind speed (10.6 m/s) | |
| No waves and current sea state | 0.3343° |
| (Hs=2.5m, Tp=10s, no current) sea state | 0.3481° |
| (Hs=2.5m, Tp=10s, with current) sea state | 0.3564° |
| (Hs=4m, Tp=12s, no current) sea state | 0.3512° |
| (Hs=4m, Tp=12s, with current) sea state | 0.3561° |
| UMaine VolturnUS-S Pitch at rated wind speed (10.6 m/s) | |
| No waves and current sea state | 2.6074° |
| (Hs=2.5m, Tp=10s, no current) sea state | 2.60788° |
| (Hs=2.5m, Tp=10s, with current) sea state | 1.763705° |
| (Hs=4m, Tp=12s, no current) sea state | 2.59653° |
| (Hs=4m, Tp=12s, with current) sea state | 1.743501° |
| UMaine VolturnUS-S Yaw at rated wind speed (10.6 m/s) | |
| (Hs=2.5m, Tp=10s, no current) sea state | 0.43856° |
| (Hs=2.5m, Tp=10s, with current) sea state | 0.194664° |
| (Hs=4m, Tp=12s, no current) sea state | 0.43581° |
| (Hs=4m, Tp=12s, with current) sea state | 0.193106° |
Table 15.
INO-WINDMOOR All degrees of freedom at rated wind speed (10.6 m/s)
| INO-WINDMOOR Surge at rated wind speed (10.6 m/s) | |
| No waves and current sea state | 10.33 m |
| (Hs=2.5m, Tp=10s, no current) sea state | 10.51 m |
| (Hs=2.5m, Tp=10s, with current) sea state | 44.80 m |
| (Hs=4m, Tp=12s, no current) sea state | 10.55 m |
| (Hs=4m, Tp=12s, with current) sea state | 44.84 m |
| INO-WINDMOOR Sway at rated wind speed (10.6 m/s) | |
| (Hs=2.5m, Tp=10s, no current) sea state | 0.03549 m |
| (Hs=2.5m, Tp=10s, with current) sea state | 0.06047 m |
| (Hs=4m, Tp=12s, no current) sea state | 0.03101 m |
| (Hs=4m, Tp=12s, with current) sea state | 0.05433 m |
| INO-WINDMOOR Heave at rated wind speed (10.6 m/s) | |
| (Hs=2.5m, Tp=10s, no current) sea state | 0.07974 m |
| (Hs=2.5m, Tp=10s, with current) sea state | 1.06905 m |
| (Hs=4m, Tp=12s, no current) sea state | 0.07713 m |
| (Hs=4m, Tp=12s, with current) sea state | 1.07597 m |
| INO-WINDMOOR Roll at rated wind speed (10.6 m/s) | |
| No waves and current sea state | 0.5266° |
| (Hs=2.5m, Tp=10s, no current) sea state | 0.5262° |
| (Hs=2.5m, Tp=10s, with current) sea state | 0.5053° |
| (Hs=4m, Tp=12s, no current) sea state | 0.5265° |
| (Hs=4m, Tp=12s, with current) sea state | 0.5056° |
| INO-WINDMOOR Pitch at rated wind speed (10.6 m/s) | |
| No waves and current sea state | 4.46472° |
| (Hs=2.5m, Tp=10s, no current) sea state | 4.45183° |
| (Hs=2.5m, Tp=10s, with current) sea state | 2.362333° |
| (Hs=4m, Tp=12s, no current) sea state | 4.44786° |
| (Hs=4m, Tp=12s, with current) sea state | 2.37938° |
| INO-WINDMOOR Yaw at rated wind speed (10.6 m/s) | |
| (Hs=2.5m, Tp=10s, no current) sea state | 0.58993° |
| (Hs=2.5m, Tp=10s, with current) sea state | 0.05136° |
| (Hs=4m, Tp=12s, no current) sea state | 0.58756° |
| (Hs=4m, Tp=12s, with current) sea state | 0.0542622° |
Table 16.
DTU Spar 1 All degrees of freedom at rated wind speed (11.4 m/s)
| DTU Spar 1 Surge at rated wind speed (11.4 m/s) | |
| No waves and current sea state | 37.91 m |
| (Hs=2.5m, Tp=10s, no current) sea state | 35.015 m |
| (Hs=2.5m, Tp=10s, with current) sea state | 95.45 m |
| (Hs=4m, Tp=12s, no current) sea state | 35.52 m |
| (Hs=4m, Tp=12s, with current) sea state | 95.35 m |
| DTU Spar 1 Sway at rated wind speed (11.4 m/s) | |
| (Hs=2.5m, Tp=10s, no current) sea state | 0.2252 m |
| (Hs=2.5m, Tp=10s, with current) sea state | 0.2488 m |
| (Hs=4m, Tp=12s, no current) sea state | 0.2073 m |
| (Hs=4m, Tp=12s, with current) sea state | 0.25006 m |
| DTU Spar 1 Heave at rated wind speed (11.4 m/s) | |
| (Hs=2.5m, Tp=10s, no current) sea state | 1.2563 m |
| (Hs=2.5m, Tp=10s, with current) sea state | 9.88609 m |
| (Hs=4m, Tp=12s, no current) sea state | 1.2941 m |
| (Hs=4m, Tp=12s, with current) sea state | 9.8373 m |
| DTU Spar 1 Roll at rated wind speed (11.4 m/s) | |
| No waves and current sea state | 0.24329° |
| (Hs=2.5m, Tp=10s, no current) sea state | 0.21234° |
| (Hs=2.5m, Tp=10s, with current) sea state | 0.17654° |
| (Hs=4m, Tp=12s, no current) sea state | 0.21018° |
| (Hs=4m, Tp=12s, with current) sea state | 0.177552° |
| DTU Spar 1 Pitch at rated wind speed (11.4 m/s) | |
| No waves and current sea state | 7.577696° |
| (Hs=2.5m, Tp=10s, no current) sea state | 7.77025° |
| (Hs=2.5m, Tp=10s, with current) sea state | 9.35642° |
| (Hs=4m, Tp=12s, no current) sea state | 7.905556° |
| (Hs=4m, Tp=12s, with current) sea state | 9.31469° |
| DTU Spar 1 Yaw at rated wind speed (11.4 m/s) | |
| (Hs=2.5m, Tp=10s, no current) sea state | 0.20895° |
| (Hs=2.5m, Tp=10s, with current) sea state | 0.21984° |
| (Hs=4m, Tp=12s, no current) sea state | 0.18102° |
| (Hs=4m, Tp=12s, with current) sea state | 0.21848° |
Table 17.
DTU Spar 2 All degrees of freedom at rated wind speed (11.4 m/s)
| DTU Spar 2 Surge at rated wind speed (11.4 m/s) | |
| No waves and current sea state | 26.39 m |
| (Hs=2.5m, Tp=10s, no current) sea state | 35.21 m |
| (Hs=2.5m, Tp=10s, with current) sea state | 81.63 m |
| (Hs=4m, Tp=12s, no current) sea state | 34.97 m |
| (Hs=4m, Tp=12s, with current) sea state | 81.308 m |
| DTU Spar 2 Sway at rated wind speed (11.4 m/s) | |
| (Hs=2.5m, Tp=10s, no current) sea state | 0.1793 m |
| (Hs=2.5m, Tp=10s, with current) sea state | 0.24407 m |
| (Hs=4m, Tp=12s, no current) sea state | 0.2389 m |
| (Hs=4m, Tp=12s, with current) sea state | 0.2454 m |
| DTU Spar 2 Heave at rated wind speed (11.4 m/s) | |
| (Hs=2.5m, Tp=10s, no current) sea state | 1.5343 m |
| (Hs=2.5m, Tp=10s, with current) sea state | 9.8176 m |
| (Hs=4m, Tp=12s, no current) sea state | 1.5063 m |
| (Hs=4m, Tp=12s, with current) sea state | 9.7206 m |
| DTU Spar 2 Roll at rated wind speed (11.4 m/s) | |
| No waves and current sea state | 0.35256° |
| (Hs=2.5m, Tp=10s, no current) sea state | 0.26218° |
| (Hs=2.5m, Tp=10s, with current) sea state | 0.26128° |
| (Hs=4m, Tp=12s, no current) sea state | 0.30099° |
| (Hs=4m, Tp=12s, with current) sea state | 0.266285° |
| DTU Spar 2 Pitch at rated wind speed (11.4 m/s) | |
| No waves and current sea state | 10.2703° |
| (Hs=2.5m, Tp=10s, no current) sea state | 11.56718° |
| (Hs=2.5m, Tp=10s, with current) sea state | 11.10816° |
| (Hs=4m, Tp=12s, no current) sea state | 11.06651° |
| (Hs=4m, Tp=12s, with current) sea state | 10.917455° |
| DTU Spar 2 Yaw at rated wind speed (11.4 m/s) | |
| (Hs=2.5m, Tp=10s, no current) sea state | 0.30461° |
| (Hs=2.5m, Tp=10s, with current) sea state | 0.21037° |
| (Hs=4m, Tp=12s, no current) sea state | 0.41443° |
| (Hs=4m, Tp=12s, with current) sea state | 0.19686° |
Disclaimer/Publisher’s Note: The statements, opinions and data contained in all publications are solely those of the individual author(s) and contributor(s) and not of MDPI and/or the editor(s). MDPI and/or the editor(s) disclaim responsibility for any injury to people or property resulting from any ideas, methods, instructions or products referred to in the content. |
© 2024 by the authors. Licensee MDPI, Basel, Switzerland. This article is an open access article distributed under the terms and conditions of the Creative Commons Attribution (CC BY) license (http://creativecommons.org/licenses/by/4.0/).
Copyright: This open access article is published under a Creative Commons CC BY 4.0 license, which permit the free download, distribution, and reuse, provided that the author and preprint are cited in any reuse.


