
Submitted:
04 November 2024
Posted:
06 November 2024
You are already at the latest version
Abstract
In this study, panelists in rural Bangladesh (n=150) evaluated the sensory properties of cooked and uncooked dehulled red lentils fortified with eight vitamins and two minerals. Panelists rated appearance, odor, and overall acceptability using a 9-point hedonic scale (1 = dislike extremely to 9 = like extremely). We also assessed the taste and texture of the cooked lentil samples, which were prepared as typical South Asian lentil meals. We noted that consumer responses varied significantly in appearance in uncooked samples but were similar in odor and overall acceptability. Meanwhile, the five attributes of cooked samples, including overall acceptability, showed significantly similar consumer responses. This suggests that the fortification process minimally affected the sensory qualities of the fortified lentil sample. Furthermore, the correlation coefficients between color measurements (L = lightness, a* = redness, and b* = yellowness) from HunterLab and sensory acceptability scores were highly significant (p < 0.0001), with values ranging from -0.98 to 0.97. The Cronbach’s alpha (CA) scores for both cooked control and fortified samples were 0.79. The average CA scores for uncooked and cooked samples were 0.71 and 0.79, respectively, demonstrating high consistency in the panelists’ evaluations using hedonic scales. Overall, the sensory qualities of multiple micronutrient fortified lentils were acceptable and did not differ significantly from unfortified lentils.
Keywords:
lentil
; fortification
; vitamins
; minerals
; sensory evaluation
1. Introduction
Micronutrient deficiency is a worldwide public health problem and remains an economic burden. Micronutrients such as iron, zinc, calcium, vitamin A, thiamin, riboflavin, niacin, folate, and vitamin B12 are essential for all forms of life to sustain optimal physiological function. Shortages of these essential nutrients pose a significant global health concern. Also, such deficiencies can lead to inadequate physical and mental growth in children, increased susceptibility to or worsening of diseases, cognitive disabilities, vision impairment, and reduced overall productivity and potential [1]. Estimates suggest that over half of preschool-aged children and about two-thirds of non-pregnant women of reproductive age globally experience micronutrient deficiencies [2].
Plant-based diets are gaining popularity worldwide, and legumes like lentils, chickpeas, dry peas, beans, and faba beans play a significant role as dietary protein sources. In many countries, vitamin B12, calcium, folate, and other vitamins and micronutrients are also increasingly important for plant-based foods in vegetarian and vegan diets. Lentils are notable among legumes for their relatively high content of protein, carbohydrates, and essential micronutrients, surpassing certain staple cereals and root crops. Collectively, over 50 countries produce approximately 6.65 million tonnes of lentils globally, with Canada contributing about 50% (2.20 million tonnes) of this total [3]. Lentils, as a type of legume, are rich in protein (25.8 to 27.1% dry weight), starch (27.4 to 47.1%), dietary fiber (5.1 to 26.6%), iron (73 to 90 mg/kg), zinc (44 to 54 mg/kg), and selenium (425 to 673 µg/kg) [4]. Lentils are also rich in vitamin A, thiamin, folate, and β-carotene, and provide significant amounts of riboflavin, niacin, pantothenic acid, pyridoxine, vitamin K, and vitamin E [5,6]. A combination of rice and lentils makes a popular and commonly eaten dish known as “hotchpotch” in many Asian countries, such as, in Bangladesh. This dish provides all essential amino acids, carbohydrates, dietary fiber, and several minerals and vitamins. Although lentils have a significant amount of intrinsic Fe and Zn, some antinutritional factors, such as phytate, polyphenols, calcium, and protein, can inhibit the absorption of both nutrients from food [4]. Improving the concentration of these micronutrients and their bioavailability using a sustainable approach is a prime area for research to provide adequate micronutrients and cope with micronutrient deficiency [7].
Various strategies are employed to address global micronutrient deficiency issues, such as biofortification, food fortification, public health interventions, supplementation, nutrition education, disease control measures, dietary diversification, and food safety measures. These approaches aim to improve the micronutrient content in crops and food products [8,9], and they are being implemented for various staple crops and foods globally [10]. Among all the approaches, the fortification of staple foods is now the more widely used strategy that has a proven history of improving dietary diversity and effectively decreasing micronutrient deficiencies [9,10,11,12]. Around 125, 91, 32, 19, 12, and 7 countries have mandatory food fortification legislation for salt, wheat flour, vegetable oil, maize flour, sugar, and rice, respectively [13].
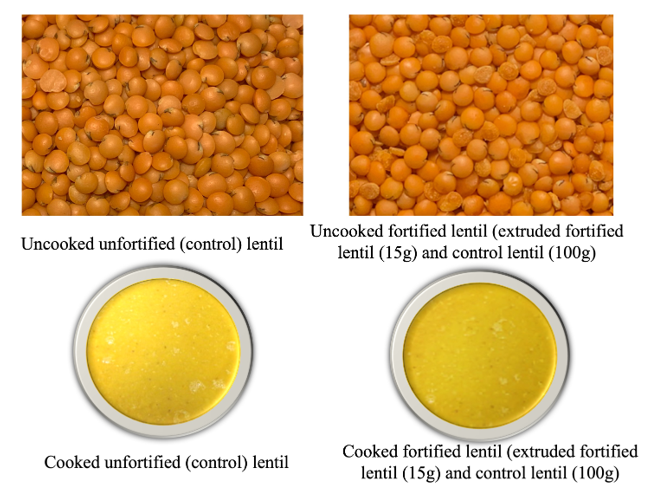
The Crop Development Centre of the University of Saskatchewan has developed techniques and expertise in lentil fortification since 2014. A laboratory-scale protocol was initially developed for fortifying dehulled lentils using a spray application to deliver appropriate doses of iron (Fe) and zinc (Zn) fortificants. This protocol aims to establish a strategy for lentil fortification and explore methods to increase the bioavailability of Fe and Zn in the human diet [7,14]. To add additional essential micronutrients, a hot extrusion technology was used to expand the essential micronutrient spectrum for lentil fortification to its full nutritional potential. We developed the fortified extruded lentil analog and blended it with the unfortified dehulled lentil kernel at a 15:100 ratio to produce the multiple micronutrients fortified (MMF) lentil product (Figure 1). In preliminary studies, we assessed the total nutritional profile, protein digestibility, colorimetric changes, and stability of micronutrients of MMF lentils after six months and one year of storage in retail market environment conditions [15]. This study was designed to conduct an exploratory sensory evaluation of MMF lentils by lentil consumers in Bangladesh.
Sensory analysis is a multidisciplinary field encompassing various social sciences, including food science, statistics, and psychology. It captures unbiased human responses to food, aiding stakeholders in identifying brand effects [16,17]. Sensory tests fall into two main categories: analytical tests, which focus on the product, and affective tests, which focus on the consumer [18]. Taste, flavor, appearance, and texture are vital organoleptic attributes in sensory evaluations of food products. The potential alteration of these attributes due to fortification can be a fascinating area of study, potentially impacting consumer acceptability. The acceptability of fortified foods depends on the type and dosage of the fortificant, the chemistry of the food vehicle, and interactions between different fortificants [19]. Fortification can also result in a metallic taste in foods, undesirable flavors from fat rancidity, unacceptable color changes, and a decrease in the quality of vitamins (such as vitamins A and C, essential for iron absorption and utilization) [20]. Any fortification program aims to reduce unwanted changes in food or food products. A prior study assessing consumer opinions on cooked and uncooked iron-fortified lentils (NaFeEDTA) revealed that consumers favored fortified lentils over unfortified lentils and those fortified with other iron sources [21]. The current study expects that MMF lentils will be just as acceptable to consumers regarding taste, smell, appearance, texture, and overall appeal. We propose that fortifying lentils with multiple micronutrients significantly affects preferences for their sensory qualities. Furthermore, we suggest that there may be noticeable differences in sensory attributes between fortified and non-fortified lentils. Identifying these sensory differences could have important scientific implications for the food science industry. Consumer feedback, a valuable source of insights, plays a crucial role in guiding recommendations for food scientists and commercial food product developers. Additionally, understanding sensory acceptability can help determine the optimal baseline and limits for fortificant formulas to meet the recommended daily allowance of added micronutrients.
2. Materials and Methods
2.1. Study Design and Selection of Panelists
A cross-sectional study was conducted from February to May 2024 at a Regional Agricultural Research Station in Ishurdi, Bangladesh. The local investigator distributed a recruitment poster within the study area to notify potential participants about this study. The poster outlined inclusion and exclusion criteria, briefly described participant tasks, and estimated the time commitment required. Using a simple random sampling technique, participants from diverse age groups, genders, and socioeconomic backgrounds were recruited to represent the broader population of lentil consumers. Panelists were included if aged 16–65 years and were selected based on their willingness to join the study and overall health. The exclusion criteria included: (i) having a fever, cold, or gum inflammation; (ii) taking medications for cancer, thyroid issues, neurological, or psychotropic treatments; (iii) being prone to allergic reactions to lentils, iron, or zinc; (iv) pregnancy; and (v) chewing betel leaf with betel nut and tobacco (locally known as paan/jarda) within an hour before the sensory evaluation. Trained interviewers conducted in-person interviews with participants in a private setting, as this was the most suitable method for collecting sensory evaluation data by trained research assistants. A total of 200 untrained lentil consumers took part in the sensory evaluation, although the Institute of Food Technologists’ Sensory Evaluation Data guidelines recommend 50–100 responses for such evaluations [22].
2.2. Preparation of Cooked and Uncooked Lentil Samples for Evaluation
The optimal micronutrient premixes were chosen following a series of trials at the Saskatchewan Food Industry Development Centre’s laboratory [15] and Canadian lentils were fortified with multiple micronutrients [i.e., vitamins A (retinol and beta-carotene); B1 (thiamine), B3 (niacin), B6 (pyridoxine), B9 (folate), B12 (cyanocobalamin); vitamin D3; iron and zinc]. For the sensory evaluation, we tested two uncooked samples (one fortified and one unfortified) among the Bangladeshi adult consumers (Figure 1). Comparable uncooked samples were used to prepare a popular traditional dish [23,24] frequently consumed in Bangladesh (Figure 2).
Food samples were prepared on the day of data collection at the Bangladesh Agricultural Research Institute (BARI) food processing laboratory in Ishurdi upazila, Pabna district, Bangladesh. Stainless steel cookware was used to ensure hygiene and quality during the preparation of all cooked samples. We made a semi-thick lentil soup using two different lentil samples. Each sample (1 kg) was cooked for about 25 minutes following a local recipe, which included de-ionized water (2.5 L), turmeric (10 g), table salt (20 g), canola oil (30 mL), and chopped onion (100 g). The uncooked samples were divided into 4-oz white foam cups labeled with 3-digit codes for individual participant evaluation. After evaluating the uncooked samples, each participant received one tablespoon of a cooked lentil dish or lentil soup from each of the six samples, served separately in 3-oz plastic cups labeled with 3-digit codes. Participants were provided with water to rinse their mouths before and after tasting each dish.
2.3. Data Collection Tools and Techniques
Data collection occurred in two stages. In the first stage (screening), a sampling frame was created from eligible participants, and a simple random sampling technique was used to finalize the participants. Initially, a screening questionnaire gathered information from 200 lentil consumers (aged 16–65 years, who expressed interest in participating) with selected sociodemographic variables. From this group, 150 participants were chosen for the final sensory evaluation study. In the second stage, a separate structured questionnaire was used for sensory evaluation. Both questionnaires were translated forward and backward between English and Bengali. The sensory evaluation form consisted of three parts. Part I collected demographic information, while Part II assessed the liking for the appearance, odor, and overall acceptability of the uncooked lentil samples. It also evaluated four sensory attributes (appearance, odor, taste, and texture) and the overall acceptability of the cooked MMF lentil samples. Participants’ responses were recorded using a 9-point hedonic scale (1 = dislike extremely, 9 = like extremely) to determine the acceptability of MMF lentils (both uncooked and cooked). Part III documented any opinions/comments from participants about the tested samples verbatim, whether positive or negative. Participants received a lump sum amount (~500 BTD/5.5 USD) to compensate for their time and transportation to and from the study location.
The sensory evaluation was conducted in a single day, from mid-morning to mid-afternoon. Fifteen research assistants (RAs) were recruited the day before the interviews and trained by a senior research investigator on the day of the evaluation. The training focused on interview techniques and understanding the sensory evaluation form to ensure adherence to the questionnaire format, questions, and response options, thereby minimizing interviewer bias. The questionnaire was pre-tested by the trained interviewers before the actual data collection. We set up 15 MMF lentil booths with uniform white lighting and furniture for participants to test the sensory attributes. Each participant evaluated the samples while seated face-to-face with a research assistant. Fifteen participants were tested at a time, and the sensory evaluation was conducted in single sessions to avoid reporting bias. Initially, uncooked samples were presented on a white tray for scoring. Then, each participant received one tablespoon of the cooked dishes or lentil soup from each sample, served separately. Deionized water was provided for oral rinsing before testing the first dish and after testing each dish to cleanse the palate [23,25].
2.4. Ethical Considerations
The study was approved by the Research Ethics Office, the University of Saskatchewan, Canada (Beh ID 3803), the Institutional Review Board/Ethics Review Committee, North South University, Bangladesh (2023/OR-NSU/IRB/0205).
2.5. HunterLab Colorimetric Analysis of Unfortified and MMF Uncooked Lentil Samples and Their Correlation with Sensory Attributes
The initial color (CIELAB color score, L, a* and b*) of control and MMF-fortified lentil sample was measured using a HunterLab (Hunter Associates Laboratory Inc., Reston, VA, USA) instrument, and compared the changes with unfortified control lentil sample. The Hunterlab L*, a* and b* scales measured for four times per sample. L* indicates the darkness to lightness, ranging from 0 to 100; a* indicates greenness to redness, ranging from -80 to +80 and b* indicates blueness to yellowness, ranging from -80 to +80 [26]. The sensory data of two attributes (appearance, and overall acceptability) of two uncooked MMF lentil samples were correlated with the L*, a*, and b* scores using Pearson’s correlation test.
2.6. Statistical Analysis
Once data collection was completed, a dataset was prepared using SAS (Statistical Analysis Software, SAS Institute Inc., Cary, NC, USA) version 9.4. The datasets were reviewed by initially entering the pretesting questionnaire data to test practicability and ensure all variables mentioned in the questionnaire were covered. Scores for the appearance, odor, taste, texture, and overall acceptability of the fortified lentils were presented in a box plot (Figure 3 and Figure 4). A paired t-test was conducted at a 95% confidence interval to determine the mean score differences between the control and fortified food samples’ sensory scores obtained from panelists. The L*, a*, and b* scores were analyzed using R Core Team (2021) (R: A language and environment for statistical computing. R Foundation for Statistical Computing, Vienna, Austria. URL https://www.R-project.org/). Cronbach’s alpha (CA) coefficient was utilized to assess the consistency of the panelists’ responses, as it measures the internal consistency reliability (ICR) of a sensory panel in multi-item evaluation scores [27]. It evaluated the measurement error (ranging from zero to one) by squaring the correlation (α values) and then subtracting the final results from one, which reveals the variation in the measurement error [28,29,30]. The value obtained after subtraction indicates the error variance in the score. We evaluated the internal consistency reliability (ICR) of the liking scores for sensory attributes from 196 panelists in Bangladesh, covering nine uncooked and six cooked samples. While there is no strict cut-off for Cronbach’s Alpha (CA), several studies suggest that acceptable ICR ranges from 0.70 to 0.95 [31,32].
3. Results
3.1. The Socio-Demographic Characteristics of the Participants
Table 1 provides a summary of the participants’ socio-demographic characteristics. Of the participants, 50.7% were male and 49.3% were female. Their ages ranged from 16 to 65 years, with the largest age group (33.3%) being 26–35 years old. About 76.0% of the participants came from households with one to five employed individuals. Nearly half (55.0%) of the participants had a monthly income between BDT 10,000 and 19,999 (approximately USD 121–240). The highest level of education attained by 43.6% of the participants was elementary (grade 5), while 27.5% had completed higher secondary education (grade 12).
3.2. Consumer Perspectives on Lentil Consumption
In the study, 57.3% of the individuals reported buying between 251–500 grams of lentils each week, while 16.0% purchased between 751–1000 grams, as detailed in Table 2. Additionally, these participants acquired smaller amounts of other types of pulses—such as chickpeas, mung beans, black gram, and field peas—with 51.3% buying 100–250 grams and 37.3% obtaining 251–500 grams on a weekly basis. The predominant place for purchasing lentils was local markets (94.0%), with neighborhood grocery stores accounting for a small portion (5.3%). Most panelists (85.3%) bought lentils monthly and showed a strong preference for red football LPT (95.3%), while a minority (7.0%) chose red split LPT.
3.3. Preference Towards Uncooked Fortified Lentils
Figure 3’s box plots illustrate the mean, range, dispersion, and outliers of the sensory attributes for the two uncooked samples. Consumer responses varied significantly for appearance, but were similar for odor, and overall acceptability. The control and fortified samples had a similar range and dispersion.
3.4. Preference Towards Uncooked Fortified Lentils
Figure 4’s box plots illustrate the mean, range, dispersion, and outliers of the sensory attributes for the two uncooked samples. Consumer responses were significantly similar for all the five attributes including the overall acceptability. The control and fortified samples had a similar range and dispersion for all the attributes except taste.
3.5. HunterLab Colorimetric Measurements of Unfortified and Fortified Uncooked Lentil Samples and Correlation with Sensory Attributes
Table 3 presents the changes in L, a*, and b* values for both unfortified and fortified lentil samples. The CIELAB scores from Hunter Lab measurements indicated insignificant variations in a* and b* values between the unfortified and fortified samples. The ranges for L, a*, and b* values in the unfortified and fortified samples were 55.62-58.07, 34.62-33.65, and 40.56-40.39, respectively. While the L value increased significantly, the a* and b* values remained significantly similar at the initial stage.
The correlation coefficients between L, a*, and b* scores from HunterLab measurements and sensory acceptability scores were significant at p < 0.0001, with values ranging from -0.98 to 0.97 (Table 4). A negative correlation between L values and sensory scores was observed; lightness (L) was increased significantly in fortified lentils by adding a micronutrient premix. However, consumers scored lower on fortified lentils than the unfortified ones. On the other hand, a positive correlation was observed between sensory scores and redness (a*) and yellowness scores (b*).
3.6. Evaluating the Consistency of Sensory Data Using Cronbach’s Alpha
Cronbach’s alpha (CA) was used to evaluate the reliability of the sensory data. CA measures the ‘proximity between evaluation profiles’ by considering both variance and covariance relationships [27]. Table 5 shows the CA scores for fortified and unfortified, cooked and uncooked samples. For uncooked samples, CA was ≥ 0.70. The CA scores for cooked control and fortified samples were 0.79. The mean CA scores for uncooked and cooked samples were 0.71 and 0.79, respectively, indicating high consistency in sample evaluations using hedonic scales.
4. Discussion
Vitamin and mineral deficiencies affect more than a third of the world’s population. To fight the consequences of such deficiencies, relevant staple foods are chosen to be enriched with micronutrients. Lentils are one of them. Collectively, over 50 countries produce approximately 7.6 million tonnes of lentils globally, with Canada contributing about 50% (3.7 million tonnes) [3]. Some countries that do not produce lentils rely on imports to use them as a staple food. Lentils, a cost-effective solution, are favored in daily meals for their quick cooking time and affordability as a source of protein, carbohydrates, and micronutrients compared to animal-based sources [33]. Lentil adds complementary protein to rice-based diets, and most importantly, unlike rice, which in many countries is boiled in water and then drained from the rice, cooked lentil is consumed as a soup without draining the cooking water, and this results in maximum nutrient availability after cooking in comparison to rice [7].
Fortifying lentils may be much more efficient because the volume of food products to achieve effective nutrition will be reduced. Many countries now accept extruded fortified rice to combat micronutrient deficiencies. Our previous study [15] proposed a similar approach to fortify lentils with multiple essential micronutrients. The extrusion techniques for fortified lentils were similar to rice fortification, entirely different from the flour fortification used for maize and wheat. Finally, we developed a novel method of fortifying lentils with multiple vitamins and minerals (vitamins A (retinol and beta-carotene); B1 (thiamine), B3 (niacin), B6 (pyridoxine), B9 (folate), B12 (cyanocobalamin); vitamin D3; calcium, iron, and zinc) using Hot Extrusion Technology (HET) [15]. These fortified lentils have been named multiple micronutrients fortified (MMF) lentils, and the MMF development protocol can easily merge with the existing pulse industry milling practices.
Sensory evaluation measures consumer responses regarding their liking, preference, and acceptance of food products [34]. In this study, we assessed sensory attributes of the newly developed MMF lentils among consumers in Bangladesh. The study's overall findings showed that the mean scores for odor, taste, texture, and overall acceptability of MMF lentils were not significantly different from those of the control/unfortified lentils. This suggests that the fortification process had minimal or no impact on the sensory qualities of the MMF lentil sample, reinforcing the positive consumer response to the MMF lentils.
In this study, we also selected Bangladesh as the study site for several reasons. Lentils are a staple or semi-staple food in many countries, with 56% of the world’s lentils consumed in Asia [17], particularly in Bangladesh. The study took place in a key lentil-growing region of Bangladesh, where farmers have extensive experience in cultivating, processing, and marketing lentils. The National Pulses Research Centre (PRC) of the Bangladesh Agricultural Research Institute (BARI) is also located in this region. Various national and international organizations are actively involved in the Bangladesh health sector, conducting research, sensory evaluations, and field trials with fortified foods, such as fortified rice. Dishes like “daal (pulses) and vhat (rice)” or “hotchpotch,” made with lentils and rice, are common and popular in South Asia, including Bangladesh. Approximately 60% and 12% of Bangladeshi women consume lentils three and four days per week, respectively [34]. The similar study revealed that 92% of 384 respondents ate hotchpotch at least once a week [34]. Over 80% of the lentils in Bangladesh are imported from countries like Australia and Canada, presenting a significant opportunity to export MMF lentil products to address micronutrient deficiencies in Bangladesh.
Moreover, food fortification is gaining momentum in Bangladesh, though the market currently offers limited options, with some products still under review. Presently, two fortified foods—vegetable oil with vitamin A and salt with iodine—are available [35]. Research is ongoing for other fortified foods such as rice, lentils, wheat flour, and sugar [35]. A feasibility study on Fe-fortified lentils with adolescent girls showed positive acceptance [36]. Additionally, a large-scale, double-blind, community-based, randomized controlled trial involving around 1,200 adolescent girls demonstrated that Fe-fortified lentils significantly improved their iron status [36].
In sensory evaluation studies, consumers are essential for assessing product differences and characteristics [37]. The number of respondents needed for a consumer test depends on the specific food products being evaluated, the test’s purpose, duration, and cost [38]. A sample size of 50–300 respondents is recommended for consumer acceptability tests [39]. Suresh & Chandrashekara, (2012) [40] provided a formula for calculating sample size, indicating that around 96 participants are sufficient for consumer-level research. This study used data from 150 participants to achieve statistically significant results.
In consumer-level sensory analysis, sociodemographic data is crucial for determining if participants accurately represent the broader population when evaluating a specific food product. Previous research has shown that sociocultural diversity, demographic factors, and economic status influence consumer choices regarding functional foods [41]. In this study, data on participant diversity—including age, gender, monthly income, employment status, education, and attitudes toward lentil consumption—confirmed the sample’s representativeness of the general consumer population. Consumer attitudes toward lentil consumption in Bangladesh indicate a preference for red lentils over other pulses. Among the two types of red lentils, the football type is favored by 95.3% of consumers over the split type. Approximately 94% of consumers in Ishurdi purchase lentils from local markets, where they are sold in open sacs or 1–2 kg plastic bags. A previous study [14,23] found that 37% of urban consumers bought lentils from local markets or retail shops, likely due to sociodemographic differences between urban and suburban areas. Consumers also the MMF lentils as a value-added product that should be packaged in sealed bags to ensure quality and reduce the risk of adulteration.
Consumer responses were significantly not different between two uncooked samples (MMF and control lentils) for all three attributes except appearance. The average sensory scores of appearances, odor, and overall acceptability for uncooked control and MMF lentils sample were 7.49 & 7.22, 7.31 & 7.43, and 7.39 & 7.32, respectively. Although the difference in appearance was significant, it was numerically very low. This could be due to adding only 15% of the extruded fortified lentil, which looks similar to the control lentil. Overall, 40%, 34%, and 26 % of the consumers scored lower, higher, and similar for MMF lentils compared to the unfortified uncooked sample. These results suggest that multiple micronutrient fortification did not negatively impact the sensory characteristics of fortified lentils. Similar to the uncooked samples, consumer responses to both the unfortified and fortified cooked samples were significantly similar across all five attributes, including overall acceptability. The control and MMF samples exhibited a similar range and dispersion for all attributes except taste. The average sensory scores of appearances, odor, taste, texture, and overall acceptability for cooked control and MMF samples were 7.54 & 7.44, 7.68 & 7.28, 7.36 & 7.14, 7.48 & 7.31, and 7.61 & 7.50, respectively. For both samples, the control lentils received a higher score for all five attributes than MMF lentils. Overall, 55%, 24%, and 22 % of the consumers scored lower, higher, and similar for MMF lentils compared to the unfortified cooked sample.
Boxplot comparisons of both uncooked and cooked samples revealed that some outlier scores might have significantly influenced the average scores of the lentil samples. Some consumers rated both the uncooked and cooked control and fortified lentils with lower hedonic scores (dislike slightly, a score of four; neither dislike nor like, a score of five). Overall, the liking scores indicated that both cooked and uncooked samples were equally accepted by the participants.
Consumer evaluations indicated no significant difference in preference for sensory qualities or overall satisfaction between uncooked and cooked lentil samples. This uniformity in scoring could be attributed to cooking methods based on traditional recipes for making lentil soup (Kohinoor et al., 2010). Ingredients like dry turmeric (Curcuma longa L.) powder and onion (Allium cepa L.), which are commonly used in cooking lentils, can enhance visual appeal by reducing darkness with turmeric’s yellow hue. They also modify the scent and flavor profiles, potentially masking any metallic taste from fortified lentils [23]. Similar negligible variances were observed when comparing sensory characteristics of cooked conventional versus fortified rice [42] Furthermore, this research utilized fortified lentils processed at the Saskatchewan Food Industry Development Centre in Canada, where canola oil is typically employed post-dehulling for an enhanced glossy appearance aimed at increasing consumer appeal; however, other oils like palm or soybean were deliberately excluded from this process to prevent any potential impact on flavor or aroma. Participants were briefed on the recipe prior to commencing with sensory assessments.
Sensory analysis allows for the evaluation of products quickly and cost-effectively with representative consumers who regularly consume the product and possess sensory skills [43]. The impact of fortification on the sensory properties of food varies greatly and depends on the components of the fortificants (minerals and vitamins), their doses, and the food items [19]. In this study, although consumers could easily distinguish the MMF samples from the control, the overall acceptability was statistically similar for both uncooked and cooked samples.
The consistency of sensory data was evaluated using Cronbach’s alpha (CA), which indicated that panelists consistently scored both uncooked and cooked samples, with CA values falling within the acceptable range (0.75 to 0.95) [31,32]. However, the uncooked fortified sample had a CA value of 0.68, which is below the suggested range. This inconsistency could be attributed to the variable scoring by consumers for this sample. One study noted that missing values can affect the psychometric properties of any test [44]. Since the data were cross-sectional, generalizability cannot be inferred from this study, so caution is advised when interpreting these specific results.
Lentils are often paired with rice as a staple food in many countries, such as Bangladesh. They are also a promising option for quick-cooking meals that can be further enhanced nutritionally. MMF lentils offer a sustainable, whole-food solution to address micronutrient deficiencies in countries where lentils are commonly consumed. We estimated that a 50 g serving of fortified lentils used in a cooked lentil can provide approximately 992 IU of vitamin A palmitate, 0.06 mg of beta carotene, 93.8 IU of vitamin D3, 0.77 µg of vitamin B12, 1.22 mg of vitamin B6 (pyridoxine hydrochloride), 4.6 mg of niacinamide, 1.98 mg of thiamine mononitrate, 0.15 mg of folic acid, 11.2 mg of iron (ferric pyrophosphate hydrate), and 4.87 mg of zinc (zinc sulfate monohydrate). These amounts cover a significant portion of the Estimated Average Requirements (EARs) for these micronutrients, as the World Health Organization (WHO) recommended.
6. Conclusion
Canadian lentils fortified with multiple micronutrient [i.e., vitamins A (retinol and beta-carotene); B1 (thiamine), B3 (niacin), B6 (pyridoxine), B9 (folate), B12 (cyanocobalamin); vitamin D3; iron and zinc] using Hot Extrusion Technology showed indifferent sensory attributes in terms of odor, taste, texture and overall acceptability except for appearance to the Canadian unfortified lentils.
Author Contributions
Conceptualization – Rajib Podder, Albert Vandenberg; Methodology - Rajib Podder, Fakir Md Yunus, Albert Vandenberg; Validation: Rajib Podder, Fakir Md Yunus, Albert Vandenberg; Formal analysis: Rajib Podder, Fakir Md Yunus; Investigation: Rajib Podder, Mohammad Delwer Hossain Hawlader, Albert Vandenberg; Resources: Albert Vandenberg; Data curation: Rajib Podder, Nurjahan Binte Munaf, Farzana Rahman, Fouzia Khanam, Fakir Md Yunus; Writing—original draft preparation - Rajib Podder, Fakir Md Yunus; Writing—review and editing - Nurjahan Binte Munaf, Farzana Rahman, Fouzia Khanam, Mohammad Delwer Hossain Hawlader; Visualization: Rajib Podder, Albert Vandenberg; Supervision: Rajib Podder, Albert Vandenberg and and Mohammad Delwer Hossain Hawlader; Project administration: Albert Vandenberg and Mohammad Delwer Hossain Hawlader; Funding acquisition: Albert Vandenberg.
Funding
The Saskatchewan Ministry of Agriculture (Agriculture Development Fund), Project # 20210855 “Development of Hot Extrusion Technology (HET) for Fortifying Lentil Consumer Products with Vitamins and Minerals”.
Data Availability Statement
The data presented in this study are available on request from the corresponding author due to (specify the reason for the restriction).
Acknowledgments
The authors gratefully acknowledge the financial support from the Saskatchewan Ministry of Agriculture (Agriculture Development Fund). We also extend our gratitude to the research scientist and scientific assistants at the Pulses Research Centre, Bangladesh Agricultural Research Institute, Ishurdi, Bangladesh, for their invaluable technical assistance in conducting the sensory trial. Additionally, we thank all the participants who took part in this study.
Conflicts of Interest
All the seven authors, Rajib Podder, Fakir Md Yunus, Nurjahan Binte Munaf, Farzana Rahman, Fouzia Khanam, Mohammad Delwer Hossain Hawlader and Albert Vandenberg declare no conflict of interest.
References
- Ritchie Hannah; Roser Max Micronutrient Deficiency - Our World in Data; 2017;
- Stevens, G.A.; Beal, T.; Mbuya, M.N.N.; Luo, H.; Neufeld, L.M.; Addo, O.Y.; Adu-Afarwuah, S.; Alayón, S.; Bhutta, Z.; Brown, K.H.; et al. Micronutrient Deficiencies among Preschool-Aged Children and Women of Reproductive Age Worldwide: A Pooled Analysis of Individual-Level Data from Population-Representative Surveys. Lancet Glob Health 2022, 10, e1590–e1599. [CrossRef]
- FAOSTAT Crops and Livestock Products Available online: https://www.fao.org/faostat/en/#data/QCL (accessed on 17 April 2024).
- Thavarajah, D.; Thavarajah, P.; Wejesuriya, A.; Rutzke, M.; Glahn, R.P.; Combs, G.F.; vandenberg, A. The Potential of Lentil (Lens Culinaris L.) as a Whole Food for Increased Selenium, Iron, and Zinc Intake: Preliminary Results from a 3 Year Study. Euphytica 2011. [CrossRef]
- Bhatty, R.S. Composition and Quality of Lentil (Lens Culinaris Medik): A Review. Canadian Institute of Food Science and Technology Journal 1988, 21, 144–160. [CrossRef]
- Migliozzi, M.; Thavarajah, D.; Thavarajah, P.; Smith, P. Lentil and Kale: Complementary Nutrient-Rich Whole Food Sources to Combat Micronutrient and Calorie Malnutrition. Nutrients 2015, 7, 9285. [CrossRef]
- Podder, R.; Glahn, R.P.; Vandenberg, A. Dual-Fortified Lentil Products-A Sustainable New Approach to Provide Additional Bioavailable Iron and Zinc in Humans. Curr Dev Nutr 2021, 5. [CrossRef]
- Thompson, B.; Amoroso, L. Combating Micronutrient Deficiencies: Food-Based Approaches. Combating Micronutrient Deficiencies: Food-based Approaches 2010, 1–397. [CrossRef]
- Olson, R.; Gavin-Smith, B.; Ferraboschi, C.; Kraemer, K. Food Fortification: The Advantages, Disadvantages and Lessons from Sight and Life Programs. Nutrients 2021, 13. [CrossRef]
- Northrop-Clewes, C.A. Food Fortification. In Nutrition in infancy; Humana Press: Totowa, NJ, 2013; pp. 359–381.
- Keats, E.C.; Haider, B.A.; Tam, E.; Bhutta, Z.A. Multiple-Micronutrient Supplementation for Women during Pregnancy. Cochrane Database of Systematic Reviews 2019, 3, CD004905.. [CrossRef]
- Bishai, D.; Nalubola, R. The History of Food Fortification in the United States: Its Relevance for Current Fortification Efforts in Developing Countries. Econ Dev Cult Change 2002, 51, 37–53.
- Rohner, F.; Wirth, J.P.; Zeng, W.; Petry, N.; Donkor, W.E.S.; Neufeld, L.M.; Mkambula, P.; Groll, S.; Mbuya, M.N.; Friesen, V.M. Global Coverage of Mandatory Large-Scale Food Fortification Programs: A Systematic Review and Meta-Analysis. Advances in Nutrition 2023, 14, 1197–1210. [CrossRef]
- Podder, R.; Imam, M.H.A.; Jahan, I.; Yunus, F.M.; Muhit, M.; A., V. Sensory Acceptability of Dual-Fortified Milled Red and Yellow Lentil (Lens Culinaris Medik.) Dal in Bangladesh. Foods 2020, 9, 992. [CrossRef]
- Podder Rajib; Yunus Fakir Md; Polley Brittany; Bhowmik Pankaj; Vandenberg Albert Lentil Fortification with Multiple Vitamins and Minerals Using Hot Extrusion Technology (HET). Food Nutr (Roma) 2024, Submitted.
- Stone, H.; Sidel, J.L. Introduction to Sensory Evaluation. In Sensory evaluation practices; Stone, H., Bleibaum, R.N., Thomas, H.A., Eds.; Academic press, Elsevier, London, UK, 2004; pp. 1–19 ISBN 9780126726909.
- Lawless, H.T.; Heymann, H. Sensory Evaluation of Food. Principles and Practices; 2nd ed.; Springer International Publishing: New York, 2010; ISBN 978-1-4419-6487-8.
- Drake, M.A.; Watson, M.E.; Liu, Y. Sensory Analysis and Consumer Preference: Best Practices. Annu Rev Food Sci Technol 2023, 14, 427–448. [CrossRef]
- Allen, L.; Benoist, B. de; Dary, O.; Hurrell, R. Guidelines on Food Fortification with Micronutrients; Avenue Appia, Switzerland, 2006;
- Mehansho, H. Iron Fortification Technology Development: New Approaches. J Nutr 2006, 136, 1059–1063.
- Podder, R.; Tar’An, B.; Tyler, R.T.; Henry, C.J.; DellaValle, D.M.; Vandenberg, A. Iron Fortification of Lentil (Lens Culinaris Medik.) to Address Iron Deficiency. Nutrients 2017, 9. [CrossRef]
- IFT/SED Guidelines for the Preparation and Review of Papers Reporting Sensory Evaluation Data. Food Technol 1981, 35, 50–59.
- Podder, R.; Khan, S.M.; Tar’an, B.; Tyler, R.T.; Henry, C.J.; Jalal, C.; Shand, P.J.; Vandenberg, A. Sensory Acceptability of Iron-Fortified Red Lentil (Lens Culinaris Medik.) Dal. J Food Sci 2018, 83, 804–813. [CrossRef]
- Kohinoor, H.; Siddiqua, A.; Akhtar, S.; Hossain, M.G.; Podder, R.; Hossain, M.A. Nutrition and Easy Cooking of Pulses; Bangladesh Agricultural Research Institute, Gazipur, Bangladesh: Print Valley Printing Press: Gazipur, Bangladesh, 2010;
- Anand, V.; Kharb, V.; Kataria, M.; Kukka, V.; Choudhury, P.K. Taste Assessment Trials for Sensory Analysis of Oral Pharmaceutical Products. Pak J Pharm Sci 2008.
- Wrolstad, R.E.; Smith, D.E. Color Analysis. In Food analysis; Nielson, S.S., Ed.; Springer International Publishing: Cham, Switzerland, 2010; pp. 545–555 ISBN 978-1-4419-1477-4.
- Pinto, F.S.T.; Fogliatto, F.S.; Qannari, E.M. A Method for Panelists’ Consistency Assessment in Sensory Evaluations Based on the Cronbach’s Alpha Coefficient. Food Qual Prefer 2014, 32, 41–47. [CrossRef]
- Tavakol, M.; Dennick, R. Making Sense of Cronbach’s Alpha. Int J Med Educ 2011, 2, 53–55. [CrossRef]
- Tavakol, M.; Mohagheghi, M.A.; Dennick, R. Assessing the Skills of Surgical Residents Using Simulation. J Surg Educ 2008, 65, 77–83. [CrossRef]
- Kline, P. An Easy Guide to Factor Analysis. In; Routledge: New York:, 1994 ISBN 9781315788135.
- Bland, J.M.; Altman, D.G. Statistics Notes: Cronbach’s Alpha. Br Med J 1997, 314, 572–572.
- DeVellis, F.R. Scale Development: Theory and Applications; 2nd ed.; Sage Publication Inc.: Thousand Oaks, Californis, 2003; ISBN 0-7619-2604-6.
- Khazaei, H.; Subedi, M.; Nickerson, M.; Martínez-Villaluenga, C.; Frias, J.; Vandenberg, A. Seed Protein of Lentils: Current Status, Progress, and Food Applications. Foods 2019, 8, 391. [CrossRef]
- Methven, L.; Jiménez-Pranteda, M.L.; Lawlor, J. Ben. Sensory and Consumer Science Methods Used with Older Adults: A Review of Current Methods and Recommendations for the Future. Food Qual Prefer 2016.
- Rahman, S.; Ahmed, T.; Rahman, A.S.; Alam, N.; Ahmed, A.S.; Ireen, S.; Chowdhury, I.A.; Chowdhury, F.P.; Rahman, S.M. Determinants of Iron Status and Hb in the Bangladesh Population: The Role of Groundwater Iron. Public Health Nutr 2016, 19, 1862–1874. [CrossRef]
- Yunus, F.M.; Jalal, C.; Afsana, K.; Podder, R.; Vandenberg, A.; Dellavalle, D.M. Iron-Fortified Lentils to Improve Iron (Fe) Status among Adolescent Girls in Bangladesh - Study Protocol for a Double-Blind Community-Based Randomized Controlled Trial. Trials 2019, 20. [CrossRef]
- The Society of Sensory Professionals Panel Selection in Sensory Analysis; 2020;
- Gacula, M.; Rutenbeck, S. Sample Size in Consumer Test and Descriptive Analysis. J Sens Stud 2006. [CrossRef]
- Meilgaard, M.C.; Carr, B.T.; Civille, G.V. Sensory Evaluation Techniques, Fifth Edition; 2007; ISBN 978-0-8493-0276-3.
- Suresh, K.; Chandrashekara, S. Sample Size Estimation and Power Analysis for Clinical Research Studies. J Hum Reprod Sci 2012.
- Verbeke, W. Consumer Acceptance of Functional Foods: Socio-Demographic, Cognitive and Attitudinal Determinants. Food Qual Prefer 2005, 16, 45–57. [CrossRef]
- Beinner M.A.a Soares, A.D.N. b B.A.L.A. b M.M.A.M. c Sensory Evaluation of Rice Fortified with Iron [Análise Sensorial de Arroz Fortificado Com Ferro]. Ciencia e Tecnologia de Alimentos 2010, 30, 516–519.
- Stone, H. Example Food: What Are Its Sensory Properties and Why Is That Important? NPJ Sci Food 2018. [CrossRef]
- Huisman, M. Imputation of Missing Item Responses: Some Simple Techniques. Qual Quant 2000, 34, 331–351. [CrossRef]
Figure 1.
Images of uncooked lentil samples from two red lentil products: (a) unfortified control lentils, and (b) fortified lentils containing 15 g of extruded fortified lentil kernels mixed with 100 g of unfortified control lentils.
Figure 1.
Images of uncooked lentil samples from two red lentil products: (a) unfortified control lentils, and (b) fortified lentils containing 15 g of extruded fortified lentil kernels mixed with 100 g of unfortified control lentils.
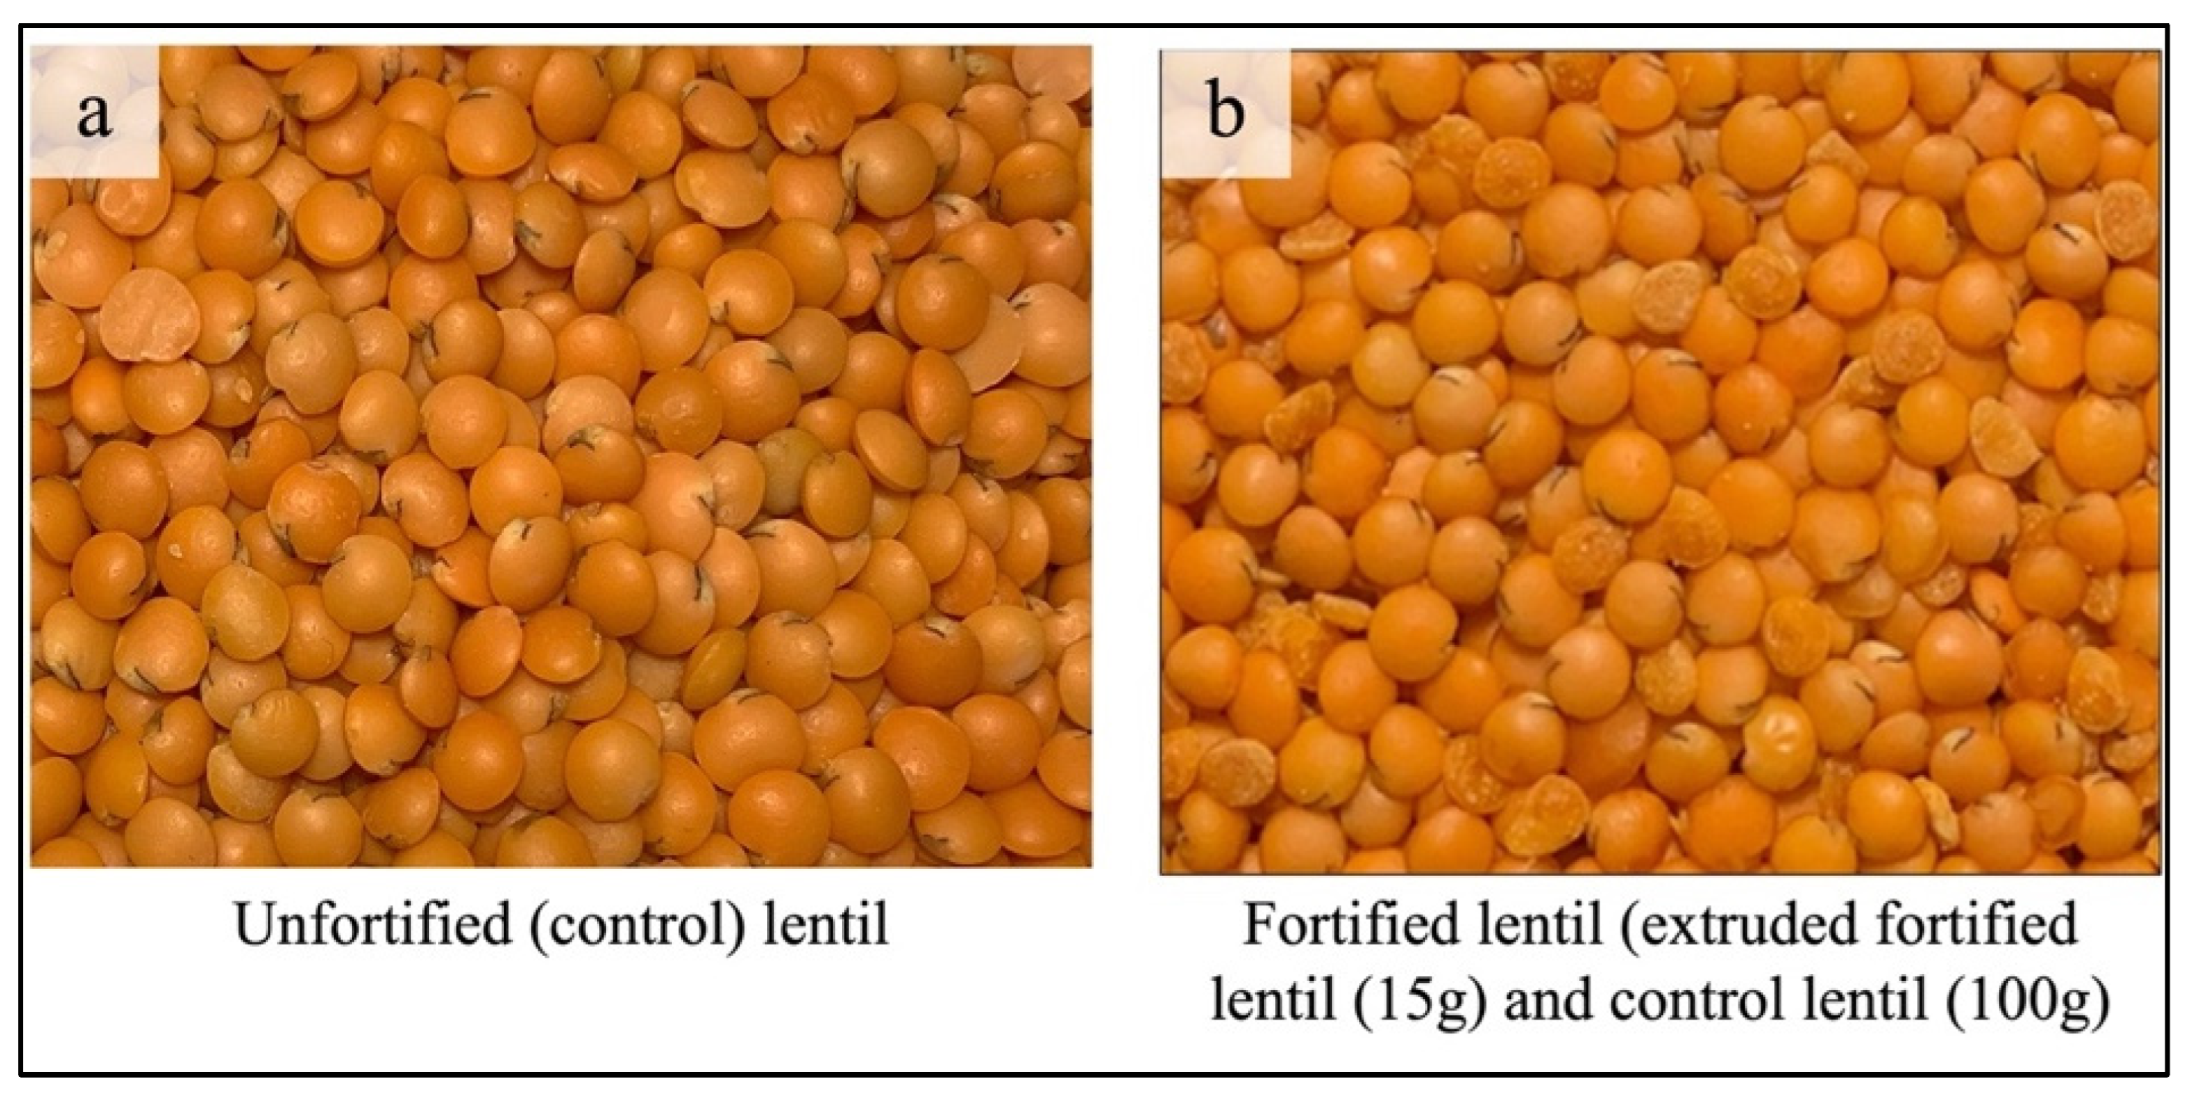
Figure 2.
Images of cooked lentil samples from two red lentil products: (a) unfortified control lentils, and (b) fortified lentils containing 15 g of extruded fortified lentil kernels mixed with 100 g of unfortified control lentils.
Figure 2.
Images of cooked lentil samples from two red lentil products: (a) unfortified control lentils, and (b) fortified lentils containing 15 g of extruded fortified lentil kernels mixed with 100 g of unfortified control lentils.
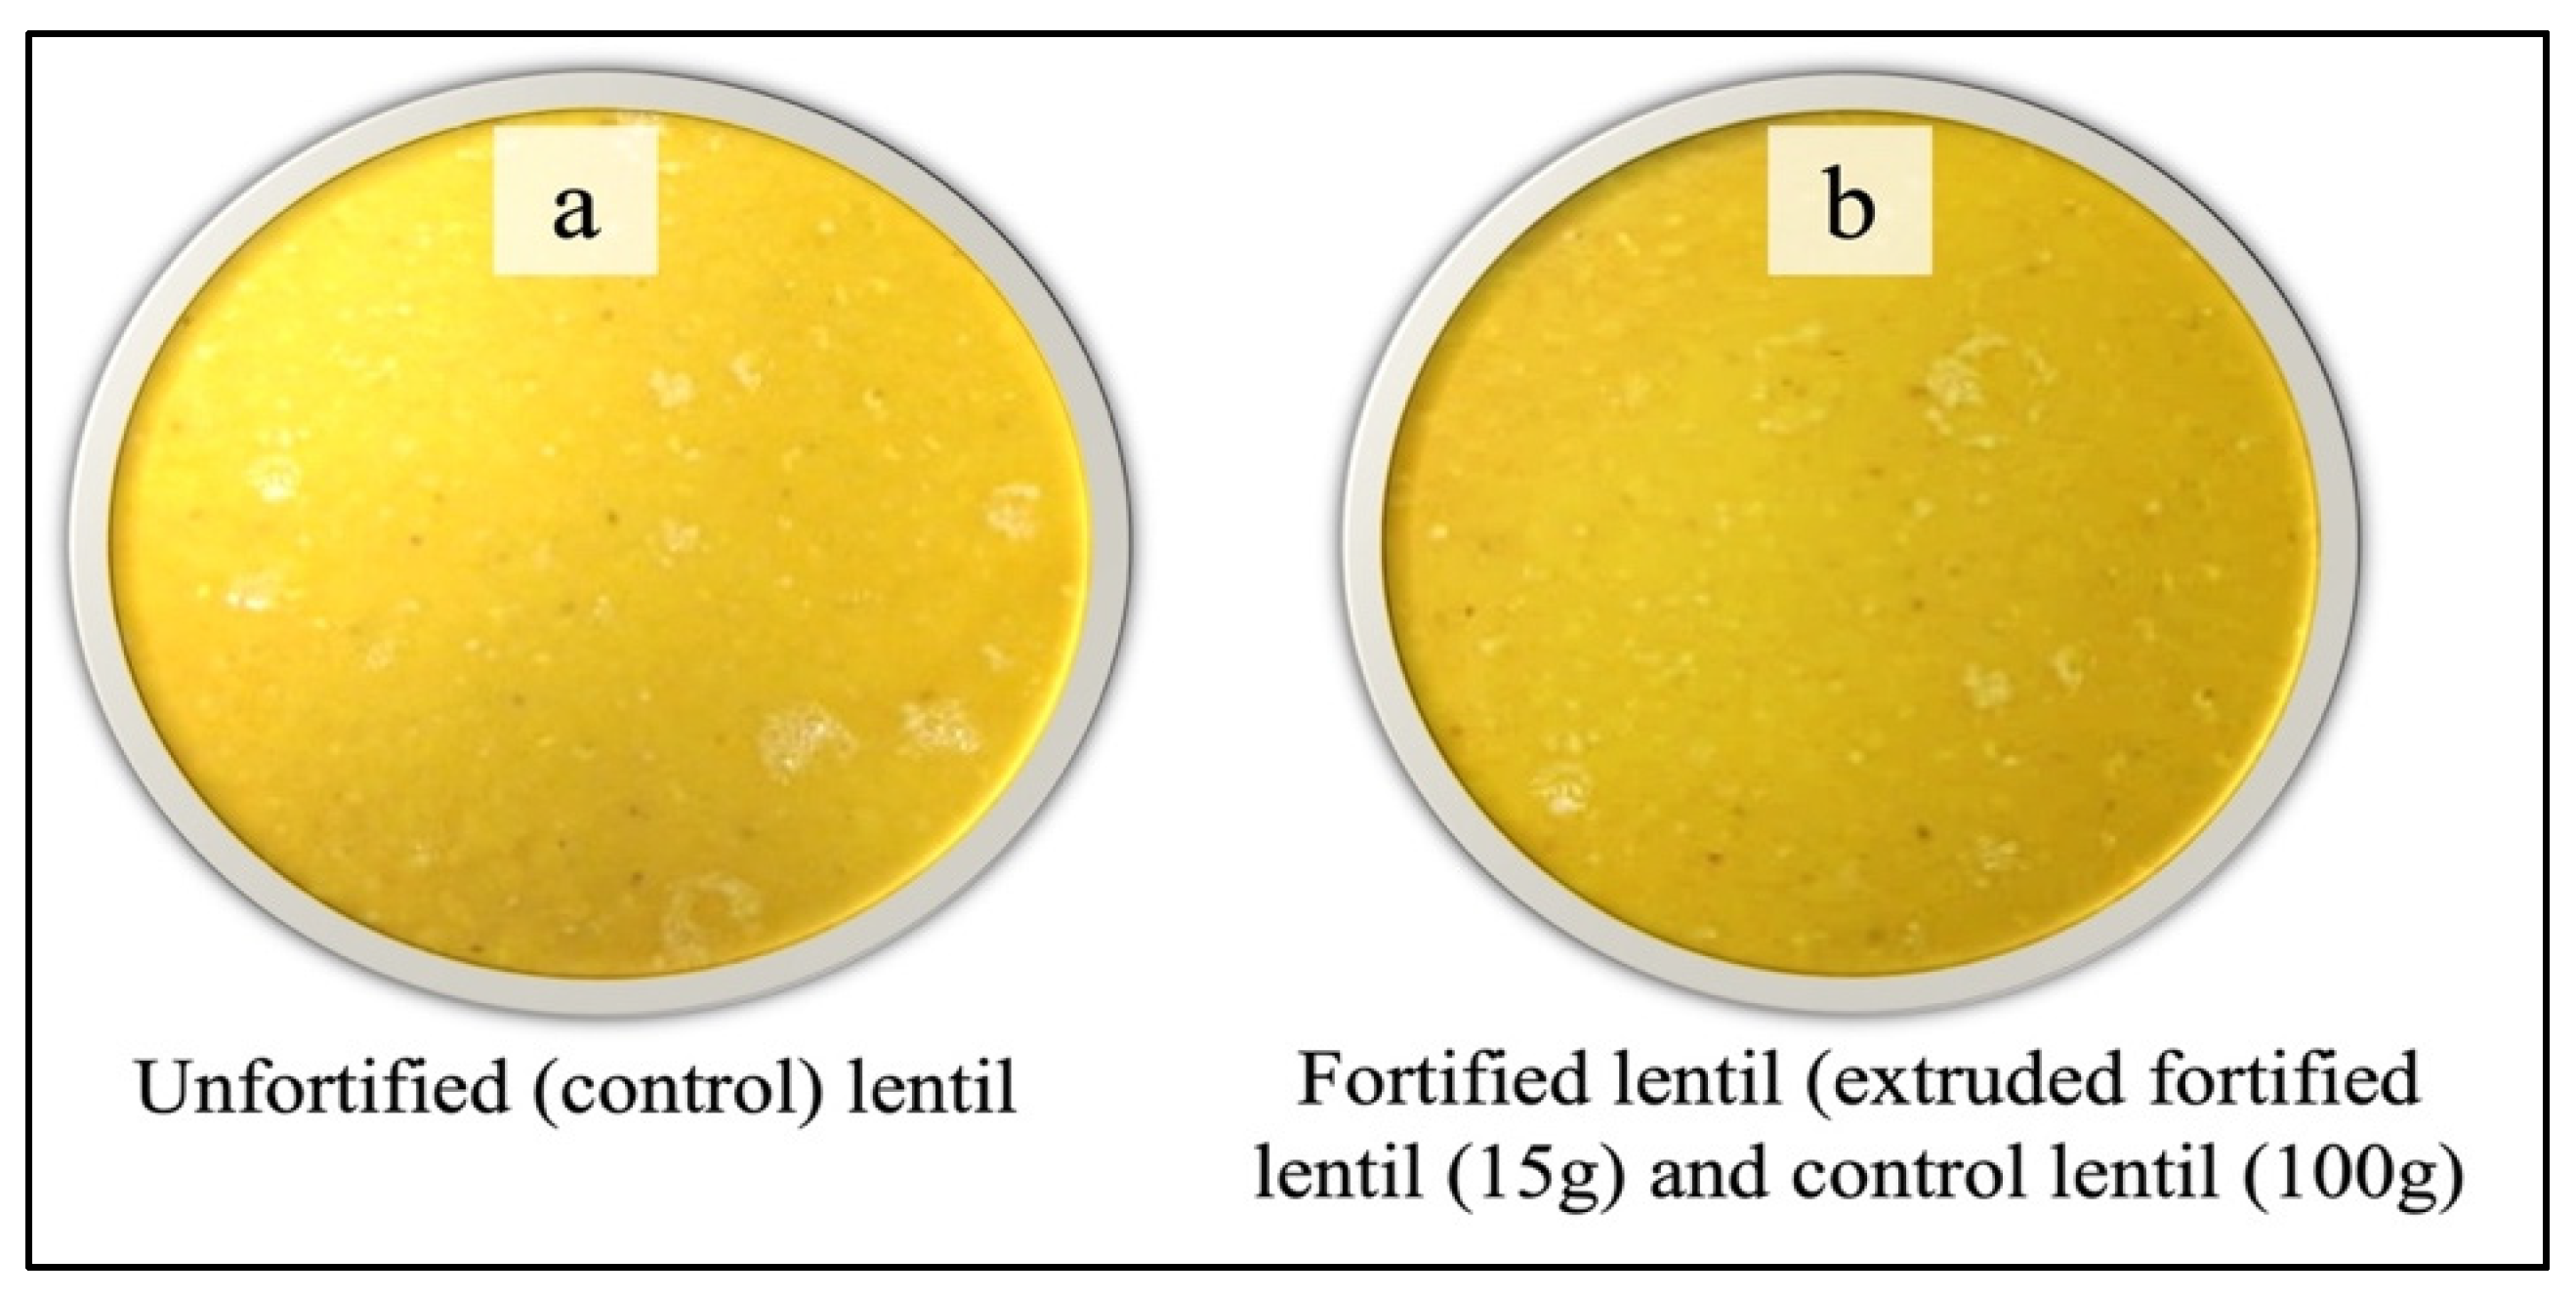
Figure 3.
Box plot analysis of hedonic scores (1 = dislike extremely, 9 = like extremely) obtained for two uncooked lentil samples (unfortified control lentil polished with 0.5% canola oil; multiple micronutrient fortified lentil) evaluated for appearance, odor, and overall acceptability by 150 panelists in Bangladesh. Different letters above the box plots signify significant differences between the two samples for each attribute. Each box plot shows the data distribution for each sample type separately, using a five-number summary: minimum, first quartile (Q1), median, third quartile (Q3), and maximum.”
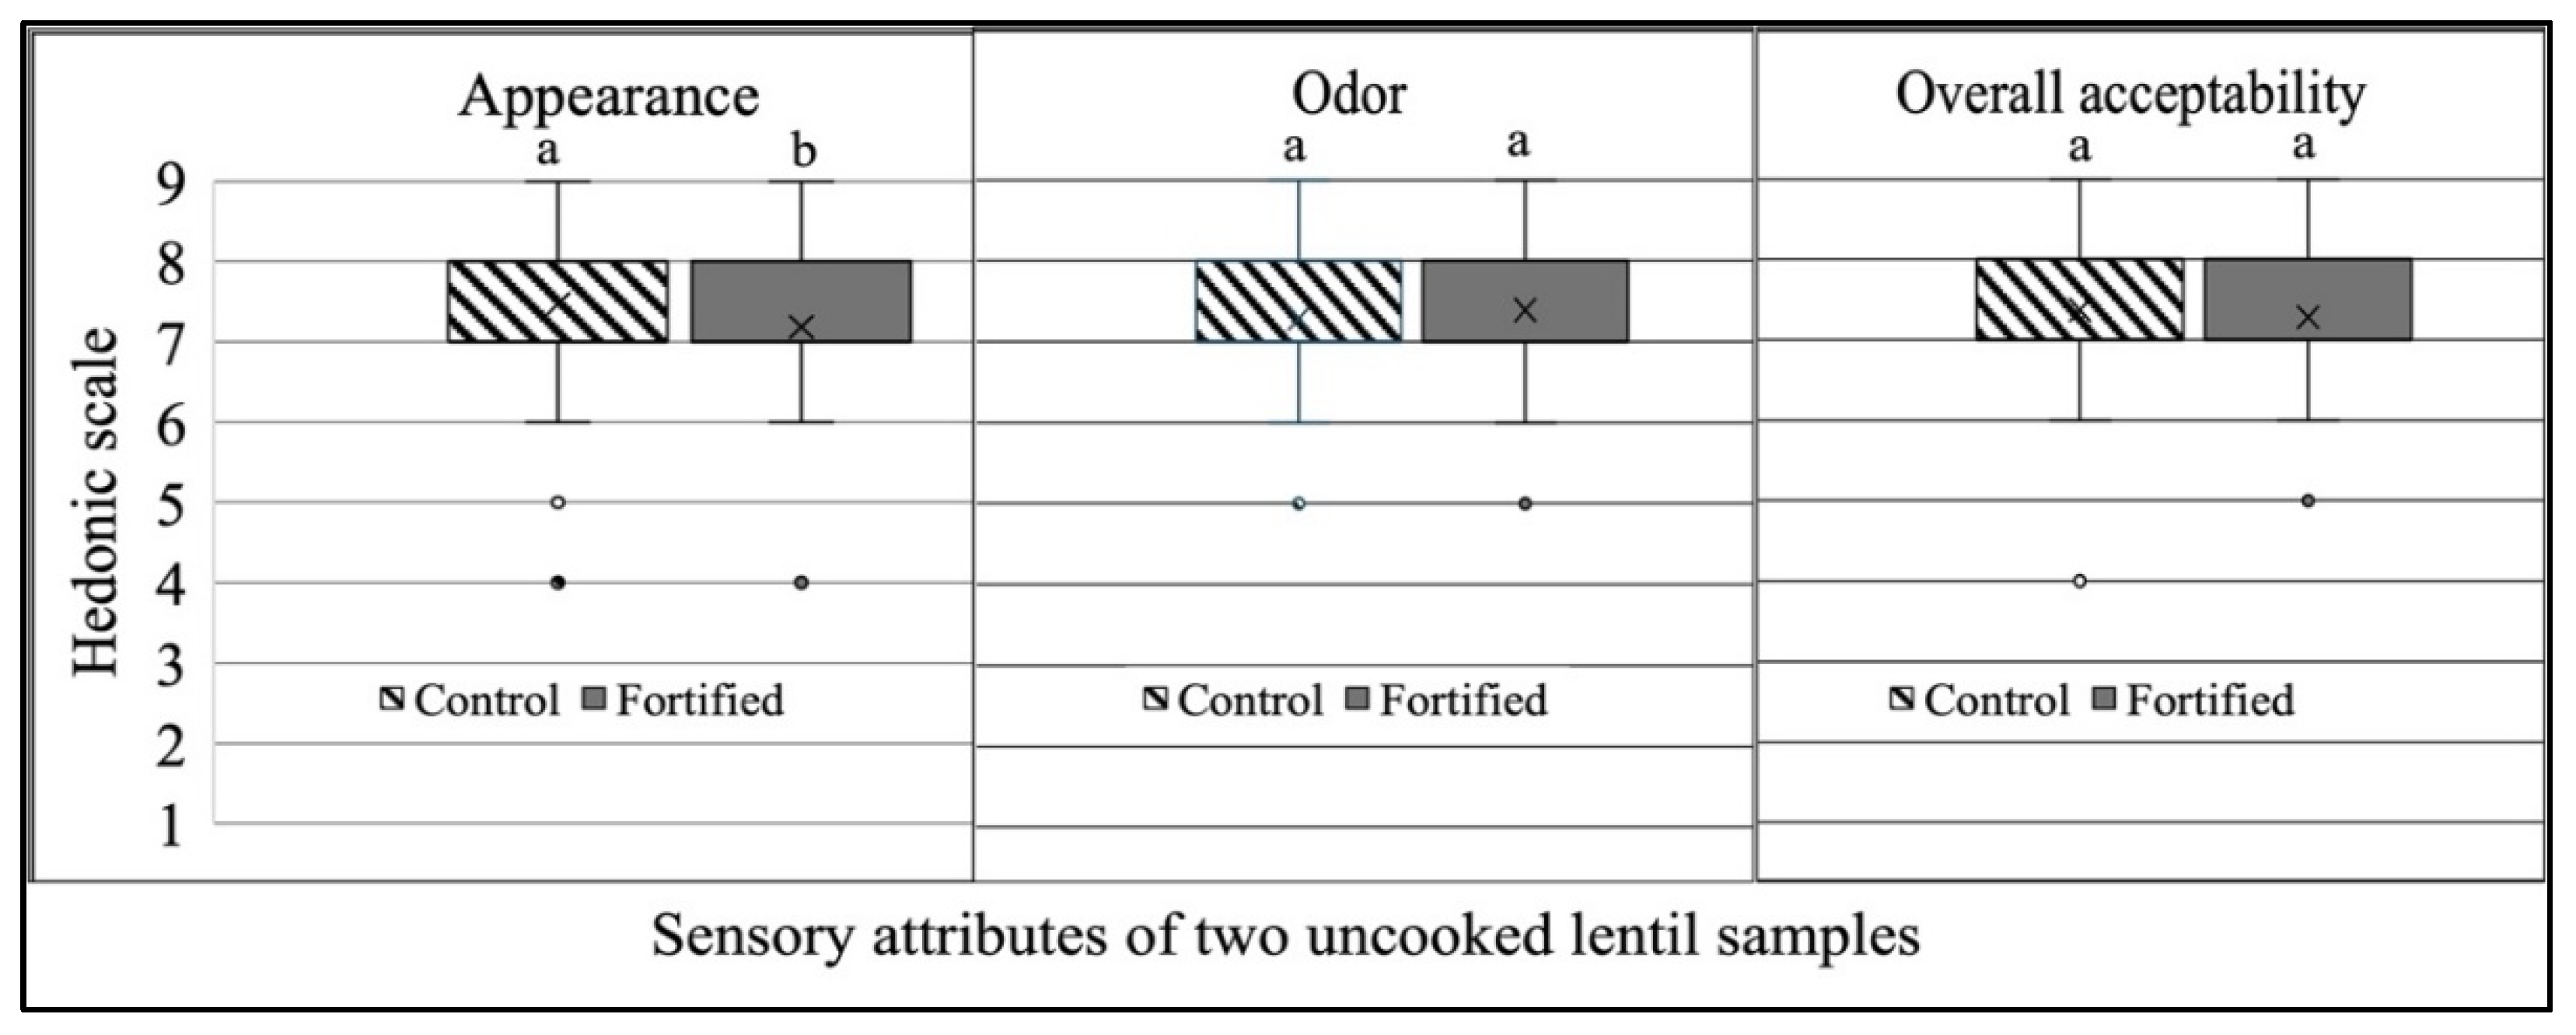
Figure 4.
Box plot analysis of hedonic scores (1 = dislike extremely, 9 = like extremely) obtained for two cooked lentil samples: an unfortified control lentil polished with 0.5% canola oil, and a multiple micronutrient fortified lentil. These samples were evaluated for appearance, odor, and overall acceptability by 150 panelists in Bangladesh. Different letters above the box plots indicate significant differences between the two samples for each attribute. Each box plot shows the data distribution for each sample type separately, based on a five-number summary: minimum, first quartile (Q1), median, third quartile (Q3), and maximum.
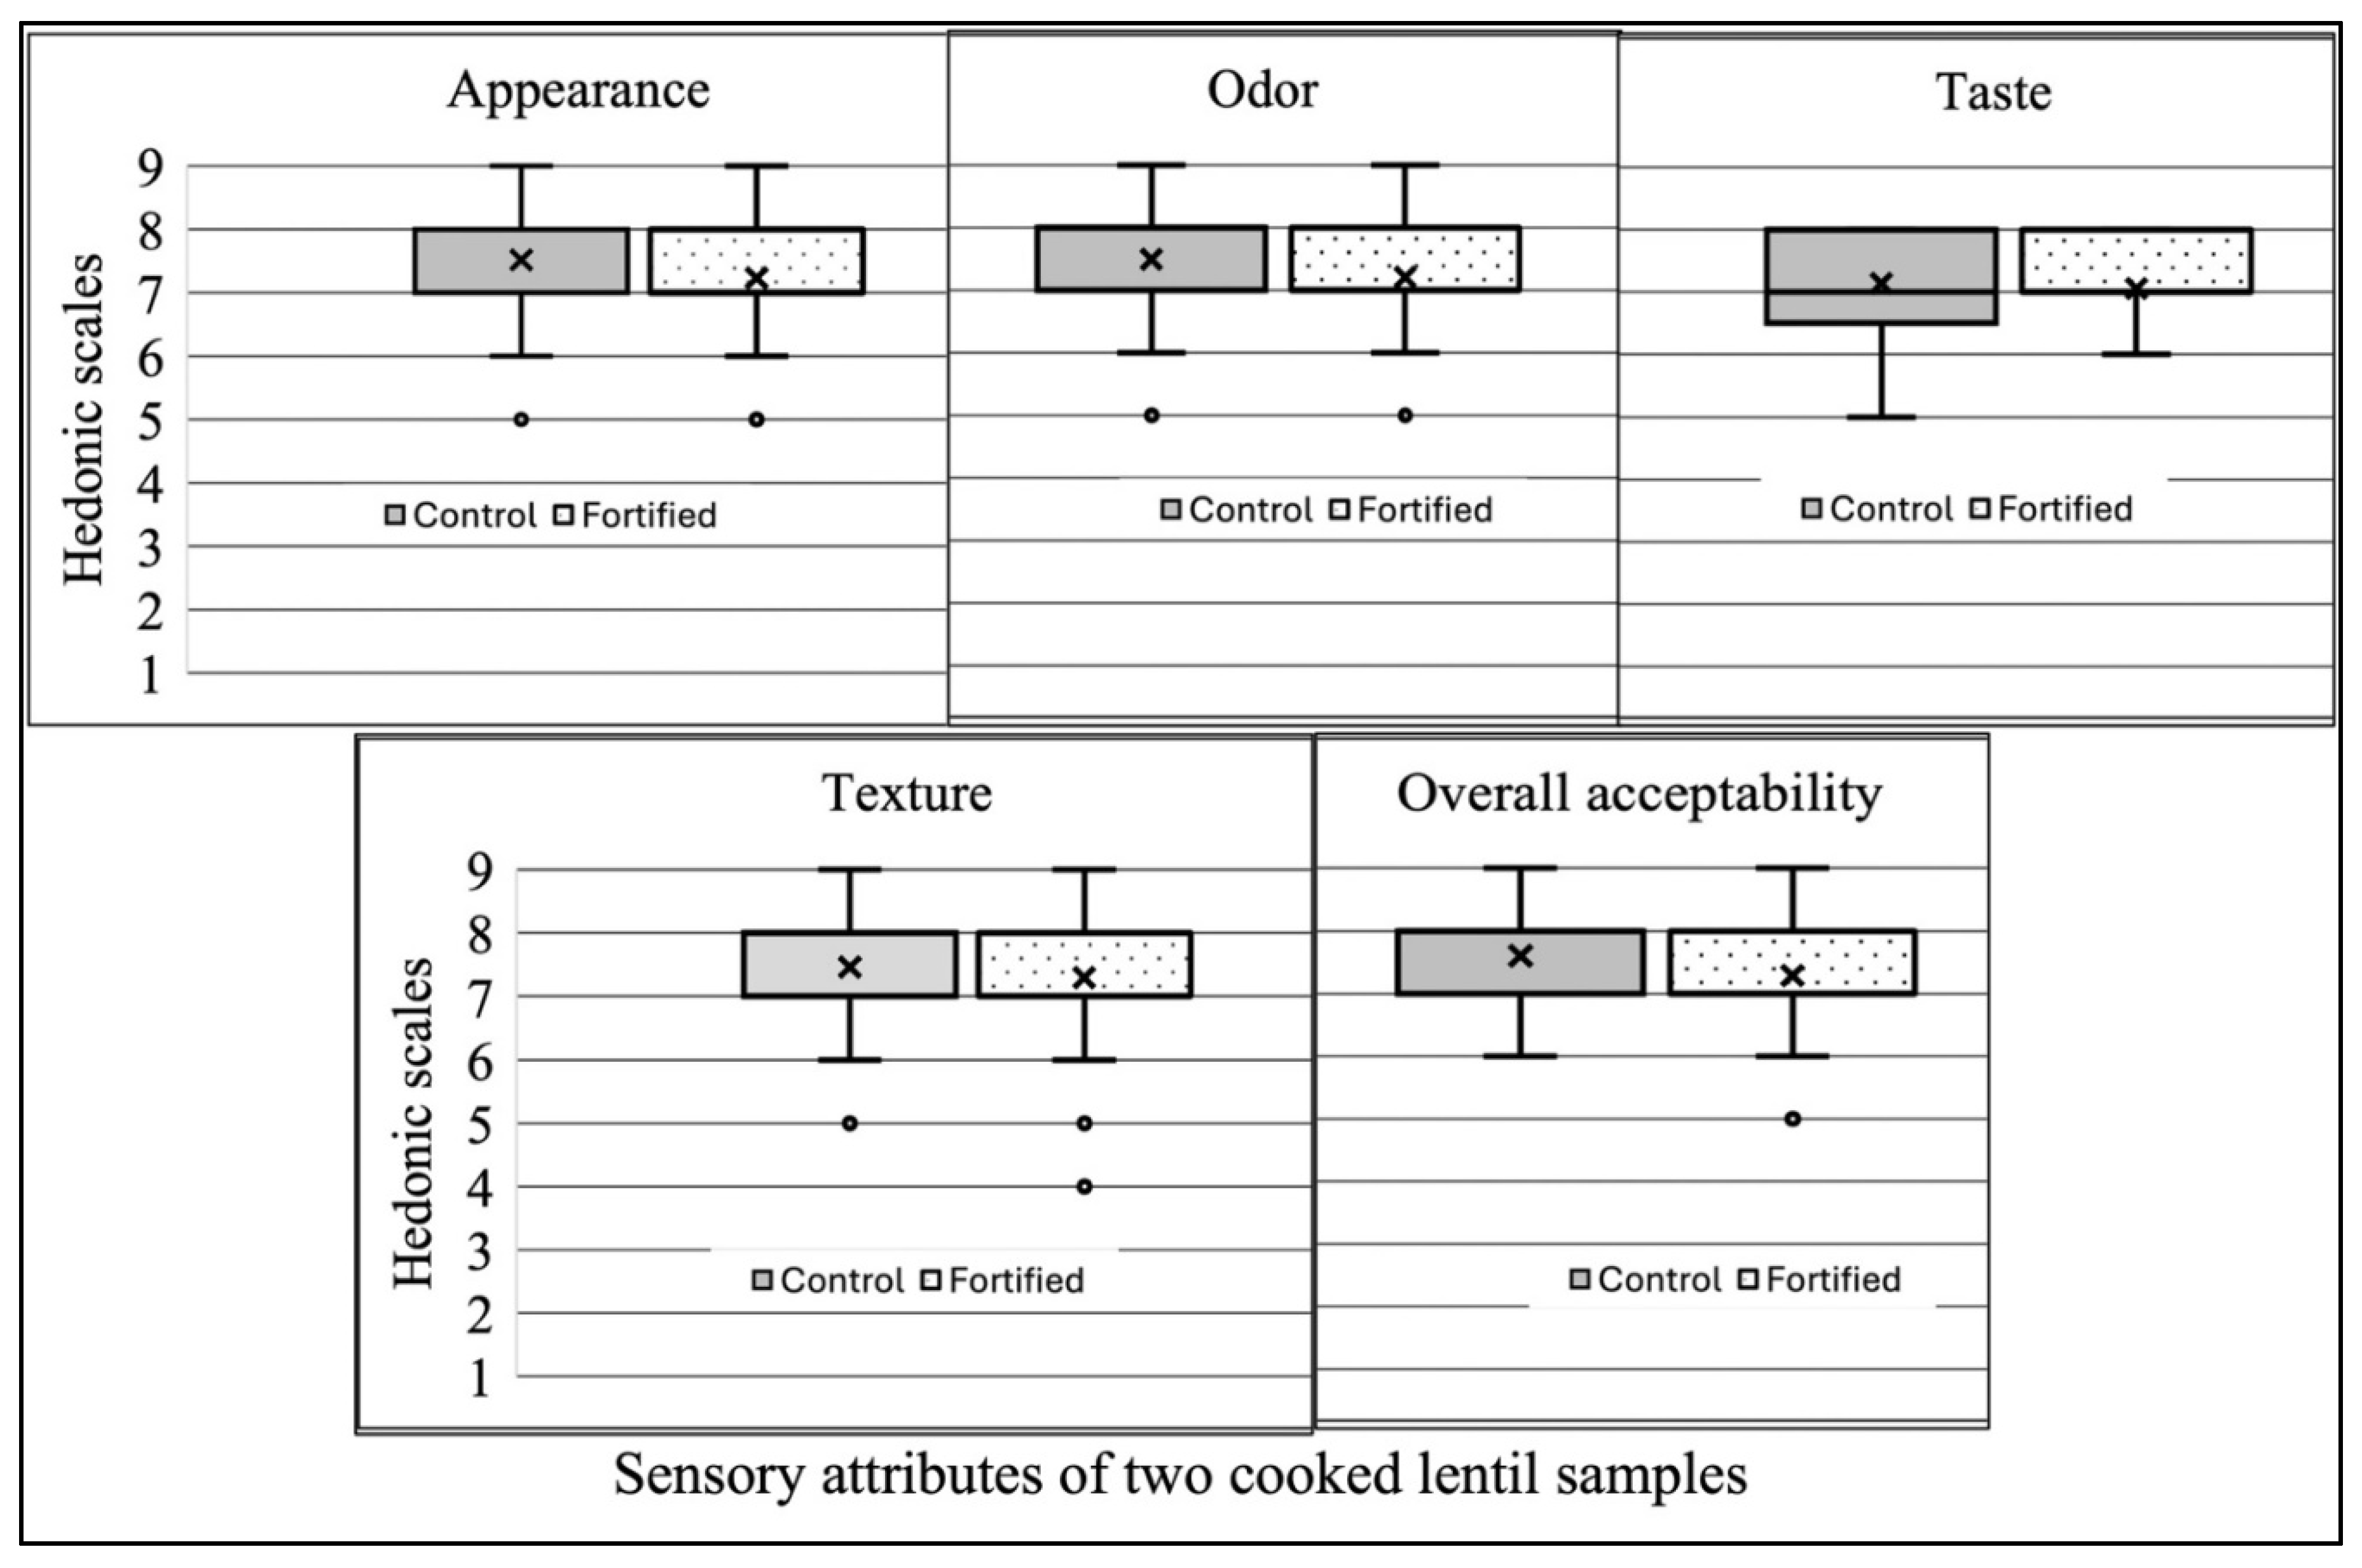

Table 1.
Socio-demographic characteristics of participants involved in the sensory evaluation study of multiple micronutrient fortified lentils conducted in Bangladesh.
Table 1.
Socio-demographic characteristics of participants involved in the sensory evaluation study of multiple micronutrient fortified lentils conducted in Bangladesh.
| Characteristics of the profile | Number (%) | |
|---|---|---|
| Biological sex |
Male | 76 (50.7) |
| Female | 74 (49.3) | |
| Age (years) |
16–25 | 32 (21.3) |
| 26–35 | 50 (33.3) | |
| 36–45 | 40 (26.7) | |
| 46–55 | 19 (12.7) | |
| 56–65 | 9 (6.0) | |
| Count of employed individuals within the household | 1–5 | 114 (76.0) |
| 6–10 | 34 (22.7) | |
| ≥11 | 2 (1.3) | |
| Aggregate monthly earnings from various sources (Bangladeshi Taka) | 5000–9999 (~ 90 to 120 USD) | 11 (7.4) |
| 10000–19999 (~ 121 to 240 USD) | 82 (55.0) | |
| 20000–29999 (~ 241 to 360 USD) | 28 (18.0) | |
| 30000–39999 (~ 361 to 480 USD) | 19 (12.8) | |
| ≥40000 (≥480 USD) | 9 (6.0) | |
| Education |
Illiterate | 2 (1.3) |
| Incomplete elementary (primary; grade 5) | 7 (4.7) | |
| Completed elementary | 65 (43.6) | |
| Passed Secondary School Certificate (grade 10) | 34 (22.8) | |
| Passed Higher Secondary Certificate (grade 12) | 41 (27.5) | |
Table 2.
Lentil consumption behaviors and trends among consumers.
| Observation | Consumer pulse purchases (g/family/week) |
Number of consumers (%) |
|---|---|---|
| Purchasing lentils by the consumers |
100–250 | 24 (16.0) |
| 251–500 | 86 (57.3) | |
| 501–750 | 13 (8.7) | |
| 751–1000 | 18 (12.0) | |
| ≥1001 | 9 (6.0) | |
| Other pulse (chickpeas, mung beans, black gram, field peas, etc.) purchases by the consumers |
100–250 | 77 (51.3) |
| 251–500 | 56 (37.3) | |
| 501–750 | 5 (3.3) | |
| 751–1000 | 3 (2.0) | |
| ≥1001 | 9 (6.0) | |
| Lentil purchase source |
Retail shops | 141 (94.0) |
| Wholesale | 8 (5.3) | |
| Do not buy or produce | 1 (0.7) | |
| Frequency of lentil purchase |
Several days in a week | 7 (7.4) |
| Weekly | 11 (7.3) | |
| Fortnightly | 4 (2.7) | |
| Monthly | 128 (85.3) | |
| Lentil product preference market |
Dehulled football | 143 (95.3) |
| Dehulled split | 7 (4.7) |
Table 3.
Lightness (L*), redness (a*), and yellowness (b*) scores of unfortified and fortified lentil samples prepared using multiple micronutrients.
Table 3.
Lightness (L*), redness (a*), and yellowness (b*) scores of unfortified and fortified lentil samples prepared using multiple micronutrients.
| Samples | CIELAB color score [Mean (CI 95%)] a | |
|---|---|---|
| Lightness (L*) | ||
| Unfortified | 55.62 ± 0.50 a | |
| Fortified | 58.07 ± 0.23 b | |
| Redness (a*) | ||
| Unfortified | 34.62 ± 0.16 a | |
| Fortified | 33.65 ± 0.35 a | |
| Yellowness (b*) | ||
| Unfortified | 40.56 ± 0.34 a | |
| Fortified | 40.39 ± 0.39 a | |
a Mean score (CI 95%) for lightness (L*), redness (a*) and yellowness (b*) score followed by different Roman letters within columns are significantly different (P<0.001). Different Roman letters in second brackets within each row are significantly different (P<0.001).
Table 4.
Correlation coefficients between the colorimetric data (lightness (L*), redness (a*), and yellowness (b*)) obtained from HunterLab and sensory acceptability scores from Bangladeshi consumers were analyzed for two attributes (appearance and overall acceptability) of three uncooked lentil types (red football, red split, and yellow split). All correlation coefficients were found to be significant at p < 0.0001.
| Sensory Attributes | L, a*, and b* scores obtained from HunterLab | ||
|---|---|---|---|
| L | a* | b* | |
| Appearance (n = 3) | -0.98 | 0.96 | 0.95 |
| Overall acceptability (n = 3) | -0.98 | 0.97 | 0.96 |
L*, Lightness; a*, redness; b*, yellowness.
Table 5.
Internal consistency reliability (Cronbach’s Alpha) of sensory panelists’ ratings for uncooked and cooked control and fortified lentils.
Table 5.
Internal consistency reliability (Cronbach’s Alpha) of sensory panelists’ ratings for uncooked and cooked control and fortified lentils.
| Samples | CA Score | ||
|---|---|---|---|
| Uncooked | Control/unfortified | 0.75 | |
| Fortified | 0.68 | ||
| Mean value for all uncooked samples | 0.71 | ||
| Cooked | Control/unfortified | 0.79 | |
| Fortified | 0.79 | ||
| Mean value for all cooked samples | 0.79 | ||
Disclaimer/Publisher’s Note: The statements, opinions and data contained in all publications are solely those of the individual author(s) and contributor(s) and not of MDPI and/or the editor(s). MDPI and/or the editor(s) disclaim responsibility for any injury to people or property resulting from any ideas, methods, instructions or products referred to in the content. |
© 2024 by the authors. Licensee MDPI, Basel, Switzerland. This article is an open access article distributed under the terms and conditions of the Creative Commons Attribution (CC BY) license (http://creativecommons.org/licenses/by/4.0/).
Copyright: This open access article is published under a Creative Commons CC BY 4.0 license, which permit the free download, distribution, and reuse, provided that the author and preprint are cited in any reuse.


