
Submitted:
02 November 2024
Posted:
05 November 2024
You are already at the latest version
Abstract
The escalating issue of phenol dye-containing wastewater necessitates the development of efficient and sustainable treatment methods. In this context, we present a novel composite photocatalyst comprising ZnFe2O4 (ZFO) nanoparticles supported on nanocellulose(NC), aimed at addressing this environmental challenge. The synthesis involved a facile hydrothermal method followed by impregnation of ZFO nanoparticles onto the NC matrix. ZFO, as a weakly magnetic semiconductor catalytic material, was utilized in photocatalytic experiments under magnetic field conditions. By controlling the electron spin states through the magnetic field, electron-hole recombination was suppressed, resulting in improved photocatalytic performance.The resultant composite exhibited remarkable photocatalytic activity under visible light irradiation, owing to the synergistic effect between ZFO nanoparticles and NC. Through systematic evaluation, we demonstrated the high efficiency and stability of the composite photocatalyst in degrading phenol dye pollutants in aqueous solutions. Furthermore, the composite material exhibited promising recyclability, retaining its activity even after multiple usage cycles. This study underscores the potential of the ZFO/NC composite for sustainable wastewater treatment, offering a promising avenue for environmental remediation.
Keywords:
ZnFe2O4
; nanocellulose
; photocatalyst
; phenol
1. Introduction
Phenol dye-containing wastewater poses a significant environmental challenge due to its harmful effects on ecosystems and human health. The discharge of untreated wastewater containing phenol dyes can lead to water pollution, disrupting aquatic life and endangering public well-being[1]. In response to this pressing issue, researchers have been exploring innovative and sustainable approaches for the efficient removal of phenol dyes from wastewater.
Conventional wastewater treatment methods often struggle to efficiently remove phenol dyes, leading to the need for advanced treatment technologies. Among these, photocatalysis has emerged as a promising approach due to its ability to harness light energy to degrade organic pollutants[2].
In recent years, composite photocatalysts have gained attention for their potential to enhance the photocatalytic performance and stability of semiconductor materials. ZnFe2O4(ZFO), characterized by its weak magnetic properties and semiconductor nature, has shown promise as an effective photocatalyst for pollutant degradation[3,4,5]. Additionally, nanocellulose(NC), derived from renewable biomass sources, has emerged as an environmentally friendly support matrix for photocatalytic nanoparticles, offering advantages such as high surface area, biodegradability, and low cost[6,7,8,9].
This study aims to investigate the effectiveness of a composite photocatalyst incorporating ZFO nanoparticles supported on nanocellulose for the sustainable removal of phenol dye-containing wastewater. By integrating ZFO nanoparticles onto the NC matrix, we anticipate synergistic effects that will enhance the photocatalytic activity and stability of the composite material. Furthermore, the utilization of ZFO/NC composite photocatalysts aligns with the principles of green chemistry, offering a promising solution for the remediation of phenol dye pollutants in wastewater.
In this paper, we present the synthesis and characterization of the ZFO/NC composite photocatalyst, followed by an evaluation of its photocatalytic performance for phenol dye degradation. The findings of this study contribute to the advancement of sustainable wastewater treatment technologies, with potential applications in mitigating environmental pollution and safeguarding water quality.
2. Materials and Method
2.1. Materials
Nanocellulose ( diameter:4–10 nm, length: 200 nm),Zinc chloride (ZnCl2), iron(III) chloride (FeCl3) and sodium hydroxide (NaOH) were procured from Macklin. All the chemicals utilized were of high analytical quality ; no additional purification procedures were conducted.
2.2. Methods
2.2.1. Preparation of ZFO/NC Nanocomposite
Prepare a 0.1 M FeCl3 solution by dissolving FeCl3·6H2O in deionized water. Similarly, create a 4.4 M NaOH solution by dissolving NaOH in deionized water. Subsequently, introduce 0.34 g, 1.01 g, and 1.68 g of NC into the FeCl3 solution, which has a volume of 70 mL, and also add 0.1 M ZnCl2 to it. Mix the solution thoroughly for 30 minutes. Gradually add 10 mL of the prepared NaOH solution to the mixture while stirring. Continue stirring for another 30 minutes. Once the reaction is completed, transfer the suspension to a high-pressure vessel lined with 100 mL of Teflon. Heat the vessel at 200°C for an overnight period. Afterward, rinse the product with water and allow it to dry to obtain the synthesized compound.
2.2.2. Instrumentations and Characterizations
Characterization of the surface morphology and elemental composition was conducted with a Scanning Electron Microscope (SEM, model JEOL JSM-6510 LV) and Energy Dispersive Spectroscopy (EDS), respectively. To facilitate analysis, a thin layer of gold was sputter-coated onto the samples using a JEOL JFC 1200 FINE COATER. Fourier Transform Infrared Spectroscopy (FT-IR) was performed at ambient temperature with a VERTEX 70 V instrument in the Attenuated Total Reflectance (ATR) mode, scanning the range of 4000 to 400 cm−1. X-ray Diffraction (XRD) analysis was conducted using an XPERT PRO - PAN Analytical system. Transmission Electron Microscopy (TEM) images were captured on a JEOL GEM-1010 microscope at an accelerating voltage of 76 kV. X-ray Photoelectron Spectroscopy (XPS) was employed with an ESCALAB 250XI+ instrument from Thermo Scientific (K-ALPHA, UK), using Al Kα radiation at an energy of 1486.6 eV. The analysis parameters were set at a spot size of 500 μm, with energy resolution calibrated against the Ag3d5/2 and C1s lines at 0.45 eV and 0.82 eV, respectively, and under a vacuum of 10–8 mbar. The full spectrum had a pass energy of 50 eV, while the narrow spectrum used a pass energy of 20 eV. The data processing was conducted using Casa XPS software and MultiPak software.
2.2.3. Photodegradation Measurements
To mimic organic wastewater, a phenol solution with a concentration of 15 mg/L was prepared. Subsequently, 125 mL of this phenol solution, 0.18 g of the catalyst ZFO/NC, and 15 µL of hydrogen peroxide were combined. The pH of the mixture was then adjusted to 7. A custom-made photocatalytic reactor equipped with magnets was employed to initiate the photocatalytic reaction. The reaction was allowed to proceed for 60 minutes. Following the reaction, a sample was taken, which was then subjected to 8 minutes of centrifugation at high speed. The supernatant from the centrifuge tube was aspirated, and the filtrate was filtered. The concentration of phenol in the solution was determined using a UV-Vis spectrophotometer. Finally, the degradation rate of phenol was calculated based on the absorbance readings before and after the reaction. For the photo-degradation experiment, a double-beaker setup was used, and the temperature was maintained constant with a circulating water bath. To achieve adsorption/desorption equilibrium in the dark, a stirring period of 60 minutes was required. The photodegradation activity was characterized using the following equation:
where A is the absorbency of phenol, and C is the concentration of collected supernatant at a certain time interval.
D = (C0 −
C)/C0 × 100% = (A0 − A)/A0 × 100%
3. Results and Discussion
3.1. XRD
Figure 1 illustrates the X-ray diffraction (XRD) patterns for NC, ZFO, and the hybrid nanocomposites containing varying amounts of ZFO (0.1, 0.3, and 0.5 g by weight). The peaks in these patterns were distinct and aligned closely with the reference cards JCPDS no. 00-050-2241 and JCPDS no. 22-1012, signifying the crystalline nature of the original nanocellulose and the spinel cubic structure of the pure ZFO nanoparticles. The XRD pattern revealed peaks at approximately 2θ = 17.69°(101), 22.08°(002), and 34.51°(040), indicative of a typical cellulose structure. The corresponding scan data for ZFO demonstrated the formation of well-defined ZFO nanoparticles, as confirmed by JCPDS card no. 22-1012. The diffraction peaks at 29.9, 35.3, 42.8, 53.1, 56.6, and 62.2° were attributed to the (220), (311), (400), (422), (511), and (440) crystal planes, respectively. No additional peaks indicative of impurities were detected, thus verifying the sample's purity. In the XRD pattern of the nanocomposites, besides the characteristic peaks of NC at 2θ = 22.85° (002), there were also diffraction peaks that aligned with the standard ZFO pattern. With an increase in the amount of zinc ferrite, the intensity of the peaks corresponding to ZFO increased, while the intensity of the peaks associated with nanocellulose decreased, as depicted in Figure 1.
3.2. FT-IR
The FT-IR spectra of ZFO, NC and ZFO/NC are given in Fig. 2.The peak corresponding to the Zn-O bond (569 cm-1) can be assigned to the intrinsic lattice vibration in the spectrum of ZFO[10]. The absorption bands at 1637 cm-1 and 3398 cm-1 can be respectively attributed to water deformation vibrations and -OH vibration modes [11].The NC absorption peak observed at 1110 cm-1 derived from C–O–C pyranose ring vibration fot he curves of NC and ZFO/NC[12]. While, after doping, the absorption spectrum undergoes a red shift, possibly due to changes in molecular structure and the influence of lattice vibrations.
3.3. UV-vis
The optical characteristics of the relevant materials were evaluated using UV-vis spectroscopy within the wavelength range of 250 to 800 nm. The absorption spectra for the untreated ZFO, NC, and the ZFO/NC composite are illustrated in Figure 3(a). The highest absorption peak for ZFO occurred at 415 nm. The energy band gap (Eg) of each material was determined by applying Tauc's equation, and the resulting graphs of (ahυ)² versus (hυ) are shown in Figure 3(b). The calculated Eg values were found to be 1.58, 1.83, and 1.74 eV for NC, ZFO, and ZFO-NC, respectively. The incorporation of impurity elements led to lattice strain within the crystal structure, which could be a result of changes in the energy band structure of the doped samples[13].
3.4. XPS
XPS analysis was used to understand the development of additional ZFO/NC. The surface content and valence states of the produced composites are shown in Fig. 4. XPS analysis indicates the origin of component elements with a favourable reaction. The Fe 2p3/2 and Fe 2p1/2 peaks in Fig. 4(a) were located at binding energies of 711.1 and 725.2 eV[14,15], respectively, where the binding energies had a upshift than that of Fe 2p in ZFO. It may be attributed to the migration of the electron from ZFO to NC[16], which can provide definite evidence for charge transport of ZFO/NC heterojunction. For ZFO/NC, the peak between 725.8 and 713.5 eV was a satellite peak, which is characteristic of Fe3+. For Zn 2p spectra, 1023.3 and 1045.0 eV peaks were assigned to Zn 2p3/2 and Zn 2p1/2 for ZFO/NC, which are characteristic of Zn2+ [17,18]. Zn 2p peaks of ZFO/NC also showed a slight upshift compared to that of pure ZFO, which further provides the evidence for the electron transfer from ZFO to NC. Fig. 4(c) shows the XPS O 1s spectra of ZFO and ZFO/NC, and O 1s peak of ZFO/NC also showed a slight upshift compared to that of pure ZFO. The survey spectrum of NC shows three splitting peaks for C1s at 285.99 eV, 284.39 eV and 286.66 eV related to C-OH, C (- C, H) and O-C-O respectively[19].
3.5. TEM and SEM
TEM is the most effective used tool for understanding the morphological structure as well as size of the prepared nanostructures. TEM image (Fig. 5a) revealed that, NC was poly-disperse and smooth rod shapes with average length of 95 nm, average diameter of 15 nm and surface charge are 0.01 mmol/gm. On the other hand, ZFO nanocomposites are formed at different shapes as hexagonal, spherical and cluster or star like with average size range of 45–150 nm. As seen in Fig. 5b, there is a good incorporation between ZFO and the rod-like NC to form hybrid ZFO/NC with average size of 37–88 nm with numerous shapes which depending on the components were found. It was observed that, the mean particle size of ZFO/NC and NC composites were found to be 85 and 30−50 nm with cloud-like and rode structures respectively[20,21].
The surfaces of NC and ZFO/NC were investigated using SEM micrographs at high resolution (Fig. 5c–d). As obvious from Fig. 5c, NC appeared as rod-like structure, while, ZFO/NC exhibited an irregular forms which agglomerated to cluster structures (Fig. 2d). Upon being dispersed on cellulose matrix (Fig. 2d) to form ZFO/NC nanocomposites, the same shapes of ZFO were observed.
The samples were subsequently analyzed with energy-dispersive X-ray spectroscopy(EDX) to assess the ratio of divalent cations within the nanoparticles, providing further confirmation of the presence of mixed ferrites. The elemental makeup of the pristine nanocellulose and the bare ZnFe2O4 is depicted in Figure 6a. The analysis showed that NC contained carbon, oxygen, hydrogen, and trace amounts of impurities, which were likely derived from sodium hydroxide used in the production process. Figure 6a also confirms the purity of ZFO, as evidenced by the presence of zinc, iron, and oxygen elements, which corresponded closely to the expected theoretical percentages(Fe: 46.33%, Zn: 27.12%, and O:26.55%). The hybrid nanocomposites exhibited material compositions that closely matched the intended ratios, as illustrated in Figure 6b. While minor discrepancies might be attributed to technical inaccuracies, the overall results suggest the successful creation of tertiary ferrites with a precisely defined composition.
3.6. Photocatalytic Properties
To study the effect of magnetic field on photodegradation performance, a photocatalyst ZFO/NC with different ZFO content was used as a model. As can be seen in Fig. 7(a-b), 0.1ZFO/NC, 0.3ZFO/NC and 0.5ZFO/NC show significant improvement compared to ZFO and NC. Among them, 0.3ZFO/NC exhibits the best degradation performance in the absence of a magnetic field. However, after placing magnets near the photocatalytic reaction system, the reaction efficiency of the 0.5ZFO/NC photocatalyst is greater than that of the 0.3ZFO/NC after placing a magnet near the photocatalytic reaction system, as shown in Fig. 7(b). In order to visually compare the promotion of photocatalytic degradation of phenol by magnetic fields, Fig. 7(c) depicts the comparison of photocatalytic reaction efficiency without and with magnetic fields. All data were fitted with pseudo-primary kinetics and followed the formula -ln(Ct/C0) = kt. It can be seen that the photodegradation k value of ZFO to phenol is the same with or without an external magnetic field, indicating that the presence of a magnetic field has no effect on NC degradation of phenol. However, the k-values for the degradation of phenol by xZFO/NC were 0.007, 0.009 min-1 (x=0.1), 0.012, 0.014 min-1 (x=0.3) and 0.011, 0.015 min-1 (x=0.5), respectively, before and after magnetic field placement. The results show that the ZFO/NC photocatalyst exhibits electron spin polarization, which can be controlled by the external magnetic field, and the photocatalytic efficiency is improved to varying degrees after the addition of magnetic field. The comparison of the efficiency improvement of ZFO/NC photocatalytic degradation of phenol is shown in Fig. 7(d). Among all these ZFO/NC samples, the degradation efficiency of phenol was increased by about 35% with the addition of a magnetic field at 0.5ZFO/NC. These results showed that the photocatalytic degradation efficiency increased with the increase of ZFO doping concentration, and showed the strongest improvement at x=0.5.
The sustainability and stability of photocatalysts play a crucial role in practical applications. In order to achieve the purpose of economy and environmental protection, the photocatalytic activity of the photocatalyst is usually required to remain unchanged as much as possible after multiple degradation cycles. To test the sustainability and stability of 0.5 ZFO/NC, cyclic degradation experiments were performed under a magnetic field using 0.5 ZFO/NC as a photocatalyst. As shown in Fig. 8, each degradation was performed under the same conditions, indicating that the photodegradation performance of 0.5 ZFO/NC in the magnetic field did not decrease significantly after three reaction cycles.
3.7. Photogenerated Carrier Dynamics Analysis
Photocurrent responses can be used to determine the separation and transfer kinetics of photogenerated carriers during photocatalytic processes[22,23,24]. In this study, during photocurrent measurements, a magnetic field was applied to the photoelectrodes to analyze its effect on the photocatalytic performance. Fig. 9a shows the photocurrent density-time curves of 0.5ZFO/NC in the absence of magnetic field and in the presence of magnetic field. The photocurrent density increased sharply when the visible light was turned on, and then rapidly returned to zero immediately after the light was turned off. Upon the application of the magnetic field, the photocurrent density of 0.5ZFO/NC increased to 4.3 μA/cm2 , which was higher than the photocurrent density without a magnetic field. According to these experimental results, the magnetic field plays a significant role in enhancing the photocatalytic activity of ZFO/NC, i.e., the separation and transfer of photo generated carriers can be quicker with the help of a magnetic field.
In addition, the transport capacity of the carriers was evaluated by employing an EIS electrochemical impedance test. Electrochemical impedance is a commonly used electrochemical characterization method to measure the change of material impedance by giving a fixed sine wave frequency, and to analyze and study the electrode dynamics of the surface of photocatalytic materials. In general, the smaller the arc radius of the EIS, the better the carrier capacity. As shown in Fig. 9b , the arc radius of 0.5 ZFO/NC under the action of a magnetic field is the smallest, indicating that the carrier transport capacity is the best. This result is consistent with the conclusions of the photocurrent and degradation experiments.
3.8. Photocatalytic Mechanism
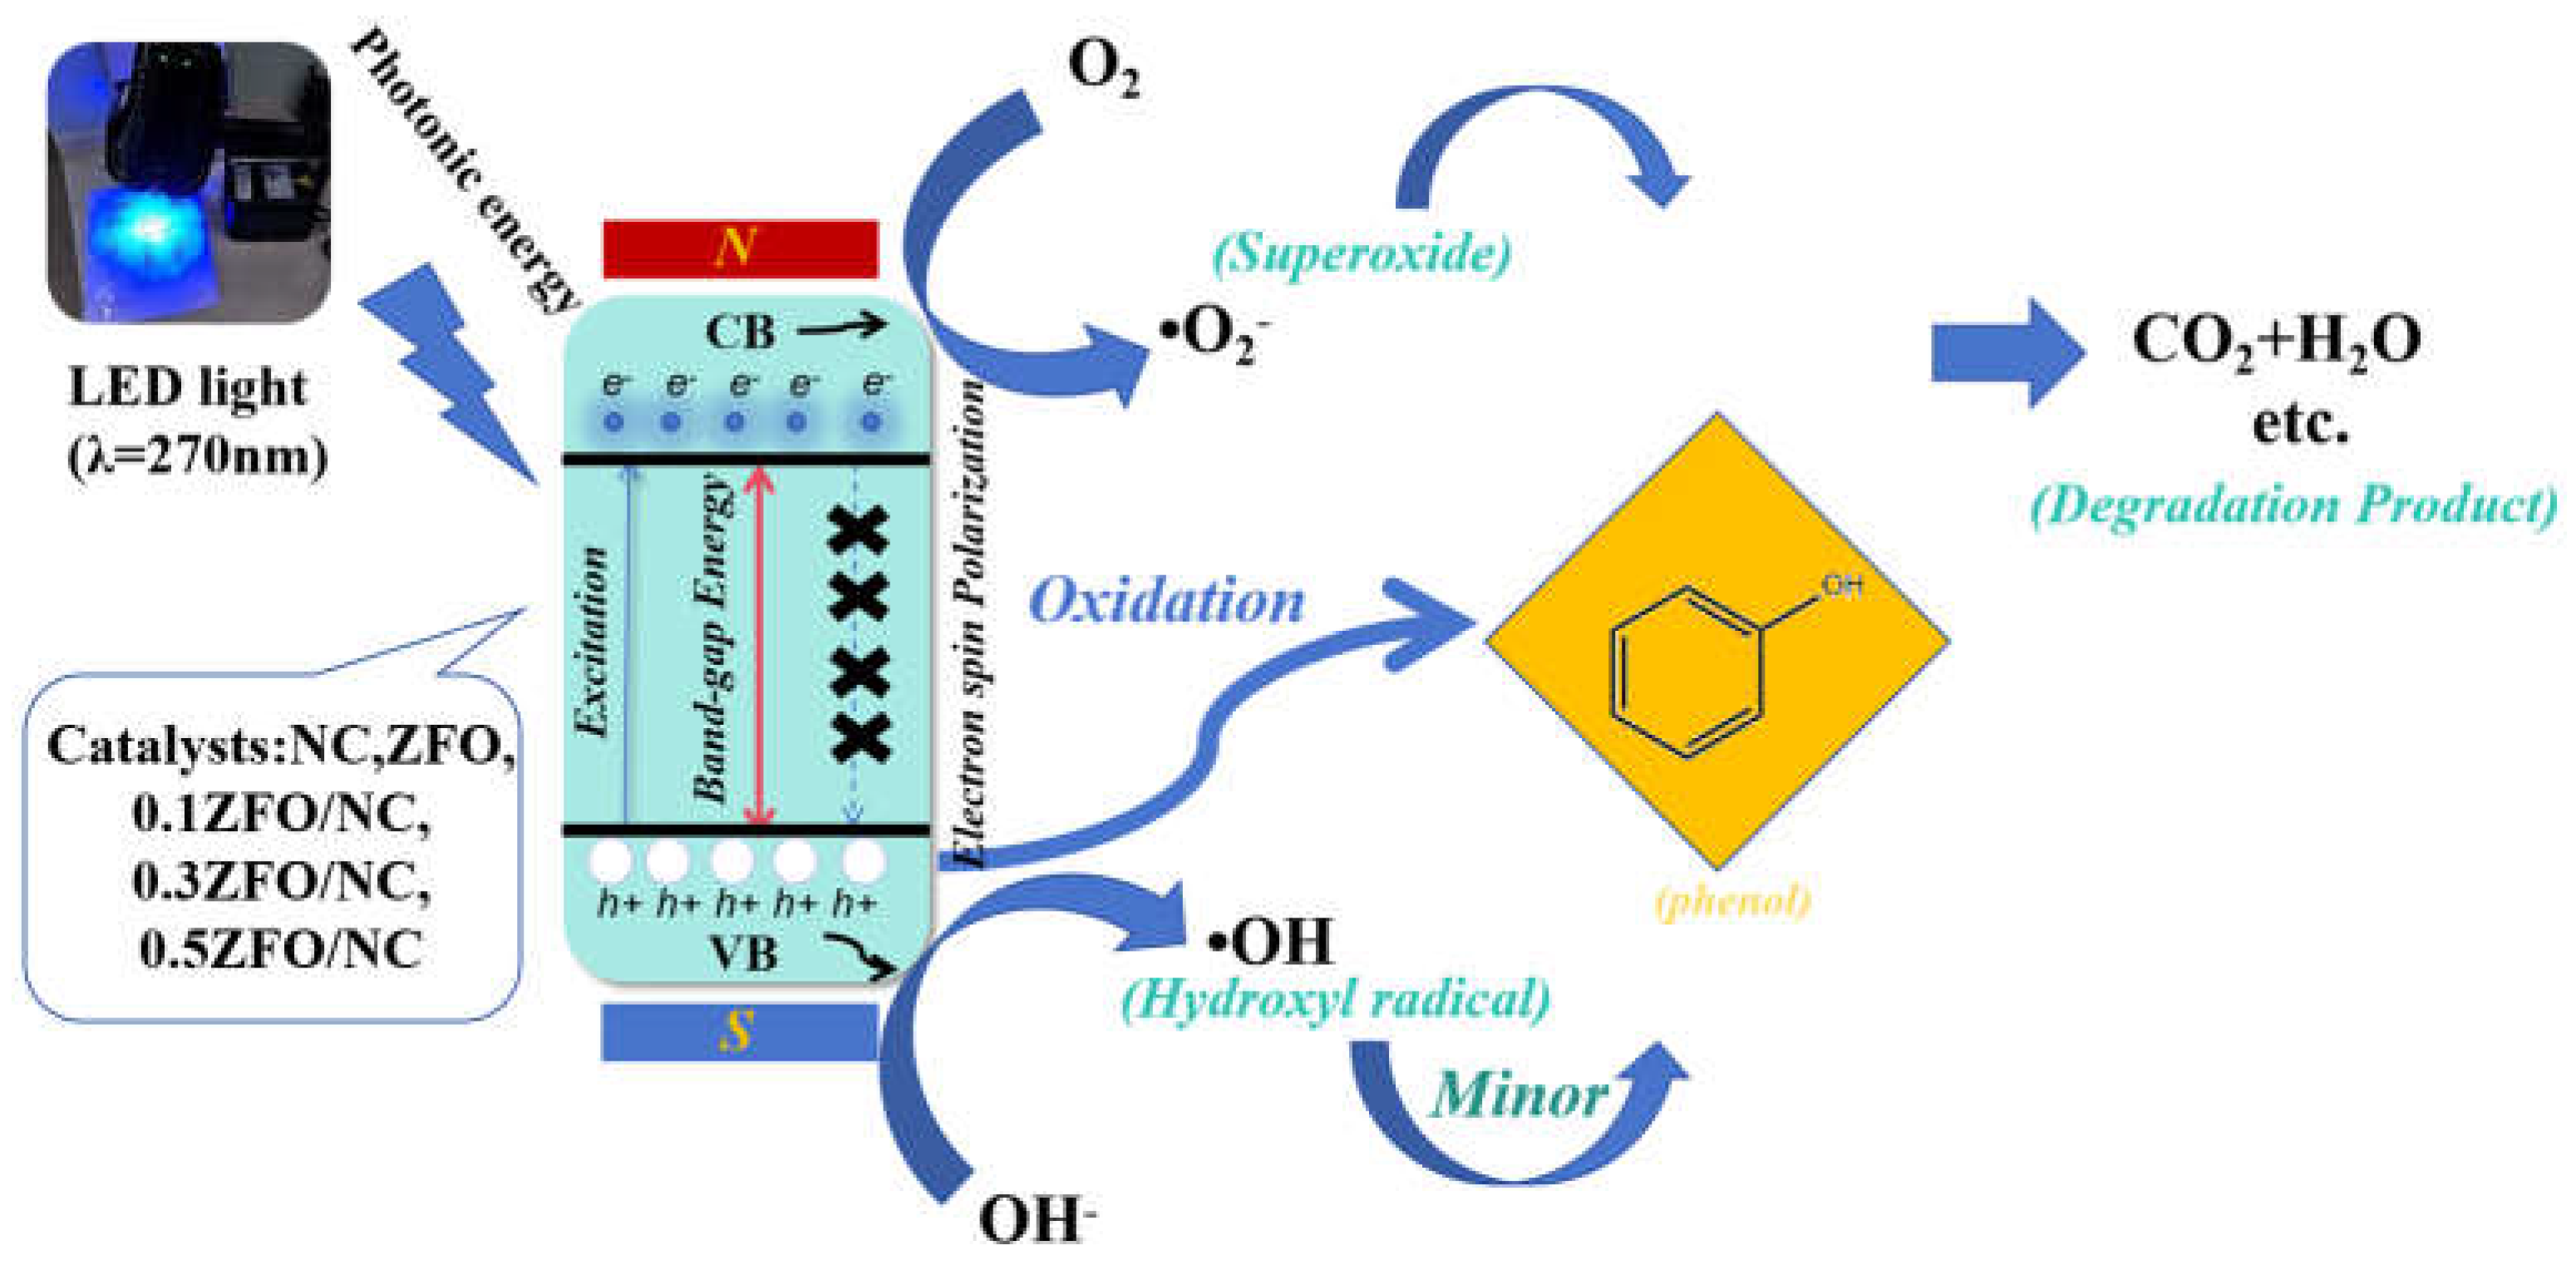
A schematic of the mechanism of visible-light photocatalytic degradation of phenol by the doped ZFO/NC nanocomposites is shown in Fig. 10. Blue light incident on the scaffolds induces the generation of electrons (e−) and holes (h+), which then migrate to the CB and VB, respectively. The photocatalytic degradation process consists of two stages: separation and transfer of photogenerated carriers. In the first stage, electrons are excited to the conduction band under the irradiation of light. However, there is a possibility that photogenerated electrons and holes will reunite. Therefore, the density of photogenerated carriers actually participating in the reaction is limited, which is not conducive to the photocatalytic reaction. At this time, by introducing an external magnetic field, the Lorentz force generated by the magnetic field can drive the positively charged holes and negatively charged electrons to move in opposite directions according to the left manipulation, separating the electrons and holes, thereby inhibiting the recombination and increasing the number of free carriers. According to the left rule, the charged particles all experience the Lorentz force perpendicular to the direction of their motion, and the Lorentz force acting on the electrons and holes is in the opposite direction because the electrons have a negative charge and the holes have a positive charge. This effect causes electrons to move in one direction, holes to move in the opposite direction, and increases the density of carriers involved in the reaction. However, during stirring, the direction of the Lorentz force is constantly changing, resulting in longer transport paths for the separated electrons and holes and a higher probability of recombination. Therefore, in the second stage, the introduction of NC establishes a directional transfer path for the separated holes, so that the holes are attracted to NC, which further inhibits the recombination of electrons and holes. In addition, NC also provides a number of active centers that favor redox reactions, further improving the efficiency of photodegradation.
4. Conclusions
In the present study, we reported the fabrications of ZFO/NC nanocomposite and for the first time hybrid ZFO/NC nanocomposite through solvothermal method. The characterizations of the synthesized nanostructures were achieved via TEM, SEM-EDX, XRD, FT-IR, UV-vis, and XPS. The photo-degradation of phenol revealed the high efficacy of hybride ZFO/NC in dye removal as compared to pure NC and ZFO nanocomposites in the presence of the MF. The Lorentz force acting on the photocatalyst can inhibit the rapid recombination of carriers. In the absence of any energy input, the photocatalytic degradation performance of phenol was improved by about 27% by placing a magnet next to the reaction device. After the introduction of NC, the photocatalytic reaction.The efficiency was further improved by 30%, indicating that NC helps to transfer separated and accumulated holes. This work provides a new perspective for suppressing the recombination of photogenerated carriers and improving the photocatalytic efficiency through Lorentz force and NC.
Author Contributions
Conceptualization, W.R.J.; project administration,W.R.J.; methodology, Z.L.; data curation, Z.L.; writing—original draft, Z.L.; writing—review and editing, Z.L.;funding acquisition,W.R.J.and K.G..All authors have read and agreed to the published version of the manuscript.
Funding
This research was funded by National Natural Science Foundation of China (Grant No. 22378089) and Natural Science Foundation of Heilongjiang Province.
Acknowledgments
The authors acknowledge School of Food Engineering of Harbin University and Harbin Institute of Technology. Z.L. would like to thank to National Natural Science Foundation of China (Grant No. 22378089) and Natural Science Foundation of Heilongjiang Province.
Conflicts of Interest
The authors declare no conflict of interest.
References
- Liang, XH; Liu, JF; et al. Preparation of a recyclable and high-performance photocatalyst AgInS2/CN/PAN for RhB and phenol degradation. J. Environ. Chem. Eng 2023,11,109987. [CrossRef]
- Zheng, R; Yang, DH; et al. Fe2O3/TiO2/reduced graphene oxide-driven recycled visible-photocatalytic Fenton reactions to mineralize organic pollutants in a wide pH range. J. Environ. Sci. 2023, 134, 11-20. [CrossRef]
- Yao, YJ; Qin, JC; et al. One-pot approach for synthesis of N-sdoped TiO2/ZnFe2O4 hybrid as an efficient photocatalyst for degradation of aqueous organic pollutants.J. Hazard. Mater. 2015,291,28-37. [CrossRef]
- Behera, A; Kandi, D; et al. Construction of Isoenergetic Band Alignment between CdS QDs and CaFe2O4@ZnFe2O4 Heterojunction: A Promising Ternary Hybrid toward Norfloxacin Degradation and H2 Energy Production. J. Phys. Chem. C 2019, 123, 17112-17126. [CrossRef]
- Meena, R; Abdullah, Mahmood M. S.; et al. Green biochar-supported ZnFe2O4 composite photocatalyst derived from waste banana peel: A sustainable approach for highly efficient visible Light-driven degradation of organic pollutants in wastewater. Ionics 2024, 30, 5639-5650. [CrossRef]
- Dmitrenko, M; Kuzminova, A; et al. Edible Carrageenan Films Reinforced with Starch and Nanocellulose: Development and Characterization. Sustainability 2023, 15, 15817. [CrossRef]
- Su, NC; Basirun, AA; et al. Modified Nanocellulose-Based Adsorbent from Sago Waste for Diclofenac Removal. Sustainability 2023, 15, 5650. [CrossRef]
- Shak, KPY; Pang, YL; et al. Nanocellulose: Recent advances and its prospects in environmental remediation. Beilstein J. Nanotechnol.2018, 9, 2479-2498. [CrossRef]
- Jamal, N; Radhakrishnan, A; et al. Efficient photocatalytic degradation of organic dye from aqueous solutions over zinc oxide incorporated nanocellulose under visible light irradiation. Main Group Met. Chem. 2020, 43,84-91. [CrossRef]
- Lin H; Li S; Deng B; et al. Degradation of Bisphenol A by Activating Peroxymonosulfate with Mn0.6Zn0.4Fe2O4 Fabricated from Spent Zn-Mn Alkaline Batteries. Chem. Eng. J. 2019, 364, 541-551. [CrossRef]
- Zhai Z; Ren K; Zheng X; et al. Simultaneous Photocatalytic Tetracycline Oxidation and Chromate Reduction via a Jointed Synchronous Pathway upon Z-Scheme Bi12O17Cl2/AgBr: Insight into Intermediates and Mechanism. Environ. Sci.: Nano 2022, 9, 1780–1793. [CrossRef]
- Zhuang WX; Yao D; Li ML; et al. Synergistically enhanced water-resistive perovskite nanocrystals for cell nucleus imaging and acid phosphatase detection. Sens. Actuators, B 2024,416,136014. [CrossRef]
- Kim, HS., Park, NG. Importance of tailoring lattice strain in halide perovskite crystals. NPG Asia Mater. 2020,12,78. [CrossRef]
- X. Zhang; B. Lin; X. Li; et al. MOF-derived magnetically recoverable Z-scheme ZnFe2O4/Fe2O3 perforated nanotube for efficient photocatalytic ciprofloxacin removal. Chem. Eng. J. 2022,430,132728. [CrossRef]
- H. Lv; L. Ma; P. Zeng; et al. Synthesis of floriated ZnFe2O4 with porous nanorod structures and its photocatalytic hydrogen production under visible light, J. Mater. Chem. 2010,20,3665-3672. [CrossRef]
- Greczynski, G.; Haasch, R.T.; Hellgren, N; et al. X-ray photoelectron spectroscopy of thin films. Nat Rev Methods Primers 2023,3, 40. [CrossRef]
- J. Xiao; W. Yang; S. Gao; et al. Fabrication of ultrafine ZnFe2O4 nanoparticles for efficient photocatalytic reduction CO2 under visible light illumination. J. Mater. Sci. Technol. 2018,34,2331–2336. [CrossRef]
- P.-L. Liang; L.-Y. Yuan; H. Deng; et al. Photocatalytic reduction of uranium(VI) by magnetic ZnFe2O4 under visible light. Appl. Catal. B 2020,267, 118688. [CrossRef]
- Zhang, H.; Hu, J.; Li, M.; et al. Highly efficient toluene gas sensor based on spinel structured hollow urchin-like core-shell ZnFe2O4 spheres. Sens. Actuators, B 2021, 349,130734. [CrossRef]
- Lefatshe, K.; Muiva, C. M.; Kebaabetswe, L. P. Extraction of nanocellulose and in-situ casting of ZnO/cellulose nanocomposite with enhanced photocatalytic and antibacterial activity. Carbohydr. Polym. 2017,164, 301–308. [CrossRef]
- Shaheen, T. I.; Fouda, A. Green approach for one-pot synthesis of silver nanorod using cellulose nanocrystal and their cytotoxicity and antibacterial assessment. Int. J. Biol. Macromol. 2018,106, 784-792. [CrossRef]
- Zhao, J.; Zhang, P.; et al. Direct evidence of multichannel-improved charge-carrier mechanism for enhanced photocatalytic H2 evolution. Sci. Rep. 2017, 7, 16116. [CrossRef]
- Y. Lin; Xiong Y.-L.; et al. Guiding charge transfer kinetics into cocatalyst for efficient solar water splitting. Electrochim. Acta 2019, 307,43-50. [CrossRef]
- Podborska, A.; Suchecki, M.; et al. Light intensity-induced photocurrent switching effect. Nat. Commun. 2020,11, 854. [CrossRef]
Figure 1.
XRD patterns of NC, ZFO, and hybrid nanocomposites.
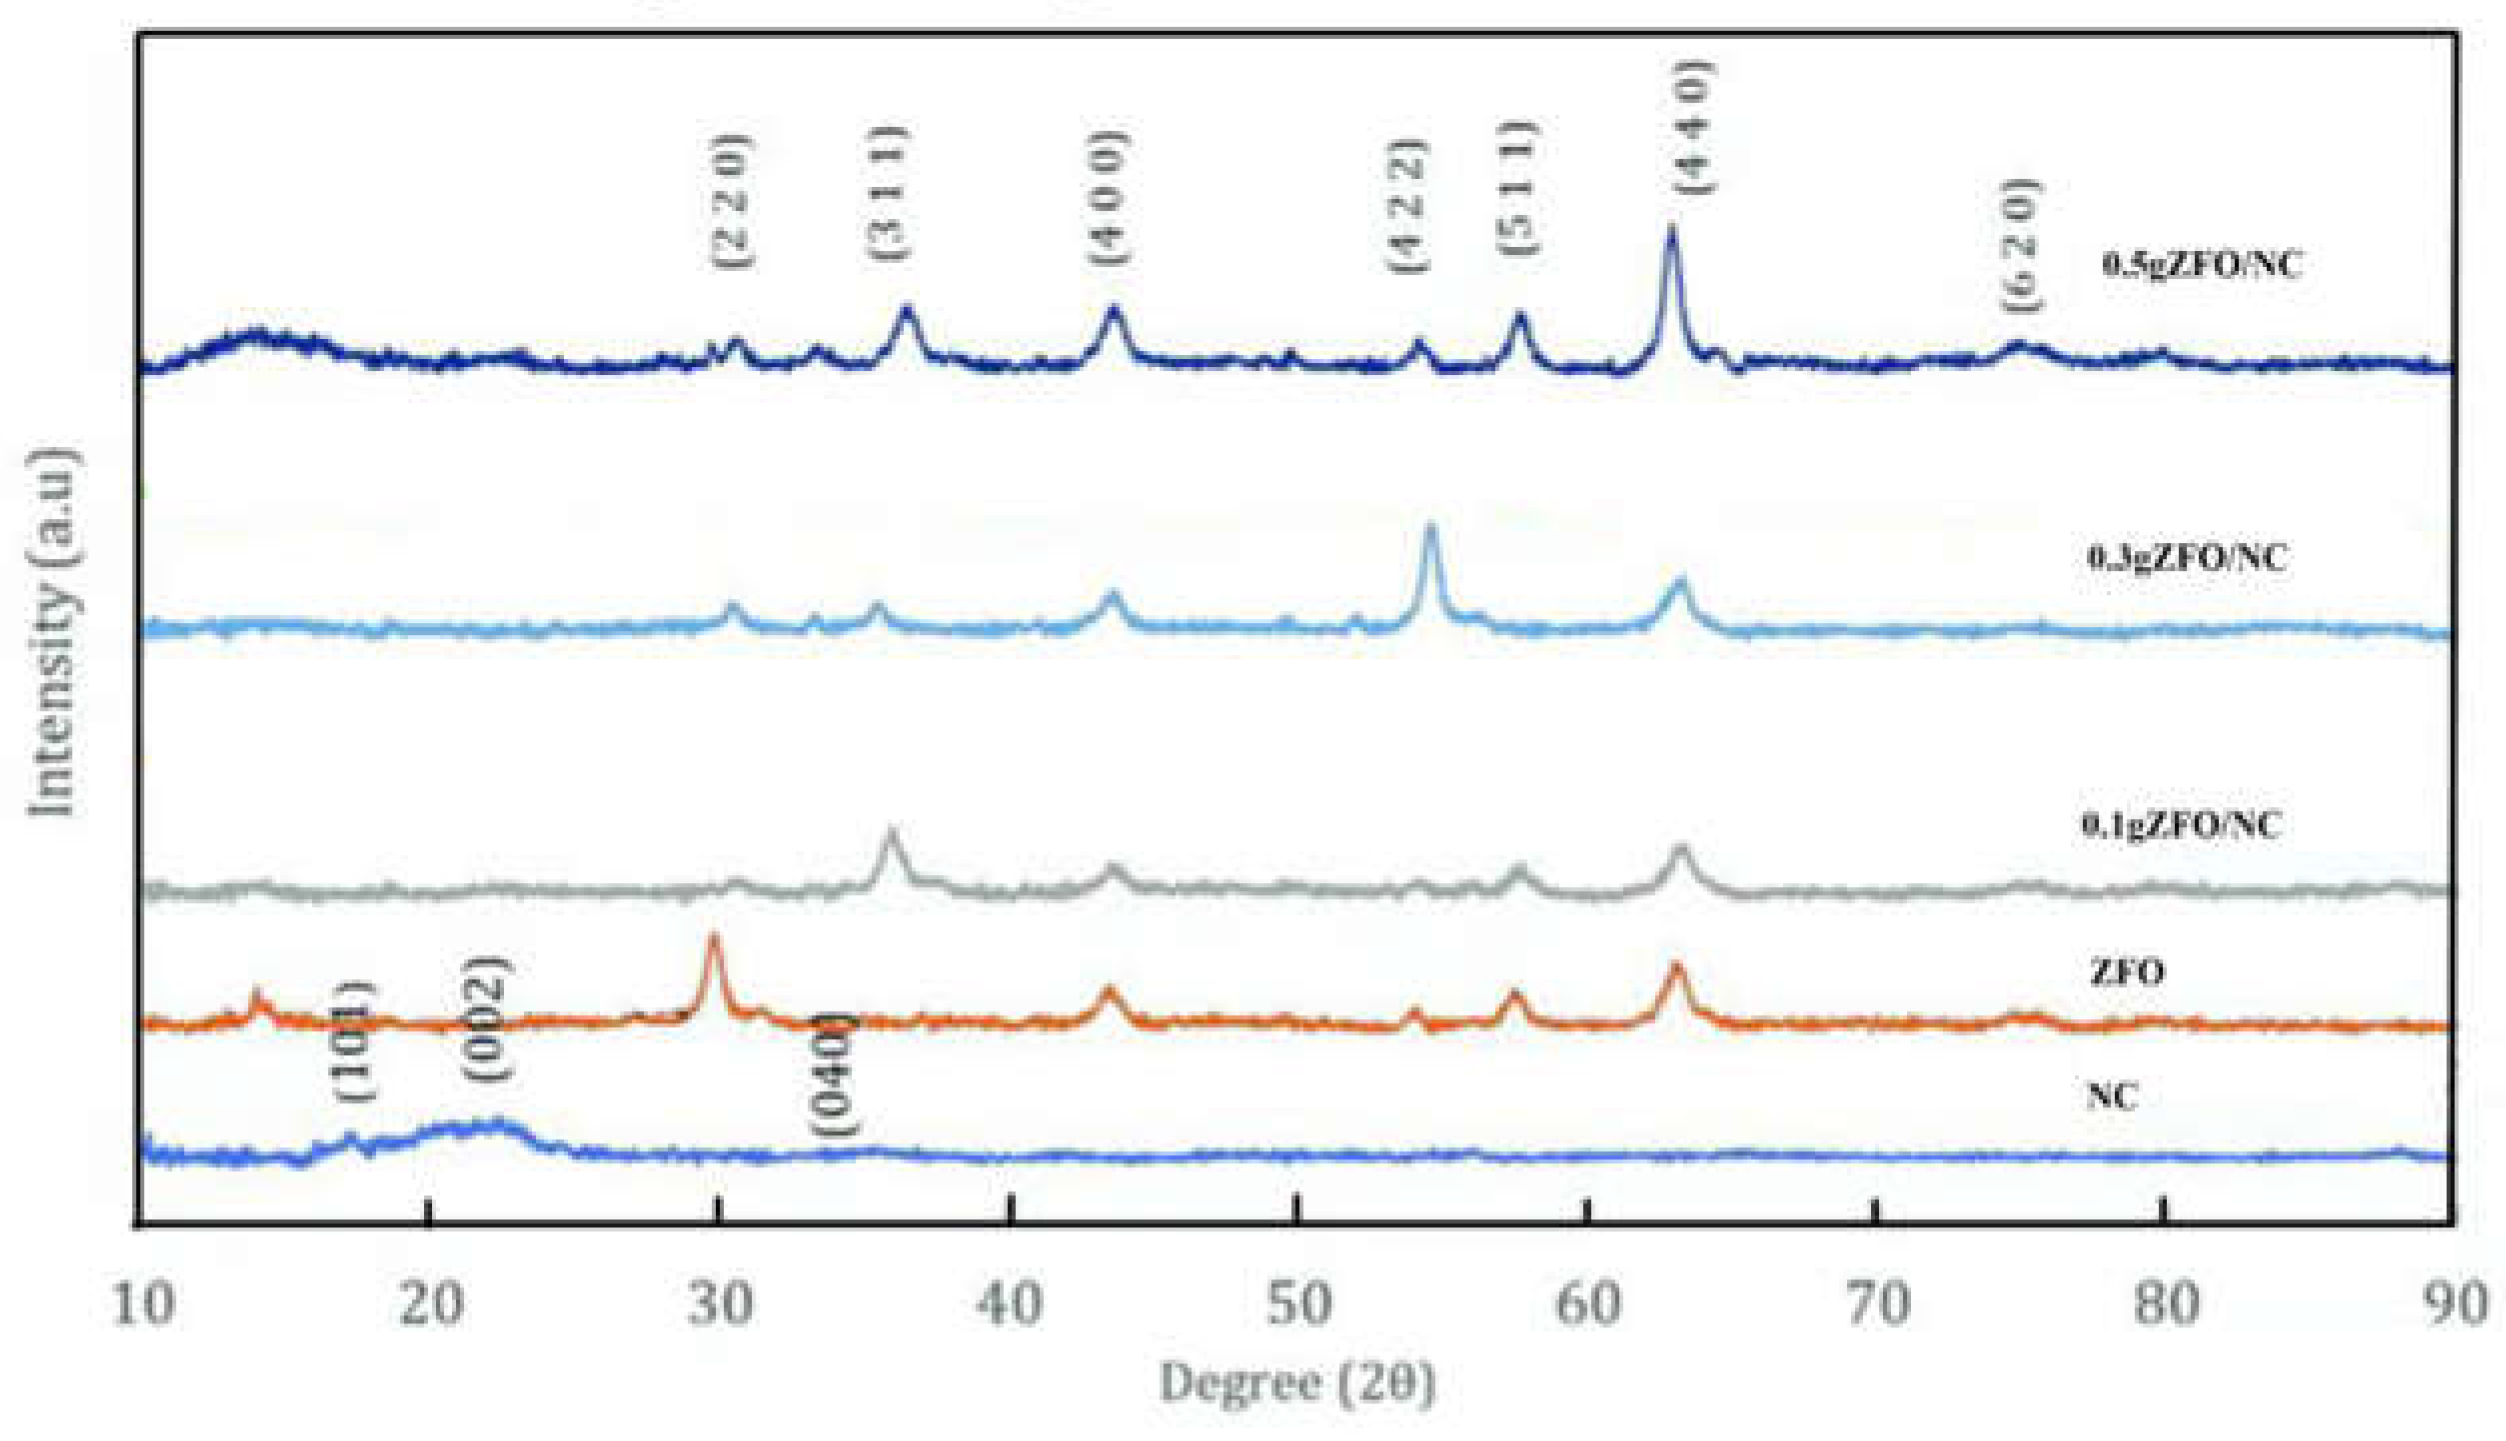
Figure 2.
FT-IR spectra of NC, ZFO and ZFO/NC nanocomposites.
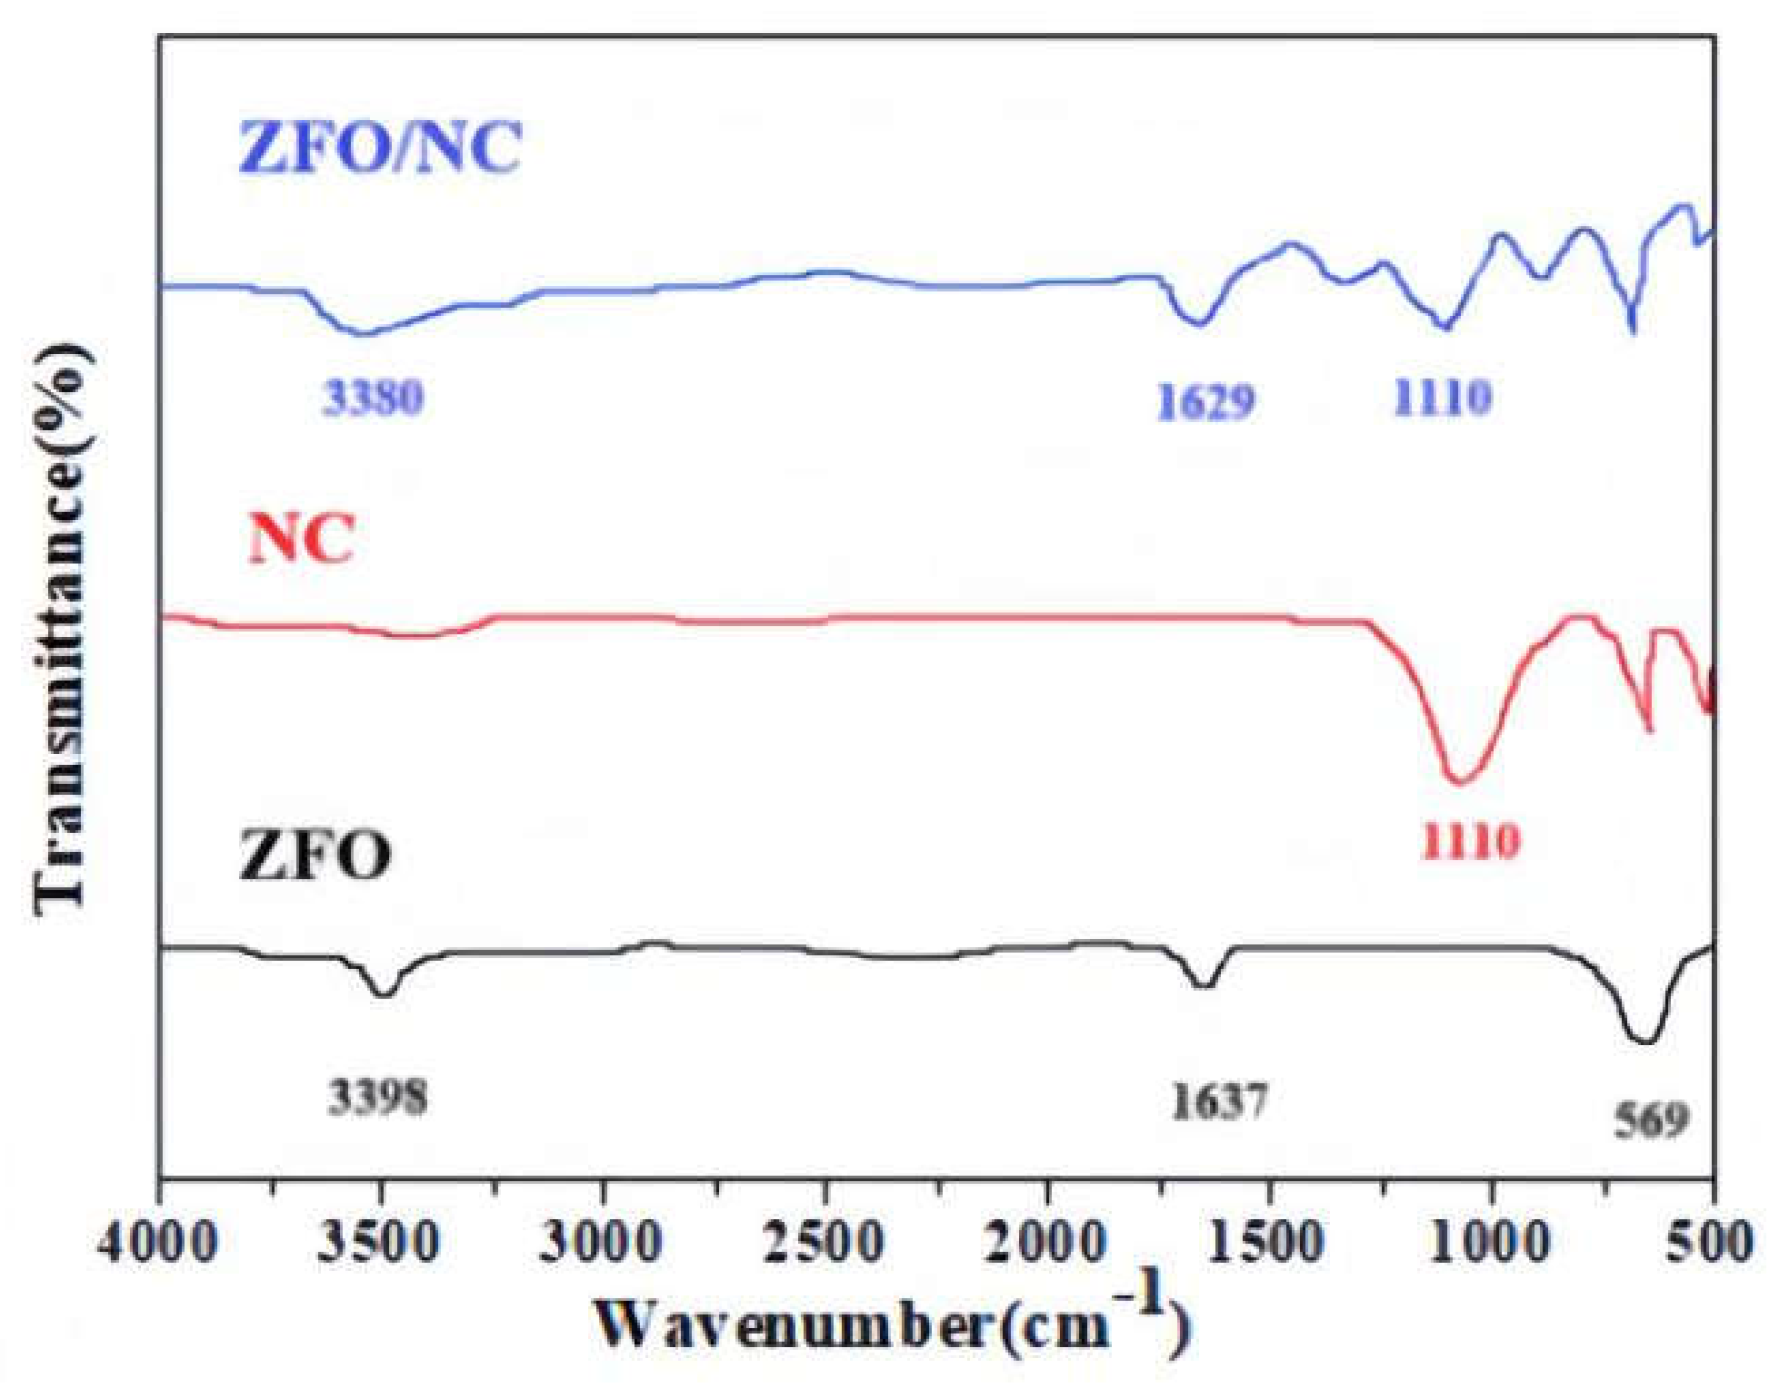
Figure 3.
(a) UV-Visible spectra and (b) Tauc plots for the band gap of NC, ZFO and ZFO/NC nanocomposites.
Figure 3.
(a) UV-Visible spectra and (b) Tauc plots for the band gap of NC, ZFO and ZFO/NC nanocomposites.
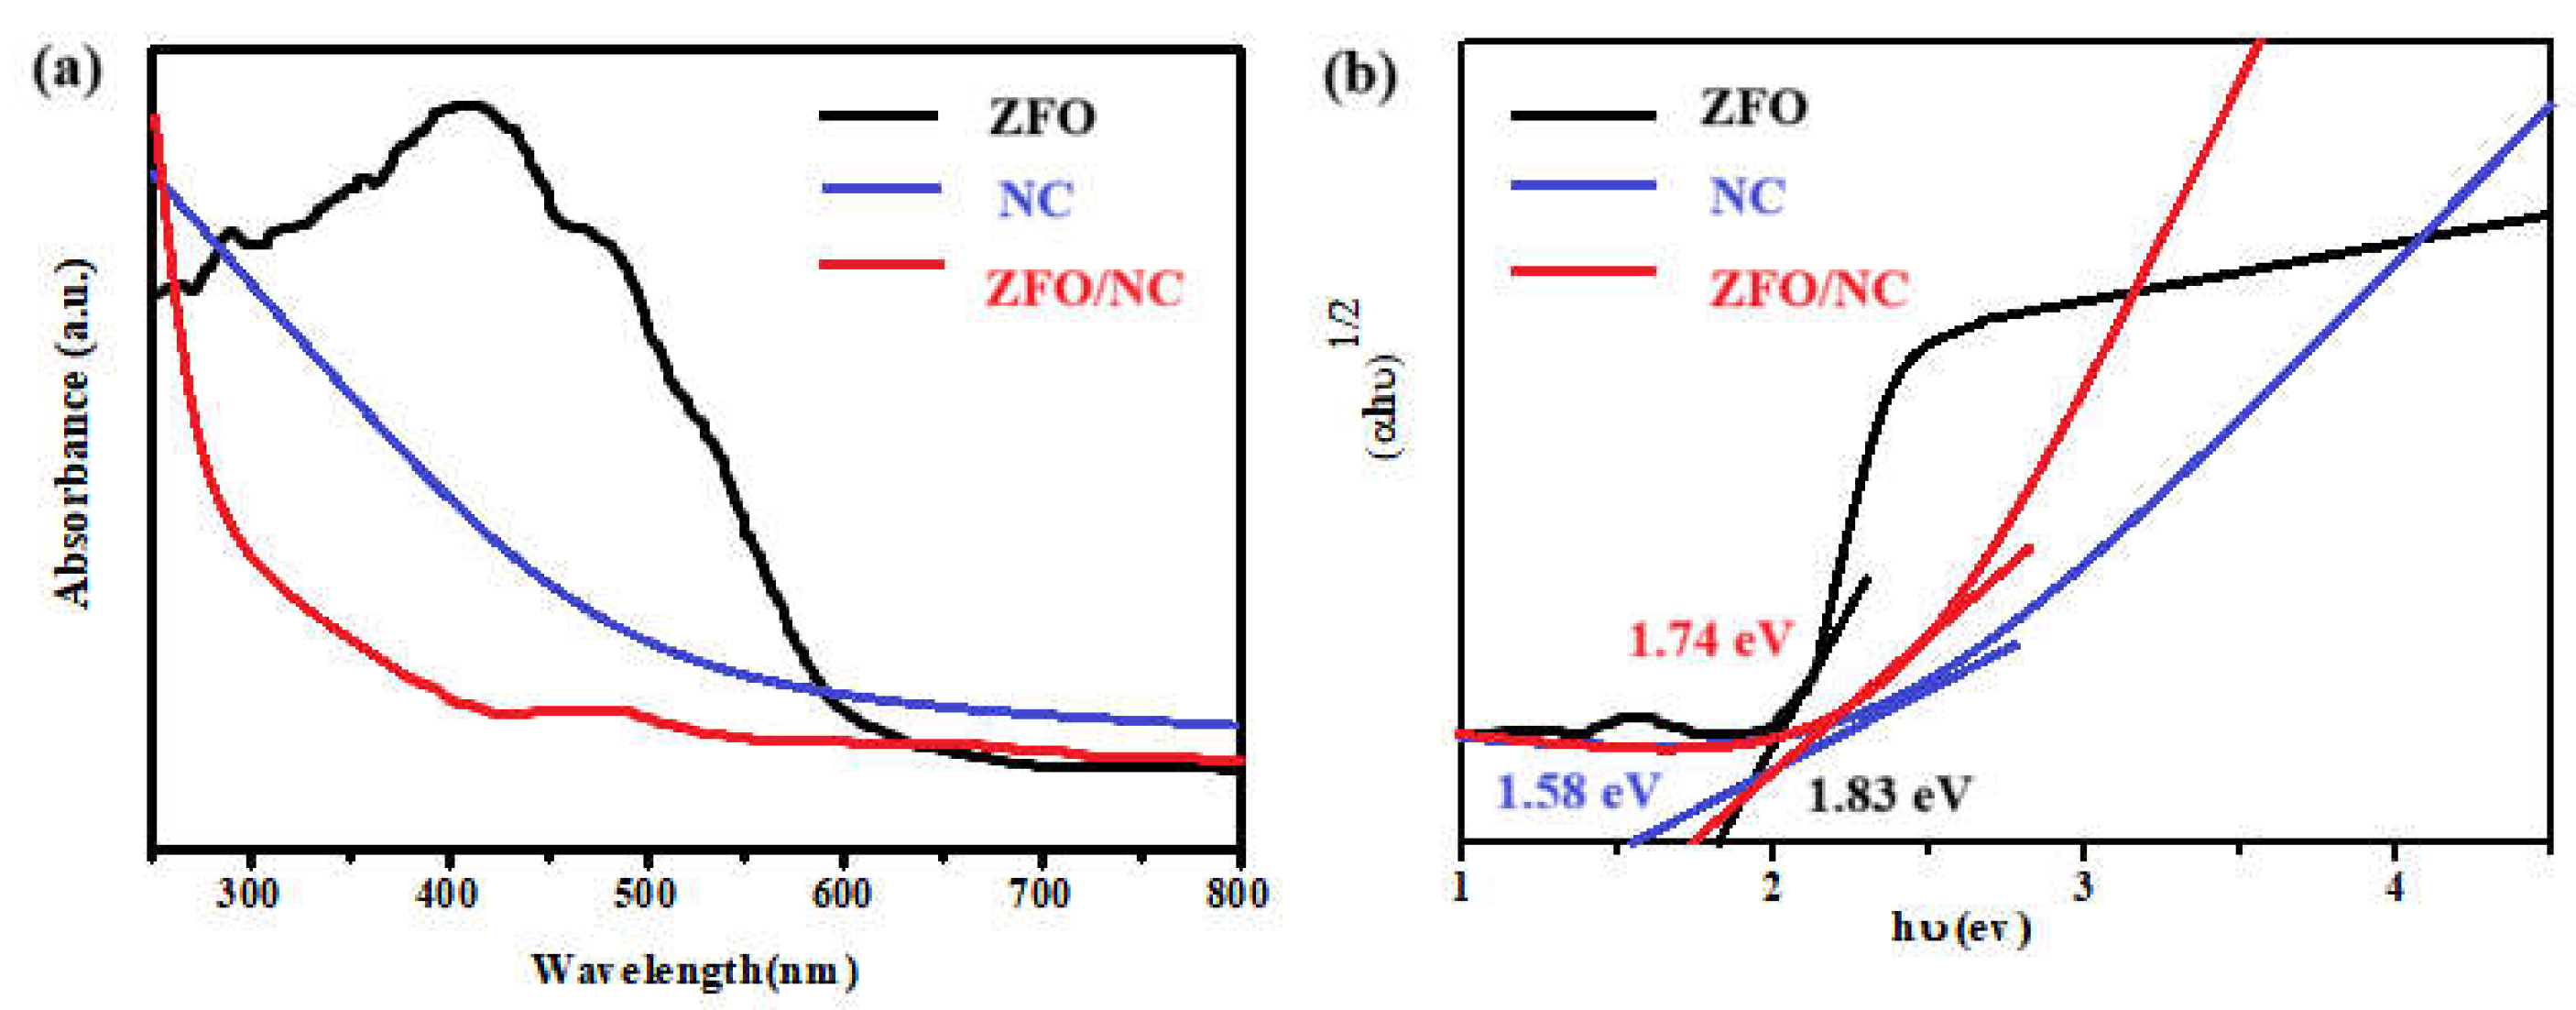
Figure 4.
XPS survey spectra of ZFO and ZFO/NC(a) Fe 2p, (b) Zn 2p, (c) O 1s, (d) C 1s.
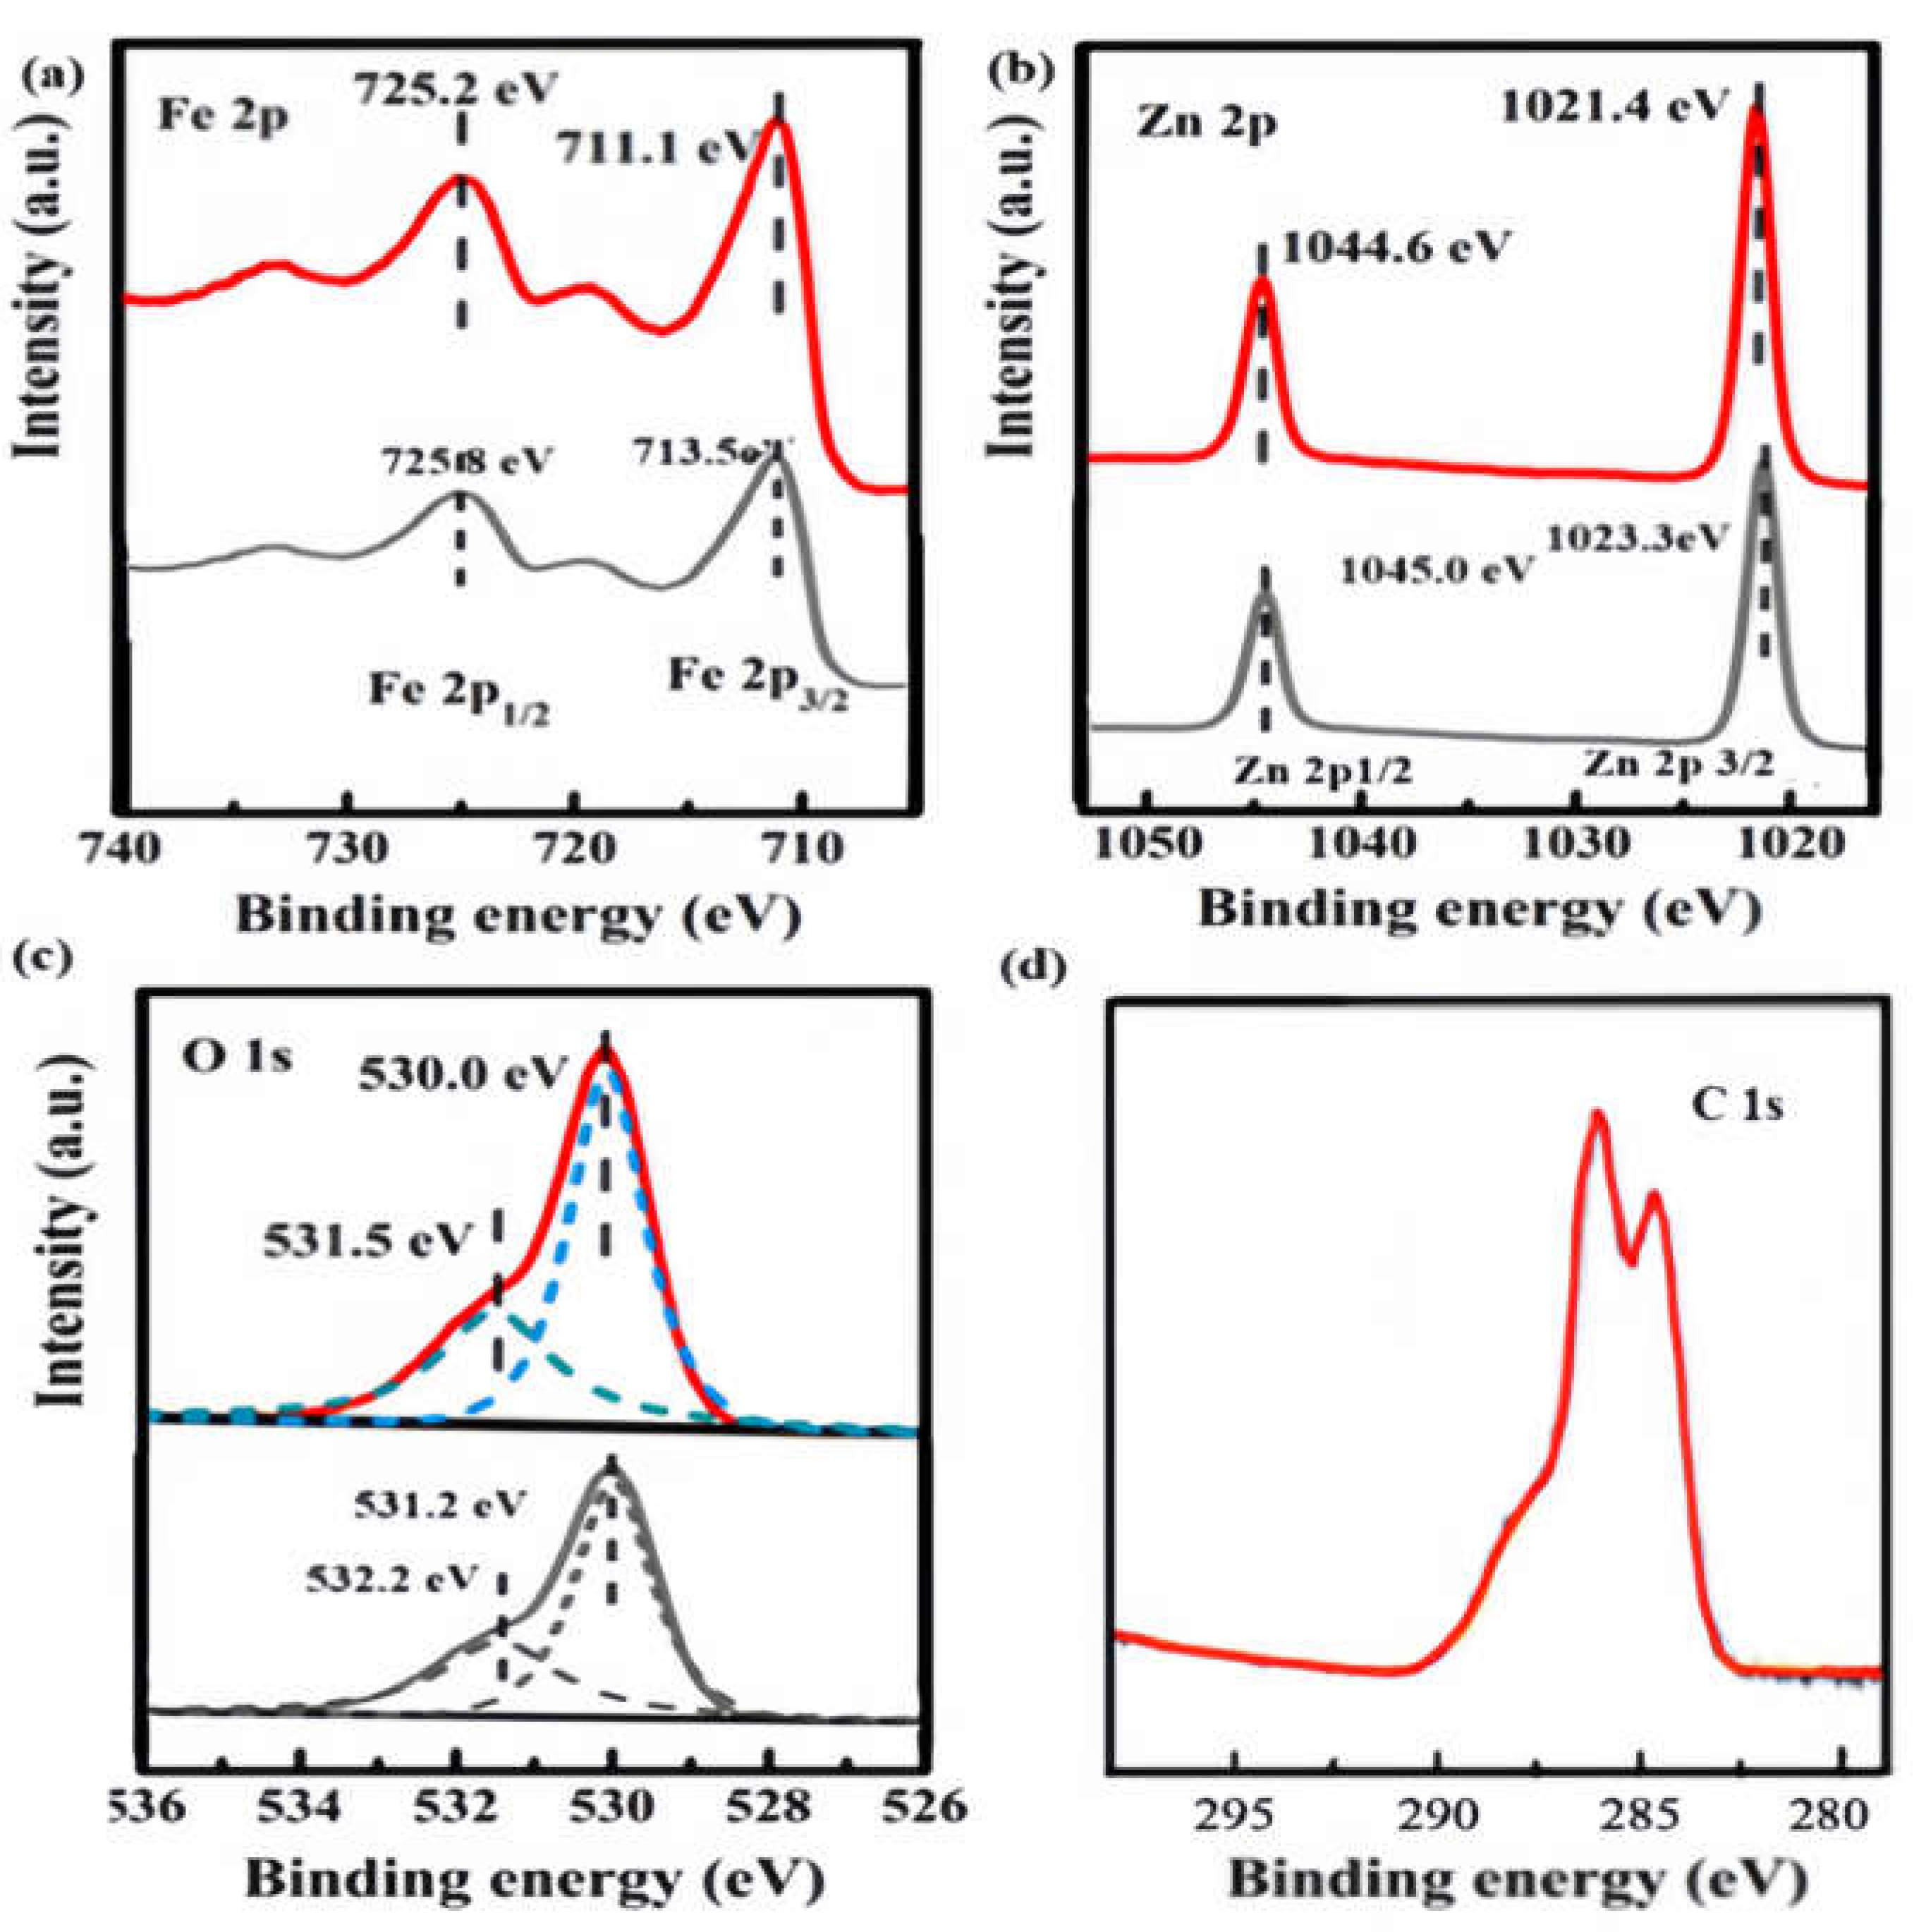
Figure 5.
Characterization of synthesized NC and nanocomposites. a and b denotes TEM images for NC and ZFO/NC ,respectively. c and d denotes SEM images for NC and ZFO/NC, respectively.
Figure 5.
Characterization of synthesized NC and nanocomposites. a and b denotes TEM images for NC and ZFO/NC ,respectively. c and d denotes SEM images for NC and ZFO/NC, respectively.
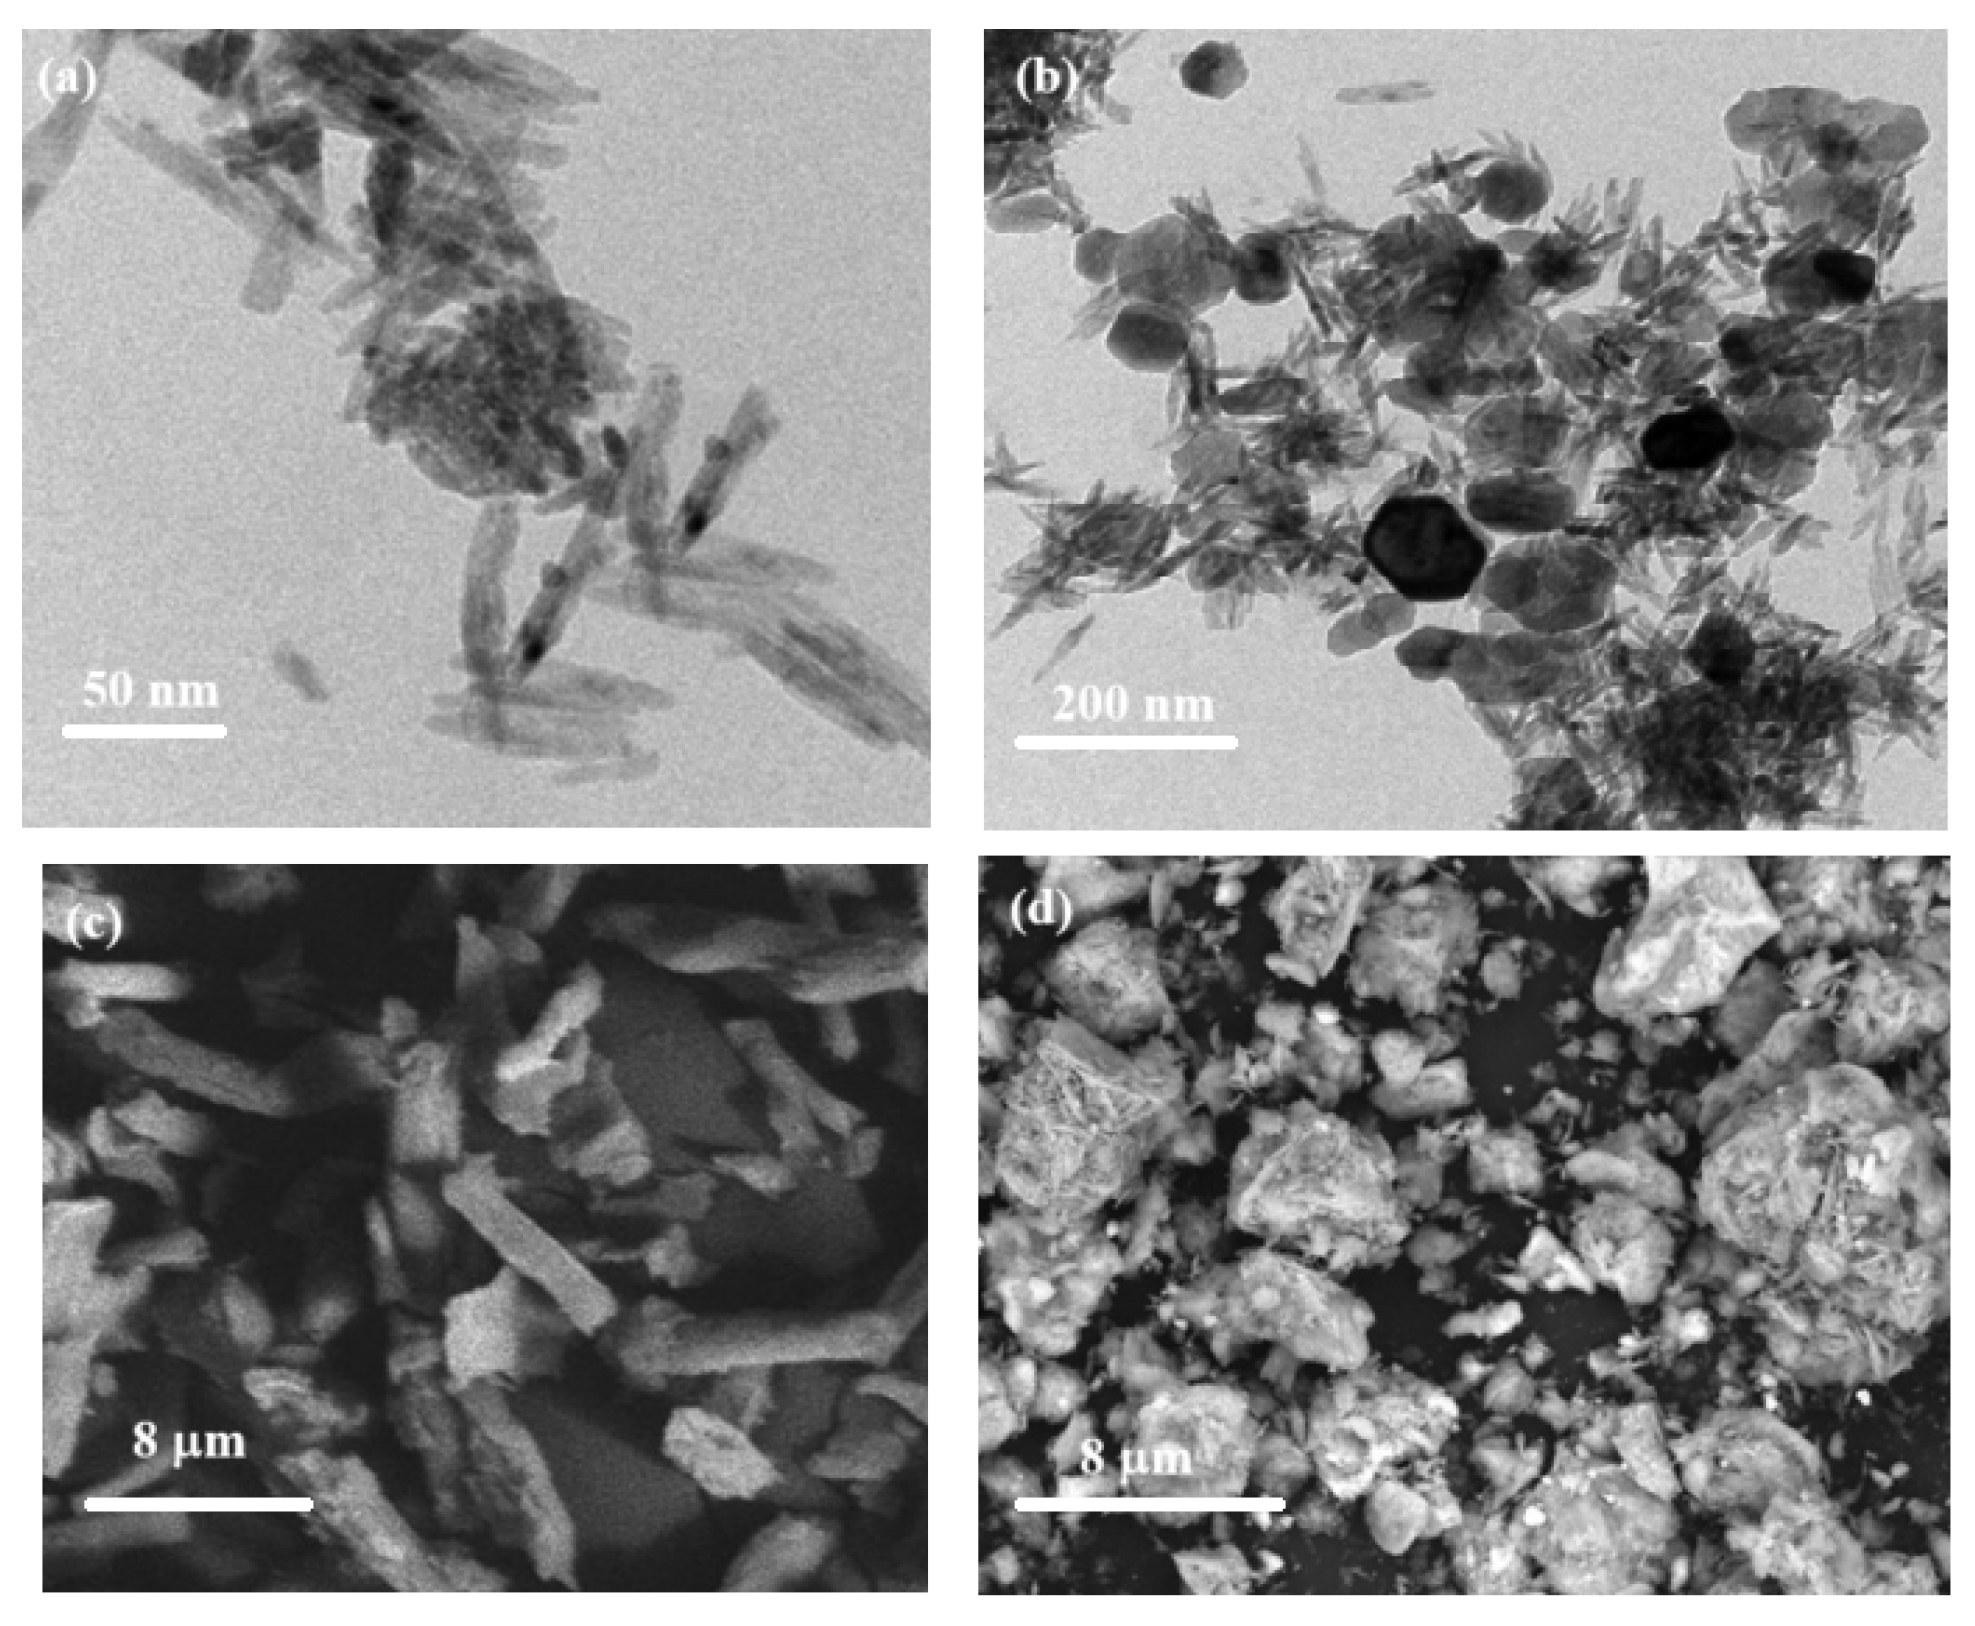
Figure 6.
Elemental composition of (a) ZFO and NC (b) hybrid nanocomposites.
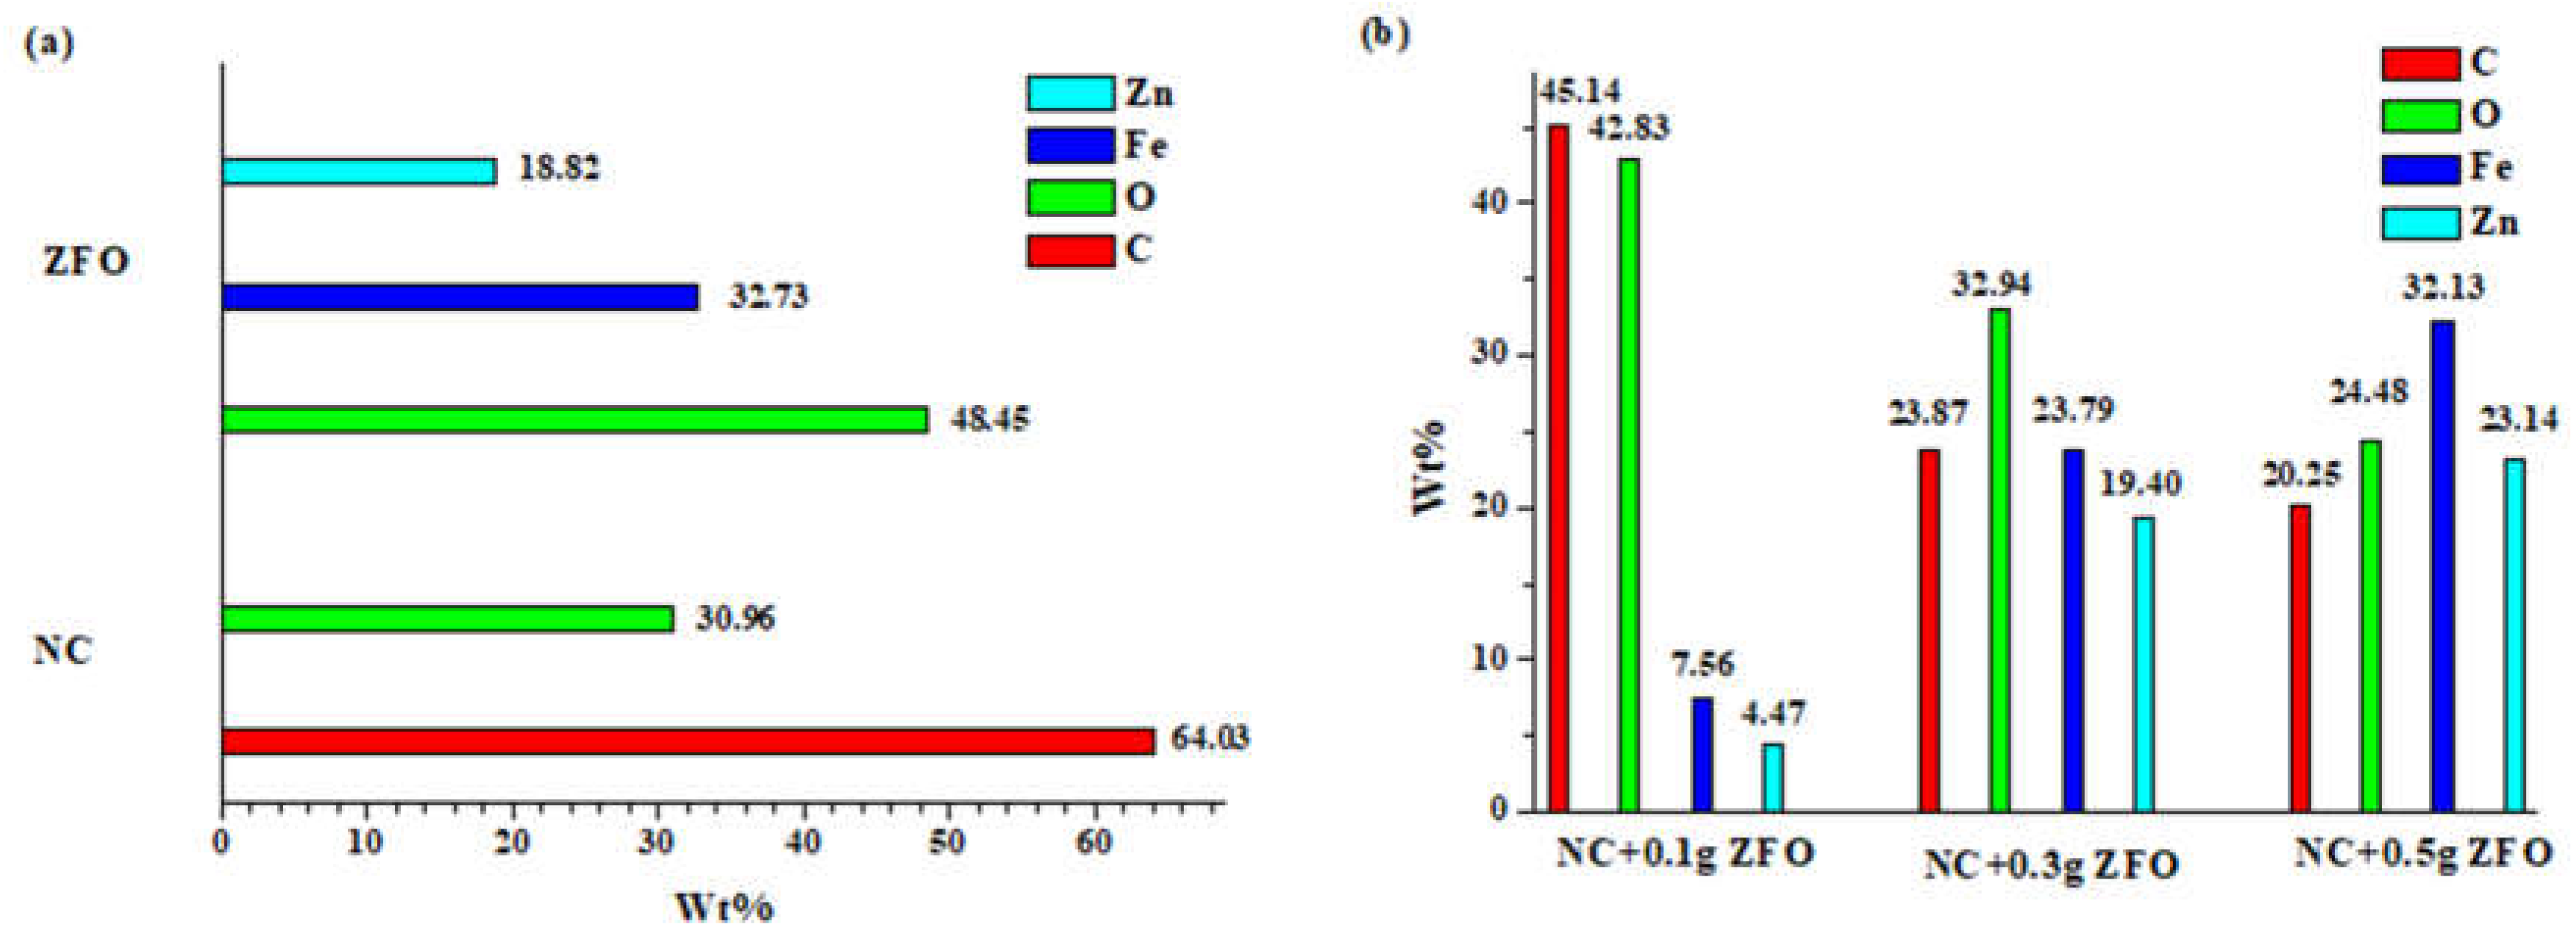
Figure 7.
(a)Degradation curves of phenol by NC, ZFO and xZFO/NC(x= 0.1, 0.3 and 0.5) in the absence of a magnetic field; (b)Degradation curves of phenol by NC, ZFO and xZFO/NC under magnetic field conditions; (c)Comparison of degradation efficiency of xZFO/NC in the absence of magnetic field and in the presence of magnetic field; (d)The increasing percentage of photodegradation rate of xZFO/NC after the addition of magnetic fields.
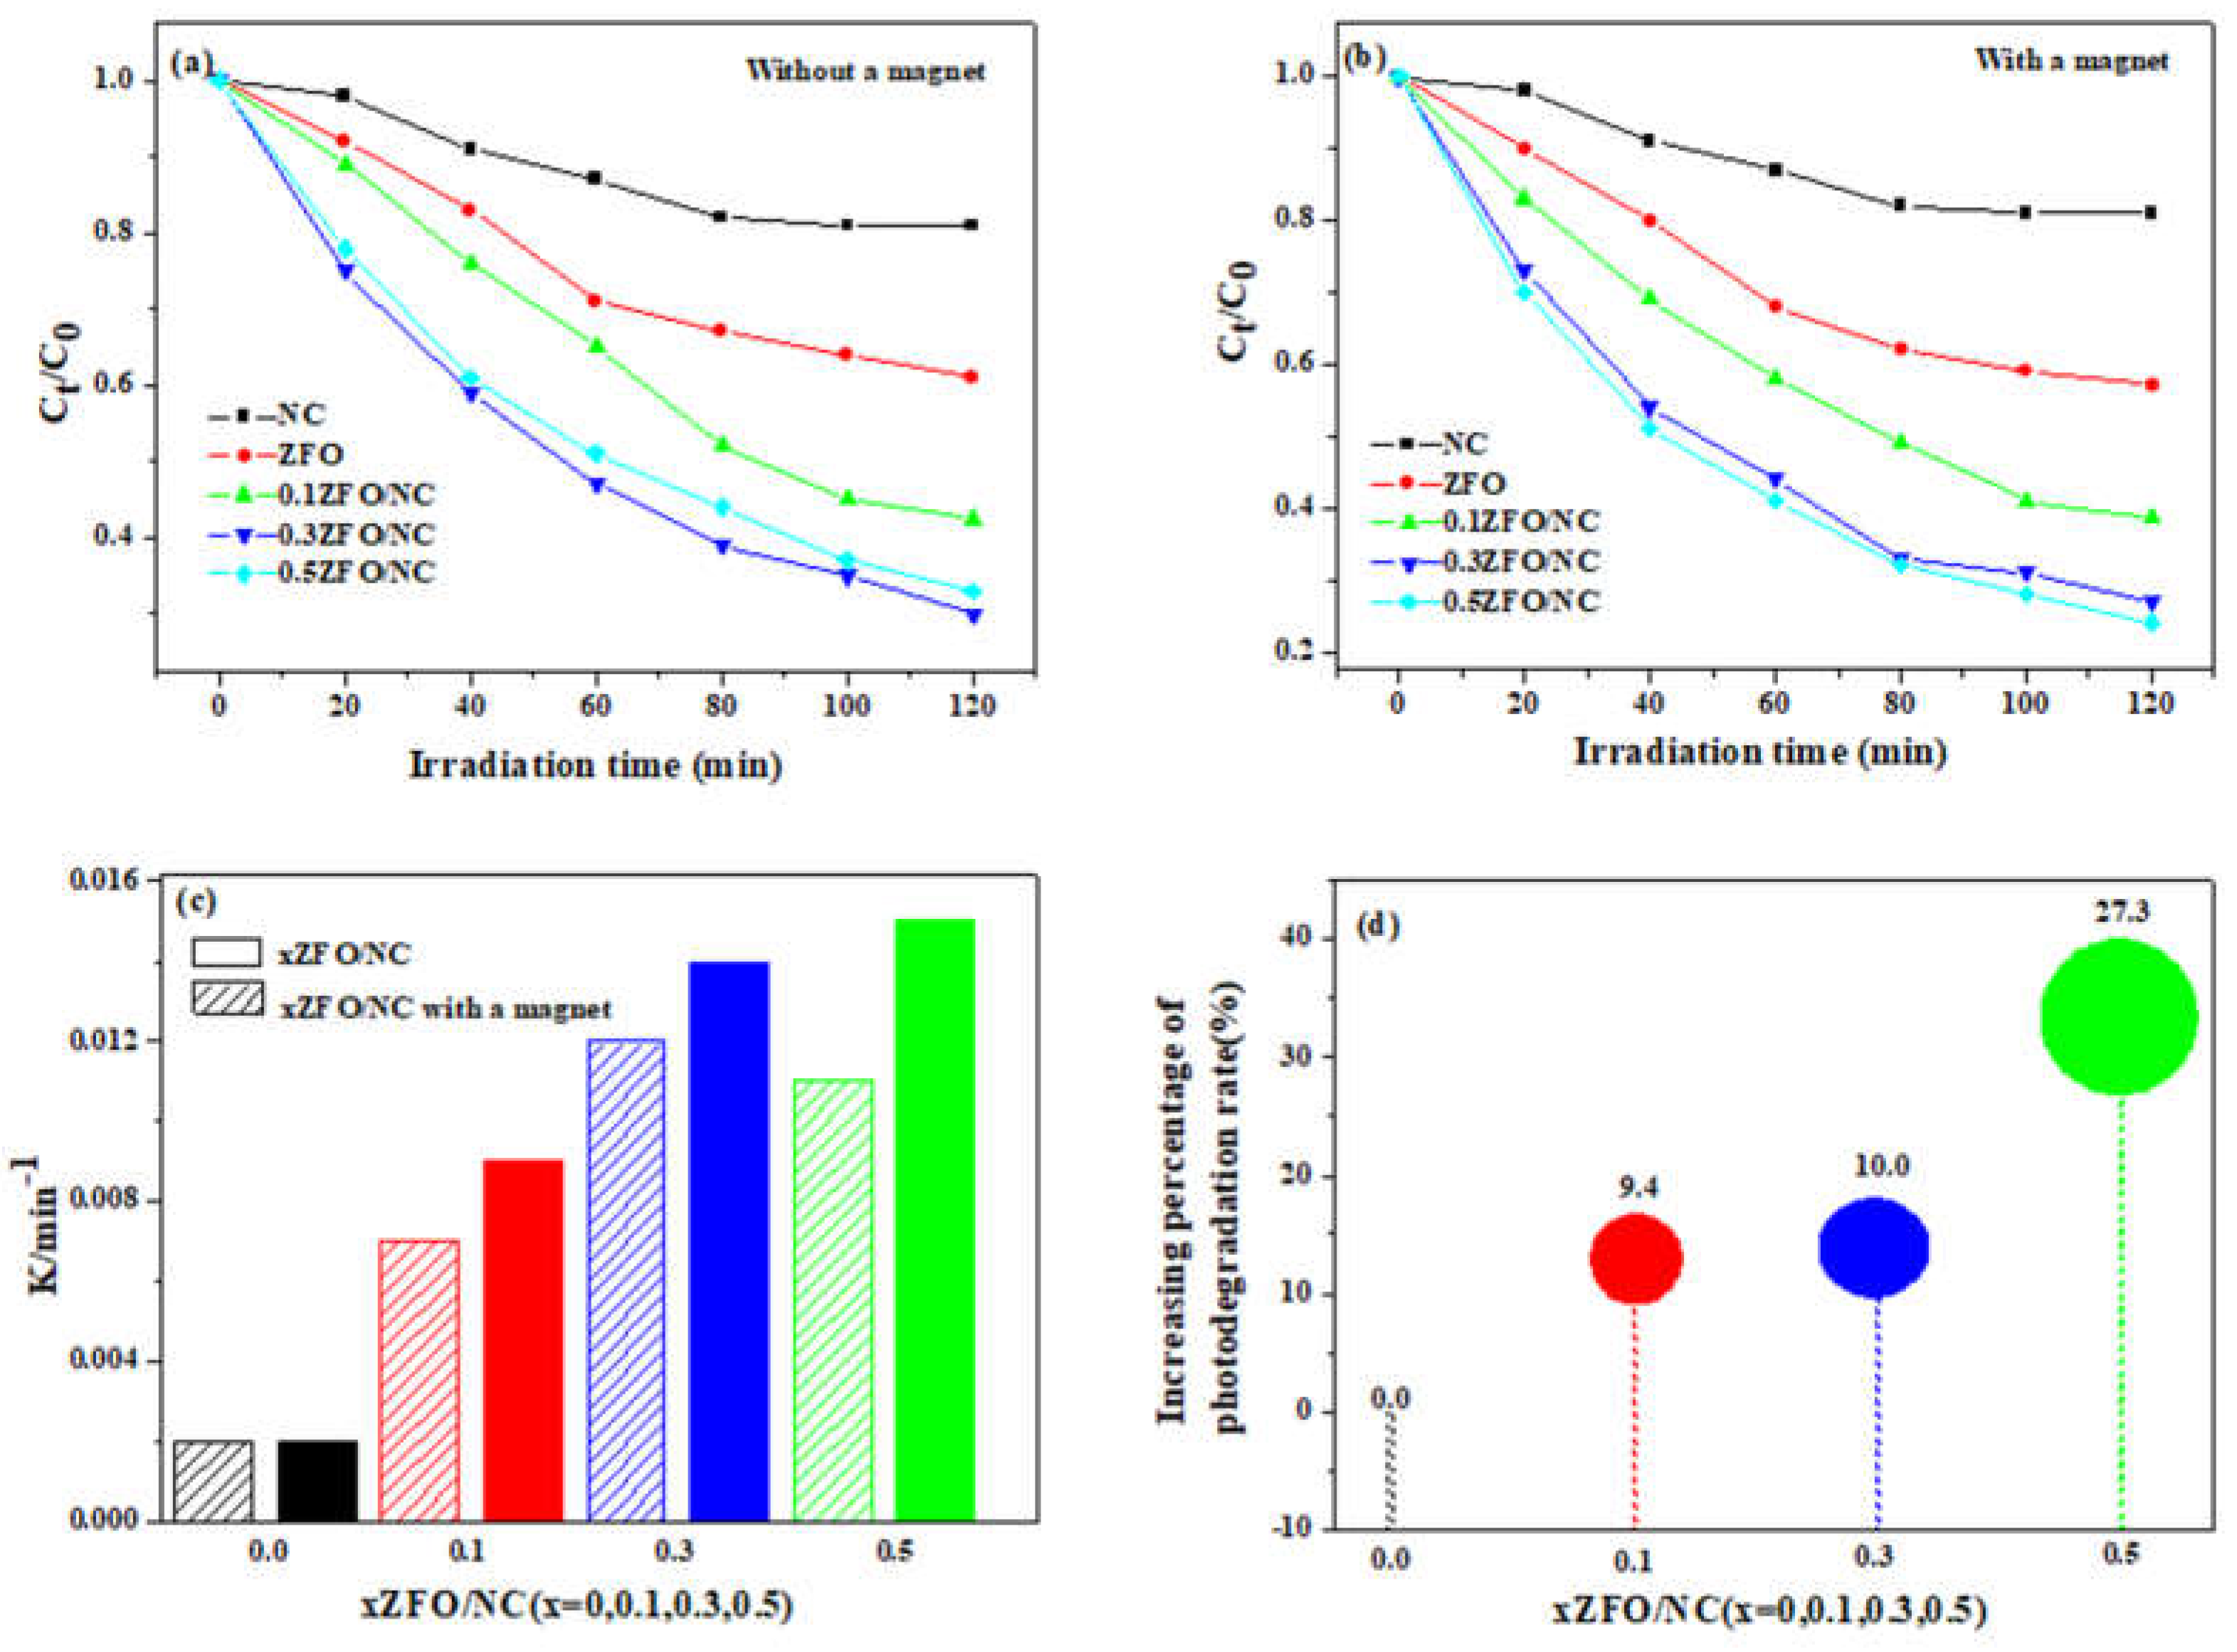
Figure 8.
Cyclic experiments on photocatalytic degradation of phenol by 0.5ZFO/NC.
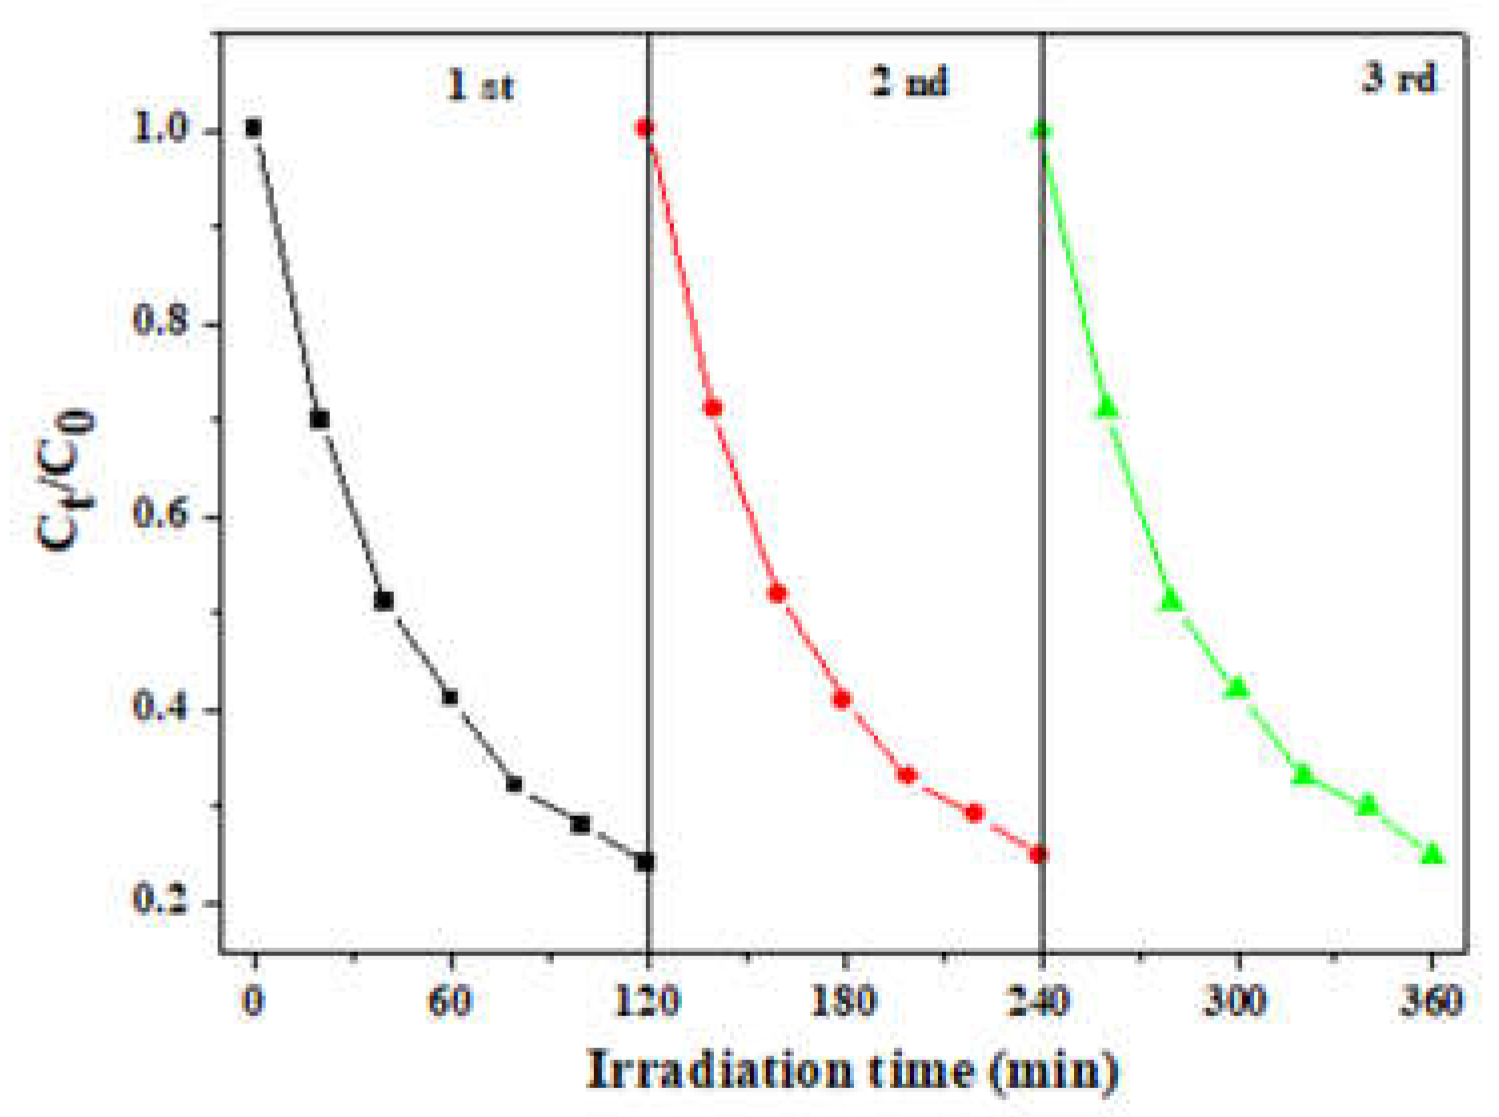
Figure 9.
0.5ZFO/NC in the absence of magnetic field and in the presence of magnetic field: (a) photocurrent response density; (b) Electrochemical impedance spectroscopy.
Figure 9.
0.5ZFO/NC in the absence of magnetic field and in the presence of magnetic field: (a) photocurrent response density; (b) Electrochemical impedance spectroscopy.
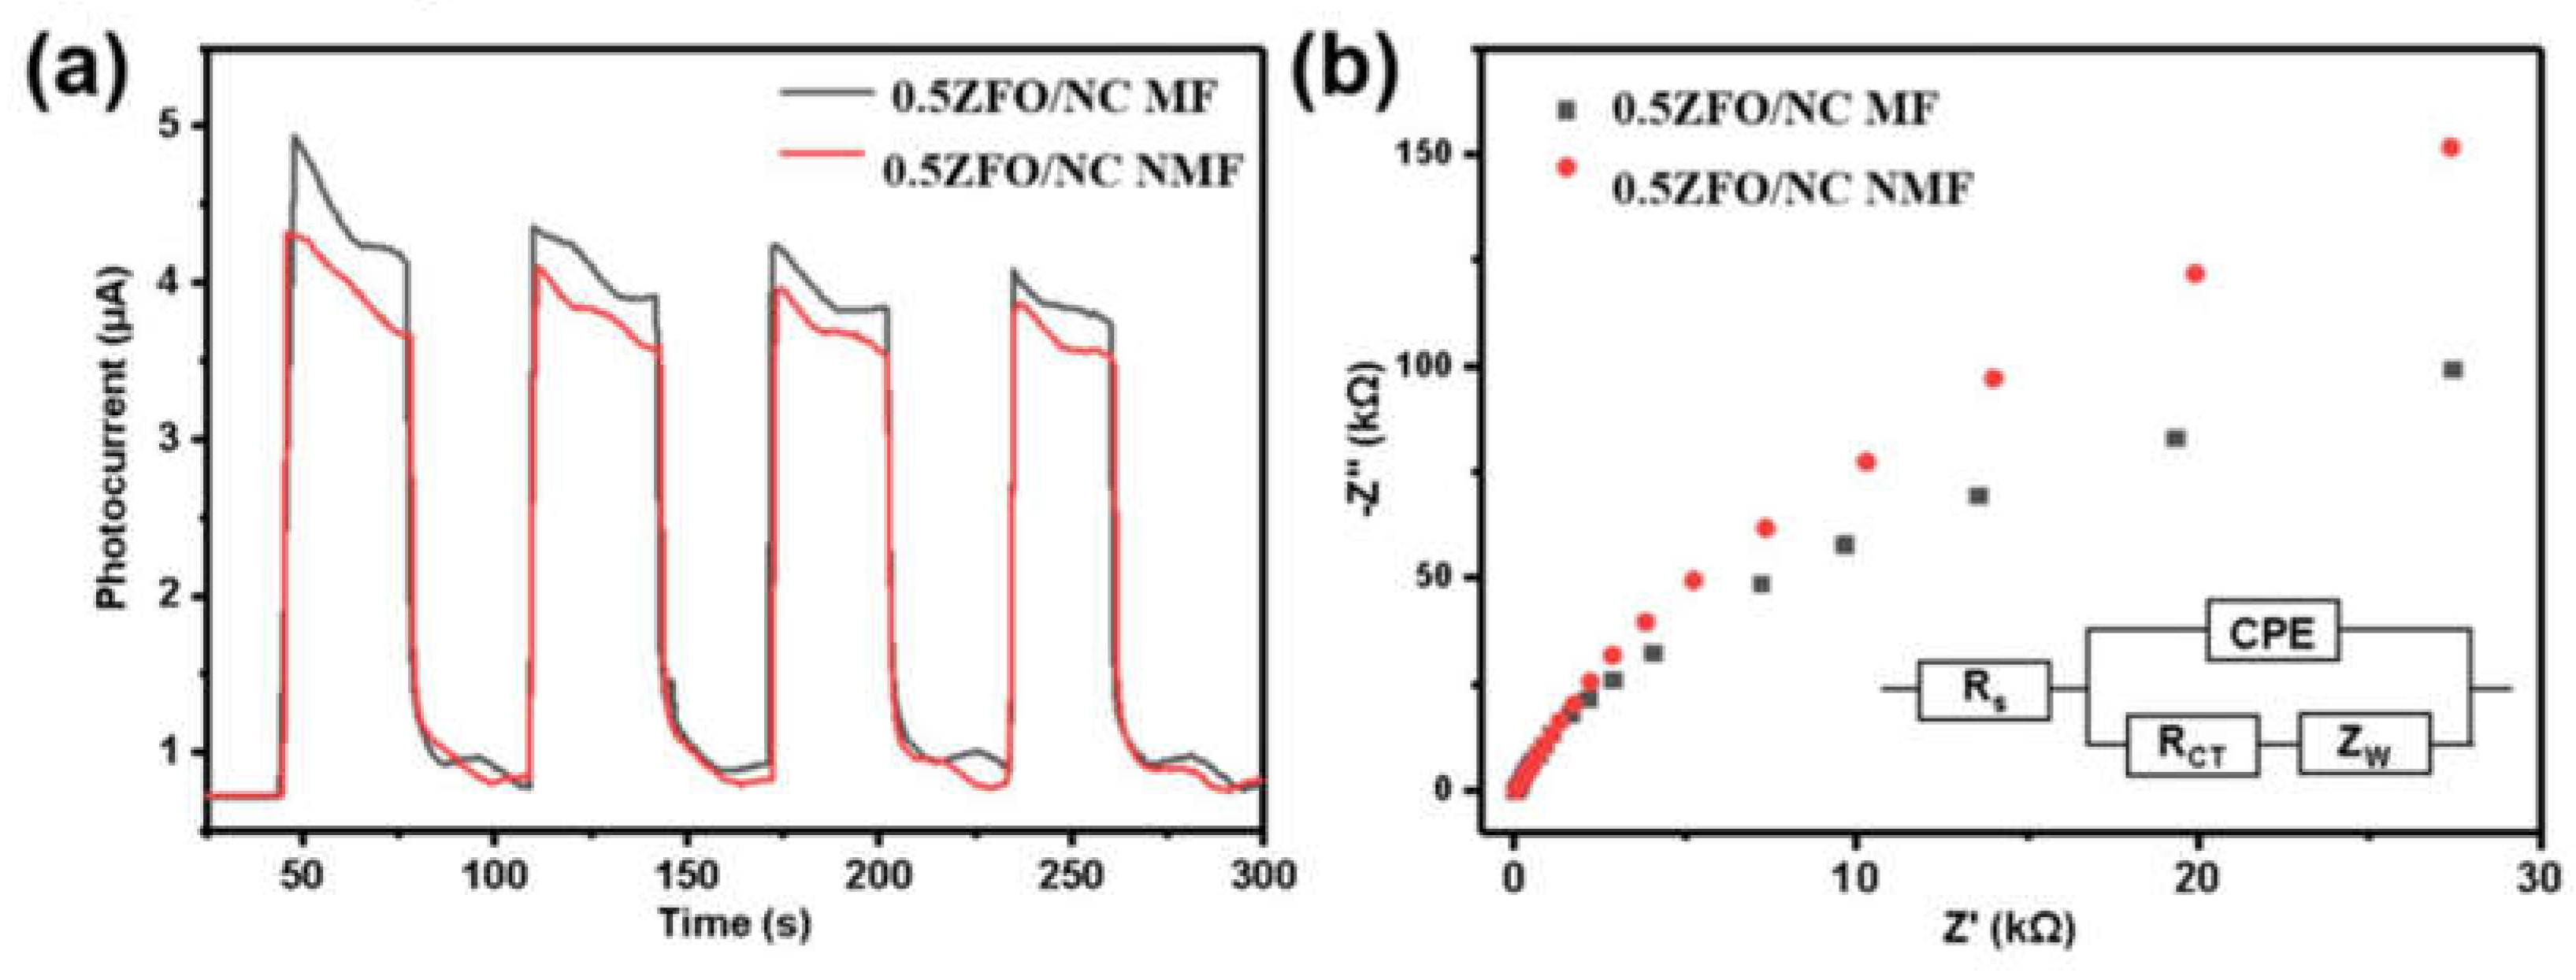
Figure 10.
Schematic of the mechanism of visible-light photocatalytic phenol degradation by NC, ZFO and xZFO/NC.
Figure 10.
Schematic of the mechanism of visible-light photocatalytic phenol degradation by NC, ZFO and xZFO/NC.
Disclaimer/Publisher’s Note: The statements, opinions and data contained in all publications are solely those of the individual author(s) and contributor(s) and not of MDPI and/or the editor(s). MDPI and/or the editor(s) disclaim responsibility for any injury to people or property resulting from any ideas, methods, instructions or products referred to in the content. |
© 2024 by the authors. Licensee MDPI, Basel, Switzerland. This article is an open access article distributed under the terms and conditions of the Creative Commons Attribution (CC BY) license (http://creativecommons.org/licenses/by/4.0/).
Copyright: This open access article is published under a Creative Commons CC BY 4.0 license, which permit the free download, distribution, and reuse, provided that the author and preprint are cited in any reuse.


