
Submitted:
01 November 2024
Posted:
01 November 2024
You are already at the latest version
Abstract
The claustrum, a small but densely interconnected brain structure, is innervated by axons containing neuromodulators such as serotonin (5-HT), a neuromodulator that has been implicated in control of sleep and in the actions of psychedelic drugs. However, little is known about how 5-HT influences the claustrum. We have combined whole-cell patch clamp measurements of ionic currents, flash photolysis and receptor pharmacology to characterize the 5-HT responses of individual claustral projection neurons (PNs) in mouse brain slices. Serotonin application elicited a long-lasting outward current in claustral PNs. This current was due to an increase in membrane permeability to K+ ions and was mediated mainly by the type 1A 5-HT receptor (5-HTR-1A). The 5-HT-induced K+ current hyperpolarized, and thereby inhibited, PNs by reducing action potential firing. Focal uncaging of 5-HT revealed that inhibitory 5-HTR-1As were located at both the soma and dendrites of PNs. We conclude that 5-HT creates a net inhibition in the claustrum, an action that should decrease claustrum sensitivity to excitatory input from other brain areas and thereby contribute to 5-HT action in the brain.
Keywords:
Serotonin
; claustrum
; neuromodulation
Introduction
The claustrum is a long and irregular sheet of neurons nestled between the insula and striatum. Because the claustrum is heavily interconnected with many other brain regions – in organisms ranging from mice to humans [1,2,3,4,5,6] – the claustrum has been likened to a cortical conductor [7]. While the function of the claustrum is beginning to come into focus [8,9,10], much less is known about how claustrum activity is regulated by neuromodulators [11].
One potential modulator of claustrum function is serotonin (5-HT). Release of 5-HT within the brain is closely tied to sleep-wake states: 5-HT is higher in wake states than sleep states [12,13,14]. Emerging evidence indicates the involvement of the claustrum in sleep: claustral activity is higher in sleep states than wake states [15,16,17]. This anticorrelation between claustral activity and 5-HT release suggests that 5-HT inhibits the claustrum during wake states, while a lack of 5-HT should enable claustral activity during sleep states.
Such serotonergic modulation of the claustrum is strongly suggested by 5-HT receptor (5-HTR) expression [18,19,20,21,22,23,24,25,26,27] and input from major serotonergic nuclei [4,16,28,29,30,31,32]. More recently, the claustrum was shown to be involved in the actions of the psychedelic drugs 2,5-Dimethoxy-4-iodoamphetamine (DOI; [33,34]) and psilocybin [35], which are thought to act via 5-HTRs. Further, the claustrum has been implicated in the loss of consciousness linked to lesions of the dorsal raphe nuclei, a major source of serotonergic input throughout the brain [36].
Here, we investigated how 5-HT influences claustral projection neurons (PNs), the principal output cells of the claustrum. Claustral PN responses to 5-HT were detected using whole-cell patch clamp recordings of PN activity in mouse brain slices. By locally applying 5-HT onto claustral PNs, we found that 5-HT inhibits these neurons. Further experiments identified the ionic mechanisms and 5-HTRs mediating these serotonergic inhibitory responses. Finally, we photolyzed caged 5-HT to determine the location of the 5-HTRs responsible for serotonergic inhibition. Together, these results provide a detailed characterization of the inhibitory actions of 5-HT on claustral output neurons.
Materials and Methods
Animals
C57BL/6 wild type mice of both sexes and approximately 2 months of age were used for the experiments. All animal procedures used were approved by the Institutional Animal Care and Use Committees (IACUCs) of NTU and TLL.
Brain Slice Preparation
As described in Chia et al. [37] and Graf et al. [38], mice were sacrificed by deep anesthesia (isoflurane) and were subsequently decapitated. Their brains were swiftly isolated and transferred to an ice-cold cutting solution containing (in mM) 250 sucrose, 26 NaHCO3, 10 D-glucose, 4 MgCl2, 3 myo-inositol, 2.5 KCl, 2 sodium pyruvate, 1.25 NaH2PO4, 0.5 ascorbic acid, 0.1 CaCl2, and 1 kynurenic acid (350-360 mOsm, pH 7.4). Using a vibratome (VT1200S, Leica), coronal acute brain slices of 250 µm thickness were obtained and incubated at 34 °C for 30 minutes in an artificial cerebral spinal fluid (ACSF) external solution containing (in mM) 126 NaCl, 24 NaHCO3, 1 NaH2PO4, 2.5 KCl, 2 CaCl2, 2 MgCl2, 10 glucose, and 0.4 ascorbic acid (300-310 mOsm, pH 7.4). The slices were kept at room temperature (RT) of 24°C in ACSF post-incubation. All solutions were bubbled with carbogen (95% oxygen and 5% carbon dioxide). All chemicals were purchased from Sigma Aldrich except for NaH2PO4 (Kanto Chemicals).
Electrophysiological Recordings
Borosilicate glass pipettes (1B150F-4, WPI) were prepared using a pipette puller (PC-10, Narashige). Whole-cell patch clamp recordings were performed on claustral neurons at RT using glass pipettes (3-8 MΩ resistance) filled with a K-gluconate internal solution containing (in mM) 130 mM K-gluconate,10 KOH, 2.5 MgCl2, 10 HEPES, 4 Na2ATP, 0.4 Na3GTP, 5 EGTA-disodium, 5 Na2 phosphocreatine, and 0.2% neurobiotin (290-295 mOsm, pH 7.4). All reagents were purchased from Sigma Aldrich except for KOH (Kanto Chemical) and neurobiotin (#SP-1120, Vector Laboratories). The slices were perfused with carbogen-oxygenated ACSF at the rate of 1 ml/min. Neurons were visualized by differential interference imaging on a two-photon microscope (FV1200-MPE, Olympus). Recordings were obtained from individual PNs, using a MultiClamp 700B amplifier (Molecular Devices) and digitized with a DigiData 1440 interface (Molecular Devices) sampling at 50 kHz. All membrane potentials stated in this paper have been corrected for a liquid-liquid junction potential of 11.7 mV. Criteria for inclusion of patch-clamp measurements were: access resistance (Ra) less than 30 MΩ, ratio of Ra to membrane resistance less than 20%, and/or a resting membrane potential (RMP) more negative than -50 mV. Electrical recordings were primarily analyzed using Clampfit 10.7 (Molecular Devices). Voltage-clamp measurements of 5-HT-induced membrane currents were low-pass filtered (8-pole Bessel Filter, 20 Hz).
Classification of claustral neurons. Neurons were depolarized with a series of rectangular current pulses (1 s duration) to evoke action potentials. The resulting voltage traces were then analyzed to determine numerous resting and active electrical properties, with extracted parameters then entered into a trained classifier that used these intrinsic electrical properties to identify the neurons as one of eight distinct neuron types [38]. These neurons included 5 types of projection neurons (PN1 to PN5) and three interneuron types (PV, SST, and VIP); the current paper focusses on the much more abundant projection neurons. These recordings were performed in the absence of synaptic blocking drugs, to emulate the conditions used by Graf et al. [38].
Responses to 5-HT application. To examine 5-HT responses of individual claustral neurons, a solution of 5-HT (100 µM) dissolved in 0.1% DMSO and ACSF was locally applied via a glass pipette (2-4 MΩ) whose tip was positioned ~50 µm away from the neuron. Positive pressure (100 ms, 1 bar) was applied via a Picospritzer II (Parker Hannifin). In most experiments, neurons were voltage clamped and held at holding potential of -70 mV, with kynurenic acid (100 µM) and GABAzine (10 µM; #1262, Tocris) added to the external solution to eliminate possible polysynaptic effects of 5-HT. Because not all neurons responded to 5-HT, applications were repeated at least 3 times to determine whether or not a 5-HT response was present, with an interval of 60 s between applications to ensure sufficient time for 5-HT responses to recover between applications. To determine the reversal potential of the 5-HT response of each neuron, the neuron was held at membrane potentials ranging from -110 to -70 mV. 5-HTR antagonists were added to the external solution at the following concentrations: 5-HTR-1A (WAY-100635; 1 µM), 5-HTR-2A (MDL-11939; 5 µM), and 5-HTR-2C (RS-102221; 5 µM). Measurements were usually made at least 10 min after applying drug-containing solutions to brain slices. All drugs were purchased from Sigma Aldrich unless stated otherwise. Several of these drugs were relatively hydrophobic; these were dissolved in DMSO prior to dilution with ACSF. In all cases, the final DSMO concentration was no more than 0.1% v/v.
In some current-clamp experiments, neurons were depolarized using two identical current ramps (5 s duration, 400 pA peak amplitude) spaced 30 s apart. To avoid possible run-down of AP firing over prolonged recording times, responses to the first current ramp served as controls for responses evoked by the second current ramp. 5-HT was then applied at a specific time before the start of the second current ramp, typically 5 s unless indicated otherwise. The same paradigm was used when rectangular current pulses (1s duration) were used instead of ramps.
5-HT Uncaging
To examine the spatial distribution of 5-HTRs on claustrum neurons, caged 5-HT was focally photolyzed. In these experiments, the external solution was oxygenated ACSF containing the caged 5-HT compound BHQ-O-5-HT (10 µM; #2320, Kerafast), which was recirculated using a peristaltic pump system. Caged 5-HT in the solution was photolyzed using a 405 nm laser (~32 mW). The area over which 5-HT was uncaged was determined by visualizing the structure of each neuron. For this purpose, Alexa 594 dye (50 µM; #A10270, Invitrogen) was added to the internal solution and a 2-photon z-stack image of the dye-filled neuron was obtained. 5-HT was then uncaged over various compartments of a neuron: (1) whole-neuron responses were generated by a 100 µm by 100 µm photolysis area that was centered over the soma; (2) somatic responses were evoked by a smaller 10 µm by 10 µm area over the soma; and (3) dendritic responses were evoked by a 100 µm by 100 µm area placed over the dendrites, 100 µm away from the soma.
Responses to uncaged 5-HT were measured by voltage clamping neurons at a holding potential of -30 mV to optimize the amplitude of the small 5-HT-induced outward currents (reversal potential of these currents was -103 mV). Responses from 3-5 trials were averaged to improve response signal-to-noise ratio.
Immunohistochemistry
Following electrophysiological recordings, brain slices were processed for parvabumin (PV) immunohistochemistry to identify the location of patched neurons (Figure 1). If the soma of a patched neuron was within or < 50 µm beyond the PV-enriched claustrum core, it was considered to reside within the claustrum [38]. Slices were fixed with 4% paraformaldehyde for 2 h and then washed thrice (20 min each time) with phosphate-buffered saline (PBS; BUF-2041-10X, Axil Scientific) containing 0.25% Triton X-100 (PBST; #H5141, Promega). Slices were subsequently blocked with 5% goat serum (#G9023, Sigma Aldrich) in PBST and incubated with the following antibodies in PBST with 1% goat serum overnight at 4 °C: 1:800 rabbit anti-PV (#PV-235, Swant) and 1:1000 streptavidin conjugated with Alexa-633 (#S21375, Invitrogen). Slices were again with washed with PBST thrice (20 min each) and incubated with 1:1000 goat anti-rabbit antibody conjugated with Alexa-488 (#A28175, Invitrogen) for 2 h. Slices were washed with PBS and mounted on glass slides with Dako mounting media (#CS70330-2, Agilent Technologies). All histological processing steps were performed at room temperature on an orbital shaker, unless otherwise indicated.
Image Acquisition
All fluorescence images were obtained using either a two-photon microscope (FV1200-MPE, Olympus) or a widefield microscope (Axioscan Z1, Zeiss). Images were then processed and/or analyzed primarily on FIJI [39]. Z-stack projections were obtained using either standard deviation or maximum intensity projection methods.
Calculations and Analyses
All statistical analyses were performed using Origin (Origin Lab) or R [40] and reported in Table 1. Levene’s test for homogeneity was performed before deciding on the appropriate statistical test to compare means. All values shown represent the mean and standard error of the mean (SEM) for the indicated parameters.
To quantify 5-HT-induced outward currents we measured the following parameters: peak amplitude is the maximum amplitude of the change in current produced by 5-HT; charge is the area under the 5-HT-induced current, measured from the time of 5-HT application until the time when the response returned to baseline; and the decay time constant (τdecay), which was measured via exponential fits of 5-HT-induced current decay.
5-HT-induced currents were determined to be carried by potassium (K+) ions because their reversal potential was similar to the equilibrium potential of potassium (). was calculated from the Nernst equation:
where R is the universal gas constant, T is the temperature in degrees Kelvin, z is the ionic valence (+1 for potassium), F is Faraday’s constant, and [K+]in/out are the K+ concentrations inside and outside the neuron. For an ohmic K+ current, the underlying chord conductance can be calculated as:
where is the peak amplitude of the 5-HT-induced current and is the holding potential.
When analyzing the results of current-clamp experiments, the current threshold (CT) was the current input that elicit the first action potential (AP), while half-width was the duration at half-maximal amplitude of the first AP. The input-output relationship of a neuron was defined as the relationship between AP frequency and amount of depolarizing current applied. It was calculated for each 250 ms epoch during a 5 s depolarizing current ramp. A Boltzmann function was fit to input-output curves:
where is the minimum AP frequency (when no depolarizing current is applied), is maximal AP frequency, the half-maximal AP frequency is , is the amount of current needed to evoke half-maximal AP frequency, and the slope of the function is .
The relationship between the magnitude of the 5-HT response and the distance from the soma was used to determine the spatial resolution of 5-HT uncaging. When uncaging 5-HT near the soma of a neuron, the distance between the center of 10 µm by 10 µm uncaging areas and the center of the soma was measured. When uncaging over 100 µm by 100 µm areas, the distance between the center of the uncaging area and the closest process of the neuron was measured. Using the ImageJ framework for quantifying neuronal structure (SNT), via a FIJI plugin subscription NeuroAnatomy [41], neuronal dendrites were traced to create a binary mask. The distance from center of the uncaging area to the nearest process of the neuron was then determined from a Sholl analysis of the binary mask.
Results
Identification of Claustral PNs
We performed whole-cell patch clamp recordings of the electrical signals of claustral neurons in mouse brain slices. Because the claustrum is a small structure that is challenging to visualize in unstained brain slices, post-hoc immunohistochemistry was used to confirm that all patched neurons were within the parvalbumin-rich core of the claustrum. For this purpose, neurons were filled with neurobiotin via the patch pipette; this allowed the neuron to be identified via streptavidin staining, while the claustrum was identified by anti-parvalbumin antibody staining (Figure 1A).
Like all other brain regions, the claustrum contains a heterogeneous mixture of neurons [38]. Previous work from our lab has established that there are eight subtypes of claustral neurons that can be split into two major groups - projection neurons (PNs) and interneurons - based on their intrinsic electrical properties [38]. We employed the classification scheme of Graf et al. [38] to distinguish claustral PNs from interneurons and further categorised PNs into five subtypes based on a variety of electrical properties. These properties included depolarizing afterpotentials, threshold current for evoking an action potential (AP) and the temporal pattern of AP firing in response to prolonged depolarizations, among other parameters. Examples of APs evoked by depolarization of each type of PN are shown in Figure 1B.
Claustral PNs Are Inhibited by a K+ Conductance Increase
To assess the actions of 5-HT on claustral PNs, 5-HT was applied onto patched, identified PNs. Serotonin was applied via pressure ejection and possible polysynaptic responses were eliminated by treatment with blockers of glutamate receptors (kynurenic acid; KA) and GABA receptors (GABAzine; GBZ). A concentration of 100 µM serotonin, which is ten times the saturating dose reported in most published dose-response curves [42,43,44], was applied to elicit maximal responses. To measure ionic currents induced by 5-HT application, neurons were voltage clamped at a holding potential of -70 mV.
Under these conditions, 5-HT induced a slow and long-lasting outward current in 67.2% (123/182) of claustral PNs (Figure 2A). On average, the outward current peaked 6.3 ± 0.3 seconds (mean ± SEM) after the onset of 5-HT application and reached a maximum amplitude of 22.1 ± 1.7 pA. This outward current decayed gradually, following a single-exponential time course (red line in Figure 2A), with a mean time constant of 19.3 ± 2.2 seconds. The total charge associated with the 5-HT response was 284 ± 35 pC. Notably, even in the absence of KA and GABAzine, an outward current of similar magnitude persisted (n = 13), suggesting that the 5-HT-induced outward current had either minimal or no polysynaptic component (Supplementary Figure S1).
Long-lasting, 5-HT-induced currents are often mediated by K+ currents [45,46,47]. To determine whether K+ mediates the 5-HT-induced outward current observed, an ion-substitution experiment was conducted. Altering the external concentration of K+ around claustral PNs changed the electrochemical gradient and equilibrium potential of K+ (EK), consequently shifting the reversal potential (Erev) of K+ currents. With normal extracellular K+ concentration, the 5-HT-induced current reversed at -95 mV (n = 10; Figure 2B). When the external K+ concentration was increased four-fold, the 5-HT-induced current reversed at -63 mV (n = 6; Figure 2C). In both conditions, the Erev closely matched the calculated EK of -103 mV and -67 mV, respectively (Figure 2D) [38]. Furthermore, since the slope of the current-voltage (I-V) curves was positive, the 5-HT-induced current is attributed to an increase in K+ conductance. The chord conductance of the 5-HT response was calculated from eqn. (2). In normal extracellular K+ conditions, the chord conductance decreased beyond Erev, while it was constant at the same potentials when EK was shifted in elevated extracellular K+ conditions (Figure 2E). Such properties indicate that 5-HT activates an inwardly-rectifying K+ conductance, likely mediated by G-protein-coupled inwardly rectifying K+ (GIRK) channels [45,46,47]. Because Erev for the K+ current was more negative than the action potential threshold (approximately -35 mV) [37,38,82], this 5-HT response should inhibit claustral PNs.
Claustral PN Subtypes Differ in Probability of 5-HT Responses
We next asked whether the response to 5-HT varied across the five subtypes of PNs. All PN subtypes generated outward current responses to 5-HT application (Figure 3A). The only statistically significant difference among these subtypes was the probability of evoking a response (Figure 3B): PN2 neurons showed the highest rate of response to 5-HT (92.9%, 39/42), while PN1 had the lowest response rate (36.8%, 7/19). There were no significant pairwise differences between PN subtypes in terms of the peak amplitude of their 5-HT-induced currents (Figure 3C), nor were there differences in other response parameters such as the magnitude of 5-HT-induced charge, the rate of current decay, or the time to peak response (Table 1). Thus, while all claustral PN subtypes exhibited very similar 5-HT-induced responses, the probability of them responding varied between subtypes.
5-HT Responses Are Generated by Multiple Types of 5-HTRs
5-HT modulates neuronal activity by binding to members of the 5-HTR family [48,49]. The slow time course of the 5-HT-induced K+ conductance suggests the involvement of metabotropic 5-HTRs rather than ionotropic 5-HT3 receptors, which typically mediate rapid excitatory responses. We examined the possible roles of several candidate 5-HTR subtypes, specifically 1A, 2A, and 2C subtypes, which were identified based on their expression in the claustrum and their established roles in 5-HT signaling in other neurons [18,19,20,21,22,23,24,25,26,27,50,51].
To determine which 5-HTRs mediate the inhibitory action of 5-HT on claustral PNs, we compared the 5-HT-induced K+ current of individual neurons before and after applying subtype-specific antagonists (Figure 4A). WAY100635, a selective 5-HTR-1A antagonist [52,53], reduced the mean 5-HT response by 83.1% (n = 16). Thus, 5-HTR-1A plays a predominant role in mediating the 5-HT-induced K+ current. A 5-HTR-2A antagonist, MDL11939 [54,55], decreased the mean 5-HT response by 41.2% (n = 11), indicating partial involvement of this receptor as well. Further, the 5-HTR-2C antagonist RS102221 [56,57,58] also reduced the mean 5-HT response, in this case by 24.7% (n = 15). Thus, ranked according to the ability of antagonists to block the 5-HT-induced K+ current (Figure 4B), the claustrum 5-HT response is primarily mediated by 5-HTR subtypes 1A, 2A, and 2C. Although our sample size was too limited to draw firm conclusions, we did not observe any statistically significant differences in the sensitivity of different claustrum PN subtypes to these 5-HTR antagonists (Supplementary Figure S2). This suggests that heterogeneity in the degree of antagonist blockade of 5-HT responses seen in Figure 4B was not a consequence of PN subtype heterogeneity.
It is notable that the combined amount of blockade produced by 5-HTR-1A, 2A, and 2C antagonists exceeded 100%. This suggests that claustral PNs may express varying compositions of 5-HTRs, with 5-HTR-1A likely being the predominant subtype. Although MDL11939 is at least 100 times more selective for 5-HTR-2A than 5-HTR-2C, and RS102221 shows the reverse selectivity [59], RS102221 exhibits low levels of binding to 5-HTR-2A at the concentration used in these experiments [60]. Similarly, MDL11939, despite having the lowest affinity for 5-HTR-2C among commonly used 5-HTR-2A antagonists [61], may also bind to 5-HTR-2C at the concentration used. Therefore, the 41.2% block produced by MDL11939 likely represents the upper bound of the 5-HT effect mediated by the combined actions of 5-HTR-2A and 5-HTR-3C.
Actions of 5-HT on AP Firing
As mentioned above, the 5-HT-mediated increase in K+ conductance should inhibit action potential (AP) firing, because Erev for the response (-95 mV; Figure 2D) is more negative than the AP threshold of all claustrum PNs (approximately -35 mV [37,38,62]). To determine the actions of 5-HT on AP firing, we examined claustrum PNs under current-clamp conditions: depolarizing current pulses were applied to evoke APs firing prior to and following application of 5-HT (Figure 5A). This protocol allowed each neuron to serve as its own control and increased the robustness of our measurements. For this purpose, four rectangular current pulses (1 s duration) with amplitudes of 150, 200, 250, and 300 pA — well above the mean current threshold (CT) of PNs [38] — were delivered in the absence and presence of 5-HT (Figure 5B). In all experiments, 5-HT was applied 5 seconds prior to the depolarizations to ensure that current pulses aligned with the peak of the 5-HT-induced current.
Under these conditions, 5-HT hyperpolarized the resting membrane potential of PNs (Figure 5A) and inhibited AP firing (Figure 5B; n = 9). Although 5-HT reduced AP firing throughout each depolarizing current step, the initial burst of APs observed at the beginning of the depolarization [38,63] persisted in the presence of 5-HT (Figure 5B). To quantify the actions of 5-HT on AP firing, we determined the relationship between the amount of depolarizing current applied and the frequency of the resulting APs. Such input-output (I-O) curves showed that while larger depolarizations evoked more APs, at all stimulus levels 5-HT produced a consistent reduction in AP frequency (Figure 5C). In summary, we conclude that the increase in K+ conductance evoked by 5-HT does inhibit AP firing in claustral PNs.
The characteristic time course of the 5-HT-induced K+ conductance in claustral PNs should affect firing of APs in a time-dependent manner. To examine this possibility, we varied the time interval between application of 5-HT and depolarizing stimuli. Because PNs required long time intervals (approximately 1 minute) to recover from each of the rectangular current pulses used in the experiments shown in Figure 5, we instead examined the timing of 5-HT effects by using ramps of depolarizing current to evoke APs (5 s duration, 400 pA peak amplitude; Figure 6A).
With this paradigm, we found that APs evoked by current ramps were maximally inhibited 5-10 s after 5-HT application (n = 13; Figure 6B, pink). The time course of mean changes in AP firing produced by 5-HT tracked the time course of the conductance changes induced by 5-HT (Figure 6B, purple). In individual experiments, the magnitude of the 5-HT-induced conductance change was also correlated with changes in the number of APs produced by 5-HT (Figure 6C; Pearson’s r = 0.39, p = 4.5 x 10⁻³). Similarly, 5-HT-induced changes in CT tracked the time course of the 5-HT-induced conductance change (Figure 6D) and the magnitude of 5-HT-induced CT changes in individual PNs was also correlated with the magnitude of the K+ conductance increased produced by 5-HT in each cell (Figure 6E; Pearson’s r = 0.64, p = 4 x 10⁻⁷). These results demonstrate that the 5-HT-induced changes in AP firing dynamics are time-locked to the 5-HT-induced K+ conductance, thereby providing additional evidence that this conductance is responsible for the observed inhibition of AP firing.
5-HT Causes a Subtractive Reduction in PN Output
Modulation of neuronal activity can be characterized as arithmetic operations [64,65]. The form of the I-O curve reveals whether such operations are linear or non-linear: a shift in the I-O curve along the x- or y-axes reflects linear additive or subtractive changes (Figure 7A, left), while changes in I-O curve slope indicate non-linear multiplicative or divisive modulation of neuronal gain (Figure 7A, right). To assess the effect of serotonergic inhibition on claustral PN arithmetic, we examined how AP output changed in response to depolarizing current input. This experiment again relied on ramps of depolarizing current (5 s duration, 400 pA peak amplitude), as in Figure 6A, and 5-HT was applied 5 s prior to the current ramp, a time interval that yields maximal inhibition of AP firing (Figure 6B). APs evoked by the current ramps were binned into 20 epochs (250 ms each) to produce the I-O curves shown in Figure 7B, restricting our analysis to PNs that fired APs throughout the entire current ramp (n = 19).
Under control conditions, there was a sigmoidal relationship between current input and AP output (Figure 7B, black). This I-O curve was fitted with a Boltzmann function (eqn. (3)), allowing quantification of control I-O parameters. Upon 5-HT application, the I-O curve shifted rightward, requiring a 32.3 ± 8.9 pA (23%) increase in current input to achieve half-maximal AP output (Input50; Figure 7C). The magnitude and polarity of this shift is consistent with the 5-HT-induced outward current measured under voltage-clamp conditions at -70 mV (24.7 ± 4.6 pA), near the resting potential of PNs. The slope of the I-O curve was unchanged by 5-HT (Figure 7D), indicating no change in PN gain. Further, other parameters such as half-maximal and maximal AP frequency were also unaffected (Figure 7E,F). These findings indicate that 5-HT induces a linear, subtractive decrease in claustral PN output, where a larger depolarizing current is required to reach the same AP output. Such an effect is consistent with the increased K+ conductance elicited by 5-HT application.
5-HTRs Are Distributed Throughout Claustral PN Compartments
In many brain regions, 5-HTRs are localized to different compartments of neurons, with such compartmentalization thought to influence neuronal output and contribute to diversification of 5-HT responses [66,67]. To determine the location of 5-HTRs on claustral PNs, we focally uncaged 5-HT over PNs while measuring their electrical responses via patch-clamp recording. This approach has previously been employed to identify receptor location in neurons [68,69,70] and, in optimal conditions, can even map the distribution of receptors on individual dendritic spines [68,71]. Unlike anatomical techniques such as immunohistochemistry or fluorescent tagging of receptors [20,24,50,51], this functional approach yields insights into both the subcellular location and biological actions of the receptors.
In our experiments, individual claustral PNs were filled with a fluorescent dye to visualize their structure. 5-HT was then photoreleased by illuminating BHQ-O-5-HT (10 µM) - a light-sensitive caged compound that generates free 5-HT upon light absorption [72,73] - over visually identified compartments of the neuron. BHQ-O-5-HT initially was uncaged over a large area (100 µm by 100 µm) centered over PN somata (Figure 8A1). Light (405 nm) was applied for 1 s while holding the neuron at a membrane potential of -30 mV to increase the electrochemical driving force for K+ efflux and, thereby, improve the signal-to-noise ratio of the light-induced K+ current. To define the spatial resolution of uncaging, the light spot was systematically positioned away from the PN. The amplitude of responses to uncaged 5-HT decreased as the light spot moved away from the PN cell body (Figure 8A2,A3). This effect was quantified by measuring the relationship between light-induced responses and distance from the PN, taking into account the position of dendrites within the uncaging area. Both the peak amplitude and charge of responses to uncaged 5-HT decreased exponentially with distance away from the PN (n = 7; Figure 8B,C). The length constant of this exponential decay was 20 µm, when measuring peak current amplitude, and 11 µm for the less noisy measurements of response charge. Therefore, although BHQ-O-5-HT was uncaged over a 100 µm by 100 µm area, the effective range of free 5-HT was larger (approximately 122 µm by 122 µm, based on the more reliable charge measurements). For uncaging spots 10 µm by 10 µm in area, the length constant measured for response charge improved to 5 µm to yield an effective spatial range of approximately 20 µm by 20 µm (Supplementary Figure S3).
For 100 µm by 100 µm light spots centered over PN cell bodies (Figure 9A, left), uncaged 5-HT reached a significant fraction of the spatial extent of a typical claustral PN 3. We therefore refer to responses to uncaging BHQ-O-5-HT over such areas as “whole neuron” responses (Figure 9A, right). These responses were observed in 92.6% (50/54) of claustral PNs examined. They had a peak amplitude of 13.9 ± 1.0 pA (mean + 1 SEM), a mean charge of 17.0 ± 3.8 pC and decayed exponentially, with a time constant of 0.7 ± 0.2 s. These parameters are different from those of the responses to pressure-applied 5-HT described above. Probably 5-HT uncaging yielded a higher response rate because the depolarized holding potential used enhanced the detection of small K+ conductance responses. Changes in other response properties likely resulted from the more restricted volume of 5-HT delivery produced by BHQ-O-5-HT uncaging.
To improve the spatial resolution for localizing 5-HTRs, we next used the smaller uncaging spot (10 µm by 10 µm). When these smaller light spots were used to uncage BHQ-O-5-HT over the soma of claustral PNs (red square in Figure 9A, left), very small outward currents were elicited (n = 50; “soma” in Figure 9A, right). These currents were typically only a few pA in peak amplitude, had a charge of 4.5 ± 1.2 pC and a decay time constant of 0.6 ± 0.1 s. These results indicate that 5-HTRs are present on the soma of PNs. However, when we used similar light spots to uncage BHQ-O-5-HT over individual dendrites (small purple square in Figure 9A, left), no 5-HT-induced outward currents were detectable (“1 dendrite” in Figure 9A, right). Because the responses to uncaging BHQ-O-5-HT over most of the neuron were several-fold larger than those produced by uncaging only over somata, we conclude that dendrites must also have 5-HTRs. However, it is likely that the poor signal-to-noise ratio of responses to uncaged BHQ-O-5-HT prevented our detection of the tiny currents likely to be produced by uncaging BHQ-O-5-HT over thin, individual dendrites.
To assess 5-HTRs on the dendrites of claustral PNs, we compared “whole neuron” responses to those measured when BHQ-O-5-HT was uncaged only over the soma. The charge associated with responses to somatic uncaging was 31% of that of “whole neuron” responses, indicating that at least 69% of the response to uncaged 5-HT originated from a non-somatic compartment (Figure 9B). The difference between “whole neuron” and “soma” responses should approximately reflect the dendritic contribution to the response to uncaged 5-HT; we therefore refer to this component as the "calculated dendrite” response in Figure 9B (n = 50). Consistent with this assumption, uncaging 5-HT over areas that included dendrites but excluded somata (large purple square in Figure 9A, left) evoked measurable responses (“dendrites” in Figure 9A, right). The mean charge of these responses was 5.7 ± 0.6 pC, which was roughly one-third the magnitude of the “calculated dendrite” responses (Figure 9C). This difference probably arises from 5-HT being uncaged over only a fraction of the PN dendritic arbor during the “dendrite” responses. In summary, 5-HTRs are present on dendrites. Indeed, our measurements indicate that most 5-HTRs are located in the dendritic compartment; this likely reflects the nearly 10-time larger surface area of PN dendrites compared to their somata [74].
To identify the 5-HTR subtypes mediating these responses, we examined the effect of the 5-HTR-1A antagonist WAY100635 (1 µM) on somatic and dendritic responses to uncaged 5-HT. 5-HTR-1A is the primary contributor to the 5-HT-induced K+ conductance (Figure 4). Because PN recordings could only be maintained for a limited time, while antagonist application required several minutes, uncaging of BHQ-O-5-HT was done at a time when the concentration of WAY100635 at the PNs may not yet have reached 1 µM. Nonetheless WAY100635 reduced responses to uncaged BHQ-O-5-HT (n = 7; Figure 10A). This effect was observed across all PN compartments: in all cases, the 5-HT-induced outward current was smaller in the presence of WAY100635 compared to control conditions (Figure 10B). Thus, 5-HTR-1A are present on both PN somata and dendrites. While dendritic responses apparently were blocked more strongly than somatic responses (Figure 10C), this difference was not statistically significant (Table 1). Responses in none of these compartments were completely blocked by WAY100635. This could be due to the presence of other 5-HTRs, presumably 2A and 2C subtypes, on the somata and dendrites of claustral PNs and/or due to insufficient time allowed for WAY100635 to act fully.
Discussion
Here, we provide evidence that the output neurons of the claustrum are inhibited by 5-HT. Whole-cell patch-clamp recordings from over 180 claustral PNs revealed the mechanisms underlying serotonergic inhibition, namely a K+ conductance increase primarily mediated by 5-HTR-1A. This serotonergic inhibition reduces neuronal excitability through hyperpolarization, making it more difficult for neurons to fire action potentials. Using caged 5-HT, we also identified the presence of 5-HTRs on the somata and dendrites of claustral PNs, with 5-HTR-1A being present on both compartments.
Most claustral PNs generated a long-lasting K+ current in response to 5-HT. Due to the rectification of this K+ conductance at potentials more positive than EK, it is likely that GIRK channels are involved [45,46,47]. GIRK4, a channel rarely expressed in the brain, may play a role in this response given its high expression in the claustrum [75,76]. Further investigation into the specific G proteins and GIRK channels involved in this process will be an important direction for future research.
Type 1A, 2A, and 2C 5-HTRs are the metabotropic receptors most likely involved in the 5-HT response, based on their expression levels in the claustrum and their established roles in 5-HT signaling elsewhere in the brain. Among these, 5-HTR-1A appears to mediate most of the 5-HT response in PNs. The contribution of each receptor type to the outward current evoked by 5-HT varied across PNs, and this heterogeneity probably cannot be explained by the diversity of PN subtypes. Comparing our results with single-cell transcriptome data from mouse claustral PNs [77], we found that 5-HTR-1A, 2A, and 2C are heterogeneously expressed, which may account for the variability in 5-HT responses. Application of specific 5-HT agonists reveals that serotonergic inhibition in the lizard claustrum is mediated by 5-HTR-1A and is responsible for suppression of claustrum-generated slow-wave ripples [17]. This indicates an evolutionarily conserved function for 5-HTR-1A in both mammals and reptiles and suggest that this receptor enables the claustrum to be active during sleep, when global 5-HT levels are low.
Our findings align with previous reports of inhibitory 5-HT responses in other types of neurons. 5-HTR-1A inhibits various neurons by activating GIRK channels [48,49,75,78]. While 5-HTR-2A and 5-HTR-2C are typically associated with excitatory responses in many cortical regions [79,80], we found evidence that both receptors contribute to inhibitory 5-HT responses in claustral PNs. This is consistent with growing evidence for 5-HTR-2A-mediated inhibitory responses in other brain areas, such as the anterior piriform cortex [81] and prefrontal cortex [82]. The variability in responses mediated by these receptors may be attributed to several factors, particularly downstream subcellular signaling cascades [83,84]. Additionally, recent evidence suggests the presence of functional intracellular 5-HTR-2A in neurons [85], which could explain why high 5-HTR-2A expression in the claustrum does not lead to a 5-HTR-2A-dominant effect when 5-HT is applied to claustral neurons. Another potential source of variability is mRNA editing of 5-HTR-2C, which can produce multiple isoforms with potentially different physiological effects [18,84,86,87]. Finally, heterodimerization of 5-HTRs with other 5-HT or non-5-HT receptors may activate different G proteins, leading to diverse downstream effects [88].
To understand how 5-HTR-mediated inhibition affects information coding in claustral PNs, we examined how 5-HT altered AP firing and the I-O functions of PNs. Our experiments showed that 5-HT inhibits PN output by increasing the threshold current required to trigger an AP, thereby reducing AP firing rate. These effects are due to 5-HT hyperpolarizing the resting membrane potential and decreasing input resistance [89,90,91]. Collectively, these effects were reflected in a rightward shift in the I-O curve. Maintaining burst spikes in the presence of 5-HT [38,63] suggests that 5-HT does not modulate the ionic conductances responsible for burst spiking [84]. The role of 5-HTR-1A in this subtractive effect of 5-HT is consistent with findings that 5-HTR-1A hyperpolarizes and suppresses spontaneous activity in mouse visual cortical neurons [84,92]. Other 5-HTRs, such as 2A and 2C, may also contribute to the subtractive effect in claustral PNs, though apparently to a lesser extent.
Until now, there have been no analyses of 5-HTR-1A localization across different compartments of claustrum neurons. To link the location of 5-HTRs with their functional output, we combined 5-HT uncaging on individual PNs with electrophysiology. This is the first time focal uncaging has been applied to any neuron for analysis of 5-HTR localization. Several versions of caged 5-HT have been synthesized, including RuBi-5-HT [93] and NPEC-5-HT [94,95]. We used BHQ-O-5-HT because of its optimal spectral separation from the fluorescent dye that was employed to visualize neuronal structure and stability [72,73].
We found that this uncaging approach to localizing 5-HTRs suffers from low signal-to-noise ratio. Uncaging BHQ-O-5-HT for relatively long times, and over relatively large volumes, reduced the effective spatial resolution. Nonetheless, the resolution was adequate to reveal new information about the location of 5-HTRs on claustrum PNs. Specifically, we found that 5-HTRs are present on both the cell bodies and dendrites of these neurons. The larger outward current responses observed when uncaging BHQ-O-5-HT over groups of dendrites, compared to the smaller current at the soma, likely reflects the greater surface area of the dendrites [74]. Further, we found that at least part of these responses on both PN compartments were mediated by 5-HTR-1A. This differs from findings in neurons in the prefrontal cortex, where 5-HTR-1A are compartmentalized to either somata or dendrites [66,67].
Although the exact site of 5-HT release onto claustral PNs is unknown, 5-HT likely broadly affects these neurons through volume transmission, diffusing widely in the extracellular space [96]. This suggests that 5-HT activates 5-HTR-1A on both dendrites and somata, causing widespread hyperpolarization. As a result, stronger excitatory synaptic input would be required on the dendrites to generate the same output at the soma, resembling the effects on neuronal arithmetic observed when interneurons inhibit cortical PNs [97,98,99]. Thus, the broad distribution of 5-HTRs in claustral PNs likely explains the observed effects of 5-HT on claustral neuronal arithmetic (Figure 7).
Conclusions
We have found that 5-HT inhibits claustral PNs and have elucidated the mechanisms underlying this inhibition. We also established a method to visualize 5-HTR localization using caged 5-HT and whole-cell patch-clamp recording. Further research on serotonergic inhibition in the claustrum, particularly regarding 5-HT release and its effects in vivo, will deepen our understanding of the claustrum. Serotonergic inhibition of the claustrum may also provide insights into broader phenomena such as sleep, psychedelic action, and neuropsychiatric disorders.
While this paper was in preparation, two other groups reported results consistent with ours. An abstract has indicated that 5-HT inhibits excitatory synaptic transmission between the cortex and claustrum [100], supporting our findings of widespread 5-HT inhibition of claustral PNs. A very recently published paper [101] reports that 5-HT hyperpolarizes claustrum neurons and inhibits their AP firing, effects that are mediated by multiple 5-HTR types. We have observed very similar effects and have provided a mechanistic explanation for them.
Supplementary Materials
The following supporting information can be downloaded at the website of this paper posted on Preprints.org: Figure S1: Lack of polysynaptic component of 5-HT responses; Figure S2: Effects of 5-HTR antagonists on PN subtypes; Figure S3: Spatial resolution of 5-HT uncaging for a 10 µm by 10 µm area of photolysis.
Author Contributions
K.L.L.W. was responsible for experimental work and data analysis; K.L.L.W. and G.J.A. were responsible for experimental design; K.L.L.W., M.G. and G.J.A. were jointly responsible for manuscript writing.
Funding
This work was supported by research grant MOE2017-T3-1-002 from the Singapore Ministry of Education and by the Temasek Life Sciences Laboratory.
Institutional Review Board Statement
All animal procedures used were approved by the Institutional Animal Care and Use Committees of NTU and TLL.
Data Availability Statement
Upon acceptance of this paper, data will be deposited in a publicly accessible database.
Acknowledgments
We thank A. Nair, Z. Chia, and G. X. Ham for insightful discussions and comments on our paper. The results described in this paper represent part of the Ph.D. thesis of K.L.L.W. at Nanyang Technological University [102].
Conflicts of Interest
The authors declare no conflicts of interest. The funders had no role in the design of the study; in the collection, analyses, or interpretation of data; in the writing of the manuscript; or in the decision to publish the results.
Declaration of Generative AI and AI-Assisted Technologies in the Writing Process
During the preparation of this work, the authors used ChatGPT to improve English usage within the text. After using this tool, the authors carefully reviewed, edited and futher improved the content. The authors take full responsibility for the content of the published article.
References
- Torgerson, C.M., Irimia, A., Goh, S.Y.M., and Van Horn, J.D. (2015). The DTI connectivity of the human claustrum. Hum. Brain Mapp. 36, 827-838. [CrossRef]
- Wang, Q., Ng, L., Harris, J.A., Feng, D., Li, Y., Royall, J.J., Oh, S.W., Bernard, A., Sunkin, S.M., Koch, C., and Zeng, H. (2017). Organization of the connections between claustrum and cortex in the mouse. The Journal of comparative neurology 525, 1317-1346. [CrossRef]
- Wang, Y., Xie, P., Gong, H., Zhou, Z., Kuang, X., Wang, Y., Li, A.-a., Li, Y., Liu, L., Veldman, M.B., et al. (2019). Complete single neuron reconstruction reveals morphological diversity in molecularly defined claustral and cortical neuron types. bioRxiv, 675280. [CrossRef]
- Zingg, B., Dong, H.-W., Tao, H.W., and Zhang, L.I. (2018). Input–output organization of the mouse claustrum. The Journal of comparative neurology 526, 2428-2443. [CrossRef]
- Sherk, H. (1986). The claustrum and the cerebral cortex. In Sensory-motor areas and aspects of cortical connectivity, E.G. Jones, and A. Peters, eds. (Springer), pp. 467-499. [CrossRef]
- Atlan, G., Terem, A., Peretz-Rivlin, N., Groysman, M., and Citri, A. (2017). Mapping synaptic cortico-claustral connectivity in the mouse. The Journal of comparative neurology 525, 1381-1402. [CrossRef]
- Crick, F.C., and Koch, C. (2005). What is the function of the claustrum? Philos Trans R Soc Lond B Biol Sci 360, 1271-1279. [CrossRef]
- Atilgan, H., Doody, M., Oliver, D.K., McGrath, T.M., Shelton, A.M., Echeverria-Altuna, I., Tracey, I., Vyazovskiy, V.V., Manohar, S.G., and Packer, A.M. (2022). Human lesions and animal studies link the claustrum to perception, salience, sleep and pain. Brain 145, 1610-1623. [CrossRef]
- Jackson, J., Smith, J.B., and Lee, A.K. (2020). The Anatomy and Physiology of Claustrum-Cortex Interactions. Annu Rev Neurosci 43, 231-247. [CrossRef]
- Madden, M.B., Stewart, B.W., White, M.G., Krimmel, S.R., Qadir, H., Barrett, F.S., Seminowicz, D.A., and Mathur, B.N. (2022). A role for the claustrum in cognitive control. Trends Cogn Sci 26, 1133-1152. [CrossRef]
- Wong, K.L.L., Nair, A., and Augustine, G.J. (2021). Changing the Cortical Conductor's Tempo: Neuromodulation of the Claustrum. Front Neural Circuits 15, 658228.
- Jouvet, M. (1999). Sleep and serotonin: an unfinished story. Neuropsychopharmacology 21, 24-27. [CrossRef]
- Monti, J.M. (2010). The role of dorsal raphe nucleus serotonergic and non-serotonergic neurons, and of their receptors, in regulating waking and rapid eye movement (REM) sleep. Sleep Med Rev 14, 319-327. [CrossRef]
- Portas, C.M., Bjorvatn, B., and Ursin, R. (2000). Serotonin and the sleep/wake cycle: special emphasis on microdialysis studies. Prog. Neurobiol. 60, 13-35. [CrossRef]
- Atlan, G., Matosevich, N., Peretz-Rivlin, N., Yvgi, I., Chen, E., Kleinman, T., Bleistein, N., Sheinbach, E., Groysman, M., Nir, Y., and Citri, A. (2021). Claustral projections to anterior cingulate cortex modulate engagement with the external world. bioRxiv, 2021.2006.2017.448649. [CrossRef]
- Narikiyo, K., Mizuguchi, R., Ajima, A., Shiozaki, M., Hamanaka, H., Johansen, J.P., Mori, K., and Yoshihara, Y. (2020). The claustrum coordinates cortical slow-wave activity. Nat. Neurosci. [CrossRef]
- Norimoto, H., Fenk, L.A., Li, H.H., Tosches, M.A., Gallego-Flores, T., Hain, D., Reiter, S., Kobayashi, R., Macias, A., Arends, A., et al. (2020). A claustrum in reptiles and its role in slow-wave sleep. Nature 578, 413-418. [CrossRef]
- Olaghere Da Silva, U., Morabito, M., Canal, C., Airey, D., Emeson, R., and Sanders-Bush, E. (2010). Impact of RNA editing on functions of the serotonin 2C receptor in vivo. Front. Neurosci. 4.
- Kinsey, A.M., Wainwright, A., Heavens, R., Sirinathsinghji, D.J., and Oliver, K.R. (2001). Distribution of 5-ht(5A), 5-ht(5B), 5-ht(6) and 5-HT(7) receptor mRNAs in the rat brain. Brain research. Molecular brain research 88, 194-198. [CrossRef]
- Mengod, G., Nguyen, H., Le, H., Waeber, C., Lubbert, H., and Palacios, J.M. (1990). The distribution and cellular localization of the serotonin 1C receptor mRNA in the rodent brain examined by in situ hybridization histochemistry. Comparison with receptor binding distribution. Neuroscience 35, 577-591. [CrossRef]
- Pompeiano, M., Palacios, J.M., and Mengod, G. (1994). Distribution of the serotonin 5-HT2 receptor family mRNAs: comparison between 5-HT2A and 5-HT2C receptors. Brain research. Molecular brain research 23, 163-178. [CrossRef]
- Rioux, A., Fabre, V., Lesch, K.P., Moessner, R., Murphy, D.L., Lanfumey, L., Hamon, M., and Martres, M.P. (1999). Adaptive changes of serotonin 5-HT2A receptors in mice lacking the serotonin transporter. Neurosci Lett 262, 113-116. [CrossRef]
- Ward, R.P., and Dorsa, D.M. (1996). Colocalization of serotonin receptor subtypes 5-HT2A, 5-HT2C, and 5-HT6 with neuropeptides in rat striatum. The Journal of comparative neurology 370, 405-414. [CrossRef]
- Wright, D.E., Seroogy, K.B., Lundgren, K.H., Davis, B.M., and Jennes, L. (1995). Comparative localization of serotonin1A, 1C, and 2 receptor subtype mRNAs in rat brain. The Journal of comparative neurology 351, 357-373. [CrossRef]
- Hamada, S., Senzaki, K., Hamaguchi-Hamada, K., Tabuchi, K., Yamamoto, H., Yamamoto, T., Yoshikawa, S., Okano, H., and Okado, N. (1998). Localization of 5-HT2A receptor in rat cerebral cortex and olfactory system revealed by immunohistochemistry using two antibodies raised in rabbit and chicken. Brain research. Molecular brain research 54, 199-211. [CrossRef]
- Dawson, T., Gehlert, D., McCabe, R., Barnett, A., and Wamsley, J. (1986). D-1 dopamine receptors in the rat brain: a quantitative autoradiographic analysis. J. Neurosci. 6, 2352-2365.
- Gawliński, D., Smaga, I., Zaniewska, M., Gawlińska, K., Faron-Górecka, A., and Filip, M. (2019). Adaptive mechanisms following antidepressant drugs: focus on serotonin 5-HT2A receptors. Pharmacol. Rep. 71, 994-1000. [CrossRef]
- Vertes, R.P. (1991). A PHA-L analysis of ascending projections of the dorsal raphe nucleus in the rat. The Journal of comparative neurology 313, 643-668. [CrossRef]
- Zhang, X., Hannesson, D.K., Saucier, D.M., Wallace, A.E., Howland, J., and Corcoran, M.E. (2001). Susceptibility to kindling and neuronal connections of the anterior claustrum. J. Neurosci. 21, 3674-3687.
- Peyron, C., Petit, J.M., Rampon, C., Jouvet, M., and Luppi, P.H. (1998). Forebrain afferents to the rat dorsal raphe nucleus demonstrated by retrograde and anterograde tracing methods. Neuroscience 82, 443-468. [CrossRef]
- Muzerelle, A., Scotto-Lomassese, S., Bernard, J.F., Soiza-Reilly, M., and Gaspar, P. (2016). Conditional anterograde tracing reveals distinct targeting of individual serotonin cell groups (B5–B9) to the forebrain and brainstem. Brain Struct. Funct. 221, 535-561. [CrossRef]
- Rahman, F.E., and Baizer, J.S. (2007). Neurochemically defined cell types in the claustrum of the cat. Brain Res. 1159, 94-111. [CrossRef]
- Martin, D.A., and Nichols, C.D. (2016). Psychedelics recruit multiple cellular types and produce complex transcriptional responses within the brain. EBioMedicine 11, 262-277. [CrossRef]
- Nichols, D.E. (2016). Psychedelics. Pharmacol. Rev. 68, 264-355. [CrossRef]
- Barrett, F.S., Krimmel, S.R., Griffiths, R., Seminowicz, D.A., and Mathur, B.N. (2020). Psilocybin acutely alters the functional connectivity of the claustrum with brain networks that support perception, memory, and attention. NeuroImage, 116980. [CrossRef]
- Snider, S.B., Hsu, J., Darby, R.R., Cooke, D., Fischer, D., Cohen, A.L., Grafman, J.H., and Fox, M.D. (2020). Cortical lesions causing loss of consciousness are anticorrelated with the dorsal brainstem. Hum. Brain Mapp. 41, 1520-1531. [CrossRef]
- Chia, Z., Silberberg, G., and Augustine, G.J. (2017). Functional properties, topological organization and sexual dimorphism of claustrum neurons projecting to anterior cingulate cortex. Claustrum 2, 1357412. [CrossRef]
- Graf, M., Nair, A., Wong, K.L.L., Tang, Y., and Augustine, G.J. (2020). Identification of mouse claustral neuron types based on their intrinsic electrical properties. eNeuro 7, ENEURO.0216-0220.2020.
- Schindelin, J., Arganda-Carreras, I., Frise, E., Kaynig, V., Longair, M., Pietzsch, T., Preibisch, S., Rueden, C., Saalfeld, S., Schmid, B., et al. (2012). Fiji: an open-source platform for biological-image analysis. Nat. Methods 9, 676-682. [CrossRef]
- R Core Team (2021). R: A language and environment for statistical computing. https://www.R-project.org/.
- Arshadi, C., Günther, U., Eddison, M., Harrington, K.I.S., and Ferreira, T.A. (2021). SNT: a unifying toolbox for quantification of neuronal anatomy. Nat. Methods 18, 374-377. [CrossRef]
- Backstrom, J.R., Chang, M.S., Chu, H., Niswender, C.M., and Sanders-Bush, E. (1999). Agonist-directed signaling of serotonin 5-HT2C receptors: differences between serotonin and lysergic acid diethylamide (LSD). Neuropsychopharmacology 21, 77s-81s. [CrossRef]
- Maeda, K., Sugino, H., Akazawa, H., Amada, N., Shimada, J., Futamura, T., Yamashita, H., Ito, N., McQuade, R.D., Mørk, A., et al. (2014). Brexpiprazole I: in vitro and in vivo characterization of a novel serotonin-dopamine activity modulator. J. Pharmacol. Exp. Ther. 350, 589-604. [CrossRef]
- Sodickson, D.L., and Bean, B.P. (1998). Neurotransmitter activation of inwardly rectifying potassium current in dissociated hippocampal CA3 neurons: Interactions among multiple receptors. J. Neurosci. 18, 8153-8162.
- del Burgo, L.S., Cortes, R., Mengod, G., Zarate, J., Echevarria, E., and Salles, J. (2008). Distribution and neurochemical characterization of neurons expressing GIRK channels in the rat brain. J Comp Neurol 510, 581-606. [CrossRef]
- Jaén, C., and Doupnik, C.A. (2005). Neuronal Kir3.1/Kir3.2a channels coupled to serotonin 1A and muscarinic m2 receptors are differentially modulated by the ‘short’ RGS3 isoform. Neuropharmacology 49, 465-476. [CrossRef]
- Montalbano, A., Corradetti, R., and Mlinar, B. (2015). Pharmacological characterization of 5-HT1A autoreceptor-coupled GIRK channels in rat dorsal raphe 5-HT neurons. PLoS One 10, e0140369.
- Ciranna, L. (2006). Serotonin as a modulator of glutamate- and GABA-mediated neurotransmission: implications in physiological functions and in pathology. Curr Neuropharmacol 4, 101-114.
- Nichols, D.E., and Nichols, C.D. (2008). Serotonin receptors. Chemical reviews 108, 1614-1641. [CrossRef]
- Palchaudhuri, M., and Flügge, G. (2005). 5-HT1A receptor expression in pyramidal neurons of cortical and limbic brain regions. Cell Tissue Res. 321, 159-172. [CrossRef]
- Pazos, A., Probst, A., and Palacios, J.M. (1987). Serotonin receptors in the human brain--III. Autoradiographic mapping of serotonin-1 receptors. Neuroscience 21, 97-122. [CrossRef]
- el Mansari, M., and Blier, P. (1997). In vivo electrophysiological characterization of 5-HT receptors in the guinea pig head of caudate nucleus and orbitofrontal cortex. Neuropharmacology 36, 577-588. [CrossRef]
- Johansson, L., Sohn, D., Thorberg, S.-O., Jackson, D.M., Kelder, D., Larsson, L.-G., Rényi, L., Ross, S.B., Wallsten, C., Eriksson, H., et al. (1997). The pharmacological characterization of a novel selective 5-hydroxytryptamine 1A receptor antagonist, NAD-299. J. Pharmacol. Exp. Ther. 283, 216-225.
- Tang, Z.-Q., and Trussell, L.O. (2015). Serotonergic regulation of excitability of principal cells of the dorsal cochlear nucleus. J. Neurosci. 35, 4540-4551.
- Zhang, Z. (2003). Serotonin induces tonic firing in layer V pyramidal neurons of rat prefrontal cortex during postnatal development. J. Neurosci. 23, 3373-3384.
- Austgen, J.R., Dantzler, H.A., Barger, B.K., and Kline, D.D. (2012). 5-Hydroxytryptamine 2C receptors tonically augment synaptic currents in the nucleus tractus solitarii. J Physiol 108, 2292-2305. [CrossRef]
- Bocchio, M., Fucsina, G., Oikonomidis, L., McHugh, S.B., Bannerman, D.M., Sharp, T., and Capogna, M. (2015). Increased serotonin transporter expression reduces fear and recruitment of parvalbumin interneurons of the amygdala. Neuropsychopharmacology 40, 3015-3026. [CrossRef]
- Huang, C.-C., Liang, Y.-C., Lee, C.-C., Wu, M.-Y., and Hsu, K.-S. (2009). Repeated cocaine administration decreases 5-HT2A receptor-mediated serotonergic enhancement of synaptic activity in rat medial prefrontal cortex. Neuropsychopharmacology 34, 1979-1992. [CrossRef]
- Aloyo, V.J., and Harvey, J.A. (2000). Antagonist binding at 5-HT(2A) and 5-HT(2C) receptors in the rabbit: high correlation with the profile for the human receptors. European journal of pharmacology 406, 163-169. [CrossRef]
- Knight, A.R., Misra, A., Quirk, K., Benwell, K., Revell, D., Kennett, G., and Bickerdike, M. (2004). Pharmacological characterisation of the agonist radioligand binding site of 5-HT2A, 5-HT2B and 5-HT2C receptors. Naunyn Schmiedebergs Arch. Pharmacol. 370, 114-123. [CrossRef]
- Pehek, E.A., Nocjar, C., Roth, B.L., Byrd, T.A., and Mabrouk, O.S. (2006). Evidence for the Preferential Involvement of 5-HT2A Serotonin Receptors in Stress- and Drug-Induced Dopamine Release in the Rat Medial Prefrontal Cortex. Neuropsychopharmacology 31, 265-277. [CrossRef]
- Nair, A., Teo, Y.Y., Augustine, G.J., and Graf, M. (2023). A functional logic for neurotransmitter corelease in the cholinergic forebrain pathway. Proc Natl Acad Sci U S A 120, e2218830120. [CrossRef]
- White, M.G., and Mathur, B.N. (2018). Claustrum circuit components for top-down input processing and cortical broadcast. Brain Struct. Funct. 223, 3945-3958. [CrossRef]
- Ferguson, K.A., and Cardin, J.A. (2020). Mechanisms underlying gain modulation in the cortex. Nature reviews. Neuroscience 21, 80-92. [CrossRef]
- Silver, R.A. (2010). Neuronal arithmetic. Nature reviews. Neuroscience 11, 474-489. [CrossRef]
- Celada, P., Puig, M.V., and Artigas, F. (2013). Serotonin modulation of cortical neurons and networks. Front. Integr. Neurosc. 7.
- Savalia, N.K., Shao, L.-X., and Kwan, A.C. (2021). A dendrite-focused framework for understanding the actions of ketamine and psychedelics. Trends Neurosci. 44, 260-275. [CrossRef]
- Ellis-Davies, G.C.R. (2019). Two-photon uncaging of glutamate. Front. Synaptic Neurosci. 10.
- Pettit, D.L., Wang, S.S., Gee, K.R., and Augustine, G.J. (1997). Chemical two-photon uncaging: a novel approach to mapping glutamate receptors. Neuron 19, 465-471. [CrossRef]
- Wang, S.S., and Augustine, G.J. (1995). Confocal imaging and local photolysis of caged compounds: dual probes of synaptic function. Neuron 15, 755-760. [CrossRef]
- Kasai, H., Ucar, H., Morimoto, Y., Eto, F., and Okazaki, H. (2023). Mechanical transmission at spine synapses: Short-term potentiation and working memory. Curr Opin Neurobiol 80, 102706. [CrossRef]
- Rea, A.C., Vandenberg, L.N., Ball, R.E., Snouffer, A.A., Hudson, A.G., Zhu, Y., McLain, D.E., Johnston, L.L., Lauderdale, J.D., Levin, M., and Dore, T.M. (2013). Light-activated serotonin for exploring its action in biological systems. Chemistry & biology 20, 1536-1546. [CrossRef]
- Vandenberg, L.N., Blackiston, D.J., Rea, A.C., Dore, T.M., and Levin, M. (2014). Left-right patterning in Xenopus conjoined twin embryos requires serotonin signaling and gap junctions. The International journal of developmental biology 58, 799-809.
- Escobar, C., and Salas, M. (1995). Dendritic branching of claustral neurons in neonatally undernourished rats. Biology of the neonate 68, 47-54. [CrossRef]
- Spauschus, A., Lentes, K., Wischmeyer, E., Dissmann, E., Karschin, C., and Karschin, A. (1996). A G-protein-activated inwardly rectifying K+ channel (GIRK4) from human hippocampus associates with other GIRK channels. J Neurosci 16, 930-938.
- Wickman, K., Karschin, C., Karschin, A., Picciotto, M.R., and Clapham, D.E. (2000). Brain localization and behavioral impact of the G-protein-gated K+ channel subunit GIRK4. J Neurosci 20, 5608-5615.
- Erwin, S.R., Bristow, B.N., Sullivan, K.E., Kendrick, R.M., Marriott, B., Wang, L., Clements, J., Lemire, A.L., Jackson, J., and Cembrowski, M.S. (2021). Spatially patterned excitatory neuron subtypes and projections of the claustrum. eLife 10, e68967.
- Peroutka, S.J. (1995). 5-HT receptors: past, present and future. Trends in Neurosci. 18, 68-69. [CrossRef]
- Araneda, R., and Andrade, R. (1991). 5-Hydroxytryptamine2 and 5-hydroxytryptamine1A receptors mediate opposing responses on membrane excitability in rat association cortex. Neuroscience 40, 399-412. [CrossRef]
- Puig, M.V., and Gulledge, A.T. (2011). Serotonin and prefrontal cortex function: neurons, networks, and circuits. Mol Neurobiol 44, 449-464. [CrossRef]
- Wang, D., Wang, X., Liu, P., Jing, S., Du, H., Zhang, L., Jia, F., and Li, A. (2020). Serotonergic afferents from the dorsal raphe decrease the excitability of pyramidal neurons in the anterior piriform cortex. Proc. Natl. Acad. Sci. 117, 3239-3247. [CrossRef]
- Tian, M.K., Schmidt, E.F., and Lambe, E.K. (2016). Serotonergic suppression of mouse prefrontal circuits implicated in task attention. eNeuro 3, ENEURO.0269-0216.2016.
- Okada, M., Goldman, D., LINNOILA, M., Iwata, N., Ozaki, N., and Northup, J.K. (2004). Comparison of G-Protein selectivity of human 5-HT2C and 5-HT1A receptors. Ann. N. Y. Acad. Sci. 1025, 570-577. [CrossRef]
- Raymond, J.R., Mukhin, Y.V., Gelasco, A., Turner, J., Collinsworth, G., Gettys, T.W., Grewal, J.S., and Garnovskaya, M.N. (2001). Multiplicity of mechanisms of serotonin receptor signal transduction. Pharmacology & therapeutics 92, 179-212. [CrossRef]
- Vargas, M.V., Dunlap, L.E., Dong, C., Carter, S.J., Tombari, R.J., Jami, S.A., Cameron, L.P., Patel, S.D., Hennessey, J.J., Saeger, H.N., et al. (2023). Psychedelics promote neuroplasticity through the activation of intracellular 5-HT2A receptors. Science 379, 700-706. [CrossRef]
- Burns, C.M., Chu, H., Rueter, S.M., Hutchinson, L.K., Canton, H., Sanders-Bush, E., and Emeson, R.B. (1997). Regulation of serotonin-2C receptor G-protein coupling by RNA editing. Nature 387, 303-308. [CrossRef]
- Fitzgerald, L.W., Iyer, G., Conklin, D.S., Krause, C.M., Marshall, A., Patterson, J.P., Tran, D.P., Jonak, G.J., and Hartig, P.R. (1999). Messenger RNA Editing of the Human Serotonin 5-HT2C Receptor. Neuropsychopharmacology 21, 82-90. [CrossRef]
- Maroteaux, L., Béchade, C., and Roumier, A. (2019). Dimers of serotonin receptors: Impact on ligand affinity and signaling. Biochimie 161, 23-33. [CrossRef]
- Bijak, M., and Misgeld, U. (1997). Effects of serotonin through serotonin1A and serotonin4 receptors on inhibition in the guinea-pig dentate gyrus in vitro. Neuroscience 78, 1017-1026. [CrossRef]
- Davies, M.F., Deisz, R.A., Prince, D.A., and Peroutka, S.J. (1987). Two distinct effects of 5-hydroxytryptamine on single cortical neurons. Brain Res. 423, 347-352. [CrossRef]
- Perrier, J.-F., Alaburda, A., and Hounsgaard, J. (2003). 5-HT1A receptors increase excitability of spinal motoneurons by inhibiting a TASK-1-like K+ current in the adult turtle. J Physiol 548, 485-492. [CrossRef]
- Azimi, Z., Barzan, R., Spoida, K., Surdin, T., Wollenweber, P., Mark, M.D., Herlitze, S., and Jancke, D. (2020). Separable gain control of ongoing and evoked activity in the visual cortex by serotonergic input. eLife 9, e53552.
- Cabrera, R., Filevich, O., García-Acosta, B., Athilingam, J., Bender, K.J., Poskanzer, K.E., and Etchenique, R. (2017). A visible-light-sensitive caged serotonin. ACS Chem Neurosci 8, 1036-1042. [CrossRef]
- Bellot-Saez, A., Stevenson, R., Kékesi, O., Samokhina, E., Ben-Abu, Y., Morley, J.W., and Buskila, Y. (2021). Neuromodulation of astrocytic K(+) clearance. Int J Mol Sci 22, 2520.
- Gantz, S.C., Levitt, E.S., Llamosas, N., Neve, K.A., and Williams, J.T. (2015). Depression of serotonin synaptic transmission by the dopamine precursor L-DOPA. Cell Rep 12, 944-954. [CrossRef]
- Fuxe, K., Dahlström, A.B., Jonsson, G., Marcellino, D., Guescini, M., Dam, M., Manger, P., and Agnati, L. (2010). The discovery of central monoamine neurons gave volume transmission to the wired brain. Prog. Neurobiol. 90, 82-100. [CrossRef]
- Jadi, M., Polsky, A., Schiller, J., and Mel, B.W. (2012). Location-dependent effects of inhibition on local spiking in pyramidal neuron dendrites. PLoS Comput. Biol. 8, e1002550.
- Tremblay, R., Lee, S., and Rudy, B. (2016). Gabaergic interneurons in the neocortex: from cellular properties to circuits. Neuron 91, 260-292. [CrossRef]
- Wilson, N.R., Runyan, C.A., Wang, F.L., and Sur, M. (2012). Division and subtraction by distinct cortical inhibitory networks in vivo. Nature 488, 343-348. [CrossRef]
- Madden M, Mathur B. (2023). Transclaustral circuit strength is attenuated by serotonin. Soc. Neurosci. Abstr. 53 PSTR456.20.
- Anderson, T.L., Keady, J.V., Songrady, J., Tavakoli, N.S., Asadipooya, A., Neeley, R.E., Turner, J.R., and Ortinski, P.I. (2024). Distinct 5-HT receptor subtypes regulate claustrum excitability by serotonin and the psychedelic, DOI. Prog Neurobiol 240, 102660. [CrossRef]
- Wong KLL (2021) Serotonergic modulation of the claustrum. Doctoral thesis, Nanyang Technological University, Singapore.
Figure 1.
Identifying claustral projection neurons via their intrinsic electrical properties. (A) Whole-cell patch clamp recording from a single claustral neuron in a coronal brain slice. The neuron was filled with neurobiotin, which was labelled by streptavidin (red). The claustrum (CLA) is identifiable as a PV-rich (cyan) elliptical structure located between the insula and the striatum. The striatum also highly expresses PV but is separated from the cortex by the external capsule. (B) Representative recordings of AP firing (upper traces) evoked by depolarizing currents (lower traces) in PN subtypes PN1 to PN5.
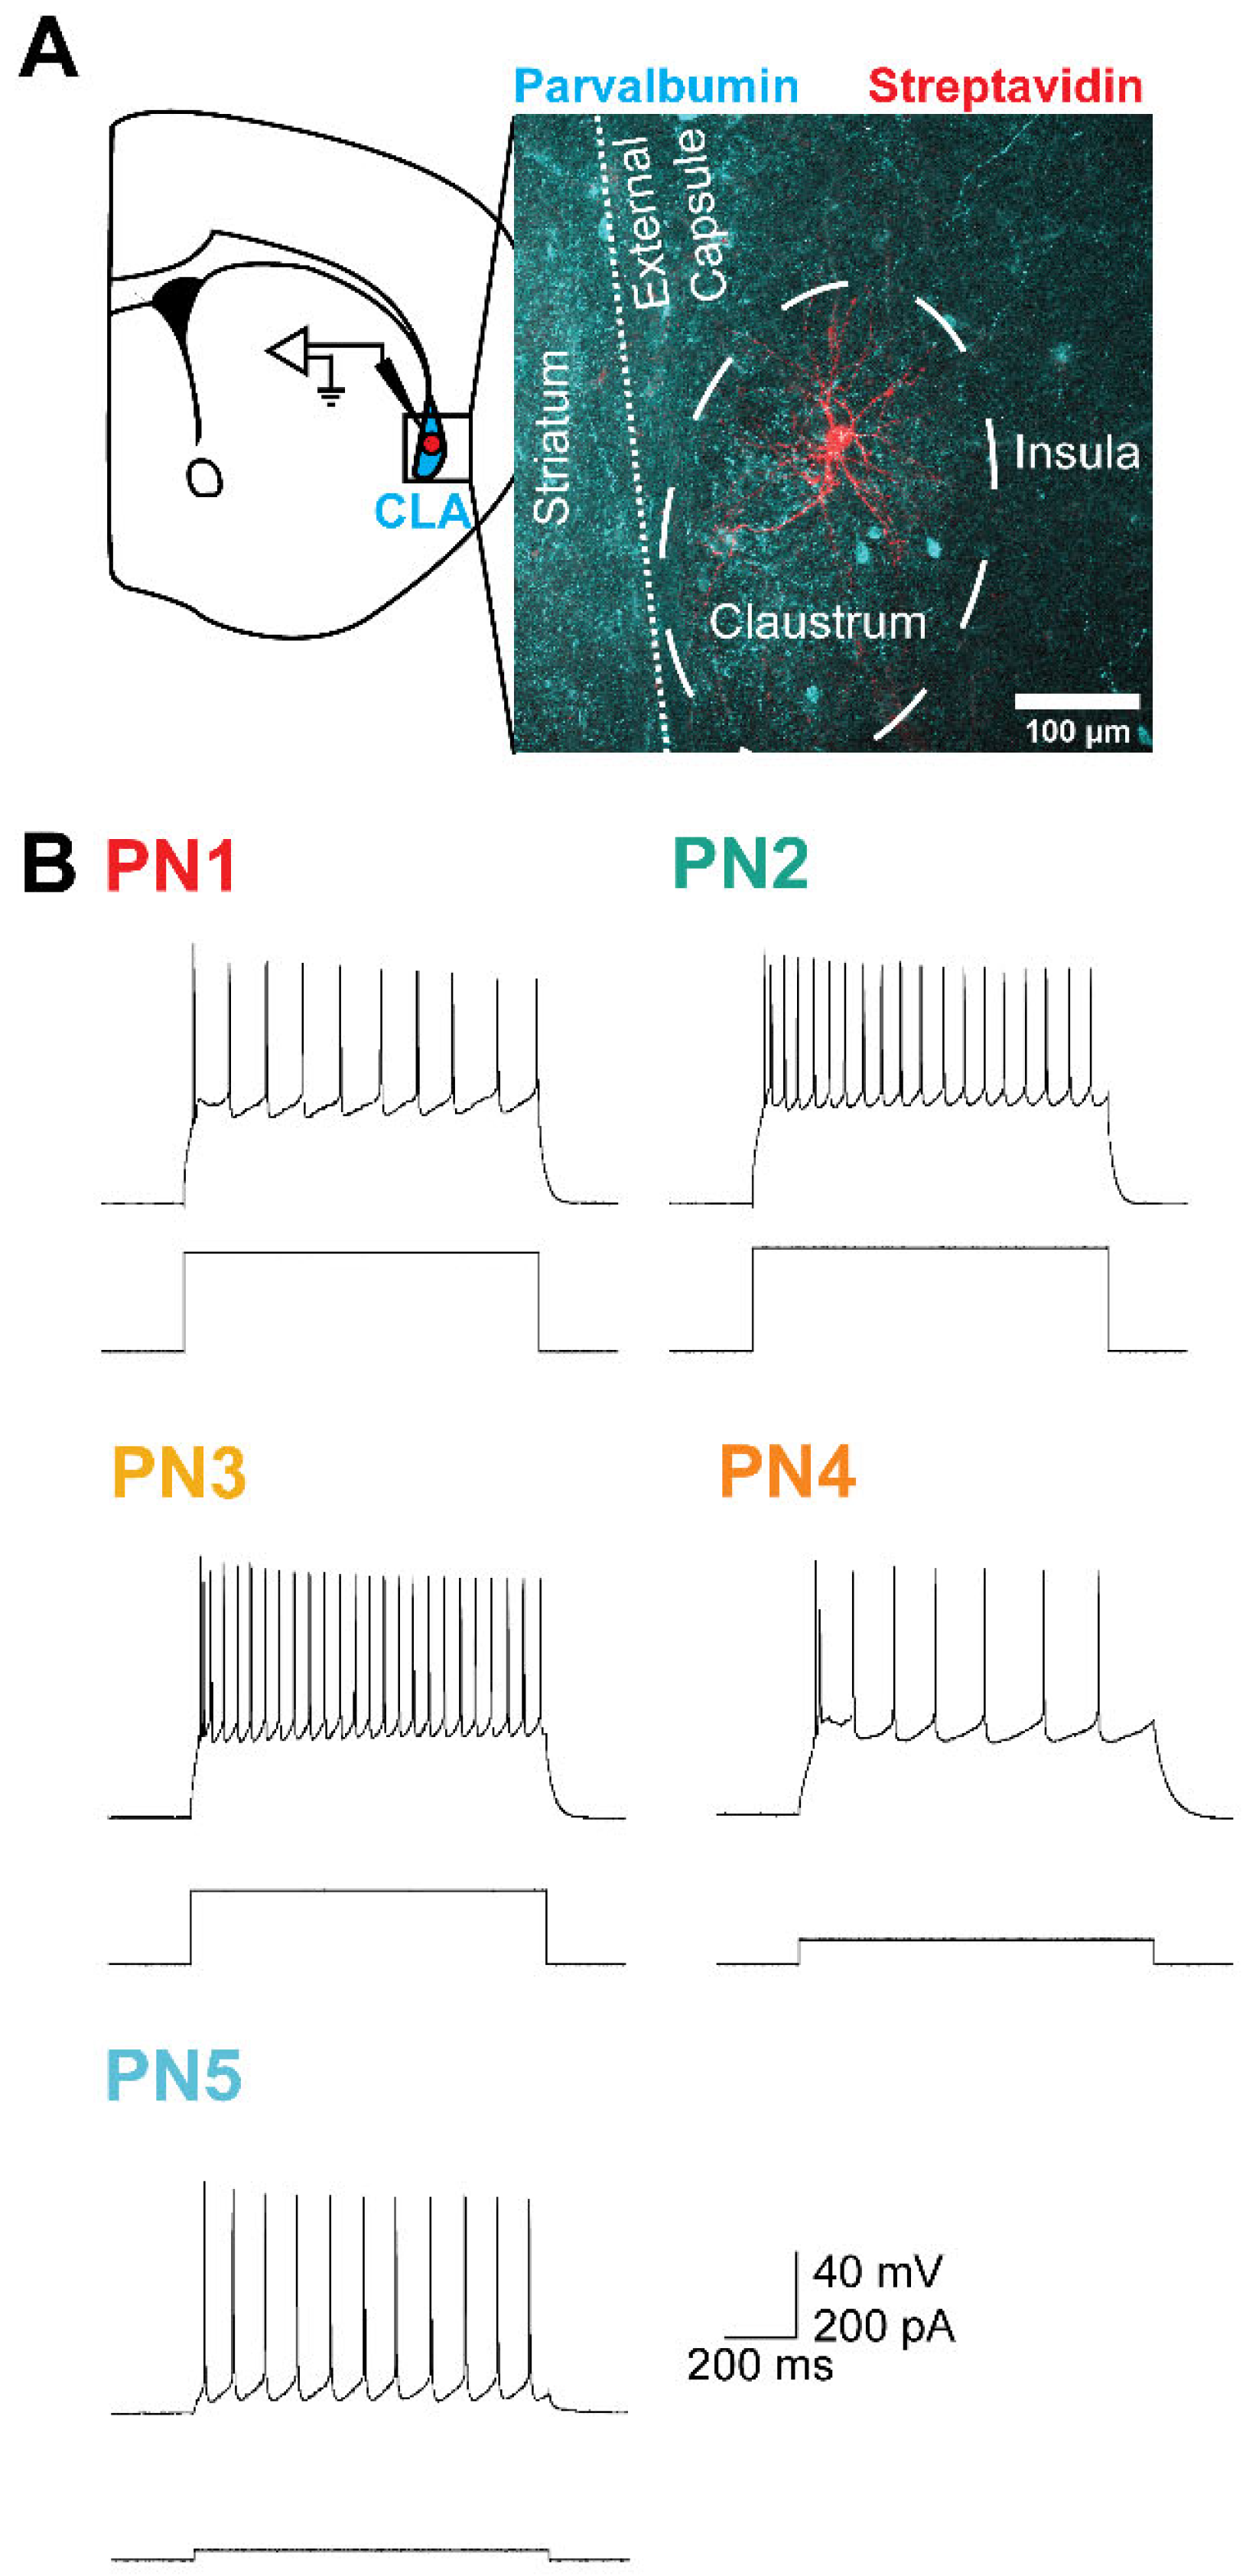
Figure 2.
A K+ conductance increase mediates the 5-HT response of claustrum PNs. (A) Representative current induced in a claustrum PN in response to local application of 5-HT. Time course of decay of the current can be fit with a single-exponential function (red). (B) Currents induced by 5-HT in a claustral PN held at different membrane potentials. In this cell, the 5-HT-induced current reversed its polarity at -100 mV. (C) Currents induced by 5-HT in a claustral PN held at various membrane potentials and bathed in a high external K+ solution. In this cell, the 5-HT-induced current reversed its polarity between -60 and -70 mV. (D) Relationships between membrane potential and 5-HT-induced currents in normal (black) and high external K+ (purple) solutions. The 5-HT responses were sensitive to the electrochemical gradient for K+ and reversed at -95 mV and -63 mV, respectively. Points indicate mean values and error bars show SEM. (E) Normalized chord conductances, calculated from eqn. (2), of 5-HT responses measured in normal (black) and high external K+ solution (purple). Points indicate mean values.
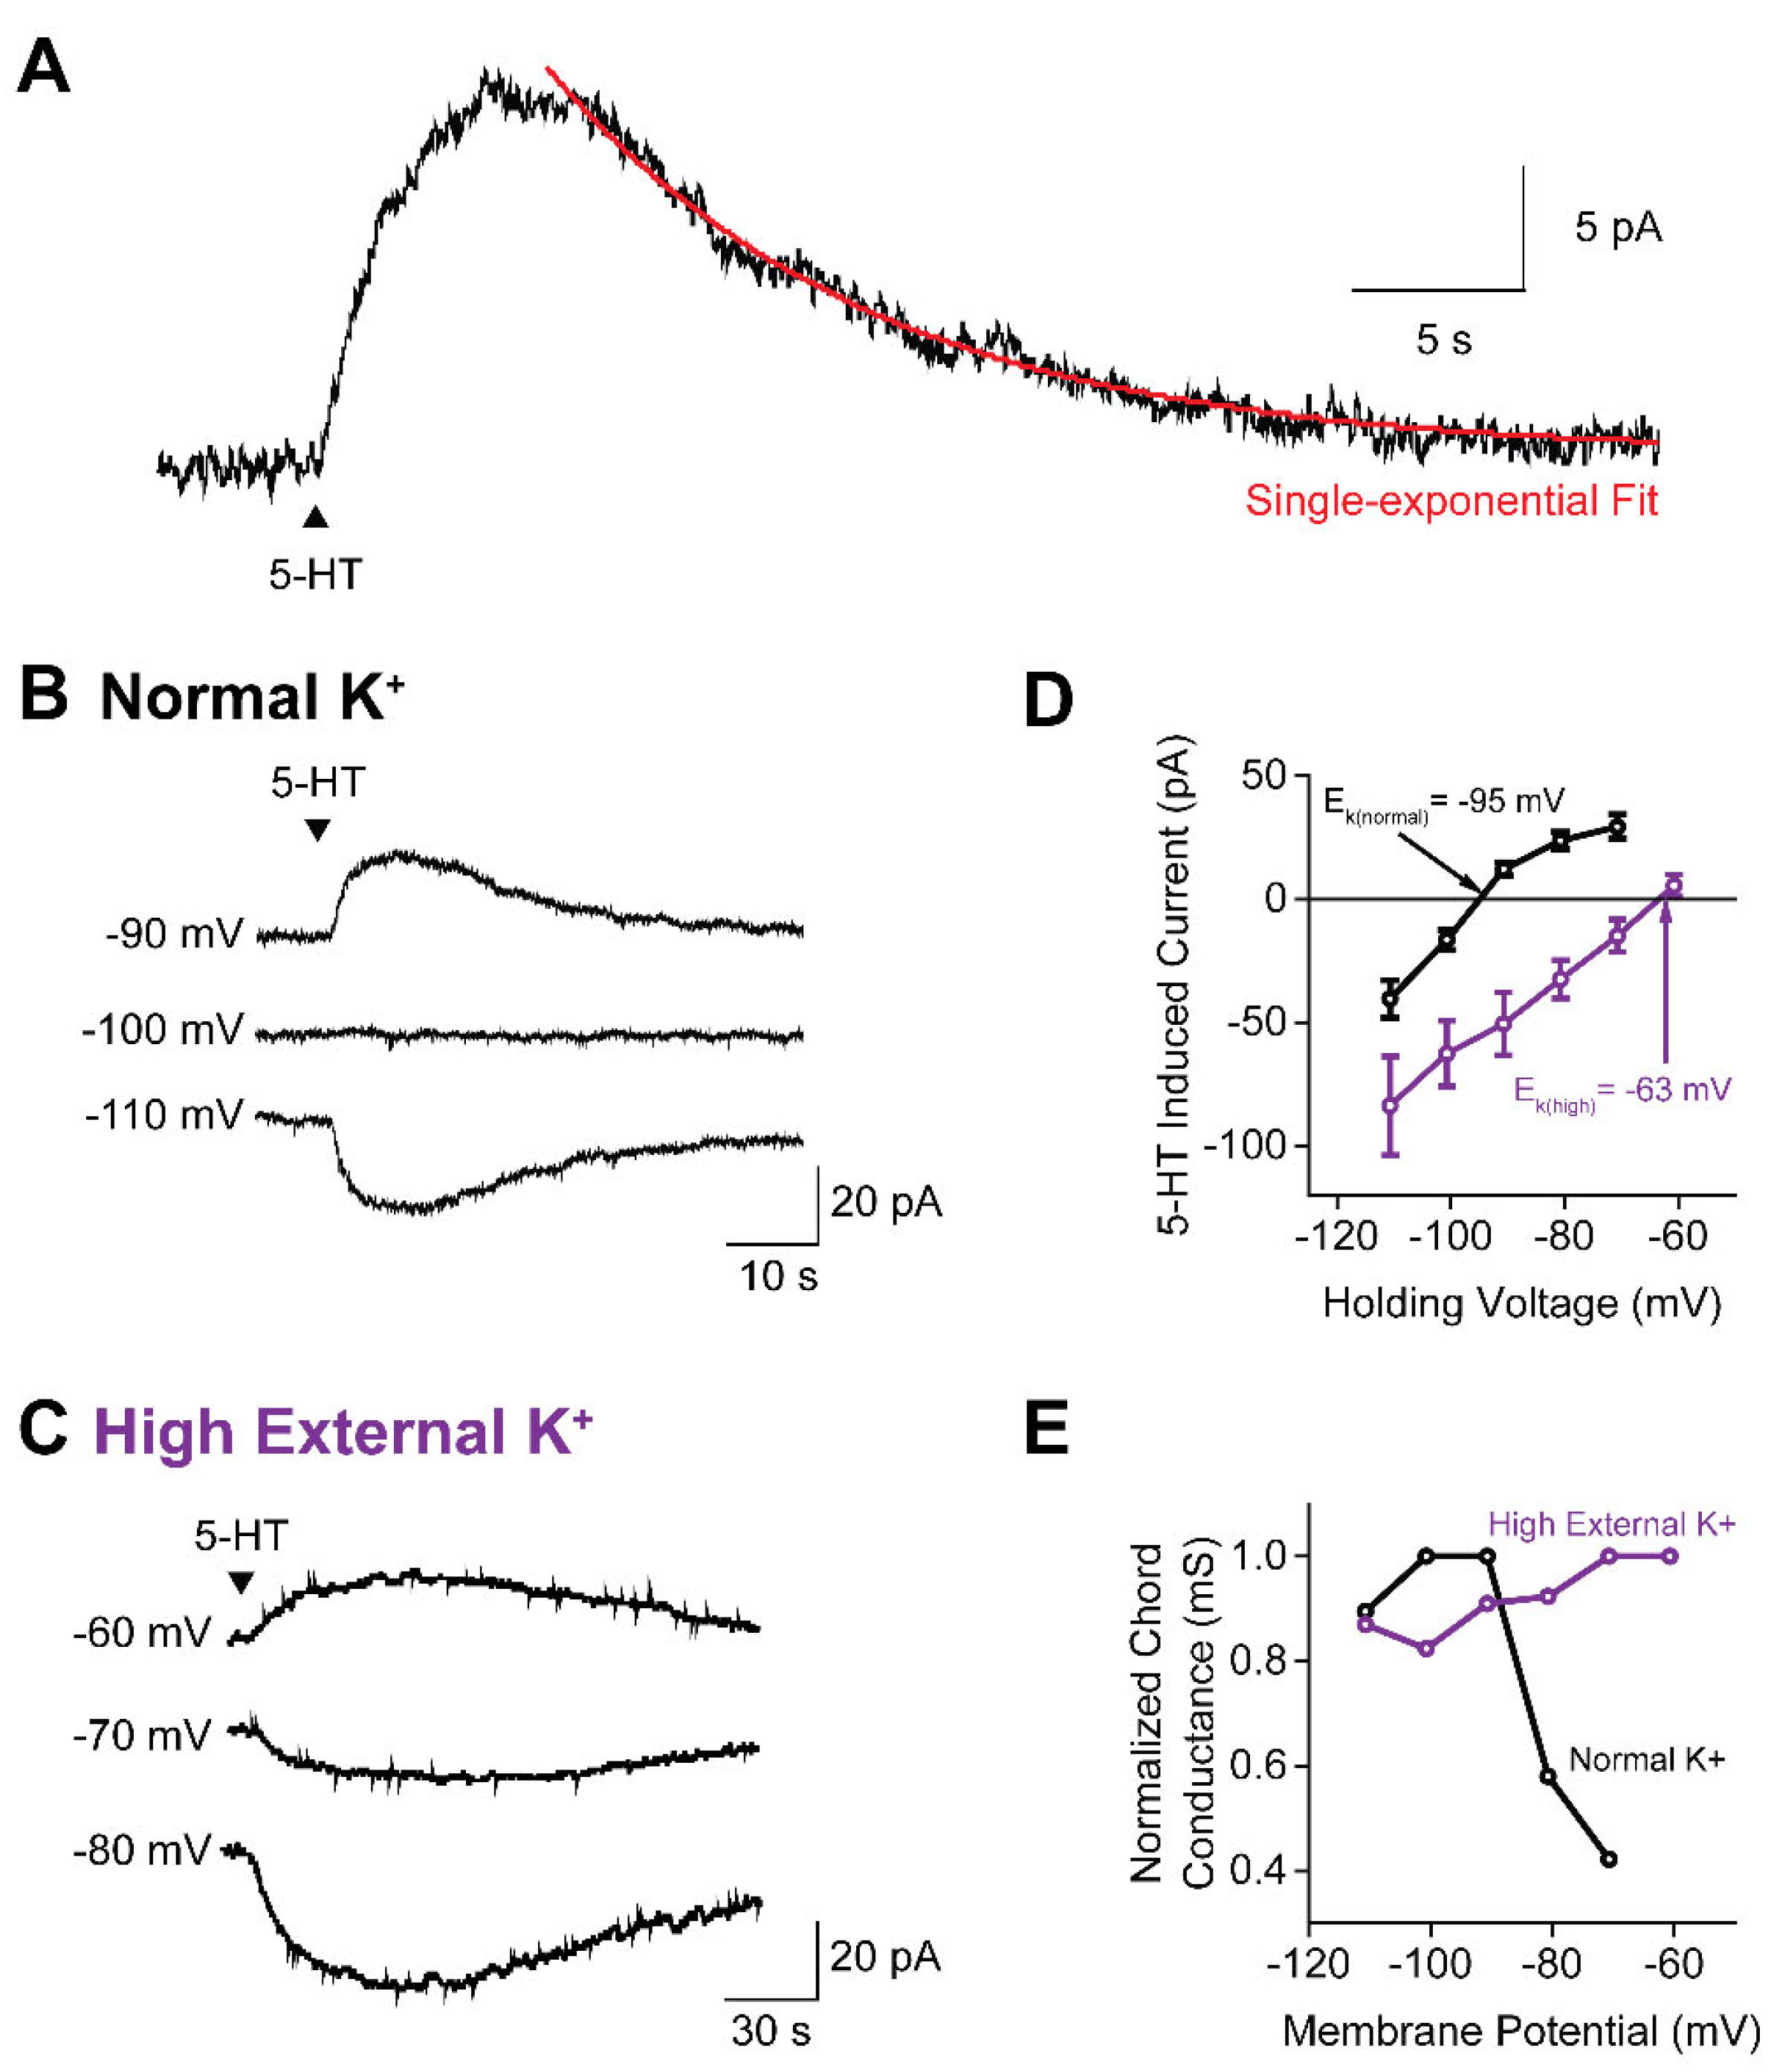
Figure 3.
5-HT induces K+ currents in all claustral PN subtypes. (A) Representative traces of 5-HT-induced outward currents in the five PN subtypes. The black arrow indicates the timing of the 5-HT pressure application. (B) Response rates of the five PN subtypes. The horizontal line represents the mean response rate (67.2%) for all PNs. Asterisk indicates that PN1 cells have a significantly lower rate of responding to 5-HT (refer to Table 1 for statistical analysis). (C) Peak amplitude of the 5-HT-induced outward current was not significantly different across the 5 PN subtypes (refer to Table 1 for statistical analysis). Points show individual measurements, bars indicate mean values and error bars show SEM. .
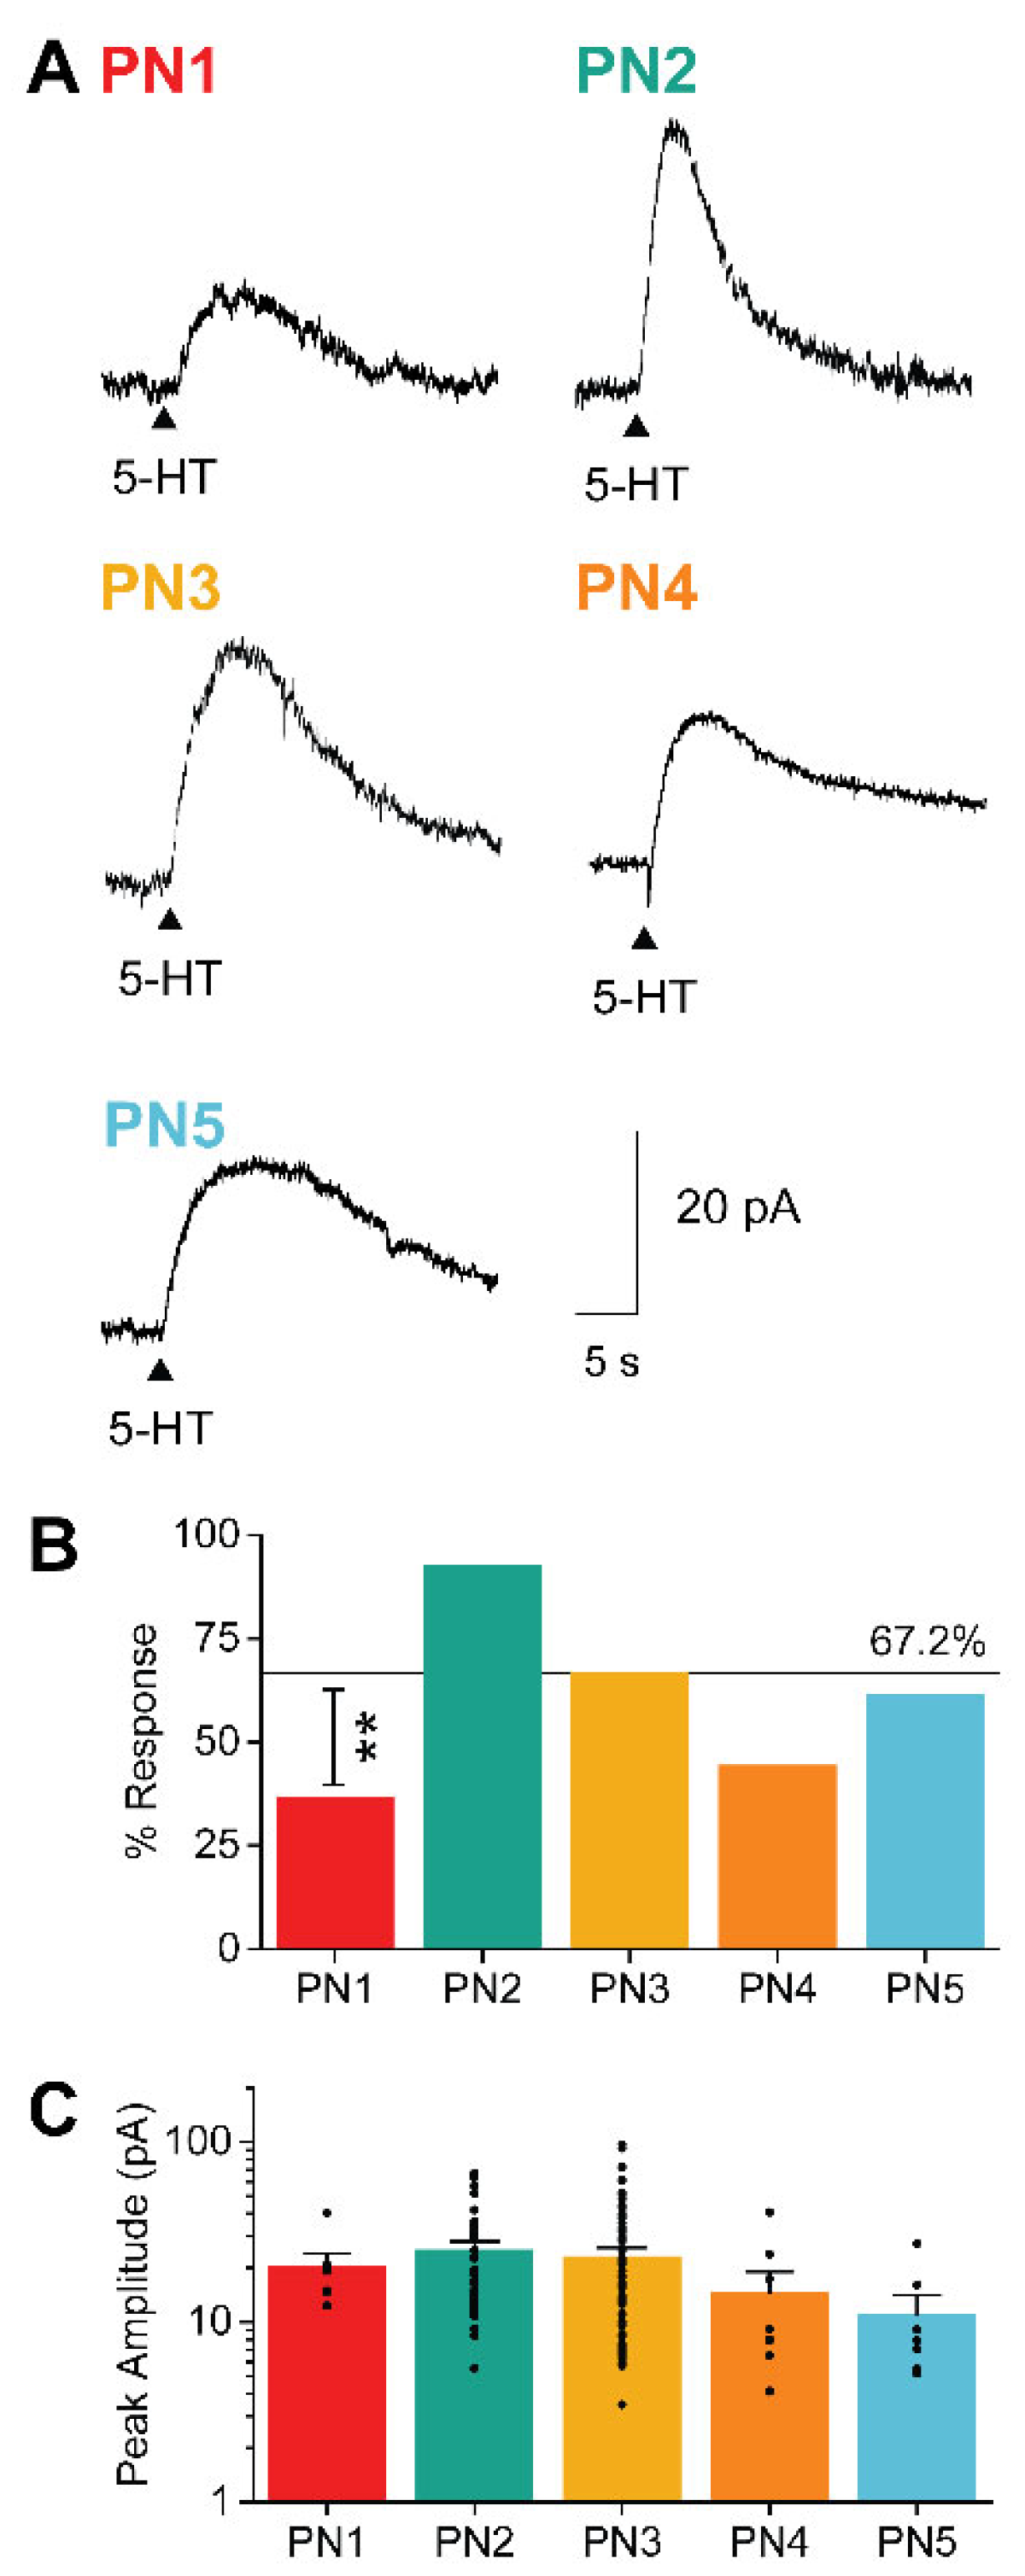
Figure 4.
5-HT responses are generated by multiple types of 5-HTRs. (A) Representative traces of 5-HT responses before (black) and after application of the indicated 5-HTR antagonists: 5-HTR-1A antagonist WAY100635 (orange), 5-HTR2A antagonist MDL11939 (red), and 5-HTR-2C antagonist RS102221 (blue). Control responses are normalized to 100% to illustrate magnitude of block by each type of antagonist. (B) Decrease in 5-HT-induced response, measured as response charge, following application of each 5-HTR antagonist. Points show individual measurements, bars indicate mean values and error bars show SEM. Asterisks indicate statistically significant differences; refer to Table 1 for statistical analyses.
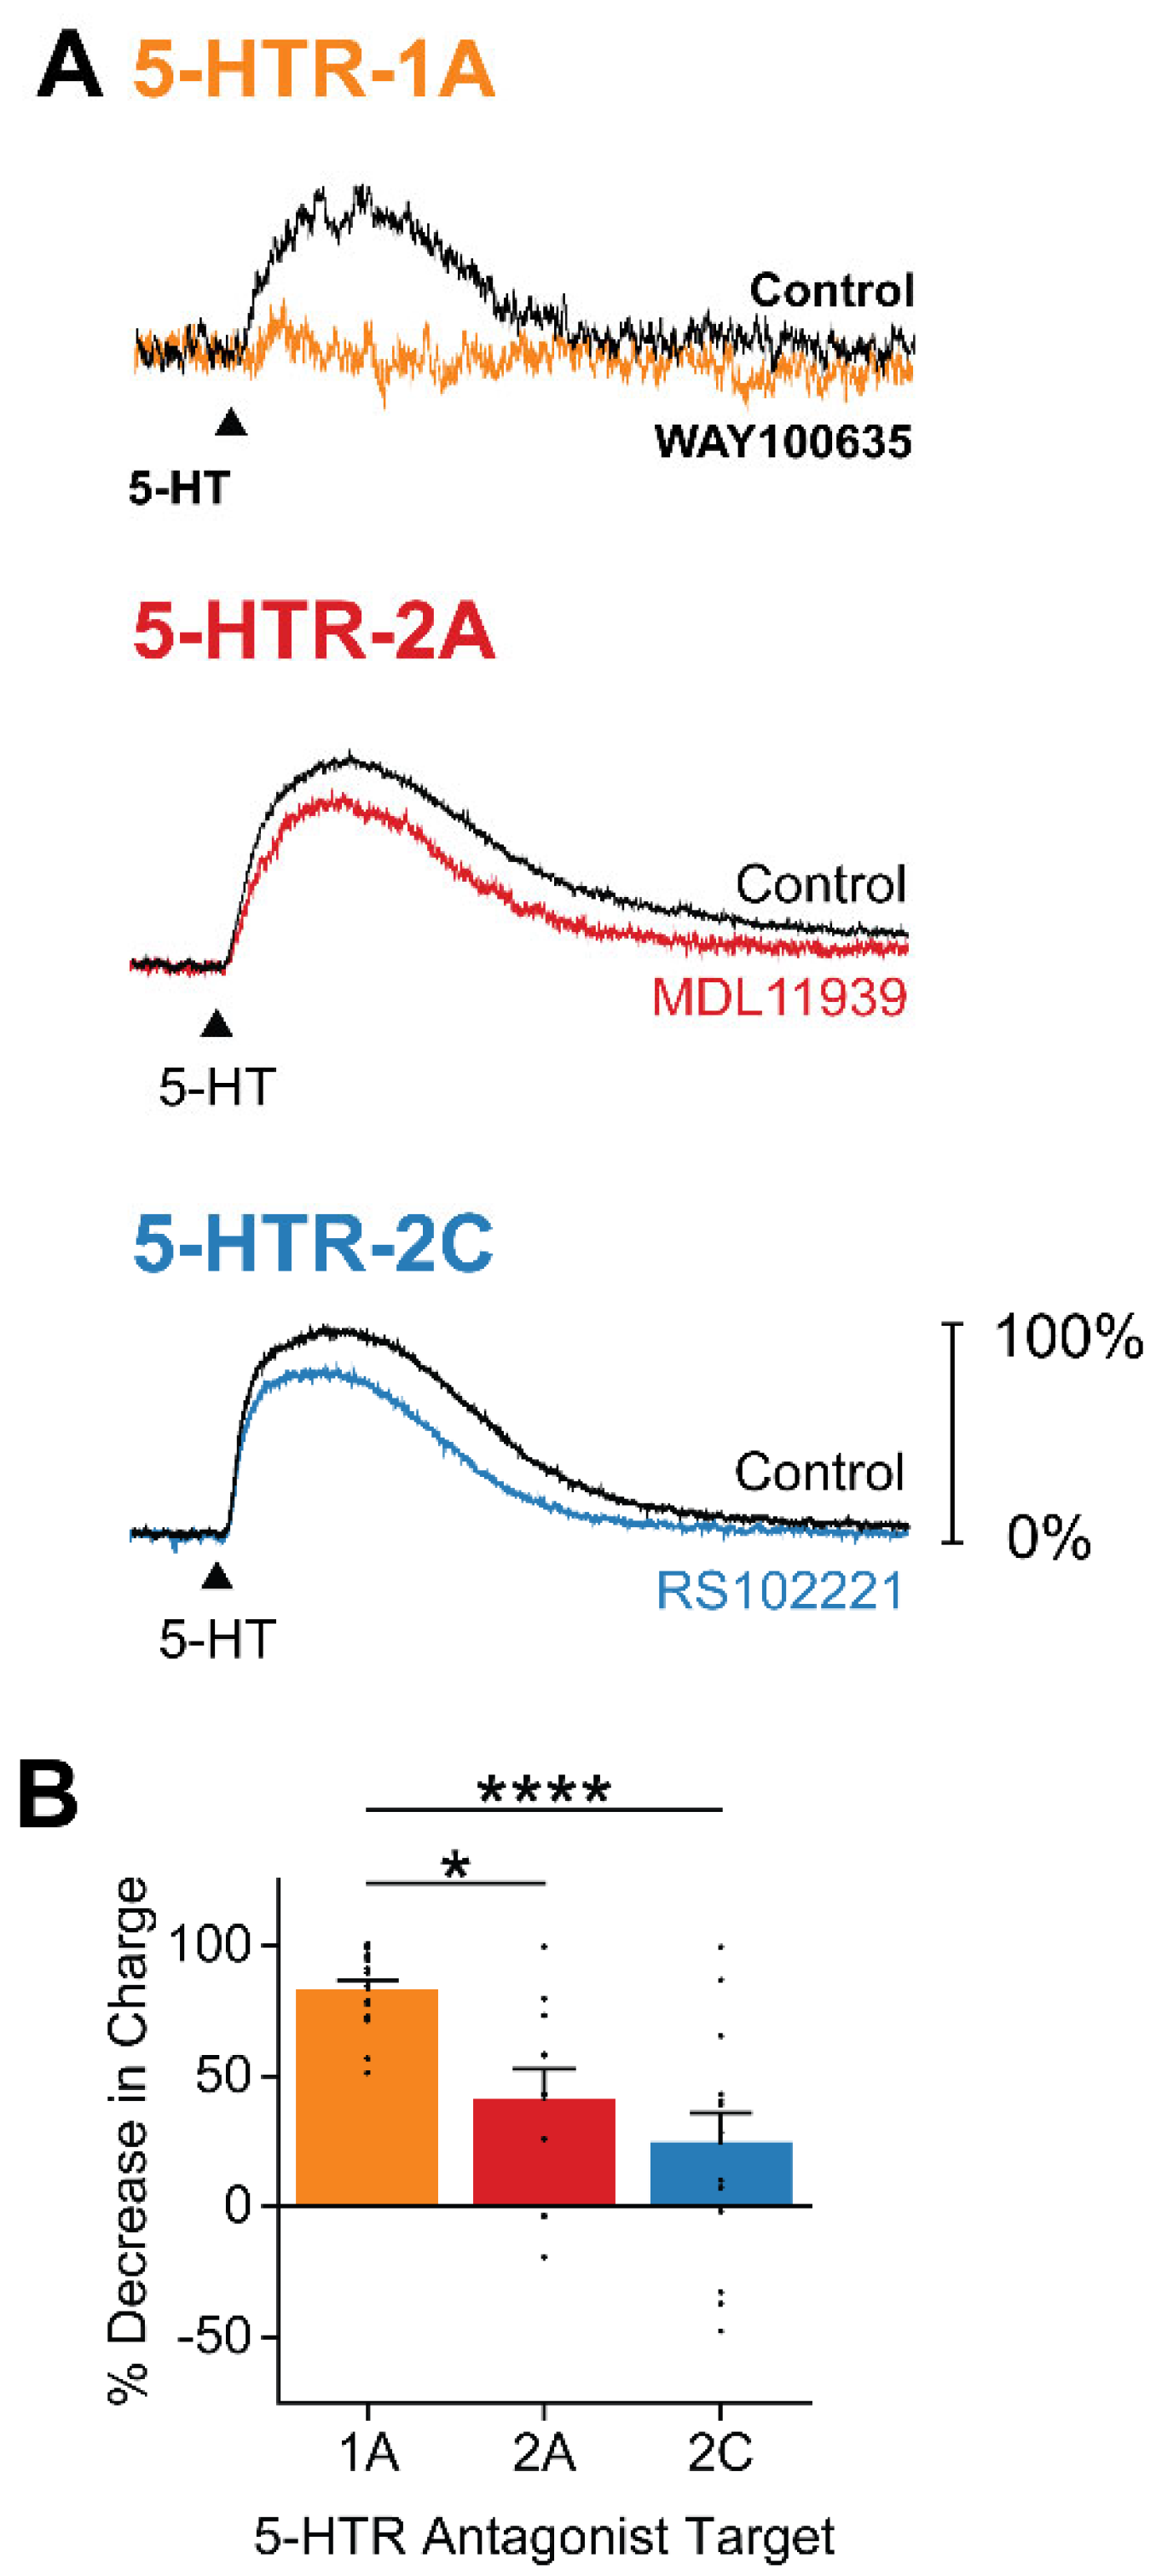
Figure 5.
5-HT decreases AP firing of claustral PNs. (A) Representative traces of AP firing (top) in a claustral PN in response to depolarizing current pulses (bottom). 5-HT was applied 5 s before the second depolarization (arrowhead) and hyperpolarized the membrane potential of the cell. (B) AP firing elicited by current pulses (bottom) before (Control; top) and after (center) 5-HT application. (C) Relationship between magnitude of depolarizing current pulses and frequency of resulting APs in control conditions (black) and after application of 5-HT (green). Points indicate mean values and error bars show +1 SEM.
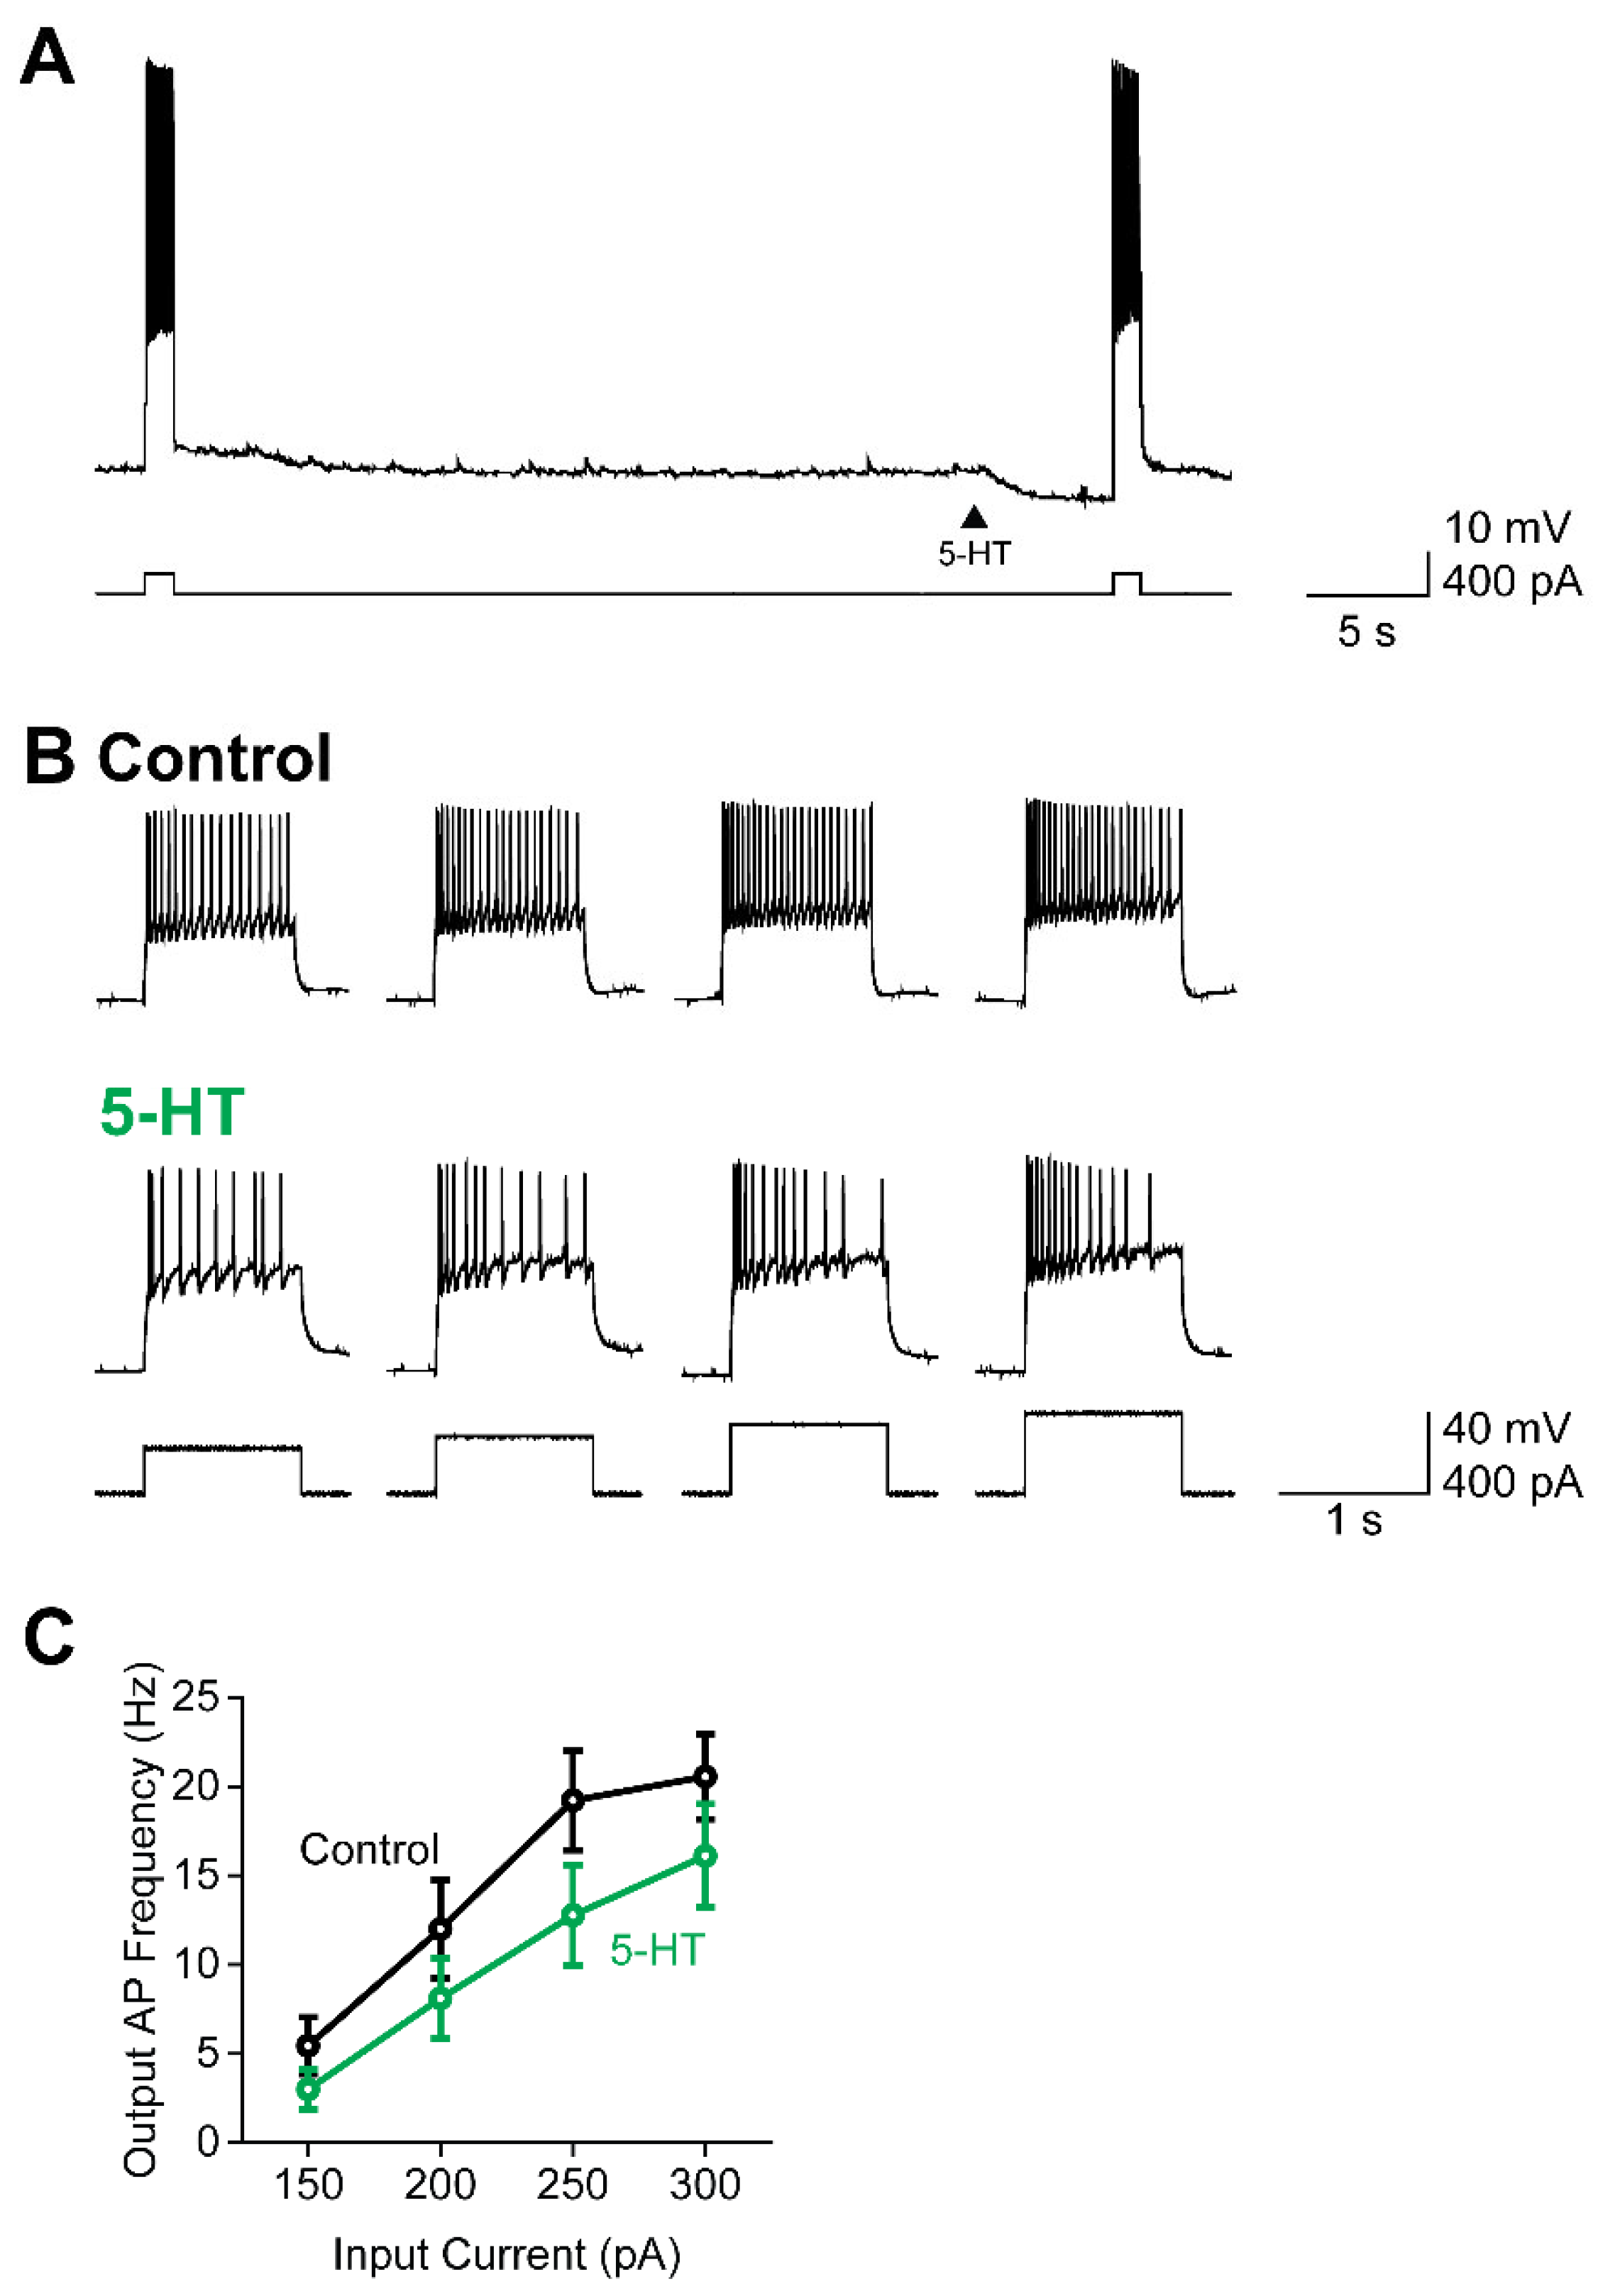
Figure 6.
Temporal dynamics of AP firing reflects time course of 5-HT-induced K+ conductance. (A) Example of claustral PN responses to pairs of depolarizing current ramps (bottom); 5-HT was applied at different times (arrowheads) prior to the second current ramp. (B) Relationship between mean time course of 5-HT-induced K+ conductance (purple), measured in voltage-clamp conditions, and mean reduction in AP firing (pink) produced by application of 5-HT at variable times. Points indicate mean values and error bars show +1 SEM. (C) Correlation between 5-HT-induced K+ conductance and reduction in AP firing measured in individual neurons. (D) Relationship between mean time course of 5-HT-induced K+ conductance (purple) and mean reduction in AP current threshold (CT) produced by application of 5-HT at indicated times. Points represent mean values and error bars show +1 SEM. (E) Correlation between 5-HT-induced K+ conductance and reduction in CT (green) measured in individual neurons.
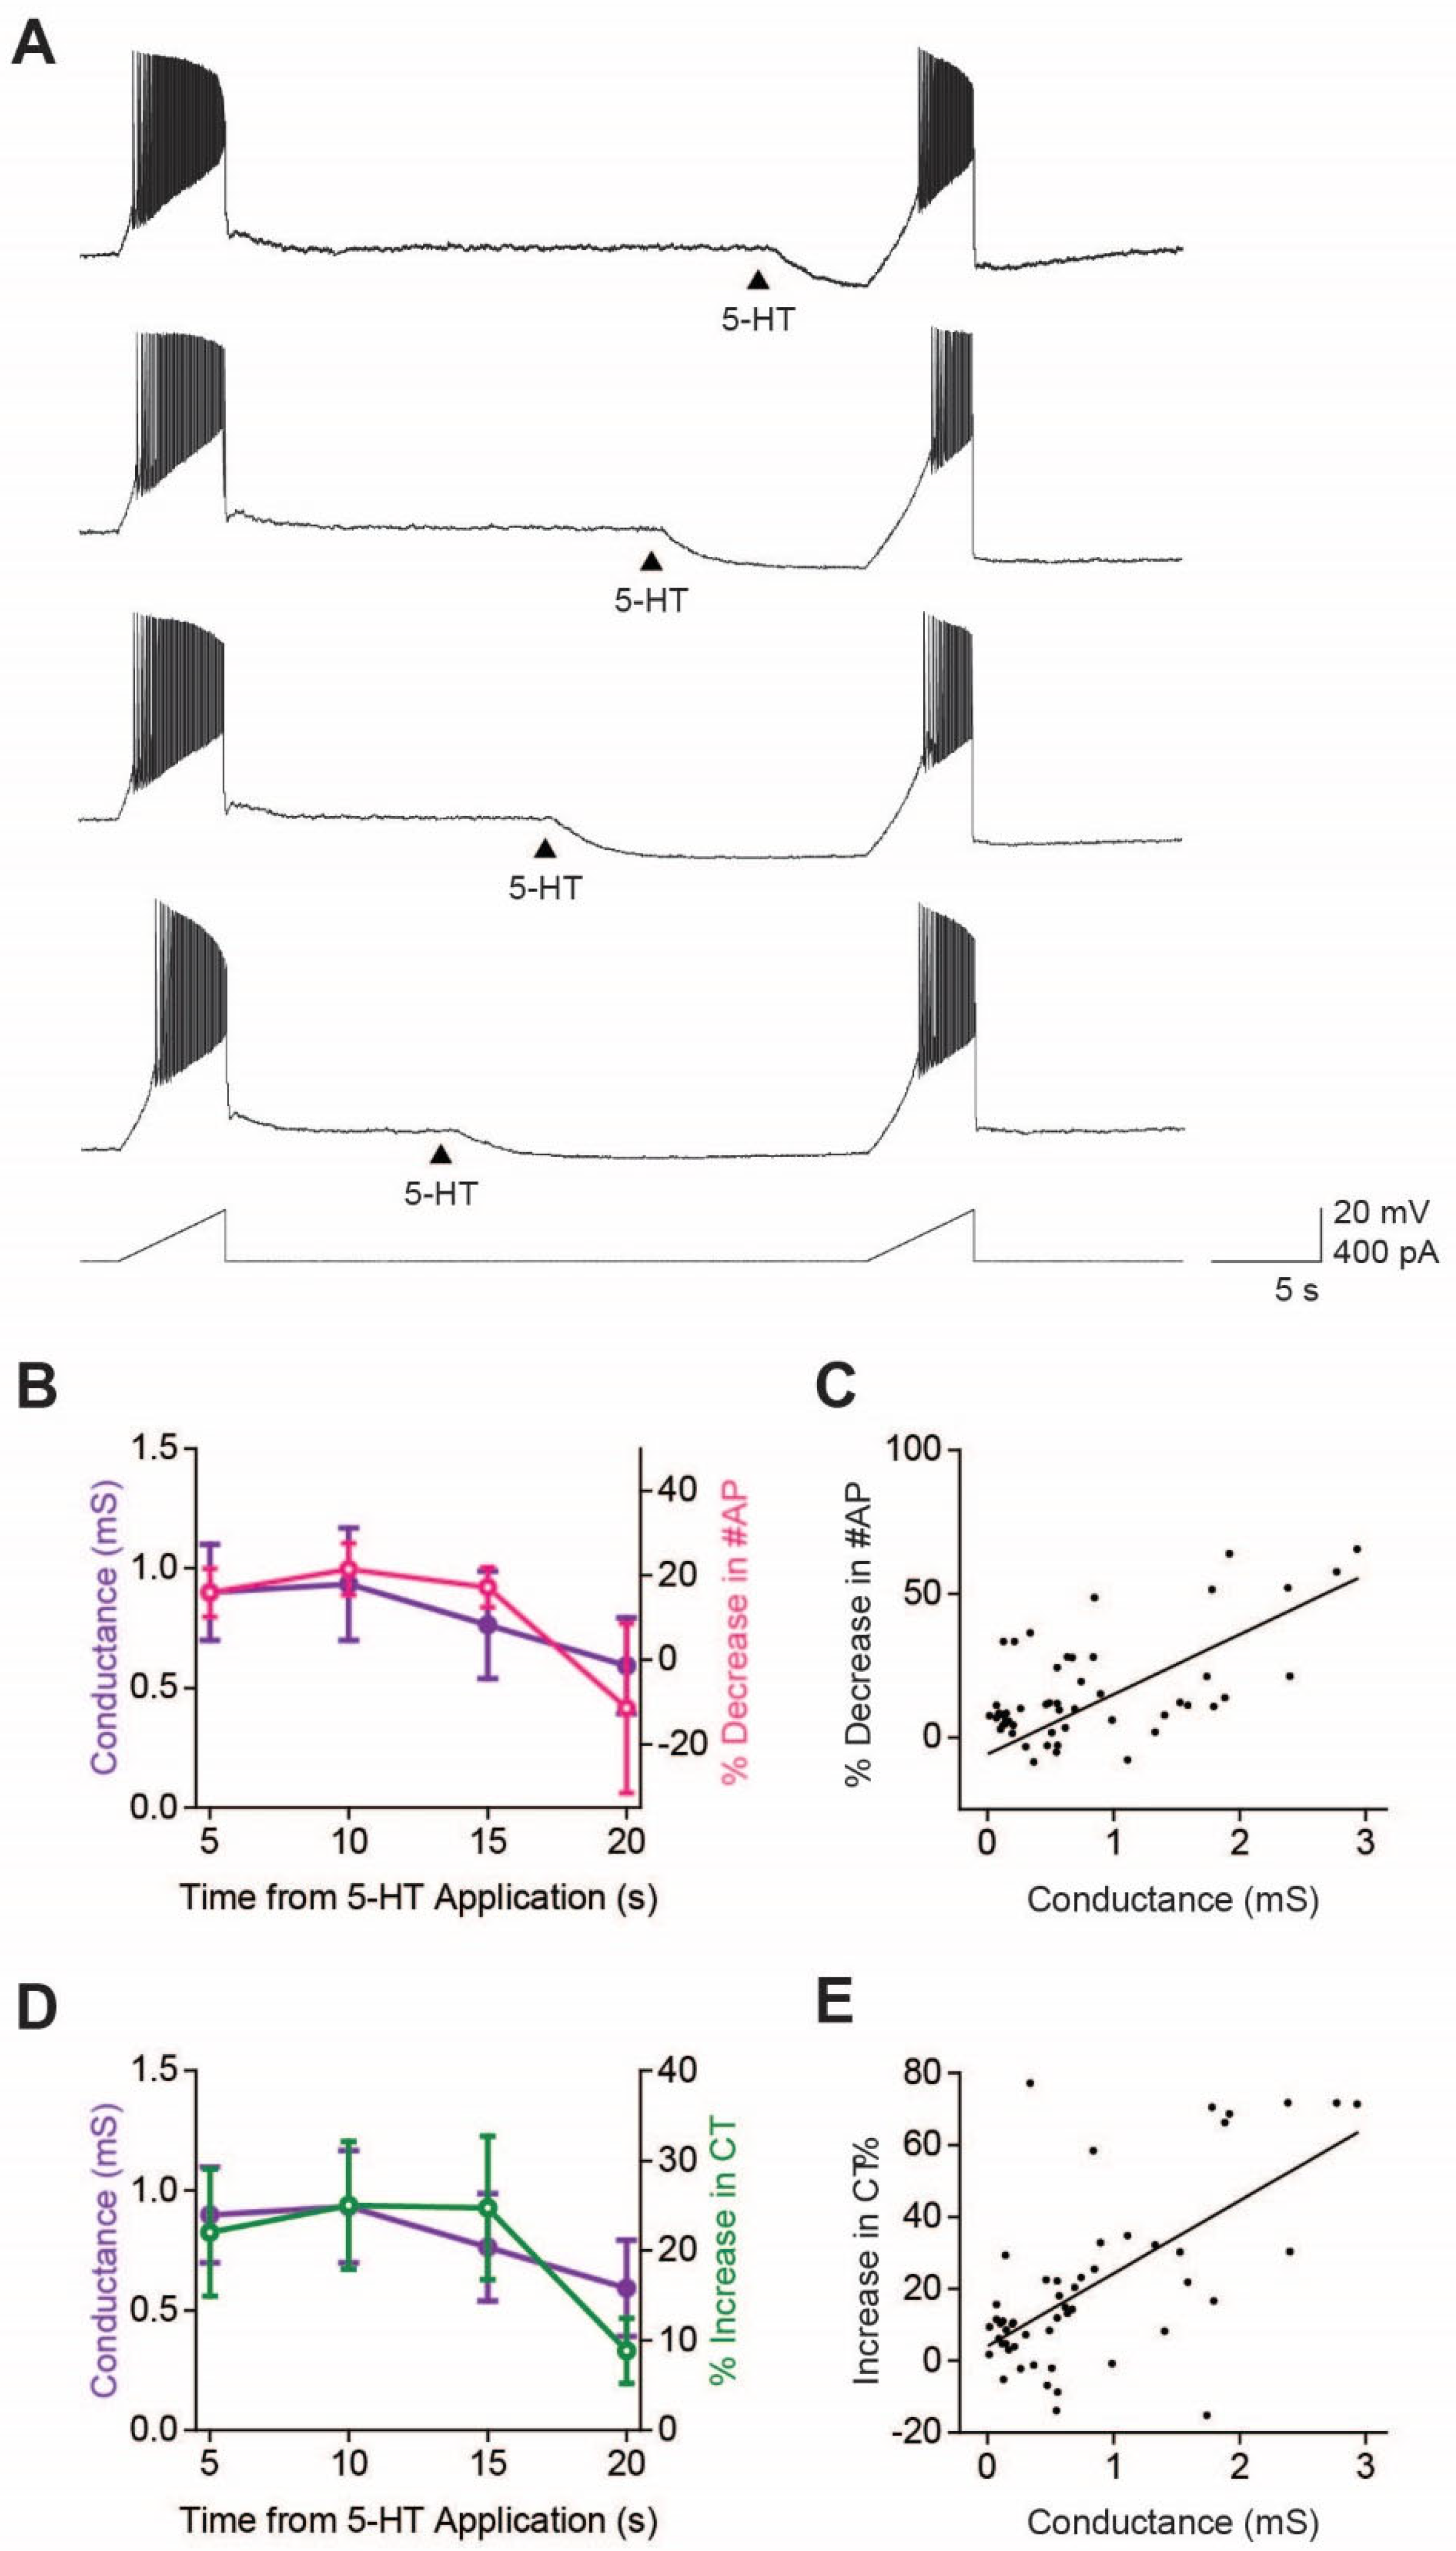
Figure 7.
Subtractive action of 5-HT on neuronal arithmetic. (A) The input-output (I-O) relationship of a neuron could be modulated either linearly or non-linearly, changing processing of input, output or both. (B) I-O relationships of claustral PNs before (Control; black) or after (maroon) 5-HT application. Points indicate mean values and error bars show +1 SEM. (C-F) I-O curve parameters obtained from Boltzmann function fits to the curves shown in (B): (C) Input50, (D) slope, (E) half-maximal AP frequency, and (F) maximum AP frequency. Points show individual measurements, bars indicate mean values and error bars show SEM. Asterisks indicate statistically significant differences; refer to Table 1 for statistical analyses.
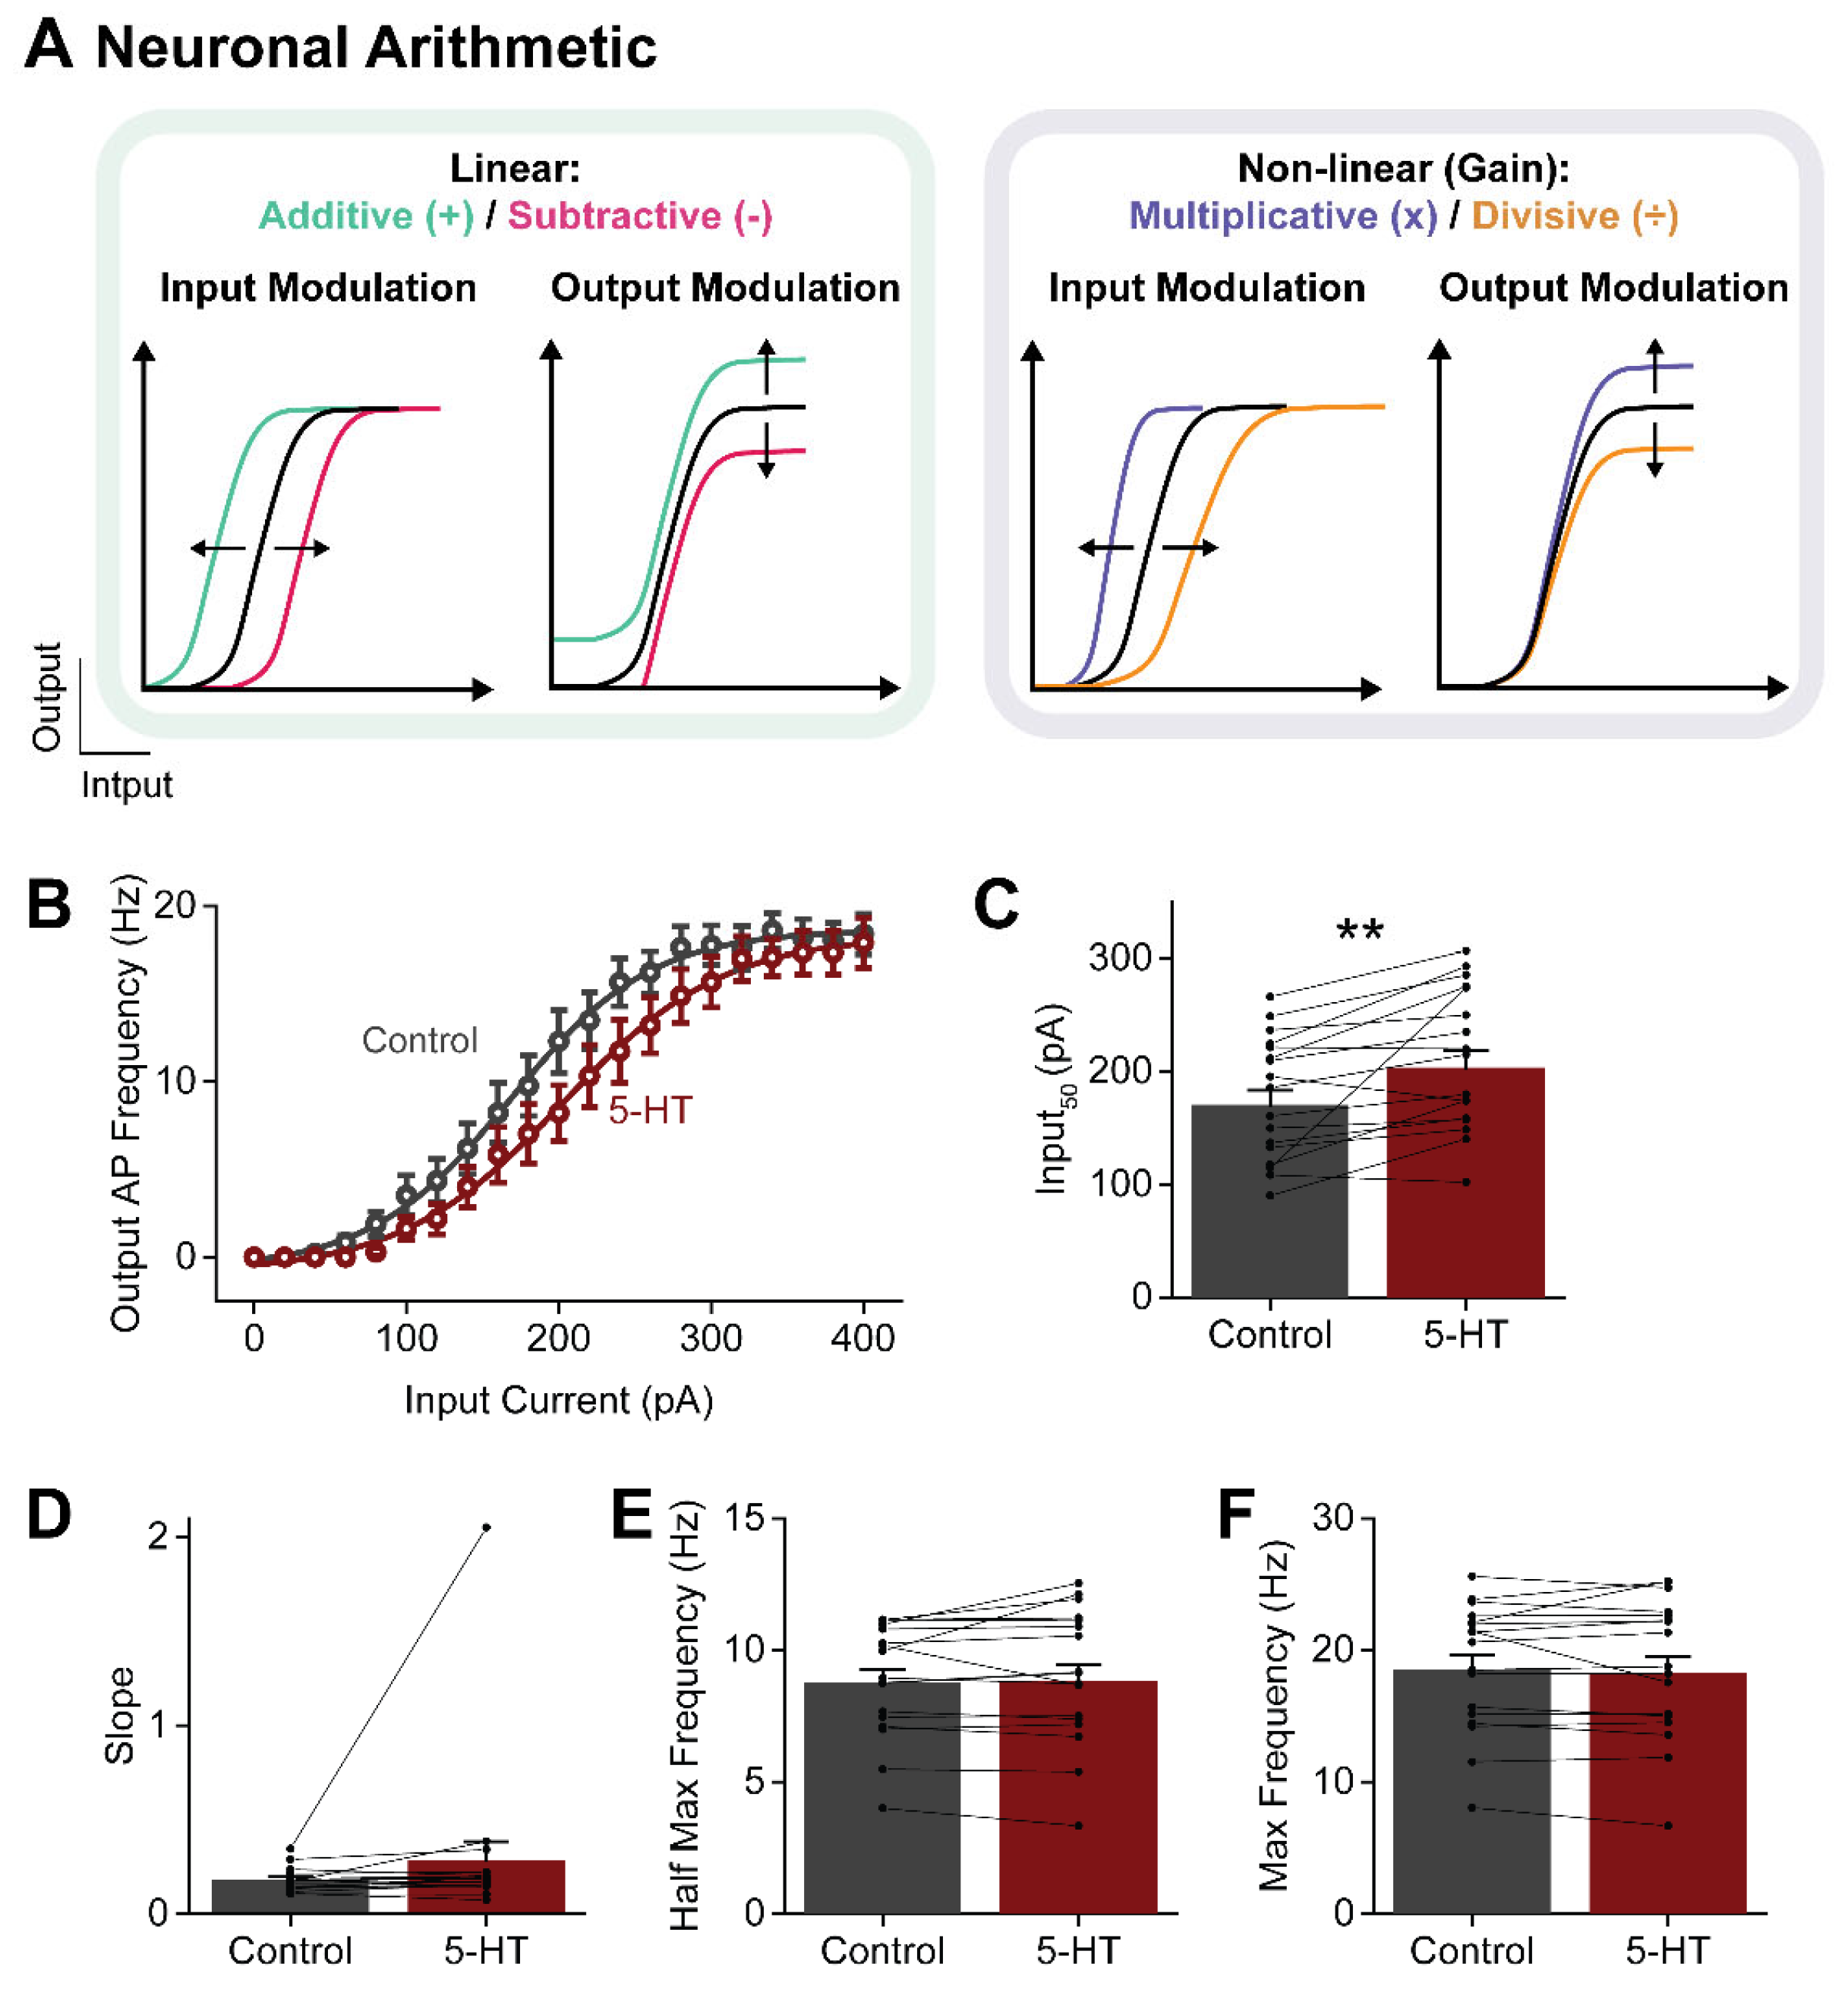
Figure 8.
Spatial resolution of 5-HT uncaging. (A) 5-HT-induced outward currents caused by photolyzing caged 5-HT over a 100 µm by 100 µm area at different locations, indicated by squares numbered 1-3. (B-C) Determination of distance-dependence of uncaging, calculated from both the peak amplitude (B) and the response charge (C) of the 5-HT-induced outward currents. Distance was calculated according to the distance to the nearest neighboring process of a neuron. Points indicate mean values and error bars show +1 SEM. Lines represent fits of exponential functions to the data; length constants of the exponential fits are also indicated.
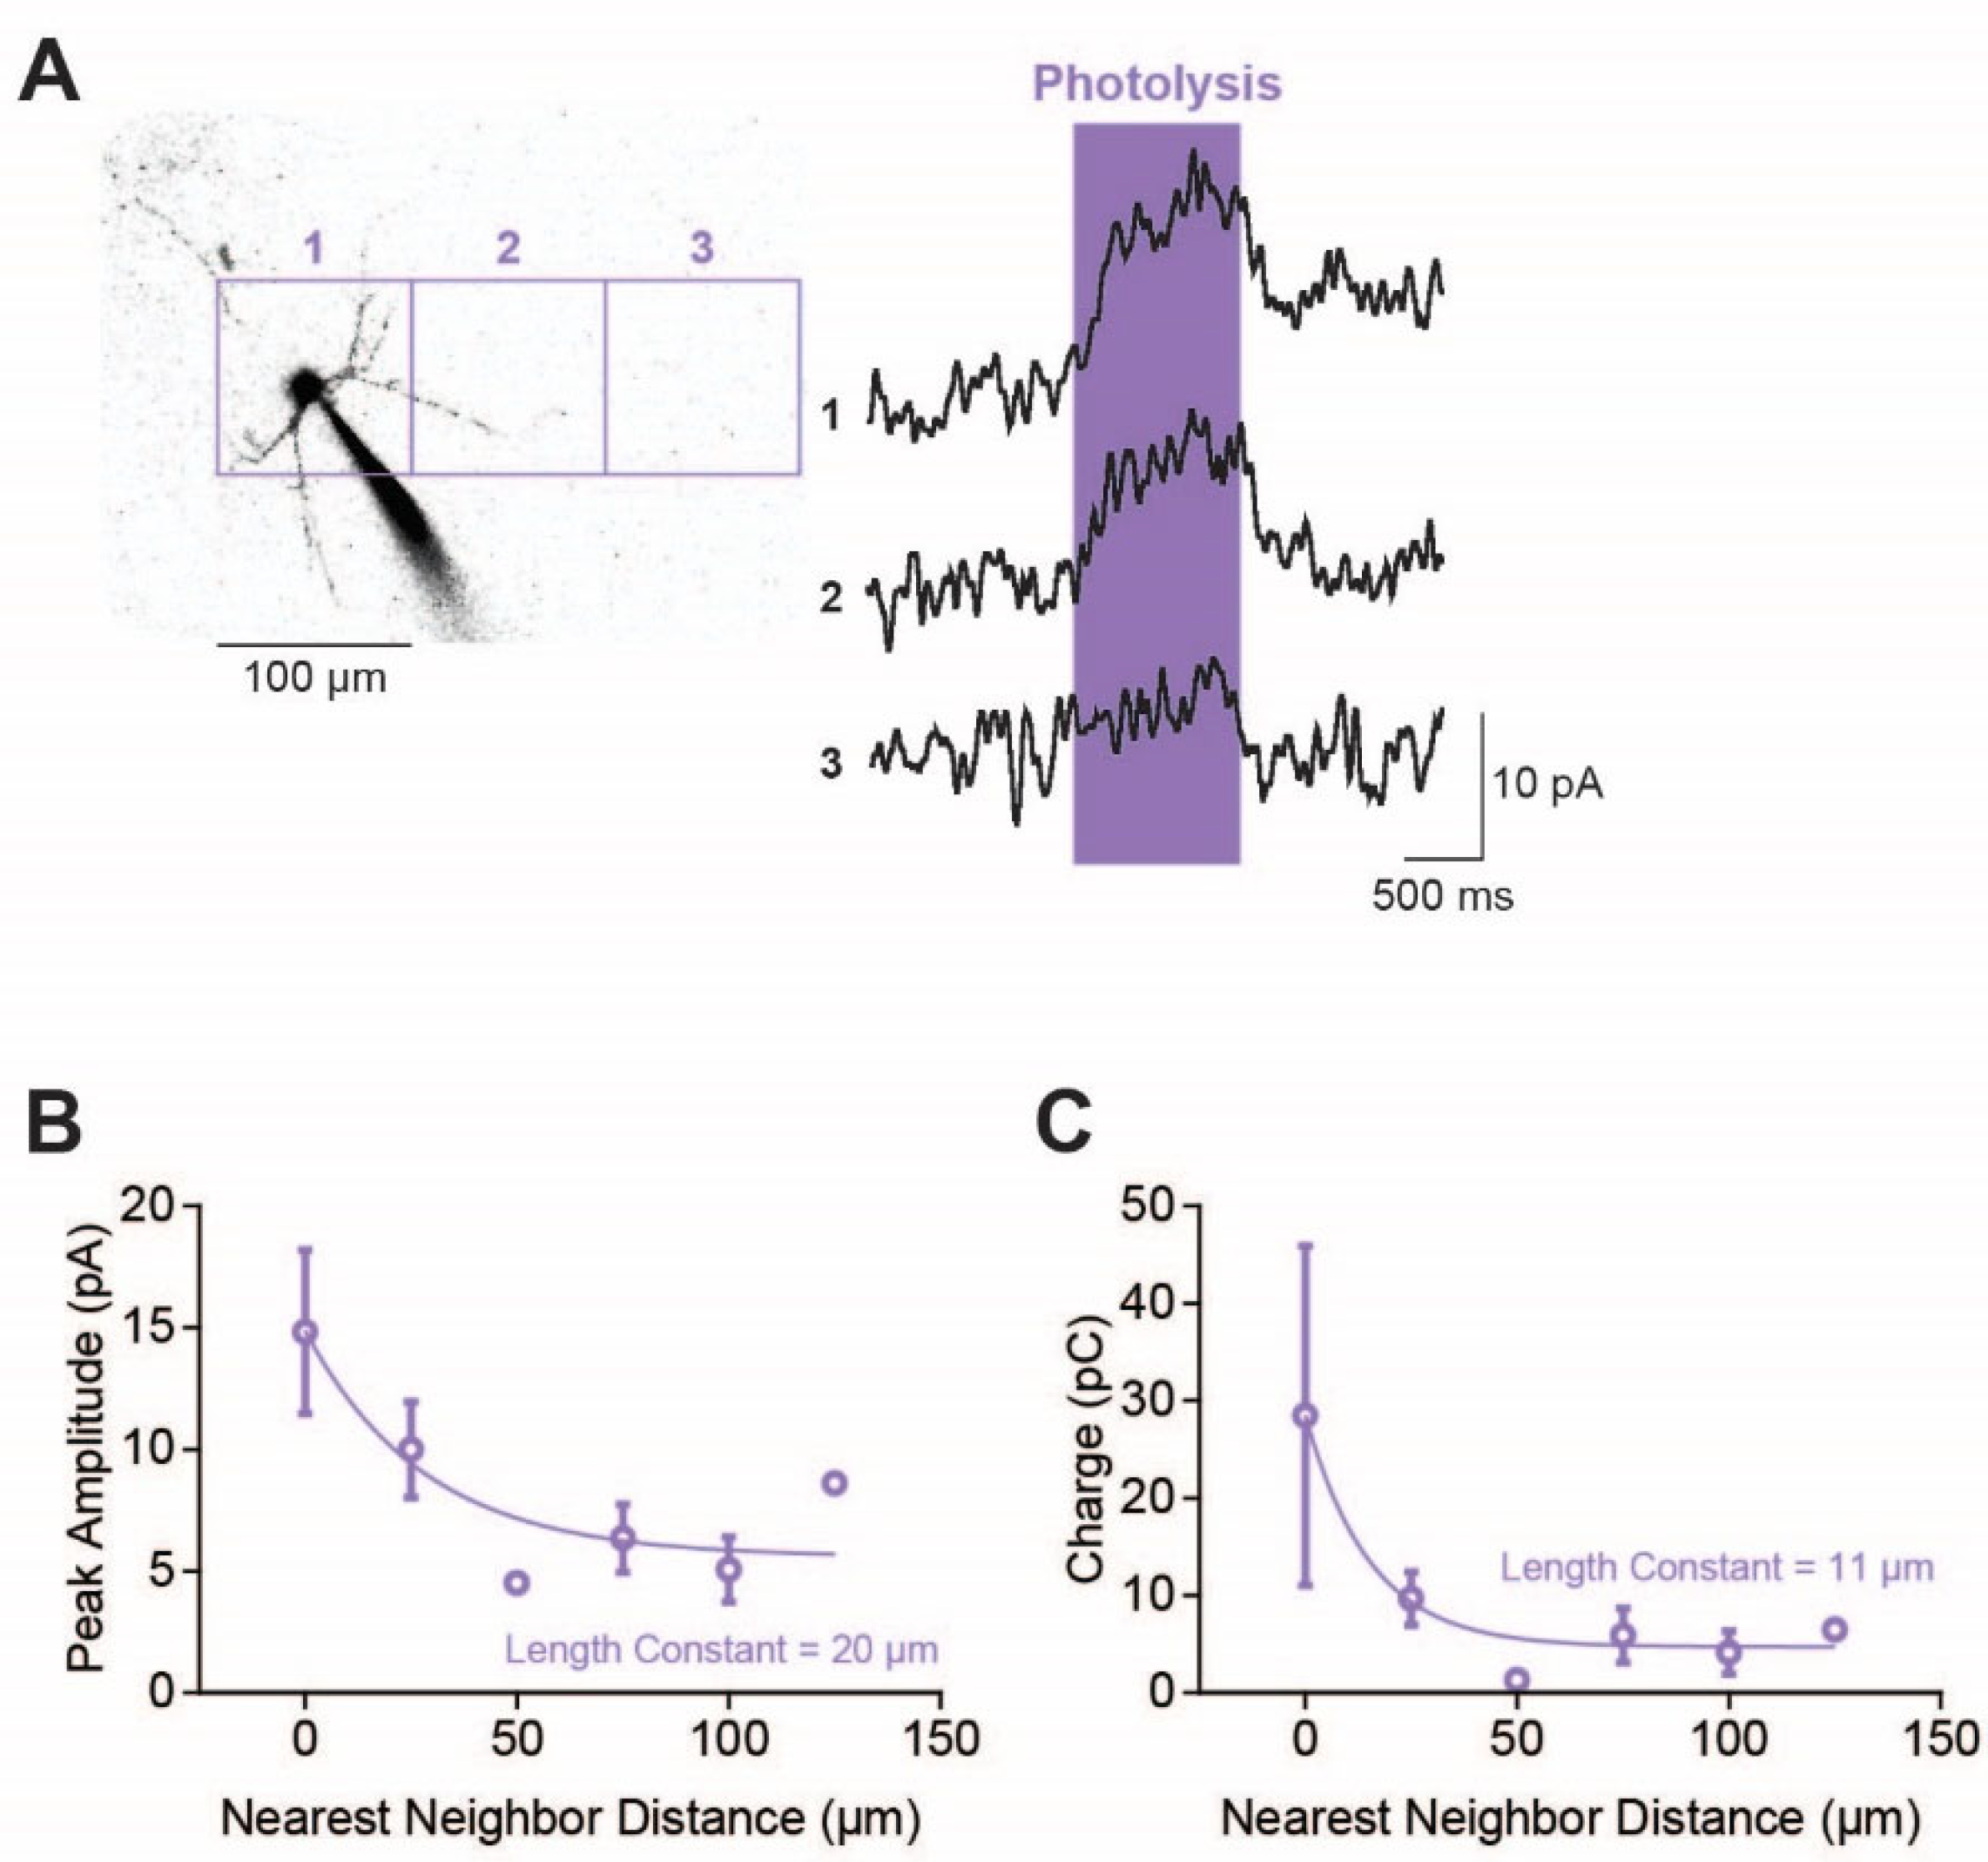
Figure 9.
5-HT uncaging reveals distribution of 5-HTRs in claustral PN neuronal compartments. (A) 5-HT-induced outward currents caused by photolyzing caged 5-HT over nearly the whole neuron (upper large square in left image), soma (upper small square in left image), 1 dendrite (lower small square in left image) or many dendrites (lower large square in left image). (B) Charge of outward currents induced by uncaging 5-HT at the whole neuron, soma and calculated dendrite component (whole neuron – soma). (C) Charge of the 5-HT-induced outward currents for the calculated dendrite component and actual responses measured after uncaging 5-HT over a large area that includes many dendrites. Points in (B) and (C) show individual measurements, bars indicate mean values and error bars show SEM. Asterisks indicate statistically significant differences; refer to Table 1 for statistical analyses.
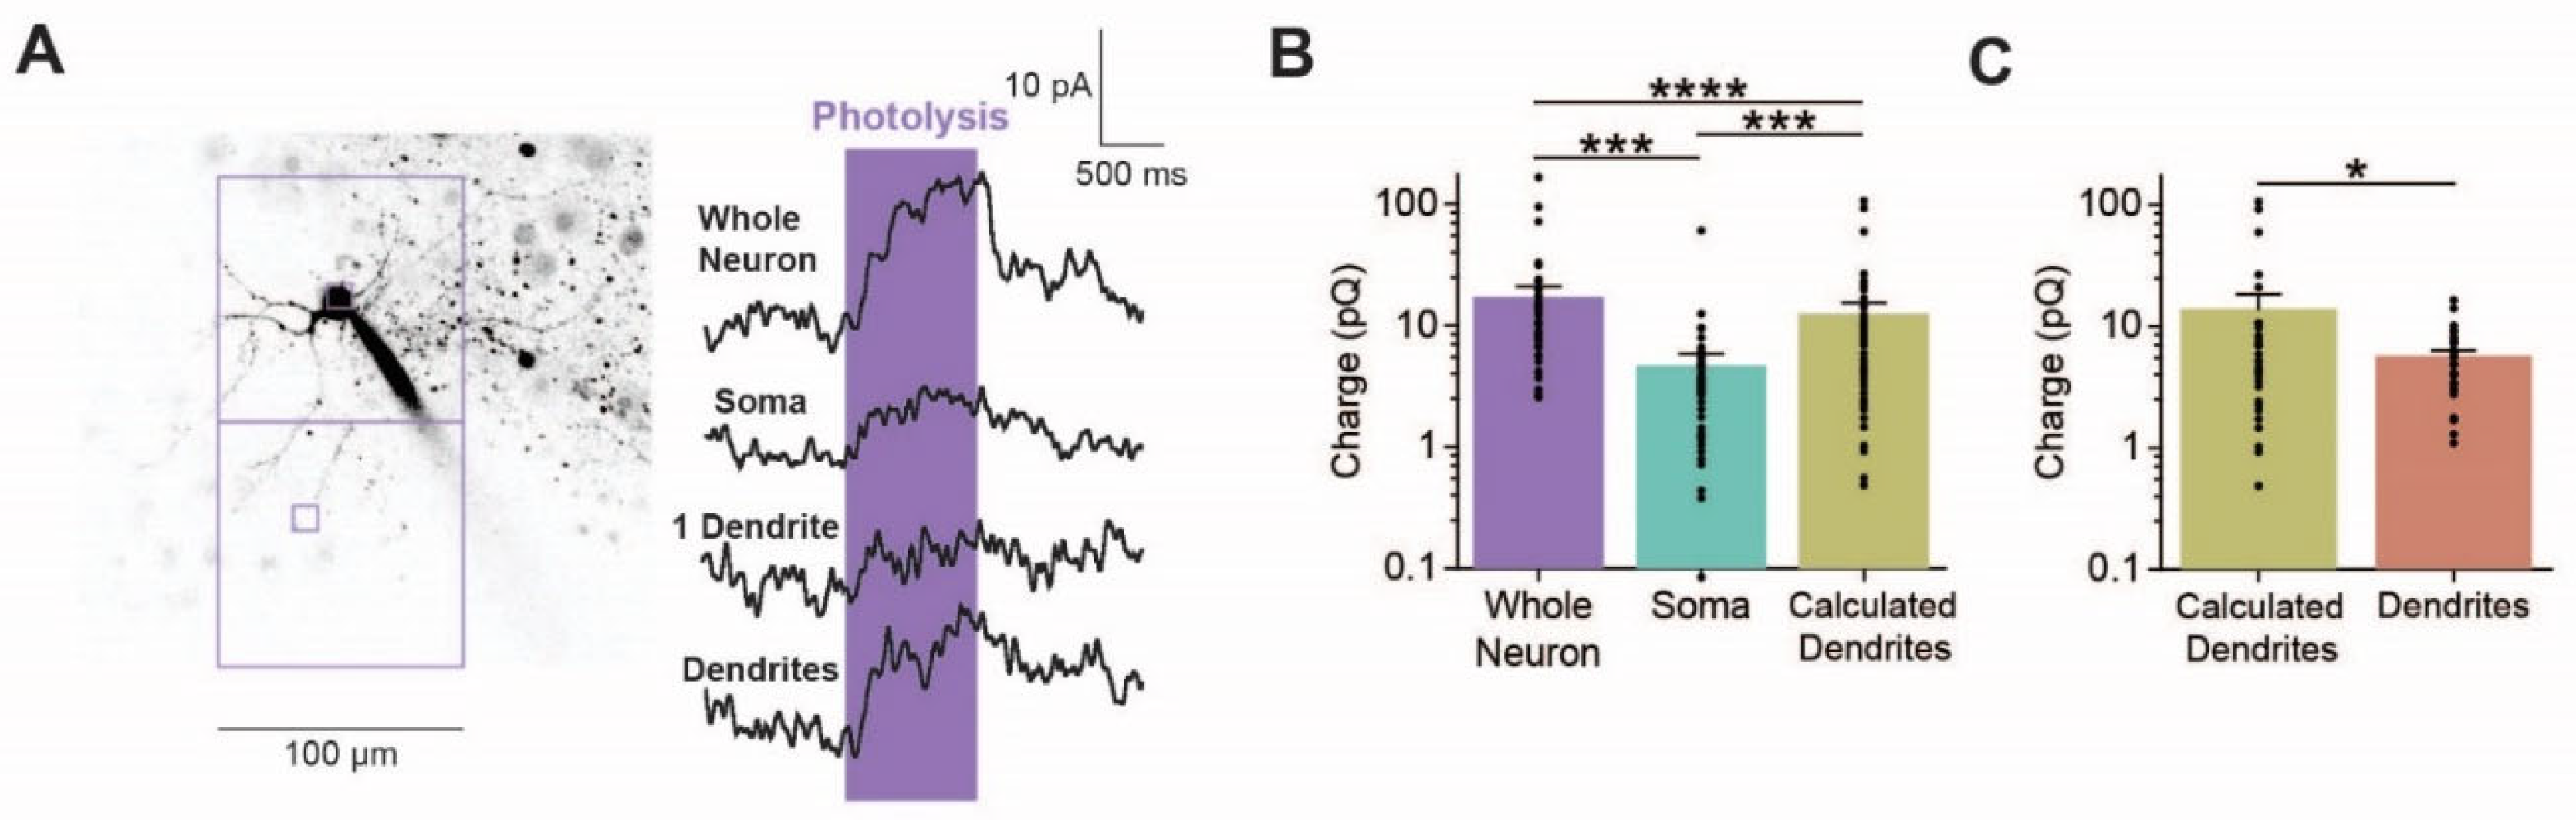
Figure 10.
Localization of 5-HTR-1A on claustral PNs. (A) 5-HT-induced outward currents caused by photolyzing caged 5-HT over the whole neuron (large left square), soma (small square), and dendrites (large right square). Black traces represent responses measured in normal ACSF, while the red traces represent responses measured in the presence of WAY100635. (B) Total charge of responses to uncaging 5-HT in the indicated neuronal compartments, measured in control conditions and in the presence of WAY1000635. Points show individual measurements, bars indicate mean values and error bars show SEM. (C) Percentage reduction in responses to uncaging 5-HT produced by WAY1000635. Bars indicate mean values and error bars show SEM. Refer to Table 1 for statistical analyses.
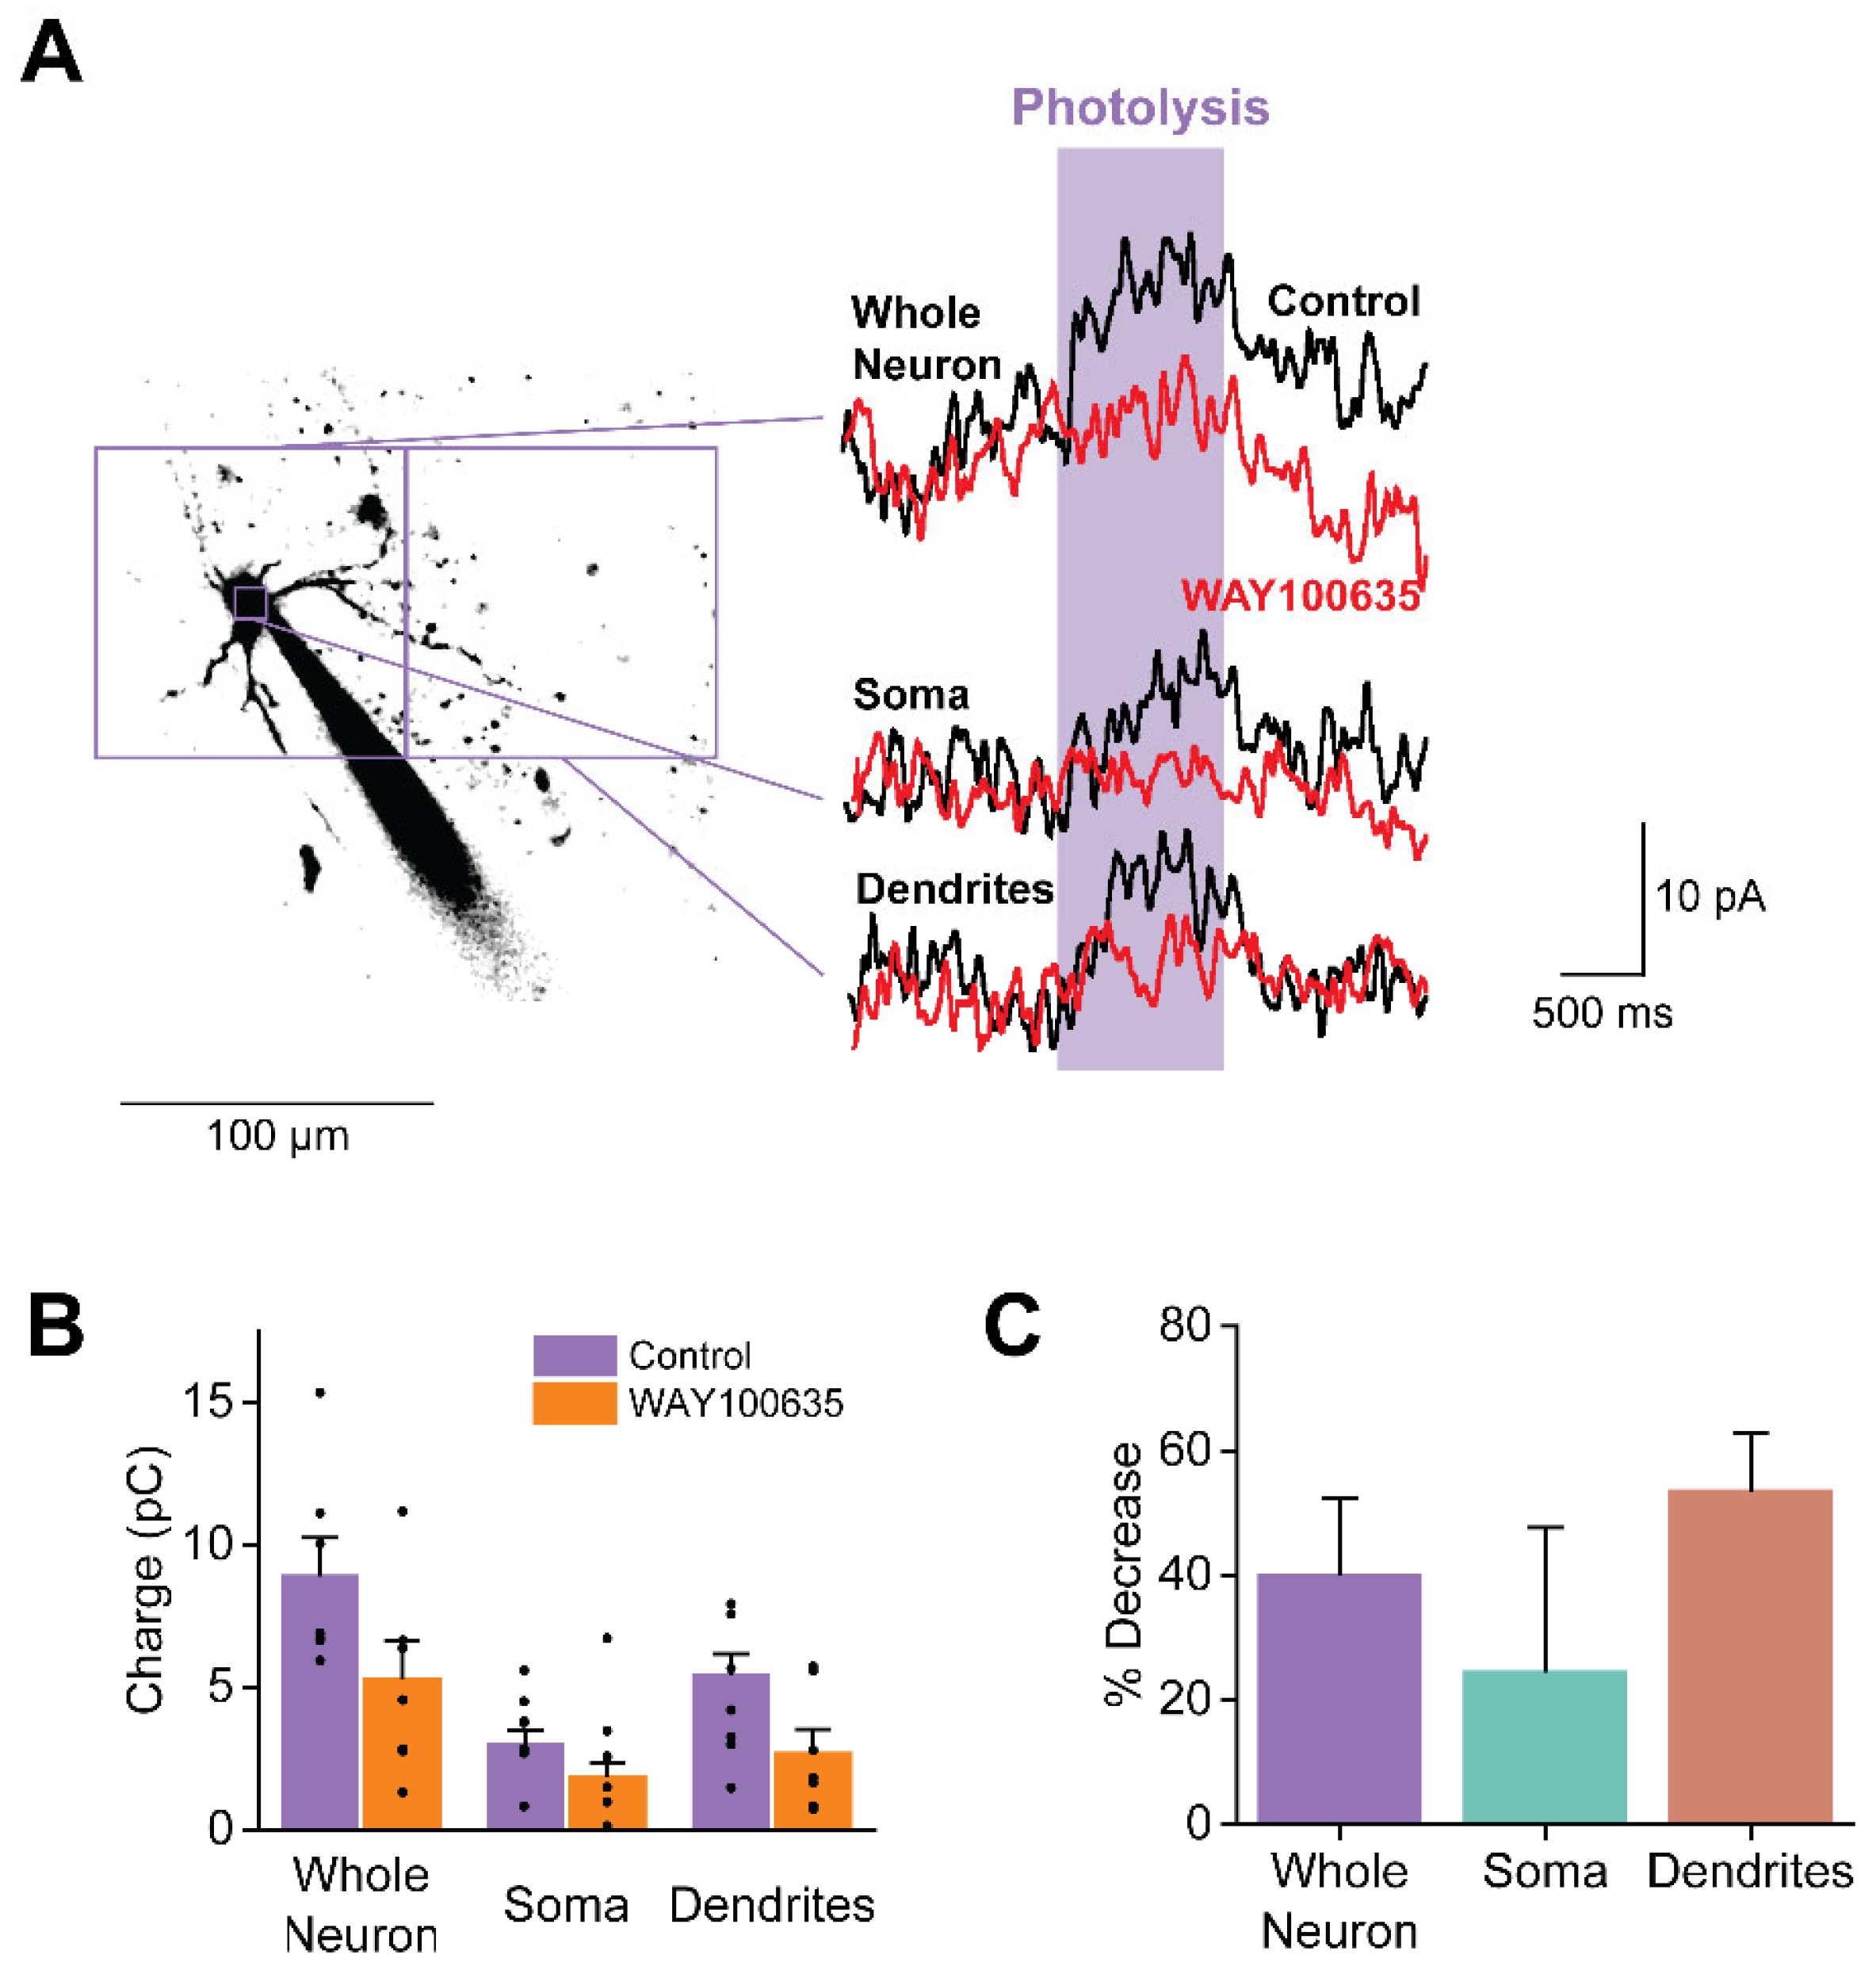

Table 1.
Statistical analyses for data contained in this paper.
| Figure | Group(s) and Sample Size | Test/Fit | Result |
|---|---|---|---|
| Suppl. Figure S1 | Control vs KA+GBZ for Charge (n = 13) | Paired t-test | t(12) = 1.47, p =0.17 |
| Figure 3B | Overall response rate(n = 182) | Chi square | X2(1, 182) = 25.1, p = 0.00005 |
| PN1 (n = 19) vs Average Response rate (n = 182) | X2 (1, 201) = 7.12, p = 0.008 | ||
| PN2 (n = 42) vs Average Response rate (n = 182) | X2(1, 272) = 0.001, p = 0.974 | ||
| Figure 3C | PN subtype effect on Peak amplitude (n = 182) | Welch’s ANOVA | F(4, 123) = 3.53, p = 0. 0.023 |
| Pairwise comparison | Tukey’s test | p > 0.05 | |
| Related to Figure 3 | PN subtype effect on Charge(n = 182) | Welch’s ANOVA | F(4, 123) = 7.77, p = 0.0010 |
| Pairwise comparison | Tukey’s test | p > 0.05 | |
| Related to Figure 3 | PN subtype effect on Exponential decay (n = 182) | Welch’s ANOVA | F(4, 122) = 0.35, p = 0.84 |
| Related to Figure 3 | PN subtype effect on Peak time (n = 182) | Welch’s ANOVA | F(4, 123) = 0.26, p = 0.902 |
| Related to Figure 3 | PN subtype effect on Conductance (n = 182) | Welch’s ANOVA | F(4, 123) = 3.53, p = 0. 0.023 |
| Pairwise comparison | Tukey’s test | p > 0.05 | |
| Figure 4B | Drug effect on % decrease in charge (n = 41) | Welch’s ANOVA | F(2, 38) = 15.818, p = .00001 |
| Pairwise comparison | Tukey’s test | 1A vs 2A: p < 0.05$$$1A vs 2C: p < 0.0001$$$2A vs 2C: p = 0.21 | |
| Figure 7C | Control vs 5-HT for Input50 (n = 19) | Paired t-test | t(18) = -3.70, p = 0.0016 |
| Figure 7D | Control vs 5-HT for Slope (n = 19) | Paired t-test | t(18) = -1.12, p = 0.28 |
| Figure 7E | Control vs 5-HT for Output50 (n = 19) | Paired t-test | t(18) = -0.24, p = 0.82 |
| Figure 7F | Control vs 5-HT for OutputMax (n = 19) | Paired t-test | t(18) = 0.59, p = 0.56 |
| Figure 9B | Location effect on Charge (n = 50) | One-way repeated ANOVA | F(2, 147) = 4.89, p = 0.008 |
| Whole neuron vs soma for charge (n = 50) | Paired t-test | t(49) = 4.31, p = 0.00008 | |
| Whole neuron vs calculated dendrites for charge (n = 50) | Paired t-test | t(49) = 3.91, p = 0.0002 | |
| Soma vs calculated dendrites for charge (n = 50) | Paired t-test | t(49) = 3.48, p = 0.001 | |
| Figure 9C | calculated dendrites vs dendrites for charge (n = 31) | Paired t-test | t(30) = 2.32, p = 0.03 |
| Figure 10B | Main effect of Drug for 1 s Integral (n = 7) | Two-way repeated ANOVA | F(1, 38) = 11.64, p = 0.002 |
| Main effect of Location Current for 1 s Integral (n = 7) | F(2, 38) = 14.10, p = 0.00003 | ||
| Interaction between Drug and Location for 1 s Integral (n = 7) | F(1, 38) = 13.28, p = 0.000004 | ||
| Figure 10C | Location effect on Charge (n = 7) | One-way repeated ANOVA | F(2, 18) = 0.93, p = 0.41 |
Disclaimer/Publisher’s Note: The statements, opinions and data contained in all publications are solely those of the individual author(s) and contributor(s) and not of MDPI and/or the editor(s). MDPI and/or the editor(s) disclaim responsibility for any injury to people or property resulting from any ideas, methods, instructions or products referred to in the content. |
© 2024 by the authors. Licensee MDPI, Basel, Switzerland. This article is an open access article distributed under the terms and conditions of the Creative Commons Attribution (CC BY) license (http://creativecommons.org/licenses/by/4.0/).
Copyright: This open access article is published under a Creative Commons CC BY 4.0 license, which permit the free download, distribution, and reuse, provided that the author and preprint are cited in any reuse.


