
Submitted:
31 October 2024
Posted:
01 November 2024
You are already at the latest version
Abstract
The malacological fauna of two algal habitats with different lighting conditions -a sciophilous wall and a photophilous one- both located in Tossa de Mar (Costa Brava, Girona, NE Spain), have been studied to examine differences in the malacological communities, their distribution over time, and the role played by micromollusks in these algal habitats. Every two months, for a year, samples were collected by scuba diving and scraping standardized surfaces (20x20 cm) of the algal communities. In the laboratory, the samples were washed and filtered using two metal sieves (2 mm for coarse fraction and 513 µm for fine fraction). Mollusks were separated, identified, and later analyzed statistically to assess biodiversity indices and sample grouping. A total of 7,913 mollusk specimens from 148 species (112 Gastropoda; 32 Bivalvia and 4 Polyplacophora) were identified across all samples, with 1,669 specimens (84 species) from the sciophilous algae and 6,244 specimens (133 species) from the photophilous algae. 10 species accounted for 76.27% of the total abundance, with each species represented by over 100 specimens in the total samples. Bittium latreillii was the most abundant species, with 2,106 specimens recorded. Regarding the two fractions, 337 specimens (69 species) were found in the coarse fraction, while 7,576 specimens (111 species) were found in the fine fraction. Significant differences were obtained between samples with respect to time, habitat type, and size fraction. The Shannon-Wiener biodiversity index values indicated differences between the two communities over time, as well as variations in biodiversity, with the photophilous community exhibiting higher values. Additionally, it was demonstrated that algal thalli provide a highly suitable substrate for juvenile forms and micromollusks. Our findings, combined with records from the literature and various online citations, establish Tossa de Mar as the town on the Catalan coast with the best-documented malacological fauna.
Keywords:
algal mollusks
; diversity
; abundance
; habitats
; Tossa de Mar (NE Spain)
1. Introduction
In the upper infralittoral of all seas and oceans, seaweeds are essential components for the development of animal populations, particularly invertebrates, which find protection, shelter, food and reproductive sites [1-5]. In some cases, they even form true mutualistic symbiotic relationships between algae and animals [6].
In the Mediterranean Sea, many studies emphasize the structural complexity of the various habitats found there, which is why comparisons between different communities and their associated fauna are necessary. Focussing on mollusks in shallow marine environments, Chemello et al. [7] noted that the spatial distribution of the malacological fauna associated with the photophilous algal communities is influenced by factors such as depth and the algal substrate. However, others, like García et al. [8], observe a more homogeneous distribution of gastropod species across all types of algae and habitats, except for certain groups like Sacoglossa gastropods, which are associated with specific species of Caulerpa algae, such as Berthelinia caribbea Edmunds, 1963.
Avila et al. [9] highlight that the floristic composition and algal biomass are crucial in determining the distinctiveness of the micromollusk community, as in the intertidal zone of the Azores, where these factors provide protection from waves, high temperatures, and desiccation. The so-called algal architecture is also critical for the settlement and abundance of epibiont marine invertebrate species, particularly mollusks [10, 11] Various sources also report behavioral patterns shifts and the advantages smaller species have over larger adults when living among algae fronds. The behavioral changes observed by Terlizzi et al. [12] show that the species within the same genus can exhibit differences in juvenile abundance due to differences in their life cicles. This is exemplified by Bittium latreillii (Payraudeau, 1826) and Bittium reticulatum (da Costa, 1778), where the former has an 18 month life cycle with semelparous reproduction, recruiting in October, February and June, while the latter shows a single recruitment peak in May, reflected in its abundance throughout the year. On the other hand, smaller species benefit from reduced dispersal capacity [9] and the protection offered by the interstices within algal fronds [8].
It is well known that infralittoral algal communities can be classified according to hydrodynamism (calm or turbulent) and the light they receive (sciophilous or photophilous). In the Mediterranean Sea, typical algal species that characterize sciophillous habitats in the upper infralittoral zone include, among others, Flabellia petiolata (Turra) Nizamuddin, 1987, Halopteris filicina (Grateloup) Kützing, 1843, Peyssonnelia rubra (Greville) J .Agardh, 1851 and Halimeda tuna (J.Ellis & Solander) J.V.Lamouroux, 1816. Photophilous habitats are mainly defined by the presence of algae such as Halopteris scoparia (Linnaeus) Sauvageau, 1904, Padina pavonica (Linnaeus) Thivy, 1960, Dictyota dichotoma (Hudson) J.V.Lamouroux, 1809 and Corallina officinalis Linnaeus, 1758, the latter being more closely studied in relation to malacological fauna.
In recent dècades, several studies in the Mediterranean Sea have explored the relationship between mollusks and different types of algae. Por example on calcareous algae [13, 14]; on photophilous algae [7, 10, 15, 16]; on Halopteris scoparia (Linnaeus) Sauvageau, 1904 [17]; on Cystoseira [18]; or on the malacofauna of Posidonia oceanica meadows [19], among others.
Tossa de Mar (Girona, NE Spain) is a tourist town on the Spanish Costa Brava very popular among scuba divers. From the beach, divers can access rocky and sandy seabeds, caves and Posidonia oceanica meadows, all teeming with marine biodiversity.
This study aims to contribute to the knowledge of the algal-associated marine malacofauna in this locality. Specifically we aim to determine the role of micromollusks and juvenile forms of larger species in algal communities. We also assess whether significant differences exist in the biodiversity and abundance of mollusk populations between two contrasting algal communities -one photophilous and the other sciophilous- located on two nearby rock walls. Lastly, we examine abundance and diversity patterns in these two contrasting environments over the course of an annual cycle.
2. Material and Methods
2.1. Study Area
The study was conducted in the town of Tossa de Mar, located in the La Selva region of Girona province, on the southern Costa Brava (NE Spain), approximately 100 km north of Barcelona. The sampling site was at the location known as “Sa Banyera de ses Dones” (Figure 1) situated at the northern end of La Mar Menuda beach. This site features a rocky corridor with a thick sandy bottom flanked by nearly vertical rock walls that are about 10 m apart. The bathymetric levels of these walls range from 2 to 11 meters in depth. The southern wall is vertical and faces northwest, giving it distinctly sciophilic characteristics. In contrast, the northern wall has a slope of about 70º and faces southeast, allowing it to receive direct sunlight, which results in a community dominated by photophilous algae (Figure 2).
2.2. The Studied Communities
At depths between 1,5 and 3m, the sciophilous wall is dominated by photophilous algae, including Osmundea pinnatifida, Ellisolandia elongata (J.Ellis & Solander) K.R.Hind & G.W.Saunders, 2013, Padina pavonica and some thalli of Codium vermilara (Olivi) Delle Chiaje, 1829. Additionally the community includes the unicellular green alga Acetabularia acetabulum (Linnaeus) P.C.Silva, 1952, cirriped crustaceans of the genus Semibalanus balanoides (Linnaeus, 1767), sea urchins (Arbacia lixula (Linnaeus, 1758)) and sponges such as Sarcotragus fasciculatus (Pallas, 1766). At depths of 3 to 4 meters, the wall becomes slightly more sciophilic (Figure 3B) with abundant fronds of Halopteris scoparia, the red algae Peyssonnellia squamaria (S.G.Gmelin) Decaisne ex J.Agardh, 1842, and the brown algae Dictyota dichotoma. Here, red encrusting sponges (Crambe crambe Schmidt, 1862) and some Sarcotragus fasciculatus are also observed. From 5 to 6 m. (Figure 3C) calcareous algae such as Mesophyllum lichenoides (J. Ellis) Me. Lemoine, 1928, and the red alga Sphaerococcus coronopifolius Stackhouse, 1797, as well as hydrozoans of the genus Eudendrium, become abundant. Scattered thalli of Halimeda tuna (J. Ellis & Solander) J.V. Lamouroux, 1816, along with the red algae Halopteris scoparia and Peyssonnelia squamaria (S. G. Gmelin) Decaisne ex J. Agardh, 1842, some thalli of Codium bursa (Olivi) C. Agardh, 1817, the sponge Crambe crambe, and the zoantharian cnidarian Parazoanthus axinellae (Schmidt, 1862) are also present. From depths of 7 to 8 m down to the bottom of the wall (11 m) (Figure 3D) the alga Flabellia petiolata predominates, with abundant polychaete spirorbids growing on its fronds. The community also includes encrusting calcareous algae, Peyssonnelia squamaria, Parazoanthus axinellae, the sponges Phorbas tenacior (Topsent, 1925), Petrosia (Petrosia) ficiformis (Poiret, 1789), Chondrosia reniformis Spikenard, 1847 and Clathrina clathrus (Schmidt, 1864), as well as serpulid polychaetes like Serpula vermicularis Linnaeus, 1767.
The photophilous wall exhibits a fairly homogeneous algal community, with few macroscopic invertebrates observed. At depths between 2 and 4 meters, the wall is vertical and dominated by photophilous algae in a wave-beaten mode (Figure 4A), primarily Osmundea pinnatifida, Acetabularia (Acetabularia) acetabulum, filamentous brown algae, Corallina elongata and Padina pavonica. Among these algae, numerous specimens of the cirriped crustacean Semibalanus balanoides (Linnaeus, 1767) can be found. From 4 meters to the bottom (11 meters), the wall becomes slightly inclined and is nearly completely covered by photophilous algae, with abundant thalli of Padina pavonica and Halopteris scoparia (Figure 4D), Acetabularia (Acetabularia) acetabulum (Figure 4B). Scattered specimens of Codium bursa, Dictyota, thalli of Sphaerococcus coronopifolius, and encrusting red algae are present beneath the high thallus algal mat. There are also several isolated thalli of Codium vermilara (Figure 4C). Among the macroscopic fauna, sea urchins (Arbacia lixula), sponges (Sarcotragus fasciculatus) and some polychaete spirographs (Sabella spallanzanii (Gmelin, 1791)) can be observed. Additionally, there are also small sciophilous enclaves featuring Peyssonnelia squamaria, the serpulid polychaete Protula tubularia (Gmelin, 1791), the sponge Aplysina aerophoba (Nardo, 1833) and the equiurid Bonellia viridis Rolando, 1822.
2.3. Sampling and Processing of Samples
Sampling was conducted every two months from January to November 2011 by two divers using scuba gear. Underwater photographs of the main communities present on both walls were taken with an Olympus SP-350 camera inside a waterproof housing.
Algal samples were collected by scraping the existing algal community inside a metal square measuring 20 x 20 cm. During each sampling dive, three replicates were randomly collected from each wall, (photophilous and sciophilous. Samples were introduced in plastic bags in situ. After surfacing and draining most of the water, 70% alcohol was added to each bag. In total, 36 samples were obtained, with 18 corresponding to the photophilous wall (6 samples x 3 replicates) and another 18 to the sciophilous wall (6 samples x 3 replicates).
2.4. Work in the Laboratory
In the laboratory, each sample was washed under running water using two metal filters with mesh sizes of 2 mm and 315 µm. This process allowed the separation of the algal and invertebrate specimens into two fractions: the coarse fraction and the fine fraction respectively. From these two fractions, the mollusk specimens were separated from the other invertebrates using a Carl Zeiss binocular magnifying glass model GMbH STEMI 2000-C.
Next, the mollusk specimens from both fractions were sorted by morphotype in plastic classification racks for subsequent counting and taxonomic identification up to the species or higher level. Various general identification guides were employed [21-27] along with specialized literature for identifiying juvenile mollusk stages [28] For the current taxonomy and nomenclature of the species, the recommendations of World Registrer of Marine Species [29] were generally followed.
Specimens that posed challenges in their taxonomic determination or were unusual were photographed and preserved in Eppendorf tubes for identification by specialists. However, some specimens (especially bivalves) were only identified at the class level due to their early development stages.
2.5. Data Analysis and Statistical Methods
Species abundance data were expressed as number of individuals per replicate sample (no. individuals / 400 cm2). Species richness (S), total abundance of individuals (N), Shannon-Wiener diversity index (H‘) and Pielou evenness (J’) were calculated for each sampling site. For diversity and evenness, permutation tests (within the PERMANOVA framework) were performed to determine whether there were significant differences between habitats, fractions and months.
To analyse and compare community composition in relation to habitat, fraction, and seasonal variation, a proximity matrix was constructed using Bray-Curtis similarity. Prior to this, a fourth root transformation was applied to reduce the influence of extreme values and obtain less asymmetric distributions of abundances. PERMANOVA designs were then used to assess significant differences based on habitat, fraction, and months. Two-dimensional representations using the NMDS technique (Kruskal's algorithm) were created to visualise relationships across habitats, fractions and months.. To identify potential clusters, dendrograms were constructed using the UPGMA method, and significant branches were tested with the SIMPROF test (α=5%). The clusters identified through this methodology were then represented as ellipsoids on NMDS plots. Finally, species abundance data were grouped by trophic level, and some of the above techniques were re-applied.
All analyses were carried out using PRIMER 7 with PERMANOVA (Plymouth Routines In Multivariate Ecological Research).
3. Results
3.1. General Abundance and Specific Richness
A total of 7,913 mollusc specimens, representing 148 different species, were counted across all samples. Of these, 32 belong to the class Bivalvia, 112 to Gastropoda, and 4 to Polyplacophora. Some specimens, due to their small size and immaturity, were identified only to the genus level, higher taxon or simply as morphotypes. Table I lists the species found in the samples, ordered by total abundance, along with their abundance in the two environments (photophilous and sciophilous) and their trophic categories. Supplementary Table I shows the species’ abundance according to their presence in the two studied fractions, fine and coarse. Regarding the two habitats, the photophilous environment proved to be the most abundant, with 6,244 mollusk specimens (6,017 in fine fraction and 227 in coarse fraction), while the sciophilic algae environment contained 1,669 specimens (1,559 in fine fraction and 110 in the coarse fraction). In terms of specific richness, the photophilous environment again stood out, with 133 different species (105 in the fine fraction and 58 in the coarse fraction), compared to 84 species in the sciophilous environment (62 in the fine fraction and 38 in the coarse fraction). Of the total number of species, 15 were exclusive to the sciophilous environment, 65 were found only in the photophilous environment, and 68 were present in both environments. Of all species, 35 were found only in the coarse fraction, 76 only in the fine fraction, and 37 species were present in both fine and coarse fractions. Among the mollusks of the fine fraction, 57 species were found in both the photophilous and sciophilous samples, 50 species were exclusive to the photophilous environment, and 6 were exclusive to the sciophilous environment. In the coarse fraction, 25 species were present in both sciophilousenvironments, 33 were found only in the photophilous samples, and 12 species appeared only in sciophilous samples. A total of 72 species were identified in the coarse fraction samples, and 111 in the fine fraction.

Table 1.
List of species according to their abundances and trophic categories. “C”: carnivore; “EC”: ectoparasite; “F”: filter feeder; “HE”: herbivore; “SC”: scavenger; “SDF”: surface depot feeder; “UN”: unknown. “Sc”: sciophilous environment; “Ph”: photophilous environment. Note: Some authors classify the species from the Pyramidelloidea group as ectoparasites of echinoderms or other invertebrates, while others consider them microcarnivores. In this study, they are classified as ectoparasites.
| Species | Trophic categories |
Total abundances |
Sc | Ph |
|---|---|---|---|---|
| Bittium latreillii | HE | 2106 | 55 | 2,051 |
| Musculus costulatus | F | 1282 | 486 | 796 |
| Pusillina philippi | C | 817 | 272 | 545 |
| Pusillina radiata | F | 546 | 179 | 367 |
| Hiatella arctica | HE | 404 | 162 | 242 |
| Rissoella diaphana | HE | 228 | 0 | 228 |
| Odostomia striolata | HE | 217 | 50 | 167 |
| Alvania lineata | HE | 176 | 49 | 127 |
| Chauvetia mamillata | C | 130 | 22 | 108 |
| Parvicardium scriptum | F | 130 | 29 | 101 |
| Triphoridae indet. | C | 130 | 16 | 114 |
| Bittium reticulatum | HE | 96 | 10 | 86 |
| Clanculus cruciatus | HE | 88 | 8 | 80 |
| Striarca lactea | F | 88 | 13 | 75 |
| Tritia incrassata | SC | 80 | 20 | 60 |
| Ammonicera fischeriana | HE | 79 | 13 | 66 |
| Modiolula phaseolina | F | 67 | 11 | 56 |
| Vitreolina perminima | C | 65 | 6 | 59 |
| Jujubinus ruscurianus | HE | 62 | 13 | 49 |
| Mytilus galloprovincialis juv. | F | 57 | 11 | 46 |
| Crisilla semistriata | HE | 53 | 29 | 24 |
| Cerithium vulgatum | SDF | 41 | 2 | 39 |
| Parvamussium fenestratum | F | 41 | 22 | 19 |
| Aplysia punctata juv. | HE | 40 | 10 | 30 |
| Arca noae | F | 40 | 1 | 39 |
| Runcina sp. | HE | 39 | 4 | 35 |
| Aequipecten opercularis | F | 36 | 23 | 13 |
| Parthenina emaciata | C | 36 | 0 | 36 |
| Alvania cancellata | HE | 35 | 3 | 31 |
| Runcina adriatica | C | 30 | 3 | 27 |
| Cyrillia linearis | C | 29 | 1 | 28 |
| Cerithiopsis tubercularis | C | 25 | 2 | 23 |
| Limaria tuberculata | F | 24 | 13 | 11 |
| Irus irus | F | 22 | 5 | 17 |
| Mimachlamys varia | F | 22 | 13 | 8 |
| Scissurella costata | HE | 22 | 1 | 21 |
| Gibberula turgidula | C | 20 | 0 | 20 |
| Odostomia plicata | EP | 20 | 11 | 9 |
| Tricolia sp. | HE | 20 | 3 | 17 |
| Chauvetia brunnea | C | 17 | 9 | 8 |
| Cerithiopsis jeffreysi | C | 16 | 0 | 16 |
| Gregariella semigranata | F | 16 | 8 | 8 |
| Mitromorpha columbellaria | C | 16 | 5 | 11 |
| Ocinebrina aciculata | C | 16 | 2 | 14 |
| Odostomella doliolum | EC | 16 | 1 | 15 |
| Bulla striata | C | 15 | 3 | 12 |
| Setia pulcherrima | HE | 15 | 5 | 10 |
| Haminoea navicula | HE | 13 | 0 | 13 |
| Petricola lithophaga | F | 13 | 0 | 13 |
| Chama gryphoides | F | 12 | 8 | 4 |
| Rissoa lia | HE | 11 | 1 | 10 |
| Monophorus erythrosoma | C | 10 | 2 | 8 |
| Alvania nestaresi | HE | 9 | 0 | 9 |
| Bittium sp. | HE | 9 | 0 | 9 |
| Cerithiopsis sp. | C | 9 | 0 | 9 |
| Modiolus barbatus | F | 9 | 1 | 8 |
| Rissoa variabilis | HE | 9 | 1 | 8 |
| Bivalvia morph. 1 | F | 8 | 0 | 8 |
| Doridina nudibranch | C | 8 | 3 | 5 |
| Hexaplex trunculus | C | 8 | 4 | 4 |
| Pusia tricolor | C | 8 | 2 | 6 |
| Raphitoma echinata | C | 8 | 2 | 6 |
| Anomia ephippium | F | 6 | 4 | 2 |
| Diodora graeca | HE | 6 | 2 | 4 |
| Marshallora adversa | C | 6 | 2 | 4 |
| Muricopsis cristata | C | 6 | 4 | 2 |
| Philine sp. | C | 6 | 0 | 6 |
| Pseudochama gryphina | F | 6 | 3 | 3 |
| Rhyssoplax corallina | HE | 6 | 3 | 3 |
| Alvania aspera | HE | 5 | 0 | 5 |
| Alvania sp. | HE | 5 | 0 | 5 |
| Gastropoda morph. 1 | UN | 5 | 0 | 5 |
| Gibberula miliaria | C | 5 | 0 | 5 |
| Mitromorpha olivoidea | C | 5 | 1 | 4 |
| Tricolia tingitana | HE | 5 | 0 | 5 |
| Trinchesia genovae | C | 5 | 0 | 5 |
| Acanthochitona sp. | HE | 4 | 0 | 4 |
| Chauvetia recondita | C | 4 | 0 | 4 |
| Nodulus contortus | HE | 4 | 0 | 4 |
| Smithiela costulata | C | 4 | 1 | 3 |
| Spiralina alpinoligustica | EC | 4 | 2 | 2 |
| Acanthochitona fascicularis | HE | 3 | 2 | 1 |
| Aegires leuckartii | C | 3 | 1 | 2 |
| Bivalvia morph. 2 | F | 3 | 0 | 3 |
| Gibberula morph. 1 | UN | 3 | 0 | 3 |
| Haliotis tuberculata | HE | 3 | 2 | 1 |
| Lima lima | F | 3 | 0 | 3 |
| Limaria hians | F | 3 | 2 | 1 |
| Pusillina inconspicua | HE | 3 | 0 | 3 |
| Veneridae indet. | F | 3 | 1 | 2 |
| Bivalvia morph. 4 | F | 2 | 1 | 1 |
| Brachystomia scalaris | EC | 2 | 0 | 2 |
| Calliostoma zizyphinum | C | 2 | 0 | 2 |
| Crisilla simulans | HE | 2 | 0 | 2 |
| Diodora italica | HE | 2 | 2 | 0 |
| Doris ocelligera | C | 2 | 2 | 0 |
| Emarginula pustula | C | 2 | 1 | 1 |
| Episcomitra cornicula | C | 2 | 2 | 0 |
| Folinella excavata | EC | 2 | 0 | 2 |
| Fusinus rudis | C | 2 | 0 | 2 |
| Gastropoda morph. 2 | UN | 2 | 0 | 2 |
| Jujubinus exasperatus | HE | 2 | 1 | 1 |
| Polyplacophoran indet. | HE | 2 | 0 | 2 |
| Raphitoma laviae | C | 2 | 0 | 2 |
| Raphitoma morph. 1 | C | 2 | 0 | 2 |
| Rissoa guerinii | HE | 2 | 0 | 2 |
| Weinkauffia turgidula | C | 2 | 0 | 2 |
| Alvania cimex | HE | 1 | 1 | 0 |
| Alvania discors | HE | 1 | 0 | 1 |
| Aplus dorbignyi | SC | 1 | 0 | 1 |
| Babelomurex cariniferus | C | 1 | 1 | 0 |
| Bivalvia morph. 3 | F | 1 | 0 | 1 |
| Caloria elegans | C | 1 | 1 | 0 |
| Cardiidae morph. 1 | F | 1 | 0 | 1 |
| Cardiidae morph. 2 | F | 1 | 0 | 1 |
| Chauvetia morph. 1 | UN | 1 | 0 | 1 |
| Chauvetia morph. 2 | UN | 1 | 0 | 1 |
| Columbella rustica | HE | 1 | 1 | 0 |
| Doto sp. | C | 1 | 1 | 0 |
| Felimare sp. | C | 1 | 0 | 1 |
| Gari tellinella | F | 1 | 0 | 1 |
| Gastropoda morph 3 | UN | 1 | 1 | 0 |
| Gibberula morph. 2 | UN | 1 | 0 | 1 |
| Idas sp. | F | 1 | 1 | 0 |
| Ischnochitonidae indet. | HE | 1 | 0 | 1 |
| Lithophaga lithophaga | F | 1 | 1 | 0 |
| Mangelia multilineolata | C | 1 | 0 | 1 |
| Mangelia morph. 1 | UN | 1 | 0 | 1 |
| Mangelia morph. 2 | UN | 1 | 0 | 1 |
| Mitrella broderipii | C | 1 | 0 | 1 |
| Muricidae indet. | C | 1 | 0 | 1 |
| Nodulus spiralis | HE | 1 | 0 | 1 |
| Otina ovata | UN | 1 | 0 | 1 |
| Paradoris indecora | C | 1 | 0 | 1 |
| Patella sp. | HE | 1 | 0 | 1 |
| Philine intricata | C | 1 | 0 | 1 |
| Phorcus richardi | HE | 1 | 0 | 1 |
| Pseudomangelia vauquelini | C | 1 | 0 | 1 |
| Pusia ebenus | C | 1 | 0 | 1 |
| Raphitoma morph. 2 | C | 1 | 0 | 1 |
| Retilaskeya horrida | C | 1 | 1 | 0 |
| Retusa mammillata | C | 1 | 0 | 1 |
| Runcina coronata | HE | 1 | 0 | 1 |
| Spondylus gaederopus | F | 1 | 1 | 0 |
| Talochlamys multistriata | F | 1 | 0 | 1 |
| Tarantinaea lignaria | C | 1 | 0 | 1 |
| Tectura virginea | HE | 1 | 1 | 0 |
| Williamia gussoni | HE | 1 | 1 | 0 |
76.27% of the total abundance is represented by 10 species: Bittium latreillii (Payraudeau, 1826), Musculus costulatus (Risso, 1826), Pusillina philippi (Aradas & Maggiore, 1844), Pusillina radiata (R. A. Philippi, 1836), Hiatella arctica (Linnaeus, 1767), Rissoella diaphana (Alder, 1848), Odostomia striolata Forbes & Hanley, 1850, Alvania lineata Risso, 1826, Parvicardium scriptum (Bucquoy, Dautzenberg & Dollfus, 1892) and Chauvetia mamillata (Risso, 1826), each with more than 100 specimens counted across all samples. Notably, a large number of juvenile gastropods from the family Triphoridae (130 specimens) were also recorded but could not be identified at the species or genus level.
Table A1 in Appendix A details the abundances of each species by environment and by their presence in either the fine or coarse fraction. In the sciophilous environment the most abundant species -those with over 50 observed specimens- were Musculus costulatus with 486 specimens (all but two in the fine fraction), Pusillina philippi with 272 specimens (all in the fine fraction), Pusillina radiata with 179 specimens (all in the fine fraction), Hiatella arctica with 162 specimens (153 in the fine fraction and 9 in the coarse fraction), Bittium latreillii with 55 specimens (all but one in the fine fraction) and Odostomia striolata with 50 specimens (all in the fine fraction).
The samples from the photophilous wall, due to their greater specimen abundance, displayed a higher species diversity, with 16 species exceeding 50 observed specimens. Among those with more than 100 observed specimens, the most abundant by far was Bittium latreillii with 2,051 specimens (only one in the coarse fraction), followed by the bivalve Musculus costulatus with 796 specimens (only 8 in the coarse fraction), Pusillina philippi with 545 specimens (all in the fine fraction), Pusillina radiata with 367 specimens (all in the fine fraction), Hiatella arctica with 242 specimens (only three in the coarse fraction), Rissoella diaphana with 228 specimens (all in the fine fraction), Odostomia striolata with 167 specimens (all in the fine fraction), Alvania lineata with 127 specimens (only 11 in the coarse fraction), Chauvetia mamillata with 108 specimens (only 16 of them in the coarse fraction), and Parvicardium scriptum with 101 specimens (only one in the coarse fraction).
Regarding the two studied fractions, in the coarse one the most abundant species was Tritia incrassata with 40 specimens (35 in the photophilous environment), followed by Alvania lineata with 33 specimens (16 in the photophilous environment and 17 in the sciophilous environment), Chauvetia mammillata with 21 specimens (16 in the photophilous environment and 5 in the sciophilous) and Chauvetia brunnea with 17 specimens (8 in the photophilous environment and 9 in the sciophilous). In the fine fraction, the highest abundance corresponded to Bittium latreillii, with 2,104 specimens (2,050 in the photophilous environment and 54 in the sciophilous), followed by Musculus costulatus with 1,272 specimens (788 in the photophilous environment and 484 in the sciophilous), Pusillina philippi with 817 specimens (545 in the photophilous environment and 272 in the sciophilous), Pusillina radiata with 546 specimens (367 in the photophilous environment and 179 in the sciophilous) and Hiatella arctica with 242 specimens (239 in the photophilous environment and only 3 in the sciophilous).
3.2. Species Richness, Abundance, Diversity and Evenness Throughout the Year
The families Cerithiidae, Mytilidae and Rissoidae show a clear contrast in terms of abundance compared to the other families in almost all the samples from the two studied environments. Mytilidae were the most abundant in nearly all samples, both photophilous and sciophilous, except in July and September, when Cerithidae dominated, and in November, when Rissoidae dominated both environments. The Rissoidae family exhibited a consistent presence throughout the year in both habitats, with their abundance peaking in the winter months (January and November).
The species found in the photophilous and sciophilous habitats showed different fluctuations over the study period (Figure 5). In the photophilous community, mollusk species richness was lowest from January to March, while the highest richness was observed from May to September, peaking in July. In the sciophillous environment, species richness was generally lower, but followed a similar pattern, with slight increases from July to September.
The seasonal abundance (Figure 6) of individuals in the sciophillous habitat remained relatively low throughout the sampling period, with November showing the highest abundance, with almost 500 specimens. The increase in the number of specimens from July to November was primarily driven by the abundance of species from the families Rissoidae and Mytilidae. In the photophilous community, the greatest abundance of individuals occurred in July, mainly due to species from the Cerithiidae Family.
Overall, it was observed that for both environments, the peak in species richness and individuals abundance occurred during the summer months.
The Shannon-Wiener diversity index (H') values (Figure 7) obtained from the samples (combining the three replicates) are not particularly high, ranging from 1.087 (March) to 2.765 (September) in the sciophilous environment, and from 2.084 (March) to 3.091 (July) in the photophilous environment. A 3-factor PERMANOVA analysis shows significant differences between environments (p=0.0079) and fractions (p=0.0266), although the month factor approaches significance (p=0.0850). No interactions between the factors are detected.
Regarding evenness (Pielou’s J´ index) (Figure 8), the values for the fine fraction range from 0.392 (March) to 0.760 (January and September) in the sciophilous environment, and from 0.540 (July) to 0.714 (May) in the photophilous environment. Evenness is higher in the coarse fraction due to the small number of individuals, which are relatively evenly distributed across several species (Figure 8). A 3-factor PERMANOVA analysis shows significant differences only between fractions (p=0.0001).
3.3. Community Composition According to Environment, Fraction and Changes over the Year
A 3-factor PERMANOVA design (En=environment, Fr=fraction and Mo=month) shows that all main effects and two-way interactions are significant (En, p=0.0001; Fr, p=0.0001; Mo, p=0.0001; En x Fr, p=0.0001; En x Mo, p=0.0238; Fr x Mo, p=0.0001), with only the three-way interaction being non-significant (En x Fr x Mo, p=0.2539). These results indicate that the composition and evolution of the community throughout the year varies depending on environment and fraction.
Based on these findings, a SIMPER analysis was conducted to examine the En x Fr groups (i.e., PhF, PhC, ScF and ScC) and months (Table II and Table 3A). The results show clear differences between groups (environments and fractions) and across months.
Species
3.4. Trophic Level According to Environment, Fraction and Evolution over the Year
For each sampling site and replicate, species abundance data were aggregated according to trophic category. Subsequently, the fourth-root transformation was applied, and a Bray-Curtis similarity matrix was calculated. Running a 3-factor PERMANOVA design (En=environment, Fr=fraction and Mo=month) showed that all main effects and the En x Fr interaction and the Fr x Mo interaction were significant (En, p=0.0001; Fr, p=0.0001; Mo, p=0.0392; En x Fr, p=0.0104; Fr x Mo, p=0.0329). The double interaction En x Mo and the triple interaction were not significant (p=0.8155 and p=0.9902, respectively).
The NMDS representation (Figure 11) again shows a clear separation between the fine and coarse fraction. Differences between habitats and months are also evident. The community composition by trophic category is shown in more detail in a bar chart (Figure 12), notice that surface depot feeders (SDF) and ectoparasites (EC) were absent in the coarse fraction.
The NMDS representation (Figure 9) reveals a distinct separation between the fine and coarse fraction, highlighting differences in species composition. Differences between habitats are also observed, although in the coarse fraction, the separation between September-October and the rest of the year appears to be more pronounced.
To further investigate differences in community composition within the fine fraction, a new NMDS was performed, excluding data from the coarse fraction (Figure 10). This allowed for a clearer separation between environments, particularly at certain times of the year, highlighting distinct differences in community composition.
4. Discussion
The structural complexity of a marine habitat is influenced by various factors and is a dynamic process. Over time, local alterations can lead to changes, which may modify the community’s fauna and flora [3]. Additionally, fluctuations in abundance, particularly in smaller species, can be affected by various disturbances. These include catastrophic events like large waves or high sea temperatures, predation, the emergence of juveniles from new generations, and the availability of nutrients provided by the algae in which they live, or by epibiont algae. This has been observed in the gastropods of the families Trochidae, Tricoliidae and Rissoidae in the present study.
This study identified rich malacological populations (148 species) associated with algae, comparable to other studies such as on the Spanish Costa Brava (131 species) [14] and on the island of Formentera (118 species) [30]. Studies from other regions also report similar specific richness associated with certain types of algae, such as La Goulette Bay, Tunisia (93 species) associated with photophilous algae with Corallina officinalis being the most abundant [31]; Lampedusa Island, Italy (176 species) in the algae community of the genus Cystoseira [32]; Algeciras, Spain (98 species) [17] and the Alboran Sea, Spain (193 species) [16] both in algal communities dominated by Halopteris; and Aegean Sea (184 species) [33] associated with photophilous algal turfs. However, these studies are not strictly comparable to ours due to differences in methodology and sampling effort.
Considering previous records from Tossa de Mar [34, 35] the observations of amateur naturalists (published with photos on the internet), and our own study, it can be said that the marine mollusks of Tossa de Mar are well-known. The only published work focusing on mollusks observed in Tossa de Mar [34] reports 98 species of gastropods (58 previously classified as “prosobranchs” and 40 as traditional “opisthobranchs”) from the area, including the coast and nearby coves. Of these, 73 species were also recorded in our study area. Among the approximately 1,300 species of marine mollusk species documented in Catalonia (NE Spain) (MB, personal observation), 296 species are known from Tossa de Mar (Table A2). This means that 22.3% of all known mollusk species from the 580 km of the Catalan coast are found at this single location.
Notably, sea slugs belonging to the marine Heterobranchia group (formerly "Opisthobranchia"), have attracted significant interest over several decades on the Catalan coast, both from scientists and amateur divers. As a result, the Heterobranchia are particularly well documented in Tossa de Mar, with about 130 species cited, representing around 52% of the total species listed in the Catalan coast’s “opisthobranch” catalog [36]. Moreover, two regional Catalan platforms on the Internet [37, 38] are dedicated to these gastropods. However, only a few species of Polyplacophora and Bivalvia have been recorded, and there is no data available on the observation of species from other mollusk groups in Tossa de Mar.
Regarding specimen abundance, our findings confirm the importance of algal communities for the establishment of mollusk populations. By extrapolating the abundances obtained from the three replicates (surface 20 cm x 20 cm x 3 = 1,200 cm2) per month to a surface area of 1m2 of the algal community, we found that mollusk abundances in the photophilous habitat range from 2,425 specimens/m2 in January to 22,133 specimens/m2 in July. In the sciophilous environment, abundance values ranged from 650 specimens/m2 in January to 3,883 specimens/m2 in November. These data suggest that algal communities provide various resources, including food, shelter, protection and reproductive support, for a wide variety of medium- and small-sized mollusk species.
The low abundance of specimens in January (296 in the photophilous environment and 78 in the sciophilous one) compared to the other sampling days could be attributed to strong wave action in the days prior to the sampling, which may have negatively impacted the communities of the two rock walls studied.
The abundance values of mollusks per square meter in this study may appear exceedingly high and possibly questionable. However, similarly high abundance figures have been reported in other research studies. For instance, have been observed between 2,400 and 6,300 individuals per square meter in photophilous algae communities dominated by Cystoseira species on the island of Ustica (Tyrrhenian Sea, Italy), with species richness ranging from 101 to 121 [39]. In Antarctica, have been recorded up to 7,358 small invertebrates per square meter in the intertidal zone of Adelaide Island [40]; other authors [41] reported a staggering 130,000 invertebrates per square meter in the intertidal soft substrates of King George Island (South Shetland) while in the same island have been [42] found abundances as high as 100,000 invertebrate per square meter in intertidal algae on hard substrate, highlighting specific mollusk species such as the Littorinidae Laevilittorina caliginosa (3,933 specimens per square meter), the bivalve Mysella subquadrata (12,250 specimens per square meter) and the extraordinary count of 42,268 individuals per square meter of the littorinid Eatoniella kerguelenensis.
These findings illustrate that small mollusks can thrive in algae fronds, establishing highly dense populations across diverse geographical regions, from the western Mediterranean to the icy waters of Antarctica.
Most of the species identified in this study are well-known in the western Mediterranean and align with findings from similar research. For instance, a study on the seasonal dynamics of mollusks living among photophilous algae in the Alboran Sea [16], reported several abundant species, including Musculus costulatus, Mytilus galloprovincialis, Hiatella arctica, Bittium reticulatum, Pusillina philippi, Chauvetia mamillata, Parvicardium scriptum, and Tritia incrassata. These species also appear frequently in our samples. However, species such as Eatonina fulgida, Rissoa guerini, Nodulus contortus, Setia amabilis or Rissoa similis, which were abundant in their study, were either absent or present in very low numbers in our findings. The same work also observed that the highest abundances of individuals and species occurred during the summer months, coinciding with the peak growth of photophilous algae thalli -a pattern similarly noted in our study.
The most abundant species identified in this study was Bittium latreillii with 2,106 specimens, the vast majority (2,051) found in samples from the photophilous environment. Along with its congener B. reticulatum (96 specimens), these two species account for 27.8% of all mollusks found in our study. Their significant presence, particularly during the summer months, plays a role in determining the seasonal peak in mollusk abundance. Both species of Bittium are generalist herbivores distributed throughout the Mediterranean and nearby Atlantic regions, including the North Sea, the Cantabrian Sea, the coasts of Portugal, the Azores, Madeira, the Canary Islands and Mauritania [29, 45]They are often abundant in various algal environments, and our study confirms their preference for photophilous algae-dominated habitats.
The second most abundant species, the mytilid bivalve Musculus costulatus, totaled 1,282 specimens. Unlike the Bittium species, M. costulatus was found in photophilous and sciophilous environments, with 486 specimens in the sciophilous and 796 in the photophilous samples, indicating no strong preference for well-lit or darker environments. A characteristic feature of this bivalve genus is its well-developed muscular foot, which facilitates movement and likely contributes to its wide distribution across different algal communities.
Some species identified in this study, though low in abundance, are particularly interesting despite not contributing significantly to the characterization of their respective habitats. For instance, Otina ovata (T. Brown, 1827) (Heterobranchia, Eupulmonata, Family Otinidae) and Williamia gussoni (O.G. Costa, 1829) (Heterobranchia, Siphonariomorpha, Family Siphonariidae), with only one specimen of each found, belong to groups of mollusks that breathe atmospheric air and are typically found in the intertidal zone of the Mediterranean. They are often found under stones, among algae, and associated with cirriped crustaceans [42, 43]. However, in our study, these species were found at depths that do not align with the usual habitat described by most authors.
Species of the Siphonariidae family are generally considered intertidal and air-breathing [46]. However, A study that redescribes Williamia gussoni and performs a 3D analysis of its morphology [47], notes that this species typically inhabits subtidal zones and never comes into contact with atmospheric air. He further suggests that its pallial cavity does not function as a lung, making it an anomaly within its family. Based on this, the presence of W. gussoni at several meters depth in our study is not unusual.
As for Otina ovata, we speculate that its presence in deeper habitats could be attributed to transport by waves and currents. Interestingly, O. ovata had not been recorded previously in Catalonian waters, along the Spanish Levant coast, or the Balearic Islands, according to the marine mollusk census for the Spanish coast [48]This discovery may represent a new record for this species in these regions.
In this study, we found a distinct preference among the algal mollusks of Tossa de Mar for photophilous environments over sciophilous ones, with 6,244 specimens and 133 species in the former, compared to 1,669 specimens and 84 species in the latter. This suggests that rocky substrates dominated by photophilous algae offer a wider variety of ecological niches, where mollusks and other marine invertebrates can access food resources [49].The dense fronds and large biomass in certain months create numerous microhabitats, including small sciophilous enclaves, where diatoms and particulate organic matter accumulate. These deposits serve as food for micromollusks, such as Rissoa guerini and other rissoaceans, which “graze” on the periphyton of the algae. The presence of these herbivorous mollusks and invertebrates also influences the abundance of carnivorous mollusk species that feed on them.
Regarding specimen size, we observed a significant abundance of smaller mollusks in the fine fraction than in the coarse fraction. A total of 7,576 specimens smaller than 2 mm (fine fraction) were counted, compared to just 337 specimens larger than 2 mm (coarse fraction) (Table A1). This indicates that micromollusks and juvenile forms smaller than 2 mm from larger species find an ideal habitat among algae, both in photophilous environments (6,017 specimens, 105 species) and sciophilous environments (1,559 specimens, 62 species).
Regarding the statistical analysis of biodiversity, the results indicate significant differences between the two environments (photophilous and sciophilous) and between the two fractions (coarse and fine). Additionally, the sampling month factor is close to reaching statistical significance, as shown in Figure 7.
When analyzing evenness, the coarse fraction exhibits notably higher values compared to the fine fraction. This is likely due to the fact that, although there are fewer specimens in the coarse fraction, they tend to be more evenly distributed among the various species. In other words, no single species dominates the abundance. In contrast, no clear temporal variations were detected across different months, as illustrated in Figure 8.
Regarding the species community composition, a clear distinction emerges between the fine and coarse fractions, as illustrated in the NMDS representation (Figure 9). Notably, the coarse fraction samples from both photophilous and sciophilous environments during September and November occupy a space between the two groups. This positioning may be attributed to the low number of specimens and limited species richness observed in those months. In contrast, samples from the other months in the coarse fraction appear to form a separate group, although some differences between photophilous and sciophilous environments are still evident.
Focusing on the fine fraction, the months of January and March are distinctly separated from the sciophilous environment, indicating a unique composition compared to the other months (Figure 9 and Figure 10). This differentiation is likely due to these months having the fewest total specimens and the lowest species richness. Overall, a clear distinction between environments is apparent, with the months of May to November clustering at the top of the graph (Figure 10), correlating with a higher number of individuals and greater species richness. Specifically, July in the photophilous environment stands out at the top of the graph, reflecting the peak in both species’ richness and total specimens during that month.
The analysis of trophic categories reveals noteworthy findings, particularly in terms of the distinct separation between the fractions (Figure 11). This separation is attributed not only to the lower species richness and number of specimens in the coarse fraction, but also to the different compositions of the trophic categories. In the bar plot representation (Figure 12), it is evident that the coarse fraction lacks the presence of Species Feeding on Detritus (SDF) or Epifaunal Consumers (EC), exhibiting a higher relative proportion of Collector (C) and Scraper (SC) species. The reduced number of specimens found in the sciophilous environment, along with slight compositional differences between environments, results in a slight differentiation in the graph. March stands out as particularly unique within the sciophilous environment, characterized by a lower number of individuals and species. Notably, no herbivorous (HE) species were detected during this month, a finding that is challenging to explain. This anomaly may stem from undetected sampling issues or complications in the laboratory analysis of the samples.
5. Conclusions
The algal communities of the upper infralittoral zone, subjected to different light intensities allow the characterization of two contrasting environments that differ in terms of structure, abundance and species biodiversity. This has been demonstrated in this study by examining the molluscs on algal populations.
The photophilic algal community exhibits greater spatial heterogeneity compared to poorly lit bottoms, with well-lit areas alternating with small sciophilous microenvironments. This variation enhances habitat diversity. In contrast, the sciophilous wall excludes much of the flora and fauna typically found in photophilous zones. This is confirmed by the significantly higher abundance and species richness of molluscs in samples from the photophilous environment compared to the sciophilous one.
Although both communities are similar at the trophic level, due to the high contribution of herbivores and filter feeders, specific species distinguish the sciophilous community, such as: Musculus costulatus, Hiatella arctica, Pusillina philippi, Alvania lineata and Pusillina radiata. In the photophilous community, species like Musculus costulatus, Bittium latreillii, Pusillina philippi, Hiatella arctica, Chauvetia mamillata, Parvicardium scriptum, Alvania lineata, Bittium reticulatum, Odostomia striolata and Pusillina radiata are predominant.
The results in terms of abundance and specific richness indicate that in Tossa de Mar, micromollusks (less than 2 mm) and juvenile individuals of larger species find an extremely suitable environment for living and carrying out all their vital functions within both photophilous and sciophilous algal communities.
Based on our data and other studies published in journals and online platforms, we can conclude that the malacofauna of Tossa de Mar is the best documented along the Catalan coast, with a total of 296 species recorded (Table A2). Notably, the sea slugs (in the broad sense) of the subclass Heterobranchia are particularly well-represented, with around 130 species cited in this locality. However, there is still much to be explored in terms of biodiversity of Bivalves, Cephalopods and other minor mollusk groups.
Author Contributions
Conceptualización, MB; methodology, MB, AS, OV, FO; validaton, MB; formal analysis. MB, FO; investigations, all the authors; resources, MB, AS, OV, MP; data curation, MB, AS, OV, FO; writing—original draft preparation, MB, AS, OV; writing—review and editing, MB, FO, MP; visualization, MB; supervision, MB, FO, MP; project administration, MB; funding acquisition, MB. All authors have read and agreed to the published version of the manuscript.
Funding
This research was funded by the consolidated research group Benthic Biology and Ecology (BEB) of the University of Barcelona to which the first three authors belonged and also received partial support from the Banc de Dades de Biodiversitat de Catalunya (BIOCAT) project funded by the Generalitat de Catalunya (Catalonia, Spain).
Acknowledgments
We are grateful to Lluís Toll for his invaluable assistance in the underwater work, participating in all the sampling. Anselmo Peñas helped us identifying micromollusk species, especially those from the Pyramidelloidea group, while Pepe Templado clarified our doubts regarding juvenile specimens of the Bittium genus. We also appreciate Sergi Taboada's advice on the general organization of this work. Vanessa Muñoz assisted us with IT tasks.
Conflicts of Interest
The authors declare no conflicts of interest.
Appendix A
Table A1.
Species abundance by environment and fraction. Species are listed alphabetically. “Sc”: sciophilous environment; “Ph”: photophilous environment.
Table A1.
Species abundance by environment and fraction. Species are listed alphabetically. “Sc”: sciophilous environment; “Ph”: photophilous environment.
| Species | Sciophilous environment (Sc) |
Photophilous environment (Ph) |
Total Sc + Ph |
||||
|---|---|---|---|---|---|---|---|
| Sc Coarse |
Sc Fine |
Total Sc |
Ph Coarse |
Ph Fine |
Total Ph |
||
| Acanthochitona fascicularis | 2 | 2 | 1 | 1 | 3 | ||
| Acanthochitona sp. | 4 | 4 | 4 | ||||
| Aegires leuckartii | 1 | 1 | 2 | 2 | 3 | ||
| Aequipecten opercularis | 23 | 23 | 13 | 13 | 36 | ||
| Alvania aspera | 5 | 5 | 5 | ||||
| Alvania cancellata | 4 | 3 | 31 | 31 | 35 | ||
| Alvania cimex | 1 | 1 | 1 | ||||
| Alvania discors | 1 | 1 | 1 | ||||
| Alvania lineata | 17 | 32 | 49 | 16 | 111 | 127 | 176 |
| Alvania nestaresi | 2 | 7 | 9 | 9 | |||
| Alvania sp. | 5 | 5 | 5 | ||||
| Ammonicera fischeriana | 13 | 13 | 66 | 66 | 79 | ||
| Anomia ephippium | 1 | 3 | 4 | 1 | 1 | 2 | 6 |
| Aplus dorbignyi | 1 | 1 | 1 | ||||
| Aplysia punctata juv. | 10 | 10 | 2 | 28 | 30 | 40 | |
| Arca noae | 1 | 1 | 11 | 28 | 39 | 40 | |
| Babelomurex cariniferus | 1 | 1 | 1 | ||||
| Bittium latreillii | 1 | 54 | 55 | 1 | 2.050 | 2.051 | 2.106 |
| Bittium reticulatum | 10 | 10 | 4 | 82 | 86 | 96 | |
| Bittium sp. | 2 | 7 | 9 | 9 | |||
| Bivalvia morph. 1 | 2 | 6 | 8 | 8 | |||
| Bivalvia morph. 2 | 2 | 1 | 3 | 3 | |||
| Bivalvia morph. 3 | 1 | 1 | 1 | ||||
| Bivalvia morph. 4 | 1 | 1 | 1 | 1 | 2 | ||
| Brachystomia scalaris | 2 | 2 | 2 | ||||
| Bulla striata | 3 | 3 | 12 | 12 | 15 | ||
| Calliostoma zizyphinum | 2 | 2 | 2 | ||||
| Caloria elegans | 1 | 1 | 1 | ||||
| Cardiidae morph. 1 | 1 | 1 | 1 | ||||
| Cardiidae morph. 2 | 1 | 1 | 1 | ||||
| Cerithiopsis jeffreysi | 16 | 16 | 16 | ||||
| Cerithiopsis tubercularis | 2 | 2 | 23 | 23 | 25 | ||
| Cerithiopsis sp. | 9 | 9 | 9 | ||||
| Cerithium vulgatum | 2 | 2 | 39 | 39 | 41 | ||
| Chama gryphoides | 8 | 8 | 4 | 4 | 12 | ||
| Chauvetia brunnea | 9 | 9 | 8 | 8 | 17 | ||
| Chauvetia mamillata | 5 | 17 | 22 | 16 | 92 | 108 | 130 |
| Chauvetia recondita | 4 | 4 | 4 | ||||
| Chauvetia morph. 1 | 1 | 1 | 1 | ||||
| Chauvetia morph. 2 | 1 | 1 | 1 | ||||
| Clanculus cruciatus | 1 | 7 | 8 | 1 | 79 | 80 | 88 |
| Columbella rustica | 1 | 1 | 1 | ||||
| Crisilla semistriata | 29 | 29 | 24 | 24 | 53 | ||
| Crisilla simulans | 2 | 2 | 2 | ||||
| Cyrillia linearis | 1 | 1 | 10 | 18 | 28 | 29 | |
| Diodora graeca | 2 | 2 | 2 | 2 | 4 | 6 | |
| Diodora italica | 2 | 2 | 2 | ||||
| Doridina nudibranch | 3 | 3 | 5 | 5 | 8 | ||
| Doris ocelligera | 2 | 2 | 2 | ||||
| Doto sp. | 1 | 1 | 1 | ||||
| Emarginula pustula | 1 | 1 | 1 | 1 | 2 | ||
| Episcomitra cornicula | 2 | 2 | 2 | ||||
| Felimare sp. | 1 | 1 | 1 | ||||
| Folinella excavata | 2 | 2 | 2 | ||||
| Fusinus rudis | 2 | 2 | 2 | ||||
| Gari tellinella | 1 | 1 | 1 | ||||
| Gastropoda morph. 1 | 2 | 3 | 5 | 5 | |||
| Gastropoda morph. 2 | 1 | 1 | 2 | 2 | |||
| Gastropoda morph. 3 | 1 | 1 | 1 | ||||
| Gibberula miliaria | 5 | 5 | 5 | ||||
| Gibberula turgidula | 2 | 18 | 20 | 20 | |||
| Gibberula morph. 1 | 3 | 3 | 3 | ||||
| Gibberula morph. 2 | 1 | 1 | 1 | ||||
| Gregariella semigranata | 8 | 8 | 8 | 8 | 16 | ||
| Haliotis tuberculata | 2 | 2 | 1 | 1 | 3 | ||
| Haminoea navicula | 13 | 13 | 13 | ||||
| Hexaplex trunculus | 4 | 4 | 4 | 4 | 8 | ||
| Hiatella arctica | 9 | 153 | 162 | 3 | 239 | 242 | 404 |
| Idas sp. | 1 | 1 | 1 | ||||
| Irus irus | 5 | 5 | 17 | 17 | 22 | ||
| Ischnochitonidae sp. | 1 | 1 | 1 | ||||
| Jujubinus exasperatus | 1 | 1 | 1 | 1 | 2 | ||
| Jujubinus ruscurianus | 7 | 6 | 13 | 3 | 46 | 49 | 62 |
| Lima lima | 3 | 3 | 3 | ||||
| Limaria hians | 2 | 2 | 1 | 1 | 3 | ||
| Limaria tuberculata | 13 | 13 | 1 | 10 | 11 | 24 | |
| Lithophaga lithophaga | 1 | 1 | 1 | ||||
| Mangelia multilineolata | 1 | 1 | 1 | ||||
| Mangelia morph. 1 | 1 | 1 | 1 | ||||
| Mangelia morph. 2 | 1 | 1 | 1 | ||||
| Marshallora adversa | 2 | 2 | 4 | 4 | 6 | ||
| Mimachlamys varia | 4 | 9 | 13 | 7 | 2 | 8 | 22 |
| Mitrella broderipii | 1 | 1 | 1 | ||||
| Mitromorpha columbellaria | 1 | 4 | 5 | 2 | 9 | 11 | 16 |
| Mitromorpha olivoidea | 1 | 1 | 4 | 4 | 5 | ||
| Modiolula phaseolina | 11 | 11 | 3 | 53 | 56 | 67 | |
| Modiolus barbatus | 1 | 1 | 8 | 8 | 9 | ||
| Monophorus erythrosoma | 1 | 1 | 2 | 8 | 8 | 10 | |
| Muricidae indet. | 1 | 1 | 1 | ||||
| Muricopsis cristata | 4 | 4 | 2 | 2 | 6 | ||
| Musculus costulatus | 2 | 484 | 486 | 8 | 788 | 796 | 1.282 |
| Mytilus galloprovincialis juv. | 1 | 10 | 11 | 46 | 46 | 57 | |
| Nodulus contortus | 4 | 4 | 4 | ||||
| Nodulus spiralis | 1 | 1 | 1 | ||||
| Ocinebrina aciculata | 1 | 1 | 2 | 3 | 11 | 14 | 16 |
| Odostomella doliolum | 1 | 1 | 15 | 15 | 16 | ||
| Odostomia plicata | 11 | 11 | 9 | 8 | 20 | ||
| Odostomia striolata | 50 | 50 | 167 | 167 | 217 | ||
| Otina ovata | 1 | 1 | 1 | ||||
| Paradoris indecora | 1 | 1 | 1 | ||||
| Parthenina emaciata | 36 | 36 | 36 | ||||
| Parvamussium fenestratum | 22 | 22 | 19 | 19 | 41 | ||
| Parvicardium scriptum | 2 | 27 | 29 | 1 | 100 | 101 | 130 |
| Patella sp. | 1 | 1 | 1 | ||||
| Petricola lithophaga | 13 | 13 | 13 | ||||
| Philine intricata | 1 | 1 | 1 | ||||
| Philine sp. | 6 | 6 | 6 | ||||
| Phorcus richardi | 1 | 1 | 1 | ||||
| Polyplacophora indet. | 2 | 2 | 2 | ||||
| Pseudochama gryphina | 3 | 3 | 3 | 3 | 6 | ||
| Pseudomangelia vauquelini | 1 | 1 | 1 | ||||
| Pusia ebenus | 1 | 1 | 1 | ||||
| Pusia tricolor | 2 | 2 | 4 | 2 | 6 | 8 | |
| Pusillina inconspicua | 3 | 3 | 3 | ||||
| Pusillina philippi | 272 | 272 | 545 | 545 | 817 | ||
| Pusillina radiata | 179 | 179 | 367 | 367 | 546 | ||
| Raphitoma echinata | 2 | 2 | 1 | 5 | 6 | 8 | |
| Raphitoma laviae | 2 | 2 | 2 | ||||
| Raphitoma morph. 1 | 2 | 2 | 2 | ||||
| Raphitoma morph. 2 | 1 | 1 | 1 | ||||
| Retilaskeya horrida | 1 | 1 | 1 | ||||
| Retusa mammillata | 1 | 1 | 1 | ||||
| Rhyssoplax corallina | 2 | 1 | 3 | 3 | 3 | 6 | |
| Rissoa guerinii | 2 | 2 | 2 | ||||
| Rissoa lia | 1 | 1 | 10 | 10 | 11 | ||
| Rissoa variabilis | 1 | 1 | 1 | 7 | 8 | 9 | |
| Rissoella diaphana | 228 | 228 | 228 | ||||
| Runcina adriatica | 3 | 3 | 27 | 27 | 30 | ||
| Runcina coronata | 1 | 1 | 1 | ||||
| Runcina sp. | 4 | 4 | 35 | 35 | 39 | ||
| Scissurella costata | 1 | 1 | 21 | 21 | 22 | ||
| Setia pulcherrima | 5 | 5 | 10 | 10 | 15 | ||
| Smithiella costulata | 1 | 1 | 1 | 2 | 3 | 4 | |
| Spiralina alpinoligustica | 2 | 2 | 2 | 2 | 4 | ||
| Spondylus gaederopus | 1 | 1 | 1 | ||||
| Striarca lactea | 4 | 9 | 13 | 9 | 66 | 75 | 88 |
| Talochlamys multistriata | 1 | 1 | 1 | ||||
| Tarantinaea lignaria | 1 | 1 | 1 | ||||
| Tectura virginea | 1 | 1 | 1 | ||||
| Tricolia tingitana | 5 | 5 | 5 | ||||
| Tricolia sp. | 3 | 3 | 17 | 17 | 20 | ||
| Trinchesia genovae | 5 | 5 | 5 | ||||
| Triphoridae indet. | 16 | 16 | 5 | 109 | 114 | 130 | |
| Tritia incrassata | 5 | 15 | 20 | 35 | 25 | 60 | 80 |
| Veneridae indet. | 1 | 1 | 2 | 2 | 3 | ||
| Vitreolina perminima | 6 | 6 | 59 | 59 | 65 | ||
| Weinkauffia turgidula | 2 | 2 | 2 | ||||
| Williamia gussoni | 1 | 1 | 1 | ||||
| Total specimens | 110 | 1.559 | 1.669 | 227 | 6.017 | 6.244 | 7.913 |
| Total species | 38 | 62 | 84 | 58 | 105 | 133 | 148 |
Table A2.
List of mollusk species recorded in Tossa de Mar. (* : present study). Species within each family are listed in alphabetical order.
Table A2.
List of mollusk species recorded in Tossa de Mar. (* : present study). Species within each family are listed in alphabetical order.
|
Class GASTROPODA 257 species Sub Class Caenogastropoda Order Littorinimorpha Littorinidae Melarhaphe neritoides Skeneopsidae Skeneopsis planorbis Naticidae Notocochlis dillwynii Rissoidae *Alvania aspera *Alvania cancellata *Alvania cimex *Alvania discors *Alvania lineata *Alvania nestaresi Alvania subcrenulata Alvania tenera *Crisilla semistriata *Crisilla simulans *Pusillina incospicua Pusillina lineolata *Pusillina philippi *Pusillina radiata Rissoa decorata *Rissoa guerini *Rissoa lia Rissoa splendida *Rissoa variabilis *Setia pulcherrima Anabathridae *Nodulus contortus *Nodulus spìralis Cypraeidae Luria lurida Eulimidae Vitreolina antiflexa *Vitreolina perminima Ovulidae Simnia spelta Triviidae Trivia monacha Vermetidae Vermetus triquetrus Order Neogastropoda Chauvetiidae *Chauvetia brunnea *Chauvetia mamillata *Chauvetia recondita Columbellidae *Columbella rustica Mitrella broderipii Mitrella scripta Fasciolariidae *Fusinus rudis Pseudofusus rostratus *Tarantinaea lignaria Nassariidae Tritia corrugata *Tritia incrassata Tritia reticulata Tritia varicosa Pisaniidae *Aplus dorbignyi Pisania striata Conidae Conus ventricosus Mangeliidae *Mangelia multilineolata *Pseudomangelia vauquelini *Smithiela costulata Mitromorphidae *Mitromorphacolumbellaria *Mitromorpha olivoidea Raphitomidae *Cyrillia linearis *Raphitoma echinata *Raphitoma laviae Raphitoma leufroyi Mitridae *Episcomitra cornicula Isara cornea Muricidae *Babelomurex cariniferus Coralliophila meyendorffii *Hexaplex trunculus Hirtomurex squamosus *Muricopsis cristata Pseudofusus rostratus Ocenebra edwardsii *Ocinebrina aciculata Stramonita haemastoma Cystiscidae *Gibberula miliaria *Gibberula turgidula Costellariidae *Pusia ebenus *Pusia tricolor Order Caenogastropoda incertae sedis Cerithiidae *Bittium latreillii *Bittium reticulatum Cerithium africanum *Cerithium vulgatum Cerithiopsidae *Cerithiopsis jeffreysi *Cerithiopsis tubercularis Newtoniellidae *Retilaskeya horrida Triphoridae Marshallora adversa *Monophorus erythrosoma Turritellidae Turritellinella tricarinata Sub Class Heterobranchia SuperOrder Acochlidiimorpha Hedylopsidae Hedylopsis spiculifera Order Aplysiida Aplysiidae Aplysia depilans Aplysia fasciata *Aplysia punctata Petalifera petalifera Phyllaplysia lafonti Order Cephalaspidea Aglajidae Aglaja tricolorata Camachoaglaja africana Melanochlamys miqueli Spinoaglaja wildpretii Bullidae *Bulla striata Haminoeidae Haminoea exigua Haminoea hydatis *Haminoea navicula *Weinkauffia turgidula Philinidae *Philine intricata Philine catena Retusidae *Retusa mammillata Retusa truncatula Order Ellobiida Otinidae *Otina ovata Order Nudibranchia Aegiridae *Aegires leuckartii Aegires punctilucens Aeolidiidae Aeolidiella alderi Berghia coerulescens Spurilla neapolitana Arminidae Armina tigrina Cadlinidae Aldisa banyulensis Calycidorididae Diaphorodoris alba Diaphorodoris luteocincta Diaphorodoris papillata Chromodorididae Felimare bilineata Felimare fontandraui Felimare orsinii Felimare picta Felimare tricolor Felimare villafranca Felimida binza Felimida krohni Felimida luteorosea Felimida purpurea Coryphellidae Coryphella lineata Dendrodorididae Dendrodoris grandiflora Dendrodoris limbata Discodorididae Discodoris rosi Discodoris stellifera Geitodoris planata Jorunna tomentosa *Paradoris indecora Peltodoris atromaculata Platydoris argo Rostanga rubra Tayuva lilacina Dorididae *Doris ocelligera Dotidae Doto coronata Doto dunnei Doto eireana Doto floridicola Doto fragaria Doto koenneckeri Doto paulinae Doto rosea Embletoniidae Embletonia pulchra Eubranchidae Amphorina farrani Capellinia doriae Eubranchus capellinii Eubranchus exiguus Eubranchus vittatus Facelinidae *Caloria elegans Caloria quatrefagesi Cratena peregrina Facelina annulicornis Facelina auriculata Facelina rubrovittata Facelinopsis marioni Favorinus branchialis Flabellinidae Calmella cavolini Calmella gaditana Edmundsella pedata Flabellina affinis Paraflabellina gabinierei Paraflabellina ischitana Goniodorididae Okenia mediterranea Trapania lineata Trapania maculata Hancockiidae Hancockia uncinata Janolidae Antiopella cristata Myrrhinidae Nemesignis banyulensis Onchidorididae Atalodoris pictoni Atalodoris sparsa Idaliadoris neapolitana Phyllidiidae Phyllidia flava Piseinotecidae Piseinotecus soussi Polyceridae Crimora papillata Kaloplocamus ramosus Limacia inesae Polycera elegans Polycera quadrilineata Samlidae Luisella babai Trinchesiidae Rubramoena amoena Trinchesia caerulea Trinchesia cuanensis Trinchesia foliata *Trinchesia genovae Trinchesia miniostriata Trinchesia morrowae Trinchesia ocellata Tritoniidae Candiella manicata Candiella odhneri Candiella striata Marionia blainvillea Order Pleurobranchida Pleurobranchidae Berthella ocellata Pleurehdera stellata Pleurobranchus testudinarius Order Runcinida Runcinidae *Runcina adriatica Runcina africana Runcina bahiensis *Runcina coronata Runcina hansbechi Super Order Sacoglossa Hermaeidae Cyerce cristallina Hermaea bifida Hermaea variopicta Limapontiidae Placida cremoniana Placida dendritica Placida verticilata Plakobranchidae Bosellia mimètica Elysia margaritae Elysia timida Elysia viridis Thuridilla hopei Order Umbraculida Tylodinidae Tylodina perversa Umbraculidae Umbraculum umbraculum Order Siphonariida Siphonariidae *Williamia gussoni Super family Omalogyroidea Omalogyridae Ammonicera rota Ammonicera fischeriana Superfamily Pyramidelloidea Pyramidellidae *Brachystomia scalaris *Folinella excavata *Odostomella doliolum *Odostomia plicata *Odostomia striolata *Parthenina emaciata Parthenina monozona *Spiralina alpinoligustica Super family Rissoelloidea Rissoellidae *Rissoella diaphana Sub Class Patellogastropoda Super Family Lottioidea Lotiidae *Tectura virginea Superfamily Patelloidea Patellidae Patella aspera Patella caerulea Patella rustica Patella ulyssiponensis Sub Class Vetigastropoda Order Lepetellida Fissurellidae Diodora gibberula *Diodora graeca *Diodora italica Emarginula huzardii Emarginula octaviana *Emarginula pustula Emarginula sicula Fissurella nubecula Puncturella noachina Haliotidae *Haliotis tuberculata Scissurellidae *Scissurella costata Order Trochida Phasianellidae *Tricolia tingitana Calliostomatidae Calliostoma laugieri *Calliostoma zizyphinum Calliostoma conulus Trochidae Clanculus corallinus *Clanculus cruciatus Gibbula ardents Gibbula divaricata Gibbula drepanensis *Jujubinus exasperatus *Jujubinus ruscurianus Jujubinus striatus *Phorcus richardi Phorcus turbinatus Steromphala divaricata Steromphala umbilicalis Turbinidae Bolma rugosa Class BIVALVIA 32 species Sub Class Autobranchia Order Cardiida Cardiidae *Parvicardium scriptum Psammobiidae *Gari tellinella Order Venerida Chamidae *Chama gryphoides *Pseudochama gryphina Veneridae Gouldia minima *Irus irus *Petricola lithophaga Venus casina Venus verrucosa Order Adapedonta Hiatellidae *Hiatella arctica Super order Anomalodesmata Thraciidae Thracia phaseolina Order Arcoida Arcidae *Arca noae Noetiidae *Striarca lactea Order Galeommatida Galiommatidae Galeomma turtoni Lasaeidae Kellia suborbicularis Order Gastrochaenida Gastrochaenidae Rocellaria dubia Order Limida Limidae *Lima lima *Limaria hians *Limaria tuberculata Order Mytilida Mytilidae *Gregariella semigranata *Lithophaga lithophaga *Modiolula phaseolina *Modiolus barbatus *Musculus costulatus *Mytilus galloprovincialis Order Pectinida Anomiidae *Anomia ephippium Pododesmus patelliformis Pectinidae *Aequipecten opercularis *Mimachlamys varia *Talochlamys multistriata Propeamussiidae *Parvamussium fenestratum Spondylidae *Spondylus gaederopus Class POLYPLACOPHORA 7 species Sub Classe Neoloricata Order Chitonida Acanthochitonidae Acanthochitona crinita *Acanthochitona fascicularis Chitonidae *Rhyssoplax corallina Rhyssoplax olivacea Ischnochiton rissoi Lepidochitona caprearum Order Lepidopleurida Leptochitonidae Leptochiton sarsi |
Table A3.
Additional results from the SIMPER analysis, detailing the species that contribute to dissimilarities across Environment x Fraction groups (PhF, PhC, ScF and ScC) and the similarities observed within each month. Cut-off thresholds of 80% for similarity and 50% for dissimilarity were applied.
| PhF & ScF - Average dissimilarity = 57,05 | ||||||||||||||||||||||||||||||||||||||||||||||||||||||||||
| Species |
Group PhF Av.Abund |
Group ScF Av.Abund |
Av.Diss | Diss/SD | Contrib% | Cum.% | ||||||||||||||||||||||||||||||||||||||||||||||||||||
| Bittium latreillii | 2,49 | 0,71 | 2,92 | 1,79 | 5,12 | 5,12 | ||||||||||||||||||||||||||||||||||||||||||||||||||||
| Bittium reticulatum | 1,17 | 0,35 | 1,98 | 1,10 | 3,46 | 8,58 | ||||||||||||||||||||||||||||||||||||||||||||||||||||
| Pusillina philippi | 2,09 | 1,48 | 1,96 | 1,02 | 3,44 | 12,02 | ||||||||||||||||||||||||||||||||||||||||||||||||||||
| Chauvetia mamillata | 1,46 | 0,61 | 1,65 | 1,19 | 2,89 | 14,91 | ||||||||||||||||||||||||||||||||||||||||||||||||||||
| Parvicardium scriptum | 1,40 | 0,56 | 1,54 | 1,14 | 2,69 | 17,60 | ||||||||||||||||||||||||||||||||||||||||||||||||||||
| Pusillina radiata | 1,25 | 0,86 | 1,45 | 0,91 | 2,54 | 20,14 | ||||||||||||||||||||||||||||||||||||||||||||||||||||
| Alvania cancellata | 0,82 | 0,18 | 1,36 | 1,13 | 2,38 | 22,51 | ||||||||||||||||||||||||||||||||||||||||||||||||||||
| Alvania lineata | 1,28 | 0,81 | 1,35 | 1,00 | 2,37 | 24,89 | ||||||||||||||||||||||||||||||||||||||||||||||||||||
| Vitreolina perminima | 0,95 | 0,29 | 1,33 | 1,07 | 2,34 | 27,22 | ||||||||||||||||||||||||||||||||||||||||||||||||||||
| Musculus costulatus | 2,50 | 2,08 | 1,33 | 1,00 | 2,33 | 29,55 | ||||||||||||||||||||||||||||||||||||||||||||||||||||
| Rissoella diaphana | 1,04 | 0,00 | 1,30 | 0,92 | 2,28 | 31,84 | ||||||||||||||||||||||||||||||||||||||||||||||||||||
| Modiolula phaseolina | 0,93 | 0,38 | 1,17 | 0,91 | 2,06 | 33,89 | ||||||||||||||||||||||||||||||||||||||||||||||||||||
| Aplysia punctata | 1,00 | 0,37 | 1,15 | 1,05 | 2,01 | 35,90 | ||||||||||||||||||||||||||||||||||||||||||||||||||||
| Clanculus cruciatus | 1,05 | 0,25 | 1,13 | 1,17 | 1,99 | 37,89 | ||||||||||||||||||||||||||||||||||||||||||||||||||||
| Arca noae | 0,77 | 0,06 | 1,13 | 1,11 | 1,98 | 39,87 | ||||||||||||||||||||||||||||||||||||||||||||||||||||
| Limaria tuberculata | 0,47 | 0,49 | 1,02 | 0,87 | 1,80 | 41,67 | ||||||||||||||||||||||||||||||||||||||||||||||||||||
| Runcina sp. | 0,77 | 0,22 | 1,01 | 1,01 | 1,77 | 43,44 | ||||||||||||||||||||||||||||||||||||||||||||||||||||
| Cerithiopsis tubercularis | 0,57 | 0,07 | 0,95 | 0,78 | 1,67 | 45,10 | ||||||||||||||||||||||||||||||||||||||||||||||||||||
| Parthenina emaciata | 0,68 | 0,00 | 0,95 | 0,85 | 1,66 | 46,76 | ||||||||||||||||||||||||||||||||||||||||||||||||||||
| Crisilla semistriata | 0,45 | 0,53 | 0,93 | 0,66 | 1,64 | 48,40 | ||||||||||||||||||||||||||||||||||||||||||||||||||||
| Rissoa lia | 0,42 | 0,06 | 0,91 | 0,57 | 1,59 | 49,99 | ||||||||||||||||||||||||||||||||||||||||||||||||||||
| Hiatella arctica | 1,71 | 1,43 | 0,86 | 0,69 | 1,51 | 51,50 | ||||||||||||||||||||||||||||||||||||||||||||||||||||
| PhF & PhC - Average dissimilarity = 88,50 | ||||||||||||||||||||||||||||||||||||||||||||||||||||||||||
| Species |
Group PhF Av.Abund |
Group PhC Av.Abund |
Av.Diss | Diss/SD | Contrib% | Cum.% | ||||||||||||||||||||||||||||||||||||||||||||||||||||
| Musculus costulatus | 2,50 | 0,30 | 5,26 | 1,45 | 5,95 | 5,95 | ||||||||||||||||||||||||||||||||||||||||||||||||||||
| Bittium latreillii | 2,49 | 0,06 | 4,28 | 2,22 | 4,84 | 10,79 | ||||||||||||||||||||||||||||||||||||||||||||||||||||
| Pusillina philippi | 2,09 | 0,00 | 4,27 | 2,30 | 4,83 | 15,62 | ||||||||||||||||||||||||||||||||||||||||||||||||||||
| Hiatella arctica | 1,71 | 0,12 | 3,21 | 2,08 | 3,63 | 19,25 | ||||||||||||||||||||||||||||||||||||||||||||||||||||
| Parvicardium scriptum | 1,40 | 0,00 | 2,78 | 2,36 | 3,15 | 22,39 | ||||||||||||||||||||||||||||||||||||||||||||||||||||
| Chauvetia mamillata | 1,46 | 0,31 | 2,62 | 1,47 | 2,96 | 25,36 | ||||||||||||||||||||||||||||||||||||||||||||||||||||
| Pusillina radiata | 1,25 | 0,00 | 2,54 | 0,96 | 2,87 | 28,22 | ||||||||||||||||||||||||||||||||||||||||||||||||||||
| Odostomia striolata | 1,43 | 0,00 | 2,53 | 1,83 | 2,86 | 31,08 | ||||||||||||||||||||||||||||||||||||||||||||||||||||
| Bittium reticulatum | 1,17 | 0,11 | 2,43 | 1,19 | 2,75 | 33,83 | ||||||||||||||||||||||||||||||||||||||||||||||||||||
| Aplysia punctata | 1,00 | 0,11 | 1,98 | 1,44 | 2,24 | 36,07 | ||||||||||||||||||||||||||||||||||||||||||||||||||||
| Alvania lineata | 1,28 | 0,57 | 1,91 | 1,12 | 2,16 | 38,24 | ||||||||||||||||||||||||||||||||||||||||||||||||||||
| Vitreolina perminima | 0,95 | 0,00 | 1,70 | 1,19 | 1,92 | 40,16 | ||||||||||||||||||||||||||||||||||||||||||||||||||||
| Modiolula phaseolina | 0,93 | 0,12 | 1,63 | 1,13 | 1,85 | 42,00 | ||||||||||||||||||||||||||||||||||||||||||||||||||||
| Clanculus cruciatus | 1,05 | 0,06 | 1,62 | 1,40 | 1,83 | 43,83 | ||||||||||||||||||||||||||||||||||||||||||||||||||||
| Rissoella diaphana | 1,04 | 0,00 | 1,56 | 0,92 | 1,77 | 45,60 | ||||||||||||||||||||||||||||||||||||||||||||||||||||
| Runcina sp. | 0,77 | 0,00 | 1,47 | 1,09 | 1,67 | 47,26 | ||||||||||||||||||||||||||||||||||||||||||||||||||||
| Alvania cancellata | 0,82 | 0,00 | 1,47 | 1,18 | 1,66 | 48,92 | ||||||||||||||||||||||||||||||||||||||||||||||||||||
| Tritia incrassata | 0,63 | 1,05 | 1,46 | 0,85 | 1,65 | 50,57 | ||||||||||||||||||||||||||||||||||||||||||||||||||||
| ScF & PhC - Average dissimilarity = 89,04 | ||||||||||||||||||||||||||||||||||||||||||||||||||||||||||
| Species |
Group ScF Av.Abund |
Group PhC Av.Abund |
Av.Diss | Diss/SD | Contrib% | Cum.% | ||||||||||||||||||||||||||||||||||||||||||||||||||||
| Musculus costulatus | 2,08 | 0,30 | 7,51 | 1,61 | 8,43 | 8,43 | ||||||||||||||||||||||||||||||||||||||||||||||||||||
| Pusillina philippi | 1,48 | 0,00 | 5,13 | 1,57 | 5,76 | 14,19 | ||||||||||||||||||||||||||||||||||||||||||||||||||||
| Hiatella arctica | 1,43 | 0,12 | 5,07 | 2,05 | 5,69 | 19,88 | ||||||||||||||||||||||||||||||||||||||||||||||||||||
| Pusillina radiata | 0,86 | 0,00 | 3,62 | 0,87 | 4,06 | 23,94 | ||||||||||||||||||||||||||||||||||||||||||||||||||||
| Odostomia striolata | 1,04 | 0,00 | 3,53 | 1,48 | 3,96 | 27,90 | ||||||||||||||||||||||||||||||||||||||||||||||||||||
| Tritia incrassata | 0,27 | 1,05 | 3,43 | 1,33 | 3,85 | 31,75 | ||||||||||||||||||||||||||||||||||||||||||||||||||||
| Alvania lineata | 0,81 | 0,57 | 2,82 | 0,91 | 3,16 | 34,92 | ||||||||||||||||||||||||||||||||||||||||||||||||||||
| Chauvetia mamillata | 0,61 | 0,31 | 2,71 | 0,93 | 3,04 | 37,96 | ||||||||||||||||||||||||||||||||||||||||||||||||||||
| Bittium latreillii | 0,71 | 0,06 | 2,13 | 0,93 | 2,39 | 40,35 | ||||||||||||||||||||||||||||||||||||||||||||||||||||
| Aplysia punctata | 0,37 | 0,11 | 1,93 | 0,68 | 2,17 | 42,52 | ||||||||||||||||||||||||||||||||||||||||||||||||||||
| Arca noae | 0,06 | 0,52 | 1,91 | 0,84 | 2,14 | 44,66 | ||||||||||||||||||||||||||||||||||||||||||||||||||||
| Parvicardium scriptum | 0,56 | 0,00 | 1,84 | 0,81 | 2,07 | 46,73 | ||||||||||||||||||||||||||||||||||||||||||||||||||||
| Limaria tuberculata | 0,49 | 0,06 | 1,79 | 0,84 | 2,01 | 48,75 | ||||||||||||||||||||||||||||||||||||||||||||||||||||
| Crisilla semistriata | 0,53 | 0,00 | 1,70 | 0,66 | 1,91 | 50,66 | ||||||||||||||||||||||||||||||||||||||||||||||||||||
| PhF & ScC - Average dissimilarity = 93,59 | ||||||||||||||||||||||||||||||||||||||||||||||||||||||||||
| Species |
Group PhF Av.Abund |
Group ScC Av.Abund |
Av.Diss | Diss/SD | Contrib% | Cum.% | ||||||||||||||||||||||||||||||||||||||||||||||||||||
| Musculus costulatus | 2,50 | 0,12 | 5,99 | 1,78 | 6,40 | 6,40 | ||||||||||||||||||||||||||||||||||||||||||||||||||||
| Pusillina philippi | 2,09 | 0,00 | 4,54 | 2,44 | 4,85 | 11,25 | ||||||||||||||||||||||||||||||||||||||||||||||||||||
| Bittium latreillii | 2,49 | 0,06 | 4,53 | 2,12 | 4,84 | 16,09 | ||||||||||||||||||||||||||||||||||||||||||||||||||||
| Hiatella arctica | 1,71 | 0,39 | 3,11 | 1,62 | 3,32 | 19,41 | ||||||||||||||||||||||||||||||||||||||||||||||||||||
| Parvicardium scriptum | 1,40 | 0,00 | 2,98 | 2,34 | 3,18 | 22,59 | ||||||||||||||||||||||||||||||||||||||||||||||||||||
| Chauvetia mamillata | 1,46 | 0,20 | 2,89 | 1,80 | 3,09 | 25,68 | ||||||||||||||||||||||||||||||||||||||||||||||||||||
| Pusillina radiata | 1,25 | 0,00 | 2,77 | 0,96 | 2,96 | 28,63 | ||||||||||||||||||||||||||||||||||||||||||||||||||||
| Odostomia striolata | 1,43 | 0,00 | 2,72 | 1,75 | 2,90 | 31,54 | ||||||||||||||||||||||||||||||||||||||||||||||||||||
| Bittium reticulattum | 1,17 | 0,00 | 2,72 | 1,33 | 2,90 | 34,44 | ||||||||||||||||||||||||||||||||||||||||||||||||||||
| Alvania lineata | 1,28 | 0,63 | 2,16 | 1,27 | 2,31 | 36,75 | ||||||||||||||||||||||||||||||||||||||||||||||||||||
| Aplysia punctata | 1,00 | 0,00 | 2,16 | 1,67 | 2,31 | 39,06 | ||||||||||||||||||||||||||||||||||||||||||||||||||||
| Clanculus cruciatus | 1,05 | 0,06 | 1,92 | 1,44 | 2,05 | 41,10 | ||||||||||||||||||||||||||||||||||||||||||||||||||||
| Modiolula phaseolina | 0,93 | 0,00 | 1,78 | 1,18 | 1,91 | 43,01 | ||||||||||||||||||||||||||||||||||||||||||||||||||||
| Vitreolina perminima | 0,95 | 0,00 | 1,78 | 1,13 | 1,90 | 44,91 | ||||||||||||||||||||||||||||||||||||||||||||||||||||
| Alvania cancellata | 0,82 | 0,00 | 1,61 | 1,15 | 1,72 | 46,63 | ||||||||||||||||||||||||||||||||||||||||||||||||||||
| Rissoella diaphana | 1,04 | 0,00 | 1,58 | 0,88 | 1,69 | 48,32 | ||||||||||||||||||||||||||||||||||||||||||||||||||||
| Runcina sp. | 0,77 | 0,00 | 1,54 | 1,06 | 1,64 | 49,96 | ||||||||||||||||||||||||||||||||||||||||||||||||||||
| Arca noae | 0,77 | 0,00 | 1,47 | 1,13 | 1,57 | 51,54 | ||||||||||||||||||||||||||||||||||||||||||||||||||||
| ScF & ScC - Average dissimilarity = 89,73 | ||||||||||||||||||||||||||||||||||||||||||||||||||||||||||
| Species |
Group ScF Av.Abund |
Group ScC Av.Abund |
Av.Diss | Diss/SD | Contrib% | Cum.% | ||||||||||||||||||||||||||||||||||||||||||||||||||||
| Musculus costulatus | 2,08 | 0,12 | 9,43 | 1,87 | 10,51 | 10,51 | ||||||||||||||||||||||||||||||||||||||||||||||||||||
| Pusillina philippi | 1,48 | 0,00 | 5,83 | 1,54 | 6,50 | 17,01 | ||||||||||||||||||||||||||||||||||||||||||||||||||||
| Hiatella arctica | 1,43 | 0,39 | 4,71 | 1,13 | 5,25 | 22,26 | ||||||||||||||||||||||||||||||||||||||||||||||||||||
| Pusillina radiata | 0,86 | 0,00 | 4,31 | 0,96 | 4,81 | 27,06 | ||||||||||||||||||||||||||||||||||||||||||||||||||||
| Odostomia striolata | 1,04 | 0,00 | 4,24 | 1,33 | 4,72 | 31,79 | ||||||||||||||||||||||||||||||||||||||||||||||||||||
| Chauvetia mamillata | 0,61 | 0,20 | 3,17 | 1,03 | 3,54 | 35,32 | ||||||||||||||||||||||||||||||||||||||||||||||||||||
| Bittium latreillii | 0,71 | 0,06 | 2,55 | 0,95 | 2,85 | 38,17 | ||||||||||||||||||||||||||||||||||||||||||||||||||||
| Chama gryphoides | 0,00 | 0,47 | 2,18 | 0,80 | 2,43 | 40,60 | ||||||||||||||||||||||||||||||||||||||||||||||||||||
| Parvicardium scriptum | 0,56 | 0,00 | 2,13 | 0,76 | 2,37 | 42,97 | ||||||||||||||||||||||||||||||||||||||||||||||||||||
| Tritia incrassata | 0,27 | 0,29 | 1,97 | 0,73 | 2,20 | 45,17 | ||||||||||||||||||||||||||||||||||||||||||||||||||||
| Alvania lineata | 0,81 | 0,63 | 1,95 | 0,72 | 2,18 | 47,35 | ||||||||||||||||||||||||||||||||||||||||||||||||||||
| Aequipecten opercularis | 0,48 | 0,00 | 1,90 | 0,73 | 2,12 | 49,47 | ||||||||||||||||||||||||||||||||||||||||||||||||||||
| Crisilla semistriata | 0,53 | 0,00 | 1,86 | 0,70 | 2,08 | 51,54 | ||||||||||||||||||||||||||||||||||||||||||||||||||||
| PhC & ScC - Average dissimilarity = 78,87 | ||||||||||||||||||||||||||||||||||||||||||||||||||||||||||
| Species |
Group PhC Av.Abund |
Group ScC Av.Abund |
Av.Diss | Diss/SD | Contrib% | Cum.% | ||||||||||||||||||||||||||||||||||||||||||||||||||||
| Tritia incrassata | 1,05 | 0,29 | 6,45 | 1,20 | 8,17 | 8,17 | ||||||||||||||||||||||||||||||||||||||||||||||||||||
| Alvania lineata | 0,57 | 0,63 | 4,64 | 0,98 | 5,89 | 14,06 | ||||||||||||||||||||||||||||||||||||||||||||||||||||
| Arca noae | 0,52 | 0,00 | 4,15 | 0,80 | 5,26 | 19,32 | ||||||||||||||||||||||||||||||||||||||||||||||||||||
| Hiatella arctica | 0,12 | 0,39 | 3,57 | 0,73 | 4,52 | 23,85 | ||||||||||||||||||||||||||||||||||||||||||||||||||||
| Striarca lactea | 0,36 | 0,14 | 2,92 | 0,77 | 3,70 | 27,55 | ||||||||||||||||||||||||||||||||||||||||||||||||||||
| Modiolus barbatus | 0,35 | 0,06 | 2,60 | 0,79 | 3,29 | 30,84 | ||||||||||||||||||||||||||||||||||||||||||||||||||||
| Chama gryphoides | 0,18 | 0,47 | 2,48 | 0,60 | 3,14 | 33,98 | ||||||||||||||||||||||||||||||||||||||||||||||||||||
| Musculus costulatus | 0,30 | 0,12 | 2,40 | 0,61 | 3,05 | 37,03 | ||||||||||||||||||||||||||||||||||||||||||||||||||||
| Muricopsis cristata | 0,11 | 0,24 | 2,21 | 0,63 | 2,80 | 39,83 | ||||||||||||||||||||||||||||||||||||||||||||||||||||
| Pusia tricolor | 0,22 | 0,12 | 2,19 | 0,54 | 2,78 | 42,61 | ||||||||||||||||||||||||||||||||||||||||||||||||||||
| Marshallora adversa | 0,22 | 0,12 | 2,12 | 0,53 | 2,69 | 45,29 | ||||||||||||||||||||||||||||||||||||||||||||||||||||
| Mimachlamys varia | 0,25 | 0,19 | 2,09 | 0,51 | 2,65 | 47,95 | ||||||||||||||||||||||||||||||||||||||||||||||||||||
| Cyrillia linearis | 0,33 | 0,06 | 2,08 | 0,59 | 2,64 | 50,58 | ||||||||||||||||||||||||||||||||||||||||||||||||||||
| January - Average similarity: 34,80 | ||||||||||||||||||||||||||||||||||||||||||||||||||||||||||
| Species | Av.Abund | Av.Sim | Sim/SD | Contrib% | Cum.% | |||||||||||||||||||||||||||||||||||||||||||||||||||||
| Musculus costulatus | 1,05 | 7,45 | 0,91 | 21,40 | 21,40 | |||||||||||||||||||||||||||||||||||||||||||||||||||||
| Alvania lineata | 0,83 | 7,32 | 0,97 | 21,02 | 42,42 | |||||||||||||||||||||||||||||||||||||||||||||||||||||
| Chama gryphoides | 0,43 | 5,19 | 0,65 | 14,92 | 57,35 | |||||||||||||||||||||||||||||||||||||||||||||||||||||
| Pusillina philippi | 0,62 | 2,60 | 0,65 | 7,49 | 64,83 | |||||||||||||||||||||||||||||||||||||||||||||||||||||
| Chauvetia mamillata | 0,48 | 2,60 | 0,58 | 7,47 | 72,30 | |||||||||||||||||||||||||||||||||||||||||||||||||||||
| Hexaplex trunculus | 0,35 | 2,20 | 0,43 | 6,33 | 78,64 | |||||||||||||||||||||||||||||||||||||||||||||||||||||
| Pusillina radiata | 0,46 | 1,69 | 0,39 | 4,86 | 83,50 | |||||||||||||||||||||||||||||||||||||||||||||||||||||
| March - Average similarity: 29,72 | ||||||||||||||||||||||||||||||||||||||||||||||||||||||||||
| Species | Av.Abund | Av.Sim | Sim/SD | Contrib% | Cum.% | |||||||||||||||||||||||||||||||||||||||||||||||||||||
| Musculus costulatus | 1,45 | 7,26 | 0,86 | 24,42 | 24,42 | |||||||||||||||||||||||||||||||||||||||||||||||||||||
| Hiatella arctica | 1,01 | 5,33 | 0,84 | 17,93 | 42,34 | |||||||||||||||||||||||||||||||||||||||||||||||||||||
| Parvicardium scriptum | 0,47 | 1,75 | 0,59 | 5,89 | 48,23 | |||||||||||||||||||||||||||||||||||||||||||||||||||||
| Bittium latreillii | 0,54 | 1,64 | 0,55 | 5,53 | 53,76 | |||||||||||||||||||||||||||||||||||||||||||||||||||||
| Chauvetia recondita | 0,19 | 1,62 | 0,29 | 5,44 | 59,20 | |||||||||||||||||||||||||||||||||||||||||||||||||||||
| Pusillina philippi | 0,52 | 1,44 | 0,55 | 4,86 | 64,06 | |||||||||||||||||||||||||||||||||||||||||||||||||||||
| Tritia incrassata | 0,27 | 1,25 | 0,29 | 4,19 | 68,25 | |||||||||||||||||||||||||||||||||||||||||||||||||||||
| Chauvetia mamillata | 0,41 | 1,21 | 0,55 | 4,06 | 72,31 | |||||||||||||||||||||||||||||||||||||||||||||||||||||
| Odostomia striolata | 0,35 | 1,20 | 0,38 | 4,03 | 76,34 | |||||||||||||||||||||||||||||||||||||||||||||||||||||
| Alvania lineata | 0,51 | 1,13 | 0,55 | 3,81 | 80,15 | |||||||||||||||||||||||||||||||||||||||||||||||||||||
| May - Average similarity: 46,60 | ||||||||||||||||||||||||||||||||||||||||||||||||||||||||||
| Species | Av.Abund | Av.Sim | Sim/SD | Contrib% | Cum.% | |||||||||||||||||||||||||||||||||||||||||||||||||||||
| Chama gryphoides | 0,33 | 4,73 | 0,55 | 10,14 | 10,14 | |||||||||||||||||||||||||||||||||||||||||||||||||||||
| Hiatella arctica | 1,30 | 4,55 | 0,83 | 9,77 | 19,92 | |||||||||||||||||||||||||||||||||||||||||||||||||||||
| Tritia incrassata | 0,82 | 4,49 | 0,70 | 9,64 | 29,56 | |||||||||||||||||||||||||||||||||||||||||||||||||||||
| Alvania lineata | 1,14 | 4,21 | 0,84 | 9,04 | 38,60 | |||||||||||||||||||||||||||||||||||||||||||||||||||||
| Musculus costulatus | 1,38 | 3,23 | 0,90 | 6,92 | 45,52 | |||||||||||||||||||||||||||||||||||||||||||||||||||||
| Pusillina philippi | 0,92 | 2,31 | 0,94 | 4,95 | 50,47 | |||||||||||||||||||||||||||||||||||||||||||||||||||||
| Odostomia striolata | 0,84 | 2,18 | 0,93 | 4,68 | 55,14 | |||||||||||||||||||||||||||||||||||||||||||||||||||||
| Muricopsis cristata | 0,17 | 1,74 | 0,29 | 3,74 | 58,88 | |||||||||||||||||||||||||||||||||||||||||||||||||||||
| Aequipecten opercularis | 0,48 | 1,25 | 0,55 | 2,69 | 61,57 | |||||||||||||||||||||||||||||||||||||||||||||||||||||
| Bittium latreillii | 0,66 | 1,19 | 0,67 | 2,54 | 64,11 | |||||||||||||||||||||||||||||||||||||||||||||||||||||
| Junjubinus ruscurianus | 0,63 | 1,15 | 0,67 | 2,46 | 66,58 | |||||||||||||||||||||||||||||||||||||||||||||||||||||
| Mimachlamys varia | 0,49 | 1,05 | 0,55 | 2,25 | 68,83 | |||||||||||||||||||||||||||||||||||||||||||||||||||||
| Gregariella semigranata | 0,33 | 0,99 | 0,55 | 2,13 | 70,96 | |||||||||||||||||||||||||||||||||||||||||||||||||||||
| Clanculus cruciatus | 0,66 | 0,96 | 0,65 | 2,06 | 73,01 | |||||||||||||||||||||||||||||||||||||||||||||||||||||
| Chauvetia mamillata | 0,55 | 0,96 | 0,67 | 2,05 | 75,07 | |||||||||||||||||||||||||||||||||||||||||||||||||||||
| Crisilla semistriata | 0,57 | 0,94 | 0,61 | 2,02 | 77,09 | |||||||||||||||||||||||||||||||||||||||||||||||||||||
| Arca noae | 0,25 | 0,87 | 0,29 | 1,86 | 78,95 | |||||||||||||||||||||||||||||||||||||||||||||||||||||
| Mitromorpha olivoidea | 0,18 | 0,87 | 0,29 | 1,86 | 80,80 | |||||||||||||||||||||||||||||||||||||||||||||||||||||
| July - Average similarity: 54,60 | ||||||||||||||||||||||||||||||||||||||||||||||||||||||||||
| Species | Av.Abund | Av.Sim | Sim/SD | Contrib% | Cum.% | |||||||||||||||||||||||||||||||||||||||||||||||||||||
| Hiatella arctica | 1,25 | 6,39 | 0,98 | 11,71 | 11,71 | |||||||||||||||||||||||||||||||||||||||||||||||||||||
| Chauvetia brunnea | 0,46 | 4,47 | 0,64 | 8,19 | 19,90 | |||||||||||||||||||||||||||||||||||||||||||||||||||||
| Musculus costulatus | 1,36 | 2,76 | 0,82 | 5,06 | 24,96 | |||||||||||||||||||||||||||||||||||||||||||||||||||||
| Pusillina philippi | 1,24 | 2,72 | 0,84 | 4,98 | 29,94 | |||||||||||||||||||||||||||||||||||||||||||||||||||||
| Alvania lineata | 1,10 | 2,63 | 0,67 | 4,82 | 34,75 | |||||||||||||||||||||||||||||||||||||||||||||||||||||
| Tritia incrassata | 0,80 | 2,17 | 0,71 | 3,98 | 38,74 | |||||||||||||||||||||||||||||||||||||||||||||||||||||
| Triphoridae indet. | 0,90 | 1,92 | 0,87 | 3,51 | 42,24 | |||||||||||||||||||||||||||||||||||||||||||||||||||||
| Odostomia striolata | 0,88 | 1,87 | 0,86 | 3,43 | 45,68 | |||||||||||||||||||||||||||||||||||||||||||||||||||||
| Modiolus barbatus | 0,28 | 1,87 | 0,55 | 3,42 | 49,10 | |||||||||||||||||||||||||||||||||||||||||||||||||||||
| Mimachlamys varia | 0,49 | 1,86 | 0,42 | 3,41 | 52,50 | |||||||||||||||||||||||||||||||||||||||||||||||||||||
| Alvania aspera | 0,27 | 1,76 | 0,55 | 3,22 | 55,72 | |||||||||||||||||||||||||||||||||||||||||||||||||||||
| Bittium latreillii | 1,42 | 1,65 | 0,66 | 3,02 | 58,74 | |||||||||||||||||||||||||||||||||||||||||||||||||||||
| Ammonicera fischeriana | 0,79 | 1,63 | 0,88 | 2,98 | 61,73 | |||||||||||||||||||||||||||||||||||||||||||||||||||||
| Modiolula phaseolina | 0,68 | 1,60 | 0,82 | 2,93 | 64,65 | |||||||||||||||||||||||||||||||||||||||||||||||||||||
| Chama gryphoides | 0,17 | 1,44 | 0,29 | 2,64 | 67,29 | |||||||||||||||||||||||||||||||||||||||||||||||||||||
| Aequipecten opercularis | 0,57 | 1,30 | 0,79 | 2,38 | 69,67 | |||||||||||||||||||||||||||||||||||||||||||||||||||||
| Striarca lactea | 0,64 | 1,03 | 0,49 | 1,89 | 71,56 | |||||||||||||||||||||||||||||||||||||||||||||||||||||
| Cyrillia linearis | 0,52 | 0,95 | 0,46 | 1,74 | 73,31 | |||||||||||||||||||||||||||||||||||||||||||||||||||||
| Parvicardium scriptum | 0,66 | 0,89 | 0,63 | 1,62 | 74,93 | |||||||||||||||||||||||||||||||||||||||||||||||||||||
| Pusillina radiata | 0,63 | 0,88 | 0,61 | 1,61 | 76,54 | |||||||||||||||||||||||||||||||||||||||||||||||||||||
| Chauvetia mamillata | 0,61 | 0,87 | 0,61 | 1,60 | 78,14 | |||||||||||||||||||||||||||||||||||||||||||||||||||||
| Bittium reticulatum | 0,68 | 0,83 | 0,60 | 1,53 | 79,66 | |||||||||||||||||||||||||||||||||||||||||||||||||||||
| Rissoella diaphana | 0,68 | 0,81 | 0,55 | 1,49 | 81,15 | |||||||||||||||||||||||||||||||||||||||||||||||||||||
| September - Average similarity: 44,42 | ||||||||||||||||||||||||||||||||||||||||||||||||||||||||||
| Species | Av.Abund | Av.Sim | Sim/SD | Contrib% | Cum.% | |||||||||||||||||||||||||||||||||||||||||||||||||||||
| Tritia incrassata | 0,77 | 4,62 | 0,78 | 10,40 | 10,40 | |||||||||||||||||||||||||||||||||||||||||||||||||||||
| Bittium latreillii | 1,44 | 3,10 | 1,15 | 6,98 | 17,38 | |||||||||||||||||||||||||||||||||||||||||||||||||||||
| Musculus costulatus | 1,26 | 2,75 | 1,08 | 6,18 | 23,56 | |||||||||||||||||||||||||||||||||||||||||||||||||||||
| Pusillina philippi | 1,12 | 2,73 | 1,12 | 6,14 | 29,70 | |||||||||||||||||||||||||||||||||||||||||||||||||||||
| Hiatella arctica | 0,89 | 2,63 | 0,97 | 5,91 | 35,61 | |||||||||||||||||||||||||||||||||||||||||||||||||||||
| Triphoridae indet. | 0,90 | 2,51 | 1,12 | 5,65 | 41,26 | |||||||||||||||||||||||||||||||||||||||||||||||||||||
| Odostomia striolata | 0,88 | 2,38 | 1,08 | 5,35 | 46,61 | |||||||||||||||||||||||||||||||||||||||||||||||||||||
| Chauvetia mamillata | 0,90 | 1,95 | 1,10 | 4,40 | 51,01 | |||||||||||||||||||||||||||||||||||||||||||||||||||||
| Runcina sp. | 0,67 | 1,86 | 1,05 | 4,18 | 55,19 | |||||||||||||||||||||||||||||||||||||||||||||||||||||
| Alvania lineata | 0,84 | 1,72 | 0,48 | 3,88 | 59,06 | |||||||||||||||||||||||||||||||||||||||||||||||||||||
| Parvicardium scriptum | 0,81 | 1,49 | 0,73 | 3,36 | 62,42 | |||||||||||||||||||||||||||||||||||||||||||||||||||||
| Jujubinus ruscurianus | 0,51 | 1,34 | 0,32 | 3,03 | 65,45 | |||||||||||||||||||||||||||||||||||||||||||||||||||||
| Arca noae | 0,53 | 1,26 | 0,58 | 2,84 | 68,28 | |||||||||||||||||||||||||||||||||||||||||||||||||||||
| Pusia tricolor | 0,27 | 1,13 | 0,32 | 2,54 | 70,83 | |||||||||||||||||||||||||||||||||||||||||||||||||||||
| Vitreolina perminima | 0,62 | 1,13 | 0,74 | 2,53 | 73,36 | |||||||||||||||||||||||||||||||||||||||||||||||||||||
| Rissoella diaphana | 0,51 | 0,97 | 0,61 | 2,18 | 75,54 | |||||||||||||||||||||||||||||||||||||||||||||||||||||
| Aplysia punctata | 0,53 | 0,97 | 0,67 | 2,18 | 77,72 | |||||||||||||||||||||||||||||||||||||||||||||||||||||
| Modiolula phaseolina | 0,55 | 0,87 | 0,39 | 1,95 | 79,67 | |||||||||||||||||||||||||||||||||||||||||||||||||||||
| Mitromorpha columbellaria | 0,36 | 0,69 | 0,32 | 1,56 | 81,23 | |||||||||||||||||||||||||||||||||||||||||||||||||||||
| November - Average similarity: 41,53 | ||||||||||||||||||||||||||||||||||||||||||||||||||||||||||
| Species | Av.Abund | Av.Sim | Sim/SD | Contrib% | Cum.% | |||||||||||||||||||||||||||||||||||||||||||||||||||||
| Chauvetia mamillata | 0,98 | 6,89 | 0,72 | 16,60 | 16,60 | |||||||||||||||||||||||||||||||||||||||||||||||||||||
| Pusillina radiata | 1,37 | 3,83 | 0,92 | 9,22 | 25,82 | |||||||||||||||||||||||||||||||||||||||||||||||||||||
| Tritia incrassata | 0,48 | 3,09 | 0,54 | 7,43 | 33,25 | |||||||||||||||||||||||||||||||||||||||||||||||||||||
| Arca noae | 0,43 | 3,08 | 0,59 | 7,42 | 40,67 | |||||||||||||||||||||||||||||||||||||||||||||||||||||
| Musculus costulatus | 1,08 | 2,97 | 0,91 | 7,15 | 47,81 | |||||||||||||||||||||||||||||||||||||||||||||||||||||
| Pusillina philippi | 1,03 | 2,69 | 0,64 | 6,48 | 54,29 | |||||||||||||||||||||||||||||||||||||||||||||||||||||
| Odostomia striolata | 0,75 | 2,55 | 0,87 | 6,15 | 60,44 | |||||||||||||||||||||||||||||||||||||||||||||||||||||
| Hiatella arctica | 0,75 | 2,28 | 0,90 | 5,48 | 65,92 | |||||||||||||||||||||||||||||||||||||||||||||||||||||
| Pseudochama gryphina | 0,33 | 2,20 | 0,40 | 5,29 | 71,21 | |||||||||||||||||||||||||||||||||||||||||||||||||||||
| Odostomia plicata | 0,56 | 1,91 | 0,87 | 4,60 | 75,81 | |||||||||||||||||||||||||||||||||||||||||||||||||||||
| Bittium latreillii | 0,77 | 1,54 | 0,54 | 3,71 | 79,52 | |||||||||||||||||||||||||||||||||||||||||||||||||||||
| Striarca lactea | 0,78 | 1,17 | 0,66 | 2,83 | 82,34 | |||||||||||||||||||||||||||||||||||||||||||||||||||||
References
- Hayward, P.J. Invertebrate epiphytes of coastal marine algae. In: The shore environment, Ecosystems, vol 2; Price, J.H., Irvine, D.E.G. & Farnham, W.F. (eds). Systematics Association, Academic Press, London, 1980; pp. 761–787.
- Hayward, P.J. Animals on seaweed. Naturalist’s handbooks, vol. 9. Richmond Publishing, Richmond, 1988; pp. 1-108.
- Ballesteros, M.; Castelló, J.; Gallés, M.; Sardà, R. Invertebrados Alguícolas Marinos de las Islas Pitiusas. Consell Insular d’Eivissa i Formentera, Conselleria d’Ecologia i Medi Ambient, Ibiza: 1987; 96 pp.
- Bégin, C.; Johnson, L.E.; Himmelman, J.H. Macroalgal canopies: Distribution and diversity of associated invertebrates and effects on the recruitment and growth of mussels. Mar. Ecol. Prog. Ser. 2004, 271, 121–132. [Google Scholar] [CrossRef]
- Guerra-García, J.M.; Sánchez, J.A.; Ros, M.; Baeza-Rojano, E.; Cabezas, M.P.; Izquierdo, D.; Corzo, J. Macrofauna asociada al alga Stycopaulon scoparium en el Estrecho de Gibraltar y comparación con el resto de la Península Ibérica. Almoraima 2010, 40, 123–132. [Google Scholar]
- Bracken, M.E.S.; González-Dorantes, C.A.; Stachowicz, J.J. Whole-community mutualism: associated invertebrates facilitate a dominant habitat-forming seaweed. Ecology 2007, 88, 2211–2219. [Google Scholar] [CrossRef] [PubMed]
- Chemello, R.; Dipiazza, F.; Dieli, T.; Riggio, S. . Struttura della Malacocenosi Associata at Alghe Fotofile: Effetti della Profondità e della Complessità d’Habitat. Biol. Mar. Mediterr 1997, 4, 167–168. [Google Scholar]
- García, R.C.; Soto, F.S.; Colón, R.R.; Medina, H.J. Gasterópodos asociados al alga calcárea Halimeda tuna (Udoteaceae) en Puerto Rico. Rev. Biol. Trop. 2008, 56, 1665–1675. [Google Scholar]
- Ávila, S.P.; Santos, A.C.; Penteado, A.M.; Rodriguez, A.M.; Quitino, I.; Machado, M. The molluscs of the intertidal algal turf in the Azores. Iberus 2005, 23, 67–76. [Google Scholar]
- Chemello, R.; Milazzo, M. Effect of algal architecture on associated fauna: some evidence from phytal molluscs. Mar. Biol. 2002, 140, 981–990. [Google Scholar]
- Gallardo, D.; Oliva, F.; Ballesteros, M. Marine invertebrates epibiont on photophilic seaweeds: importance of algal architecture. Mar. Biodivers. 2021, 51, 16. [Google Scholar] [CrossRef]
- Terlizzi, A.; Scuderi, D.; Fraschetti, S.; Guidetti, P.; Boero, F. Molluscs on subtidal cliffs: patterns of spatial distribution. J. Mar. Biol. Assoc. U. K., 2003, 83, 165–172. [Google Scholar] [CrossRef]
- Salas, C.; Hergueta, E. La fauna de moluscos de las concreciones calcáreas de Mesophyllum lichenoides (Ellis) Lemoine. Estudio de la Diversidad de un Ciclo Anual. Iberus 1986, 6, 57–65. [Google Scholar]
- Martin, D.; Dantart, L.; Ballesteros, M. Moluscos de las concreciones de algas calcáreas del litoral catalán (NE España). Lavori SIM 1990, 23, 445–456. [Google Scholar]
- Milazzo, M.; Chemello, R.; Badalamendi, F.; Riggio, S. Molluscan assemblages associated with photophilic alae in the Marine Reserve of Ustica Island (Lower Tyrrhenian Sea, Italy). Ital. J. Zool. 2000, 67, 287–295. [Google Scholar] [CrossRef]
- Urra, J.; Rueda, J.L.; Mateo Ramírez, Á.; Marina, P.; Tirado, C.; Salas, C.; Gofas, S. Seasonal variation of molluscan assemblages in diferent strata of photophilous algae in the Alboran Sea (Western Mediterranean). J. Sea Res. 2013, 83, 83–93. [Google Scholar] [CrossRef]
- Sánchez-Moyano, J.E.; Estacio, F.J.; García-Adiego, E.M.; García-Gómez, J.C. The molluscan epifauna of the alga Halopteris scoparia in Southern Spain as a bioindicator of coastal environmental conditions. J. Mollus. Stud. 2000, 66, 431–448. [Google Scholar] [CrossRef]
- Pitacco,V. ; Orlando-Bonaca, M.; Mavrič, B.; Popović, A.; Lipej, L. Mollusc fauna associated with the Cystoseira algal associations in the Gulf of Trieste (Northern Adriatic Sea). Mediterr. Mar. Sci. 2014, 15, 225–238. [Google Scholar] [CrossRef]
- Peñas, A.; Almera, J. Malacofauna Asociada a una pradera de Posidonia oceanica (L.) en Mataró (NE de la Península Ibérica). Spira 2001, 1, 25–31. [Google Scholar]
- Llamas, A. Costa Brava. Las 200 Mejores Inmersiones, A Fondo. Barcelona. Geoplaneta,2001. 280 pp.
- Parenzan, P. Carta d’Identità delle Conchiglie del Mediterraneo. Vol. I Gasteropodi. Bios Taras, Taranto, Italy, 1970, 283 pp.
- Parenzan, P. Carta d’Identità delle Conchiglie del Mediterraneo. Vol. II Bivalvi prima parte. Bios Taras, Taranto, Italy, 1974, 282 pp.
- Parenzan, P. Carta d’Identità delle Conchiglie del Mediterraneo. Vol. II Bivalvi seconda parte. Bios Taras, Taranto, Italy, 1976, pp. 283 - 546.
- D’Angelo, G.; Gargiullo, S. Guida alle Conchiglie Mediterranee. Fabbri Editori, Milano, Italy, 1987, 224 pp.
- Poppe, G.T.; Goto, Y. European seashells. Verlag Christa Hemmen, Wiesbaden, Germany, 1991, 352 pp.
- Doneddu, M.; Trainito, E. Conchiglie del Mediterraneo. Il Castello Editore, Trezzano Sul naviglio, Italy, 2005, 256 pp.
- Gofas, S.; Moreno, D.; Salas, C. Moluscos Marinos de Andalucía. Universidad de Málaga, Servicio de Publicaciones e Intercambio Científico, vols. I & II, Málaga, Spain, 2011, 798 pp.
- Scaperrotta, M.; Bartolini, S.; Bogi, C. Accrescimenti. Stadi di accrescimento dei molluschi marini del Mediterraneo. Vols. I-VI, L´Informatore Piceno, Ancona, Italia, 2009-2014.
- WoRMS, World Register of Marine species. 2024. Published on: http://www.marinespecies.org/ Accessed: 03/10/2024.
- Dantart, L.; Frechilla, M.; Ballesteros, M. Fauna Malacologica del Estany des Peix (Formentera). Iberus 1990, 9, 111–125. [Google Scholar]
- Antit, M.; Daoulatli, A.; Rueda, J.L.; Salas, C. Temporal variation of the algae associated molluscan assemblage of artificial substrata in the Bay of Tunis (Tunisia). Mediterr. Mar. Sci. 2013, 14, 390–402. [Google Scholar] [CrossRef]
- Chemello, R.; Russo, G.F. The molluscan Taxocoene of photophilic algae from the Island of Lampedusa (strait of Sicily, Southern Mediterranean). Boll. Malacol. 1997, 33(5–8), 95–104.
- Chintiroglou, C.; Antoniadou, C.; Vafidis, D.; Koutsoubas, D. VI. 5. Zoobenthos –hard Substrata communities’. In: State the Hellenic Marine Environment, E. Papathanassiou & A. Zenetos (Eds), Athens, Greece, 2005, pp. 247-253.
- Pereira, F.; Ballesteros, M. Gasterópodos del litoral mediterráneo español. II. Tossa de Mar. Actas I Simp.o Ibér. Bent. Mar. 1982, 1, 223–235. [Google Scholar]
- BIOCAT, Banc de Dades de Biodiversitat de Catalunya. 2024. Published on: http://biodiver.bio.ub.es/biocat/ Accessed: 03/10/2024.
- Ballesteros, M.; Madrenas, E.; Pontes, M. Actualización del catálogo de los moluscos opistobranquios (Gastropoda: Heterobranchia) de las costas catalanas. Spira 2016, 6, 1–28. [Google Scholar]
- OPK Opistobranquis. 2024. Published on: https://opistobranquis.info/en/. Accessed: 02/10/2024.
- GROC, Grup de Recerca d´Opistobranquis de Catalunya. 2024. Published on: https://opistobranquis.org/ca/home. Accessed: 03/10/2024. Accessed, 2024.
- Milazzo, M.; Chemello, R.; Badalamendi, F.; Riggio, S. Molluscan assemblages associated with photophilic algae in the Marine Reserve of Ustica Island (Lower Tyrrhenian Sea, Italy). Ital. J. Zool. 2000, 67, 287–295. [Google Scholar] [CrossRef]
- Waller, C.L. Variability in intertidal communities along a latitudinal gradient in the Southern Ocean. Polar Biol. 2008, 31, 809–816. [Google Scholar] [CrossRef]
- Bick, A.; Arlt, G. Description of intertidal macro- and meiobenthic assemblages in Maxwell Bay, King George Island, South Shetland Islands, Southern Ocean. Polar Biol. 2013, 36, 673–689. [Google Scholar] [CrossRef]
- Aghmich, A.; Taboada, S.; Toll, S.; Ballesteros, M. First assessment of the rocky intertidal communities of Fildes Bay, King George Island (South Shetland Islands, Antarctica). Polar Biol. 2015, 39, 198–198. [Google Scholar] [CrossRef]
- AnimalBase. 2024. Published on: http://www.animalbase.uni-goettingen.de/zooweb/servlet/AnimalBase/AnimalBase/search Accessed: 03/10/2024.
- Forli, M. : Dell´Angelo, B.; Sosso, M.; Bonfitto, A. Note su alcune specie fossili di Williamia (Gastropoda: Siphonariidae) con descrizione di una nuova specie. Boll. Malacol. 2009, 45, 5–8. [Google Scholar]
- GBIF, Global Biodiversity Information Facility. 2024. Published on: https://www.gbif.org/es/ Accessed: 03/10/2024.
- Hodgson, A.N. The Biology of Siphonariid limpets (Gastropoda: Pulmonata). Oceanography and Marine Biology, CRC Press, 1999, 70 pp.
- Ruthensteiner, B. Redescription and 3D morphology of Williamia gussonii (Gastropoda: Siphonariidae). J. Mollus. Stud. 2006, 72, 327–336. [Google Scholar] [CrossRef]
- Gofas, S.; Luque, A.A.; Templado, J.; Salas, C. A national checklist of marine Mollusca in Spanish waters. Sci. Mar. 2017, 81, 241–254. [Google Scholar] [CrossRef]
- Ballesteros, E. Species composition and structure of a photophilic algal community dominated by Halopteris scoparia (L.) Sauvageau from the North-Western Mediterranean. Collect. Bot. 1993, 22, 5–24. [Google Scholar] [CrossRef]
Figure 1.
Location of Tossa de Mar on the Iberian Peninsula, showing La Banyera de ses Dones (1) and the sampling site (2).
Figure 1.
Location of Tossa de Mar on the Iberian Peninsula, showing La Banyera de ses Dones (1) and the sampling site (2).
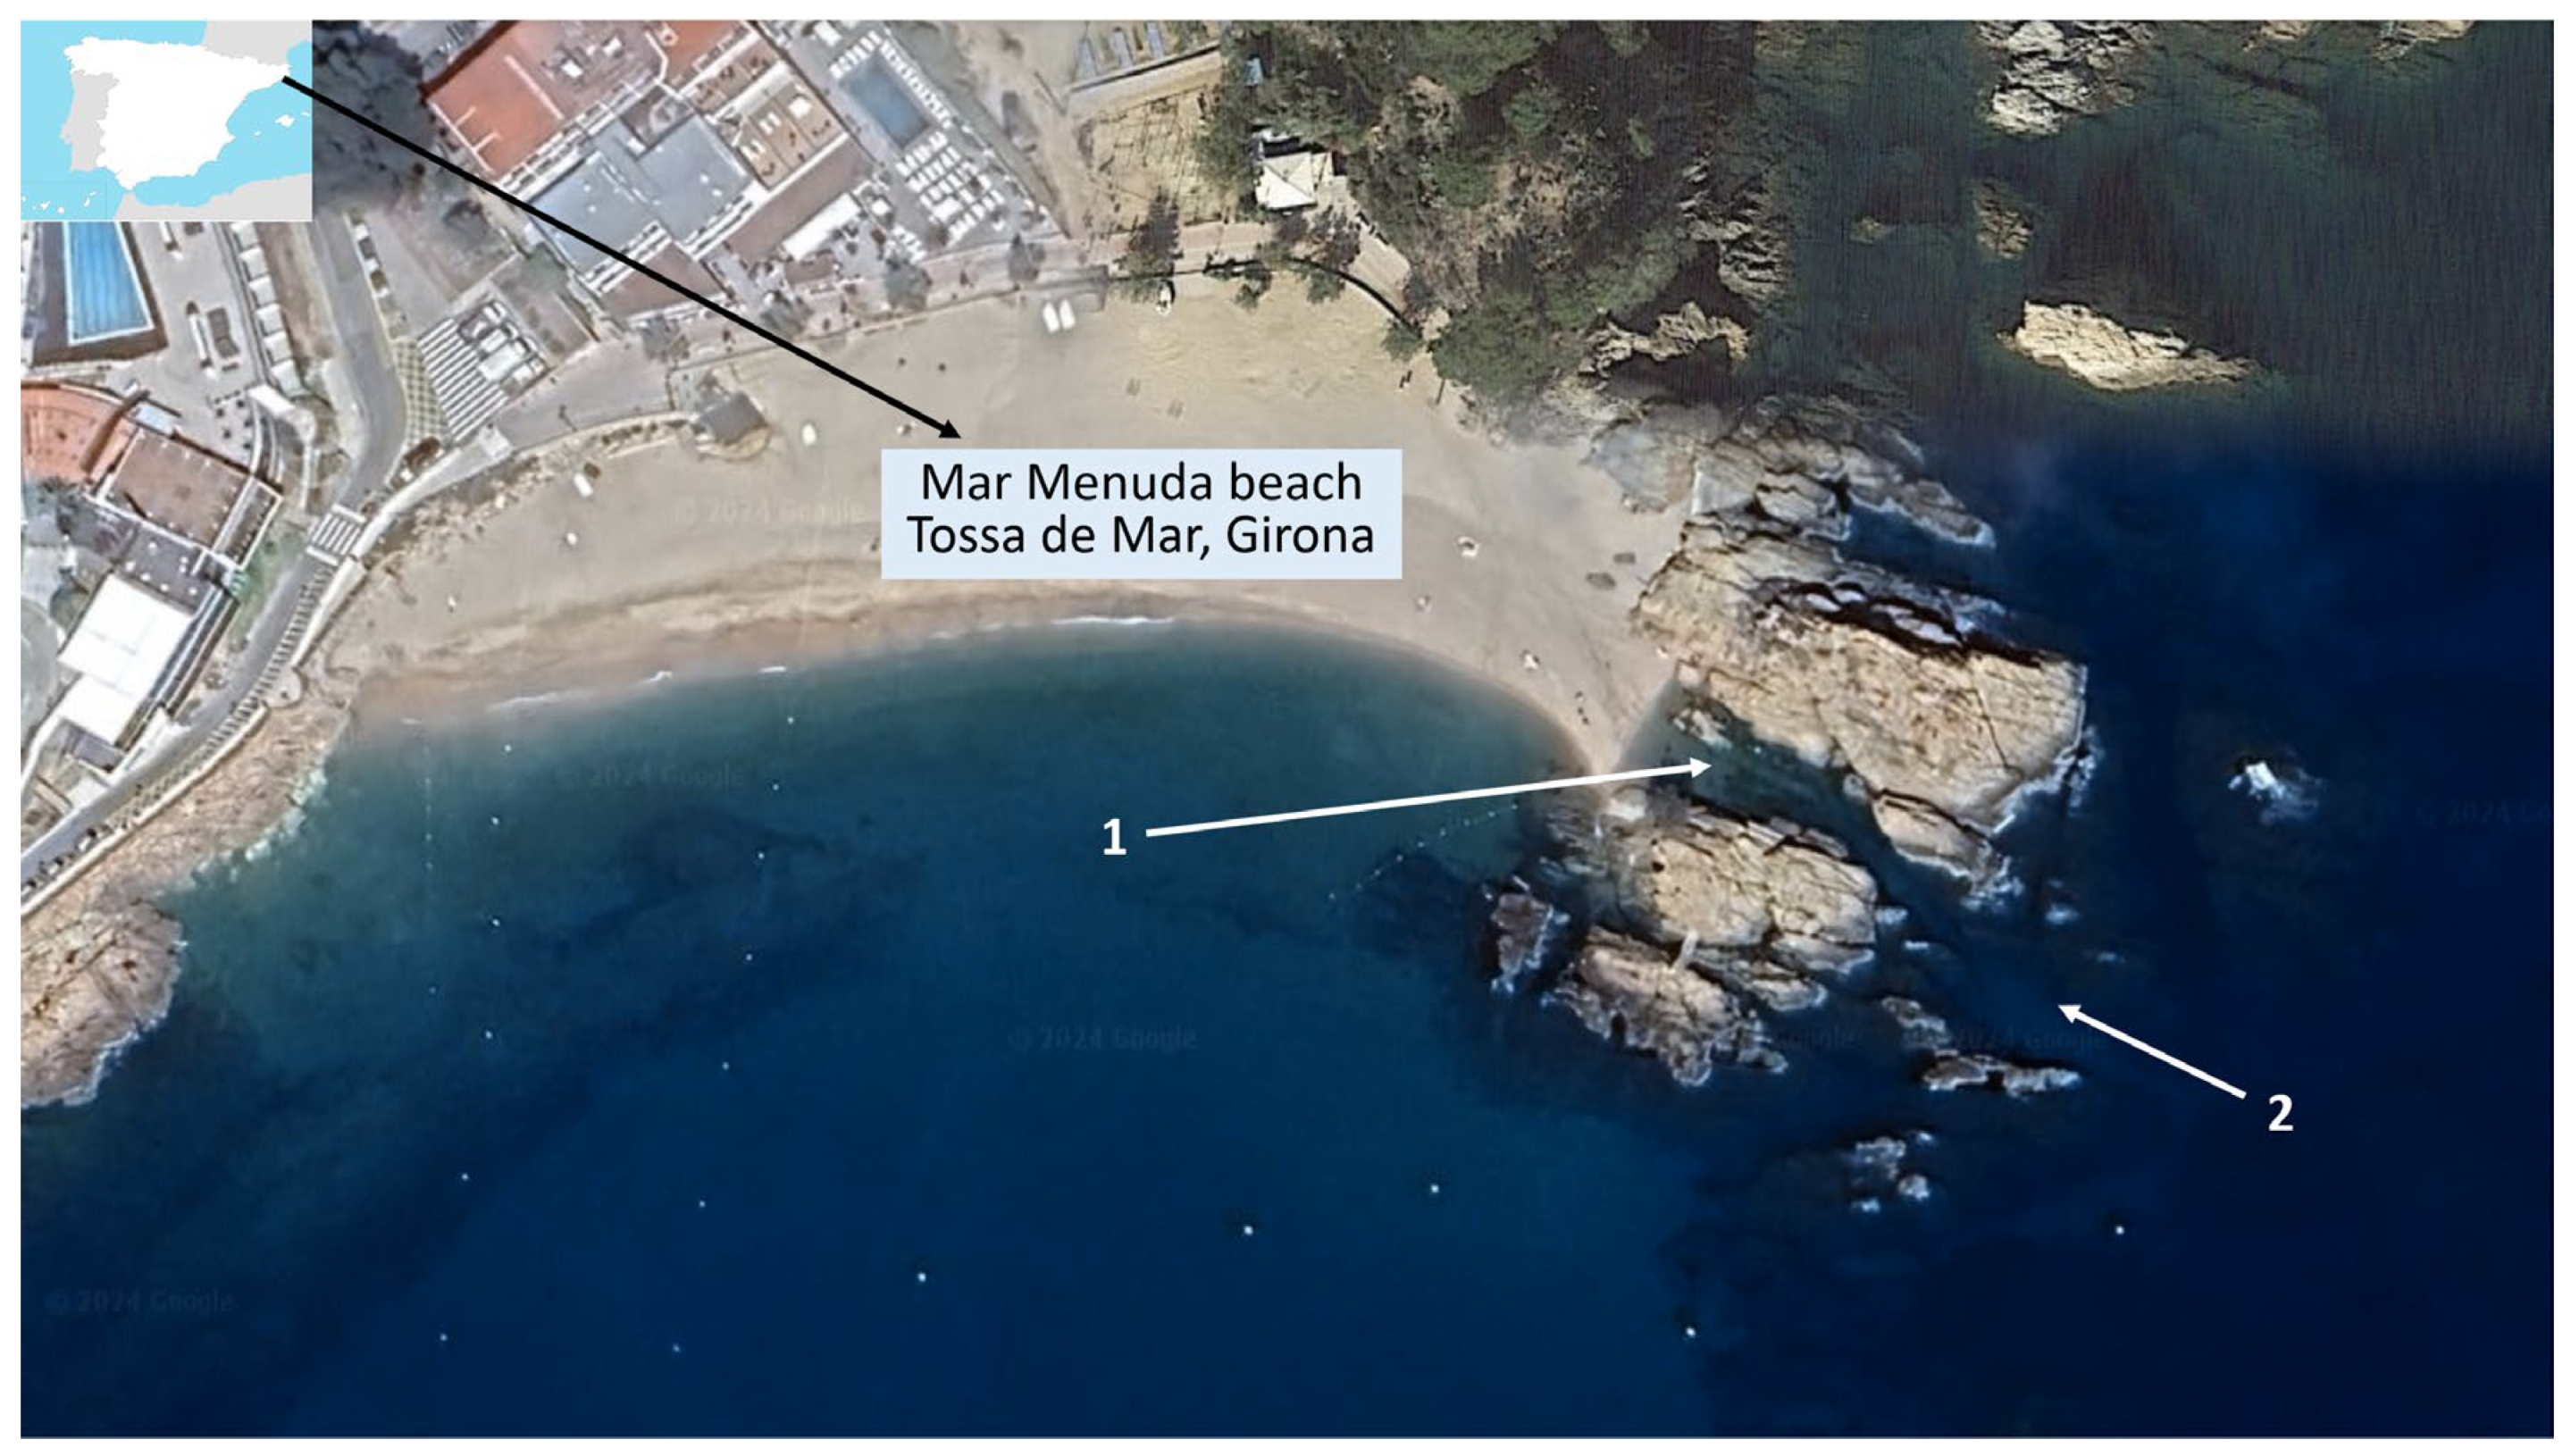
Figure 2.
Artistic recreation of the sampling area. 1: Mar Menuda beach; 2: Sa Banyera de ses Dones; 3: sampled sciophillous wall; 4: sampled photophilous wall. Image extracted with permission [20].
Figure 2.
Artistic recreation of the sampling area. 1: Mar Menuda beach; 2: Sa Banyera de ses Dones; 3: sampled sciophillous wall; 4: sampled photophilous wall. Image extracted with permission [20].
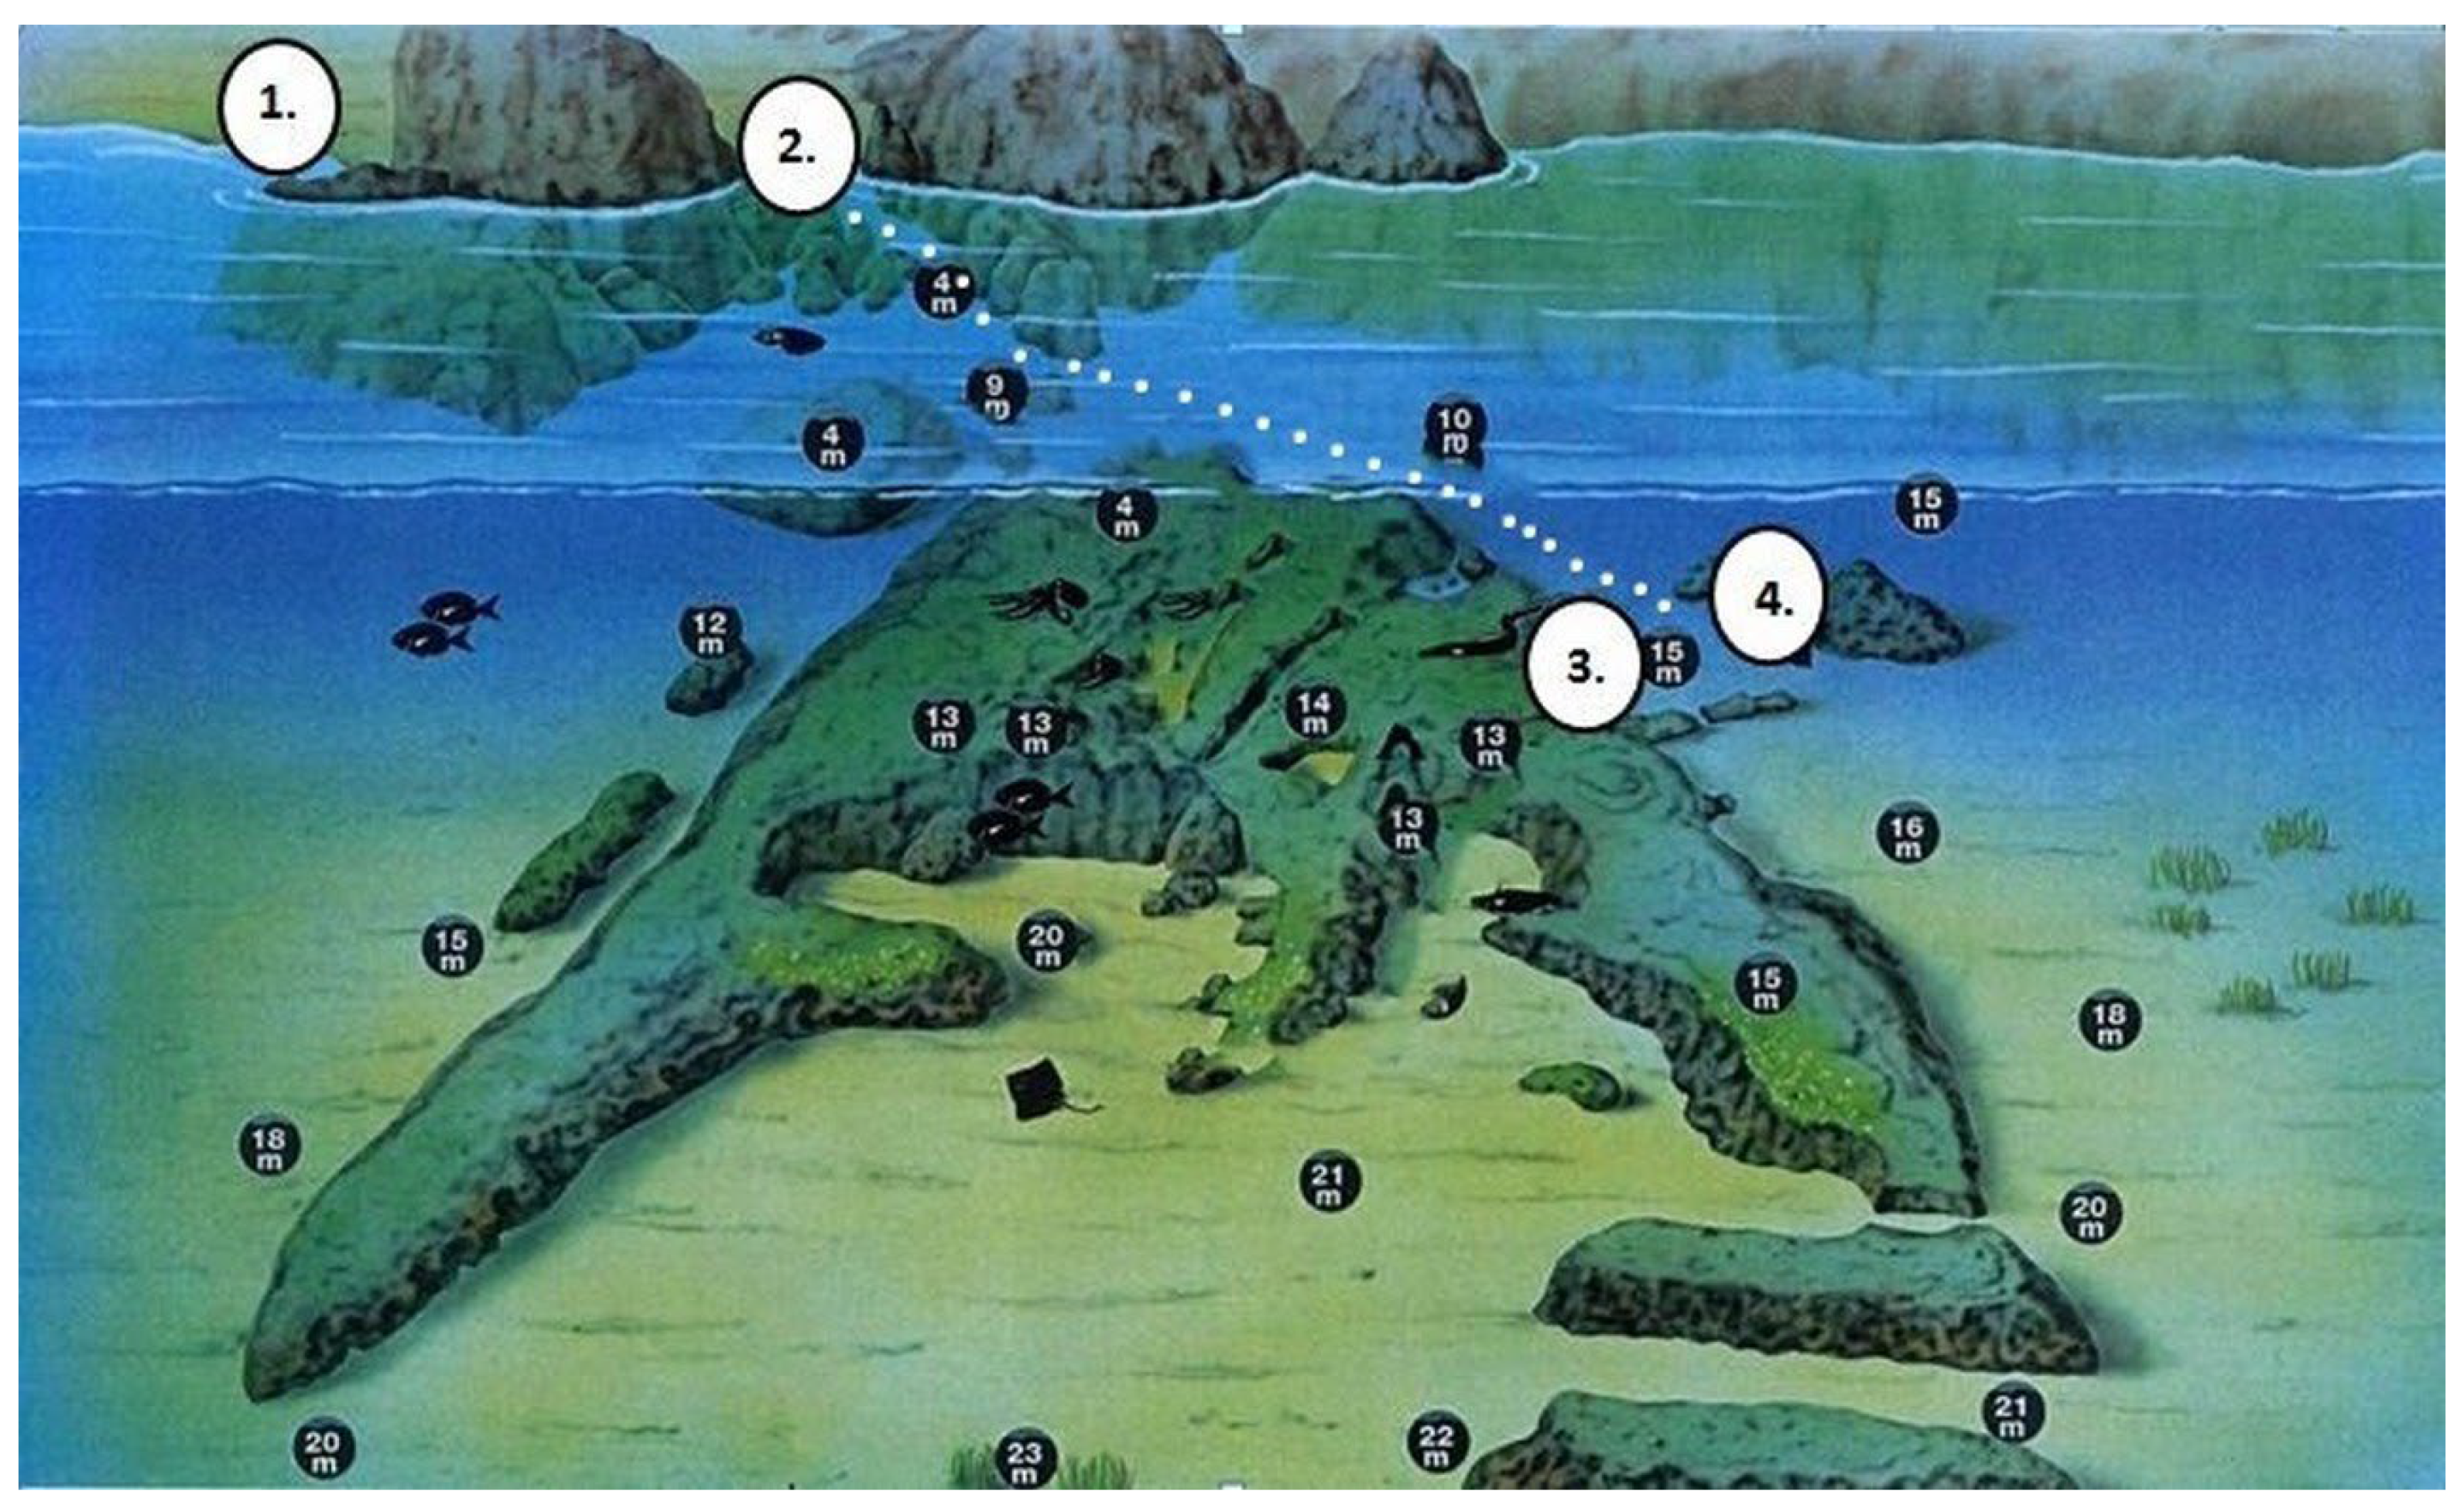
Figure 3.
Images of the sciophilic wall. A: Osmundea pinnatifida; B: Halopteris scoparia; C: Codium bursa and Peyssonnellia squamaria; D: Chondrosia reniformis. Photos by M. Ballesteros.
Figure 3.
Images of the sciophilic wall. A: Osmundea pinnatifida; B: Halopteris scoparia; C: Codium bursa and Peyssonnellia squamaria; D: Chondrosia reniformis. Photos by M. Ballesteros.
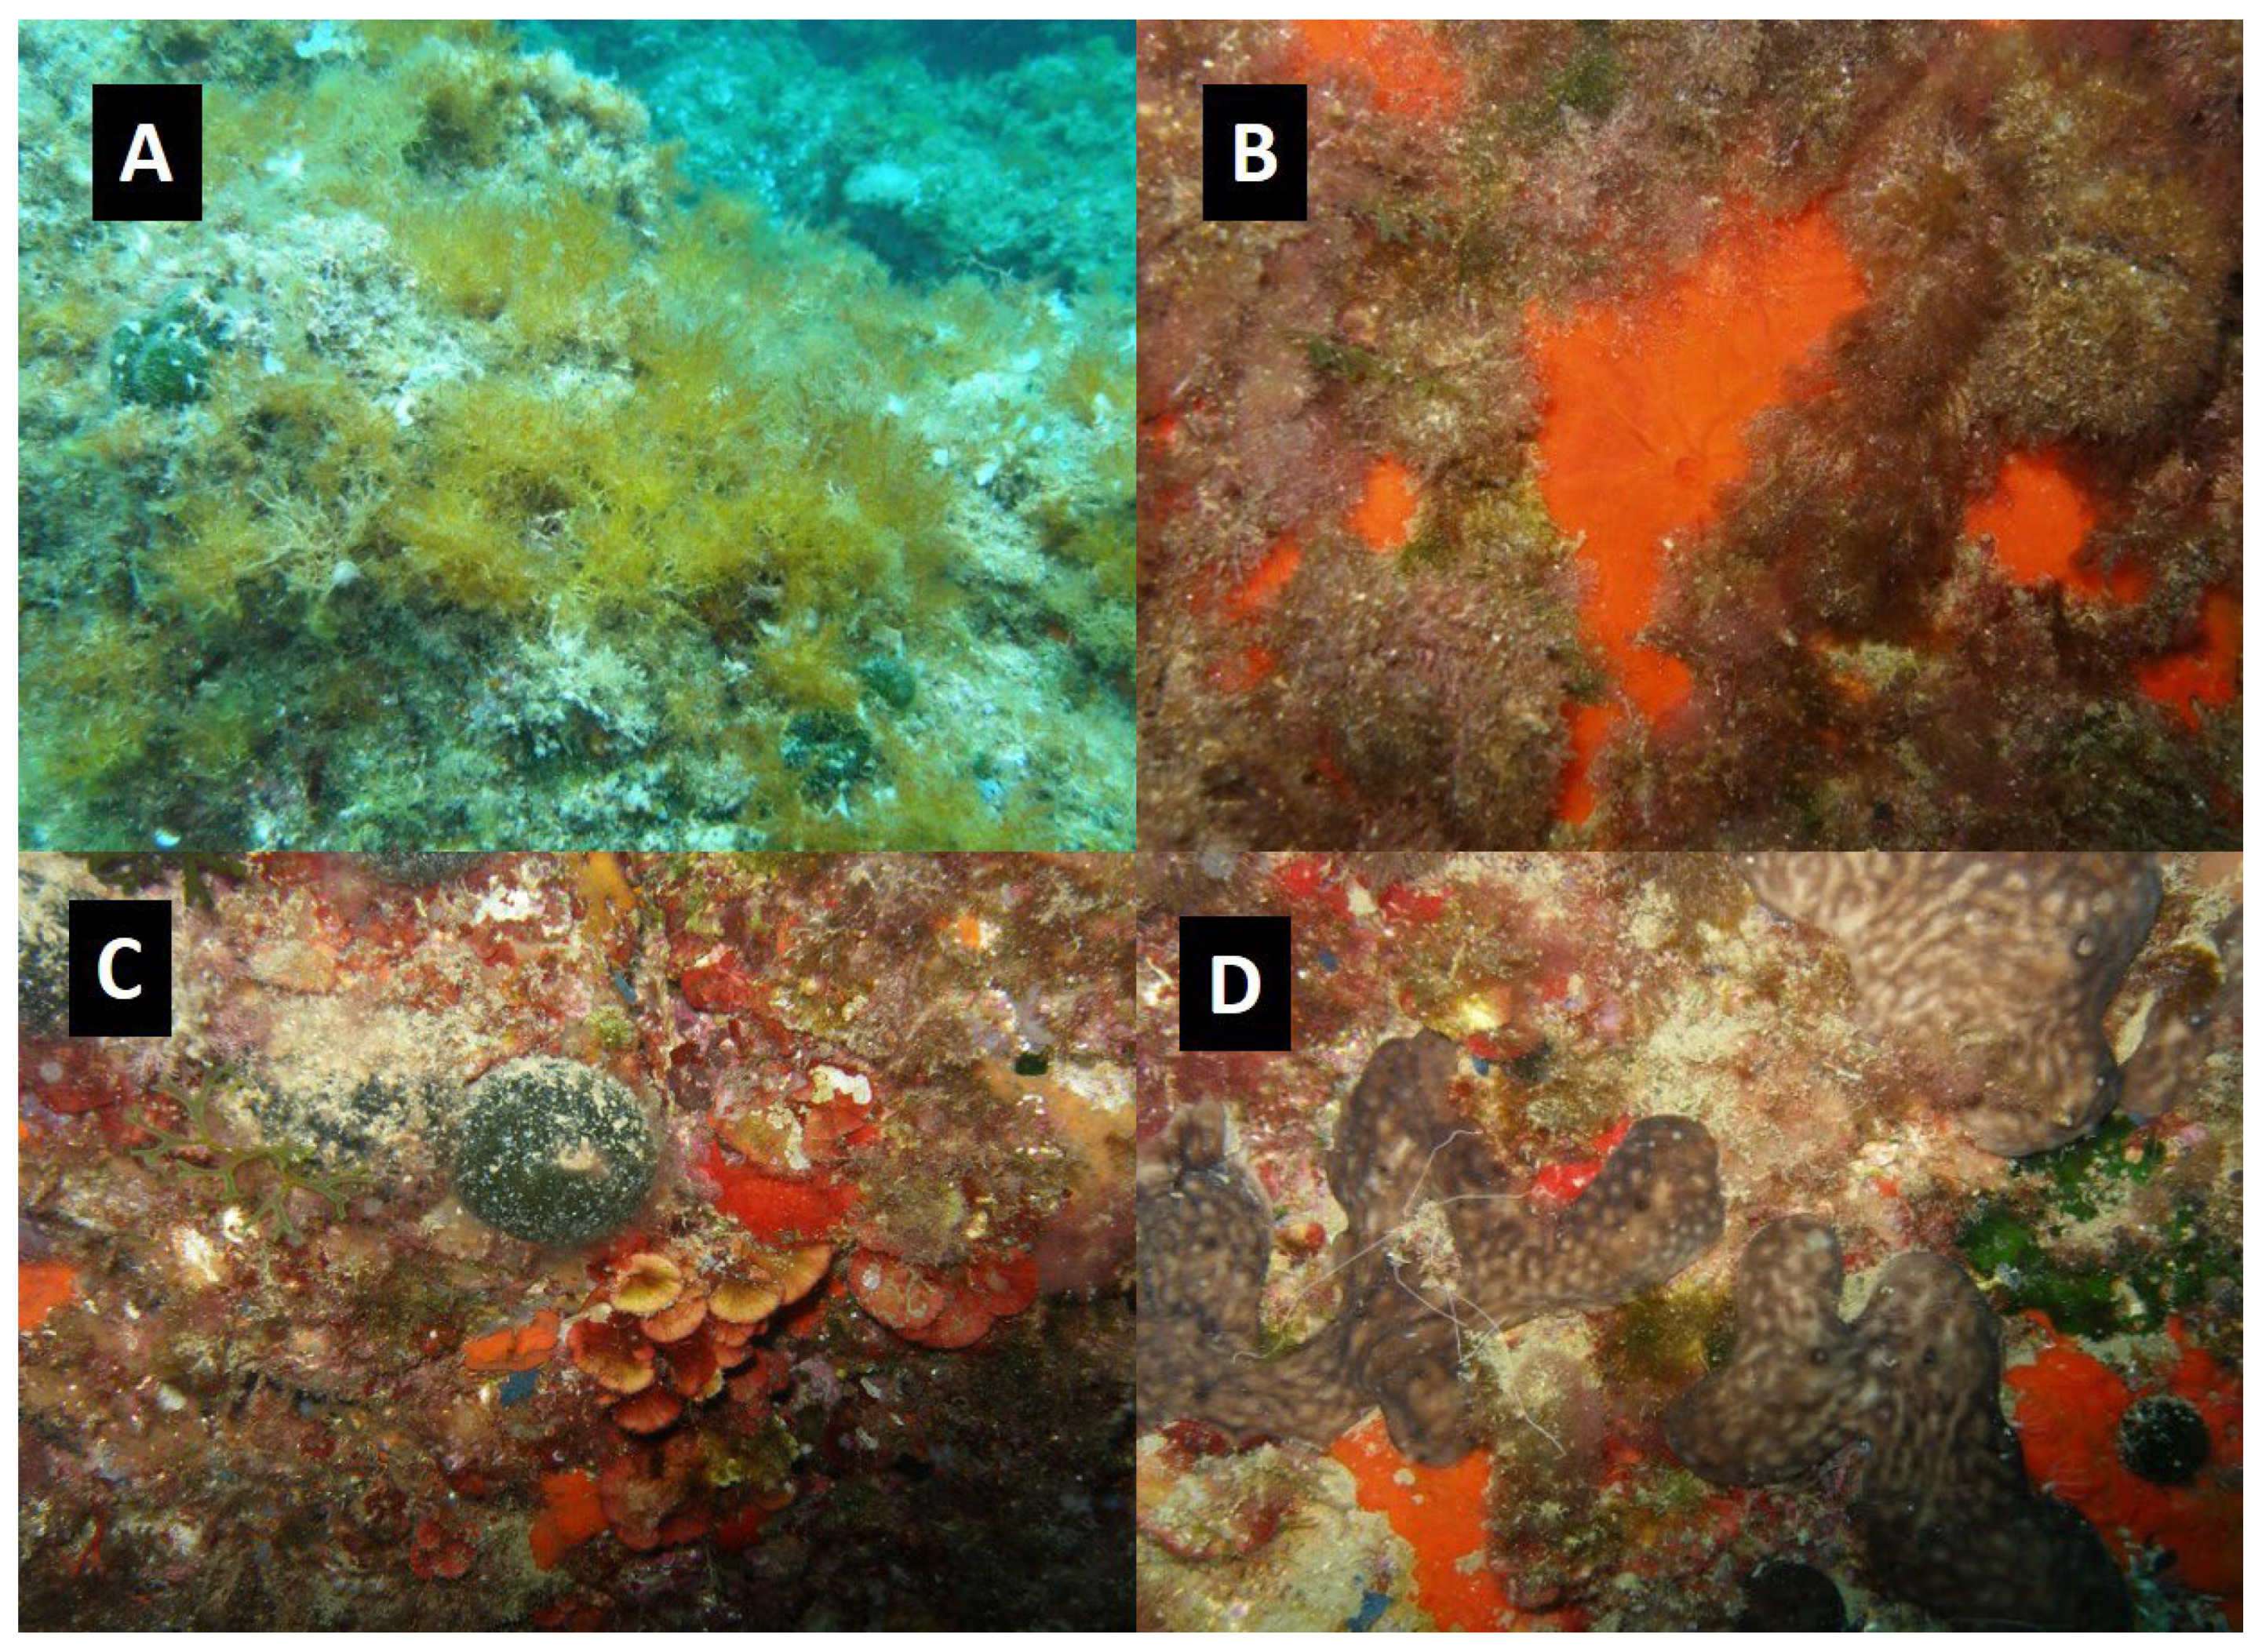
Figure 4.
Images of the photophilic wall. A: Osmundea pinnatifida; B: Acetabularia (Acetabularia) acetabulum; C: Codium vermilara; D: Halopteris scoparia. Photos by M. Ballesteros.
Figure 4.
Images of the photophilic wall. A: Osmundea pinnatifida; B: Acetabularia (Acetabularia) acetabulum; C: Codium vermilara; D: Halopteris scoparia. Photos by M. Ballesteros.
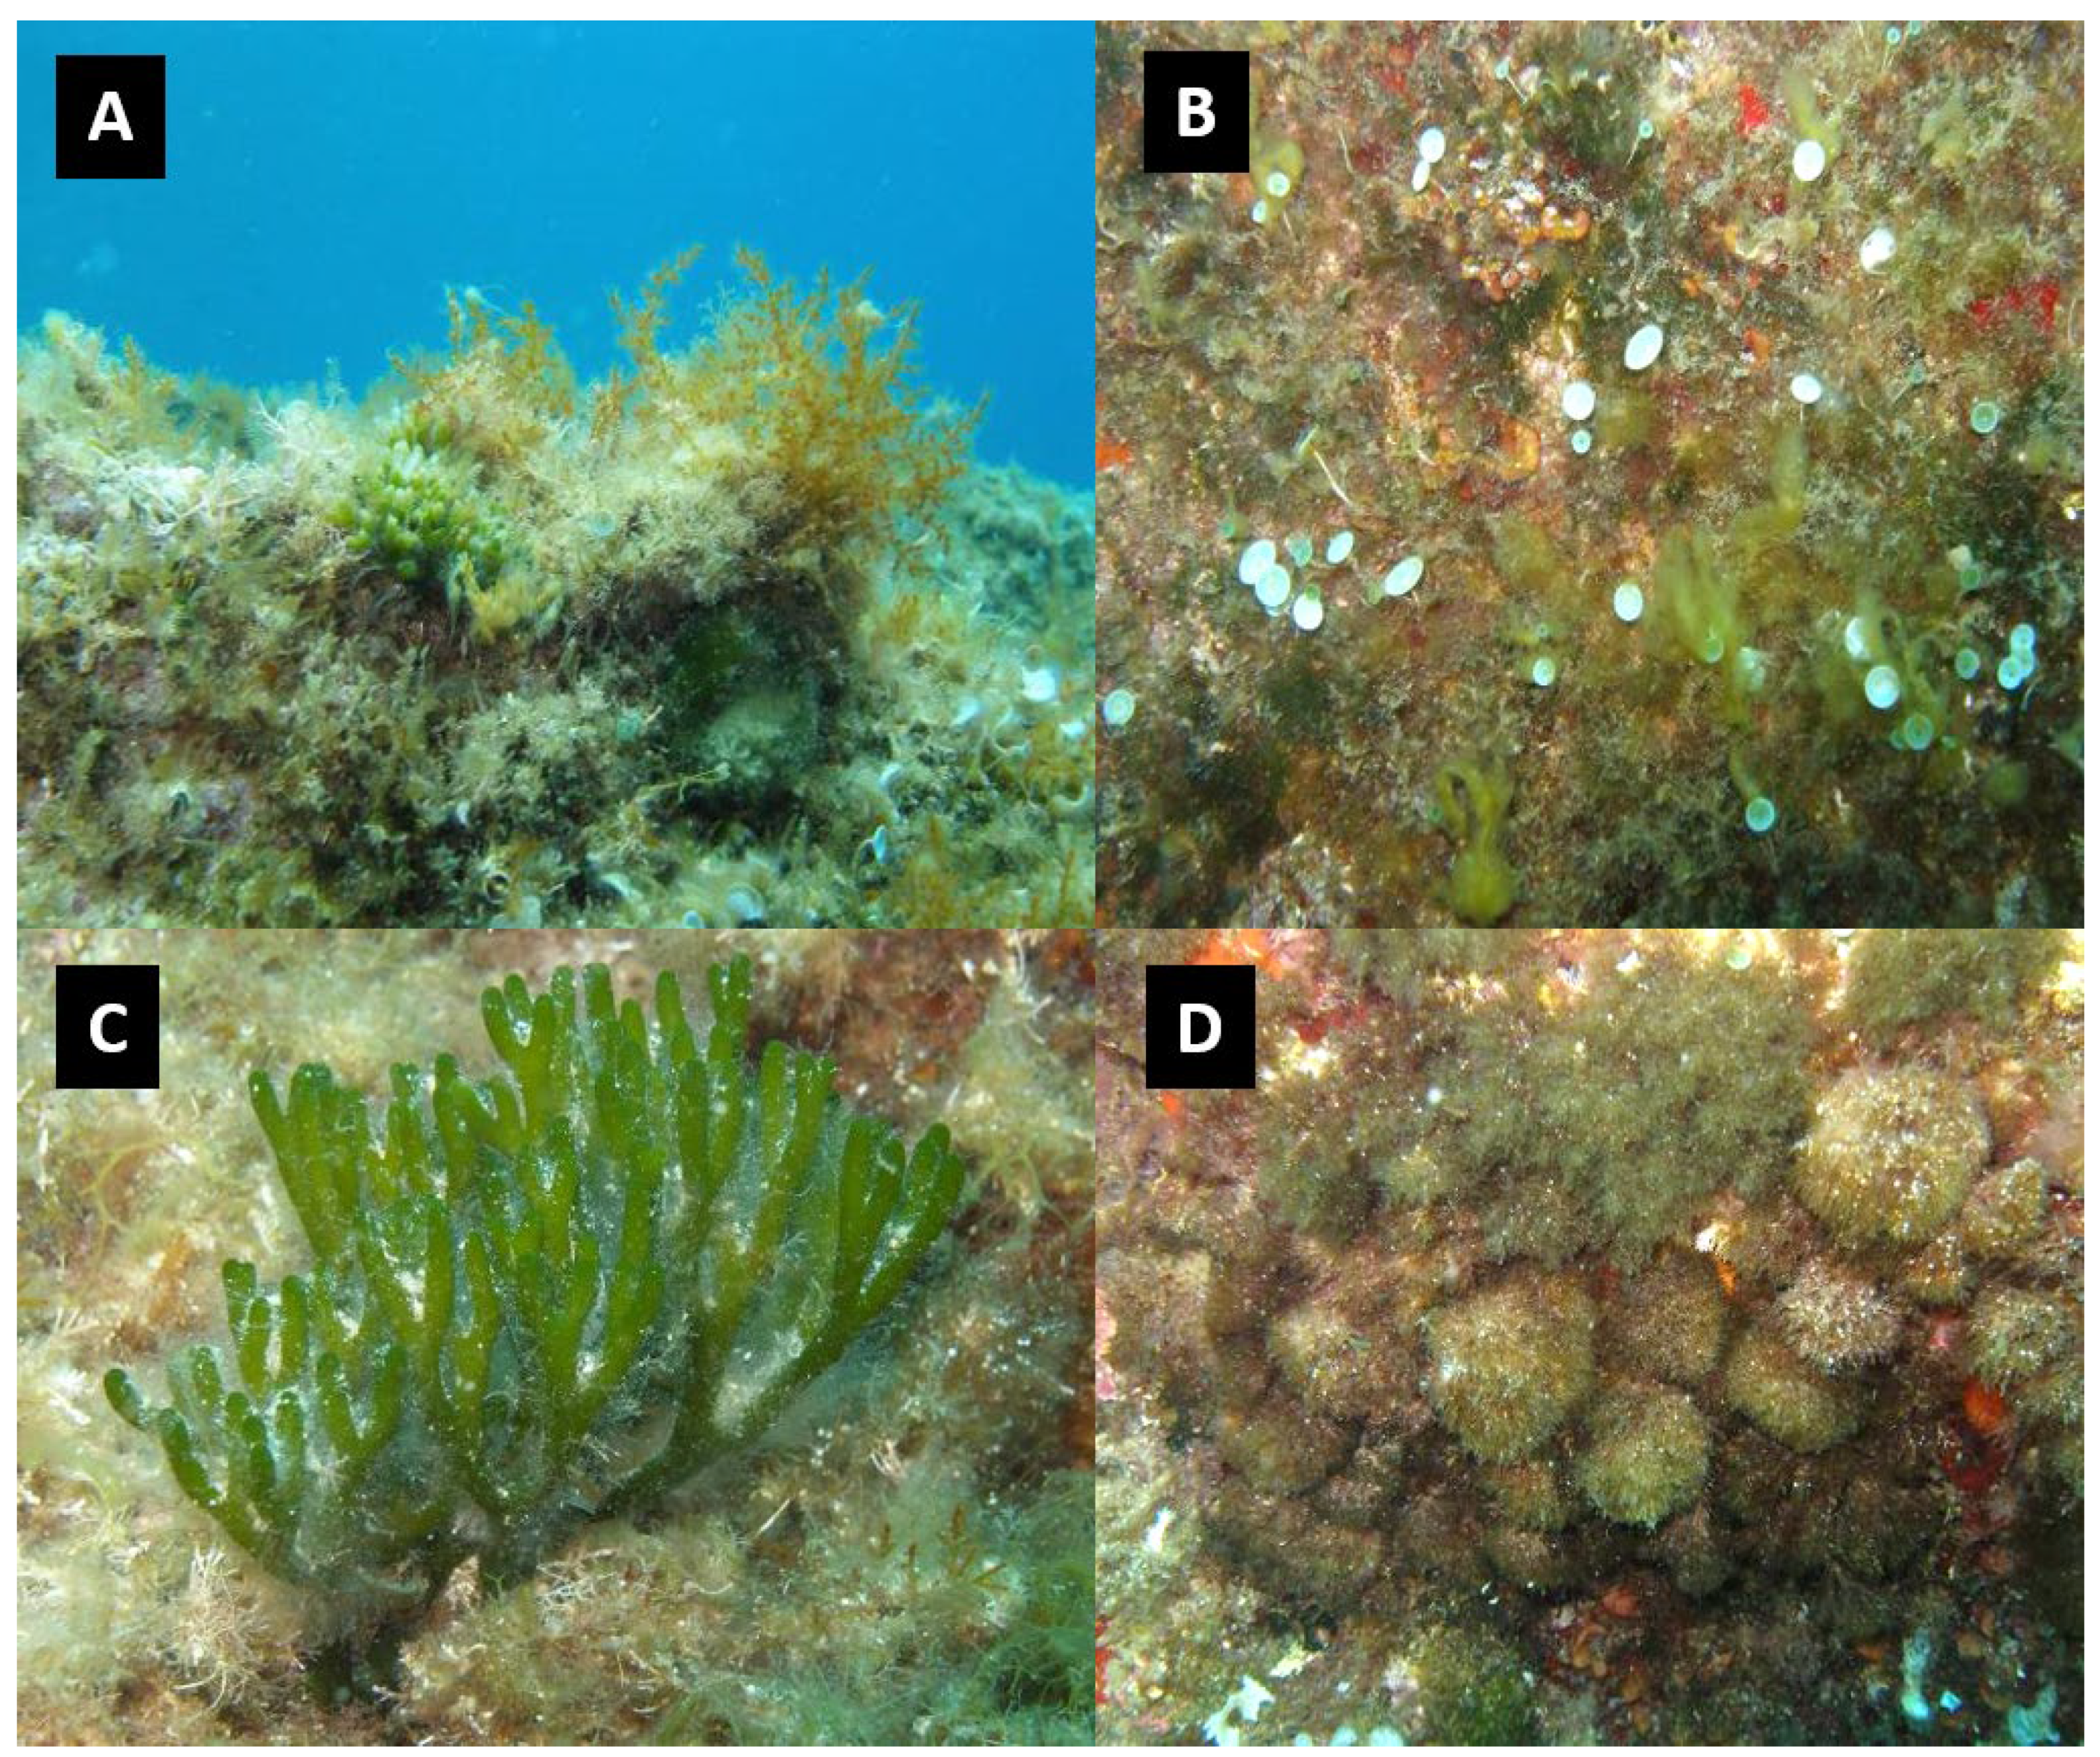
Figure 5.
Species richness throughout the year. “Ph” and “Sc” indicate the photophilous and sciophilous communities, respectively, while “F” refers to the fine fraction and “C” to the coarse fraction.
Figure 5.
Species richness throughout the year. “Ph” and “Sc” indicate the photophilous and sciophilous communities, respectively, while “F” refers to the fine fraction and “C” to the coarse fraction.

Figure 6.
Number of individuals collected throughout the year. “Ph” and “Sc” indicate the photophilous and sciophilous habitats, respectively, while F refers to the fine fraction and C to the coarse fraction. Due to the low number of specimens in the coarse fraction, individuals from both habitats are grouped together.
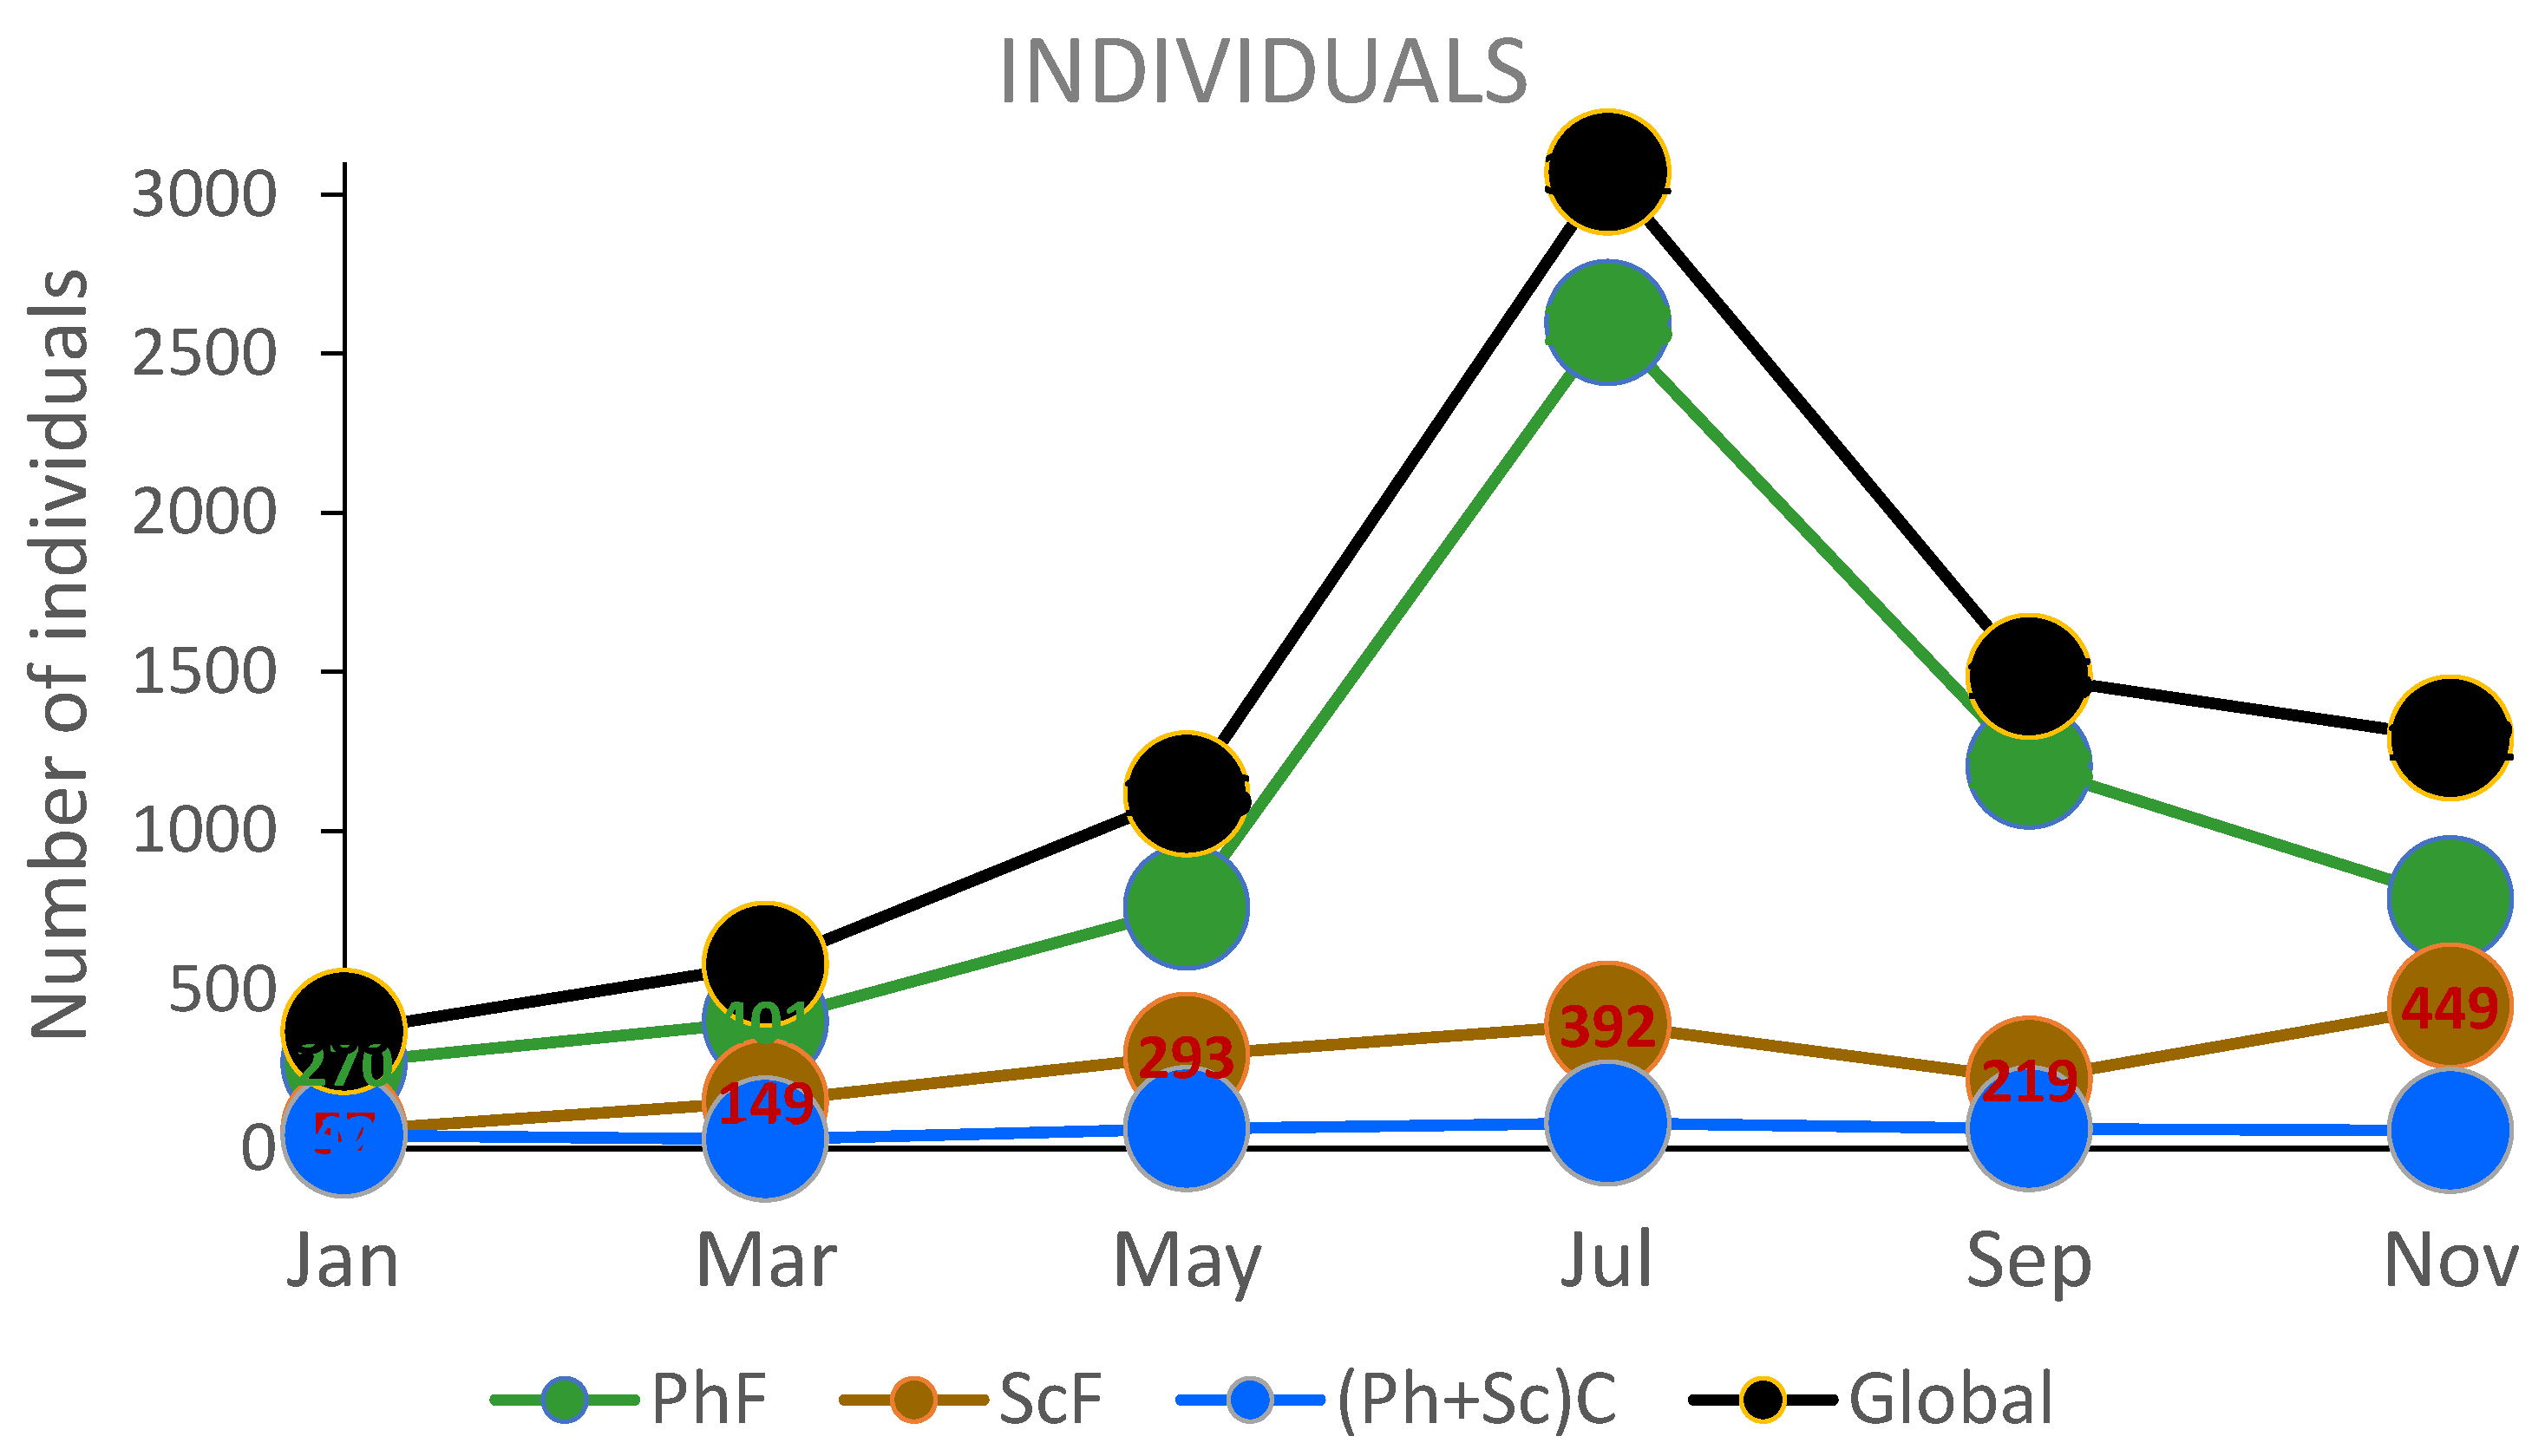
Figure 7.
Shannon diversity index throughout the year. “Ph” and “Sc” refer to the photophilous and sciophilous habitats, respectively, while “F” refers to the fine fraction and “C” to the coarse fraction.
Figure 7.
Shannon diversity index throughout the year. “Ph” and “Sc” refer to the photophilous and sciophilous habitats, respectively, while “F” refers to the fine fraction and “C” to the coarse fraction.
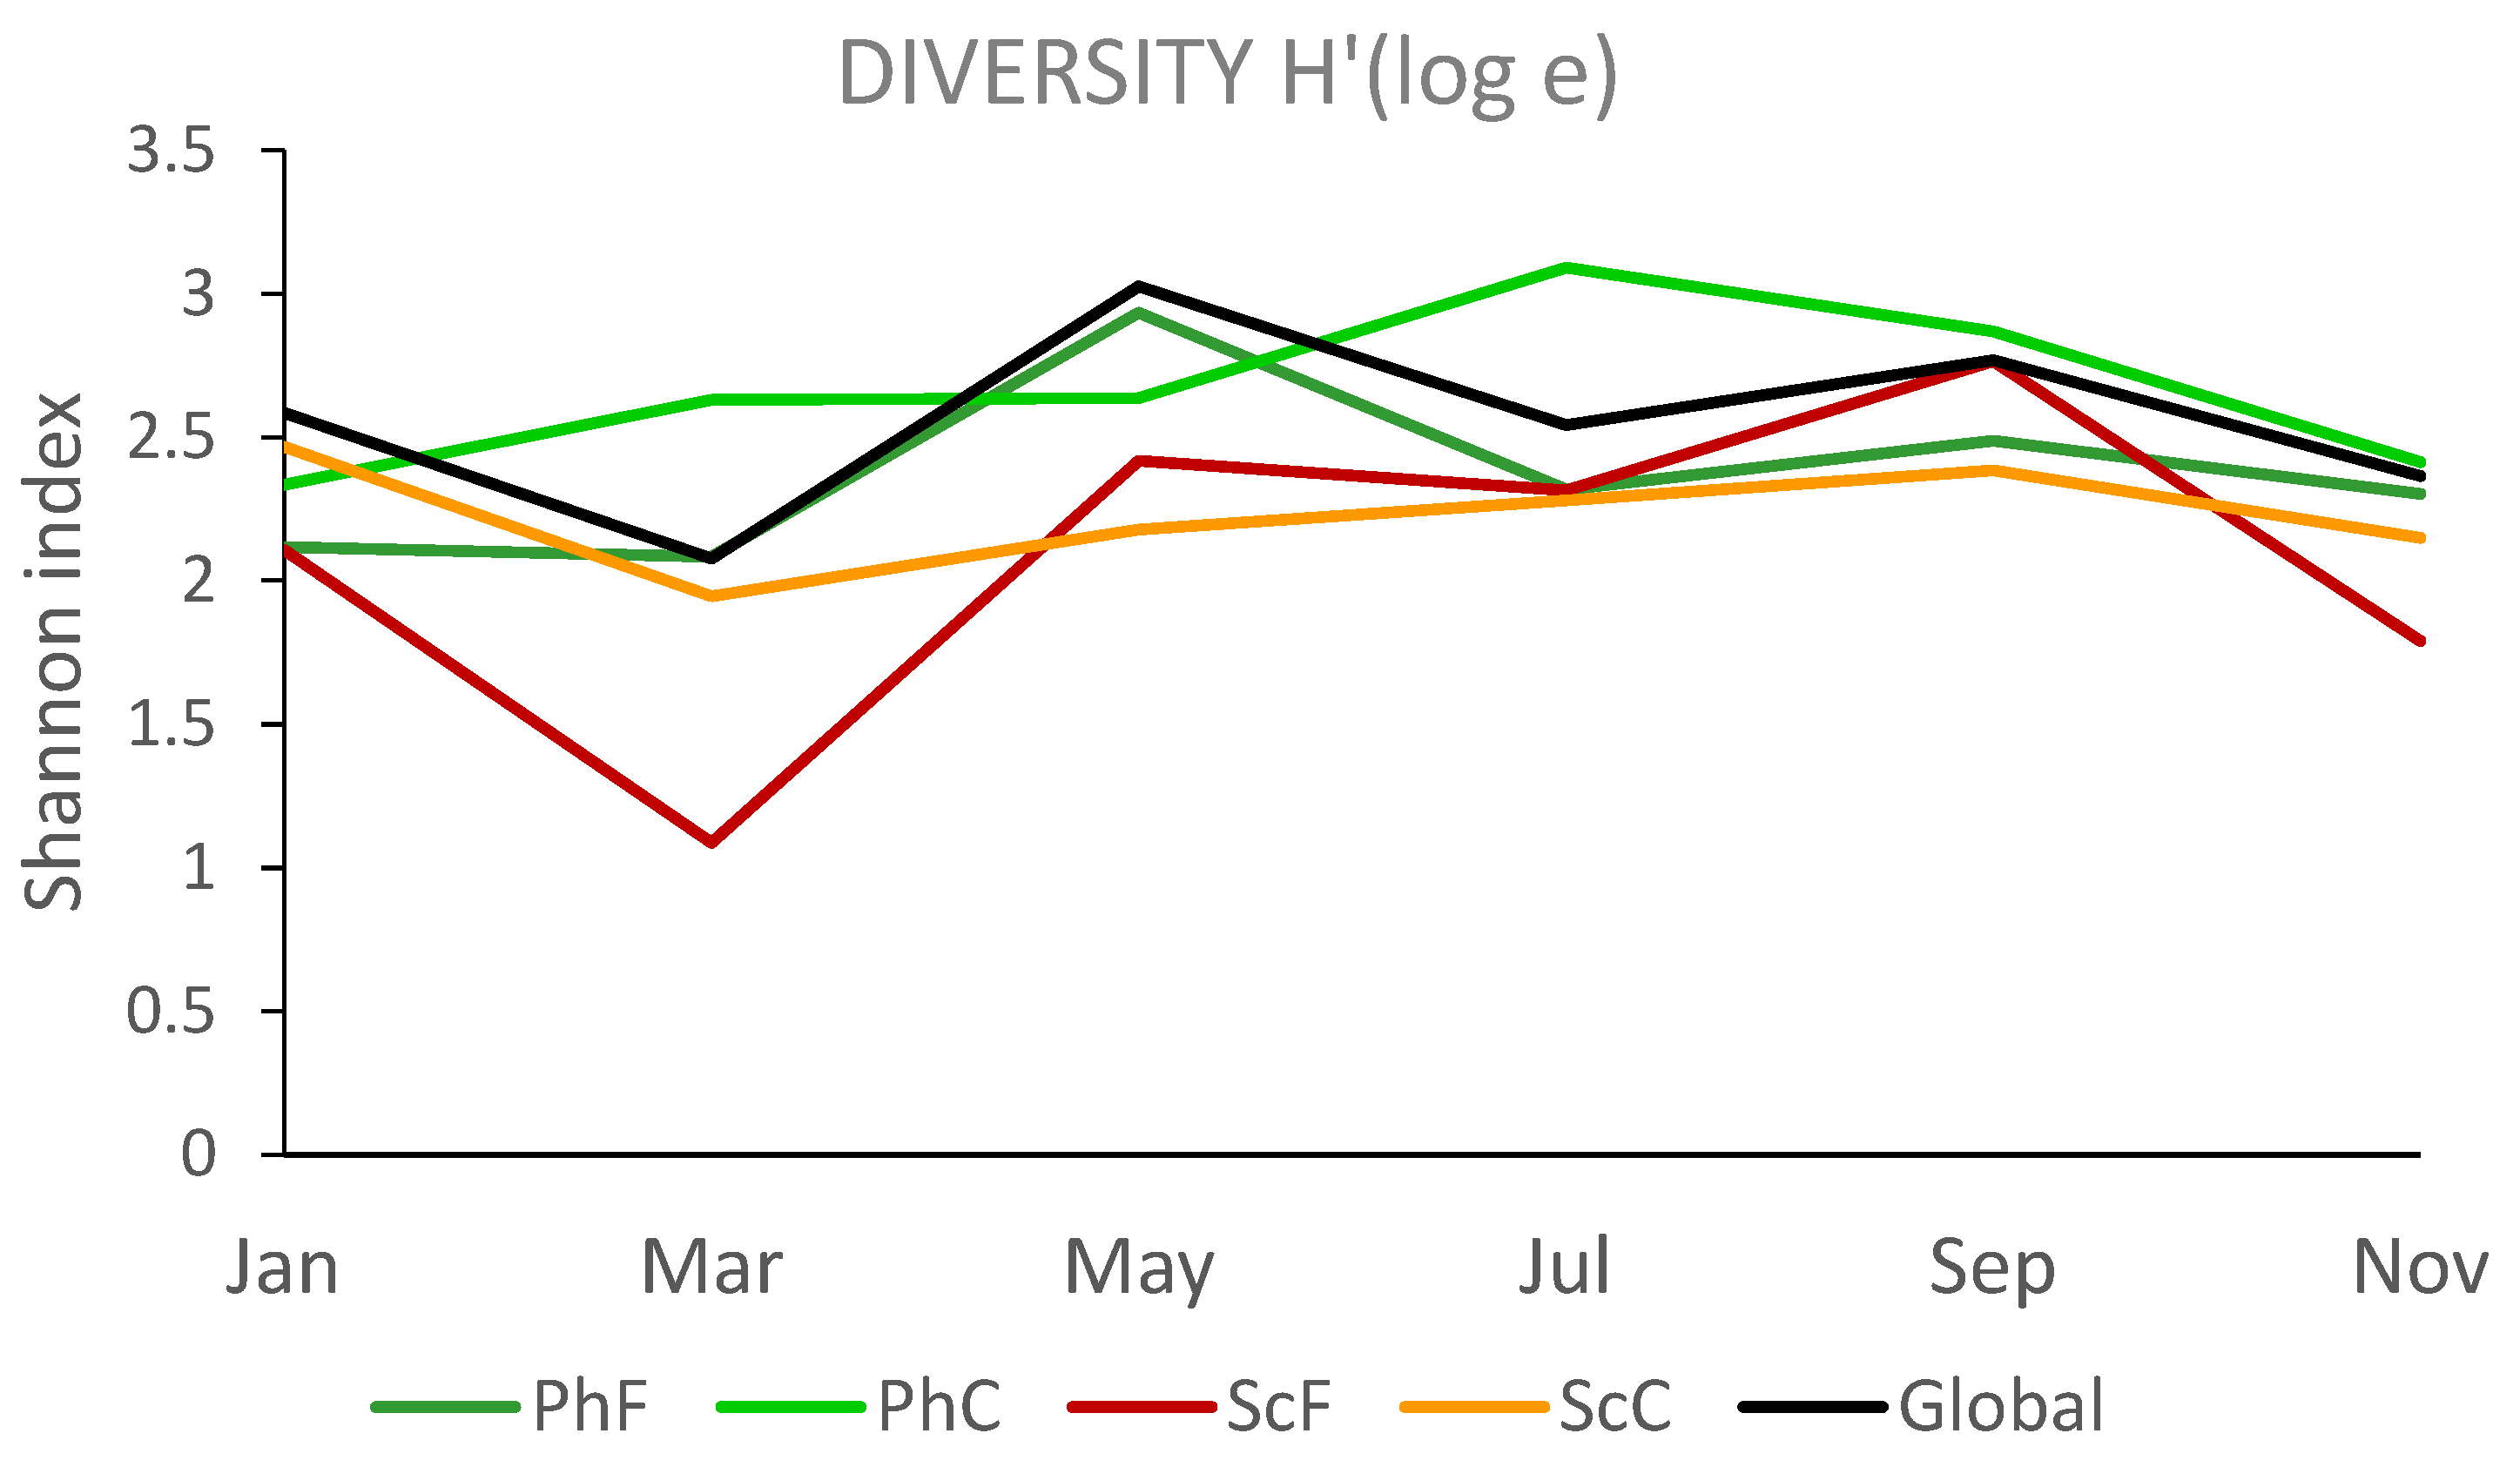
Figure 8.
Pielou's evenness index throughout the year. “Ph” and “Sc” indicate the photophilous and sciophilous habitats, respectively, while “F” refers to the fine fraction and “C” to the coarse fraction.
Figure 8.
Pielou's evenness index throughout the year. “Ph” and “Sc” indicate the photophilous and sciophilous habitats, respectively, while “F” refers to the fine fraction and “C” to the coarse fraction.
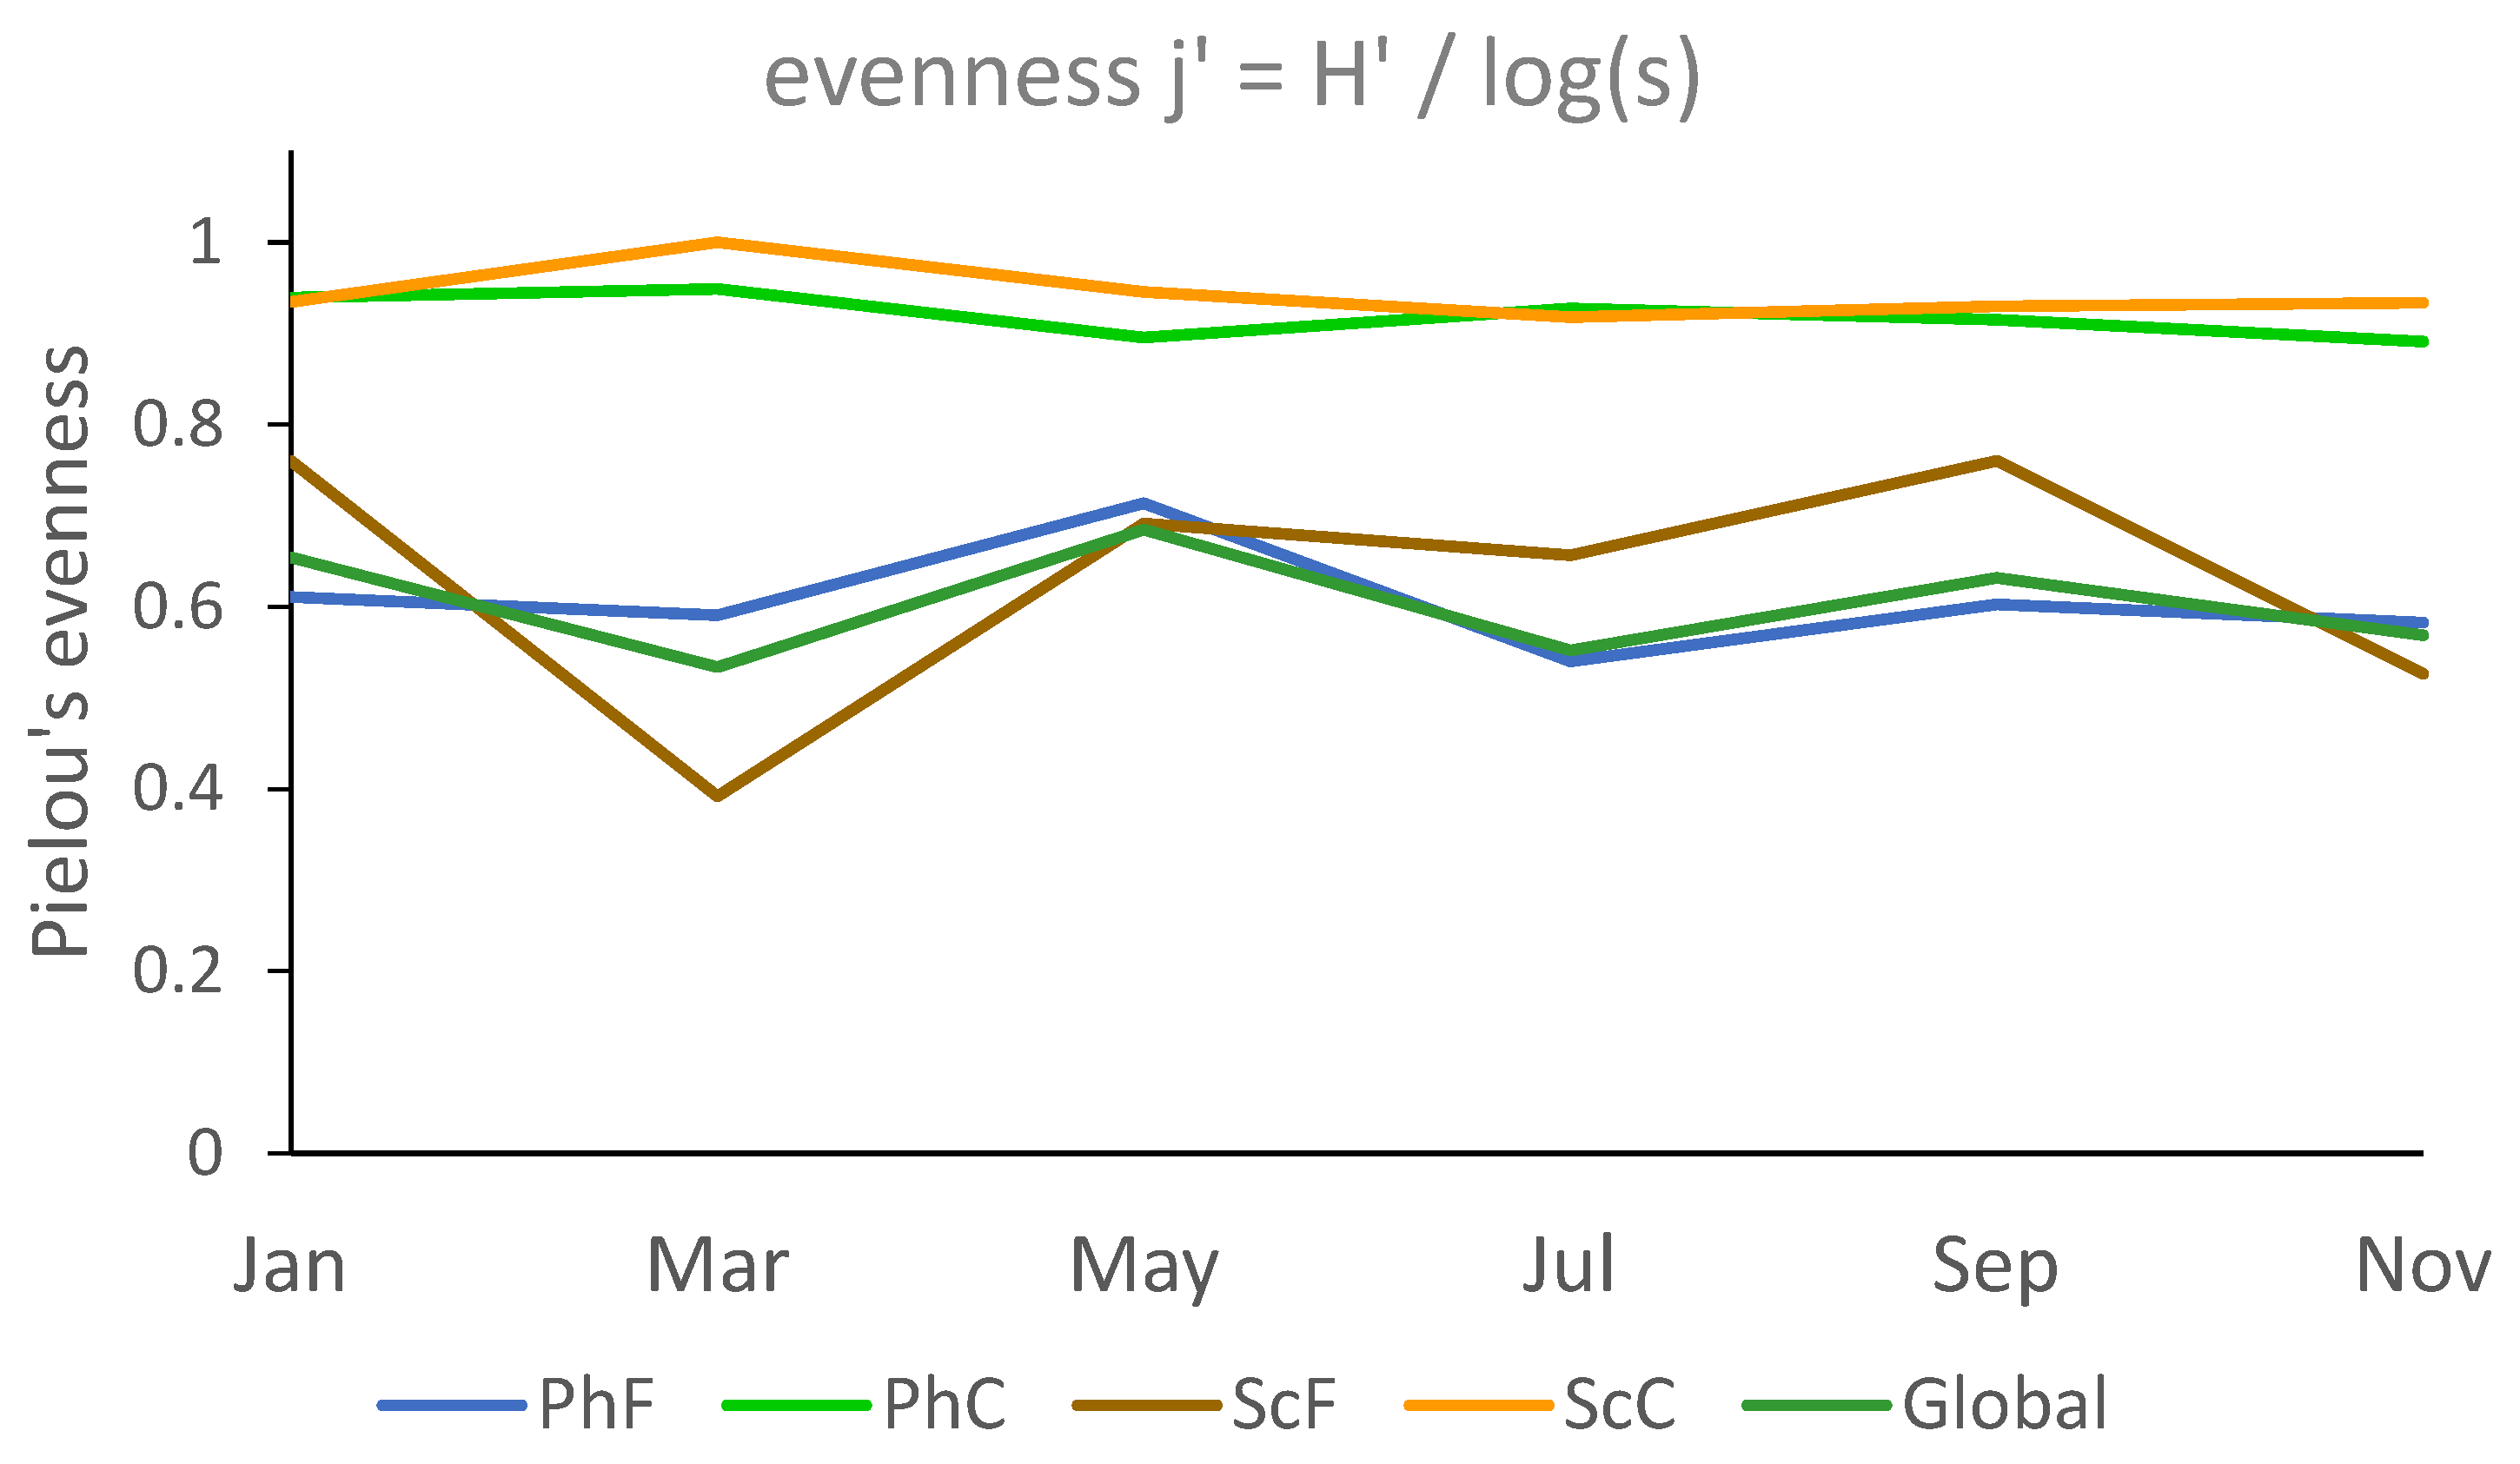
Figure 11.
NMDS representation of the sample sites according to trophic categories. Clusters are represented by ellipsoids and were obtained by applying the UPGMA method, with significant branches verified using the SIMPROF test (α=5%). “Ph” and “Sc” indicate photophilous and sciophilous habitats, respectively, while “F” refers to the fine fraction and “C” to the coarse fraction. The segments represent the correlation between species and axes, and the circle delimits maximum correlation (-1 to 1). Trophic categories: herbivore (HE), filter feeder (F), surface depot feeder (SDF), carnivore (C), scavenger (SC), ectoparasite (EC), unknown (UN).
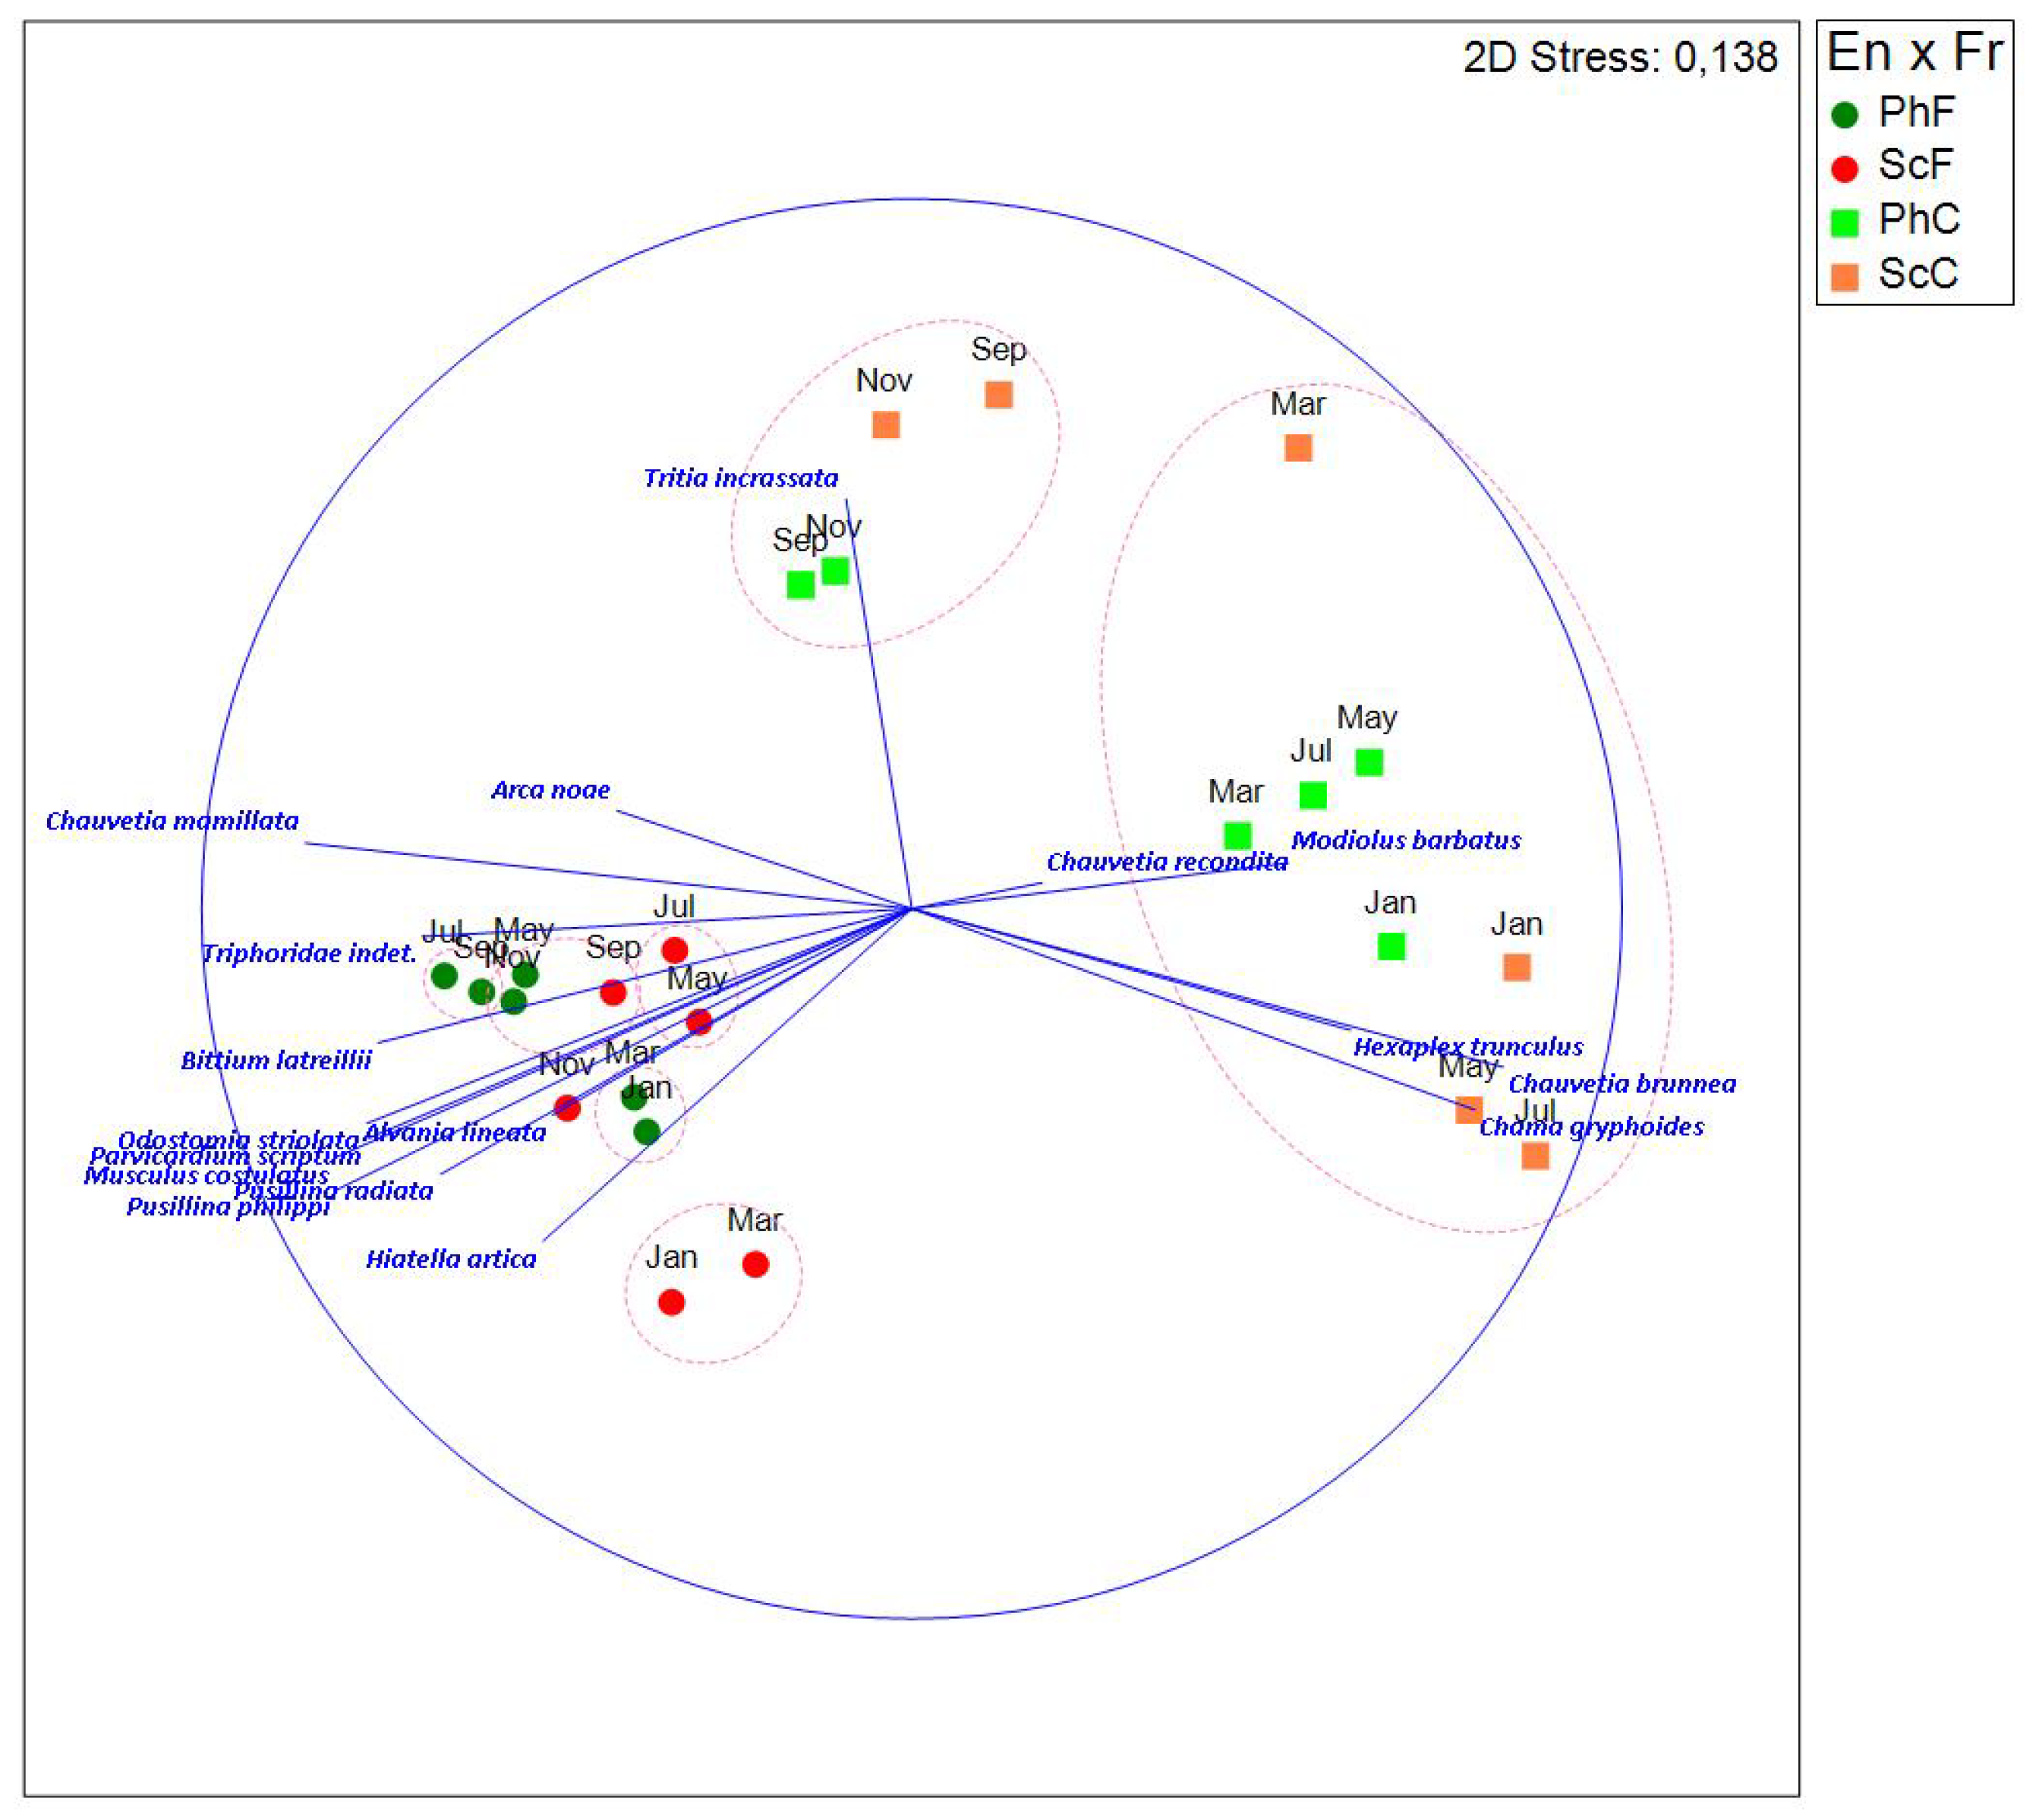
Figure 12.
Bar chart of community composition according to trophic categories for each sample site and month. Abundances were previously fourth-root transformed. “Ph” and “Sc” indicate photophilous and sciophilous habitat respectively, while “F” refers to the fine fraction and “C” to the coarse fraction. Trophic categories: herbivore (HE), filter feeder (F), surface depot feeder (SDF), carnivore (C), scavenger (SC), ectoparasite (EC), unknown (UN).
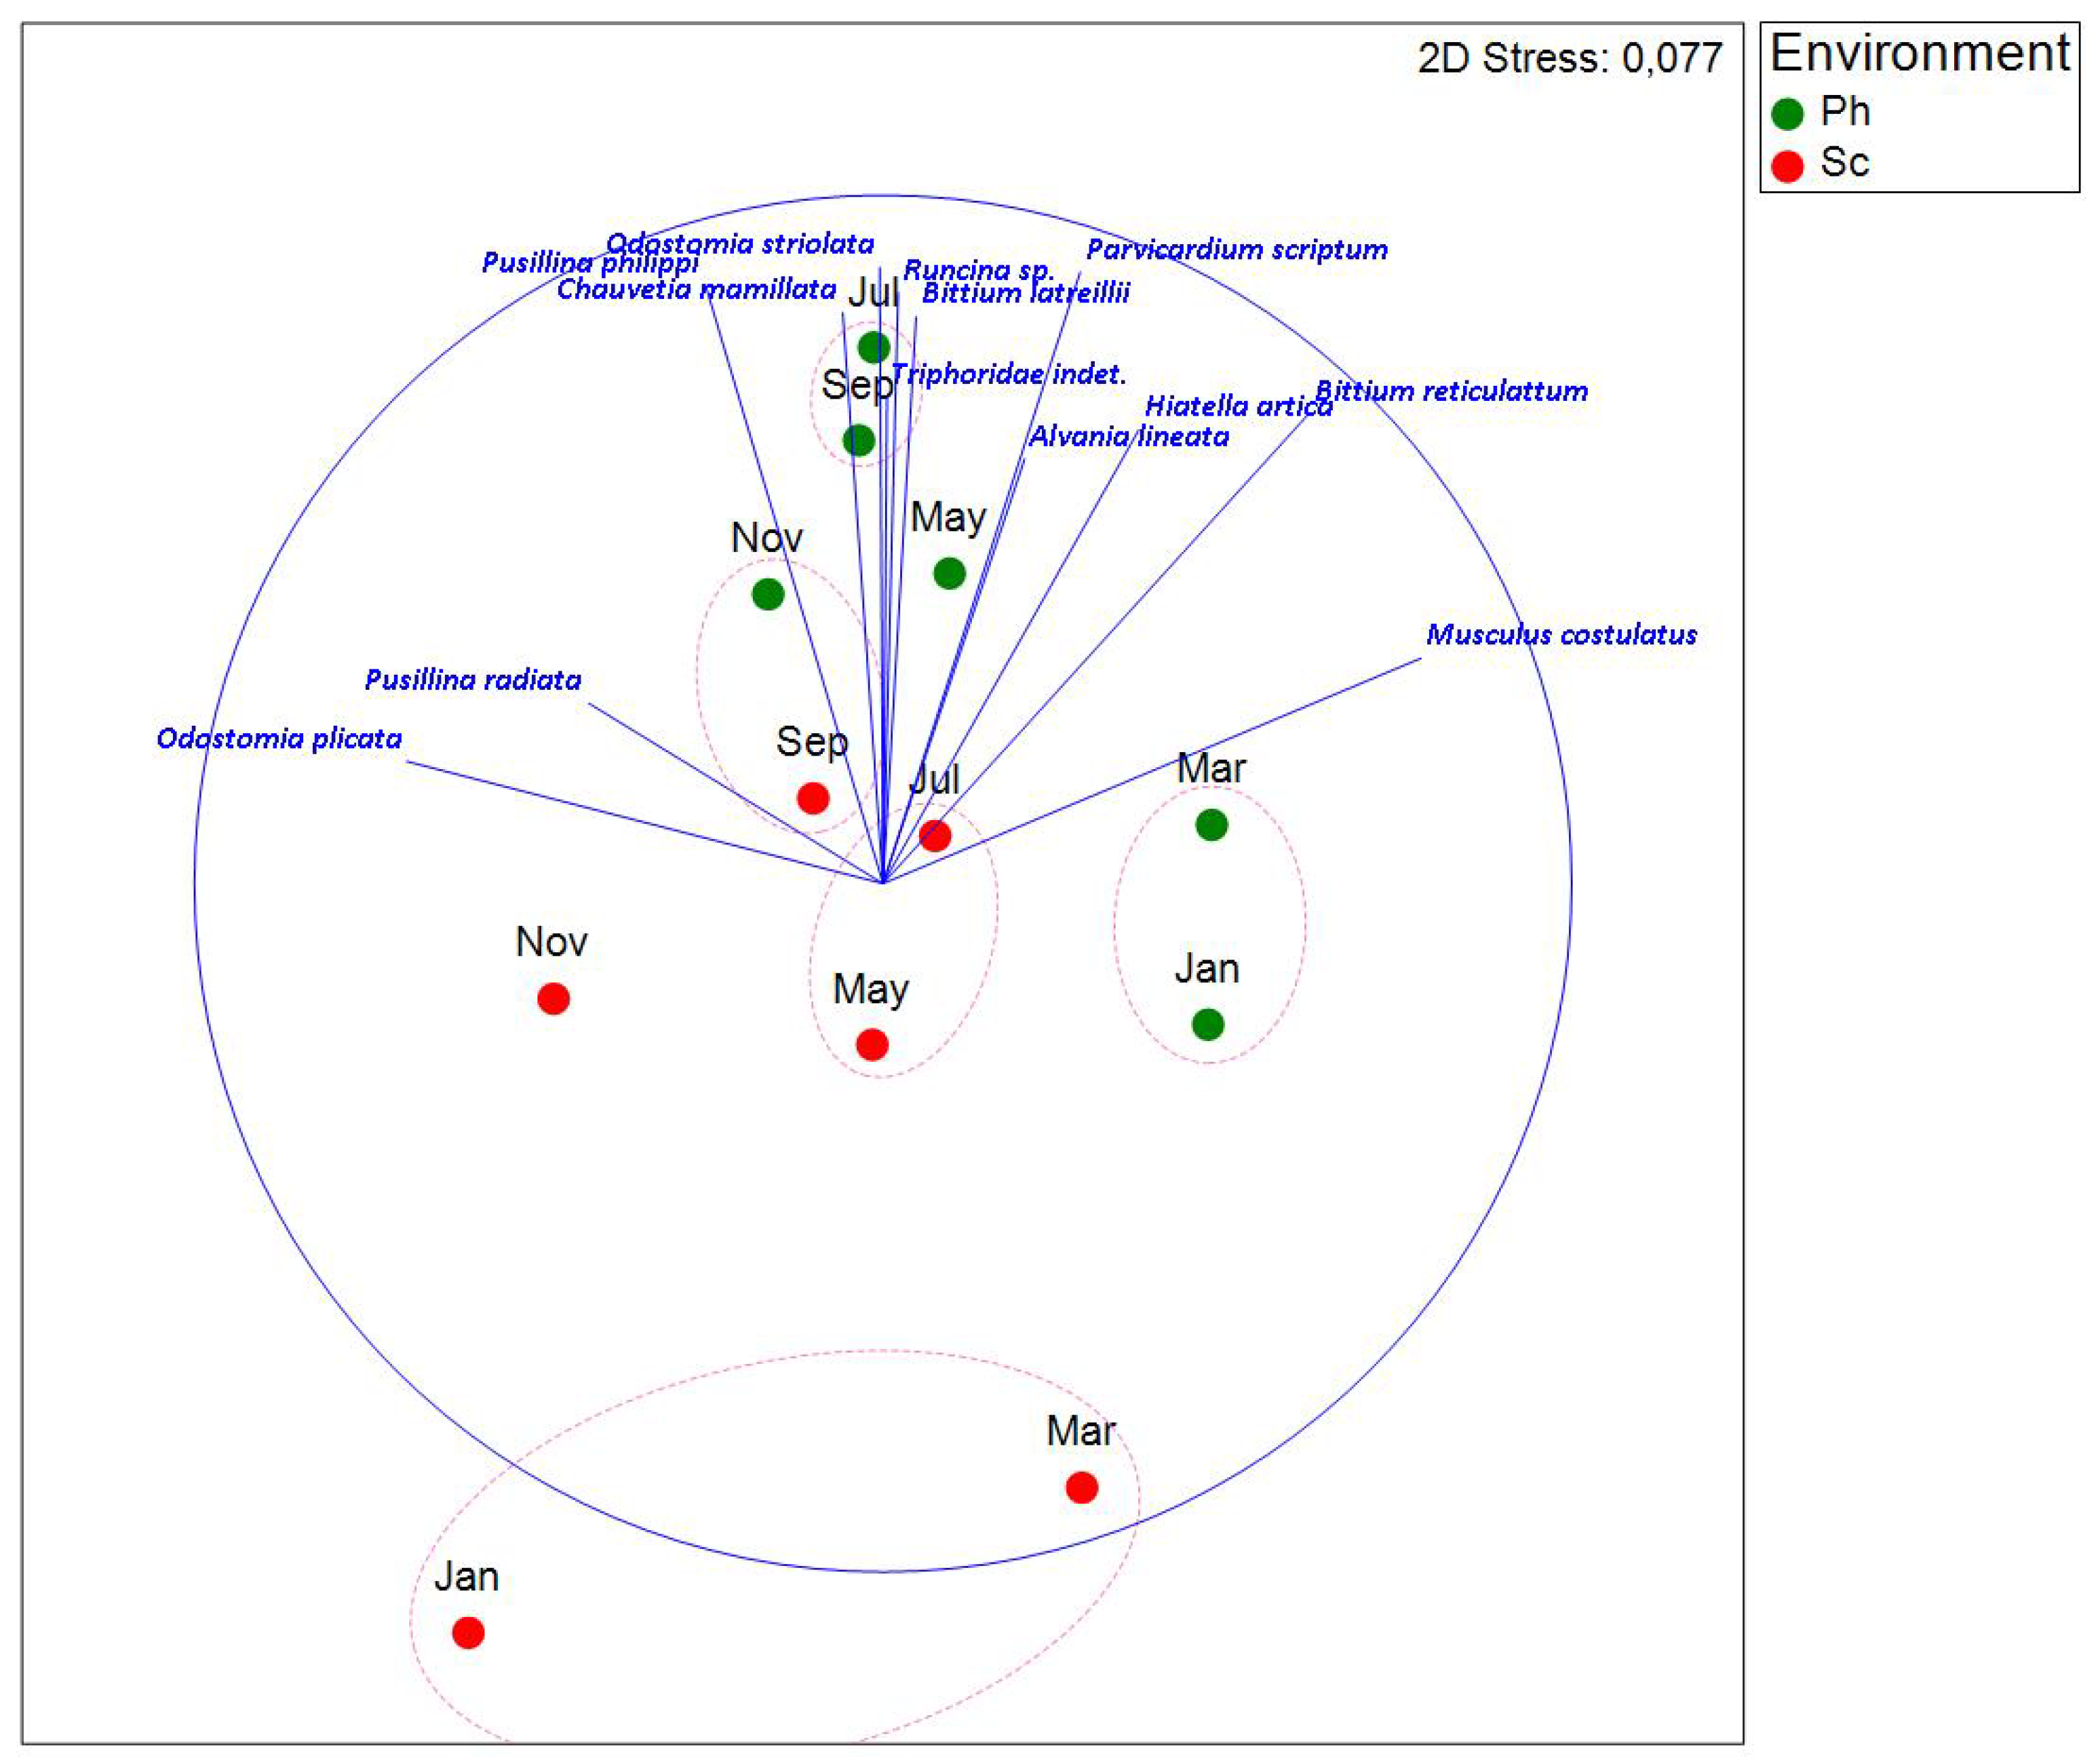
Figure 9.
NMDS representation of the sample sites. Clusters are represented by ellipsoids, which were obtained using the UPGMA method, with significant branches verified by the SIMPROF test (α=5%). “Ph” and “Sc” indicate photophilous and sciophilous habitats, respectively, while “F” refers to the fine fraction and “C” to the coarse fraction. The segments represent the correlation between species and the axes, and the circle delineates the maximum correlation range (-1 to 1). For each environment, fraction, and month, species contributing at least 5% to the similarity (based on SIMPER analysis) were selected.
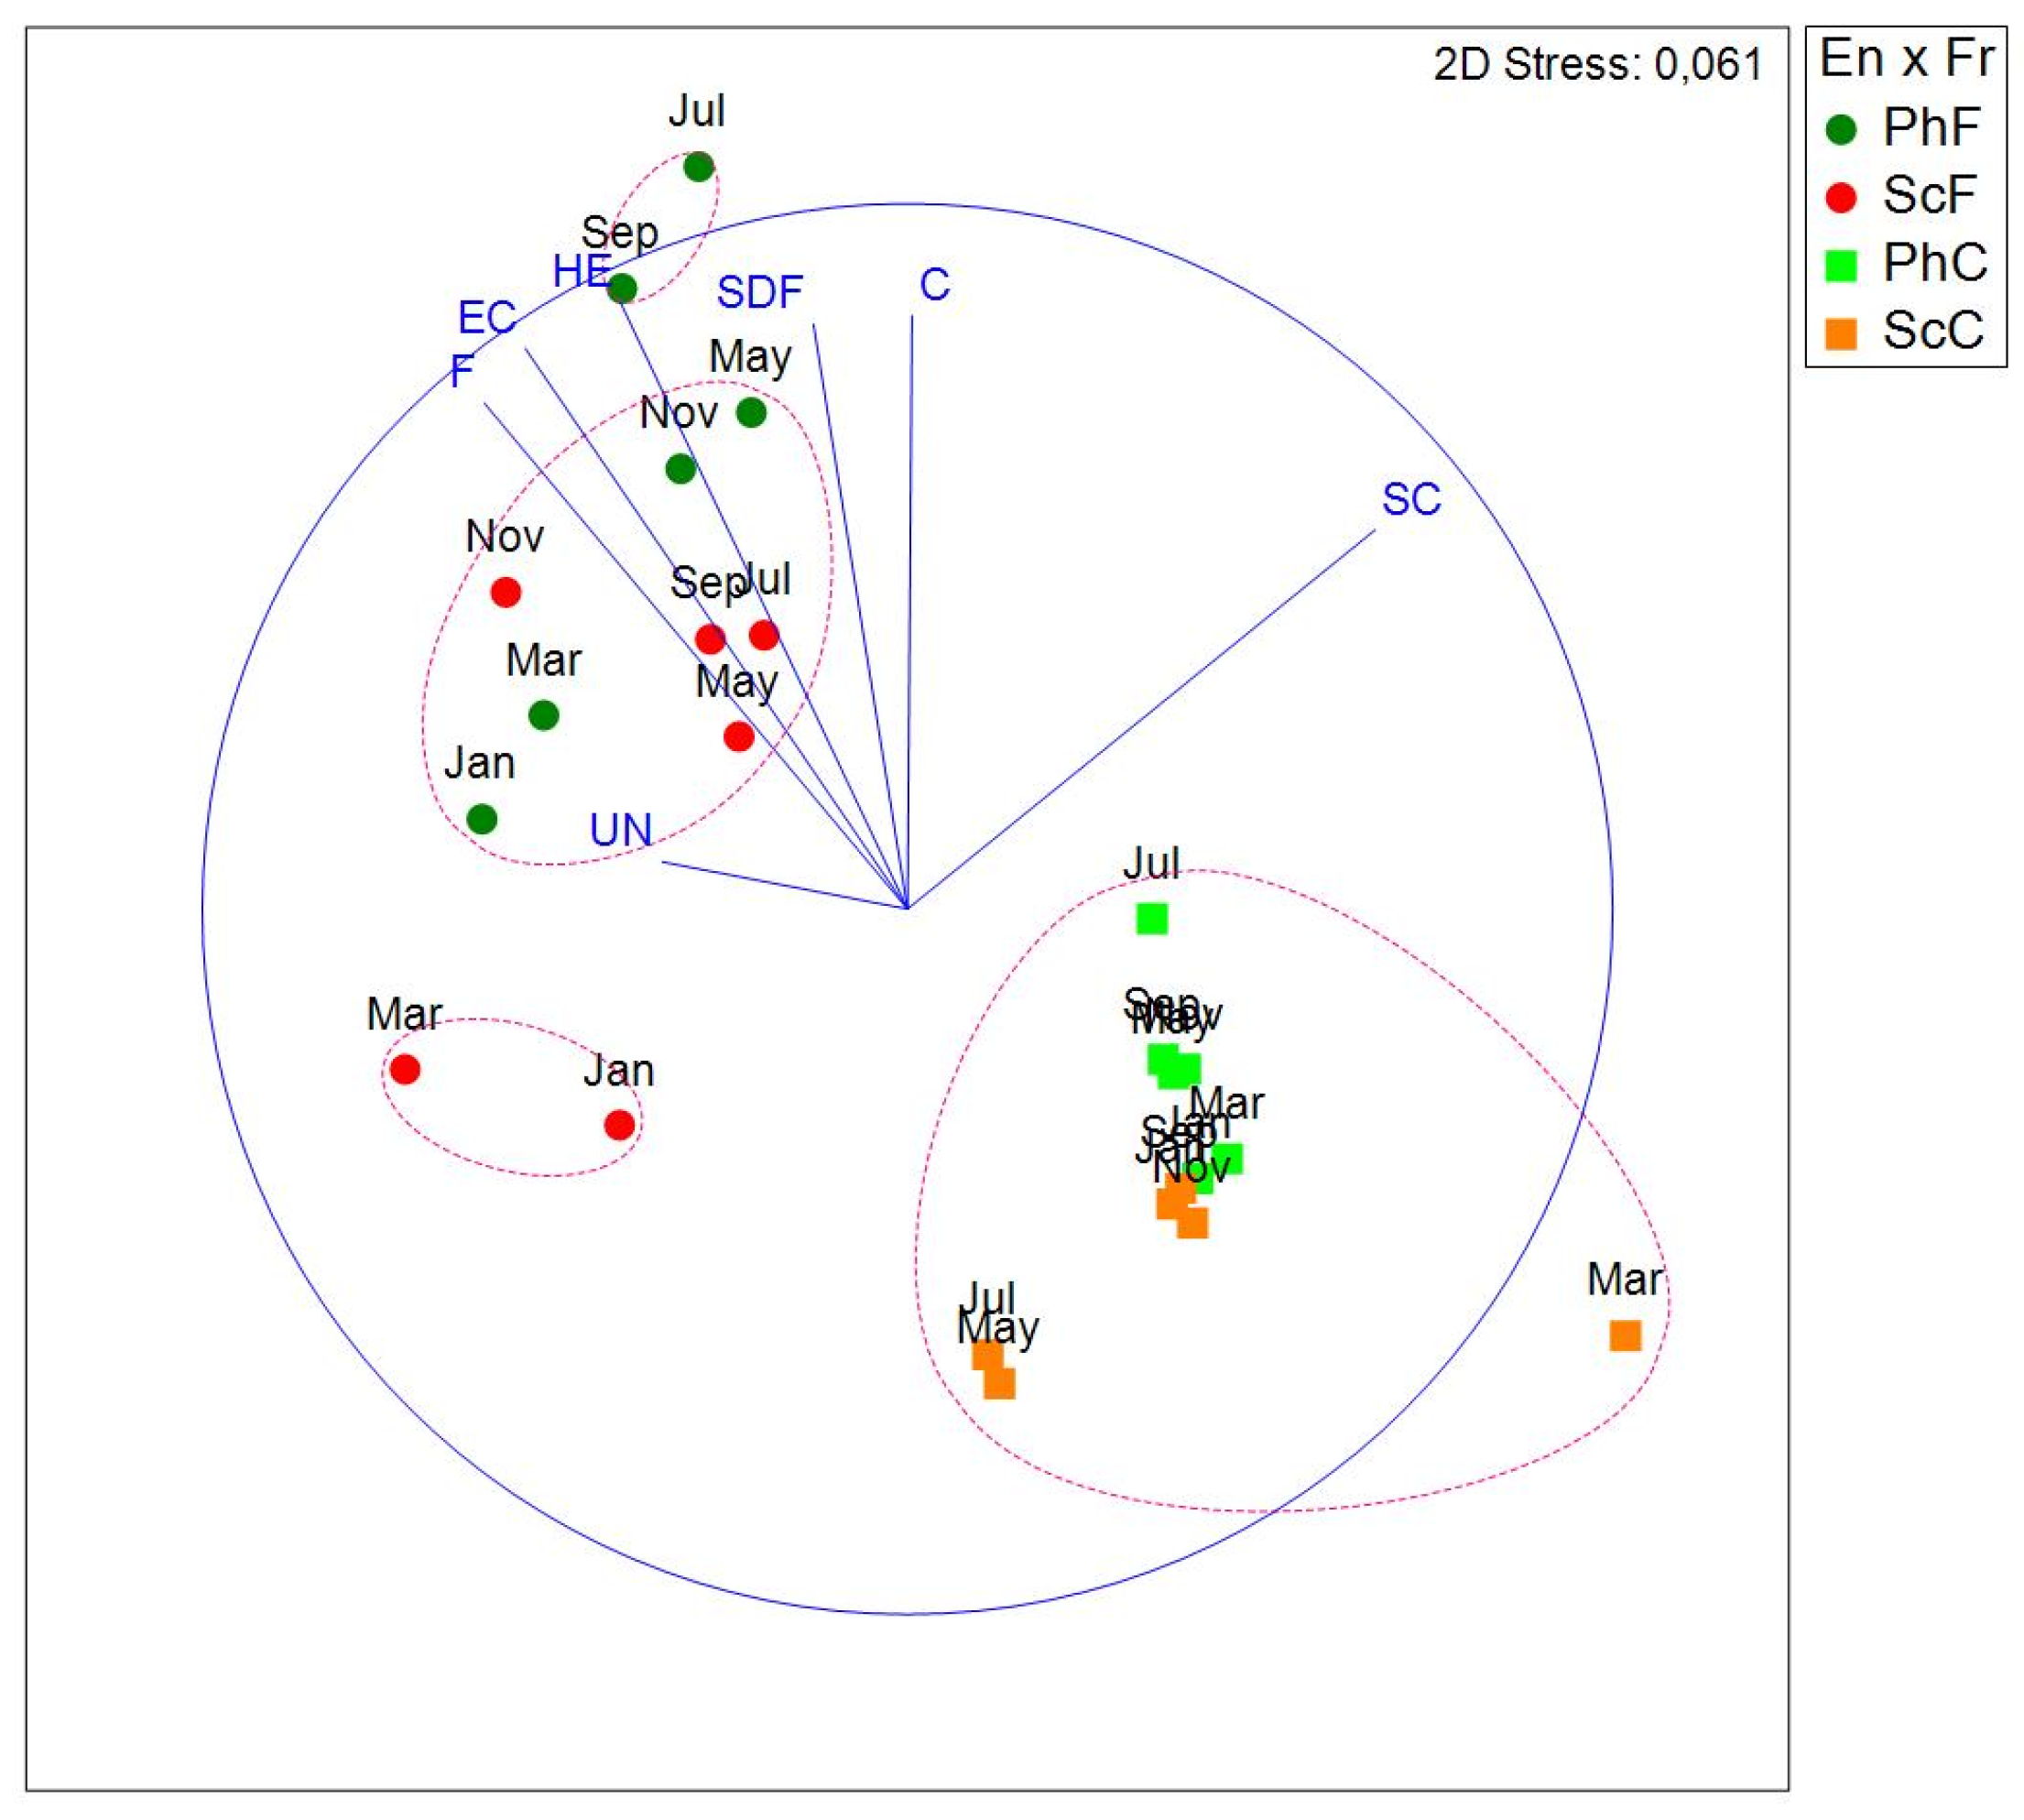
Figure 10.
NMDS representation of fine fraction data. Clusters are represented by ellipsoids and have been obtained by applying the UPGMA method and checking significant branches with the SIMPROF test (α=5%). “Ph” and “Sc” indicate photophilous and sciophilous environment respectively. The segments represent the correlation between species and axes, with the circle delimiting maximum correlation (-1 to 1). For each environment and month, species contributing at least 5% to the similarity (based on SIMPER analysis) were selected.
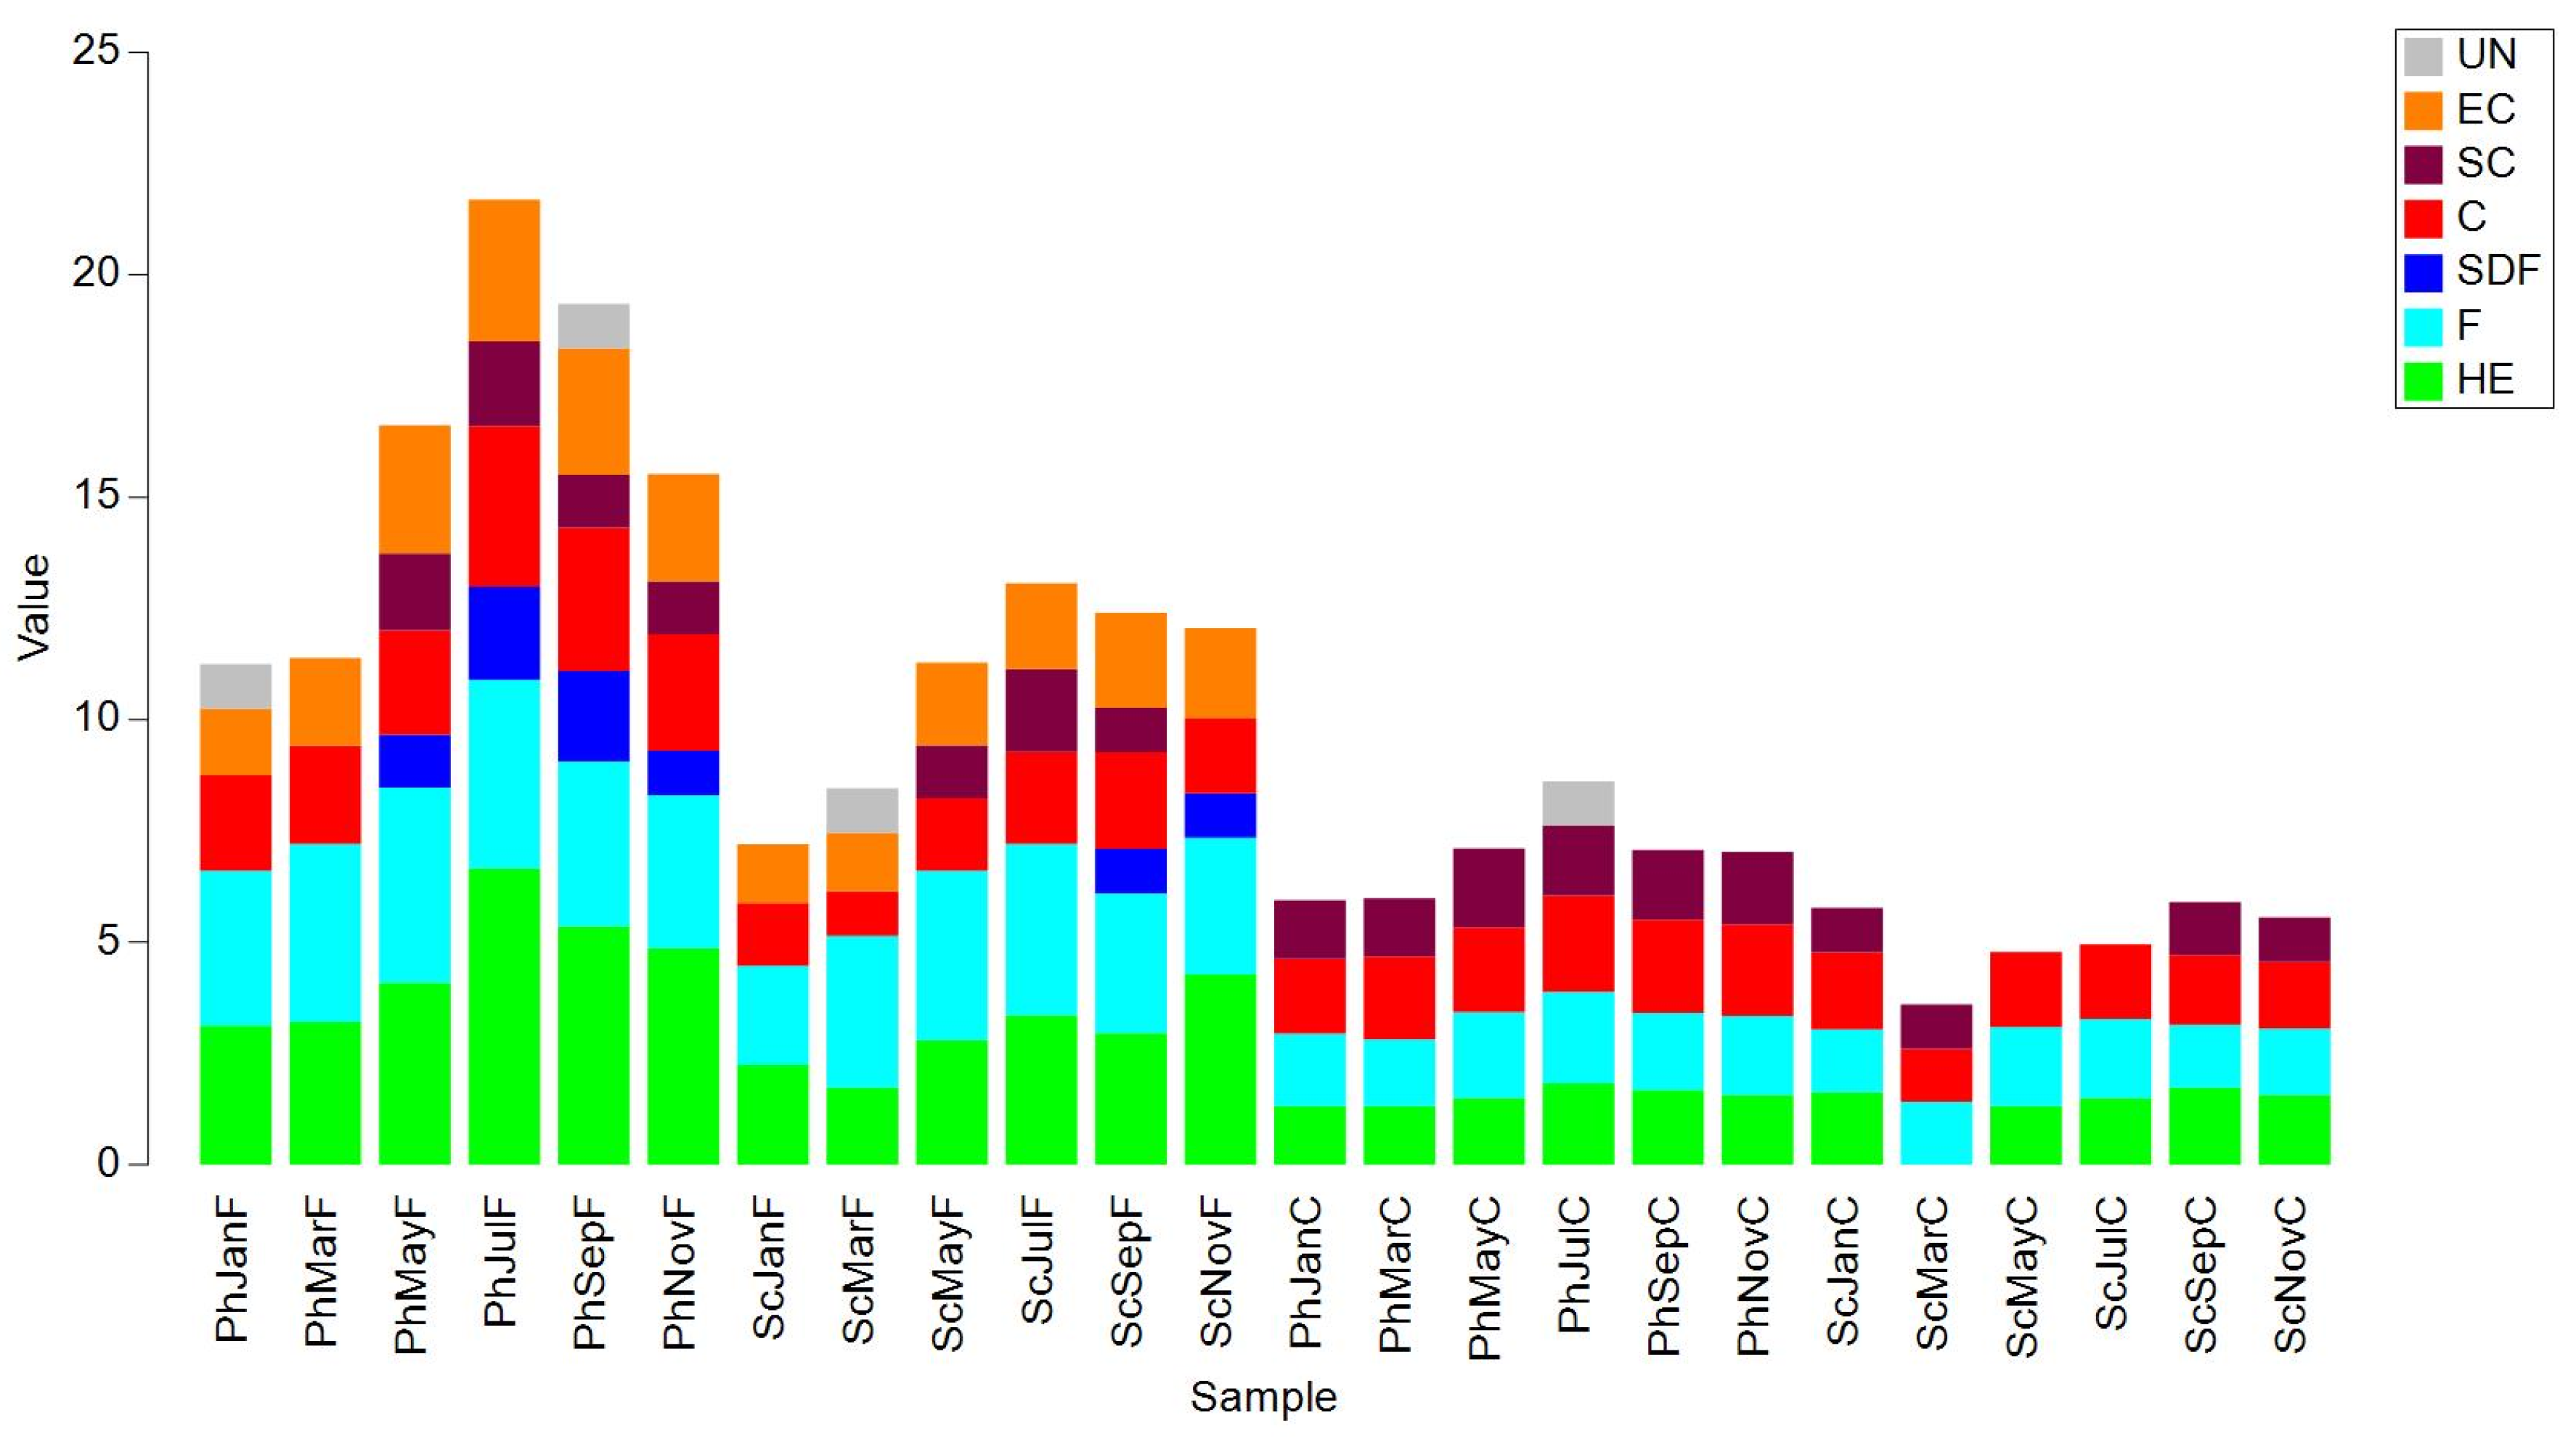
Table 2.
Results of SIMPER analysis, detailing the species that contribute to similarities within En x Fr groups (i.e. PhF, PhC, ScF and ScC) and months. Cut-off points of 80% for similarity and 50% for dissimilarity were applied. For the months, only the average dissimilarities between En x Fr groups are listed.
| PhF (photophilous, fine fraction) Average similarity: 60,28 | |||||||||||||||||||||||||||||||||||||||||||||||||||||||||
| Species | Av.Abund | Av.Sim | Sim/SD | Contrib% | Cum.% | ||||||||||||||||||||||||||||||||||||||||||||||||||||
| Musculus costulatus | 2,50 | 6,53 | 1,65 | 10,83 | 10,83 | ||||||||||||||||||||||||||||||||||||||||||||||||||||
| Bittium latreillii | 2,49 | 4,51 | 1,91 | 7,49 | 18,31 | ||||||||||||||||||||||||||||||||||||||||||||||||||||
| Pusillina philippi | 2,09 | 4,30 | 2,03 | 7,13 | 25,45 | ||||||||||||||||||||||||||||||||||||||||||||||||||||
| Chauvetia mamillata | 1,46 | 3,51 | 2,42 | 5,83 | 31,27 | ||||||||||||||||||||||||||||||||||||||||||||||||||||
| Hiatella arctica | 1,71 | 3,51 | 1,79 | 5,82 | 37,09 | ||||||||||||||||||||||||||||||||||||||||||||||||||||
| Parvicardium scriptum | 1,40 | 2,76 | 2,14 | 4,58 | 41,67 | ||||||||||||||||||||||||||||||||||||||||||||||||||||
| Odostomia striolata | 1,43 | 2,38 | 1,48 | 3,95 | 45,62 | ||||||||||||||||||||||||||||||||||||||||||||||||||||
| Alvania lineata | 1,28 | 2,12 | 1,21 | 3,52 | 49,14 | ||||||||||||||||||||||||||||||||||||||||||||||||||||
| Aplysia punctata | 1,00 | 2,02 | 1,52 | 3,36 | 52,50 | ||||||||||||||||||||||||||||||||||||||||||||||||||||
| Bittium reticulatum | 1,17 | 1,96 | 0,85 | 3,26 | 55,76 | ||||||||||||||||||||||||||||||||||||||||||||||||||||
| Pusillina radiata | 1,25 | 1,87 | 0,71 | 3,09 | 58,85 | ||||||||||||||||||||||||||||||||||||||||||||||||||||
| Alvania cancellata | 0,82 | 1,35 | 0,94 | 2,23 | 61,08 | ||||||||||||||||||||||||||||||||||||||||||||||||||||
| Clanculus cruciatus | 1,05 | 1,31 | 1,05 | 2,17 | 63,25 | ||||||||||||||||||||||||||||||||||||||||||||||||||||
| Striarca lactea | 0,87 | 1,29 | 0,98 | 2,14 | 65,39 | ||||||||||||||||||||||||||||||||||||||||||||||||||||
| Rissoella diaphana | 1,04 | 1,25 | 0,77 | 2,07 | 67,46 | ||||||||||||||||||||||||||||||||||||||||||||||||||||
| Runcina sp. | 0,77 | 1,13 | 0,81 | 1,87 | 69,33 | ||||||||||||||||||||||||||||||||||||||||||||||||||||
| Vitreolina perminima | 0,95 | 1,09 | 0,79 | 1,82 | 71,15 | ||||||||||||||||||||||||||||||||||||||||||||||||||||
| Ammonicera fischeriana | 0,84 | 1,08 | 0,86 | 1,79 | 72,93 | ||||||||||||||||||||||||||||||||||||||||||||||||||||
| Modiolula phaseolina | 0,93 | 1,06 | 0,82 | 1,77 | 74,70 | ||||||||||||||||||||||||||||||||||||||||||||||||||||
| Triphoridae indet. | 0,88 | 0,93 | 0,76 | 1,55 | 76,25 | ||||||||||||||||||||||||||||||||||||||||||||||||||||
| Arca noae | 0,77 | 0,91 | 0,79 | 1,51 | 77,76 | ||||||||||||||||||||||||||||||||||||||||||||||||||||
| Jujubinus ruscurianus | 0,60 | 0,82 | 0,63 | 1,37 | 79,13 | ||||||||||||||||||||||||||||||||||||||||||||||||||||
| Mytilus galloprovincialis | 0,74 | 0,78 | 0,74 | 1,30 | 80,43 | ||||||||||||||||||||||||||||||||||||||||||||||||||||
| ScF (sciophilous, fine fraction) Average similarity: 49,55 | |||||||||||||||||||||||||||||||||||||||||||||||||||||||||
| Species | Av.Abund | Av.Sim | Sim/SD | Contrib% | Cum.% | ||||||||||||||||||||||||||||||||||||||||||||||||||||
| Musculus costulatus | 2,08 | 10,77 | 1,92 | 21,74 | 21,74 | ||||||||||||||||||||||||||||||||||||||||||||||||||||
| Hiatella arctica | 1,43 | 6,83 | 1,52 | 13,78 | 35,52 | ||||||||||||||||||||||||||||||||||||||||||||||||||||
| Pusillina philippi | 1,48 | 5,06 | 1,37 | 10,21 | 45,73 | ||||||||||||||||||||||||||||||||||||||||||||||||||||
| Odostomia striolata | 1,04 | 4,14 | 1,36 | 8,36 | 54,08 | ||||||||||||||||||||||||||||||||||||||||||||||||||||
| Alvania lineata | 0,81 | 3,18 | 0,72 | 6,42 | 60,50 | ||||||||||||||||||||||||||||||||||||||||||||||||||||
| Pusillina radiata | 0,86 | 2,73 | 0,61 | 5,51 | 66,01 | ||||||||||||||||||||||||||||||||||||||||||||||||||||
| Chauvetia mamillata | 0,61 | 1,88 | 0,53 | 3,78 | 69,80 | ||||||||||||||||||||||||||||||||||||||||||||||||||||
| Triphoridae indet. | 0,51 | 1,49 | 0,67 | 3,00 | 72,80 | ||||||||||||||||||||||||||||||||||||||||||||||||||||
| Aequipecten opercularis | 0,48 | 1,47 | 0,67 | 2,97 | 75,77 | ||||||||||||||||||||||||||||||||||||||||||||||||||||
| Odostomia plicata | 0,47 | 1,27 | 0,59 | 2,57 | 78,33 | ||||||||||||||||||||||||||||||||||||||||||||||||||||
| Bittium latreillii | 0,71 | 1,22 | 0,59 | 2,47 | 80,80 | ||||||||||||||||||||||||||||||||||||||||||||||||||||
| PhC (photophilous, coarse fraction) Average similarity: 27,62 | |||||||||||||||||||||||||||||||||||||||||||||||||||||||||
| Species | Av.Abund | Av.Sim | Sim/SD | Contrib% | Cum.% | ||||||||||||||||||||||||||||||||||||||||||||||||||||
| Tritia incrassata | 1,05 | 9,04 | 1,50 | 32,72 | 32,72 | ||||||||||||||||||||||||||||||||||||||||||||||||||||
| Arca noae | 0,52 | 2,88 | 0,58 | 10,43 | 43,16 | ||||||||||||||||||||||||||||||||||||||||||||||||||||
| Chauvetia mamillata | 0,31 | 2,37 | 0,43 | 8,60 | 51,75 | ||||||||||||||||||||||||||||||||||||||||||||||||||||
| Modiolus barbatus | 0,35 | 1,73 | 0,51 | 6,25 | 58,01 | ||||||||||||||||||||||||||||||||||||||||||||||||||||
| Alvania lineata | 0,57 | 1,48 | 0,43 | 5,35 | 63,36 | ||||||||||||||||||||||||||||||||||||||||||||||||||||
| Alvania aspera | 0,23 | 1,17 | 0,43 | 4,24 | 67,60 | ||||||||||||||||||||||||||||||||||||||||||||||||||||
| Cyrillia linearis | 0,33 | 1,15 | 0,33 | 4,17 | 71,76 | ||||||||||||||||||||||||||||||||||||||||||||||||||||
| Chauvetia recondita | 0,13 | 1,08 | 0,24 | 3,90 | 75,66 | ||||||||||||||||||||||||||||||||||||||||||||||||||||
| Triphoridae indet. | 0,23 | 0,88 | 0,34 | 3,20 | 78,86 | ||||||||||||||||||||||||||||||||||||||||||||||||||||
| Chama gryphoides | 0,18 | 0,75 | 0,24 | 2,70 | 81,56 | ||||||||||||||||||||||||||||||||||||||||||||||||||||
| ScC (sciophilous, coarse fraction) Average similarity: 28,56 | |||||||||||||||||||||||||||||||||||||||||||||||||||||||||
| Species | Av.Abund | Av.Sim | Sim/SD | Contrib% | Cum.% | ||||||||||||||||||||||||||||||||||||||||||||||||||||
| Chama gryphoides | 0,47 | 7,68 | 0,83 | 26,89 | 26,89 | ||||||||||||||||||||||||||||||||||||||||||||||||||||
| Alvania lineata | 0,63 | 5,61 | 0,72 | 19,66 | 46,55 | ||||||||||||||||||||||||||||||||||||||||||||||||||||
| Hiatella arctica | 0,39 | 4,23 | 0,56 | 14,81 | 61,36 | ||||||||||||||||||||||||||||||||||||||||||||||||||||
| Chauvetia brunnea | 0,33 | 2,90 | 0,46 | 10,15 | 71,51 | ||||||||||||||||||||||||||||||||||||||||||||||||||||
| Chauvetia mamillata | 0,20 | 1,88 | 0,25 | 6,60 | 78,11 | ||||||||||||||||||||||||||||||||||||||||||||||||||||
| Muricopsis cristata | 0,24 | 1,31 | 0,25 | 4,57 | 82,68 | ||||||||||||||||||||||||||||||||||||||||||||||||||||
| PhF & ScF Average dissimilarity = 57,05 | |||||||||||||||||||||||||||||||||||||||||||||||||||||||||
| Species | Group PhF #break#Av.Abund | Group ScF #break#Av.Abund | Av.Diss | Diss/SD | Contrib% | Cum.% | |||||||||||||||||||||||||||||||||||||||||||||||||||
| Bittium latreillii | 2,49 | 0,71 | 2,92 | 1,79 | 5,12 | 5,12 | |||||||||||||||||||||||||||||||||||||||||||||||||||
| Bittium reticulatum | 1,17 | 0,35 | 1,98 | 1,10 | 3,46 | 8,58 | |||||||||||||||||||||||||||||||||||||||||||||||||||
| Pusillina philippi | 2,09 | 1,48 | 1,96 | 1,02 | 3,44 | 12,02 | |||||||||||||||||||||||||||||||||||||||||||||||||||
| Chauvetia mamillata | 1,46 | 0,61 | 1,65 | 1,19 | 2,89 | 14,91 | |||||||||||||||||||||||||||||||||||||||||||||||||||
| Parvicardium scriptum | 1,40 | 0,56 | 1,54 | 1,14 | 2,69 | 17,60 | |||||||||||||||||||||||||||||||||||||||||||||||||||
| Pusillina radiata | 1,25 | 0,86 | 1,45 | 0,91 | 2,54 | 20,14 | |||||||||||||||||||||||||||||||||||||||||||||||||||
| Alvania cancellata | 0,82 | 0,18 | 1,36 | 1,13 | 2,38 | 22,51 | |||||||||||||||||||||||||||||||||||||||||||||||||||
| Alvania lineata | 1,28 | 0,81 | 1,35 | 1,00 | 2,37 | 24,89 | |||||||||||||||||||||||||||||||||||||||||||||||||||
| Vitreolina perminima | 0,95 | 0,29 | 1,33 | 1,07 | 2,34 | 27,22 | |||||||||||||||||||||||||||||||||||||||||||||||||||
| Musculus costulatus | 2,50 | 2,08 | 1,33 | 1,00 | 2,33 | 29,55 | |||||||||||||||||||||||||||||||||||||||||||||||||||
| Rissoella diaphana | 1,04 | 0,00 | 1,30 | 0,92 | 2,28 | 31,84 | |||||||||||||||||||||||||||||||||||||||||||||||||||
| Modiolula phaseolina | 0,93 | 0,38 | 1,17 | 0,91 | 2,06 | 33,89 | |||||||||||||||||||||||||||||||||||||||||||||||||||
| Aplysia punctata | 1,00 | 0,37 | 1,15 | 1,05 | 2,01 | 35,90 | |||||||||||||||||||||||||||||||||||||||||||||||||||
| Clanculus cruciatus | 1,05 | 0,25 | 1,13 | 1,17 | 1,99 | 37,89 | |||||||||||||||||||||||||||||||||||||||||||||||||||
| Arca noae | 0,77 | 0,06 | 1,13 | 1,11 | 1,98 | 39,87 | |||||||||||||||||||||||||||||||||||||||||||||||||||
| Limaria tuberculata | 0,47 | 0,49 | 1,02 | 0,87 | 1,80 | 41,67 | |||||||||||||||||||||||||||||||||||||||||||||||||||
| Runcina sp. | 0,77 | 0,22 | 1,01 | 1,01 | 1,77 | 43,44 | |||||||||||||||||||||||||||||||||||||||||||||||||||
| Cerithiopsis tubercularis | 0,57 | 0,07 | 0,95 | 0,78 | 1,67 | 45,10 | |||||||||||||||||||||||||||||||||||||||||||||||||||
| Parthenina emaciata | 0,68 | 0,00 | 0,95 | 0,85 | 1,66 | 46,76 | |||||||||||||||||||||||||||||||||||||||||||||||||||
| Crisilla semistriata | 0,45 | 0,53 | 0,93 | 0,66 | 1,64 | 48,40 | |||||||||||||||||||||||||||||||||||||||||||||||||||
| Rissoa lia | 0,42 | 0,06 | 0,91 | 0,57 | 1,59 | 49,99 | |||||||||||||||||||||||||||||||||||||||||||||||||||
| Hiatella arctica | 1,71 | 1,43 | 0,86 | 0,69 | 1,51 | 51,50 | |||||||||||||||||||||||||||||||||||||||||||||||||||
| PhF & PhC Average dissimilarity = 88,50 | |||||||||||||||||||||||||||||||||||||||||||||||||||||||||
| Species | Group Ph#break#Av.Abund | Group PhC#break#Av.Abund | Av.Diss | Diss/SD | Contrib% | Cum.% | |||||||||||||||||||||||||||||||||||||||||||||||||||
| Musculus costulatus | 2,50 | 0,30 | 5,26 | 1,45 | 5,95 | 5,95 | |||||||||||||||||||||||||||||||||||||||||||||||||||
| Bittium latreillii | 2,49 | 0,06 | 4,28 | 2,22 | 4,84 | 10,79 | |||||||||||||||||||||||||||||||||||||||||||||||||||
| Pusillina philippi | 2,09 | 0,00 | 4,27 | 2,30 | 4,83 | 15,62 | |||||||||||||||||||||||||||||||||||||||||||||||||||
| Hiatella arctica | 1,71 | 0,12 | 3,21 | 2,08 | 3,63 | 19,25 | |||||||||||||||||||||||||||||||||||||||||||||||||||
| Parvicardium scriptum | 1,40 | 0,00 | 2,78 | 2,36 | 3,15 | 22,39 | |||||||||||||||||||||||||||||||||||||||||||||||||||
| Chauvetia mamillata | 1,46 | 0,31 | 2,62 | 1,47 | 2,96 | 25,36 | |||||||||||||||||||||||||||||||||||||||||||||||||||
| Pusillina radiata | 1,25 | 0,00 | 2,54 | 0,96 | 2,87 | 28,22 | |||||||||||||||||||||||||||||||||||||||||||||||||||
| Odostomia striolata | 1,43 | 0,00 | 2,53 | 1,83 | 2,86 | 31,08 | |||||||||||||||||||||||||||||||||||||||||||||||||||
| Bittium reticulatum | 1,17 | 0,11 | 2,43 | 1,19 | 2,75 | 33,83 | |||||||||||||||||||||||||||||||||||||||||||||||||||
| Aplysia punctata | 1,00 | 0,11 | 1,98 | 1,44 | 2,24 | 36,07 | |||||||||||||||||||||||||||||||||||||||||||||||||||
| Alvania lineata | 1,28 | 0,57 | 1,91 | 1,12 | 2,16 | 38,24 | |||||||||||||||||||||||||||||||||||||||||||||||||||
| Vitreolina perminima | 0,95 | 0,00 | 1,70 | 1,19 | 1,92 | 40,16 | |||||||||||||||||||||||||||||||||||||||||||||||||||
| Modiolula phaseolina | 0,93 | 0,12 | 1,63 | 1,13 | 1,85 | 42,00 | |||||||||||||||||||||||||||||||||||||||||||||||||||
| Clanculus cruciatus | 1,05 | 0,06 | 1,62 | 1,40 | 1,83 | 43,83 | |||||||||||||||||||||||||||||||||||||||||||||||||||
| Rissoella diaphana | 1,04 | 0,00 | 1,56 | 0,92 | 1,77 | 45,60 | |||||||||||||||||||||||||||||||||||||||||||||||||||
| Runcina sp. | 0,77 | 0,00 | 1,47 | 1,09 | 1,67 | 47,26 | |||||||||||||||||||||||||||||||||||||||||||||||||||
| Alvania cancellata | 0,82 | 0,00 | 1,47 | 1,18 | 1,66 | 48,92 | |||||||||||||||||||||||||||||||||||||||||||||||||||
| Tritia incrassata | 0,63 | 1,05 | 1,46 | 0,85 | 1,65 | 50,57 | |||||||||||||||||||||||||||||||||||||||||||||||||||
| ScF & PhC Average dissimilarity = 89,04 | |||||||||||||||||||||||||||||||||||||||||||||||||||||||||
| Species | Group ScF#break#Av.Abund | Group PhC#break#Av.Abund | Av.Diss | Diss/SD | Contrib% | Cum.% | |||||||||||||||||||||||||||||||||||||||||||||||||||
| Musculus costulatus | 2,08 | 0,30 | 7,51 | 1,61 | 8,43 | 8,43 | |||||||||||||||||||||||||||||||||||||||||||||||||||
| Pusillina philippi | 1,48 | 0,00 | 5,13 | 1,57 | 5,76 | 14,19 | |||||||||||||||||||||||||||||||||||||||||||||||||||
| Hiatella arctica | 1,43 | 0,12 | 5,07 | 2,05 | 5,69 | 19,88 | |||||||||||||||||||||||||||||||||||||||||||||||||||
| Pusillina radiata | 0,86 | 0,00 | 3,62 | 0,87 | 4,06 | 23,94 | |||||||||||||||||||||||||||||||||||||||||||||||||||
| Odostomia striolata | 1,04 | 0,00 | 3,53 | 1,48 | 3,96 | 27,90 | |||||||||||||||||||||||||||||||||||||||||||||||||||
| Tritia incrassata | 0,27 | 1,05 | 3,43 | 1,33 | 3,85 | 31,75 | |||||||||||||||||||||||||||||||||||||||||||||||||||
| Alvania lineata | 0,81 | 0,57 | 2,82 | 0,91 | 3,16 | 34,92 | |||||||||||||||||||||||||||||||||||||||||||||||||||
| Chauvetia mamillata | 0,61 | 0,31 | 2,71 | 0,93 | 3,04 | 37,96 | |||||||||||||||||||||||||||||||||||||||||||||||||||
| Bittium latreillii | 0,71 | 0,06 | 2,13 | 0,93 | 2,39 | 40,35 | |||||||||||||||||||||||||||||||||||||||||||||||||||
| Aplysia punctata | 0,37 | 0,11 | 1,93 | 0,68 | 2,17 | 42,52 | |||||||||||||||||||||||||||||||||||||||||||||||||||
| Arca noae | 0,06 | 0,52 | 1,91 | 0,84 | 2,14 | 44,66 | |||||||||||||||||||||||||||||||||||||||||||||||||||
| Parvicardium scriptum | 0,56 | 0,00 | 1,84 | 0,81 | 2,07 | 46,73 | |||||||||||||||||||||||||||||||||||||||||||||||||||
| Limaria tuberculata | 0,49 | 0,06 | 1,79 | 0,84 | 2,01 | 48,75 | |||||||||||||||||||||||||||||||||||||||||||||||||||
| Crisilla semistriata | 0,53 | 0,00 | 1,70 | 0,66 | 1,91 | 50,66 | |||||||||||||||||||||||||||||||||||||||||||||||||||
| PhF & ScC Average dissimilarity = 93,59 | |||||||||||||||||||||||||||||||||||||||||||||||||||||||||
| Species | Group PhF#break#Av.Abund | Group ScC#break#Av.Abund | Av.Diss | Diss/SD | Contrib% | Cum.% | |||||||||||||||||||||||||||||||||||||||||||||||||||
| Musculus costulatus | 2,50 | 0,12 | 5,99 | 1,78 | 6,40 | 6,40 | |||||||||||||||||||||||||||||||||||||||||||||||||||
| Pusillina philippi | 2,09 | 0,00 | 4,54 | 2,44 | 4,85 | 11,25 | |||||||||||||||||||||||||||||||||||||||||||||||||||
| Bittium latreillii | 2,49 | 0,06 | 4,53 | 2,12 | 4,84 | 16,09 | |||||||||||||||||||||||||||||||||||||||||||||||||||
| Hiatella arctica | 1,71 | 0,39 | 3,11 | 1,62 | 3,32 | 19,41 | |||||||||||||||||||||||||||||||||||||||||||||||||||
| Parvicardium scriptum | 1,40 | 0,00 | 2,98 | 2,34 | 3,18 | 22,59 | |||||||||||||||||||||||||||||||||||||||||||||||||||
| Chauvetia mamillata | 1,46 | 0,20 | 2,89 | 1,80 | 3,09 | 25,68 | |||||||||||||||||||||||||||||||||||||||||||||||||||
| Pusillina radiata | 1,25 | 0,00 | 2,77 | 0,96 | 2,96 | 28,63 | |||||||||||||||||||||||||||||||||||||||||||||||||||
| Odostomia striolata | 1,43 | 0,00 | 2,72 | 1,75 | 2,90 | 31,54 | |||||||||||||||||||||||||||||||||||||||||||||||||||
| Bittium reticulatum | 1,17 | 0,00 | 2,72 | 1,33 | 2,90 | 34,44 | |||||||||||||||||||||||||||||||||||||||||||||||||||
| Alvania lineata | 1,28 | 0,63 | 2,16 | 1,27 | 2,31 | 36,75 | |||||||||||||||||||||||||||||||||||||||||||||||||||
| Aplysia punctata | 1,00 | 0,00 | 2,16 | 1,67 | 2,31 | 39,06 | |||||||||||||||||||||||||||||||||||||||||||||||||||
| Clanculus cruciatus | 1,05 | 0,06 | 1,92 | 1,44 | 2,05 | 41,10 | |||||||||||||||||||||||||||||||||||||||||||||||||||
| Modiolula phaseolina | 0,93 | 0,00 | 1,78 | 1,18 | 1,91 | 43,01 | |||||||||||||||||||||||||||||||||||||||||||||||||||
| Vitreolina perminima | 0,95 | 0,00 | 1,78 | 1,13 | 1,90 | 44,91 | |||||||||||||||||||||||||||||||||||||||||||||||||||
| Alvania cancellata | 0,82 | 0,00 | 1,61 | 1,15 | 1,72 | 46,63 | |||||||||||||||||||||||||||||||||||||||||||||||||||
| Rissoella diaphana | 1,04 | 0,00 | 1,58 | 0,88 | 1,69 | 48,32 | |||||||||||||||||||||||||||||||||||||||||||||||||||
| Runcina sp. | 0,77 | 0,00 | 1,54 | 1,06 | 1,64 | 49,96 | |||||||||||||||||||||||||||||||||||||||||||||||||||
| Arca noae | 0,77 | 0,00 | 1,47 | 1,13 | 1,57 | 51,54 | |||||||||||||||||||||||||||||||||||||||||||||||||||
| ScF & ScC Average dissimilarity = 89,73 | |||||||||||||||||||||||||||||||||||||||||||||||||||||||||
| Species | Group PhF#break#Av.Abund | Group ScC#break#Av.Abund | Av.Diss | Diss/SD | Contrib% | Cum.% | |||||||||||||||||||||||||||||||||||||||||||||||||||
| Musculus costulatus | 2,50 | 0,12 | 5,99 | 1,78 | 6,40 | 6,40 | |||||||||||||||||||||||||||||||||||||||||||||||||||
| Pusillina philippi | 2,09 | 0,00 | 4,54 | 2,44 | 4,85 | 11,25 | |||||||||||||||||||||||||||||||||||||||||||||||||||
| Bittium latreillii | 2,49 | 0,06 | 4,53 | 2,12 | 4,84 | 16,09 | |||||||||||||||||||||||||||||||||||||||||||||||||||
| Hiatella arctica | 1,71 | 0,39 | 3,11 | 1,62 | 3,32 | 19,41 | |||||||||||||||||||||||||||||||||||||||||||||||||||
| Parvicardium scriptum | 1,40 | 0,00 | 2,98 | 2,34 | 3,18 | 22,59 | |||||||||||||||||||||||||||||||||||||||||||||||||||
| Chauvetia mamillata | 1,46 | 0,20 | 2,89 | 1,80 | 3,09 | 25,68 | |||||||||||||||||||||||||||||||||||||||||||||||||||
| Pusillina radiata | 1,25 | 0,00 | 2,77 | 0,96 | 2,96 | 28,63 | |||||||||||||||||||||||||||||||||||||||||||||||||||
| Odostomia striolata | 1,43 | 0,00 | 2,72 | 1,75 | 2,90 | 31,54 | |||||||||||||||||||||||||||||||||||||||||||||||||||
| Bittium reticulatum | 1,17 | 0,00 | 2,72 | 1,33 | 2,90 | 34,44 | |||||||||||||||||||||||||||||||||||||||||||||||||||
| Alvania lineata | 1,28 | 0,63 | 2,16 | 1,27 | 2,31 | 36,75 | |||||||||||||||||||||||||||||||||||||||||||||||||||
| Aplysia punctata | 1,00 | 0,00 | 2,16 | 1,67 | 2,31 | 39,06 | |||||||||||||||||||||||||||||||||||||||||||||||||||
| Clanculus cruciatus | 1,05 | 0,06 | 1,92 | 1,44 | 2,05 | 41,10 | |||||||||||||||||||||||||||||||||||||||||||||||||||
| Modiolula phaseolina | 0,93 | 0,00 | 1,78 | 1,18 | 1,91 | 43,01 | |||||||||||||||||||||||||||||||||||||||||||||||||||
| Vitreolina perminima | 0,95 | 0,00 | 1,78 | 1,13 | 1,90 | 44,91 | |||||||||||||||||||||||||||||||||||||||||||||||||||
| Alvania cancellata | 0,82 | 0,00 | 1,61 | 1,15 | 1,72 | 46,63 | |||||||||||||||||||||||||||||||||||||||||||||||||||
| Rissoella diaphana | 1,04 | 0,00 | 1,58 | 0,88 | 1,69 | 48,32 | |||||||||||||||||||||||||||||||||||||||||||||||||||
| Runcina sp. | 0,77 | 0,00 | 1,54 | 1,06 | 1,64 | 49,96 | |||||||||||||||||||||||||||||||||||||||||||||||||||
| Arca noae | 0,77 | 0,00 | 1,47 | 1,13 | 1,57 | 51,54 | |||||||||||||||||||||||||||||||||||||||||||||||||||
| PhC & ScC Average dissimilarity = 78,87 | |||||||||||||||||||||||||||||||||||||||||||||||||||||||||
| Species | Group PhC#break#Av.Abund | Group ScC#break#Av.Abund | Av.Diss | Diss/SD | Contrib% | Cum.% | |||||||||||||||||||||||||||||||||||||||||||||||||||
| Tritia incrassata | 1,05 | 0,29 | 6,45 | 1,20 | 8,17 | 8,17 | |||||||||||||||||||||||||||||||||||||||||||||||||||
| Alvania lineata | 0,57 | 0,63 | 4,64 | 0,98 | 5,89 | 14,06 | |||||||||||||||||||||||||||||||||||||||||||||||||||
| Arca noae | 0,52 | 0,00 | 4,15 | 0,80 | 5,26 | 19,32 | |||||||||||||||||||||||||||||||||||||||||||||||||||
| Hiatella arctica | 0,12 | 0,39 | 3,57 | 0,73 | 4,52 | 23,85 | |||||||||||||||||||||||||||||||||||||||||||||||||||
| Striarca lactea | 0,36 | 0,14 | 2,92 | 0,77 | 3,70 | 27,55 | |||||||||||||||||||||||||||||||||||||||||||||||||||
| Modiolus barbatus | 0,35 | 0,06 | 2,60 | 0,79 | 3,29 | 30,84 | |||||||||||||||||||||||||||||||||||||||||||||||||||
| Chama gryphoides | 0,18 | 0,47 | 2,48 | 0,60 | 3,14 | 33,98 | |||||||||||||||||||||||||||||||||||||||||||||||||||
| Musculus costulatus | 0,30 | 0,12 | 2,40 | 0,61 | 3,05 | 37,03 | |||||||||||||||||||||||||||||||||||||||||||||||||||
| Muricopsis cristata | 0,11 | 0,24 | 2,21 | 0,63 | 2,80 | 39,83 | |||||||||||||||||||||||||||||||||||||||||||||||||||
| Pusia tricolor | 0,22 | 0,12 | 2,19 | 0,54 | 2,78 | 42,61 | |||||||||||||||||||||||||||||||||||||||||||||||||||
| Marshallora adversa | 0,22 | 0,12 | 2,12 | 0,53 | 2,69 | 45,29 | |||||||||||||||||||||||||||||||||||||||||||||||||||
| Mimachlamys varia | 0,25 | 0,19 | 2,09 | 0,51 | 2,65 | 47,95 | |||||||||||||||||||||||||||||||||||||||||||||||||||
| Cyrillia linearis | 0,33 | 0,06 | 2,08 | 0,59 | 2,64 | 50,58 | |||||||||||||||||||||||||||||||||||||||||||||||||||
| January Average similarity: 34,80 | |||||||||||||||||||||||||||||||||||||||||||||||||||||||||
| Species | Av.Abund | Av.Sim | Sim/SD | Contrib% | Cum.% | ||||||||||||||||||||||||||||||||||||||||||||||||||||
| Musculus costulatus | 1,05 | 7,45 | 0,91 | 21,40 | 21,40 | ||||||||||||||||||||||||||||||||||||||||||||||||||||
| Alvania lineata | 0,83 | 7,32 | 0,97 | 21,02 | 42,42 | ||||||||||||||||||||||||||||||||||||||||||||||||||||
| Chama gryphoides | 0,43 | 5,19 | 0,65 | 14,92 | 57,35 | ||||||||||||||||||||||||||||||||||||||||||||||||||||
| Pusillina philippi | 0,62 | 2,60 | 0,65 | 7,49 | 64,83 | ||||||||||||||||||||||||||||||||||||||||||||||||||||
| Chauvetia mamillata | 0,48 | 2,60 | 0,58 | 7,47 | 72,30 | ||||||||||||||||||||||||||||||||||||||||||||||||||||
| Hexaplex trunculus | 0,35 | 2,20 | 0,43 | 6,33 | 78,64 | ||||||||||||||||||||||||||||||||||||||||||||||||||||
| Pusillina radiata | 0,46 | 1,69 | 0,39 | 4,86 | 83,50 | ||||||||||||||||||||||||||||||||||||||||||||||||||||
| March Average similarity: 29,72 | |||||||||||||||||||||||||||||||||||||||||||||||||||||||||
| Species | Av.Abund | Av.Sim | Sim/SD | Contrib% | Cum.% | ||||||||||||||||||||||||||||||||||||||||||||||||||||
| Musculus costulatus | 1,45 | 7,26 | 0,86 | 24,42 | 24,42 | ||||||||||||||||||||||||||||||||||||||||||||||||||||
| Hiatella arctica | 1,01 | 5,33 | 0,84 | 17,93 | 42,34 | ||||||||||||||||||||||||||||||||||||||||||||||||||||
| Parvicardium scriptum | 0,47 | 1,75 | 0,59 | 5,89 | 48,23 | ||||||||||||||||||||||||||||||||||||||||||||||||||||
| Bittium latreillii | 0,54 | 1,64 | 0,55 | 5,53 | 53,76 | ||||||||||||||||||||||||||||||||||||||||||||||||||||
| Chauvetia recondita | 0,19 | 1,62 | 0,29 | 5,44 | 59,20 | ||||||||||||||||||||||||||||||||||||||||||||||||||||
| Pusillina philippi | 0,52 | 1,44 | 0,55 | 4,86 | 64,06 | ||||||||||||||||||||||||||||||||||||||||||||||||||||
| Tritia incrassata | 0,27 | 1,25 | 0,29 | 4,19 | 68,25 | ||||||||||||||||||||||||||||||||||||||||||||||||||||
| Chauvetia mamillata | 0,41 | 1,21 | 0,55 | 4,06 | 72,31 | ||||||||||||||||||||||||||||||||||||||||||||||||||||
| Odostomia striolata | 0,35 | 1,20 | 0,38 | 4,03 | 76,34 | ||||||||||||||||||||||||||||||||||||||||||||||||||||
| Alvania lineata | 0,51 | 1,13 | 0,55 | 3,81 | 80,15 | ||||||||||||||||||||||||||||||||||||||||||||||||||||
| May Average similarity: 46,60 | |||||||||||||||||||||||||||||||||||||||||||||||||||||||||
| Species | Av.Abund | Av.Sim | Sim/SD | Contrib% | Cum.% | ||||||||||||||||||||||||||||||||||||||||||||||||||||
| Chama gryphoides | 0,33 | 4,73 | 0,55 | 10,14 | 10,14 | ||||||||||||||||||||||||||||||||||||||||||||||||||||
| Hiatella arctica | 1,30 | 4,55 | 0,83 | 9,77 | 19,92 | ||||||||||||||||||||||||||||||||||||||||||||||||||||
| Tritia incrassata | 0,82 | 4,49 | 0,70 | 9,64 | 29,56 | ||||||||||||||||||||||||||||||||||||||||||||||||||||
| Alvania lineata | 1,14 | 4,21 | 0,84 | 9,04 | 38,60 | ||||||||||||||||||||||||||||||||||||||||||||||||||||
| Musculus costulatus | 1,38 | 3,23 | 0,90 | 6,92 | 45,52 | ||||||||||||||||||||||||||||||||||||||||||||||||||||
| Pusillina philippi | 0,92 | 2,31 | 0,94 | 4,95 | 50,47 | ||||||||||||||||||||||||||||||||||||||||||||||||||||
| Odostomia striolata | 0,84 | 2,18 | 0,93 | 4,68 | 55,14 | ||||||||||||||||||||||||||||||||||||||||||||||||||||
| Muricopsis cristata | 0,17 | 1,74 | 0,29 | 3,74 | 58,88 | ||||||||||||||||||||||||||||||||||||||||||||||||||||
| Aequipecten opercularis | 0,48 | 1,25 | 0,55 | 2,69 | 61,57 | ||||||||||||||||||||||||||||||||||||||||||||||||||||
| Bittium latreillii | 0,66 | 1,19 | 0,67 | 2,54 | 64,11 | ||||||||||||||||||||||||||||||||||||||||||||||||||||
| Jujubinus ruscurianus | 0,63 | 1,15 | 0,67 | 2,46 | 66,58 | ||||||||||||||||||||||||||||||||||||||||||||||||||||
| Mimachlamys varia | 0,49 | 1,05 | 0,55 | 2,25 | 68,83 | ||||||||||||||||||||||||||||||||||||||||||||||||||||
| Gregariella semigranata | 0,33 | 0,99 | 0,55 | 2,13 | 70,96 | ||||||||||||||||||||||||||||||||||||||||||||||||||||
| Clanculus cruciatus | 0,66 | 0,96 | 0,65 | 2,06 | 73,01 | ||||||||||||||||||||||||||||||||||||||||||||||||||||
| Chauvetia mamillata | 0,55 | 0,96 | 0,67 | 2,05 | 75,07 | ||||||||||||||||||||||||||||||||||||||||||||||||||||
| Crisilla semistriata | 0,57 | 0,94 | 0,61 | 2,02 | 77,09 | ||||||||||||||||||||||||||||||||||||||||||||||||||||
| Arca noae | 0,25 | 0,87 | 0,29 | 1,86 | 78,95 | ||||||||||||||||||||||||||||||||||||||||||||||||||||
| Mitromorpha olivoidea | 0,18 | 0,87 | 0,29 | 1,86 | 80,80 | ||||||||||||||||||||||||||||||||||||||||||||||||||||
| July Average similarity: 54,60 | |||||||||||||||||||||||||||||||||||||||||||||||||||||||||
| Species | Av.Abund | Av.Sim | Sim/SD | Contrib% | Cum.% | ||||||||||||||||||||||||||||||||||||||||||||||||||||
| Hiatella arctica | 1,25 | 6,39 | 0,98 | 11,71 | 11,71 | ||||||||||||||||||||||||||||||||||||||||||||||||||||
| Chauvetia brunnea | 0,46 | 4,47 | 0,64 | 8,19 | 19,90 | ||||||||||||||||||||||||||||||||||||||||||||||||||||
| Musculus costulatus | 1,36 | 2,76 | 0,82 | 5,06 | 24,96 | ||||||||||||||||||||||||||||||||||||||||||||||||||||
| Pusillina philippi | 1,24 | 2,72 | 0,84 | 4,98 | 29,94 | ||||||||||||||||||||||||||||||||||||||||||||||||||||
| Alvania lineata | 1,10 | 2,63 | 0,67 | 4,82 | 34,75 | ||||||||||||||||||||||||||||||||||||||||||||||||||||
| Tritia incrassata | 0,80 | 2,17 | 0,71 | 3,98 | 38,74 | ||||||||||||||||||||||||||||||||||||||||||||||||||||
| Triphoridae indet. | 0,90 | 1,92 | 0,87 | 3,51 | 42,24 | ||||||||||||||||||||||||||||||||||||||||||||||||||||
| Odostomia striolata | 0,88 | 1,87 | 0,86 | 3,43 | 45,68 | ||||||||||||||||||||||||||||||||||||||||||||||||||||
| Modiolus barbatus | 0,28 | 1,87 | 0,55 | 3,42 | 49,10 | ||||||||||||||||||||||||||||||||||||||||||||||||||||
| Mimachlamys varia | 0,49 | 1,86 | 0,42 | 3,41 | 52,50 | ||||||||||||||||||||||||||||||||||||||||||||||||||||
| Alvania aspera | 0,27 | 1,76 | 0,55 | 3,22 | 55,72 | ||||||||||||||||||||||||||||||||||||||||||||||||||||
| Bittium latreillii | 1,42 | 1,65 | 0,66 | 3,02 | 58,74 | ||||||||||||||||||||||||||||||||||||||||||||||||||||
| Ammonicera fischeriana | 0,79 | 1,63 | 0,88 | 2,98 | 61,73 | ||||||||||||||||||||||||||||||||||||||||||||||||||||
| Modiolula phaseolina | 0,68 | 1,60 | 0,82 | 2,93 | 64,65 | ||||||||||||||||||||||||||||||||||||||||||||||||||||
| Chama gryphoides | 0,17 | 1,44 | 0,29 | 2,64 | 67,29 | ||||||||||||||||||||||||||||||||||||||||||||||||||||
| Aequipecten opercularis | 0,57 | 1,30 | 0,79 | 2,38 | 69,67 | ||||||||||||||||||||||||||||||||||||||||||||||||||||
| Striarca lactea | 0,64 | 1,03 | 0,49 | 1,89 | 71,56 | ||||||||||||||||||||||||||||||||||||||||||||||||||||
| Cyrillia linearis | 0,52 | 0,95 | 0,46 | 1,74 | 73,31 | ||||||||||||||||||||||||||||||||||||||||||||||||||||
| Parvicardium scriptum | 0,66 | 0,89 | 0,63 | 1,62 | 74,93 | ||||||||||||||||||||||||||||||||||||||||||||||||||||
| Pusillina radiata | 0,63 | 0,88 | 0,61 | 1,61 | 76,54 | ||||||||||||||||||||||||||||||||||||||||||||||||||||
| Chauvetia mamillata | 0,61 | 0,87 | 0,61 | 1,60 | 78,14 | ||||||||||||||||||||||||||||||||||||||||||||||||||||
| Bittium reticulatum | 0,68 | 0,83 | 0,60 | 1,53 | 79,66 | ||||||||||||||||||||||||||||||||||||||||||||||||||||
| Rissoella diaphana | 0,68 | 0,81 | 0,55 | 1,49 | 81,15 | ||||||||||||||||||||||||||||||||||||||||||||||||||||
| September Average similarity: 44,42 | |||||||||||||||||||||||||||||||||||||||||||||||||||||||||
| Species | Av.Abund | Av.Sim | Sim/SD | Contrib% | Cum.% | ||||||||||||||||||||||||||||||||||||||||||||||||||||
| Tritia incrassata | 0,77 | 4,62 | 0,78 | 10,40 | 10,40 | ||||||||||||||||||||||||||||||||||||||||||||||||||||
| Bittium latreillii | 1,44 | 3,10 | 1,15 | 6,98 | 17,38 | ||||||||||||||||||||||||||||||||||||||||||||||||||||
| Musculus costulatus | 1,26 | 2,75 | 1,08 | 6,18 | 23,56 | ||||||||||||||||||||||||||||||||||||||||||||||||||||
| Pusillina philippi | 1,12 | 2,73 | 1,12 | 6,14 | 29,70 | ||||||||||||||||||||||||||||||||||||||||||||||||||||
| Hiatella arctica | 0,89 | 2,63 | 0,97 | 5,91 | 35,61 | ||||||||||||||||||||||||||||||||||||||||||||||||||||
| Triphoridae indet. | 0,90 | 2,51 | 1,12 | 5,65 | 41,26 | ||||||||||||||||||||||||||||||||||||||||||||||||||||
| Odostomia striolata | 0,88 | 2,38 | 1,08 | 5,35 | 46,61 | ||||||||||||||||||||||||||||||||||||||||||||||||||||
| Chauvetia mamillata | 0,90 | 1,95 | 1,10 | 4,40 | 51,01 | ||||||||||||||||||||||||||||||||||||||||||||||||||||
| Runcina sp. | 0,67 | 1,86 | 1,05 | 4,18 | 55,19 | ||||||||||||||||||||||||||||||||||||||||||||||||||||
| Alvania lineata | 0,84 | 1,72 | 0,48 | 3,88 | 59,06 | ||||||||||||||||||||||||||||||||||||||||||||||||||||
| Parvicardium scriptum | 0,81 | 1,49 | 0,73 | 3,36 | 62,42 | ||||||||||||||||||||||||||||||||||||||||||||||||||||
| Jujubinus ruscurianus | 0,51 | 1,34 | 0,32 | 3,03 | 65,45 | ||||||||||||||||||||||||||||||||||||||||||||||||||||
| Arca noae | 0,53 | 1,26 | 0,58 | 2,84 | 68,28 | ||||||||||||||||||||||||||||||||||||||||||||||||||||
| Pusia tricolor | 0,27 | 1,13 | 0,32 | 2,54 | 70,83 | ||||||||||||||||||||||||||||||||||||||||||||||||||||
| Vitreolina perminima | 0,62 | 1,13 | 0,74 | 2,53 | 73,36 | ||||||||||||||||||||||||||||||||||||||||||||||||||||
| Rissoella diaphana | 0,51 | 0,97 | 0,61 | 2,18 | 75,54 | ||||||||||||||||||||||||||||||||||||||||||||||||||||
| Aplysia punctata | 0,53 | 0,97 | 0,67 | 2,18 | 77,72 | ||||||||||||||||||||||||||||||||||||||||||||||||||||
| Modiolula phaseolina | 0,55 | 0,87 | 0,39 | 1,95 | 79,67 | ||||||||||||||||||||||||||||||||||||||||||||||||||||
| Mitromorpha columbellaria | 0,36 | 0,69 | 0,32 | 1,56 | 81,23 | ||||||||||||||||||||||||||||||||||||||||||||||||||||
| November Average similarity: 41,53 | |||||||||||||||||||||||||||||||||||||||||||||||||||||||||
| Species | Av.Abund | Av.Sim | Sim/SD | Contrib% | Cum.% | ||||||||||||||||||||||||||||||||||||||||||||||||||||
| Chauvetia mamillata | 0,98 | 6,89 | 0,72 | 16,60 | 16,60 | ||||||||||||||||||||||||||||||||||||||||||||||||||||
| Pusillina radiata | 1,37 | 3,83 | 0,92 | 9,22 | 25,82 | ||||||||||||||||||||||||||||||||||||||||||||||||||||
| Tritia incrassata | 0,48 | 3,09 | 0,54 | 7,43 | 33,25 | ||||||||||||||||||||||||||||||||||||||||||||||||||||
| Arca noae | 0,43 | 3,08 | 0,59 | 7,42 | 40,67 | ||||||||||||||||||||||||||||||||||||||||||||||||||||
| Musculus costulatus | 1,08 | 2,97 | 0,91 | 7,15 | 47,81 | ||||||||||||||||||||||||||||||||||||||||||||||||||||
| Pusillina philippi | 1,03 | 2,69 | 0,64 | 6,48 | 54,29 | ||||||||||||||||||||||||||||||||||||||||||||||||||||
| Odostomia striolata | 0,75 | 2,55 | 0,87 | 6,15 | 60,44 | ||||||||||||||||||||||||||||||||||||||||||||||||||||
| Hiatella arctica | 0,75 | 2,28 | 0,90 | 5,48 | 65,92 | ||||||||||||||||||||||||||||||||||||||||||||||||||||
| Pseudochama gryphina | 0,33 | 2,20 | 0,40 | 5,29 | 71,21 | ||||||||||||||||||||||||||||||||||||||||||||||||||||
| Odostomia plicata | 0,56 | 1,91 | 0,87 | 4,60 | 75,81 | ||||||||||||||||||||||||||||||||||||||||||||||||||||
| Bittium latreillii | 0,77 | 1,54 | 0,54 | 3,71 | 79,52 | ||||||||||||||||||||||||||||||||||||||||||||||||||||
| Striarca lactea | 0,78 | 1,17 | 0,66 | 2,83 | 82,34 | ||||||||||||||||||||||||||||||||||||||||||||||||||||
Disclaimer/Publisher’s Note: The statements, opinions and data contained in all publications are solely those of the individual author(s) and contributor(s) and not of MDPI and/or the editor(s). MDPI and/or the editor(s) disclaim responsibility for any injury to people or property resulting from any ideas, methods, instructions or products referred to in the content. |
© 2024 by the authors. Licensee MDPI, Basel, Switzerland. This article is an open access article distributed under the terms and conditions of the Creative Commons Attribution (CC BY) license (https://creativecommons.org/licenses/by/4.0/).
Copyright: This open access article is published under a Creative Commons CC BY 4.0 license, which permit the free download, distribution, and reuse, provided that the author and preprint are cited in any reuse.


