
Submitted:
31 October 2024
Posted:
31 October 2024
Read the latest preprint version here
Abstract
Preserving natural biodiversity of forest ecosystems is one of the greatest challenges of modern, multifunctional forest management. Among the many different groups of forest organisms trees are of major importance as they often act as the so-called foundation species, i.e. species that create conditions on which the existence of virtually all other organisms depends, either directly or indirectly. The essential condition for trees to permanently play this role is their demographic sustainability, which is reflected in the balanced proportions of individuals representing different developmental stages (from seedlings and saplings to mature trees). The main goal of this study was to assess the possibility of tree species occurring in the Białowieża Forest (important biodiversity hotspot) to maintain the role of foundation species in a sustainable manner. Comparison of species-specific, equilibrium vs. actual size distributions revealed that almost half of all trees growing in the Białowieża Forest represent "inappropriate", i.e. occurring in excess compared to the balanced model, species and/or diameter ranges. Similarly high was also the amount of deficits, concerning primarily the smallest trees. It is suggested that, in order to permanently preserve a high biological diversity of the Białowieża Forest, active actions should be taken to bring the current tree diameter distributions as close as possible to the desired sustainable model.

Keywords:
equilibrium diameter distribution
; forest-associated biodiversity
; forest sustainability
; foundation species
; stocking regulation
; tree demography
; tree regeneration failure
1. Introduction
The reduction of many aspects of biodiversity (the biodiversity loss) is currently very widely analyzed and discussed, at global [1,2,3,4,5], regional [6,7,8,9] and local scales [10,11]. In Central Europe, similarly as in many other regions in the world, a significant part of the overall biodiversity is associated with forests, which, despite centuries of exploitation and many transformations, constitute the most "natural" form of land use [8,9,10,11,12,13,14]. Among the numerous plant, fungi and animal organisms associated with forest ecosystems, trees occupy a special place [13,15,16]. Although, both in terms of the number of species and individuals, trees may be significantly inferior to other organisms, they very often work in forest ecosystems as so-called foundation species. The foundation species, due to their specific features and parameters (such as age and size at maturity in the case of trees), form the main component of communities and ecosystems, significantly influencing their functioning [17,18,19]. Their importance lies in the stabilization of basic ecosystem processes, such as biomass production, water balance, rate of organic matter decomposition, nutrient cycling, carbon sequestration, and energy flow. The decline and disappearance of foundation species lead to a significant change in local environmental conditions on which the subsistence and survival of many other species depend. A good illustration of the role of trees as foundation species is their so-called biocenotic value, which is measured by the number of taxa representing different groups of forest biota associated with particular tree species (fungi, insects, lichens, etc.) [20,21,22].
From the nature conservation point of view, one of the most valuable regions in Poland is the Białowieża Forest. High diversity, richness, uniqueness and rarity are features that can be found in virtually all groups of plant, animal and fungal organisms inhabiting the forest [10,23,24]. Against the background of the great diversity and richness of many types of forest-related organisms, the group of tree species found in the Białowieża Forest looks rather modest. According to Faliński [25,26], the dendroflora of the Białowieża Forest includes 28 tree species, of which Scots pine (Pinus sylvestris L.), Norway spruce (Picea abies (L.) Karsten); pedunculate oak (Quercus robur L.); common hornbeam (Carpinus betulus L.); small-leaved lime (Tilia cordata Miller); Norway maple (Acer platanoides L.); common ash (Fraxinus excelsior L.); black alder (Alnus glutinosa (L.) Gaertner), aspen (Populus tremula L.), silver birch (Betula pendula Roth) and wych elm (Ulmus glabra Hudson) are the most common. The biocenotic value of the above-mentioned tree species for individual groupings of forest-dwelling organisms is different, nevertheless, it can be assumed that, from the point of view of safeguarding high natural values of local forest ecosystems, maintaining a high diversity of species composition, as well as a demographic sustainability of individual tree species (i.e. an appropriate form of their size distributions), would be of vital importance [13,15,27,28].
Taking this into account, the main goal of this work was to analyze the current demographic status of individual tree species occurring in the Polish part of the Białowieża Forest. The research covered the managed part of the forest (area of ca. 520 km2), i.e. after excluding the Białowieża National Park (area of ca. 105 km2), located in its central part. To assess the demographic stability of the diameter distributions of the main tree species occurring in the Białowieża Forest, species-specific equilibrium curves were constructed using the method proposed by Brzeziecki et al. [29,30]; see also [31]. The scope of the work also included: 1) an attempt to determine the most important factors that caused the observed deviations of the current diameter distributions of individual tree species from theoretical equilibrium states, 2) determining the amount of surpluses and deficits in the number of trees representing various development stages and 3) indicating, on this basis, the most important types of action, which would be needed to bring the current condition of forest stands closer to the desired state, ensuring the highest conservation benefits. The obtained results also constitute the basis for a brief discussion on the currently adopted solutions for protecting the natural values of the Białowieża Forest.
2. Material and Methods
2.1. Study Area
Białowieża Forest is situated on both sides of the national border between Poland and Belarus. It encompasses in total 1475 km2 (625 km2 in Poland and 850 km2 in adjacent Belarus). The climate has features of both Continental and Atlantic character [23]. Average annual temperature is 7.0°C (January average = -4.6°C, July average = 18.2°C), total annual precipitation averages 631 mm and snow cover lasts for an average of 92 days [23]. Białowieża Forest is situated on a flat, undulating terrain ranging from 135 to 190 m a.s.l., built from glaciofluvial sands, gravels and clays [32]. The Polish section of Białowieża Forest is divided into the protected (Białowieża National Park, about 105 km2) and the managed part (about 520 km2), which is subdivided into three forest districts: Białowieża, Hajnówka and Browsk.
From the 14th until the beginning of the 20th century, Białowieża Forest served as an extensive royal hunting area and, thanks to this, escaped the widespread colonization and commercial timber extraction that occurred in most European forests of similar climate and topography [23,33].
Within Białowieża Forest it is possible to find a range of different woodland community types. There is coniferous forest (with dominant Scots pine and Norway spruce), mixed coniferous/broadleaved forest (Scots pine, Norway spruce and pedunculate oak), mixed broadleaved/coniferous forest (pedunculate oak, lime, hornbeam and spruce), broadleaved forest (oak, lime, hornbeam, maple), streamside alder-ash forest (alder and ash) and black alder bog forest (alder, birch). These forest types, based on phytosociological units, reflect the presence of an ecological gradient of soil fertility and water availability. Coniferous forest can be found on the most well-drained, nutrient-poor soils, while broadleaved and floodplain forests both occur on highly productive soils rich in organic matter, but differing in terms of water supply. For some periods of the year at least, floodplain forests are inundated. Mixed coniferous/broadleaved forests occupy an intermediate position on the soil fertility gradient. A detailed phytosociological description of these basic vegetation units has been provided by Faliński [23], among others. According to current phytosociological investigations, a total of 36 different woodland community types occur in the Białowieża Forest [34].
2.2. Methods
2.2.1. Introductory Remarks - Construction of Equilibrium Size Distribution Taking into Account the Growth and Mortality Rates of Trees and the Desired/Assumed Share of a Given Species in the Particular Woodland Community Type
In the case of tree species, the commonly used measure of the demographic status of the given tree population is size/diameter distribution [28,29,35]. It is largely accepted that in the case of a population in a state of demographic balance/equilibrium, the general form of the distribution of the number of trees in successive diameter classes resembles an inversed letter “J” [36,37,38]. Equilibrium curves/distributions for tree species can be determined in several ways [29]. One of them is the so-called demographic approach [29,30], drawing on information on size-dependent growth and mortality rates [39,40,41,42]. Growth determines the rate of migration of trees from one diameter class to the next, while mortality determines the number of losses depending on size class. Thus, knowing growth and mortality rates, it is possible to calculate the number of trees in each subsequent diameter class of the equilibrium distribution, starting from the first, smallest class. In other words, next to growth and mortality functions, the number of trees in the lowest diameter class is the third (and final) element needed to determine the exact form of the equilibrium distribution. According to the proposal of Brzeziecki et al. [29,30], in this work, the number of trees in the first diameter class was determined in such a way that the basal area calculated for the entire resulting equilibrium distribution corresponded to a certain, predetermined value (reflecting the assumed role of a given tree species in a particular community type). Further details on the approach described here can be found in the work of Brzeziecki et al. [29,30], see also [31]. The main stages of applying this approach to assessing the current demographic structure of the most important tree species occurring in the Białowieża Forest are presented below.
2.2.2. Division of the Białowieża Forest into Sustainability Units
The entire area of the managed part of the Białowieża Forest was first divided into the so-called sustainability (control) units (SUs). Here, the sustainability unit should be understood as the basic unit, for which the primary objective is to maintain the forest continuity in terms of the demographic stability of all tree species that could potentially create tree stands occurring in that unit. In this work, it was assumed that, as a rule, the boundaries of the SUs will coincide with the boundaries of the major forest compartments into which the area of the Białowieża Forest is divided and which act as the elementary units of forest inventory and silvicultural planning.
2.2.3. Determination of the Actual Diameter Distributions of Tree Species Occurring in Individual Sustainability Units
Due to the lack of more precise data at the moment, the current distributions of tree diameters of individual species occurring in the SUs have been defined approximately. For this purpose, data from ca. 9,600 temporary, circular 0.01-0.05 ha plots, measured in 2019-2020 [34], were utilized. First, these data were used to derive empirical diameter distributions for the most important tree species occurring in the particular types of Białowieża woodland communities. In the next step, the aggregated diameter distributions of individual tree species in each SU were reconstructed by calculating the number of trees of a given species in successive diameter classes as an average weighted by the share of area occupied by individual woodland associations occurring in a given SU. When calculating these distributions, 7 cm was assumed as the minimum (threshold) value and 4 cm as the width of the diameter classes.
2.2.4. Determination of Model, Species-Specific Tree-Size Distributions in Particular Sustainability Units
Determining the model (theoretical, desirable, equilibrium) diameter distributions of individual tree species in each SU consisted of two main stages.
The first stage involved dividing the growing space in a given SU between individual tree species, proportionally to their assumed “roles” in this unit. As a measure of the available growing space, the stand basal area was adopted. The model value of this parameter (Bmod) for a given SU was calculated on the basis of the empirical value of this variable determined for all actual diameter distributions of individual tree species (Btot) in this SU (reconstructed as described in point 3.3). For this purpose, first, from the Btot, the basal area of very large trees (with a DBH of ≥67 cm) was subtracted. It was assumed that these trees, due to their high ecological and landscape values, should be excluded from potential regulatory activities. Then, the obtained value of basal area (Bred) was reduced again by subtracting a certain, determined a priori, value corresponding to the intensity of planned regulatory activities (cuts). Finally, calculated in this way, the total model value of basal area (Bmod) in a given SU, was distributed over individual species, in proportion to their assumed “roles” in this SU. The basis for determining these “roles” were the model tree species compositions (expressed as percentages) determined for all woodland types occurring in the Białowieża Forest (the collective share of each tree species in a given SU was calculated as an average weighted by the area of woodland types occurring in this unit).
The second stage consisted in constructing theoretical equilibrium distributions of individual tree species occurring in a given SU. For this purpose, the approach described by Brzeziecki et al. [29,30] was used. According to this approach, the numbers of trees in subsequent diameter classes of theoretical distributions were calculated using empirical functions describing the growth and mortality rates of trees as they move to higher and higher diameter classes. The calculations always started from the smallest diameter class, and the number of trees in this class was assumed to be such that the basal area of the entire theoretical distribution for a given tree species was equal to the value assigned for this species in a given SU.
2.2.5. Comparison of Theoretical vs. Real Diameter Distributions: Calculation of Deficit and Surplus (Total and Effective) Trees of Individual Species; Determining the Approximate Size of Regeneration Spots
The total amount of surplus and deficit trees of a given species was calculated in a simple way as the arithmetic difference between the number of trees in individual diameter classes of the corresponding real and model size distributions. Next, the so-called effective surpluses, which were defined as that part of the total surpluses that should be allocated for removal in the next 10-year long planning period, were calculated. For this purpose, the amount of total surpluses (gross surpluses) determined for each tree species was reduced proportionally in such a way that the sum of basal areas of the species-specific residual distributions (i.e. distributions after performing regulatory cuts) was equal to the assumed model value of this parameter (i.e. Bmod).
The approximate area of necessary regeneration spots (RS) in individual SUs was calculated based on the size of deficits in the first diameter class, using the following formula:
where:
RS = SUS * (DEF * GS / 10000)
RS – the total size of regeneration spots (regeneration patches) for a given tree species (in ha);
SUS – the size of SU (in ha);
DEF – the number of deficit trees of a given species in the smallest diameter class (in trees ∙ ha-1);
GS – the growing space (in m2) of a single tree with DBH = 9 cm of a given species estimated on the basis of the crown projection calculated by means of allometric functions developed for the Białowieża tree species [43].
3. Results
3.1. Number and Size Distribution of Sustainability Units
The total number of sustainability units (SUs) into which the managed part of the Białowieża Forest was divided was 479 (Figure S1). In most cases, the size of individual SUs (after subtracting non-forest areas) ranged from 50 to 175 ha (Figure S2). The average size of the SUs was approximately 110 ha. Due to the large number of analyzed sustainability units, in the rest of this chapter, the data averaged for all units, i.e. for the entire managed part of the Białowieża Forest, are presented. Each time, parameters characterizing individual tree species and/or entire stands were calculated as averages weighted by the size of SUs.
3.2. Actual Tree Diameter Distributions of Individual Species in the Sustainability Units (Determined on the Basis of Their Occurrence in Major Woodland Community Types)
There are a total of 35 different woodland community types occurring in the Białowieża Forest (Table S1). The number of woodland types occurring in individual SUs ranged from 3 to 24 (Figure S3). Species-specific tree size distributions in individual woodland communities types are shown in Figure S4.
Actual tree size distributions in SUs, calculated on the basis of the species-specific distributions in community types, averaged for the whole managed part of the Białowieża Forest, are shown in Table 1. As can be observed, the initial classes of the resulting distributions (with midpoints 9-25 cm) were predominantly occupied by individuals of two species: spruce and hornbeam. In the first diameter class (midpoint 9 cm), the total share of trees of these two species was as high as ca. 75%. In the 25-53 cm diameter classes, alder and pine had the highest density. In turn, in the largest classes (65 cm and more), oak played the important role (which was mainly due to the fact that of all tree species found in the Białowieża Forest, oak trees attain the biggest dimensions). In classes from 41 cm upwards, aspen also appeared quite often. In addition to the species mentioned above, birch also played some role, occurring quite evenly in a wide range of diameter variation. The densities of other species were clearly lower.
3.3. Model (Target, Desirable), Species-Specific Tree Diameter Distributions of Particular Species in Sustainability Units (Taking into Account the Assumed Role of Particular Tree Species in a Given Sustainability Unit)
After subtracting very large trees, i.e. trees with a DBH of ≥67 cm, the actual basal area was 28.8 m2 ∙ ha-1 (parameter Bred, the average value for all SUs). For simplicity, we assumed the same intensity of regulatory cuts in all SUs (amounting to 15%). This means that the value of Bmod was 0.85 * 28.8 m2 ∙ ha-1 = 24.5 m2 ∙ ha-1.
Species-specific values of Bmod were determined on the basis of model (assumed, desired) species compositions of woodland communities occurring in the Białowieża Forest shown in Figure S5. Based on these data, first, model species compositions (in percentage terms, weighted by the area of individual community types) for all SUs were calculated. The results obtained (average values for the whole managed part of the Białowieża) are presented in Table 2. According to data in this table, in Białowieża woodland communities oak should play the largest role, with a share of just over 20%, followed by pine, spruce, alder and hornbeam, with a share of approximately 11-15%. The share of birch should also be quite significant (over 7%). The shares of other species should be in the range of 3-5%.
In the next step, model shares of individual tree species in particular SUs, calculated as explained above, were used to assign an appropriate part of the overall, model value of stand basal area (Bmod = 24.5 m2 ∙ ha-1) to each species (Table 3).
In the last step, the species-specific values of basal area, as provided in Table 3, together with appropriate growth and mortality functions [29], were used to create model diameter distributions in all SUs. The results of these calculations, averaged for the entire managed part of the Białowieża Forest, are given in Table 4.
The actual (Table 1) and model (Table 4) species-specific diameter distributions (expressed as percentage of species-specific tree number in a given diameter class in relation to the total number of trees in that class) are visually compared in Figure 1. In the case of the actual shares of individual tree species in the small diameter classes, there is a clear overrepresentation of hornbeam and spruce trees, while in the intermediate classes there is an overrepresentation of pine and alder (compared to the model values). In turn, some species, especially those of less importance (ash, maple, elm), are almost completely missing from the actual distributions.
3.4. Total Number of Surplus and Deficit Trees
The amount of the total surpluses (determined by subtracting the model distributions from the empirical distributions) is shown in Figure 2 (average data for the entire area of the managed part of the Białowieża Forest). One may notice that the greatest surpluses occurred in four tree species: pine, spruce, hornbeam and alder. For spruce and hornbeam they occurred mainly in the small diameter classes, for pine - in intermediate trees, and for alder - quite evenly in classes from 9 to approximately 49 cm. Some surpluses also appeared in the case of birch and lime.
The total density of surplus trees was 267.7 ha-1, which constituted approximately 47% of the current total density of all trees, while the basal of the excess trees was 13.1 m2 ∙ ha-1, which constituted 45% of the total value of the actual value of basal area after subtracting very large trees.
In turn, the greatest deficits occurred in the three initial diameter classes (with midpoints 9-17 cm) – Figure 3. The first diameter class was particularly outstanding in this respect, where the greatest shortages in terms of the number of trees concerned species such as pine, birch, spruce, oak, aspen, elm and ash.
The total amount of shortages was 229.2 ha-1, which constituted approximately 40% of the current density of all trees, whereas the total basal area of the deficiencies was 8.8 m2 ∙ ha-1 which was approximately 30% of the current total value of this parameter, after excluding very large trees.
3.5. Effective Surpluses
The amount of effective surpluses of particular tree species (average values for the entire managed part of the Białowieża Forest) in consecutive diameter classes is shown in Figure 4. Most of the trees to be removed represent small and intermediate diameter classes (with midpoints from 9 to 45 cm). In the smallest diameter classes (9-21 cm) hornbeam trees dominate. Most spruce trees to be removed belong to classes from 17 to 33 cm, while alder and pine trees stem from 25-41 cm classes. The total density of trees to be removed was 94.4 ha-1, while their basal area amounted to 4.3 m2 ∙ ha-1 (i.e. 15% of the actual value of the total basal area, after subtracting very large trees).
Deficit and surplus trees, as determined for individual tree species, are jointly shown in Figure 5. On this basis, some distinctive groups of tree species can be defined. In the case of pine and birch, there were both surplus as well as deficit trees. For spruce, hornbeam and alder, extensive surpluses occurred over a wide range of tree diameters (except the largest trees). At the same time, deficits were rather small and concerned mainly large trees. The empirical size distribution of lime was close to the assumed model distribution. In the case of remaining species (aspen, oak, maple, elm, ash), smaller or bigger deficits involved practically the whole considered diameter range.
3.6. Estimated Area of Regeneration Spots (Regeneration Patches) (Required to Reduce Species-Specific Deficits in the Smallest Diameter Class)
The average total size of necessary regeneration spots, per one SU, calculated on the basis of deficits in the smallest diameter class (midpoint = 9 cm), was approximately 14 ha, which constituted approximately 13% of the average size of SU (Table 6).
4. Discussion
4.1. Balanced Demography of Tree Population: A Key to Maintain High Natural Values of Woodland Communities
Trees, as the so-called foundation species [17,18,21], play a vital role in the functioning of forest ecosystems and maintaining their high natural values [13,15]. In order for them to play this role sustainably (within a given time and space scales), the populations of individual tree species should be demographically stable, i.e. their size distributions should have a steeply descending monotonic form [28]. How many trees there should be in subsequent classes of diameter distributions to ensure the demographic sustainability of a given population depends on two main (species-specific) demographic processes: growth and mortality. The result of the growth process (leading to the increased tree size) is the migration of trees into increasingly higher diameter classes. This process is always accompanied by tree mortality, caused by factors such as competition for limited environmental resources (space, light, water, nutrients) and the impact of various types of abiotic (extreme temperature, droughts, strong winds, collapse of larger neighbors) and biotic factors (large herbivores, insects, fungi). Knowing these two processes in quantitative terms and assuming a specific role/share of a given species in a particular woodland community, it is possible to calculate the number of trees in subsequent diameter classes of theoretical equilibrium distribution [29,35,39]. In this work, to characterize the growth and mortality rates of trees, the functions parameterized by Brzeziecki et al. [29] were used, based on data collected during a research conducted on permanent plots in the Białowieża Forest over a period of almost 80 years. Such a long study period provides an opportunity to eliminate the influence of random factors on the examined processes and increases a chance to correctly determine the main trends and patterns [44].
In addition to the tree growth and mortality functions, an important element of the approach used in this work to construct demographic equilibrium curves was also a model value of the basal area, assigned to the given SU as a whole and to the individual tree species. We assumed that the basis for determining the total model value of the basal area (characterizing the condition of stands in the given SU after regulatory cuts) should be the actual value of this parameter in that SU (after excluding very large trees), reduced by a certain, predetermined figure (15% in our case). The above number has been chosen more or less arbitrary, but it was adopted at such a level as to ensure that the basal area of trees harvested during regulatory cuts will be about 50% of the estimated value of the current 10-year long, periodic increment of basal area in the Białowieża stands [34]. An alternative solution could be to adopt an arbitrary, constant value of the target basal area, the same for all SUs, similarly as, for example, in the BDq method, which is often used as a regulation tool in structurally diverse stands [45,46,47,48,49,50,51]. In the latter case, however, it could happen that in some SUs, due to the actual value of the basal area being lower than the target one, no regulatory cuts would be possible in a given planning period.
The above-mentioned total value of the basal area was divided among individual tree species, in proportion to their assumed shares in the stands of a given sustainability unit. For this purpose, the data on model tree species composition of the main types of Białowieża woodland communities were used (adopted after [34]). These data constitute a synthesis of many previous phytosociological studies conducted at different times in the communities of the Białowieża Forest by numerous researchers [23,52,53,54]. Although these data are, at least to some extent, arbitrary, they seem to constitute a reasonable approximation of what can be assumed or expected in relation to individual tree species based on knowledge of their life strategies, ecological requirements and biological properties. This does not change the fact that the assumptions made in this respect (which are necessarily based on past experience) can be modified at any time. In the face of climate change and modifications of other important environmental parameters (e.g. caused by deposition of nitrogen compounds), this may turn out to be necessary, indeed [55,56,57]. Nevertheless, in any situation, striving to ensure a balanced demographic status of a given species, regardless of its assumed role or participation in community structure, remains an issue of fundamental, prime importance [15,28,58].
To check whether the tree species occurring in the managed part of the Białowieża Forest are demographically stable, the model distributions constructed for individual species were compared with their actual distributions. In this work, the latter, due to the lack of other data at the moment, were reconstructed in an approximate way, however, using an extensive empirical database consisting of appr. 9,600 sample plots. In the future, it's certainly worth striving to improve the accuracy of these data. Promising prospects in this area are related, among others, to the constant progress in the field of tree and species recognition, which takes place in the case of remote sensing methods [59].
Achieving population balance by individual tree species is, to a large extent, a matter of appropriate spatial scale [28,60,61]. This problem especially concerns species with high light requirements [40,62]. In this work, it was assumed that, as a rule, efforts should be made to ensure the demographic stability of individual tree species within relatively small sustainability units with an average size of approximately 100 hectares. Nevertheless, this size seems to be sufficient even for species with high light requirements. Moreover, maintaining the demographic balance of species at such (rather small) scale should have a positive impact on the overall state of preservation of forest-associated biodiversity and should help to increase an adaptive potential of woodland communities to changes occurring in the environment [63,64]. Nevertheless, the decision to determine the size and boundaries of sustainability units is more or less conventional and may, and even should, take into account various considerations, of ecological, organizational and technical nature.
4.2. Common Deviations Between Actual and Theoretical Tree Size Distributions in Białowieża Forest: Major Causes and Implications
In the case of many or even the majority of tree species occurring in the Białowieża Forest, the current situation is that their actual diameter distributions deviate, to a greater or lesser extent, from the desired equilibrium state, which is reflected in significant amounts of total surpluses and deficits. In certain, usually middle, ranges of tree diameters of some species, there are surpluses, and in others (generally in the range of the smallest trees, and to some extent also in the largest trees) there are deficits of the actual number of trees in relation to the model values. At the moment, almost half of all trees currently present in the Białowieża Forest represent "inappropriate", i.e. found in excess in relation to the balanced model, species and/or diameter ranges. This problem mainly concerns hornbeam, spruce, alder and pine. The scale of the deficits is also similar, estimated at over 40% of the current total number of trees.
The question arises why such a large area covered by this study (over 520 km2) was not sufficient to allow for a demographic balance at the level of individual tree species. There is certainly no one simple answer to this question. What is of fundamental importance here is the fact that in the area in question for over 100 years, i.e. since World War I, exploitation of wood resources has been carried out, initially in the form of plundering cuts (German cuttings during World War I, the activities of the “Century” company during interwar period), and then, in the post-war period, in the form of regulated forest management, favoring certain tree species at the expense of others [23,33].
The legacy of events that took place at the beginning of the 20th century, and probably also in the post-war years, which has been preserved to this day, is, among others, excessive occurrence of alder stands in the fertile and wet habitats of the Białowieża Forest, potentially favoring the occurrence of much more diverse tree stands, consisting of ash, maple, elm, oak, spruce, hornbeam and lime.
The heritage of forest management is certainly overrepresentation of pine, and to some extent also spruce, in some stands, which is the result of (excessive) favoring of these species in the past.
Hornbeam is also one of the species found in great abundance. In this case, it is primarily the result of the high competitive ability and shade tolerance of this species. It is worth emphasizing that, from the point of view of forest management, the expansion of hornbeam under the canopy of other species (such as pine or oak) is basically a desirable phenomenon. The problem occurs when a given forest area is completely taken over by hornbeam, because practically no other tree species are able to effectively compete with it.
The influence of forest management can also explain the currently low role of species such as birch and especially aspen in the tree stands of the managed part of the Białowieża Forest. The populations of these species, being less valuable from an economic point of view, has been systematically reduced over time during thinning operations carried out in favor of species that are more valuable from an economic point of view (oak, pine, spruce) [65].
In turn, the currently low density of species such as elm and ash is the result of the mass death of trees of these species caused by factors on which forest management had practically no influence (Dutch disease in the case of elm and the invasive fungus Chalara fraxinea in the case of ash [66]).
In order to properly assess the impact of past forest management in the Białowieża Forest on the current species composition of tree stands and the demographic structure of individual tree species, it is worth comparing the situation in the managed part of the forest with that in the “Strict Reserve” of the Białowieża National Park, i.e. in this part of the forest, which has been under strict protection for over 100 years. Research on permanent research plots established in the Park shows that the current demographic structure of many, or even the vast majority, of tree species occurring in this area is much less favorable than in the managed part of the Białowieża Forest [67]. A key role here is played by the phenomenon referred to in the ecological and forestry literature as "tree recruitment failure" [15,35,58,68,69,70]. In the case of the Białowieża National Park, there are many reasons for this phenomenon [29,30,71,72]. A particularly important role is played by the strong, uncontrolled pressure of large herbivores (bison, elk, deer and roe deer), resulting in the almost complete elimination of many tree species from regeneration processes [73,74].
For this reason, in general, the demographic status of many tree species in the managed part of the Białowieża Forest (where, among other things, for many years the access of ungulates to the young stand development stages was effectively limited by the use of fences) is at the moment much more favorable than in its part that has been under “strict protection” for years. This is particularly clear in the case of species that play a key role in the forest stands of the Białowieża Forest: oak, pine and spruce [29,67,72]. This indirectly indicates the potential of appropriate forest management to create woodland communities distinguished by a diversified structure and a balanced demographic structure of individual tree species. This potential can and even should be used to restore the appropriate status and role not only of the above-mentioned species traditionally favored in forest management, but also all the others, while maintaining appropriate quantitative proportions between them. In this context, one of the priorities of active actions covering most of the area of the Białowieża Forest could be, for example, the development of a comprehensive program aimed at recovering the declined population of ash, which is associated with a large group of forest organisms [66].
4.3. Looking for an Efficient Conservation Strategy of Białowieża Woodland Communities: A Passive or an Active Approach?
With regard to the forest ecosystems in the managed part of the Białowieża Forest, two general strategies are possible. One strategy is to refrain from any action and hope that the diverse species composition of tree stands and the balanced demography of individual tree species will develop spontaneously, i.e. as a result of natural processes. An alternative to the above strategy is the approach outlined in this study. This approach is based on the assumption that one should not passively wait and count on that the desired state of the Białowieża Forest ecosystems will spontaneously recover (in a rather unspecified future), but that appropriate actions should be initiated to restore this (desired) state right here and now.
In the approach presented in this study, the concept of active regulation of the structure of woodland communities as an alternative to the idea of protecting natural (spontaneous) processes plays a key role. The concept of regulation assumes application of practices controlling the density, species composition, and sizes of trees through periodic harvest treatments, thinnings, and regeneration treatments [51]. The aim of active regulatory activities is to divide the available growing space between individual forest components (tree species and their development stages) in a way that ensures the (relative) permanence of the desired structure of woodland communities at a given spatial scale (here: within the boundaries of sustainability units).
The primary goal of regulation can also be defined as the transformation of a given forest structure into another (more desirable one). The potential scope of regulatory activities may also include other (beyond the above) structural elements contributing to the complexity of the forest (tree stand), such as dead standing and lying trees. The structure of the forest is constantly changing as a result of the appearance of new trees (the recruitment process) and the use of available space by existing trees (the growth process). The basic task of regulation in this situation is to ensure that these processes do not cause too far-reaching changes and deviations from the structure of the forest, considered as optimal from the point of view of the possibility of achieving various goals and expectations towards forests [51].
The approach presented in this work is an example of the application of the concept of regulating forest structure in order to achieve effects desired primarily from the point of view of nature conservation. As part of this approach, it was first defined what the condition of the forest ecosystems in the Białowieża Forest should be, primarily in terms of the species diversity of tree stands and the demographic structure of individual tree species. Next, the desired state was compared with the current situation and the nature and type of discrepancies between them were determined. These discrepancies constitute the basis for planning actions and treatments aimed at gradually bringing the current state closer to the desired conditions. Achieving this goal would require taking actions consisting in: 1) gradual elimination of existing surpluses, taking into account those species and those diameter ranges where they are the largest; 2) gradual eradication of existing deficits, primarily by actively supporting the process of regeneration and recruitment to the stand stage in the case of those tree species that show in this regard the greatest deficiencies.
The need to eliminate surplus trees can be justified by the necessity to create free space for tree species that are in short supply. Excesses and deficiencies are often interrelated, in the sense that the occurrence of excesses in certain species and in certain tree diameter ranges causes deficiencies in other species and in other diameter ranges. It is known, for example, that too large a representation of trees in higher diameter classes may result in a strong inhibition of regeneration processes, thus leading to the occurrence of shortages in the initial diameter classes [49].
The early life stages are crucial for maintaining population viability [15]. This is also confirmed by the situation in the Białowieża Forest where many tree species have not been regenerating naturally or have been regenerating to an insufficient extent [72]. For this reason, an active intervention and supporting tree recruitment processes has often been suggested by several researchers studying at different times the Białowieża Forest [52,53,54,75]. For example, in his outstanding, comprehensive botanical monograph devoted to Białowieża Forest, Paczoski [52] suggested the promotion, by means of active silvicultural measures, of oak, at the expense of hornbeam. Similar suggestions, with regard to several different tree species (Scots pine, Norway maple, ash, elm and alder) have also been made by other researchers.
Actions aimed at reducing existing deficits in some species can and even should be combined with actions aimed at eliminating existing surpluses. Places where there is a particularly large concentration of species and diameter classes occurring in excess in relation to the equilibrium curves should be selected for the establishment of regeneration spots for species in short supply. First of all, natural regeneration should be preferred, and if this is not possible, artificial regeneration should be used.
To sum up, the approach proposed in this work allows for the assessment of the population viability of tree species that play a key role in the functioning of forest ecosystems [13,28,76]. It meets also the increasingly emerging demands regarding the selection of the optimal strategy for areas characterized by high natural values [77]. A good example in this area is the work edited by Cole and Yung [78]. As the authors of this work clearly state, for many reasons it is not possible to effectively protect nature today by enclosing it within “protected areas” (reserves, national parks and wilderness areas), drawing a line around them and leaving them alone (cf. also [79]). Protecting an area’s beauty, heritage, and biodiversity entails thoughtful stewardship and, at times, active intervention. The pertinent examples include lighting fires, culling ungulate populations, thinnings, assisting migration of individuals or species, mixing tree species; suitable planting programmes [13,15,28,69,70,76].
At the moment, there is a little chance that the above-mentioned postulates of Cole and Yung [78] and other authors cited above, exemplified by the principles of an approach outlined in this paper, will find a wide application in the case of the Białowieża Forest. In 2014, the Białowieża Forest received the status of a World Heritage Site, and the adopted principles of operation of this site assumed that no activities will be carried out in the majority of the forest area (approx. 80%) [80]. Nevertheless, the remaining 20% of the area (and the buffer zone) constitutes a potential arena for implementing the solutions proposed in this work. Thanks to this, over time it would be possible to compare both of these strategies (passive, based on the principle of strict protection, and active, assuming appropriately directed human activities) in terms of their impact on the overall degree of species and structural diversity of forest stands, and indirectly - on the preservation of overall biodiversity.
Obviously, the application of the approach described here is not limited to the area of the Białowieża Forest, which was analyzed in this work as a representative example, but is also possible in relation to other forests, in all cases where the preservation of high natural values of forest ecosystems is one of the priority tasks of forest management.
5. Conclusions
Trees act in forest ecosystems as the so-called foundation species, i.e. species that have the most significant impact on the main processes and phenomena occurring in woodland communities and on which the existence of virtually all other groups of forest-associated organisms depend, either directly or indirectly. The essential condition for sustainably playing this role (within a specific time and space scales) is a balanced demographic structure of individual tree species, which is reflected in the appropriate proportions of individuals representing particular development stages (young/small trees, middle-aged/intermediate-sized trees and old/large trees). Maintaining demographic sustainability requires that there be the largest number of youngest/small trees, and fewer and fewer older and larger trees, in accordance with a general model often compared to the inversed letter “J”. The analysis of the current demographic status of individual tree species occurring in the managed part of the Białowieża Forest revealed that the actual diameter distributions of most of them are characterized by large deviations, both positive and negative, from the desired equilibrium state. The reasons for this situation are complex and result from both human-related factors and the impact of changing general environmental conditions. A specially important problem is large shortages in the number of trees in the smallest diameter classes, as observed for many species in the Białowieża Forest. This calls into question the possibility of them to play the role of foundation species in a sustainable manner and thus preserving the high natural values of local woodland communities. The concept of protecting natural processes, currently adopted in relation to most of the area of the Białowieża Forest, indirectly assumes that the desired demographic balance of individual tree species will be restored spontaneously, although in an unspecified future. An alternative to this concept is an active strategy, which assumes actions aimed at the gradual elimination of identified excesses and deficiencies of trees in relation to the desired equilibrium state and bringing the current tree diameter distributions closer to the model distributions, ensuring the demographic sustainability of tree species and, implicitly, preservation of forest-associated biodiversity.
Supplementary Materials
The following supporting information can be downloaded at the website of this paper posted on Preprints.org. Figure S1. Partition of the managed part of the Białowieża Forest into forest compartments playing the role of elementary units of forest sustainability (forest compartment = sustainability unit (SU)). Figure S2. The number of sustainability units in area size classes: 1: <25 ha; 2: 25-50 ha; 3: 50-75 ha; …; 8 ≥175 ha. Figure S3. Number of sustainability units in Białowieża Forest by the number of woodland community types. Figure S4. Actual diameter distributions of the main tree species occurring in the Białowieża woodland communities (based on data from ca. 9,600 temporary 0.01-0.05 ha plots [34]). The sequence of community types as in Table S1. Figure S5. Model tree species composition (in % of basal area) of forest stands in the woodland community types occurring in the Białowieża Forest (after [34]). The sequence of community types reflects a major environmental gradient from most oligotrophic to most eutrophic and wettest sites. Table S1. List and area of woodland community types occurring in the managed part of the Białowieża Forest (source: [34]).
Author Contributions
B.B. designed the study and wrote the first draft of the paper. J.Z. performed data analysis. M.K., Ł.K. and M.K. conducted field work. All authors collaborated on data analysis and writing of the paper.
Acknowledgments
Research funded by the General Directorate of State Forests in Poland (GA No. EO.271.3.1.2019).
Conflicts of Interest
The authors declare no conflicts of interest. The funding sponsors had no role in the design of the study; in the collection, analysis, or interpretation of data; in the writing of the manuscript, or in the decision to publish the results.
References
- Kannan, R. , James, D.A. Effects of climate change on global biodiversity: a review of key literature. Trop. Ecol.
- Wilson, E.O. Half-Earth: Our Planet’s Fight for Life. 2016. New York, NY: Liveright Publishing Corp.
- IPBES. Summary for policymakers of the global assessment report on biodiversity and ecosystem services of the Intergovernmental Science-Policy Platform on Biodiversity and Ecosystem Services. 2019. IPBES secretariat, Bonn, Germany. DOI. [CrossRef]
- Sala, O.E.; Chapin, F.S.; Armesto, J.J.; Berlow, E.; Bloomfield, J.; Dirzo, R.; Huber-Sanwald, E.; Huenneke, L.F.; Jackson, R.B.; Kinzig, A.; Leemans, R.; Lodge, D.M.; Mooney, H.A.; Oesterheld, M.; Poff, N.L.; Sykes, M.T.; Walker, B.H.; Walker, M.; Wall, D.H. Global biodiversity scenarios for the year 2100. Science. 2000, 287(5459), 1770–4. [Google Scholar] [CrossRef] [PubMed]
- Wilkening, J.L.; Magness, D.R.; Thompson, L.M.; Lynch, A.J. A brave new world: Managing for biodiversity conservation under ecosystem transformation. Land. 2023, 12, 1556. [Google Scholar] [CrossRef]
- Galatowitsch, S.; Frelich, L.; Phillips-Mao, L. Regional climate change adaptation strategies for biodiversity conservation in a midcontinental region of North America. Biol. Conserv. 2009, 142, 2012–2022. [Google Scholar] [CrossRef]
- EU Biodiversity Strategy for 2030. Bringing nature back into our lives. 2020. European Commission. Brussels.
- Pötzelsberger, E.; Bauhus, J.; Muys, B.; Wunder, S.; Bozzano, M.; Farsakoglou, A.-M.; Schuck, A.; Lindner, M.; Lapin, K. Forest biodiversity in the spotlight – what drivers change? 2021. European Forest Institute. [CrossRef]
- Muys, B.; Angelstam, P.; Bauhus, J.; Bouriaud, L.; Jactel, H.; Kraigher, H.; Müller, J.; Pettorelli, N.; Pötzelsberger, E.; Primmer, E.; Svoboda, M.; Thorsen, B.J.; Van Meerbeek, K. Forest Biodiversity in Europe. 2022. From Science to Policy 13. European Forest Institute. [CrossRef]
- Brzeziecki, B. Białowieża Forest as a biodiversity spot (In Polish with English Summary). Sylwan. 2017, 12, 971–981. [Google Scholar] [CrossRef]
- Brzeziecki, B. Conservation of forest biodiversity: a segregative or an integrative approach? Sylwan. 2022, 7, 470–490. [Google Scholar] [CrossRef]
- Götmark, F. Habitat management alternatives for conservation forests in the temperate zone: Review, synthesis, and implications. Forest Ecol. Manag. 2013, 306, 292–307. [Google Scholar] [CrossRef]
- Ampoorter, E.; Barbaro, L.; Jactel, H.; Baeten, L.; Boberg, J.; Carnol, M.; Castagneyrol, B.; Charbonnier, Y.; Dawud, S.M.; Deconchat, M.; Smedt, P.D.; Wandeler, H.D.; Guyot, V.; Hättenschwiler, S.; Joly, F.-X.; Koricheva, J.; Milligan, H.; Muys, B.; Nguyen, D.; Ratcliffe, S.; Raulund-Rasmussen, K.; Scherer-Lorenzen, M.; van der Plas, F.; Keer, J.V.; Verheyen, K.; Vesterdal, L.; Allan, E. Tree diversity is key for promoting the diversity and abundance of forest-associated taxa in Europe. Oikos. 2020, 129, 133–146. [Google Scholar] [CrossRef]
- FOREST EUROPE. The State of Europe’s Forests. 2020. Forest Europe Liason Unit. Bratislava. Slovakia.
- Ohse, B.; Compagnoni, A.; Farrior, C.E.; McMahon, S.M.; Salguero-Gómez, R.; Rüger, N.; Knight, T.M. Demographic synthesis for global tree species conservation. Trends Ecol. Evol. 2023, 6, 579–590. [Google Scholar] [CrossRef]
- Dale, V.H.; Joyce, L.A.; McNulty, S.; Neilson, R.P.; Ayres, M.P.; Flannigan, M.D.; Hanson, P.J.; Irland, L.C.; Lugo, A.E.; Peterson, Ch.J.; Simberloff, D.; Swanson, F.J.; Stocks, B.J.; Wotton, B.M. Climate Change and Forest Disturbances: Climate change can affect forests by altering the frequency, intensity, duration, and timing of fire, drought, introduced species, insect and pathogen outbreaks, hurricanes, windstorms, ice storms, or landslides. Bioscience. 2001, 51, 723–734. [Google Scholar] [CrossRef]
- Palik, B.; Engstrom, R.T. Species composition. In: Hunter Jr, M.L. (ed.). Maintaining Biodiversity in Forest Ecosystems. 2004. Cambridge University Press. Cambridge. Pp. 65-94.
- Ellison, A.M.; Bank, M.S.; Clinton, B.D.; Colburn, E.A.; Elliott, K.; Ford, C.R.; Foster, D.R.; Kloeppel, B.D.; Knoepp, J.D.; (. ..), Webster, J.R. Loss of foundation species: consequences for the structure and dynamics of forested ecosystems. Front. Ecol. Environ. 2005, 3, 479–486. [Google Scholar] [CrossRef]
- Boonman, C.C.F.; Serra-Diaz, J.M.; Hoeks, S. Guo W.-Y.; Enquist B.J.; Maitner B.; Malhi Y.; Merow C.; Buitenwerf R.; Svenning J.-Ch. More than 17,000 tree species are at risk from rapid global change. Nat. Commun, 1038; 15. [Google Scholar]
- Faliński, J.B.; Mułenko, W. Cryptogamous plants in the forest communities of Białowieża National Park. Phytocoenosis 1996, 8, 75–110. [Google Scholar]
- Alexander, K.; Butler, J.; Green, T. The value of different tree and shrub species to wildlife. Brit. Wildl. 2006, 1, 18–28. [Google Scholar]
- Senn-Irlet, B. Welches sind pilzreiche Holzarten? Wald und Holz 2008, 10, 57–59. [Google Scholar]
- Faliński, J.B. Vegetation dynamics in temperate lowland primeval forests. Ecological studies in Białowieża Forest. Dr W. Junk Publishers, Dordrecht/Boston/Lancaster. Geobotany.
- Okołów, Cz.; Karaś, M.; Bołbot, A. (Eds.) Białowieski Park Narodowy. Poznać. Zrozumieć. Zachować. 2009. Białowieski Park Narodowy. Białowieża.
- Faliński, J.B. Zielone grądy i czarne bory Białowieży. Część tekstowa. 1977. Instytut Wydawniczy Nasza Księgarnia. Warszawa.
- Faliński, J.B. Concise geobotanical atlas of Białowieża Forest. Phytocoenosis. Supplementum Cartographiae Geobotanicae. 1994, 6, 3–12. [Google Scholar]
- Gamfeldt, L.; Snäll, T.; Bagchi, R.; Jonsson, M.; Gustafsson, L.; Kjellander, P.; Ruiz-Jaen, M.C.; Fröberg, M.; Stendahl, J.; Philipson, C.D.; Mikusiński, G.; Andersson, E.; Westerlund, B.; Andrén, H.; Moberg, F.; Moen, J.; Bengtsson, J. Higher levels of multiple ecosystem services are found in forests with more tree species. Nat. Commun. 2013, 4, 1340. [Google Scholar] [CrossRef]
- Halpin, C.R.; Lorimer, C.G. A demographic approach to evaluating tree population sustainability. Forests 2017, 8, 46. [Google Scholar] [CrossRef]
- Brzeziecki, B.; Pommerening, A.; Miścicki, S.; Drozdowski, S.; Żybura, H. A common lack of demographic equilibrium among tree species in Białowieża National Park (NE Poland): evidence from long-term plots. J. Veg. Sci. 2016, 27, 460–469. [Google Scholar] [CrossRef]
- Brzeziecki, B.; Drozdowski, S.; Bielak, K.; Czacharowski, M.; Zajączkowski, J.; Buraczyk, W.; Gawron, L. A demographic equilibrium approach to stocking control in mixed, multiaged stands in the Białowieża Forest, Northeast Poland. Forest Ecol. Manag. 2021, 481, 118694. [Google Scholar] [CrossRef]
- Olofsson, L.; Langvall, O.; Pommerening, A. Norway spruce (Picea abies (L.) H. Karst.) selection forests at Siljansfors in Central Sweden. Trees, Forests and People, 0392. [Google Scholar] [CrossRef]
- Kwiatkowski, W. Vegetation landscapes of Białowieża Forest. Phytocoenosis. Supplementum Cartographiae Geobotanicae. 1994, 6, 35–87. [Google Scholar]
- Więcko, E. Puszcza Białowieska. 1984. PWN. Warszawa.
- BULiGL. Forest management plans for Białowieża, Browsk and Hajnówka Forest Districts for years 2021-2030 (In Polish). 2021. BULiGL. Białystok.
- Salk, T.T.; Frelich, L.E.; Sugita, S.; Calcote, R.; Ferrari, J.B.; Montgomery, R.A. Poor recruitment is changing the structure and species composition of an old-growth hemlock-hardwood forest. Forest Ecol. Manag. 2011, 261, 1998–2006. [Google Scholar] [CrossRef]
- de Liocourt, F. De l’amenagement des sapinieres. Bulletin trimestriel -, 1898. [Google Scholar]
- Lorimer, C.G.; Frelich, L.E. A simulation of equilibrium diameter distributions of sugar maple (Acer saccharum). B. Torrey Bot. Club. 1984, 111, 193–199. [Google Scholar] [CrossRef]
- Wang, X.; Hao, Z.; Zhang, J.; Lian, J.; Li, B.; Ye, J.; Yao, X. Tree size distributions in an old-growth temperate forest. Oikos. 2009, 118, 25–36. [Google Scholar] [CrossRef]
- Schütz, J.-P. Dynamique et conditions d’equilibre de peuplements jardin es sur les stations de la hêtraie a sapin. Schweiz. Z. Forstw. 1975, 126, 637–671. [Google Scholar]
- Schütz, J.-P. Modelling the demographic sustainability of pure beech plenter forests in Eastern Germany. Ann. For. Sci. 2006, 63, 93–100. [Google Scholar] [CrossRef]
- Coomes, D.A.; Duncan, R.P.; Allen, R.B.; Truscott, J. Disturbances prevent stem size-density distributions in natural forests from following scaling relationships. Ecol. Lett. 2003, 6, 980–989. [Google Scholar] [CrossRef]
- Kohyama, T.S.; Potts, M.D.; Kohyama, T.I.; Rahman Kassim, A.; Ashton, P.S. Demographic properties shape tree size distribution in a Malaysian rain forest. Am. Nat. 2015, 185, 367–379. [Google Scholar] [CrossRef]
- Bolibok, L.; Brzeziecki, B. An analysis of selected allometric relationships for main tree species of the Białowieża National Park (In Polish with English summary). Sylwan. 2000, 6, 73–81. [Google Scholar]
- Muller-Landau, H.C.; Condit, R.S.; Harms, K.E.; Marks, Ch.O.; Thomas, S.C.; Bunyavejchewin, S.; Chuyong, G.; Co, L.; Davies, S.; (. ..), Ashton, P. Comparing tropical forest tree size distributions with the predictions of metabolic ecology and equilibrium models. Ecol. Lett. 2006, 9, 589–602. [Google Scholar] [CrossRef] [PubMed]
- Baker, J.B.; Cain, M.D.; Guldin, J.M.; Murphy, P.A.; Shelton, M.G. Uneven-Aged Silviculture for the Loblolly and Shortleaf Pine Forest Cover Types. 1996. General Technical Report SO-118. USDA Forest Service. Southern Research Stadion. Asheville, NC. USA.
- Buongiorno, J.; Kolbe, A.; Vasievich, M. Economic and Ecological Effects of Diameter-Limit and BDq Management Regimes: Simulation Results for Northern Hardwoods. Silva Fenn. 2000, 34(3), 223–235. [Google Scholar] [CrossRef]
- Cancino, J.; von Gadow, K. Stem number guide curves for uneven-aged forests development and limitations. In: von Gadow, K.; Nagel J.; Saborowski, J. (eds.) Continuous Cover Forestry. 2002. Kluwer Academic Publishers. Pp.: 163-174.
- O’Hara, K.L.; Gersonde, R.F. Stocking control concepts in uneven-aged silviculture. Forestry. 2004, 2, 131–143. [Google Scholar] [CrossRef]
- Ducey, M.J. The Reverse-J and Beyond: Developing Practical, Effective Marking Guides. In Proceedings of Implementing Uneven-Aged Management in New England: Is it practical? Fox Research and Demonstration Forest, Hillsborough, NH, USA, 13 April 2006; Caroline, A. Ed.: U.N.H. Cooperative Extension: Durham, NH, USA. 2006. [Google Scholar]
- Brzeziecki, B.; Drozdowski, S.; Bielak, K.; Gawron, L.; Buraczyk, W. Promoting diverse forest stand structure under lowland conditions (In Polish with English summary). Sylwan. 2013, 8, 597–606. [Google Scholar]
- O'Hara, K.L. Multiaged Silviculture. Managing for Complex Forest Stand Structures. 2014. Oxford. Oxford University Press.
- Paczoski, J. Lasy Białowieży. 1930. PROP. Poznań.
- Matuszkiewicz, W. Zespoły leśne Białowieskiego Parku Narodowego. Annales UMCS. Lublin – Polonia. Supplementum VI. Sectio C.
- Sokołowski, A. Lasy Puszczy Białowieskiej. 2004. CILP. Warszawa.
- Seastedt, T.R.; Hobbs, R.J.; Suding, K.N. Management of novel ecosystems: are novel approaches required? Front. Ecol. Environ. 2008, 10, 547–553. [Google Scholar] [CrossRef]
- Gonzalez, P.; Neilson, R.P.; Lenihan, J.M.; Drapek, R.J. Global patterns in the vulnerability of ecosystems to vegetation shifts due to climate change. Global Ecol. Biogeogr. 2010, 6, 755–768. [Google Scholar] [CrossRef]
- Milad, M.; Schaich, H.; Bürgi, M.; Konold, W. Climate change and nature conservation in Central European forests: A review of consequences, concepts and challenges. Forest Ecol. Manag. 2011, 261, 829–843. [Google Scholar] [CrossRef]
- Stanke, H.; Finley, A.O.; Domke, G.M.; Weed, A.S.; MacFarlane, D.W. Over half of western United States’ most abundant tree species in decline. Nat. Commun. 2021, 12, 451. [Google Scholar] [CrossRef]
- Zhong, L.; Dai, Z.; Fang, P.; Cao, Y.; Wang, L. A Review: Tree Species Classification Based on Remote Sensing Data and Classic Deep Learning-Based Methods. Forests. 2024, 15. [Google Scholar] [CrossRef]
- Rubin, B.D.; Manion, P.D.; Faber-Langendoen, D. Diameter distributions and structural sustainability in forests. Forest Ecol. Manag. 2006, 222, 427–438. [Google Scholar] [CrossRef]
- Janowiak, M.K.; Nagel, L.M.; Webster, C.R. Spatial scale and stand structure in northern hardwood forests: implications for quantifying diameter distributions. For. Sci. 2008, 54(5), 497–506. [Google Scholar] [CrossRef]
- Schütz, J.-Ph. Der Plenterwald. 2001. Parey Buchverlag. Berlin. Germany.
- Zajączkowski, J.; Brzeziecki, B.; Perzanowski, K.; Kozak, I. Impact of potential climate changes on competitive ability of main forest tree species in Poland (In Polish with English summary). Sylwan. 2013, 157(4), 253–261. [Google Scholar] [CrossRef]
- Brang, P.; Spathelf, J.; Larsen, B.; Bauhus, J.; Bončìna, A.; Chauvin, Ch.; Drössler, L.; García-Güemes, C.; Heiri, C.; Kerr, G.; Lexer, M.J.; Mason, B.; Mohren, F.; Mühlethaler, U.; Nocentini, S.; Svoboda, M. Suitability of close-to-nature silviculture for adapting temperate European forests to climate change. Forestry. 2014, 87, 492–503. [Google Scholar] [CrossRef]
- Borecki, T.; Brzeziecki, B. Silvicultural analysis of post-Century stands in the Białowieża Forest (In Polish with English summary). Sylwan. 2001, 7, 19–29. [Google Scholar]
- Pautasso, M.; Aas, G.; Queloz, V.; Holdenrieder, O. European ash (Fraxinus excelsior) dieback - A conservation biology challenge. Biol. Conserv. 2013, 158, 37–49. [Google Scholar] [CrossRef]
- Brzeziecki, B.; Zajączkowski, J.; Bolibok, L. Tree species and forest stands. In: Matuszkiewicz J.M.; Tabor J. (ed.). Inventory of selected natural and cultural elements of the Białowieża Forest (in Polish). 2023. Instytut Badawczy Leśnictwa. Sękocin Stary. Pp.: 159-391. [CrossRef]
- Temperli, C.; Veblen, T.T.; Hart, S.J.; Kulakowski, D.; Tepley, A.J. Interactions among spruce beetle disturbance, climate change and forest dynamics captured by a forest landscape model. Ecosphere. 2015, 6(11), 231. [Google Scholar] [CrossRef]
- Walters, M.B.; Roloff, G.J.; Henry, C.R.; Hartman, J.P.; Donovan, M.L.; Farinosi, E.J.; Starking, M.D. Rethinking Northern Hardwood Forest Management Paradigms with Silvicultural Systems Research: Research-Management Partnerships Ensure Relevance and Application. J. Forest. 1093; 3. [Google Scholar]
- Ngugi, M.R.; Neldner, V.J.; Dowling, R.M.; Li, J. Recruitment and demographic structure of floodplain tree species in the Queensland Murray-Darling basin, Australia. Ecol. Manag. Restor. 2021, 1, 64–73. [Google Scholar] [CrossRef]
- Brzeziecki, B.; Keczyński, A.; Zajączkowski, J.; Drozdowski, S.; Gawron, L.; Buraczyk, W.; Bielak, K.; Szeligowski, H.; Dzwonkowski, M. Threatened tree species of the Białowieża National Park (the Strict Reserve) (In Polish with English summary). Sylwan. 2012, 4, 252–261. [Google Scholar]
- Brzeziecki, B.; Andrzejczyk, T.; Żybura, H. Natural regeneration of trees in the Białowieża Forest (In Polish with English summary). Sylwan. 2018, 11, 883–896. [Google Scholar] [CrossRef]
- Kuijper, D.P.J.; Jędrzejewska, B.; Brzeziecki, B.; Churski, M. ; Jędrzejewsk,i W.; Żybura, H. Fluctuating ungulate density shapes tree requirement in natural stands of the Białowieża Primeval Forest, Poland. J. Veg. Sci, 1082; 21. [Google Scholar]
- Kuijper, D.P.J.; Cromsigt, J.P.G.M.; Jędrzejewska, B.; Miścicki, S.; Churski, M.; Jędrzejewski, W.; Kweczlich, I. Bottom-up versus top-down control of tree regeneration in the Białowieża Primeval Forest, Poland. J. Ecol. 2010, 98(4), 888–899. [Google Scholar] [CrossRef]
- Matuszkiewicz, J.M. Changes in the forest associations of Poland’s Białowieża Primeval Forest in the second half of the 20th century. Czas. Geogr. 2011, 82, 69–105. [Google Scholar]
- Akçakaya, H.R.; Sjögren-Gulve, P. Population viability analyses in conservation planning: an overview. Ecol. Bull. 2000, 48, 9–21. [Google Scholar]
- Guidelines on Closer-to-Nature Forest Management. 2023. Commission Staff Working Document. Brussels. 27.7.2023. SWD(2023) 284 final.
- Cole, D.N.; Yung, L. Beyond Naturalness: Rethinking Park and Wilderness Stewardship in an Era of Rapid Change. 1st edition. 2010. Island Press. Washington DC. US.
- Wapner, P. The changing nature of nature: environmental politics in the Anthropocene. Global Environ. Polit. 2014, 14, 4. [Google Scholar] [CrossRef]
- Brzeziecki, B.; Hilszczański, J.; Kowalski, T.; Łakomy, P.; Małek, S.; Miścicki, S.; Modrzyński, J.; Sowa, J.; Starzyk, J.R. Problem of a massive dying-off of Norway spruce in the ‘Białowieża Forests’ Forest Promotional Complex (In Polish with English Summary). Sylwan. 2018, 5, 373–386. [Google Scholar] [CrossRef]
Figure 1.
Actual (top) and model (bottom) share of the number of trees of individual species in subsequent diameter classes, as determined for the entire managed part of the Białowieża Forest.
Figure 1.
Actual (top) and model (bottom) share of the number of trees of individual species in subsequent diameter classes, as determined for the entire managed part of the Białowieża Forest.
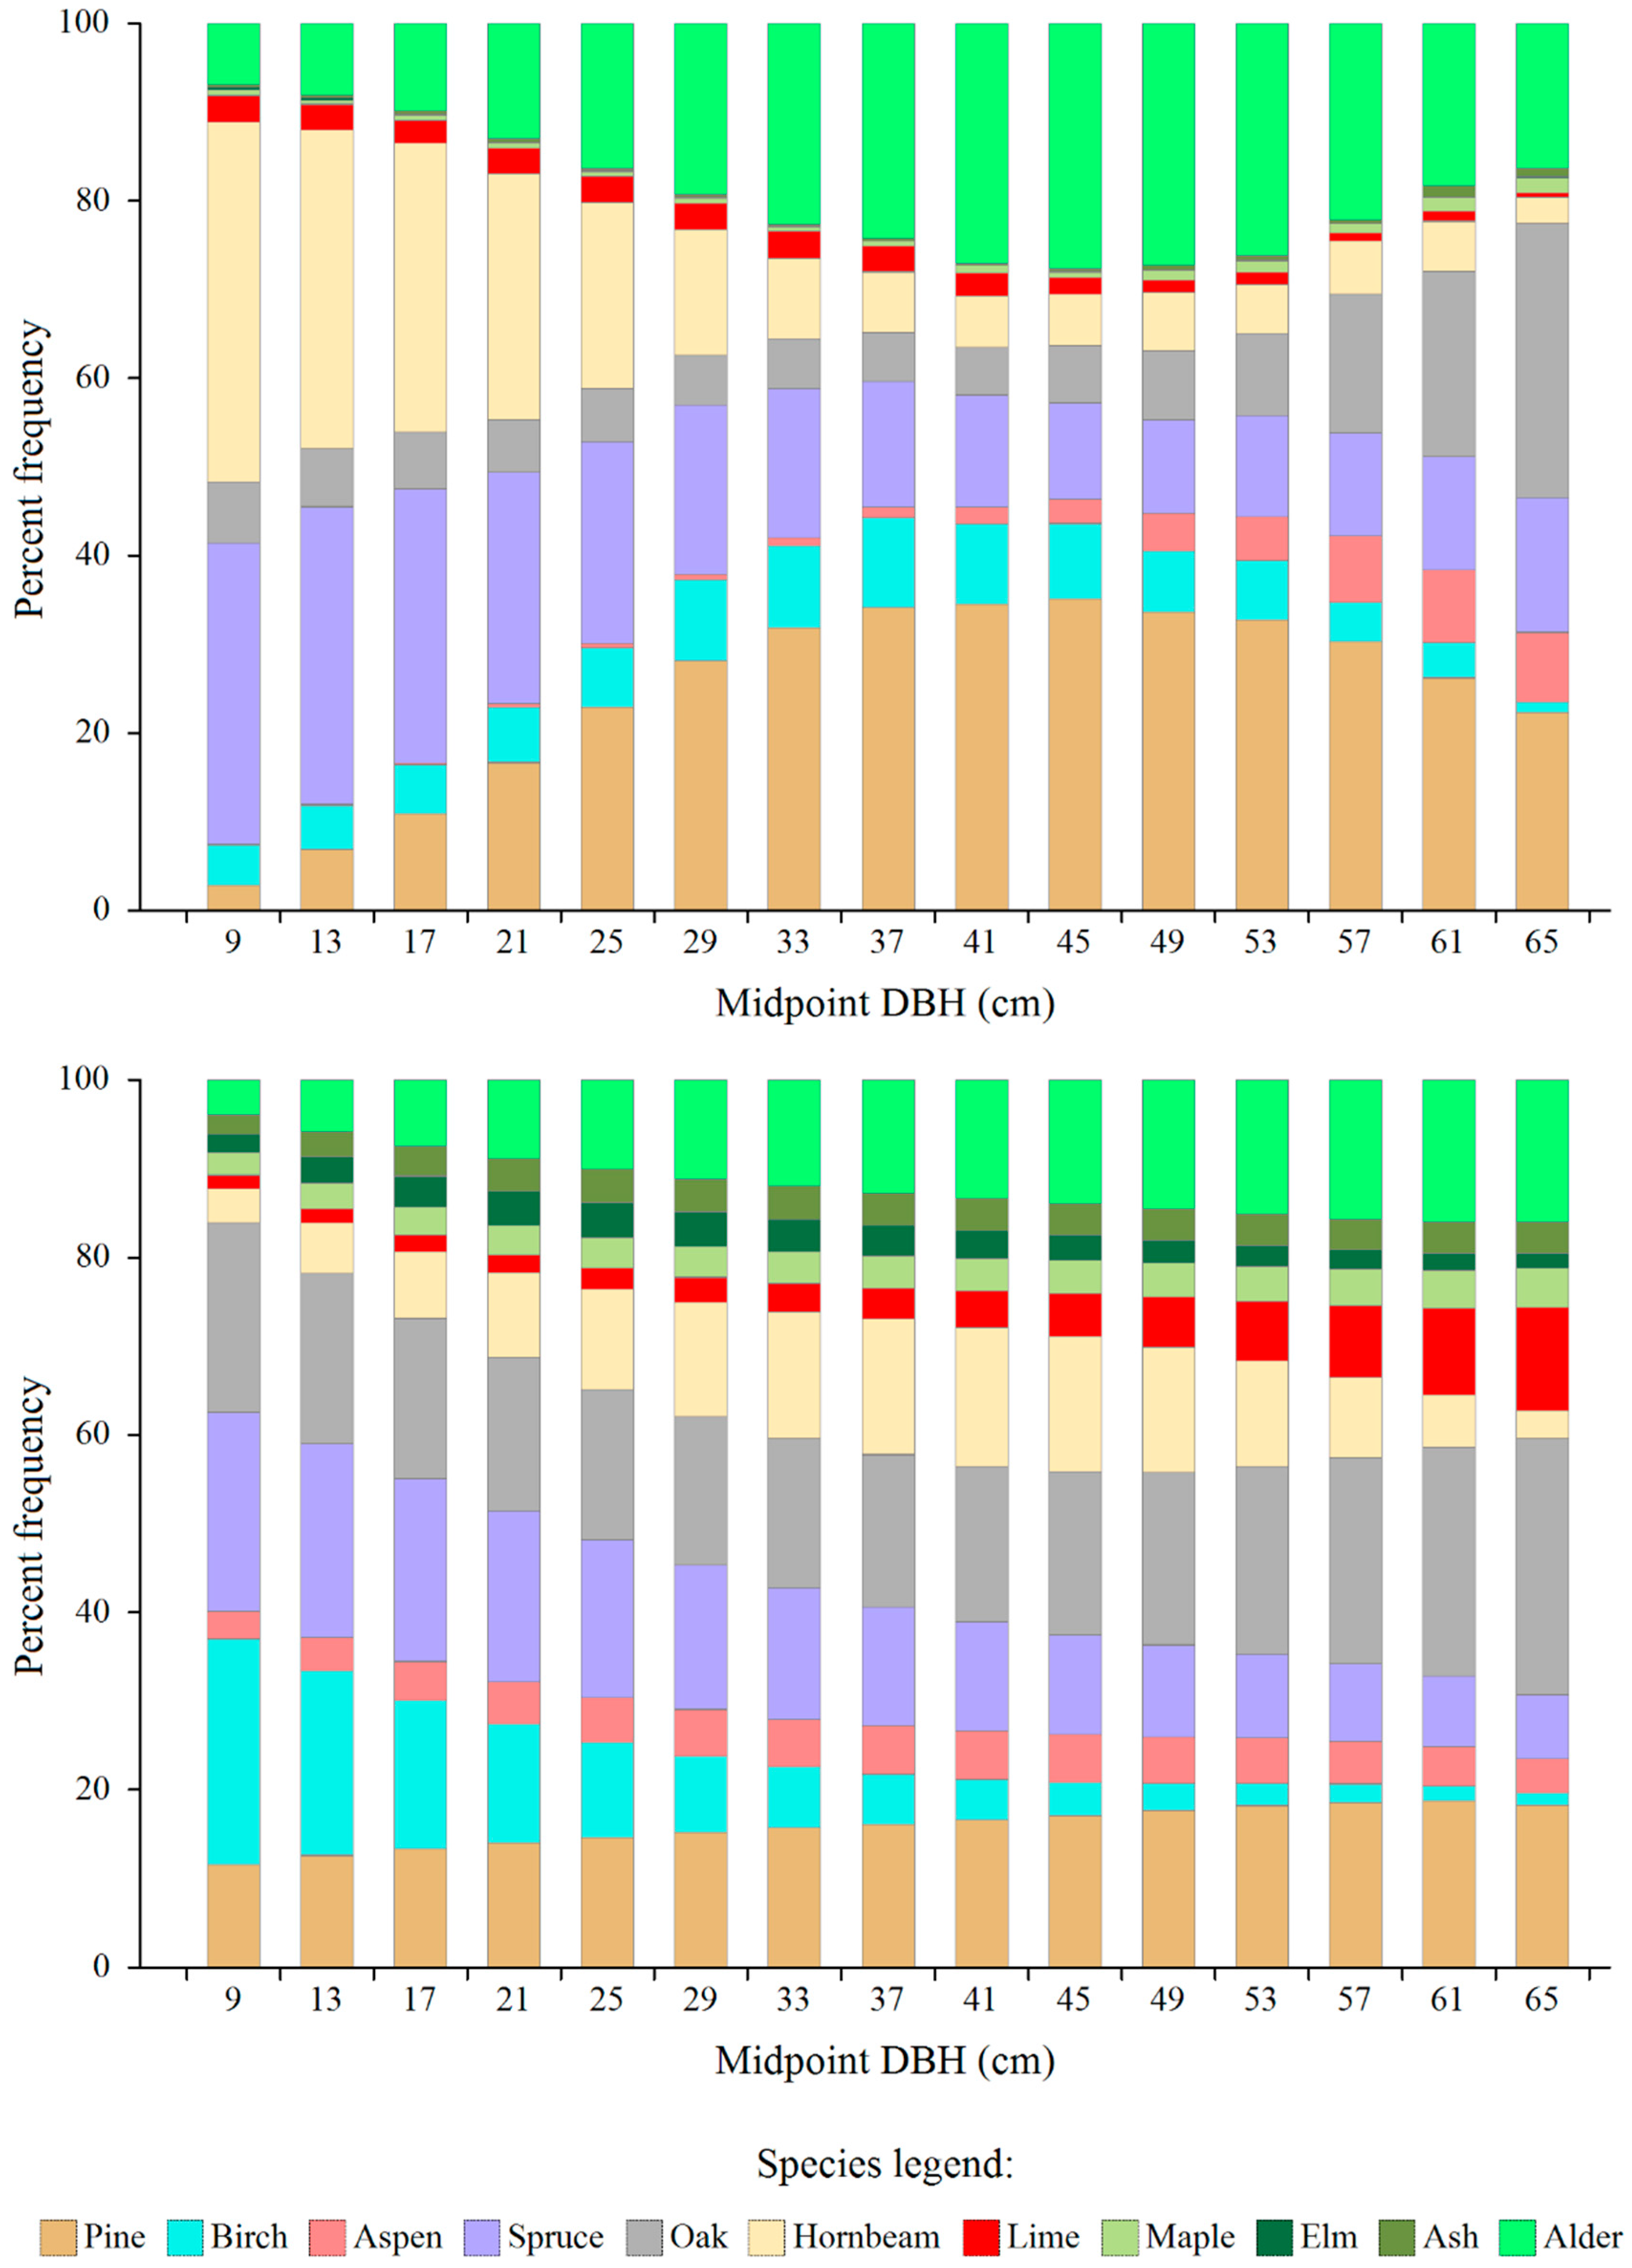
Figure 2.
The amount of the total surpluses (in relation to the equilibrium distributions) of trees of individual species in all SUs of the Białowieża Forest, by diameter classes.
Figure 2.
The amount of the total surpluses (in relation to the equilibrium distributions) of trees of individual species in all SUs of the Białowieża Forest, by diameter classes.
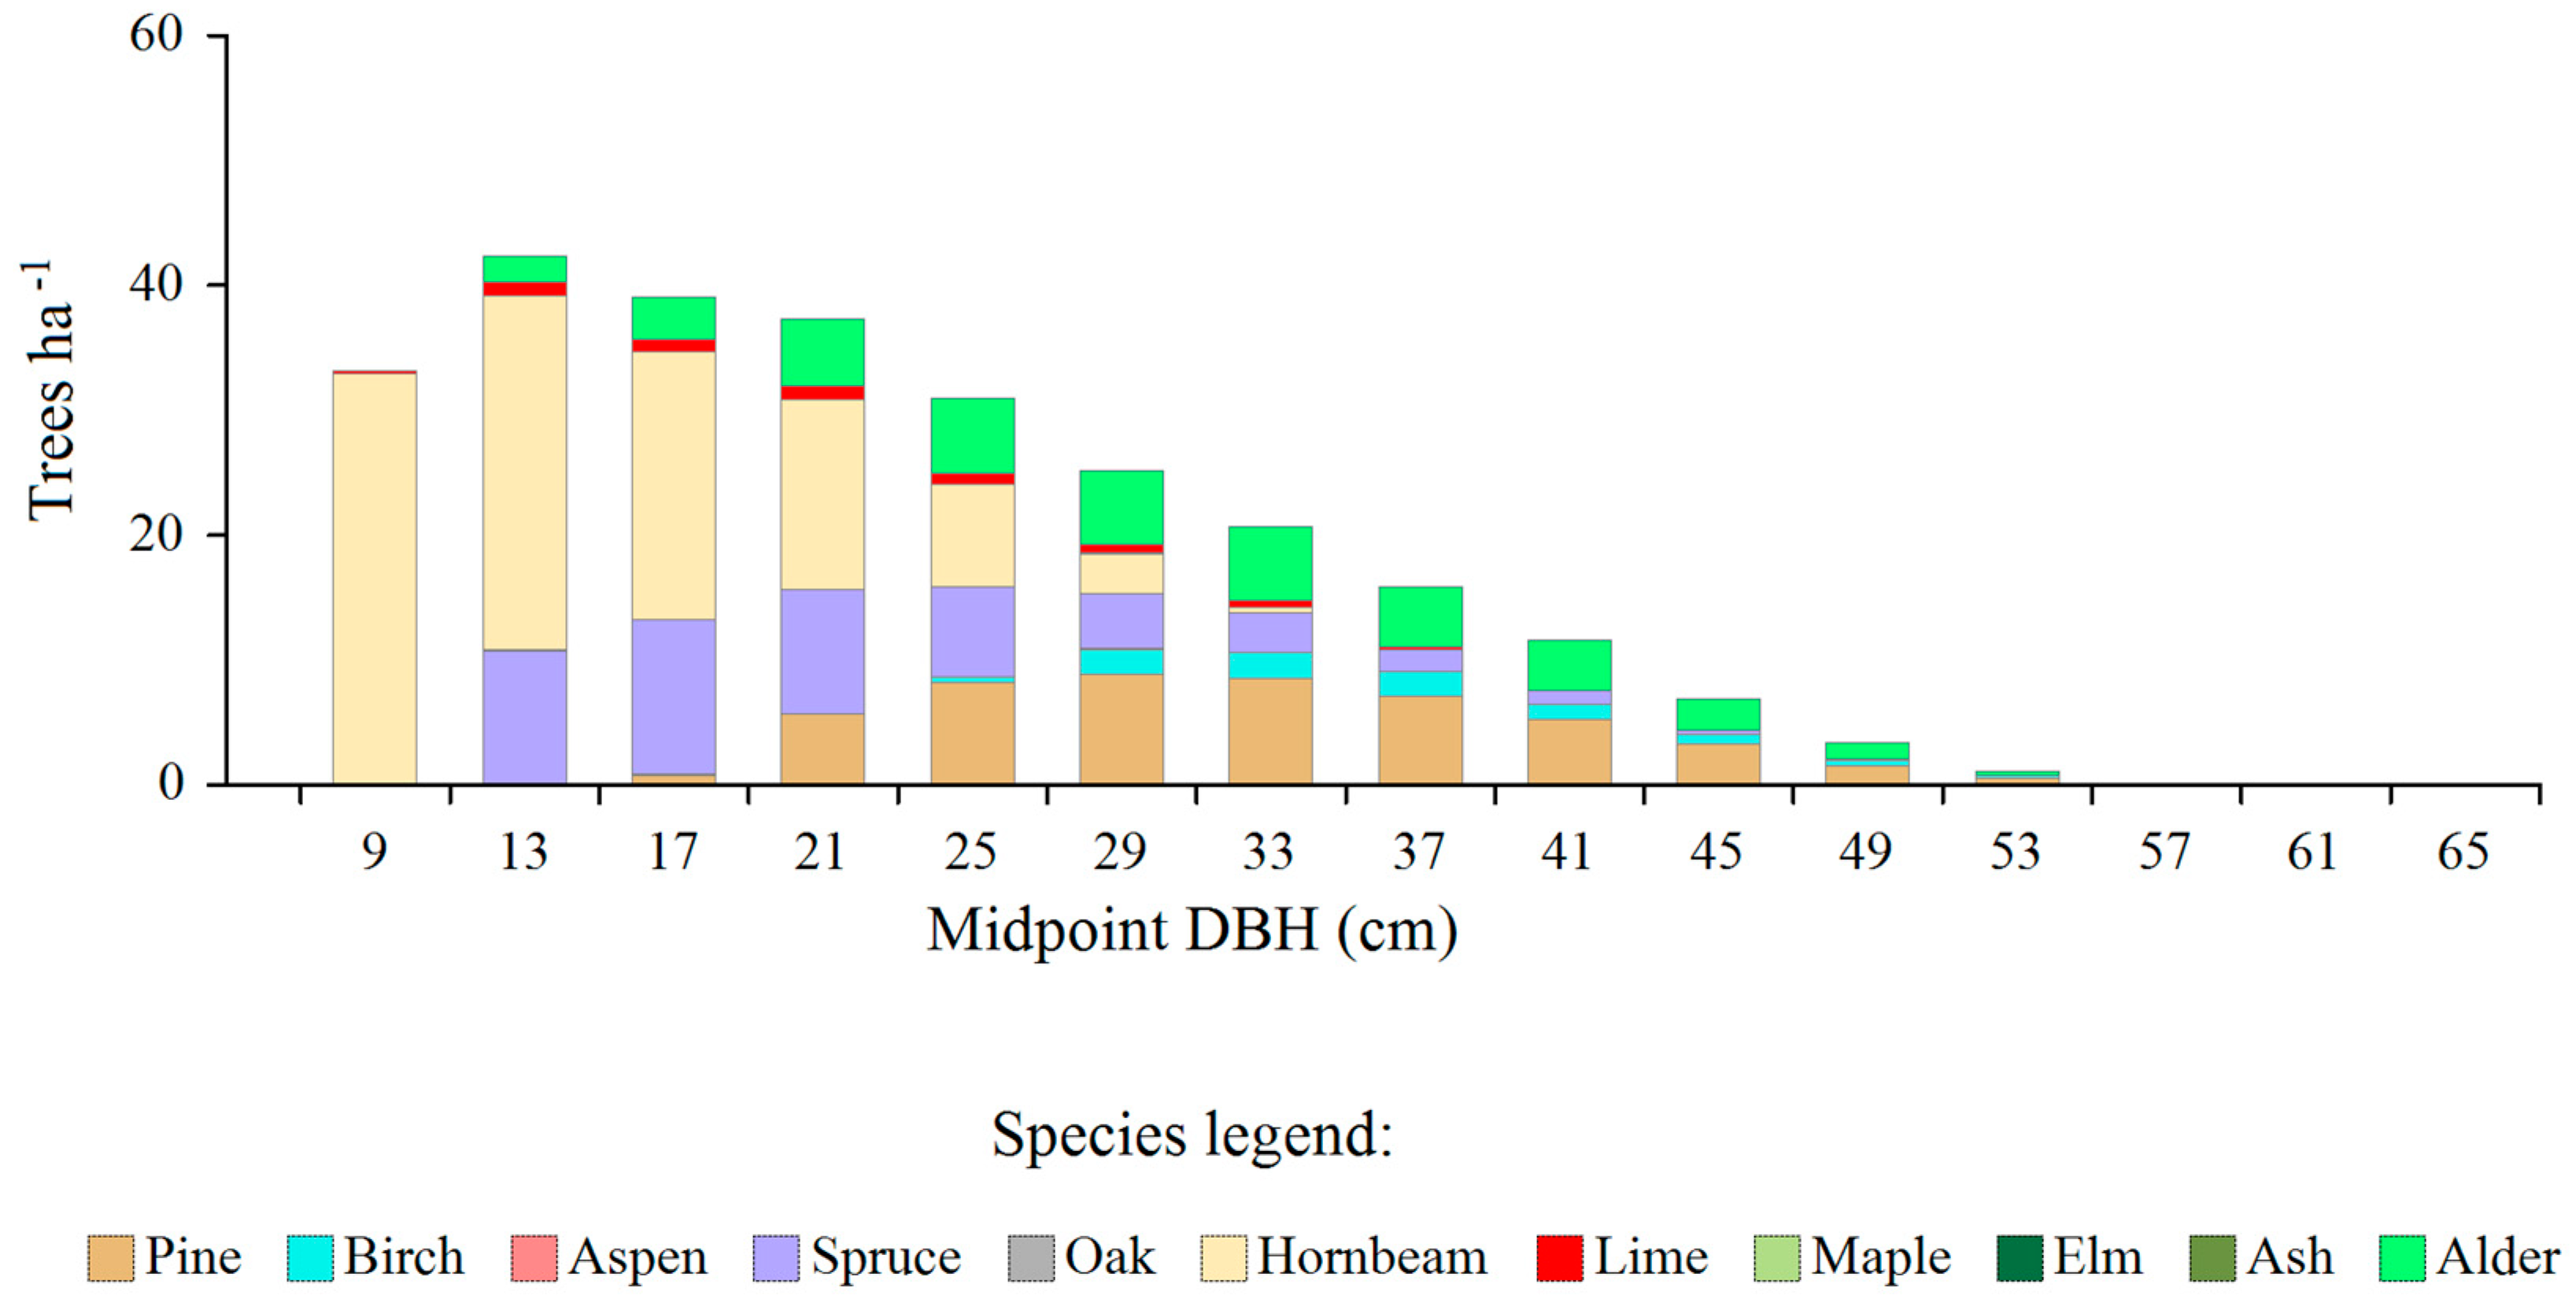
Figure 3.
The amount of tree shortages (in relation to equilibrium model) of individual species in all SUs of the Białowieża Forest, by diameter classes.
Figure 3.
The amount of tree shortages (in relation to equilibrium model) of individual species in all SUs of the Białowieża Forest, by diameter classes.

Figure 4.
Density of effective surpluses (trees intended for removal as part of activities aimed at bringing actual diameter distributions closer to the sustainable model), taking into account tree species and diameter classes.
Figure 4.
Density of effective surpluses (trees intended for removal as part of activities aimed at bringing actual diameter distributions closer to the sustainable model), taking into account tree species and diameter classes.
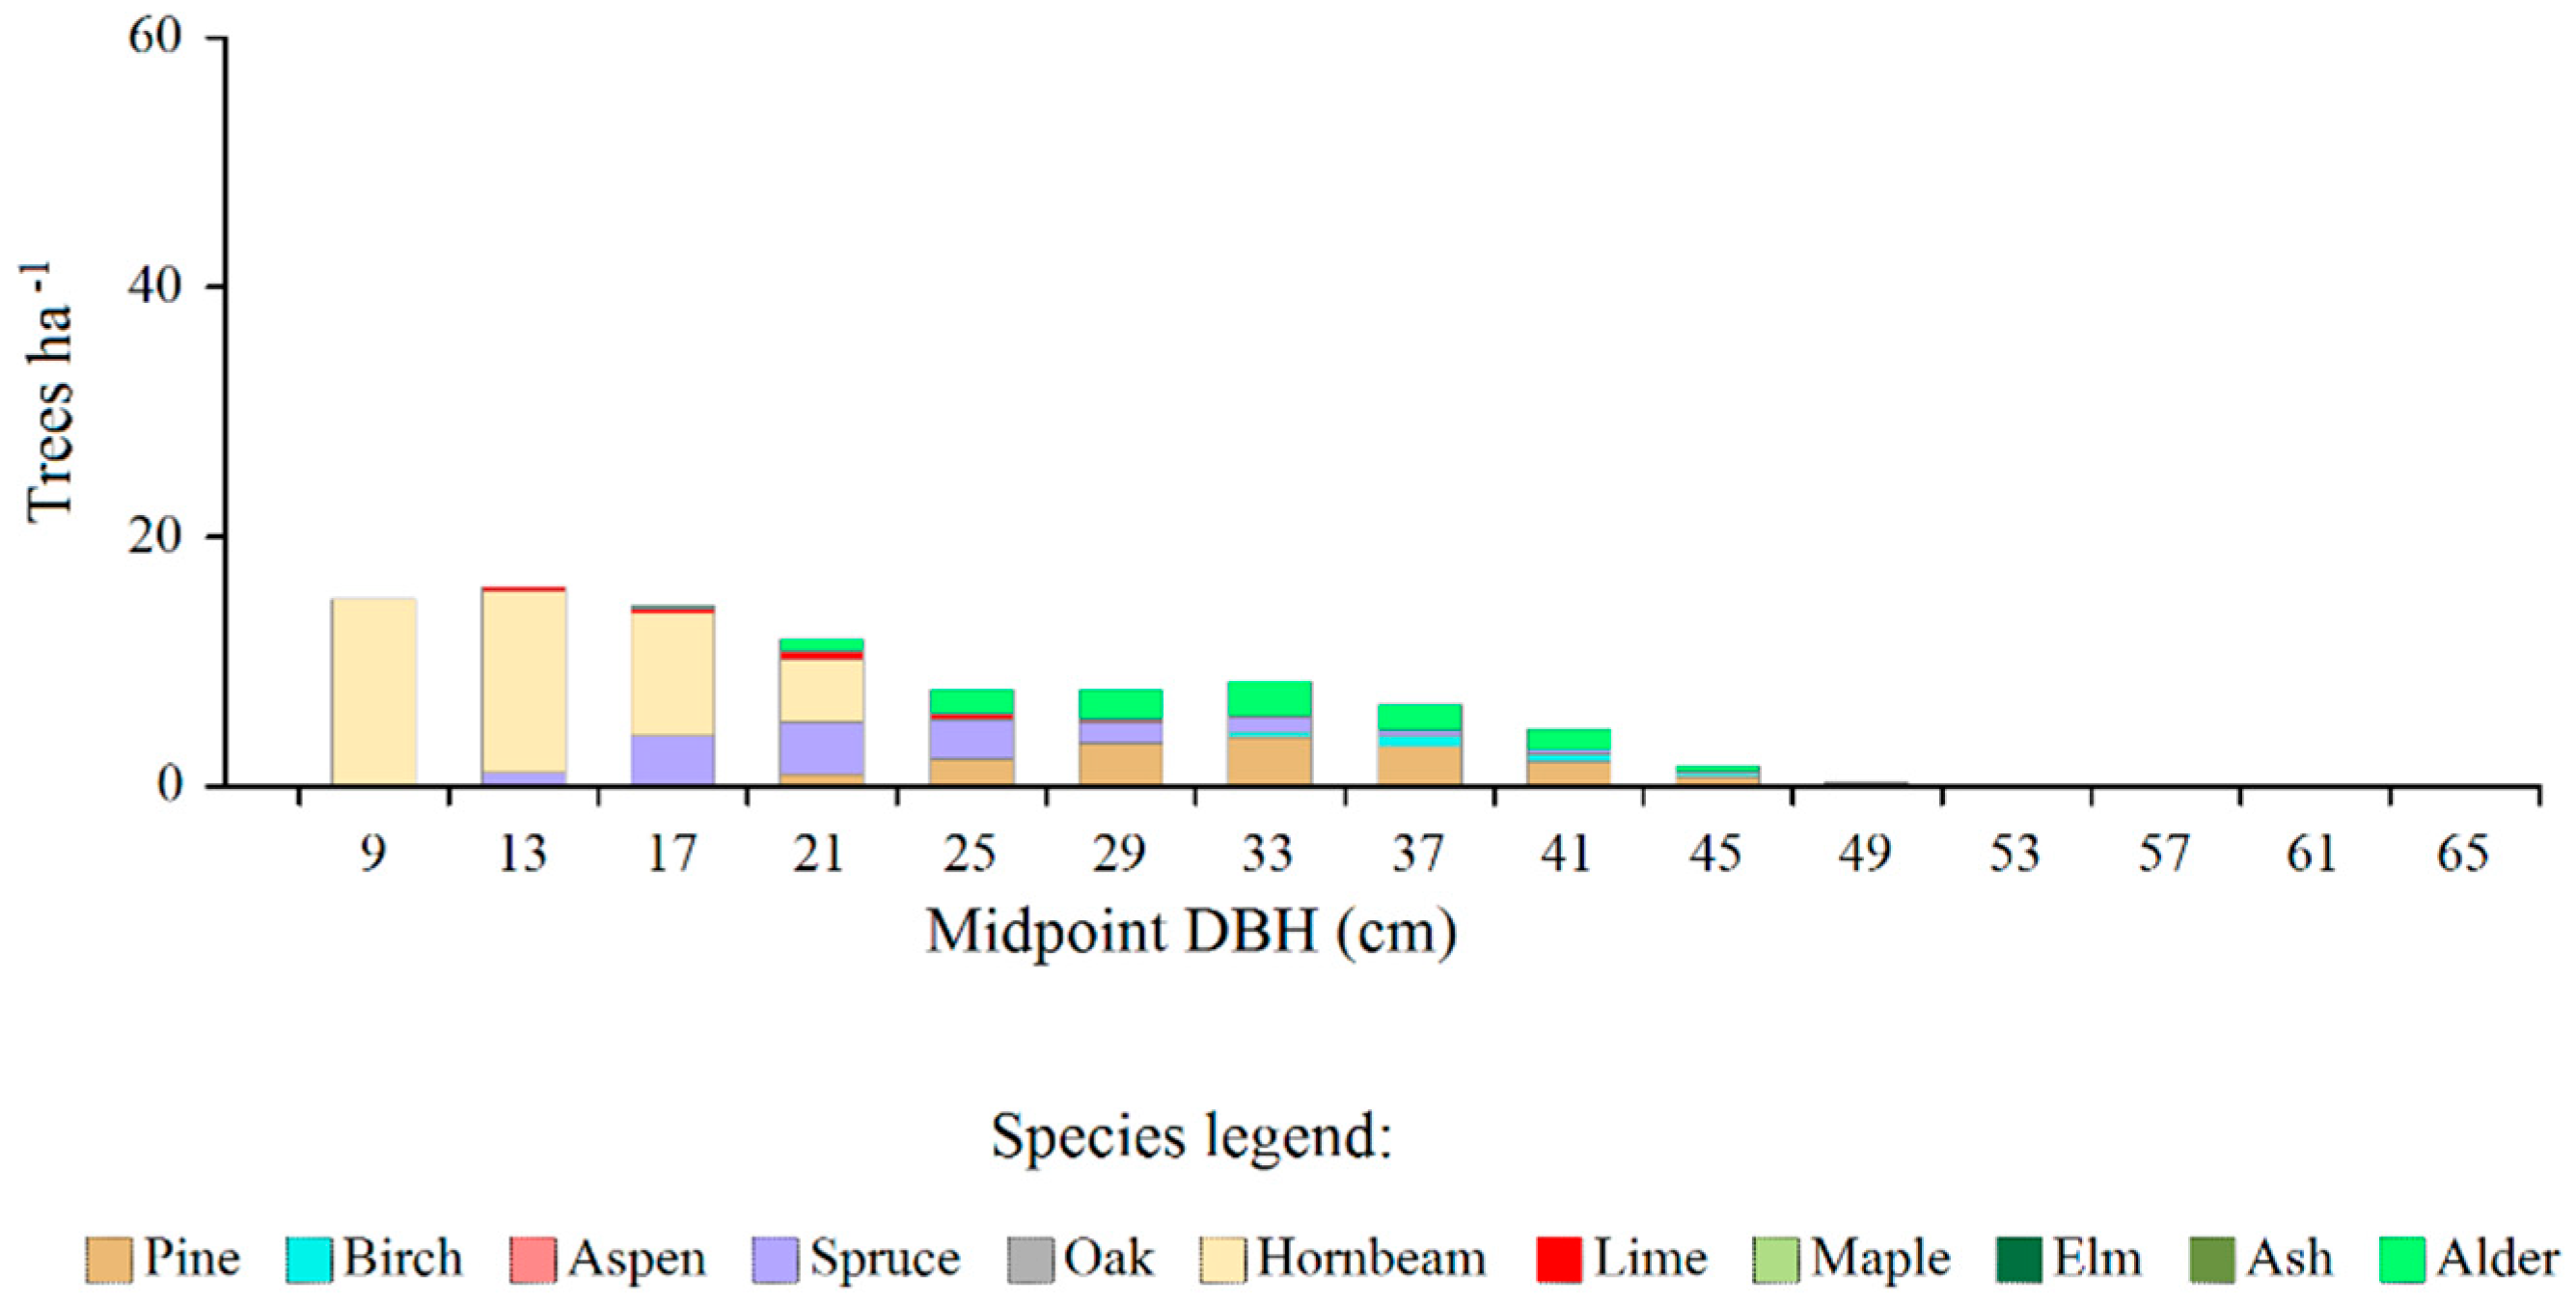
Figure 5.
Surplus (overall and effective) and deficit trees shown against the background of model distributions constructed for individual tree species. Averaged data for the entire managed part of the Białowieża Forest.
Figure 5.
Surplus (overall and effective) and deficit trees shown against the background of model distributions constructed for individual tree species. Averaged data for the entire managed part of the Białowieża Forest.
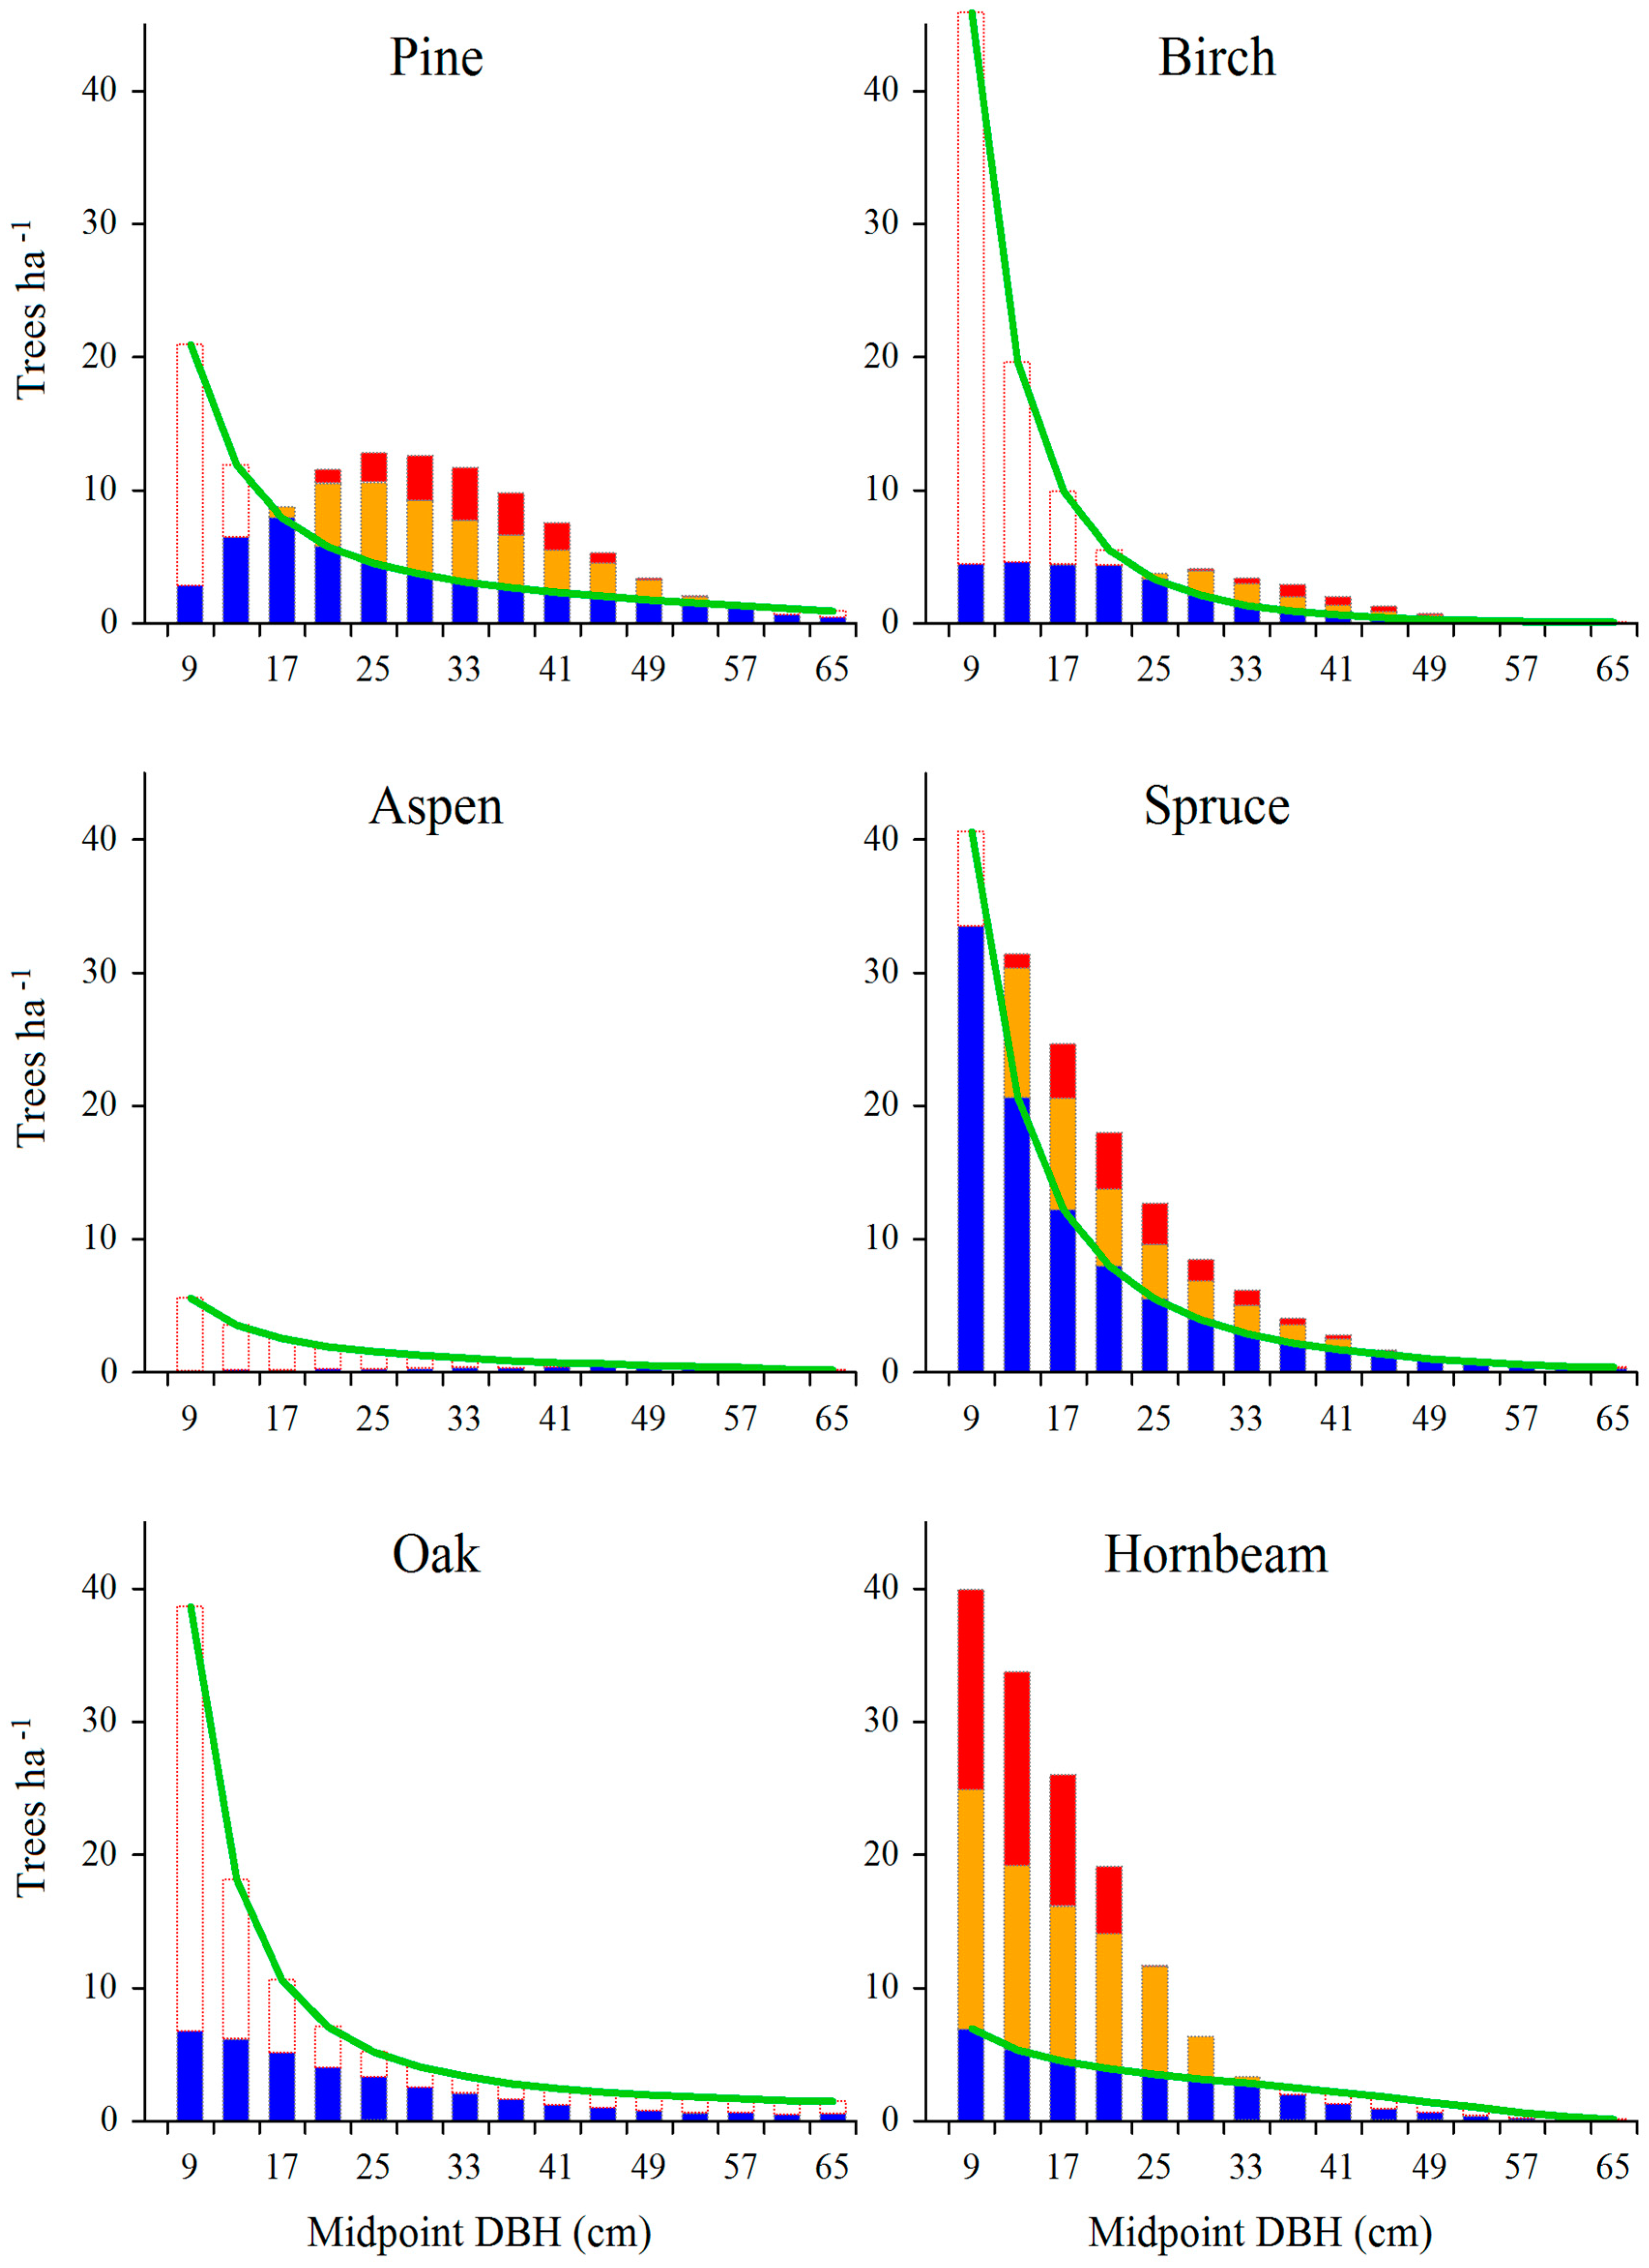
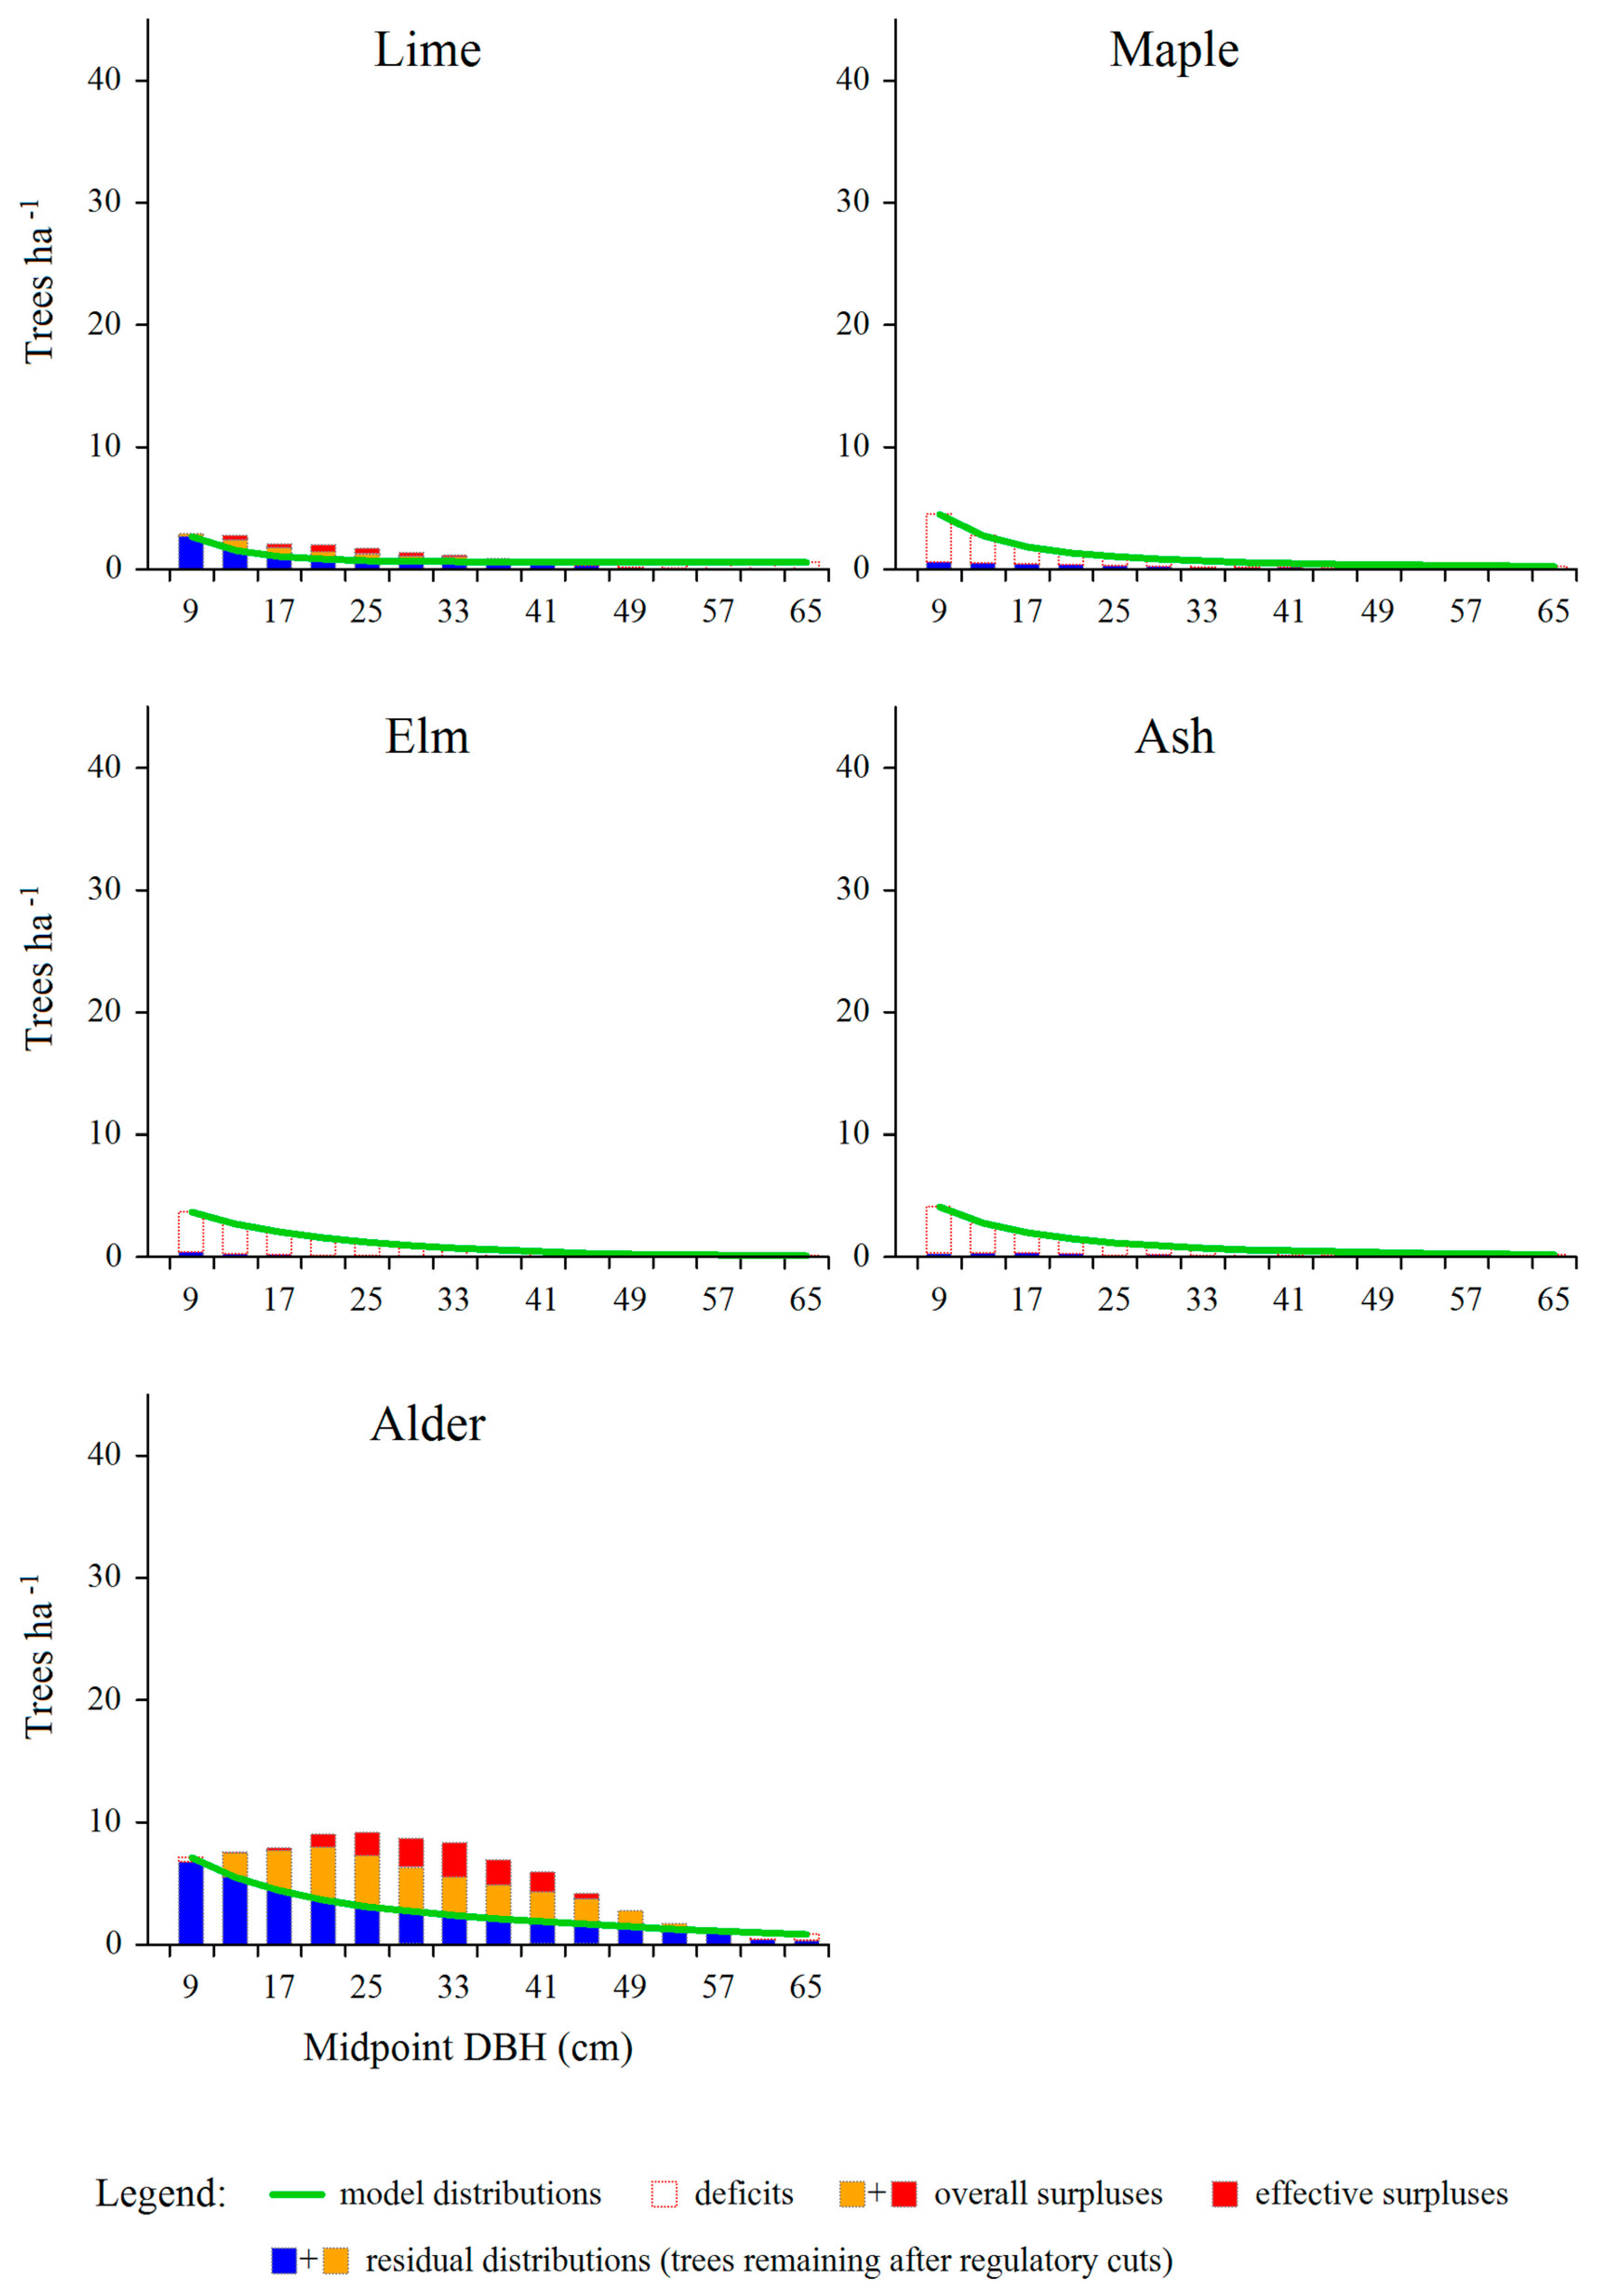

Table 1.
Actual diameter distributions (trees ∙ ha-1) of tree species occurring in the managed part of the Białowieża Forest. The sequence of species corresponds to their relative position along a major environmental gradient from most oligotrophic to most eutrophic sites [30]. Ntot (trees ∙ ha-1) - overall density; Btot (m2 ∙ ha-1) - overall basal area; B% - the share of a given species in total basal area.
| DBH (cm) |
Tree species | |||||||||||
|---|---|---|---|---|---|---|---|---|---|---|---|---|
| Pine | Birch | Aspen | Spruce | Oak | Hornbeam | Lime | Maple | Elm | Ash | Alder | Total | |
| 9 | 2.8 | 4.4 | 0.1 | 33.5 | 6.8 | 39.9 | 2.9 | 0.6 | 0.4 | 0.3 | 6.8 | 98.5 |
| 13 | 6.5 | 4.6 | 0.2 | 31.4 | 6.1 | 33.7 | 2.7 | 0.5 | 0.3 | 0.3 | 7.5 | 93.8 |
| 17 | 8.7 | 4.4 | 0.2 | 24.6 | 5.1 | 26.0 | 2.1 | 0.4 | 0.2 | 0.3 | 7.8 | 79.7 |
| 21 | 11.5 | 4.4 | 0.2 | 18.0 | 4.1 | 19.1 | 1.9 | 0.4 | 0.1 | 0.3 | 9.0 | 68.9 |
| 25 | 12.8 | 3.7 | 0.2 | 12.7 | 3.3 | 11.7 | 1.7 | 0.3 | 0.1 | 0.1 | 9.1 | 55.7 |
| 29 | 12.6 | 4.1 | 0.3 | 8.5 | 2.5 | 6.3 | 1.3 | 0.2 | 0.0 | 0.1 | 8.6 | 44.6 |
| 33 | 11.7 | 3.4 | 0.3 | 6.2 | 2.0 | 3.3 | 1.1 | 0.2 | 0.0 | 0.1 | 8.3 | 36.6 |
| 37 | 9.7 | 2.9 | 0.3 | 4.0 | 1.6 | 1.9 | 0.8 | 0.2 | 0.0 | 0.1 | 6.9 | 28.5 |
| 41 | 7.5 | 2.0 | 0.4 | 2.8 | 1.2 | 1.3 | 0.6 | 0.2 | 0.0 | 0.1 | 5.9 | 21.8 |
| 45 | 5.3 | 1.3 | 0.4 | 1.6 | 1.0 | 0.9 | 0.3 | 0.1 | 0.0 | 0.0 | 4.2 | 15.1 |
| 49 | 3.4 | 0.7 | 0.4 | 1.1 | 0.8 | 0.7 | 0.1 | 0.1 | 0.0 | 0.1 | 2.8 | 10.1 |
| 53 | 2.1 | 0.4 | 0.3 | 0.7 | 0.6 | 0.3 | 0.1 | 0.1 | 0.0 | 0.0 | 1.6 | 6.3 |
| 57 | 1.2 | 0.2 | 0.3 | 0.5 | 0.6 | 0.2 | 0.0 | 0.0 | 0.0 | 0.0 | 0.9 | 4.0 |
| 61 | 0.6 | 0.1 | 0.2 | 0.3 | 0.5 | 0.1 | 0.0 | 0.0 | 0.0 | 0.0 | 0.4 | 2.4 |
| 65 | 0.4 | 0.0 | 0.1 | 0.3 | 0.6 | 0.1 | 0.0 | 0.0 | 0.0 | 0.0 | 0.3 | 1.8 |
| 69 | 0.1 | 0.0 | 0.1 | 0.1 | 0.3 | 0.0 | 0.0 | 0.0 | 0.0 | 0.0 | 0.1 | 0.8 |
| 73 | 0.1 | 0.0 | 0.0 | 0.1 | 0.2 | 0.0 | 0.0 | 0.0 | 0.0 | 0.0 | 0.1 | 0.5 |
| 77 | 0.2 | 0.0 | 0.1 | 0.1 | 1.2 | 0.0 | 0.0 | 0.0 | 0.0 | 0.0 | 0.1 | 1.7 |
| Ntot | 97.2 | 36.5 | 4.3 | 146.3 | 38.5 | 145.6 | 15.8 | 3.4 | 1.1 | 1.8 | 80.3 | 570.7 |
| Btot | 7.9 | 2.2 | 0.6 | 5.4 | 2.9 | 4.1 | 0.7 | 0.2 | 0.0 | 0.1 | 6.0 | 30.1 |
| B% | 26.2 | 7.3 | 2.0 | 17.9 | 9.6 | 13.6 | 2.3 | 0.7 | 0.0 | 0.3 | 19.9 | 100.0 |
Table 2.
Model tree species composition (in % of basal area) of tree stands in the managed part of Białowieża Forest.
Table 2.
Model tree species composition (in % of basal area) of tree stands in the managed part of Białowieża Forest.
| Tree species | |||||||||||
|---|---|---|---|---|---|---|---|---|---|---|---|
| Pine | Birch | Aspen | Spruce | Oak | Hornbeam | Lime | Maple | Elm | Ash | Alder | Total |
| 15.3 | 7.4 | 4.9 | 13.4 | 20.3 | 11.2 | 5.1 | 3.8 | 3.0 | 3.6 | 12.2 | 100.0 |
Table 3.
Model (target) value of the basal area (parameter Bmod, in m2 ∙ ha-1) in all SUs of the Białowieża Forest, in total and for individual tree species. A part of the overall basal area assigned to each species reflects its supposed role in particular SUs (which in turn depends on the model tree species compositions of woodland community types occurring in SUs).
| Tree species | |||||||||||
|---|---|---|---|---|---|---|---|---|---|---|---|
| Pine | Birch | Aspen | Spruce | Oak | Hornbeam | Lime | Maple | Elm | Ash | Alder | Total |
| 3.7 | 1.8 | 1.2 | 3.3 | 5.0 | 2.7 | 1.2 | 0.9 | 0.7 | 0.9 | 3.0 | 24.5 |
Table 4.
Model (target) number of trees (Nmod, trees ∙ ha-1) of individual species in subsequent classes of theoretical (equilibrium) diameter distributions, averaged for all SUs of the Białowieża Forest.
Table 4.
Model (target) number of trees (Nmod, trees ∙ ha-1) of individual species in subsequent classes of theoretical (equilibrium) diameter distributions, averaged for all SUs of the Białowieża Forest.
| DBH (cm) | Tree species | |||||||||||
|---|---|---|---|---|---|---|---|---|---|---|---|---|
| Pine | Birch | Aspen | Spruce | Oak | Hornbeam | Lime | Maple | Elm | Ash | Alder | Total | |
| 9 | 21.0 | 45.9 | 5.6 | 40.6 | 38.6 | 6.9 | 2.7 | 4.5 | 3.7 | 4.1 | 7.1 | 180.7 |
| 13 | 11.9 | 19.6 | 3.6 | 20.6 | 18.1 | 5.4 | 1.5 | 2.7 | 2.7 | 2.8 | 5.5 | 94.4 |
| 17 | 7.9 | 9.9 | 2.6 | 12.2 | 10.6 | 4.5 | 1.1 | 1.9 | 2.1 | 2.0 | 4.4 | 59.0 |
| 21 | 5.8 | 5.5 | 2.0 | 8.0 | 7.1 | 3.9 | 0.9 | 1.4 | 1.6 | 1.5 | 3.7 | 41.2 |
| 25 | 4.5 | 3.3 | 1.6 | 5.5 | 5.2 | 3.5 | 0.7 | 1.1 | 1.2 | 1.2 | 3.1 | 30.9 |
| 29 | 3.7 | 2.1 | 1.3 | 4.0 | 4.1 | 3.2 | 0.7 | 0.9 | 0.9 | 0.9 | 2.7 | 24.3 |
| 33 | 3.1 | 1.4 | 1.1 | 2.9 | 3.3 | 2.8 | 0.6 | 0.7 | 0.7 | 0.7 | 2.4 | 19.8 |
| 37 | 2.7 | 0.9 | 0.9 | 2.2 | 2.8 | 2.5 | 0.6 | 0.6 | 0.6 | 0.6 | 2.1 | 16.5 |
| 41 | 2.3 | 0.6 | 0.8 | 1.7 | 2.5 | 2.2 | 0.6 | 0.5 | 0.4 | 0.5 | 1.9 | 13.9 |
| 45 | 2.0 | 0.4 | 0.6 | 1.3 | 2.2 | 1.8 | 0.6 | 0.4 | 0.3 | 0.4 | 1.6 | 11.8 |
| 49 | 1.8 | 0.3 | 0.5 | 1.0 | 2.0 | 1.4 | 0.6 | 0.4 | 0.3 | 0.4 | 1.5 | 10.0 |
| 53 | 1.5 | 0.2 | 0.4 | 0.8 | 1.8 | 1.0 | 0.6 | 0.3 | 0.2 | 0.3 | 1.3 | 8.5 |
| 57 | 1.3 | 0.2 | 0.4 | 0.6 | 1.7 | 0.7 | 0.6 | 0.3 | 0.2 | 0.3 | 1.1 | 7.1 |
| 61 | 1.1 | 0.1 | 0.3 | 0.5 | 1.6 | 0.4 | 0.6 | 0.3 | 0.1 | 0.2 | 1.0 | 6.0 |
| 65 | 0.9 | 0.1 | 0.2 | 0.4 | 1.5 | 0.2 | 0.6 | 0.2 | 0.1 | 0.2 | 0.8 | 5.0 |
| Nmod | 71.5 | 90.5 | 21.9 | 102.3 | 103.1 | 40.4 | 13.0 | 16.2 | 15.1 | 16.1 | 40.2 | 529.1 |
Table 6.
The average amount of deficits in the 9 cm class and the approximate average size of regeneration spots in the SUs, in total and by species.
Table 6.
The average amount of deficits in the 9 cm class and the approximate average size of regeneration spots in the SUs, in total and by species.
| Tree species | Area of growing space for a tree with DBH = 9 cm (GS, in m2)* | Average number of deficit trees in the smallest diameter class (midpoint = 9 cm) (DEF, in trees ∙ ha-1) |
Estimated area of regeneration spots (RS, in ha) |
|---|---|---|---|
| Pine | 8.13 | 18.14 | 1.64 |
| Birch | 12.55 | 41.45 | 5.91 |
| Aspen | 12.55 | 5.46 | 0.78 |
| Spruce | 10.82 | 9.21 | 1.14 |
| Oak | 6.14 | 31.88 | 2.24 |
| Hornbeam | 25.24 | 0.00 | 0.00 |
| Lime | 15.98 | 0.58 | 0.11 |
| Maple | 13.29 | 3.92 | 0.60 |
| Elm | 23.10 | 3.30 | 0.87 |
| Ash | 10.75 | 3.82 | 0.47 |
| Alder | 10.14 | 1.06 | 0.12 |
| Total | 118.83 | 13.87 |
* accord. to Bolibok and Brzeziecki [43].
Disclaimer/Publisher’s Note: The statements, opinions and data contained in all publications are solely those of the individual author(s) and contributor(s) and not of MDPI and/or the editor(s). MDPI and/or the editor(s) disclaim responsibility for any injury to people or property resulting from any ideas, methods, instructions or products referred to in the content. |
© 2024 by the authors. Licensee MDPI, Basel, Switzerland. This article is an open access article distributed under the terms and conditions of the Creative Commons Attribution (CC BY) license (http://creativecommons.org/licenses/by/4.0/).
Copyright: This open access article is published under a Creative Commons CC BY 4.0 license, which permit the free download, distribution, and reuse, provided that the author and preprint are cited in any reuse.


