Submitted:
13 March 2025
Posted:
17 March 2025
You are already at the latest version
Abstract
Forests, both natural and managed, provide a critical habitat to a significant part of a global diversity. Among many different groups of forest biota, trees occupy a special position. They act as foundation species that create conditions upon which the existence of virtually all other forest organisms depends, either directly or indirectly. To permanently play this role, trees must be demographically stable, i.e., their populations should be distinguished by the balanced, size-dependent proportions of individuals representing different developmental stages (from seedlings and saplings to mature and old trees). In this study, we examine the extent to which this condition is met in Białowieża Forest in northeastern Poland, an important biodiversity hotspot in Central Europe. Comparison of species-specific, equilibrium vs. actual size distributions revealed that almost half of all trees growing in Białowieża Forest represented "inappropriate", i.e. occurring in excess compared to the balanced model, species and/or diameter ranges. The amount of deficits was also large (around 30% of the current tree number), concerning primarily the smallest trees. To restore demographic balance of key tree species and thus, to enhance conservation of local biodiversity, we recommend targeted, active management strategies, including gradual removal of trees from surplus diameter ranges and assisted regeneration of species with the greatest deficiencies in small diameter classes.
Keywords:
Equilibrium diameter distribution
; Forest-associated biodiversity
; Foundation species
; Population viability
; Tree demography
; Tree regeneration failure
Introduction
The high threat and ongoing loss of many components and facets of biodiversity are currently matters of widespread concern. The main causes of this phenomenon and possible countermeasures are widely discussed and analyzed on global (Kannan and James 2009; Wilson 2016; IPBES 2019; Sala et al. 2000; Wilkening et al. 2023), regional (Galatowitsch et al. 2009; EU Biodiversity Strategy for 2030 2020; Pötzelsberger et al. 2021; Muys et al. 2022), and local scales (e.g., Brzeziecki 2017).
In Central Europe, as in other intensively developed regions, a significant part of the native biodiversity is associated with managed forests, which, despite centuries of exploitation and many transformations, constitute the most “natural” form of land use (Götmark 2013; Ampoorter et al. 2020; FOREST EUROPE 2020; Pötzelsberger et al. 2021; Muys et al. 2022).
Among the numerous taxa associated with forest ecosystems, tree species occupy a unique position (Dale et al. 2001; Ampoorter et al. 2020; Ohse et al. 2023). Although trees may be significantly inferior to other forest organisms in terms of the number of species and individuals, in woodland communities they often act as foundation species. Foundation species, due to their specific features and parameters - such as age and size at maturity in the case of trees - form the main components of communities and ecosystems, significantly influencing their functioning (Palik and Engstrom 2004; Ellison et al. 2005; Boonman et al. 2024). Their importance lies in the stabilization of basic ecosystem processes, such as biomass production, water balance, the rate of organic matter decomposition, nutrient cycling, carbon sequestration, and energy flow (Palik and Engstrom 2004). The decline of foundation species leads to significant changes in local environmental conditions on which the survival of many other species depends (Ellison et al. 2005). A good illustration of the importance of trees as foundation species is their “biocenotic value”, which can be measured by the number of taxa representing numerous groups of forest biota (fungi, insects, lichens, etc.) associated with various tree species (Faliński and Mułenko 1996; Alexander et al. 2006; Senn-Irlet 2008). Although the biocenotic value of particular tree species for individual groupings of forest-dwelling organisms may differ, it can generally be assumed that safeguarding the natural values of forest ecosystems requires high species diversity of tree stands accompanied by the demographic sustainability of individual tree species (Gamfeldt et al. 2013; Halpin and Lorimer 2017; Ampoorter et al. 2020; Ohse et al. 2023).
From a nature conservation perspective, one of the most important regions in the lowlands of Central Europe is Białowieża Forest (BF), located on the border between northeastern Poland and Belarus. High diversity, richness, uniqueness, and rarity are features characteristic of virtually all groups of plant, animal, and fungal organisms inhabiting the forest (Faliński 1986; Okołów et al. 2009; Brzeziecki 2017; Jaroszewicz et al. 2019). In contrast to the great diversity and richness of many forest-associated organisms, the group of tree species found in BF appears relatively modest. According to Faliński (1977, 1994), the dendroflora of BF includes 28 tree species, of which only c. 10 species play a significant role in local woodland communities.
Until recently, the majority (approximately 80%) of the Polish part of BF was actively managed. This means that for a long time, the species composition of individual tree stands and the demography of local tree populations were deliberately shaped. This situation changed abruptly in 2014 when BF obtained the status of a World Heritage Site (WHS), as the primary principle of the newly created WHS was strict protection, prohibiting human intervention (Brzeziecki, Hilszczański et al. 2018).
In this context, this work attempts to answer the following questions:
- How has forest management carried out until recently in BF influenced the current demographic status of individual tree species?
- To what extent does the present demographic status of individual tree species differ from the desired, sustainable state ensuring optimal conservation effects?
- What measures should be taken to bring local tree populations closer to this desired state?
- Which conservation strategy would be most effective for safeguarding the high natural values of BF?
In our analysis, we focus on tree size distributions, a traditional criterion used to assess the demographic sustainability of tree populations (Halpin and Lorimer 2017). To determine actual, species-specific size distributions, we use data from a large-scale forest inventory conducted in BF in 2018 (Matuszkiewicz and Tabor 2023). To investigate discrepancies between the desired and actual states, we first develop theoretical equilibrium size distributions for Białowieża tree species and then compare them with actual distributions. Based on the identified differences (deficits and surpluses in particular size classes), we suggest actions needed to improve the demographic status of specific tree species and secure their vital role in preserving local biodiversity. Finally, we discuss the possible consequences of currently adopted solutions aimed at preserving the natural values of Białowieża woodland communities by referring to the situation in the “Strict Reserve” of Białowieża National Park (BNP) - the part of BF that has been under strict protection for over 100 years.
Study Area
BF is situated on both sides of the national border between Poland and Belarus. It encompasses a total of 1,475 km² (625 km² in Poland and 850 km² in adjacent Belarus). The climate exhibits characteristics of both continental and Atlantic influences (Faliński 1986). The average annual temperature is 7.0°C (January average: -4.6°C, July average: 18.2°C). Total annual precipitation averages 631 mm, and snow cover lasts for an average of 92 days (Faliński 1986). BF lies on a flat, undulating terrain ranging from 135 to 190 meters a.s.l., composed of glaciofluvial sands, gravels, and clays (Kwiatkowski 1994). The Polish sector of BF is divided into the protected area (BNP, approximately 105 km²) and the managed area (around 520 km²), which is subdivided into three forest districts: Białowieża, Hajnówka, and Browsk. From the 14th century until the early 20th century, BF served as an extensive royal hunting area. As a result, it escaped the widespread colonization and commercial timber extraction that affected most European forests with similar climates and topographies (Więcko 1984; Faliński 1986). BF contains a variety of woodland community types, including coniferous forests, mixed coniferous/broadleaved forests, mixed broadleaved/coniferous forests, and broadleaved forests. Additionally, there are streamside alder-ash forests and black alder bog forests. Coniferous forests thrive on well-drained, nutrient-poor soils, while broadleaved and floodplain forests occur on highly productive soils rich in organic matter but differing in water supply. For part of the year, floodplain forests are inundated. Mixed coniferous/broadleaved forests occupy an intermediate position on the soil fertility gradient. A detailed phytosociological description of these basic vegetation units has been provided by Paczoski (1930), Matuszkiewicz (1952), Faliński (1986), and Sokołowski (2004), among others. According to current phytosociological investigations, a total of 36 different woodland community types are present in BF (BULiGL 2021; Table S1 in Supplementary Information).
Material and Methods
Determination of the Actual DBH-Distributions of Tree Species
In order to determine the actual DBH-distributions of the main tree species occurring in the managed part of BF, data from measurements carried out in 2018 on permanent circular sample plots were used. The plots were established as part of a project aimed at the comprehensive inventory of the natural and cultural values of BF (Matuszkiewicz and Tabor 2022). Within this project, a total of 1,373 permanent test plots were set up, including 855 plots in managed stands (the remaining plots were located in BNP (240 plots, including 116 plots in the “Strict Reserve”) and in forest reserves excluded from forest management (278 plots)). The sample plots had a radius of r = 11.28 m (size 0.04 ha) and were arranged in a regular grid of 650 m × 650 m (Figure S1 in Supplementary Information). During measurements performed on these plots, among others, the species affiliation of all trees with a DBH of ≥7 cm was determined, and their diameters were measured. In this paper, we used these data to calculate the number of trees in successive, 4-cm-wide diameter classes with midpoints of 9 cm, 13 cm, 17 cm, etc. The list of species, which occurred most frequently and were included in the analyses presented below, involved Scots pine (Pinus sylvestris L.), Norway spruce (Picea abies (L.) Karsten), pedunculate oak (Quercus robur L.), common hornbeam (Carpinus betulus L.), small-leaved lime (Tilia cordata Miller), Norway maple (Acer platanoides L.), common ash (Fraxinus excelsior L.), black alder (Alnus glutinosa (L.) Gaertner), aspen (Populus tremula L.), silver and downy birch (Betula pendula Roth and Betula pubescens Ehrh.), and wych elm (Ulmus glabra Hudson).
Construction of Equilibrium/Sustainable Tree Size Distributions
In the case of tree species, the commonly used measure of the demographic status of a given population is size/diameter distribution (Salk et al. 2011; Brzeziecki et al. 2016; Halpin and Lorimer 2017). It is largely accepted that, in the case of a population in a state of demographic balance/equilibrium, the general form of the distribution of the number of trees in successive diameter classes resembles an inverted letter “J”, with the greatest number of individuals in the first, smallest size class (de Liocourt 1898; Lorimer and Frelich 1984; Wang et al. 2009). The exact form of the equilibrium distribution for tree species can be determined in several ways. In this paper, to calculate the number of trees in successive diameter classes of equilibrium, sustainable species-specific DBH-distributions, the so-called demographic approach was used (Coomes et al. 2003; Schütz 2006; Wang et al. 2009; Salk et al. 2011; Kohyama et al. 2015; Brzeziecki et al. 2016; Olofsson et al. 2023). The advantage of this approach is that it takes directly into account the growth and mortality rates of trees which jointly determine the shape of the equilibrium DBH-distribution. Under the demographic approach, the long-term sustainability of tree populations is determined by a simple rule: over time, the number of trees moving into a given size/diameter class through growth (in-growth) must equal the number of trees leaving that size class due to growth (out-growth) or mortality due to natural causes or management (Schütz 2006). In accordance with this rule, to determine species-specific equilibrium DBH-distributions, the following formula was used (Brzeziecki et al. 2016; Brzeziecki et al. 2021; cf. also: Lorimer and Frelich 1984; Schütz 2006; Salk et al. 2011; Olofsson et al. 2023):
where:
- ni, ni+1 – the numbers of trees in diameter classes i and i + 1, respectively;
- pi, pi+1 – the outgrowth rates, i.e. proportions of trees moving from diameter class i to class i + 1 and from diameter class i + 1 to class i + 2, respectively, during a given period;
- li, li+1 – the mortality rates, i.e. the proportions of trees in diameter classes i and i + 1, respectively, which died or were harvested during the same period.
The outgrowth rate (p) was determined by multiplying the annual absolute diameter growth rate (g) by the length of the corresponding census period (Δt) and dividing by the diameter class width (4-cm diameter classes were used). The absolute diameter growth rate (g) itself was estimated by means of the first derivative of the Chapman-Richards growth function, using DBH instead of time (Brzeziecki et al. 2016). The species-specific mortality rate (l) was estimated using a binary logistic function. The reduction terms (1–li and 1–li+1) in formula (1) were introduced by Brzeziecki et al. (2016) to account for the mortality of trees that moved out of classes i and i+1 during the observation period but died before the end of that period. Both natural mortality and growth functions were parameterized using empirical data from permanent study plots established in BNP and surveyed over the period 1936 - 2012 (cf. Appendix S9 in Brzeziecki et al. 2016).
The calculation of tree numbers in consecutive diameter classes was performed, starting always from n1 (the number of trees in the first, smallest diameter class). The value of n1 was fixed using a trial-and-error method such that the resulting basal area of the model DBH-distribution amounted to the target basal area of a given species. To determine the latter parameter, first, the overall value of the basal area (i.e., the value remaining after performing hypothetical regulatory cuts) was established. In the next step, this value was distributed among individual tree species proportionally to their assumed roles in the managed part of BF, calculated on the basis of their model shares in particular woodland communities (Table S3 in Supplementary Information), weighted by their area (Table S1 in Supplementary Information).
Calculation of Surplus (Total and Reduced) and Deficit Trees of Individual Species by Diameter Classes— Determination of the Area of Regeneration Units, by Species and Total
The total amount of surplus and deficit trees for a given species was calculated in a simple way as the arithmetic difference between the number of trees in individual diameter classes of the corresponding real and model size distributions. In the next step, for each species, the amount of reduced surpluses was calculated, under the assumption that the basal area of the residual DBH-distribution (i.e., the distribution that would remain after the completion of regulatory cuts) should correspond to the model value of basal area determined for this species.
The information on the amount of species-specific deficits in the first diameter class (DBH = 9 cm) was used to calculate the area of the regeneration units (ARU, in ha) that would be needed in order to establish (either naturally or artificially) groups and patches of young individuals of tree species that are currently in short supply. The value of the ARU parameter was calculated per 100 ha (which is the approximate standard size of large forest compartments into which the area of BF is divided) using information about the growing space (in m²) occupied by a single tree with DBH = 9 cm (midpoint of the first diameter class). It was assumed that the latter corresponds to the vertical crown projection area, calculated using allometric functions developed for Białowieża tree species (Bolibok and Brzeziecki 2000):
- ARU – the total area of regeneration units for a given tree species (in ha);
- DEF – the number of deficit trees of a given species in the smallest diameter class (in trees ∙ ha-1);
- GS – the growing space (in m2) of a single tree with DBH = 9 cm of a given species (corresponding to its crown projection area);
- FCS – an approximate size of standard forest compartment (amounting to 100 ha in this case).
Results
Current Densities and Actual DBH-Distributions of Individual Tree Species in BF
Overall densities of major tree species occurring in the managed part of BF, as determined during large-scale forest inventory conducted in 2018, were very diverse (parameter Ntot in Table 1). The density of the most abundant spruce was 100 times greater than the density of the least numerous species (elm and ash). Large differences also occurred for basal area (parameter Btot in Table 1). In this respect, pine and spruce, as well as alder, clearly outweighed the other species. For five species (elm, ash, maple, lime and aspen) the species-specific value of basal area was less than 1 m2 ∙ ha-1. The particular tree species differed also markedly in the general shape of their respective size distributions. While DBH-distributions for spruce and hornbeam, to a lesser extent also for birch and oak, were characterized by the prevalence of trees in small diameter classes and resembled, to a greater or lesser extent, an inverted letter “J”, the DBH-distributions for pine and alder were more or less unimodal and were distinguished by the dominance of trees in intermediate size classes. The remaining tree species were characterized by flat DBH-distributions containing, as a rule, a few individuals in successive diameter classes.
In addition, in Table 1, basal area of large trees (DBH ≥67 cm) is shown. We decided to exclude such trees from potential regulatory activities, taking into account their great ecological importance. By far, the largest share (over 50%) in this category had oak trees. After subtracting large trees, the total, empirical value of basal area (parameter Bred) amounted to around 27 m2 ∙ ha-1.
Real vs. Theoretical (Model and Hypothetical) DBH-Distributions
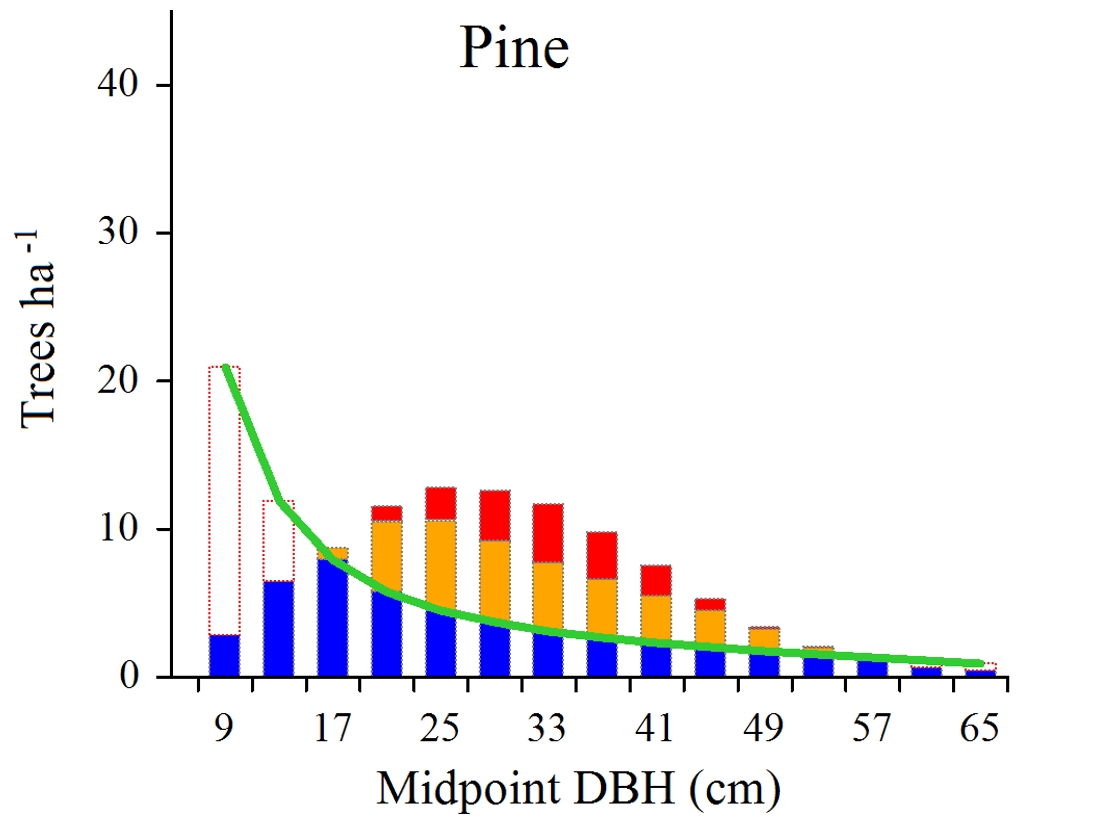
The real DBH-distributions for particular tree species are visually presented in Figure 2 against the background of model (equilibrium) and hypothetical (help) distributions. The latter were constructed to calculate the amount of reduced surpluses, i.e. trees that should be removed during the next, 10-year long planning period. The overall basal areas for hypothetical DBH-distributions were selected in such a way that the basal areas of the residual DBH-distributions (obtained with the smaller value between the real and hypothetical number of trees) corresponded to the target basal areas assumed for each species (shown in Table 2).
At the level of individual tree species, some characteristic patterns could be recognized. Aspen, maple, elm and ash, all were distinguished by the merely presence of deficits, occurring over the entire range of tree diameters. For birch and oak, deficits occurred mainly in small diameter classes, while in the case of lime they concerned mainly larger trees. In the case of pine, both deficit and surplus trees were present. While the first involved mainly small trees, the latter occurred mostly in intermediate size classes. Similar pattern was found also for alder, however, in the case of this species the amount of deficits was markedly smaller. The two last species, hornbeam and spruce, were distinguished, first of all, by the incidence of numerous surplus trees, present in small and intermediate diameter classes.
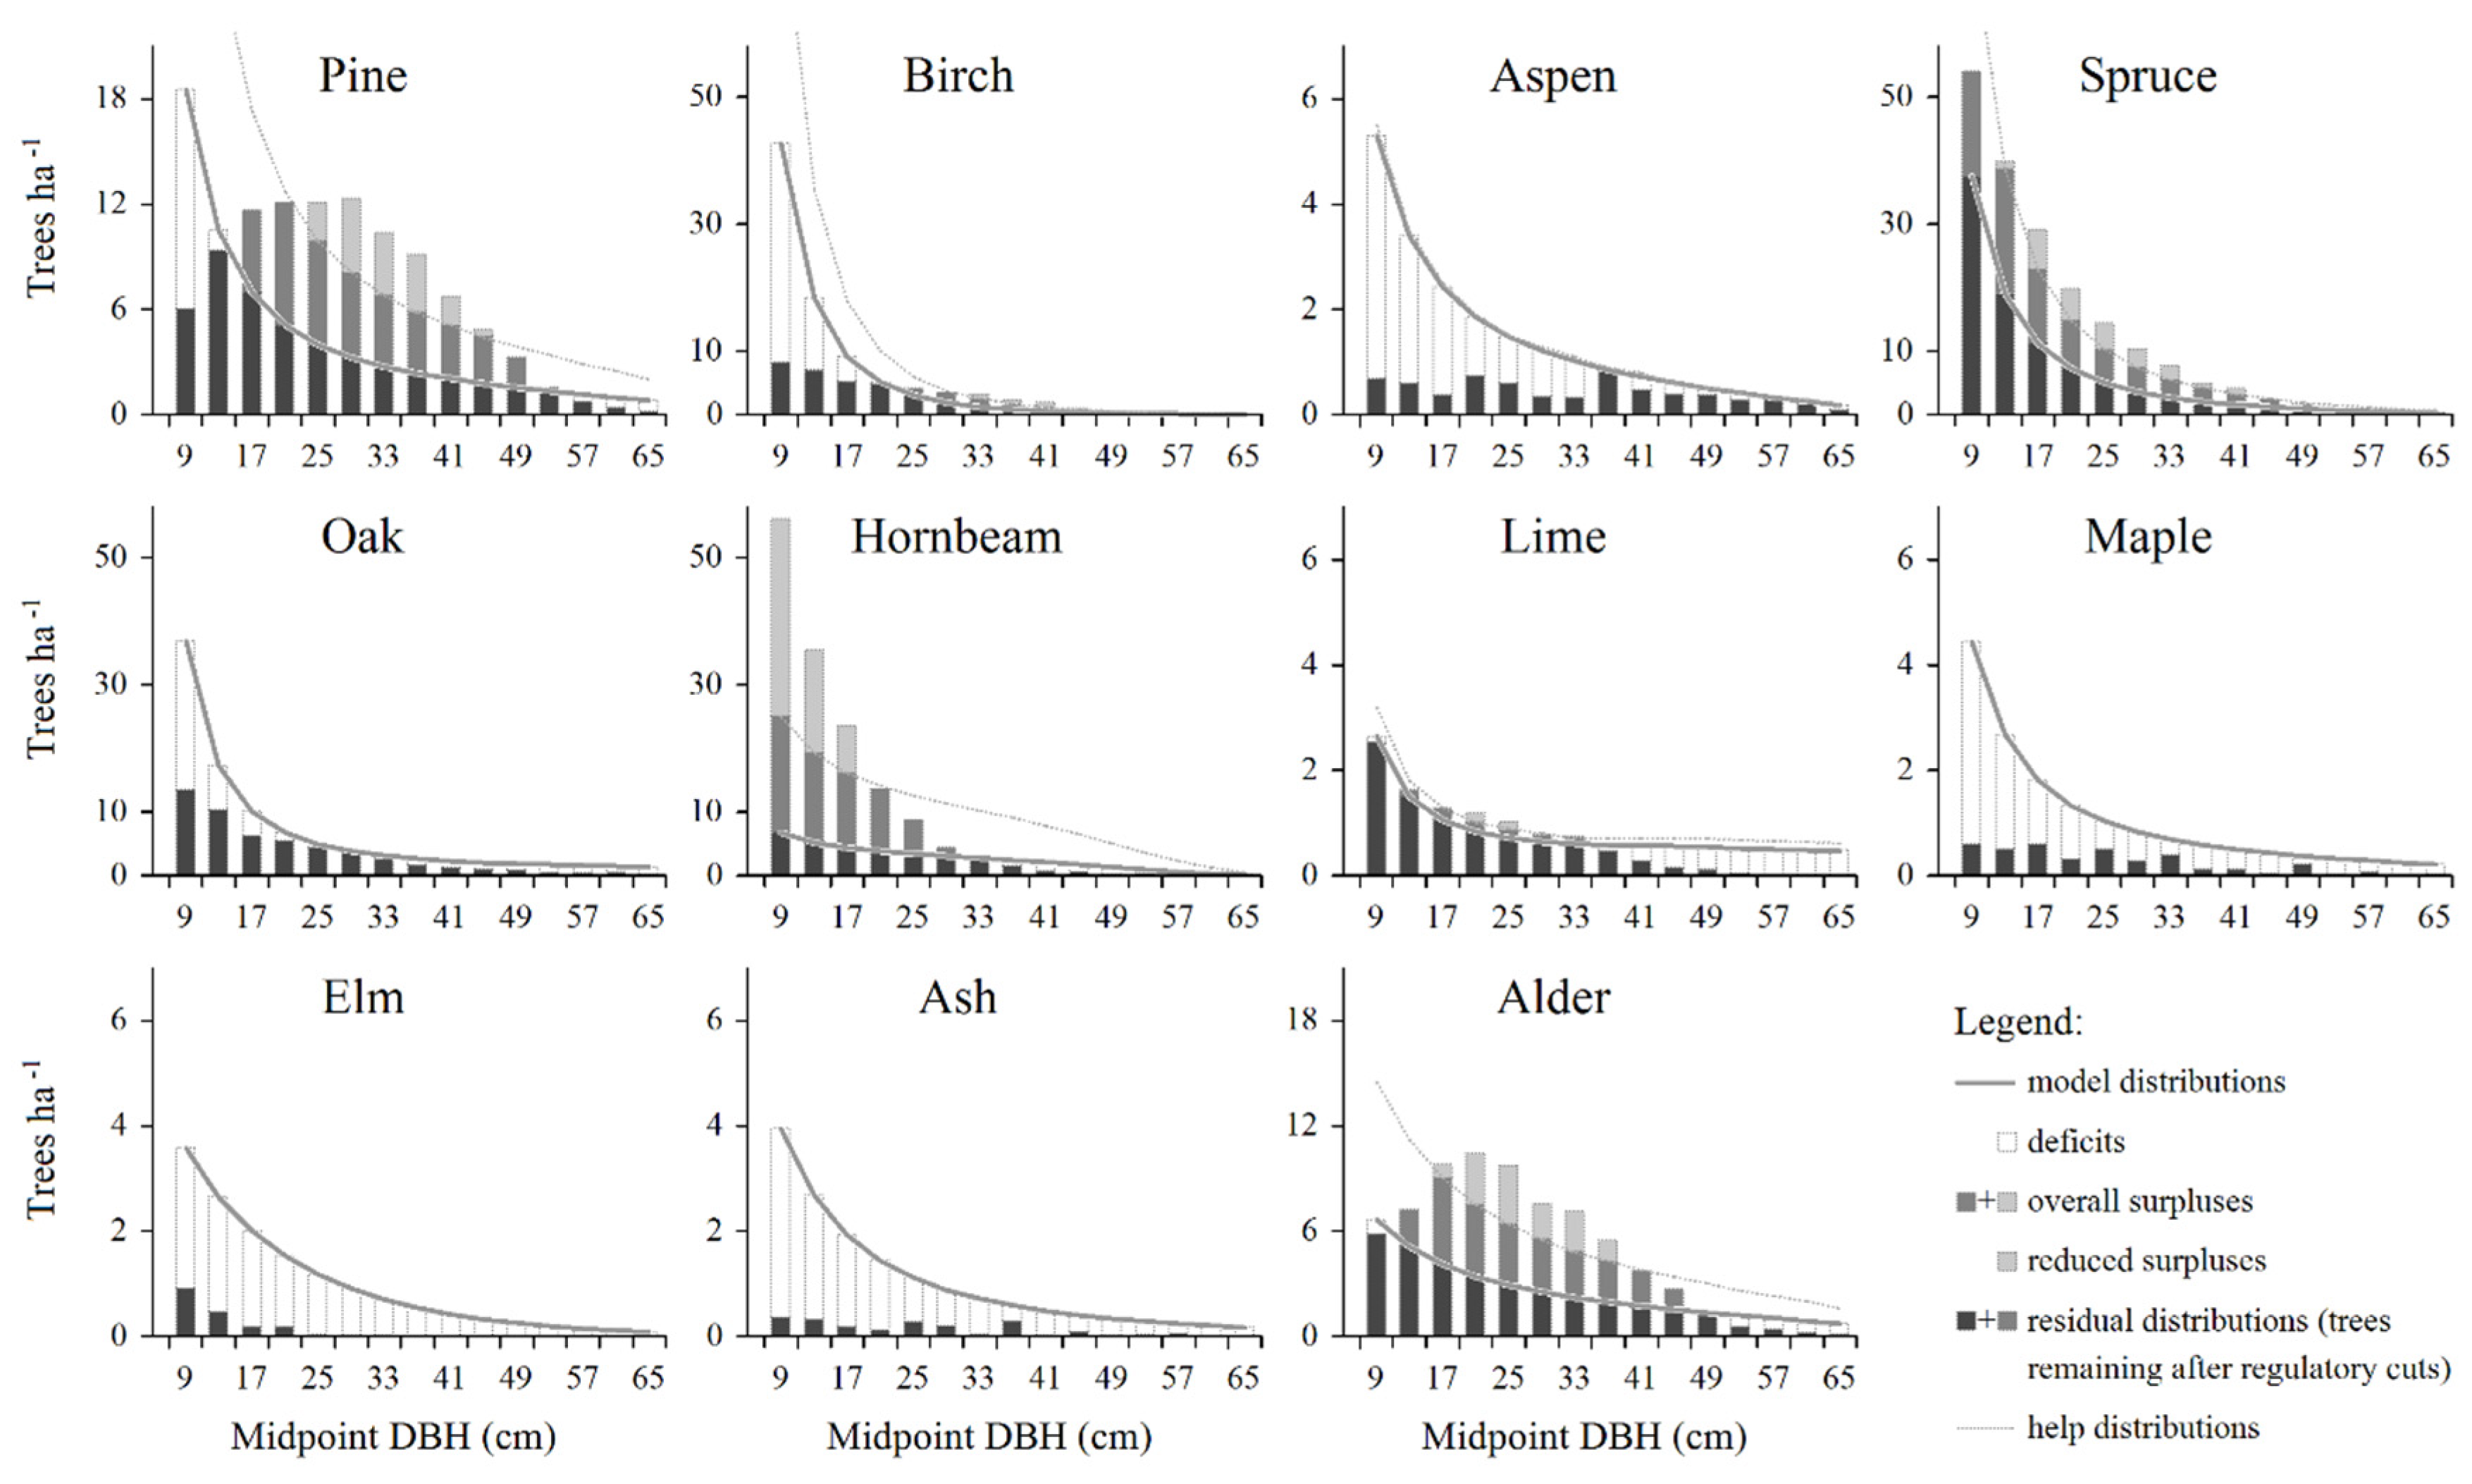
Figure 2.
Surplus (overall and reduced) and deficit trees shown against the background of model and hypothetical (help) distributions developed for individual tree species occurring in Białowieża woodland communities.
Figure 2.
Surplus (overall and reduced) and deficit trees shown against the background of model and hypothetical (help) distributions developed for individual tree species occurring in Białowieża woodland communities.
Overall Amount and Distribution of Total Surplus Trees
Most total surplus trees occurred in small and intermediate DBH-classes and were represented by hornbeam, spruce, alder and pine trees (Figure 3). The overall density of surplus trees was 311.7 ha-1, which constituted approximately 49% of the current overall density of all trees, while their basal area was 12.8 m2 ∙ ha-1, which corresponded to 47% of the total actual value of basal area after subtracting very large trees.
Amount and Distribution of Reduced Surpluses
Reduced surpluses represented small and intermediate diameter classes (with midpoints from 9 to 41 cm) (Figure 4). In the smallest diameter classes (9-17 cm), hornbeam trees clearly prevailed. Most of the spruce trees to be removed belonged to the 17-33 cm classes, while alder and pine trees primarily came from the 21-41 cm classes. The total density of trees planned for removal was 108.9 trees ∙ ha⁻¹, while their basal area amounted to 4.1 m² ∙ ha⁻¹ (i.e., 15% of the actual total basal area after subtracting very large trees).
Overall Amount and Distribution of Deficit Trees
The greatest deficits (calculated by subtracting real from model distributions) occurred in the three initial diameter classes (with midpoints between 9-17 cm) - Figure 5. The first diameter class was particularly prominent in this regard, with the greatest shortages concerning birch, oak and pine. A group of species characterized by deficiencies in the first diameter class also included aspen, maple, ash, elm and alder. The total deficit was 185.4 trees ∙ ha⁻¹, which constituted around 29% of the current density of all trees, while the total basal area of the deficits was 8.7 m² ∙ ha⁻¹, which was around 32% of the current total basal area after excluding very large trees.
Estimated Area of Regeneration Units (Regeneration Patches) Required to Reduce Species-Specific Deficits in the Smallest Diameter Class
The total size of necessary regeneration units, as calculated per 100 ha of forest area, was approximately 9 ha (Table 4). Greatest needs in this regard concerned birch, oak and pine, while the lowest - hornbeam, spruce, lime and alder.
Discussion
Using Equilibrium Distributions as an Indicator of the Demographic Sustainability/Viability of Tree Populations
To permanently play the role of foundation species in woodland communities, tree populations must be demographically sustainable, i.e., their size/diameter distributions should have a steeply descending monotonic form (Halpin and Lorimer 2017). The number of trees that should be present in subsequent diameter classes to ensure the demographic sustainability of a given population depends on two (species-specific) demographic processes: growth and mortality. In this work, to characterize the growth and mortality rates of trees, we used functions parameterized by Brzeziecki et al. (2016), based on data collected during research conducted on permanent plots in the strictly protected part of BF, covering a period of almost 80 years. Such a long study period provides an opportunity to eliminate the influence of random factors on the examined processes and increases the chance of correctly determining the main trends and patterns (Muller-Landau et al. 2006).
In addition to the tree growth and mortality functions, an important element of the approach used in this work was the model value of the basal area, overall and assigned to the individual tree species. We assumed that the basis for determining the overall value of this parameter (characterizing the condition of stands after cuttings aimed at approximating the real distributions to the modeled ones) should be the actual value of basal area in BF stands (after excluding very large trees), reduced by a predetermined figure (15% or 4.1 m2 ∙ ha-1 in our case). The above number was chosen somewhat arbitrarily but was adopted at such a level as to ensure that the basal area of trees harvested during a standard 10-year planning period would be markedly below the estimated value of the periodic 10-year increment of basal area in Białowieża stands amounting to around 7.3 m2 ∙ ha-1 (Brzeziecki et al. 2021; BULiGL 2021). The total model value of the basal area was then divided among individual tree species, in proportion to their assumed percentage shares in Białowieża communities. For this purpose, data on the model tree species composition of the main types of Białowieża woodland communities were used (adopted after BULiGL 2021; cf. Table 3 in Supplementary Information). These data constitute a synthesis of many previous phytosociological studies conducted at different times in the communities of BF by numerous researchers (Paczoski 1930; Matuszkiewicz 1952; Faliński 1986; Sokołowski 2004). Although these data are, at least to some extent, arbitrary, they seem to constitute a reasonable approximation of what can be assumed in relation to individual tree species, based on the knowledge of their life strategies, ecological requirements, and biological properties. Nevertheless, in the future, the assumptions made in this respect (which are necessarily based on past experience) may be changed. In the face of climate change and modifications to other important environmental parameters (e.g., caused by the deposition of nitrogen compounds), this may turn out to be necessary, indeed (Seastedt et al. 2008; Gonzalez et al. 2010; Milad et al. 2011; Brang et al. 2014). Nevertheless, in any situation, striving to ensure a balanced demographic status of a given species, regardless of its assumed participation in community structure, remains an issue of fundamental importance (Halpin and Lorimer 2017; Stanke et al. 2021; Ohse et al. 2023).
Common Deviations Between Actual and Theoretical Tree Size Distributions: Major Causes and Implications
For many, or even the majority, of tree species in BF, their actual diameter distributions deviated, to a greater or lesser extent, from the desired equilibrium state, as shown by large amounts of total surpluses and deficits. In certain, usually middle, ranges of tree diameters of some species, there were surpluses, and in others (mainly for the smallest trees, and to some extent also for the largest trees) there were deficits in the actual number of trees in relation to the model values. Together, almost half of all trees in BF represented “inappropriate” species and/or diameter ranges, i.e., they were found in excess in relation to the balanced model. This problem mainly concerned hornbeam, spruce, alder, and pine. The scale of the deficits was also high, estimated at over 30% of the current total number of trees.
The question arises as to why such a large area covered by this study (over 520 km²) was not sufficient to allow for a demographic balance at the level of individual tree species. There is certainly no single, simple answer to this question. What is of fundamental importance here is the fact that, in the area in question, exploitation of wood resources has been carried out for over 100 years - since the World War I. Initially, this was in the form of plundering cuts (German cuttings during the World War I; the activity of the “Century” timber company during the interwar period), and then, after the World War II, in the form of regulated forest management, favoring certain tree species at the expense of others (Więcko 1984; Faliński 1986).
The legacy of events that took place at the beginning of the 20th century, and probably also in the post-war years, which has been preserved to this day, is, among other things, the excessive occurrence of alder-dominated stands in the eutrophic and wet habitats of BF. Such habitats could potentially be occupied by much more diverse tree stands, consisting of ash, maple, elm, oak, spruce, hornbeam, and lime. The heritage of forest management is also the overrepresentation of pine, and to some extent spruce, in certain stands, which is the result of excessive favoring of these (important from a commercial point of view) species in the past.
Hornbeam is also found in great abundance. In this case, it is primarily the result of the high competitive ability and shade tolerance of this species. It is worth emphasizing that, from the ecological and economical point of view, the appearance and growth of hornbeam under the canopy of other species (such as pine or oak) is generally a desirable phenomenon. The problem arises when a given forest area is completely taken over by hornbeam, because, over a long period of time, practically no other tree species are able to effectively compete with it.
The influence of forest management can also explain the currently low abundance of birch and especially aspen in the managed part of BF. The populations of these species, being less valuable from an economic point of view, have been systematically reduced over time during thinning operations carried out in favor of species that are more valuable economically (oak, pine, spruce) (Borecki and Brzeziecki 2001).
In turn, the currently low density of species such as elm and ash is the result of mass die-off caused by factors on which forest management had practically no influence (Dutch elm disease in the case of elm and the invasive fungus Chalara fraxinea in the case of ash (Pautasso et al. 2013; Kowalski et al. 2017)).
Measures Which Need Be Done to Bring the Local Tree Populations Closer to This Desired State
Considering the large discrepancies between actual and theoretical, sustainable distributions, two main types of actions would be required to bring the current situation closer to the desirable, sustainable state: 1) a gradual elimination of existing surpluses, taking into account those species and diameter ranges where they are currently the largest; 2) a systematic reduction of existing deficits, primarily by actively supporting the process of regeneration and recruitment to the stand stage for those tree species that show the greatest deficiencies in this regard.
From the point of view of maintaining the demographic stability of individual tree species, the biggest problem today is the significant deficit of trees in the initial diameter classes for a large group of species. As pointed out by Ohse et al. (2023), the early life stages are crucial for maintaining population viability. This suggests that, first and foremost, efforts should focus on creating conditions that enable the regeneration and subsequent recruitment to the stand phase of species that are currently in short supply. This could partly be done through (assisted) natural regeneration; however, in many cases, artificial regeneration would also be necessary. In fact, the need for human intervention to support tree recruitment processes has often been recognized by researchers who have studied BF at different times (Paczoski 1930; Matuszkiewicz 1952; Sokołowski 2004; Paluch 2004, 2005; Matuszkiewicz 2011). For example, already almost 100 years ago, Paczoski (1930) suggested that oak should be promoted at the expense of hornbeam through active silvicultural measures (planting, release cuttings). Similar suggestions, regarding several different tree species (Scots pine, Norway maple, ash, elm, and even alder), were also made by other authors later.
Actions aimed at reducing existing deficits in some species can, or even should, be combined with actions aimed at eliminating current surpluses. Places where there is a particularly large concentration of species and diameter classes occurring in excess in relation to the equilibrium curves, should be selected for the establishment of regeneration units (in form of smaller or larger artificial canopy gaps) for species in short supply. The need to eliminate surplus trees is justified by the necessity to create space for missing tree species. Excesses and deficiencies are often interrelated in the sense that the occurrence of excesses in certain species and diameter ranges causes deficiencies in other species and diameter ranges. It is known, for example, that an overrepresentation of trees in higher diameter classes may strongly inhibit regeneration processes, thus leading to shortages in the initial diameter classes (Ducey 2006; Halpin and Lorimer 2017).
Undoubtedly, one of the priority tasks in the active protection of the natural resources of BF should be the restoration of populations of those tree species that are currently very sparsely represented (elm, maple, ash, aspen – Figure 5). They all are important host species for many valuable elements of forest biodiversity (Pautasso et al. 2013; Jaworski et al. 2019; Hilszczański et al. 2022). To be effective, potential actions aimed at improving the demographic status of the aforementioned species should cover extensive areas of BF.
Conserving Natural Values of BF: Which Strategy Would Be the Best?
The debate about the most appropriate management strategy aimed at preserving the high natural values of BF on a sustainable basis lasted for a very long time. Essentially, this debate took place between proponents of an active policy (Brzeziecki et al. 2017) and supporters of a passive approach, associated with the concept of strict protection (Jaroszewicz et al. 2017). When BF was granted the status of a World Heritage Site in 2014, the balance clearly shifted in favor of the concept of strict protection, as most of its area was, by political decision, excluded from any activities. The concept of strict protection implies that allowing natural processes is the best way to maintain the high biological diversity of BF. In relation to trees, this concept assumes, at least implicitly, that their balanced demographic structure will spontaneously recover, enabling them to sustainably play the desired role of foundation species. The question, however, is how realistic this assumption is?
At least a partial answer to this question is provided by the research conducted in the “Strict Reserve” of BNP (occupying an area of nearly 50 km2), i.e., that part of BF which has been “left to nature” for more than 100 years. The long-term studies conducted in the “Strict Reserve” clearly show that under conditions of strict protection, for the vast majority of tree species, deviations from the equilibrium state did not decrease; on the contrary, they increased significantly (Brzeziecki et al. 2016). A fundamental role here was played by a phenomenon often referred to in the literature as “tree recruitment failure” (Salk et al. 2011; Temperli et al. 2015; Walters et al. 2020; Ngugi et al. 2021; Stanke et al. 2021; Ohse et al. 2023). In BNP, there were many reasons for this phenomenon (Miścicki 2012; Brzeziecki et al. 2016; Brzeziecki, Andrzejczyk et al. 2018). A particularly important role was played by the strong, uncontrolled pressure of large herbivores (bison, elk, deer, and roe deer), resulting in the almost complete elimination of many tree species from regeneration processes (Kuijper, Jędrzejewska et al. 2010; Kuijper, Cromsigt et al. 2010). As a result, regeneration and recruitment processes were dominated by a limited number of species, which lead to the increasing simplification and homogenization of woodland communities and the disappearance of many precious elements of biodiversity, such as numerous rare vascular plants (Adamowski 2009; Matuszkiewicz 2011; Brzeziecki, Ciurzycki et al. 2018) and lichens (Cieśliński 2009).
At this moment, the demographic status of several tree species in the managed part of BF (where, among other things, the access of ungulates to young stands has been effectively limited by the use of fences) is more favorable than in the “Strict Reserve” of BNP (Brzeziecki et al. 2022). A remarkable example in this respect is the current diameter distributions of two important species: pine and oak. In the “Strict Reserve”, both pine and oak are currently represented by aging, strongly decreasing populations (Figure 6). At the same time, in the managed part of BF, the present demographic situation of both species is much more favorable, particularly in the range of young and middle-aged trees (with DBH between 7 and 67 cm). This is the result of deliberate support (through various silvicultural measures, including artificial regeneration and fencing) for both species over a long period of time (formerly pine, and in recent years mainly oak). Although these species were primarily favored for economic reasons, both, and especially oak, also play an important ecological role, due to the long list of different forest taxa associated with them, including rare and endangered saproxylic beetles (Jaworski et al. 2019; Hilszczański et al. 2022). The example of pine and oak illustrates the potential of appropriate forest management to create woodland communities distinguished by a diversified structure and a balanced demographic structure of individual tree species. This capacity can and should be used to restore the appropriate demographic status and ecological role not only of the above-mentioned species traditionally favored in forest management, but also of all others, while maintaining appropriate quantitative proportions between them.
Thus, a viable alternative to the strategy based on the concept of strict protection is the active approach outlined in this study. This approach is based on the assumption that one should not passively wait and hope that the desired state of BF ecosystems will spontaneously recover (in an unspecific future), but that appropriate actions should be initiated to restore this desirable state here and now. The foundation of the approach proposed here is the concept of stocking control or stocking regulation (O’Hara 2014). The aim of stocking regulation is to allocate the available growing space between individual forest components (tree species and their development stages) in a way that ensures the (relative) permanence of the desired structure of woodland communities at a given spatial scale. The primary goal of regulation can also be defined as the transformation of a given forest structure into another (more desirable one) (O’Hara 2014). The potential scope of regulatory activities may also include other structural elements contributing to the complexity of the forest (tree stand), such as dead standing and lying trees. The structure of the forest is constantly changing due to the appearance of new trees (the recruitment process), dying of and the use of available space by existing trees (the mortality and growth processes). The primary task of regulation in this situation is to ensure that these processes do not lead to excessive changes or deviations from the structure of the forest, considered as optimal.
The approach presented in this work is an example of the application of the concept of regulating forest structure in order to achieve effects primarily desired from the point of view of nature conservation. As part of this approach, the condition that the forest ecosystems in BF should achieve was first defined, primarily in terms of the species diversity of tree stands and the demographic structure of individual tree species. Next, the desired state was compared with the current situation, and the nature and type of discrepancies between them were determined. These discrepancies constituted the basis for planning actions and treatments aimed at gradually bringing the current state closer to the desired conditions. Although our analysis was carried out in relation to the entire area of BF, it can be repeated in a similar way in relation to smaller spatial units, e.g. forest compartments, which could play the role of basic spatial units of forest silvicultural planning aimed at preserving demographic sustainability of tree species (Brzeziecki et al. 2021).
It is worth emphasizing that the need for an active approach to preserving the high natural values of forest ecosystems has recently been emphasized by an increasing number of authors (Cole and Yung 2010; Gamfeldt et al. 2013; Wapner 2014; Pautasso et al. 2013; Sebek et al. 2015; Halpin and Lorimer 2017; Miller et al. 2018; Kovac et al. 2018; Ampoorter et al. 2020; Ohse et al. 2023). As shown, for example, by Cole and Yung (2010), today, in the era of global change, it is not possible to effectively protect nature by enclosing it within “protected areas” (reserves, national parks, and wilderness areas), drawing a line around them, and leaving them alone (cf. also Wapner 2014). The approach presented in this work meets the demands put forward by all these authors. We suggest that in order for it to bring the desired effects, it should be applied to the majority of the area of BF. Obviously, the application of the approach described here is not limited to the particular case of BF but is also possible in all instances where the preservation of high natural values of forest ecosystems is important.
Summary and Conclusions
Trees act in forest ecosystems as so-called foundation species, i.e., species that have the most significant impact on the main processes and phenomena occurring in woodland communities. The existence of virtually all other groups of forest-associated organisms depends on trees, either directly or indirectly. The essential condition for trees to sustainably play this role (within given time and spatial scales) is their balanced demographic structure, reflected in the appropriate proportions of individuals representing particular developmental stages (from young/small trees, through middle-aged/intermediate-sized trees, to old/large trees). Maintaining demographic sustainability requires that there be the largest number of youngest/small trees, with fewer and fewer older and larger trees, in accordance with a general model often compared to the inverted letter “J”.
The analysis of the current demographic status of individual tree species in the managed part of BF revealed that the actual diameter distributions of most of them are characterized by large deviations, both in excess and in deficit, from the desired equilibrium state. The reasons for this situation are complex and result from both human-related factors and the impact of (changing) general environmental conditions. A major problem is the large shortages in the number of trees in the smallest diameter classes, as observed for many species. This calls into question the possibility of these species acting as foundation species in a sustainable manner.
The concept of protecting natural processes, currently adopted in relation to most of the area of BF, indirectly assumes that the desired demographic balance of individual tree species will be restored spontaneously, although in an unspecified future. An alternative to this concept is an active strategy, which assumes actions aimed at the gradual elimination of identified excesses and deficiencies of trees in relation to the desired equilibrium state. A primary goal of such actions would be to bring gradually the current tree diameter distributions closer to the model distributions, ensuring the demographic sustainability of tree species and, ultimately, more efficient preservation of forest-associated biodiversity.
Supplementary Materials
The following supporting information can be downloaded at the website of this paper posted on Preprints.org.
Author Contributions
Bogdan Brzeziecki designed the study and wrote the first draft of the paper.Data analysis was performed byJacek Zajączkowski who also produced tabular and graphical output. Marek Ksepko provided data on woodland community types occurring in Białowieża Forest, their spatial extent and model composition. All authors collaborated on data analysis and writing of the paper. All authors read and approved the final manuscript.
Funding
Research funded by the General Directorate of State Forests in Poland (GA No. EO.271.3.1.2019).
Data Availability Statement
The datasets generated and/or analyzed during the current study are available from the corresponding author on reasonable request.
Conflicts of Interest
The authors declare no conflicts of interest.
References
- Adamowski W (2009) Flora naczyniowa. In: Okołów C, Karaś M, Bołbot A (ed) Białowieski Park Narodowy. Poznać. Zrozumieć. Zachować (In Polish). Białowieski Park Narodowy, Białowieża, Poland, pp 60-72.
- Alexander K, Butler J, Green T (2006) The value of different tree and shrub species to wildlife. Brit Wildlife 18,1: 18-28.
- Ampoorter E, Barbaro L, Jactel H et al. (2020) Tree diversity is key for promoting the diversity and abundance of forest-associated taxa in Europe. Oikos 129: 133-146. [CrossRef]
- Bolibok L, Brzeziecki B (2000) An analysis of selected allometric relationships for main tree species of the Białowieża National Park (In Polish with English summary). Sylwan 144,6: 73-81.
- Boonman CCF, Serra-Diaz JM, Hoeks S, Guo W-Y, Enquist BJ, Maitner B, Malhi Y, Merow C, Buitenwerf R, Svenning J-Ch (2024) More than 17,000 tree species are at risk from rapid global change. Nat Commun 15: 166. [CrossRef]
- Borecki T, Brzeziecki B (2001) Silvicultural analysis of post-Century stands in the Białowieża Forest (In Polish with English summary). Sylwan 145,7: 19-29.
- Brang P, Spathelf P, Bo Larsen J, Bauhus J, Boncčìna A, Chauvin Ch, Drössler L, García-Güemes C, Heiri C, Kerr G, Lexer MJ, Mason B, Mohren F, Mühlethaler U, Nocentini S, Svoboda M (2014) Suitability of close-to-nature silviculture for adapting temperate European forests to climate change. Forestry 87: 492-503. [CrossRef]
- Brzeziecki B (2017) Białowieża Forest as a biodiversity spot (In Polish with English Summary). Sylwan 161,12: 971-981. [CrossRef]
- Brzeziecki B, Pommerening A, Miścicki S, Drozdowski S, Żybura H (2016) A common lack of demographic equilibrium among tree species in Białowieża National Park (NE Poland): evidence from long-term plots. J Veg Sci 27: 460-469. [CrossRef]
- Brzeziecki B, Drozdowski S, Żybura H, Bolibok L, Bielak K, Zajączkowski J (2017) Managing for naturalness alone is not an effective way to preserve all the valuable natural features of the Białowieża Forest – a reply to Jaroszewicz et al. J Veg Sci 28: 223-231. [CrossRef]
- Brzeziecki B, Andrzejczyk T, Żybura H (2018) Natural regeneration of trees in the Białowieża Forest (In Polish with English summary). Sylwan 162,11: 883-896. [CrossRef]
- Brzeziecki B, Ciurzycki W, Keczyński A (2018) Changes of herb layer vegetation during the period 1959-2016 on the permanent study plot in the compartment 319 of Białowieża National Park (In Polish with English summary). Sylwan 162,12: 980-988. [CrossRef]
- Brzeziecki B, Hilszczański J, Kowalski T, Łakomy P, Małek S, Miścicki S, Modrzyński J, Sowa J, Starzyk JR (2018) Problem of a massive dying-off of Norway spruce in the ‘Białowieża Forests’ Forest Promotional Complex (In Polish with English Summary). Sylwan 162,5: 373-386. [CrossRef]
- Brzeziecki B, Drozdowski S, Bielak K, Czacharowski M, Zajączkowski J, Buraczyk W, Gawron L (2021) A demographic equilibrium approach to stocking control in mixed, multiaged stands in the Białowieża Forest, Northeast Poland. For Ecol Manage 481, 118694. [CrossRef]
- Brzeziecki B, Zajączkowski J, Bolibok L (2022) Tree species and tree stands. In: Matuszkiewicz JM, Tabor J (ed). Natural and cultural inventory of Białowieża Forest (In Polish). Instytut Badawczy Leśnictwa, Sękocin Stary, pp 159-391. [CrossRef]
- BULiGL (2021) Forest management plans for Białowieża, Browsk and Hajnówka Forest Districts for years 2021-2030 (In Polish). BULiGL, Białystok, Poland.
- Cieśliński S (2009) Porosty. In: Okołów C, Karaś M, Bołbot A (ed) Białowieski Park Narodowy. Poznać. Zrozumieć. Zachować (In Polish). Białowieski Park Narodowy, Białowieża, Poland, pp 73-86.
- Cole DN, Yung L (2010) Beyond Naturalness: Rethinking Park and Wilderness Stewardship in an Era of Rapid Change, 1st edition. Island Press, Washington DC, US.
- Coomes DA, Duncan RP, Allen RB, Truscott J (2003) Disturbances prevent stem size-density distributions in natural forests from following scaling relationships. Ecol Lett 6: 980-989. [CrossRef]
- Dale VH, Joyce LA, McNulty S, Neilson RP, Ayres MP, Flannigan MD, Hanson PJ, Irland LC, Lugo AE, Peterson ChJ, Simberloff D, Swanson FJ, Stocks BJ, Wotton BM (2001) Climate Change and Forest Disturbances: Climate change can affect forests by altering the frequency, intensity, duration, and timing of fire, drought, introduced species, insect and pathogen outbreaks, hurricanes, windstorms, ice storms, or landslides. Biosci J 51: 723-734. [CrossRef]
- de Liocourt F (1898) De l’amenagement des sapinieres. Société forestière di Franche-Comtè et Belfort, Bulletin, pp 396-409.
- Ducey MJ (2006) The Reverse-J and Beyond: Developing Practical, Effective Marking Guides. In: Proceedings of Implementing Uneven-Aged Management in New England: Is it practical? Fox Research and Demonstration Forest, Hillsborough, NH, USA, 13 April 2006; Caroline, A., Ed.: U.N.H. Cooperative Extension: Durham, NH, USA. http://extension.unh.edu/resources/files/Resource002220_Rep3279.pdf.
- Ellison AM, Bank MS, Clinton BD et al. (2005) Loss of foundation species: consequences for the structure and dynamics of forested ecosystems. Front Ecol Envi 3: 479-486. [CrossRef]
- EU Biodiversity Strategy for 2030 (2020) Bringing nature back into our lives. European Commission, Brussels, Belgium.
- Faliński JB (1977) Zielone grądy i czarne bory Białowieży (In Polish). Instytut Wydawniczy Nasza Księgarnia, Warszawa.
- Faliński JB (1986) Vegetation dynamics in temperate lowland primeval forests. Ecological studies in Białowieża Forest. Dr W. Junk Publishers, Dordrecht/Boston/Lancaster. Geobotany 8: 1-537.
- Faliński JB (1994) Concise geobotanical atlas of Białowieża Forest. Phytocoenosis. Supplementum Cartographiae Geobotanicae 6: 3-12.
- Faliński JB, Mułenko W (1996) Cryptogamous plants in the forest communities of Białowieża National Park. Phytocoenosis 8: 75-110.
- FOREST EUROPE (2020) The State of Europe’s Forests. Forest Europe Liason Unit, Bratislava, Slovakia.
- Galatowitsch S, Frelich L, Phillips-Mao L (2009) Regional climate change adaptation strategies for biodiversity conservation in a midcontinental region of North America. Biol Conserv 142: 2012-2022. [CrossRef]
- Gamfeldt L, Snäll T, Bagchi R et al. (2013) Higher levels of multiple ecosystem services are found in forests with more tree species. Nat Commun 4: 1340. [CrossRef]
- Gonzalez P, Neilson RP, Lenihan JM, Drapek RJ (2010) Global patterns in the vulnerability of ecosystems to vegetation shifts due to climate change. Global Ecol Biogeogr 19,6: 755-768. [CrossRef]
- Götmark F (2013) Habitat management alternatives for conservation forests in the temperate zone: Review, synthesis, and implications. For Ecol Manage 306: 292-307. [CrossRef]
- Halpin CR, Lorimer CG (2017) A demographic approach to evaluating tree population sustainability. Forests 8, 46. [CrossRef]
- Hilszczański J, Jaworski T, Plewa R, Tarwacki G, Sućko K, Horák J. (2022) Chrząszcze saproksyliczne. In: Matuszkiewicz JM, Tabor J (ed). Inwentaryzacja wybranych elementów przyrodniczych i kulturowych Puszczy Białowieskiej (In Polish). Instytut Badawczy Leśnictwa, Sękocin Stary, Poland, pp 617-663. [CrossRef]
- IPBES (2019) Summary for policymakers of the global assessment report on biodiversity and ecosystem services of the Intergovernmental Science-Policy Platform on Biodiversity and Ecosystem Services. IPBES secretariat, Bonn, Germany. 56 p. [CrossRef]
- Jaroszewicz B, Bobiec A, Eycott AE (2017) Lack of demographic equilibrium indicates natural, large-scale forest dynamics, not a problematic forest conservation policy – a reply to Brzeziecki et al. J Veg Sci 28: 218-222. [CrossRef]
- Jaroszewicz B, Cholewińska O, Gutowski JM, Samojlik T, Zimny M, Latałowa M (2019) Białowieża forest - A relic of the high naturalness of European forests. Forests 10 (10), 849. [CrossRef]
- Jaworski T, Plewa R, Tarwacki G, Sućko K, Hilszczański J, Horák J. (2019) Ecologically similar saproxylic beetles depend on diversified deadwood resources : from habitat requirements to management implications. For Ecol Manage 449 : 117462. [CrossRef]
- Kannan R, James DA (2009) Effects of climate change on global biodiversity: a review of key literature. Trop Ecol 50,1: 31-39.
- Kohyama TS, Potts MD, Kohyama TI, Rahman Kassim A, Ashton PS (2015) Demographic properties shape tree size distribution in a Malaysian rain forest. Am Nat 185: 367-379. [CrossRef]
- Kowalski T, Bilański P, Kraj W (2017) Pathogenicity of fungi associated with ash dieback towards Fraxinus excelsior. Plant Pathol 66,8: 1228-1238. [CrossRef]
- Kovac M, Hladnik D, Kutnar L (2018) Biodiversity in (the Natura 2000) forest habitats is not static: its conservation calls for an active management approach. J Nat Conserv 43: 250-260. [CrossRef]
- Kuijper DPJ, Jędrzejewska B, Brzeziecki B, Churski M, Jędrzejewski W, Żybura H (2010) Fluctuating ungulate density shapes tree requirement in natural stands of the Białowieża Primeval Forest, Poland. J Veg Sci 21: 1082-1098.
- Kuijper DPJ, Cromsigt JPGM, Jędrzejewska B, Miścicki S, Churski M, Jędrzejewski W, Kweczlich I (2010) Bottom-up versus top-down control of tree regeneration in the Białowieża Primeval Forest, Poland. J Ecol 98 (4): 888-899.
- Kwiatkowski W (1994) Vegetation landscapes of Białowieża Forest. Phytocoenosis. Supplementum Cartographiae Geobotanicae 6: 35-87.
- Lorimer CG, Frelich LE (1984) A simulation of equilibrium diameter distributions of sugar maple (Acer saccharum). B Torrey Bot Club 111: 193–199.
- Matuszkiewicz W (1952) Zespoły leśne Białowieskiego Parku Narodowego (In Polish with English summary). Annales UMCS. Lublin – Polonia. Supplementum VI. Sectio C. UMCS, Lublin, Poland.
- Matuszkiewicz JM (2011) Changes in the forest associations of Poland’s Białowieża Primeval Forest in the second half of the 20th century. Czas Geogr 82: 69-105.
- Matuszkiewicz JM, Tabor J (ed) 2022. Inwentaryzacja wybranych elementów przyrodniczych i kulturowych Puszczy Białowieskiej (In Polish with English summary). Instytut Badawczy Leśnictwa, Sękocin Stary, Poland. [CrossRef]
- Milad M, Schaich H, Bürgi M, Konold W (2011) Climate change and nature conservation in Central European forests: A review of consequences, concepts and challenges. For Ecol Manage 261: 829-843. [CrossRef]
- Miller KM, McGill BJ, Mitchell BR, Comiskey J, Dieffenbach FW, Matthews ER, Perles SJ, Schmit JP, Weed AS (2018) Eastern national parks protect greater tree species diversity than unprotected matrix forests. For Ecol Manage 414: 74-84. [CrossRef]
- Miścicki S (2012) Structure and dynamics of temperate lowland natural forest in the Białowieża National Park, Poland. Forestry 85 (4): 473-483. [CrossRef]
- Muller-Landau HC, Condit RS, Harms KE et al. (2006) Comparing tropical forest tree size distributions with the predictions of metabolic ecology and equilibrium models. Ecol Lett 9: 589-602.
- Muys B, Angelstam P, Bauhus J, Bouriaud L, Jactel H, Kraigher H, Müller J, Pettorelli N, Pötzelsberger E, Primmer E, Svoboda M, Thorsen BJ, Van Meerbeek K (2022) Forest Biodiversity in Europe. From Science to Policy 13, EFI. [CrossRef]
- O’Hara KL (2014) Multiaged Silviculture. Managing for Complex Forest Stand Structures. Oxford, Oxford University Press, US.
- Ohse B, Compagnoni A, Farrior CE, McMahon SM, Salguero-Gómez R, Rüger N, Knight TM (2023) Demographic synthesis for global tree species conservation. Trends Ecol Evol 38,6: 579-590. [CrossRef]
- Okołów C, Karaś M, Bołbot A (ed.) (2009) Białowieski Park Narodowy (In Polish). Poznać. Zrozumieć. Zachować. Białowieski Park Narodowy, Białowieża, Poland.
- Olofsson L, Langvall O, Pommerening A (2023) Norway spruce (Picea abies (L.) H. Karst.) selection forests at Siljansfors in Central Sweden. Trees, Forests People 12, 100392. [CrossRef]
- Ngugi MR, Neldner VJ, Dowling RM, Li J (2021) Recruitment and demographic structure of floodplain tree species in the Queensland Murray-Darling basin, Australia. Ecol Manag Restor 23,1: 64-73. [CrossRef]
- Paczoski J (1930) Lasy Białowieży (In Polish). PROP, Poznań, Poland.
- Palik B, Engstrom RT (2004) Species composition. In: Hunter Jr ML (ed) Maintaining Biodiversity in Forest Ecosystems. Cambridge University Press, Cambridge. pp 65-94.
- Paluch R 2004. The state, conditions and problems of pine natural regeneration in the Białowieża Forest (In Polish with English summary). Sylwan 148 (11): 9-21.
- Paluch R. 2005. Natural regeneration of oak in the „Białowieża Primeval Forest” Promotional Forest Complex – state, conditions and prospects (In Polish with English summary). Sylwan 149 (1): 30-41.
- Pautasso M, Aas G, Queloz V, Holdenrieder O (2013) European ash (Fraxinus excelsior) dieback - A conservation biology challenge. Biol Conserv 158: 37-49.
- Pötzelsberger E, Bauhus J, Muys B, Wunder S, Bozzano M, Farsakoglou A-M, Schuck A, Lindner M, Lapin K (2021) Forest biodiversity in the spotlight – what drivers change? EFI. [CrossRef]
- Sala OE, Chapin FS, Armesto JJ et al. (2000) Global biodiversity scenarios for the year 2100. Science 287(5459), 1770-4. [CrossRef]
- Salk TT, Frelich LE, Sugita S, Calcote R, Ferrari JB, Montgomery RA (2011) Poor recruitment is changing the structure and species composition of an old-growth hemlock-hardwood forest. For Ecol Manage 261: 1998-2006. [CrossRef]
- Schütz J-Ph (2006) Modelling the demographic sustainability of pure beech plenter forests in Eastern Germany. Ann For Sci 63: 93-100.
- Seastedt TR, Hobbs RJ, Suding KN (2008) Management of novel ecosystems: are novel approaches required? Front Ecol Environ 6(10): 547-553. [CrossRef]
- Sebek P, Bace R, Bartos M et al. (2015) Does minimal intervention approach threaten the biodiversity of protected areas? A multi-taxa short-term response to intervention in temperate oak-dominated forests. For Ecol Manage 358: 80-89. [CrossRef]
- Senn-Irlet B (2008) Welches sind pilzreiche Holzarten? Wald und Holz 10: 57-59.
- Sokołowski A (2004) Lasy Puszczy Białowieskiej. CILP, Warszawa, Poland.
- tanke H, Finley AO, Domke GM, Weed AS, MacFarlane DW (2021) Over half of western United States’ most abundant tree species in decline. Nat Commun 12, 451. [CrossRef]
- emperli C, Veblen TT, Hart SJ, Kulakowski D, Tepley AJ (2015) Interactions among spruce beetle disturbance, climate change and forest dynamics captured by a forest landscape model. Ecosphere 6, art231. [CrossRef]
- Walters MB, Roloff GJ, Henry CR, Hartman JP, Donovan ML, Farinosi EJ, Starking MD (2020) Rethinking Northern Hardwood Forest Management Paradigms with Silvicultural Systems Research: Research-Management Partnerships Ensure Relevance and Application. J Forest 118,3: 260-274. [CrossRef]
- Wang X, Hao Z, Zhang J, Lian J, Li B, Ye J, Yao X (2009) Tree size distributions in an old-growth temperate forest. Oikos 118: 25-36.
- Wapner P (2014) The changing nature of nature: environmental politics in the Anthropocene. Global Environ Polit 14:4. [CrossRef]
- Więcko E (1984) Puszcza Białowieska (In Polish). PWN, Warszawa, Poland.
- Wilkening JL, Magness DR, Thompson LM, Lynch AJ (2023) A brave new world: Managing for biodiversity conservation under ecosystem transformation. Land 12, 1556. [CrossRef]
- Wilson EO (2016) Half-Earth: Our Planet’s Fight for Life. Liveright Publishing Corp, New York, US.
Figure 1.
Actual (top) and model (bottom) share of the number of trees of individual species in subsequent diameter classes.
Figure 1.
Actual (top) and model (bottom) share of the number of trees of individual species in subsequent diameter classes.
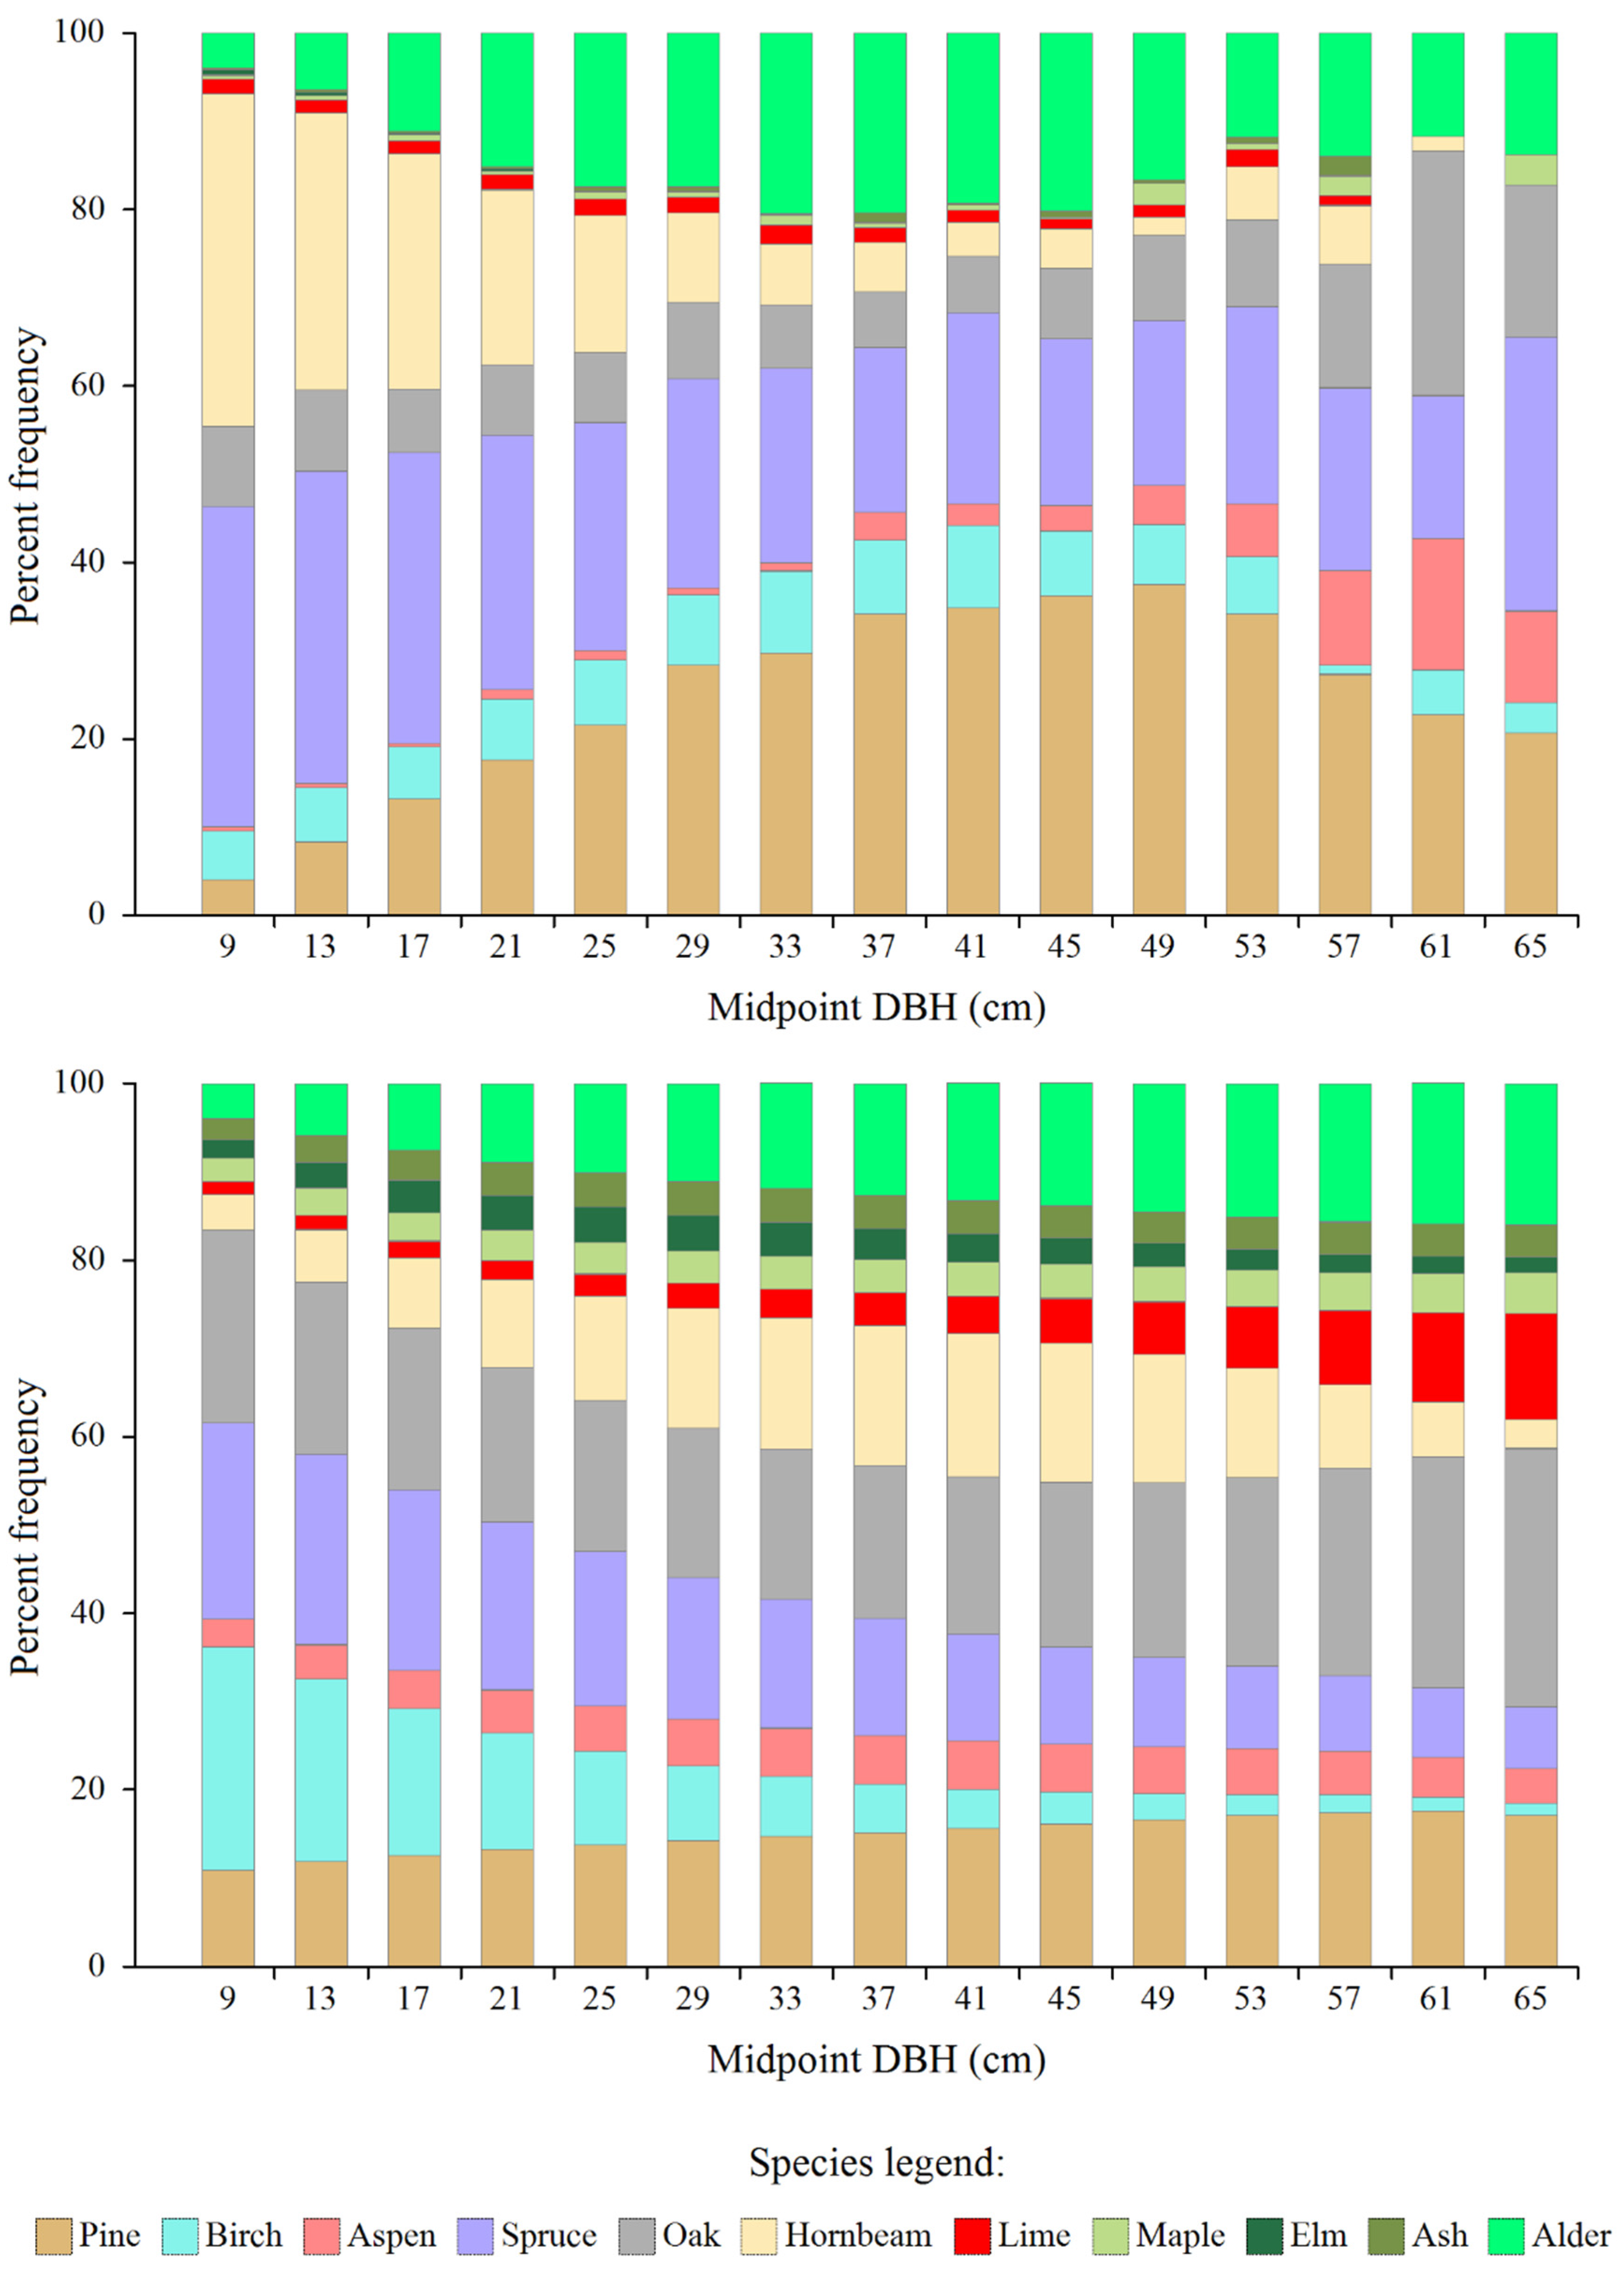
Figure 3.
The amount of the total surpluses (in relation to the equilibrium distributions) of trees of individual species, by diameter classes.
Figure 3.
The amount of the total surpluses (in relation to the equilibrium distributions) of trees of individual species, by diameter classes.
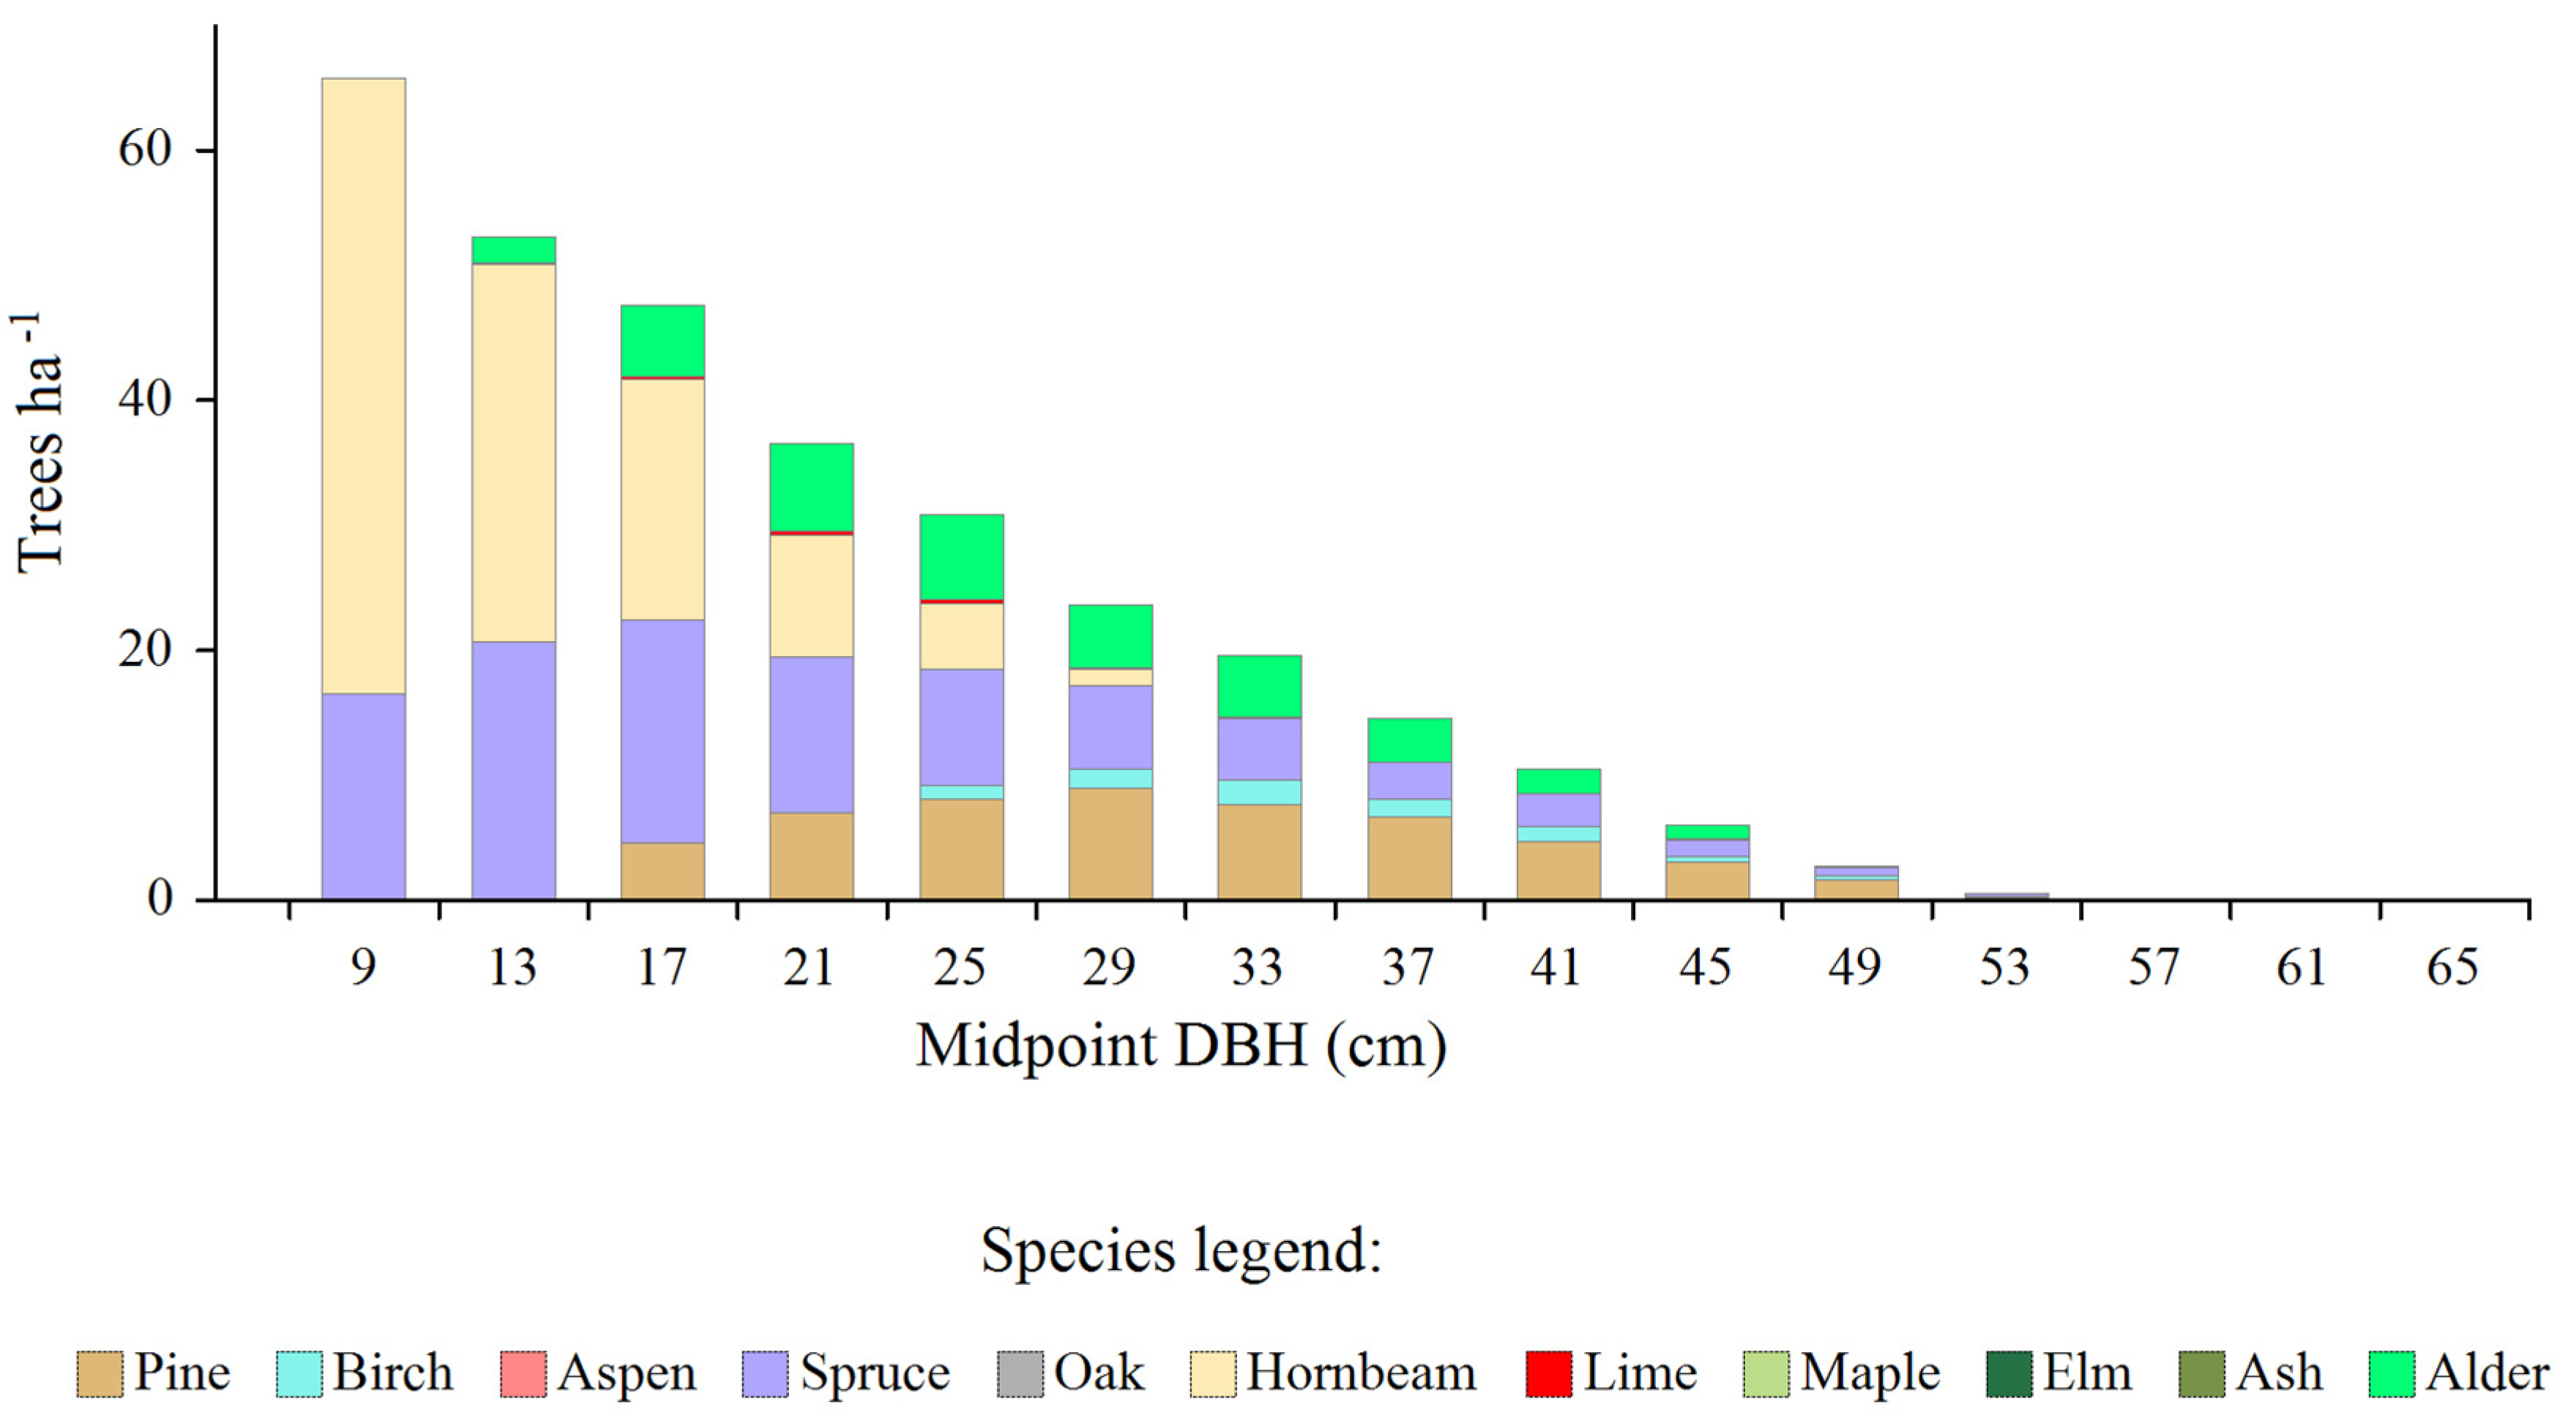
Figure 4.
Density of reduced surpluses (trees intended for removal during the next 10-year planning period as part of activities aimed at bringing actual diameter distributions closer to the sustainable model), by tree species and diameter classes.
Figure 4.
Density of reduced surpluses (trees intended for removal during the next 10-year planning period as part of activities aimed at bringing actual diameter distributions closer to the sustainable model), by tree species and diameter classes.
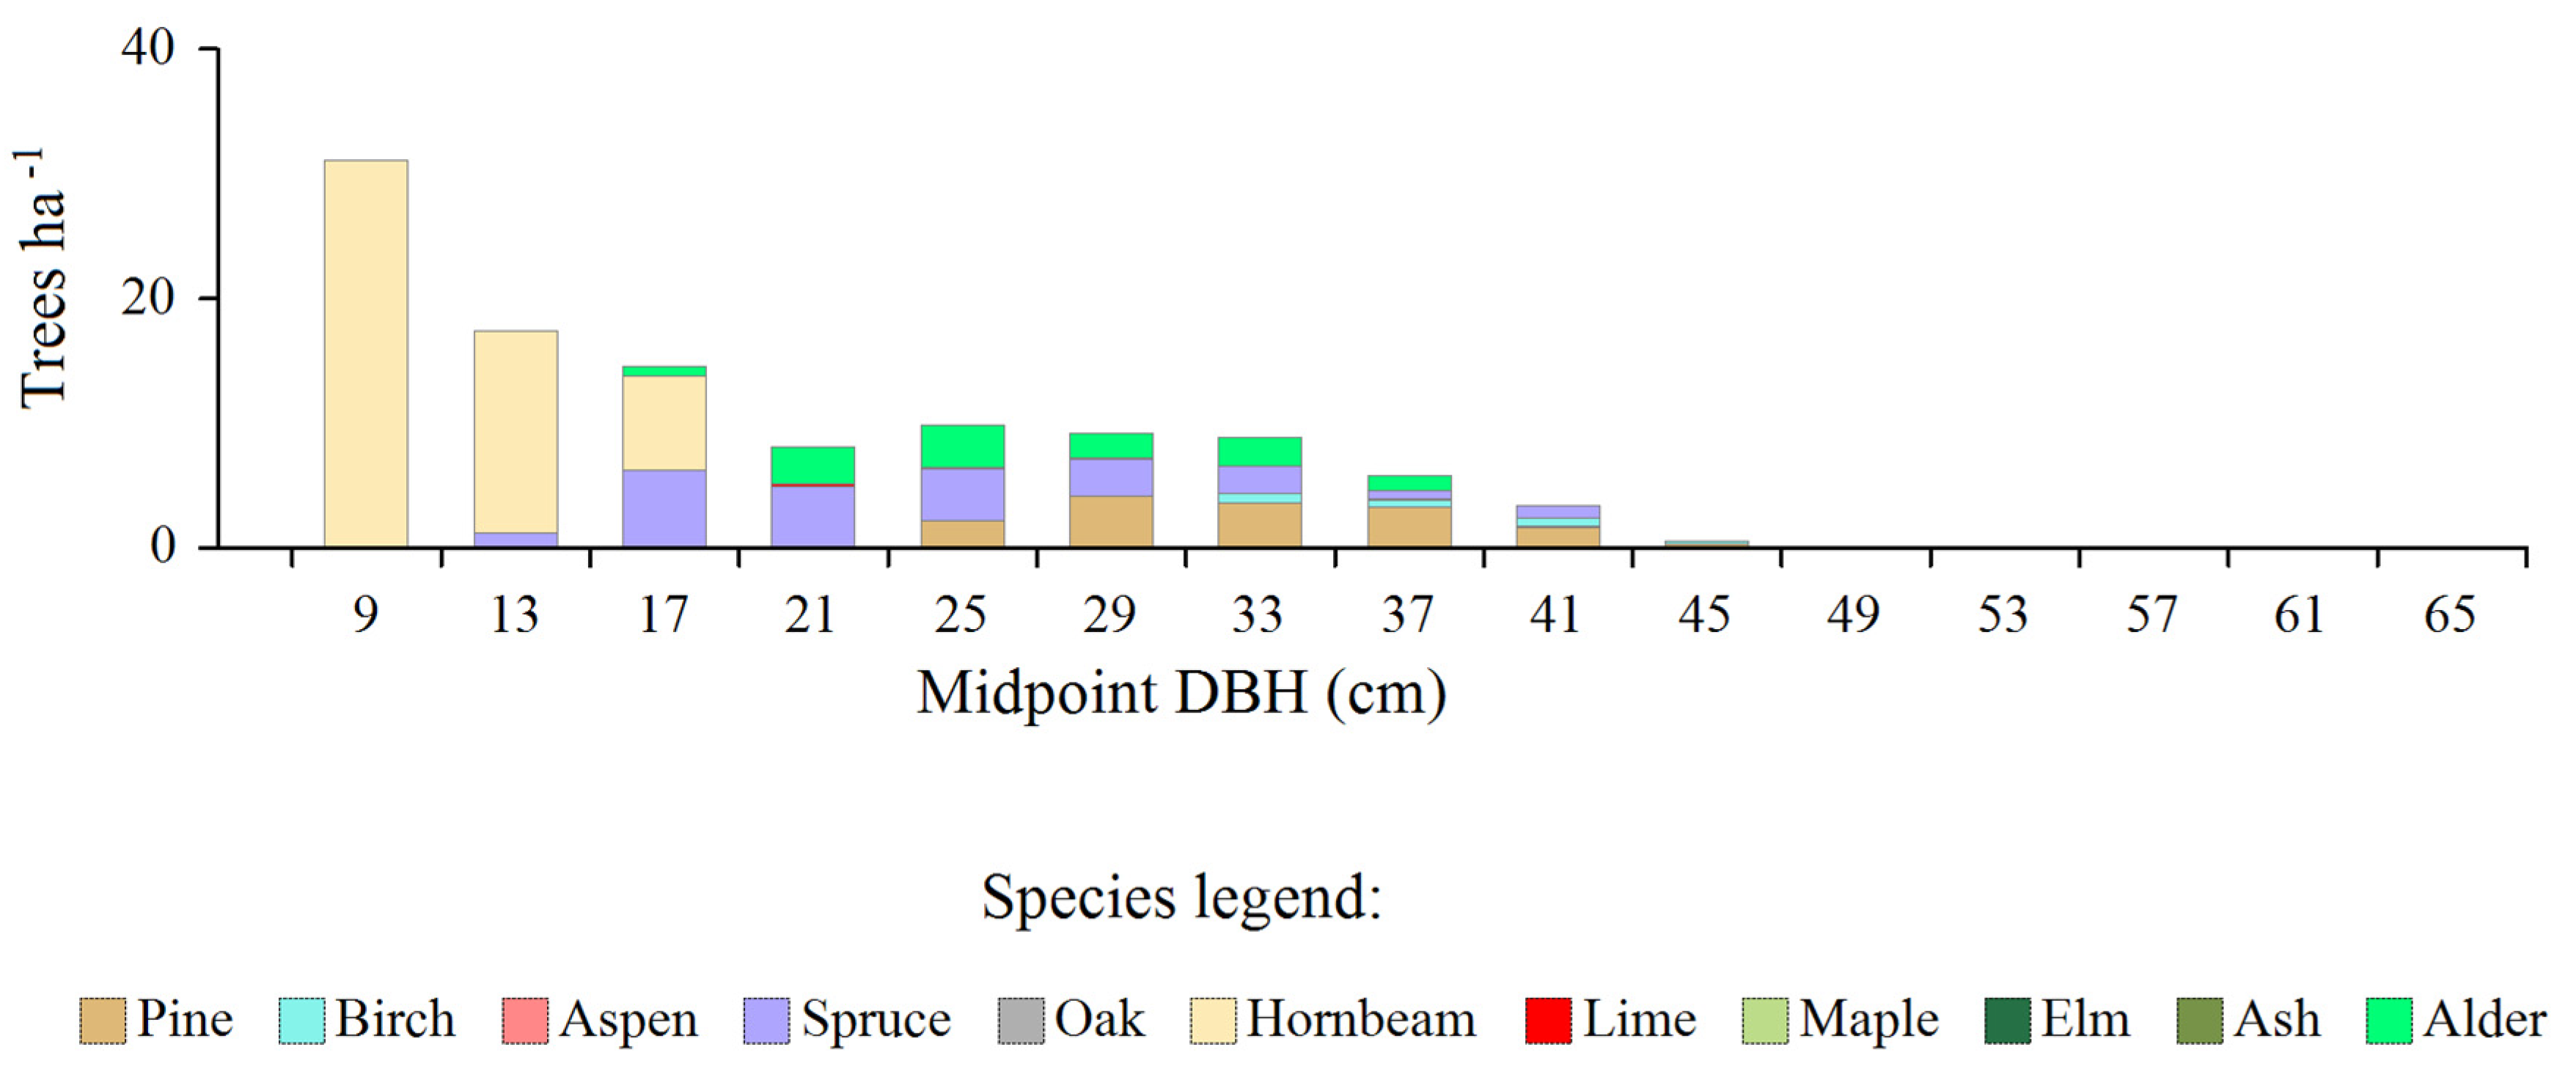
Figure 5.
The amount of tree shortages (in relation to equilibrium models) of individual species, by diameter classes.
Figure 5.
The amount of tree shortages (in relation to equilibrium models) of individual species, by diameter classes.
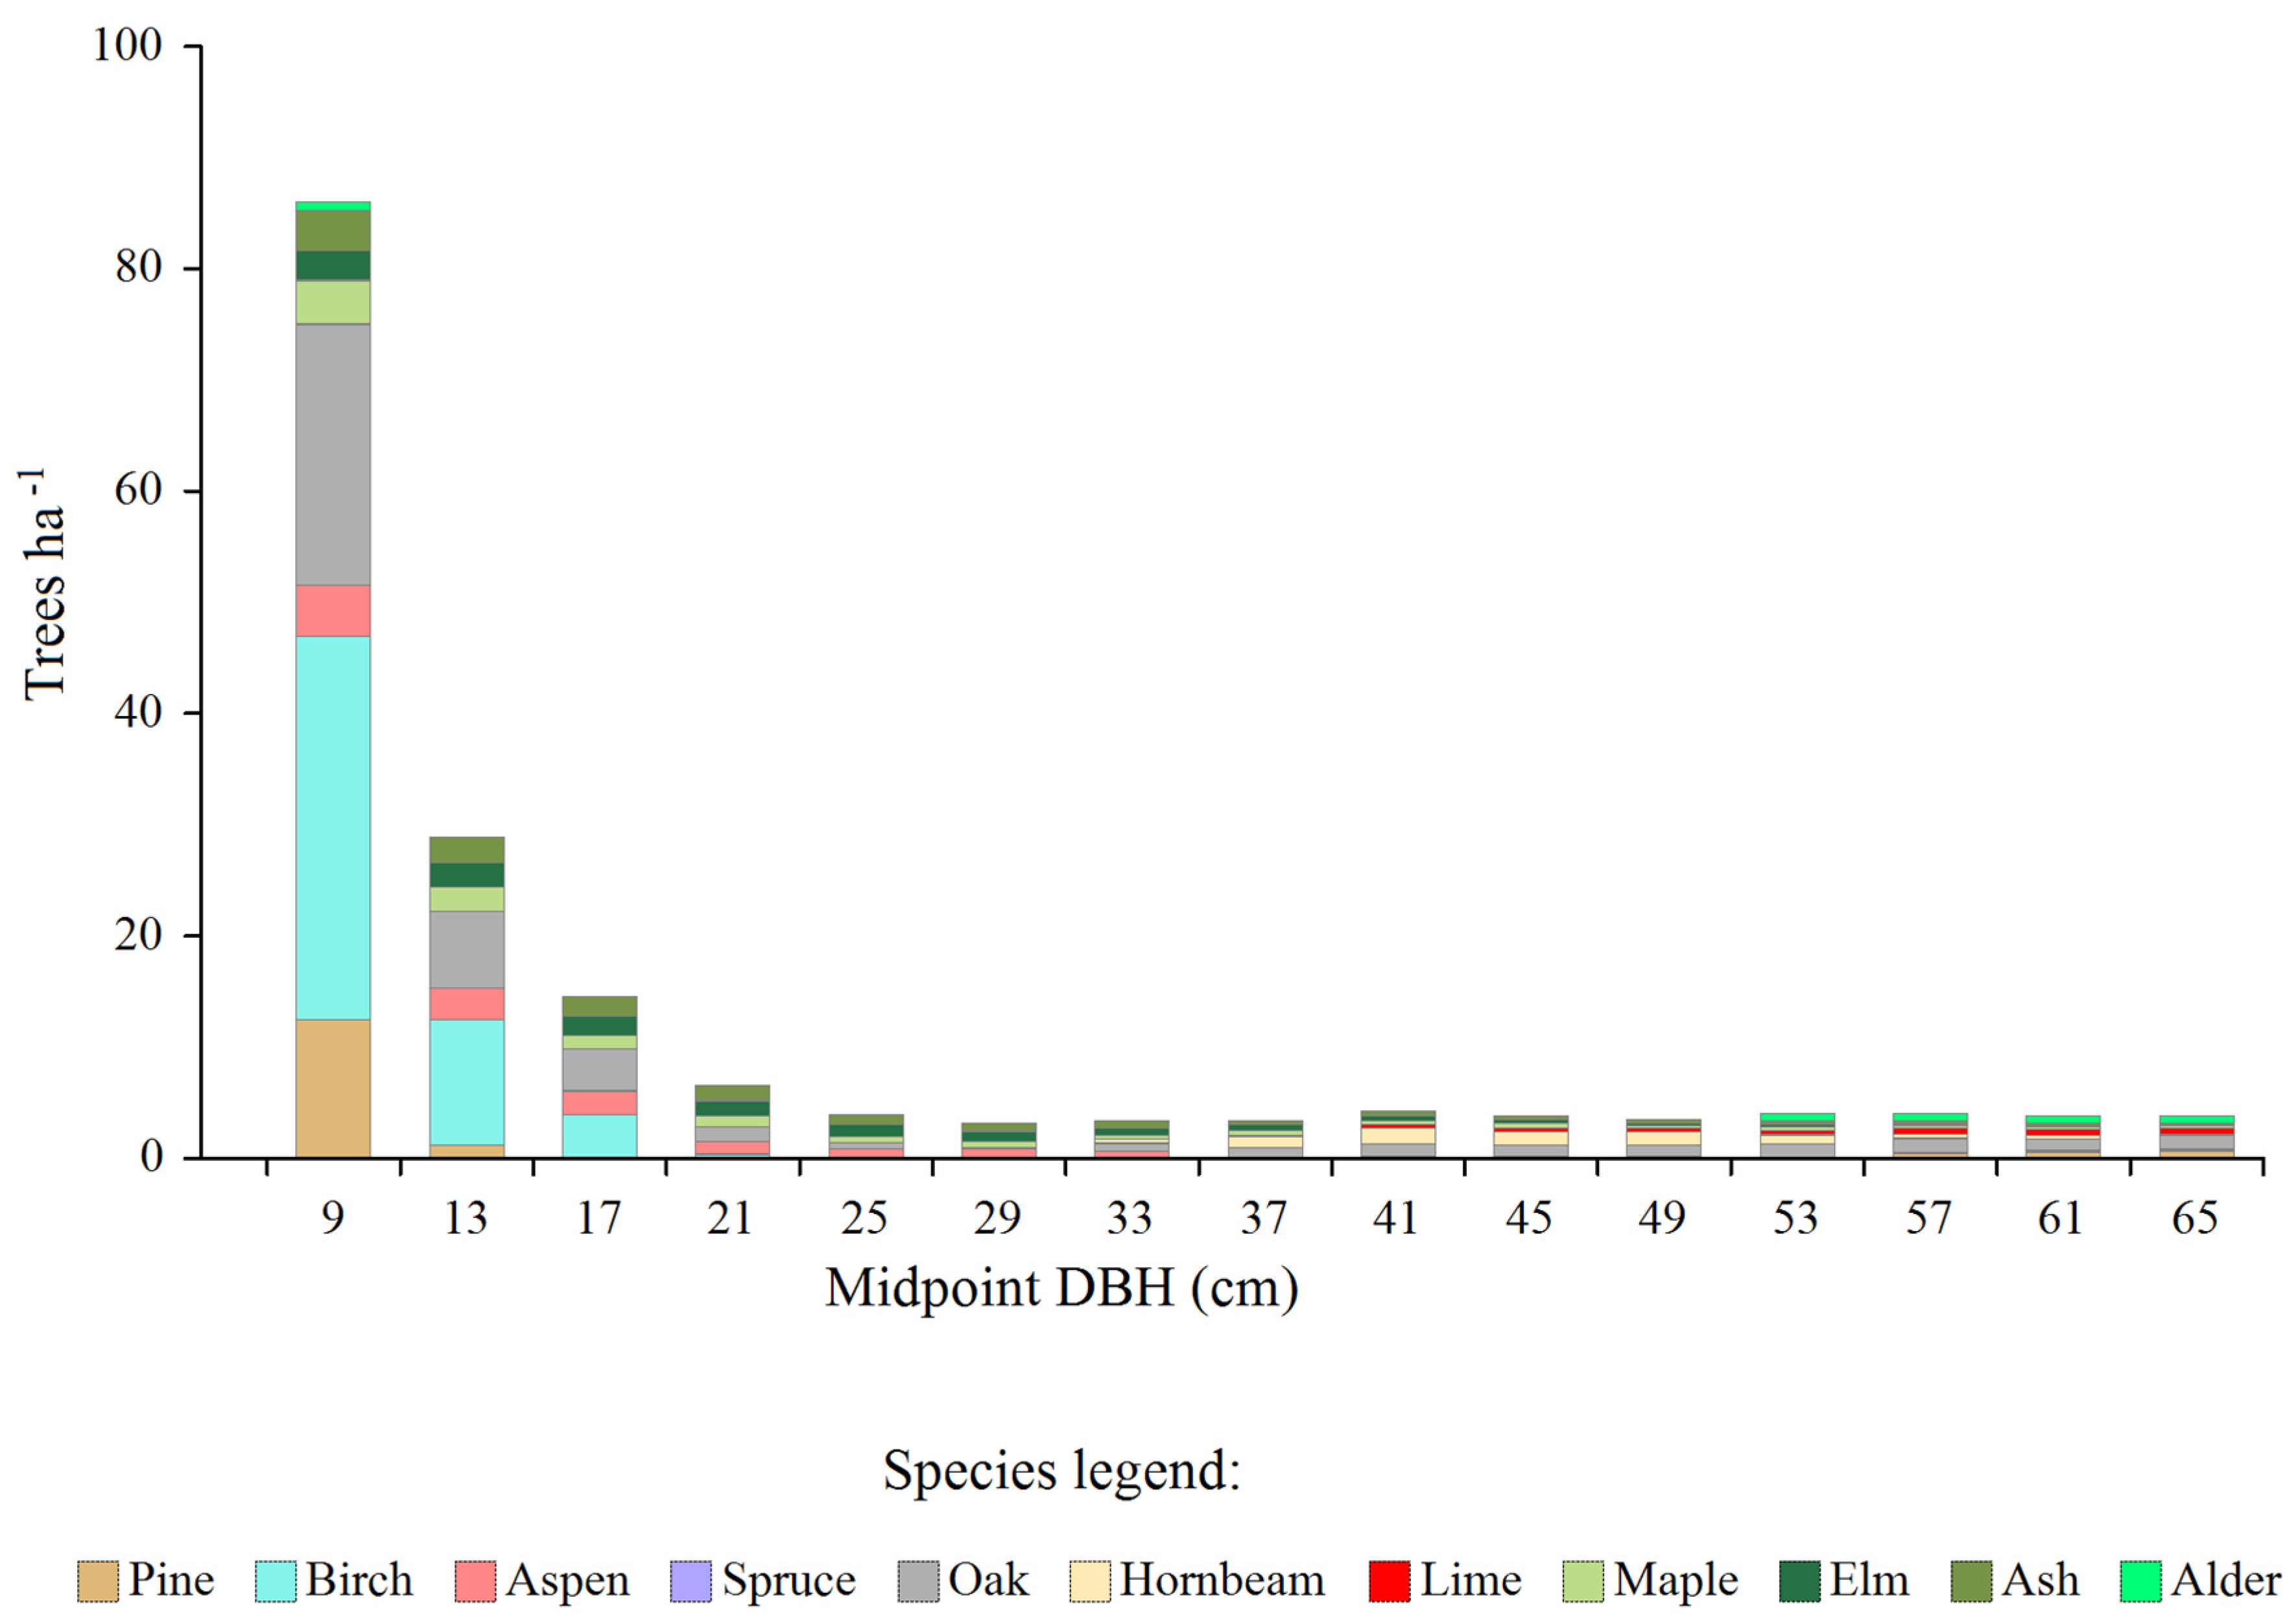
Figure 6.
Actual diameter distributions of pine and oak in the managed part of BF (MF) and in the “Strict Reserve” of BNP (SR). Data for MF and SR were determined on the basis of 855 and 116 circular sample plots (size 0.04 ha), respectively. Rare individuals with DBH ≥67 cm, excluded from potential regulatory activities for ecological reasons, are not shown.
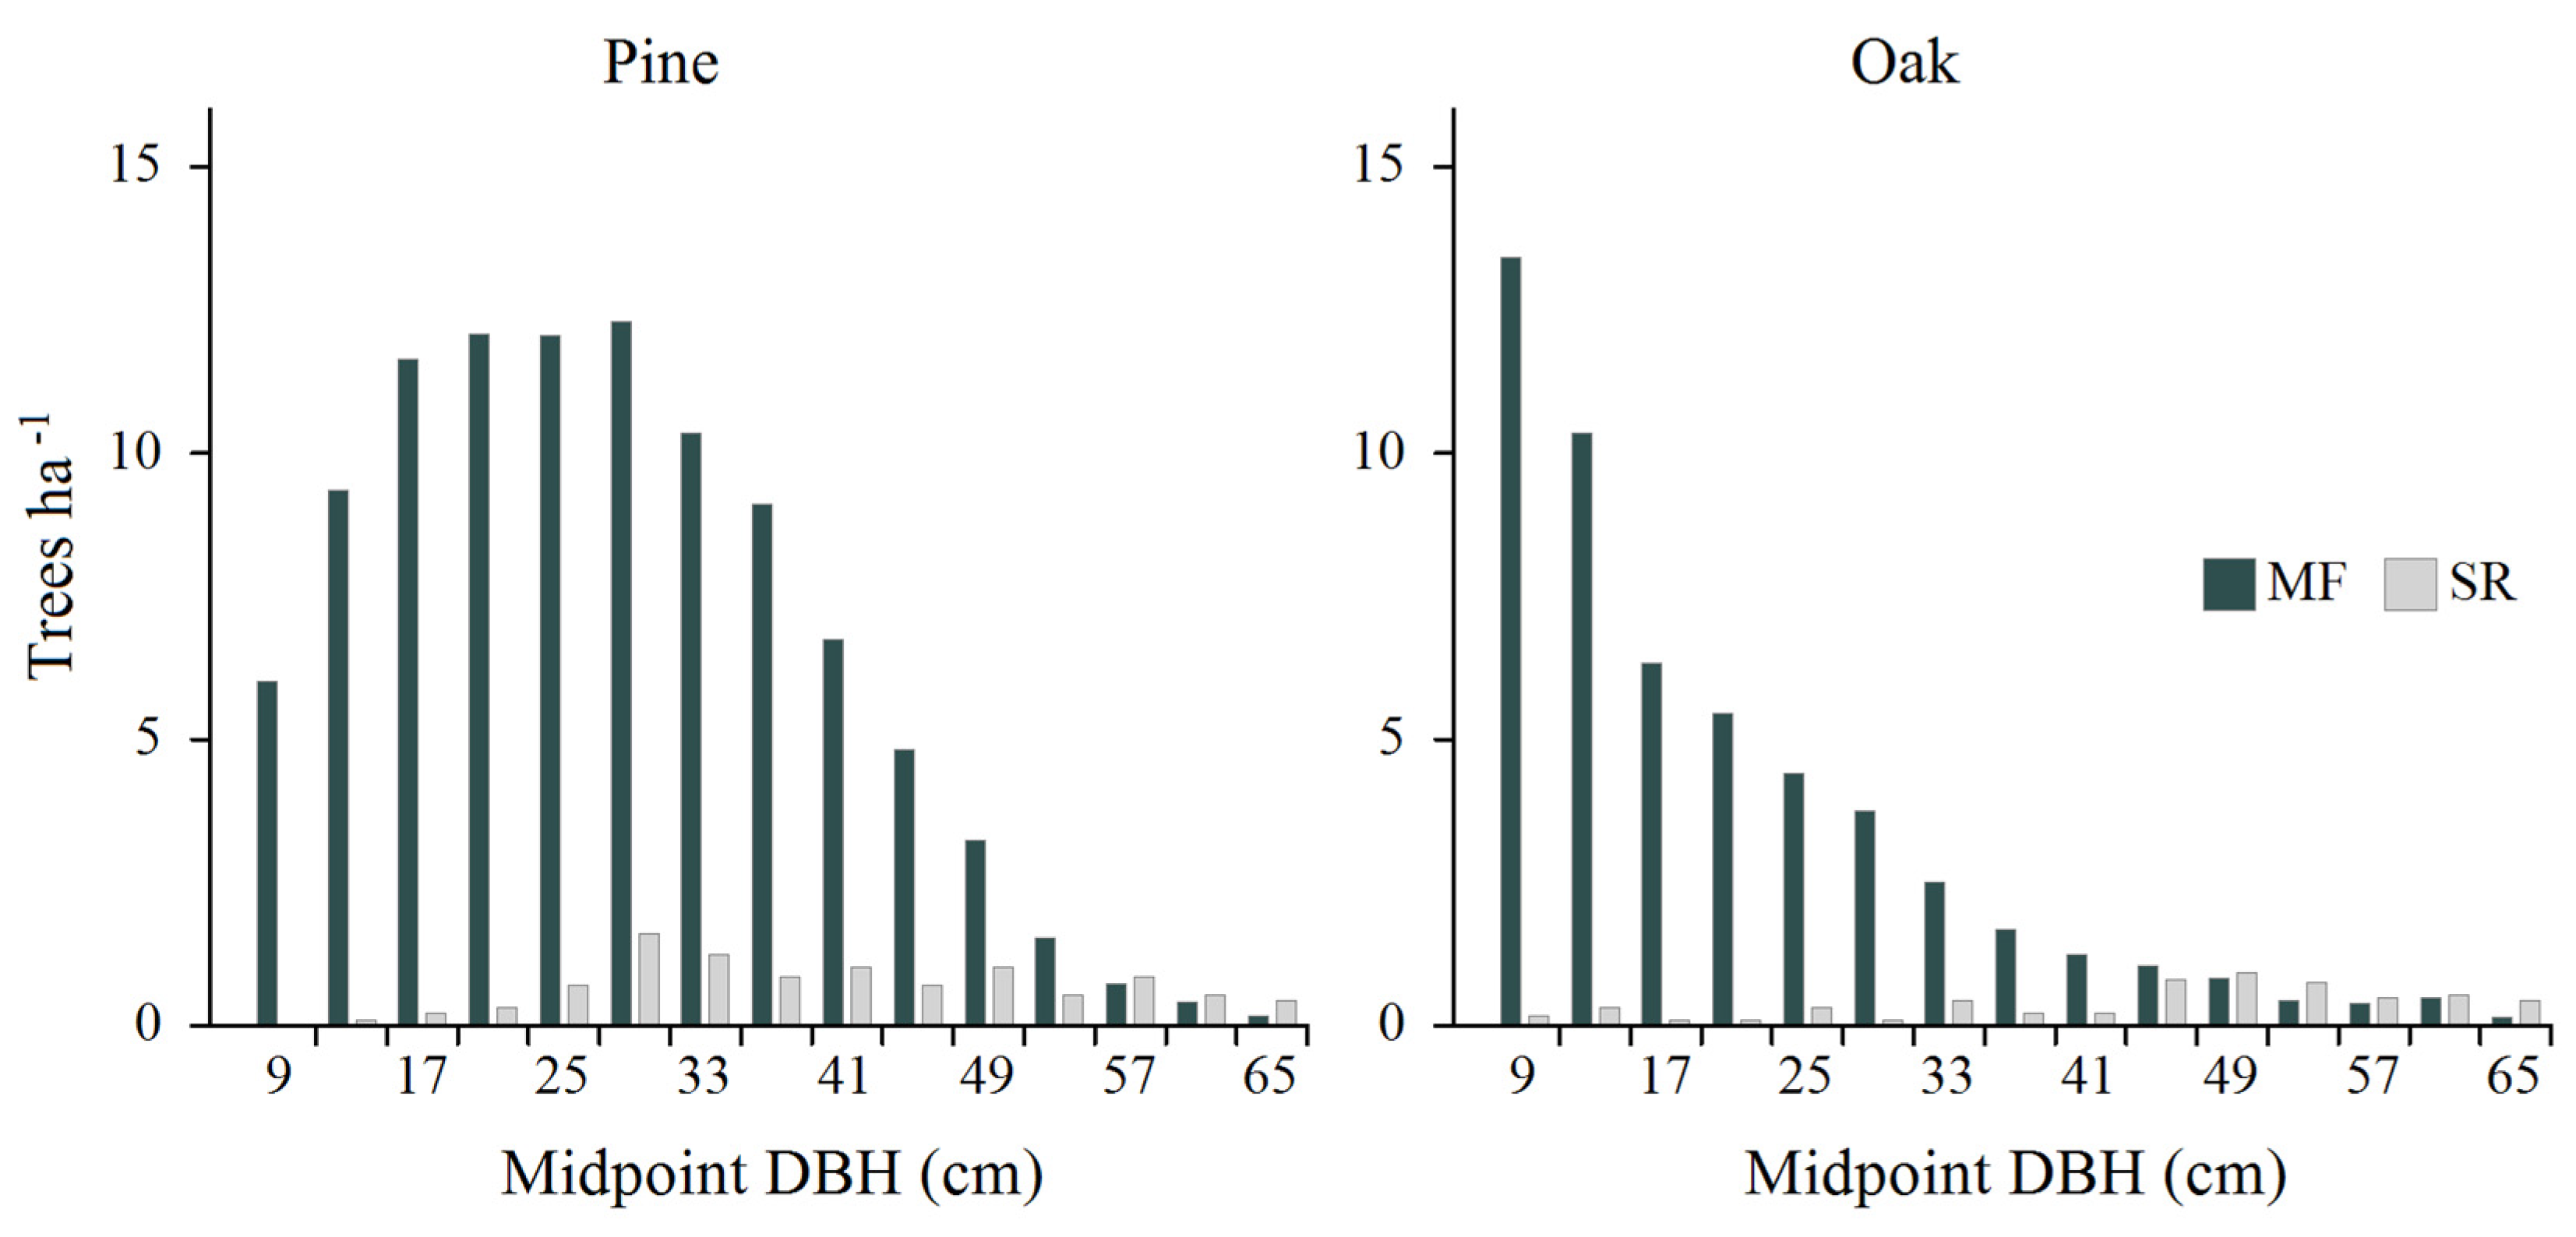

Table 1.
Actual DBH-distributions (trees ∙ ha-1) of tree species in the managed part of the BF. Ntot (trees ∙ ha-1) - overall density; Btot (m2 ∙ ha-1) - overall basal area; Blarge (m2 ∙ ha-1) – basal area of very large trees (DBH ≥67 cm); Bred (m2 ∙ ha-1) - basal area after subtracting very large trees; Bred% - the percentage share of a given species in the reduced basal area.
| DBH (cm) |
Tree speciesa | |||||||||||
| Pine | Birch | Aspen | Spruce | Oak | Hornbeam | Lime | Maple | Elm | Ash | Alder | Total | |
| 9 | 6.0 | 8.2 | 0.7 | 54.0 | 13.4 | 56.1 | 2.5 | 0.6 | 0.9 | 0.4 | 5.8 | 148.7 |
| 13 | 9.4 | 6.9 | 0.6 | 39.8 | 10.4 | 35.4 | 1.6 | 0.5 | 0.5 | 0.3 | 7.2 | 112.5 |
| 17 | 11.7 | 5.2 | 0.4 | 29.1 | 6.3 | 23.7 | 1.3 | 0.6 | 0.2 | 0.2 | 9.8 | 88.3 |
| 21 | 12.1 | 4.8 | 0.7 | 19.8 | 5.5 | 13.6 | 1.2 | 0.3 | 0.2 | 0.1 | 10.4 | 68.7 |
| 25 | 12.1 | 4.2 | 0.6 | 14.4 | 4.4 | 8.7 | 1.0 | 0.5 | 0.0 | 0.3 | 9.7 | 55.9 |
| 29 | 12.3 | 3.5 | 0.4 | 10.3 | 3.7 | 4.4 | 0.8 | 0.3 | 0.0 | 0.2 | 7.6 | 43.4 |
| 33 | 10.4 | 3.2 | 0.3 | 7.7 | 2.5 | 2.4 | 0.7 | 0.4 | 0.0 | 0.0 | 7.1 | 34.8 |
| 37 | 9.1 | 2.2 | 0.9 | 5.0 | 1.7 | 1.5 | 0.5 | 0.1 | 0.0 | 0.3 | 5.5 | 26.7 |
| 41 | 6.8 | 1.8 | 0.5 | 4.2 | 1.2 | 0.7 | 0.3 | 0.1 | 0.0 | 0.0 | 3.7 | 19.4 |
| 45 | 4.8 | 1.0 | 0.4 | 2.5 | 1.1 | 0.6 | 0.2 | 0.0 | 0.0 | 0.1 | 2.7 | 13.3 |
| 49 | 3.2 | 0.6 | 0.4 | 1.6 | 0.8 | 0.2 | 0.1 | 0.2 | 0.0 | 0.0 | 1.4 | 8.6 |
| 53 | 1.5 | 0.3 | 0.3 | 1.0 | 0.4 | 0.3 | 0.1 | 0.0 | 0.0 | 0.0 | 0.5 | 4.5 |
| 57 | 0.7 | 0.0 | 0.3 | 0.6 | 0.4 | 0.2 | 0.0 | 0.1 | 0.0 | 0.1 | 0.4 | 2.7 |
| 61 | 0.4 | 0.1 | 0.3 | 0.3 | 0.5 | 0.0 | 0.0 | 0.0 | 0.0 | 0.0 | 0.2 | 1.8 |
| 65 | 0.2 | 0.0 | 0.1 | 0.3 | 0.2 | 0.0 | 0.0 | 0.0 | 0.0 | 0.0 | 0.1 | 0.9 |
| 69 | 0.1 | 0.0 | 0.1 | 0.1 | 0.4 | 0.0 | 0.0 | 0.1 | 0.0 | 0.0 | 0.1 | 0.9 |
| 73 | 0.1 | 0.0 | 0.0 | 0.1 | 0.1 | 0.0 | 0.0 | 0.0 | 0.0 | 0.0 | 0.0 | 0.4 |
| 77 | 0.1 | 0.0 | 0.0 | 0.1 | 0.7 | 0.0 | 0.0 | 0.0 | 0.0 | 0.0 | 0.0 | 1.0 |
| Ntot | 100.9 | 42.0 | 6.7 | 190.9 | 53.7 | 147.9 | 10.3 | 3.8 | 1.8 | 2.1 | 72.3 | 632.5 |
| Btot | 7.21 | 2.00 | 0.68 | 6.72 | 2.83 | 3.27 | 0.45 | 0.25 | 0.03 | 0.16 | 4.44 | 28.04 |
| Blarge | 0.13 | 0.01 | 0.02 | 0.13 | 0.54 | 0.01 | 0.01 | 0.03 | 0.00 | 0.04 | 0.05 | 0.97 |
| Bred | 7.09 | 1.99 | 0.65 | 6.60 | 2.29 | 3.26 | 0.43 | 0.21 | 0.03 | 0.12 | 4.39 | 27.08 |
| Bred% | 26.2 | 7.4 | 2.4 | 24.4 | 8.5 | 12.1 | 1.6 | 0.8 | 0.1 | 0.5 | 16.2 | 100.0 |
a The sequence of species corresponds to their relative position along a major environmental gradient from most oligotrophic to most eutrophic and wet sites (Brzeziecki et al. 2021).
Table 2.
A model (target) value of the basal area (Bmod, m2 ∙ ha-1), total and for individual tree species. A part of the overall basal area assigned to each species reflects its supposed role in BF (Rmod, %), which in turn depends on the model tree species composition of the local woodland community types and their spatial extent.
| Parameter | Tree species | |||||||||||
| Pine | Birch | Aspen | Spruce | Oak | Hornbeam | Lime | Maple | Elm | Ash | Alder | Total | |
| Rmod (%) |
15.2 | 7.4 | 4.9 | 13.4 | 20.2 | 11.2 | 5.1 | 3.8 | 3.0 | 3.6 | 12.2 | 100.0 |
| Bmod (m2 ∙ ha-1) |
3.50 | 1.70 | 1.13 | 3.08 | 4.65 | 2.58 | 1.17 | 0.87 | 0.69 | 0.83 | 2.81 | 23.01 |
Table 3.
Model (target) number of trees (Nmod, trees ∙ ha-1) of individual species in subsequent classes of theoretical (equilibrium) DBH-distributions.
Table 3.
Model (target) number of trees (Nmod, trees ∙ ha-1) of individual species in subsequent classes of theoretical (equilibrium) DBH-distributions.
| DBH (cm) |
Tree species | |||||||||||
| Pine | Birch | Aspen | Spruce | Oak | Hornbeam | Lime | Maple | Elm | Ash | Alder | Total | |
| 9 | 18.5 | 42.7 | 5.3 | 37.5 | 36.8 | 6.8 | 2.6 | 4.4 | 3.6 | 3.9 | 6.6 | 168.9 |
| 13 | 10.5 | 18.3 | 3.4 | 19.1 | 17.3 | 5.2 | 1.5 | 2.7 | 2.6 | 2.7 | 5.1 | 88.4 |
| 17 | 7.0 | 9.2 | 2.4 | 11.3 | 10.1 | 4.4 | 1.1 | 1.8 | 2.0 | 1.9 | 4.1 | 55.3 |
| 21 | 5.1 | 5.1 | 1.9 | 7.3 | 6.8 | 3.8 | 0.8 | 1.3 | 1.5 | 1.4 | 3.4 | 38.6 |
| 25 | 4.0 | 3.1 | 1.5 | 5.1 | 5.0 | 3.4 | 0.7 | 1.0 | 1.2 | 1.1 | 2.9 | 29.0 |
| 29 | 3.3 | 1.9 | 1.2 | 3.7 | 3.9 | 3.1 | 0.6 | 0.8 | 0.9 | 0.9 | 2.5 | 22.9 |
| 33 | 2.7 | 1.3 | 1.0 | 2.7 | 3.2 | 2.8 | 0.6 | 0.7 | 0.7 | 0.7 | 2.2 | 18.6 |
| 37 | 2.4 | 0.9 | 0.9 | 2.1 | 2.7 | 2.5 | 0.6 | 0.6 | 0.6 | 0.6 | 2.0 | 15.5 |
| 41 | 2.0 | 0.6 | 0.7 | 1.6 | 2.3 | 2.1 | 0.6 | 0.5 | 0.4 | 0.5 | 1.7 | 13.1 |
| 45 | 1.8 | 0.4 | 0.6 | 1.2 | 2.1 | 1.8 | 0.6 | 0.4 | 0.3 | 0.4 | 1.5 | 11.1 |
| 49 | 1.6 | 0.3 | 0.5 | 1.0 | 1.9 | 1.4 | 0.6 | 0.4 | 0.3 | 0.3 | 1.4 | 9.5 |
| 53 | 1.4 | 0.2 | 0.4 | 0.7 | 1.7 | 1.0 | 0.6 | 0.3 | 0.2 | 0.3 | 1.2 | 8.0 |
| 57 | 1.2 | 0.1 | 0.3 | 0.6 | 1.6 | 0.6 | 0.6 | 0.3 | 0.1 | 0.2 | 1.0 | 6.7 |
| 61 | 1.0 | 0.1 | 0.3 | 0.4 | 1.5 | 0.3 | 0.6 | 0.3 | 0.1 | 0.2 | 0.9 | 5.6 |
| 65 | 0.8 | 0.1 | 0.2 | 0.3 | 1.4 | 0.2 | 0.6 | 0.2 | 0.1 | 0.2 | 0.8 | 4.7 |
| Nmod | 63.2 | 84.2 | 20.5 | 94.6 | 98.1 | 39.5 | 12.5 | 15.8 | 14.6 | 15.4 | 37.5 | 496.0 |
Table 4.
The average amount of deficits in the 9 cm class and the approximate average size of regeneration units, total and by species.
Table 4.
The average amount of deficits in the 9 cm class and the approximate average size of regeneration units, total and by species.
| Tree species | Area of growing space for a tree with DBH = 9 cm (GS, in m2)* | Average number of deficit trees in the smallest diameter class (midpoint = 9 cm) (DEF, in trees ∙ ha-1) |
Estimated area of regeneration spots (RS, in ha) |
| Pine | 8.13 | 12.50 | 1.02 |
| Birch | 12.55 | 34.46 | 4.32 |
| Aspen | 12.55 | 4.61 | 0.58 |
| Spruce | 10.82 | 0.00 | 0.00 |
| Oak | 6.14 | 23.43 | 1.44 |
| Hornbeam | 25.24 | 0.00 | 0.00 |
| Lime | 15.98 | 0.11 | 0.02 |
| Maple | 13.29 | 3.85 | 0.51 |
| Elm | 23.10 | 2.66 | 0.62 |
| Ash | 10.75 | 3.59 | 0.39 |
| Alder | 10.14 | 0.80 | 0.08 |
| Total | 86.00 | 8.97 |
* accord. to Bolibok and Brzeziecki (2000).
Disclaimer/Publisher’s Note: The statements, opinions and data contained in all publications are solely those of the individual author(s) and contributor(s) and not of MDPI and/or the editor(s). MDPI and/or the editor(s) disclaim responsibility for any injury to people or property resulting from any ideas, methods, instructions or products referred to in the content. |
© 2025 by the authors. Licensee MDPI, Basel, Switzerland. This article is an open access article distributed under the terms and conditions of the Creative Commons Attribution (CC BY) license (http://creativecommons.org/licenses/by/4.0/).
Copyright: This open access article is published under a Creative Commons CC BY 4.0 license, which permit the free download, distribution, and reuse, provided that the author and preprint are cited in any reuse.


