
Submitted:
30 October 2024
Posted:
31 October 2024
You are already at the latest version
Abstract
Electromagnetic coil is the key component of rotating equipment, and its reliability is very important for the normal operation of the equipment. In order to accurately evaluate the health status of electromagnetic coil, a health evaluation and anomaly detection method based on Mahalanobis distance (MD) and Box-Cox transformations is proposed. With the help of accelerated fatigue experiment, the whole life electrical data of high, medium and low frequency spectrum of electromagnetic coil is collected, and the low and medium frequency spectrum data are constructed as the initial feature set. And then, the initial feature set is mahalanized, and Mahalanobis distance is taken as the feature to evaluate the health state of the electromagnetic coil. With the help of Box-Cox transformations, MD is transformed into normal distribution form, and the electromagnetic coil fault early warning is realized according to 3 σ criterion. The results show that MD can accurately evaluate the degradation state of the electromagnetic coil and realize early warning.
Keywords:
Degradation
; Inter-turn short
; Mahalanobis distance
; Failure threshold
; Cox-Box
1. Introduction
In the intelligent manufacturing system, online condition monitoring and fault diagnosis, residual life prediction will become the new features of the production system. These new features help to evaluate the health status, remaining available time, product quality deviation and other useful information of the equipment. Electromagnetic coil is the core component of electrical equipment, its degradation and failure will lead to unexpected shutdown of production equipment, product quality decline and other problems, and its health status is of great significance for the safe operation of the equipment.
For a long time, many scholars at home and abroad have carried out a lot of research on the equipment with electromagnetic coil as the core component. Oak Ridge National Laboratory [1] collected the failure data of solenoid valves used in the safety protection system of commercial nuclear power plants in the United States for a period of 10 years, and the results show that more than 50% of the solenoid valve failures are related to the insulation failure of the solenoid coil; the data of CIGRE show that 56% of the generator failures are related to the insulation failure of the winding [2] . In recent years, with the application of low-voltage motor (less than 1KV) in aviation field, especially the rapid development of multi electric/all electric aircraft, the reliability and insulation life prediction of low-voltage electromagnetic coil are paid more and more attention [3] .
The fault phenomenon of electromagnetic coil is mostly caused by its insulation failure, and the failure usually develops from inter-turn short circuit fault [4,5,6]. Take the motor as an example, the failure of insulation between phases and main insulation of motor leads to short circuit fault, which will cause serious shutdown events in a very short time [7]. Therefore, before the occurrence of short circuit fault, on-line monitoring of coil inter-turn insulation degradation state is the key to avoid unexpected fault, and the key point is to find the characteristics that can characterize the degradation state. In the existing research, resonance frequency, parasitic capacitance and high frequency impedance are used as characteristic indexes to evaluate the degradation degree of electromagnetic coils. However, the above characteristic parameters are directly obtained or indirectly calculated in high frequency state. Because the acquisition of high-frequency data in the industrial field is seriously affected by external factors, there are large errors and uncertainties in the characterization of degradation state by single data feature. Therefore, the low and medium frequency data and multi-dimensional characteristic data are used to evaluate health status, which become an effective research method.
At present, many scholars at home and abroad study the degradation feature recognition method of electromagnetic coil, and the main single high-frequency electrical parameters is used as the evaluation characteristic. Because of its good adaptability and sensitivity, the The Mahalanobis distance (MD) recognition method based on multidimensional space feature samples that considers correlations among parameters has been applied in many fields. Mosavi et al. [8] proposed a method to identify the damage location of steel girder bridge based on MD. Zhou et al. [9] used MD to judge the damage degree of structure, and they proved the damage identification ability of this method. Therefore, this paper proposes an electromagnetic coil degradation characteristic evaluation method based on MD, which uses the data of electrical parameter samples to construct MD as degradation characteristic index to realize the evaluation characteristic of electromagnetic coil health state.
In this paper, based on the constant high temperature accelerated fatigue experiment, the electrical data from 50Hz to 1.0 MHz are collected. In this paper, MD is used to reduce the dimension of multi-dimensional feature parameters, and MD is used as the feature to evaluate the health state of electromagnetic coil, which solves the shortcomings of poor anti-interference ability of high frequency electrical data and inaccurate evaluation of single feature; this probabilistic approach is provided to define degradation and fault threshold MD values to improve upon the traditional approaches where threshold MD values are decided by experts, since MD values do not follow any distribution and have positive values, a Box-Cox transformation was applied to the MD values to obtain a normally distributed transformed variable. The criterion is used to evaluate the electromagnetic coil short circuit fault to realize the early warning, and 1σ criterion is used to evaluate degradation and health status. The health of electromagnetic coil is classified by comparing its MD value, which is computed for each observation, with a threshold MD value. Finally, the high temperature accelerated fatigue test is used to verify the effectiveness of the proposed method.
2. The Framework of Determining Degradation Characteristics and Failure Mechanism of Coil Insulation Degradation Performance
2.1. General Idea of Determining Degradation Characteristics
In this paper, the accelerated fatigue test is carried out to collect the electrical parameters from 50Hz to 1.0 MHz of the life cycle of electromagnetic coil, and then the electrical parameters which can evaluate the health state of the electromagnetic coil are studied.
The overall research framework of this paper is shown in Figure 1. Taking the electromagnetic coil as the research object, the main causes of electromagnetic coil degradation are analyzed, and the failure mechanism based on creep degradation is deeply studied. Combined with the equivalent circuit model of the electromagnetic coil, the qualitative analysis of the changes of electrical properties in the degradation process is carried out, and the high-frequency electrical data are collected on the basis of constant high temperature accelerated fatigue experiment By using Spearman correlation coefficient to evaluate the correlation of high-frequency data, multiple vectors are selected as the characteristic parameters to characterize the degradation state of electromagnetic coils; in order to avoid the shortcomings of single data with insufficient anti-interference ability and reduce the complexity of data processing, MD is used as the characteristic to evaluate the degradation state of electromagnetic coils; in order to realize the fault early warning of electromagnetic coils, Box-Cox is used to realize the normal transformation of MD and the early warning of electromagnetic coil fault detection.
2.2. Failure Mechanism of Electromagnetic Coil
Electromagnetic coil is the core component of transformer, solenoid valve, motor and other energy conversion equipment, which is composed of insulating material and copper conductor, in which the insulating material is polymer material. According to [9], insulation degradation is primarily attributed to excessive thermal stresses. According to the theory of polymer creep, the deformation of insulating material will increase gradually under the action of thermal stress and constant external force (tension, pressure or torsion), that is, the compression stress and high temperature create favorable conditions for the creep of insulation materials. During the creep process, the thickness of the insulation material continues to become thin, and the creep deformation continues to increase, finally, the insulation material breaks, which leads to the short circuit fault, as shown in Figure. 2
The thickness and creep deformation of insulating materials are defined as follows, as shown in Figure 3:
Where is the outer diameter of the cross section of the electromagnetic conductor (including the thickness of the insulating material), and is the inner diameter of the cross section of the electromagnetic conductor (excluding the thickness of the insulating material).
Where represents the thickness of insulating material in the initial (healthy) state, and represents the thickness of the insulation material in a degraded state.
In the low frequency range, the electromagnetic coil can be equivalent to the series connection of inductance and resistance [10]. With the increase of frequency, the parasitic capacitance effect is significant. According to the transmission line theory, the coil can be equivalent to the series connection of inductance L and resistance R, and then connected with parasitic capacitance in parallel, as shown in Figure 4.
According to the equivalent circuit model (ECM), the calculation formula of coil impedance is shown in (3)
Where:
is the impedance of the electromagnetic coil
is angular frequency
is the inductance of the electromagnetic coil
is direct current resistance (DCR) of the electromagnetic coil
is parasitic capacitance of the electromagnetic coil
According to reference [10], the thickness of insulation material in degradation process will cause the parasitic capacitance , as shown in equation (4).
Where:
where D0 is the outer diameter of the magnet wire including the insulation; Dc is the inner diameter of the magnet wire without the insulation; lt is the turn length; is the relative permittivity of the insulation material; and is the vacuum permittivity, k is a constant that is dependent on the number of layers of the coil. Thus, according to Eqs. (3)-(5), the change of D0/Dc makes the coil parasitic capacitance change, further, according to the ECM model and Eq. (3), the impedance and reactance will consequently change. Therefore, considering that the electrical data will change as the insulation degrades, it can be determined as a characteristic parameter for degradation monitoring of the coil insulation.
3. Research on Health Assessment and Abnormal Detection Method of Electromagnetic Coil Based on MD
3.1. Spearman Rank Correlation Coefficient
A large number of electrical data obtained from accelerated fatigue test need to be identified as the characteristic data to characterize the degradation state of electromagnetic coils. Due to the time series characteristics of degradation feature data, Spearman rank correlation coefficient is suitable for acquiring degradation sensitive features. The Spearman rank correlation coefficient is a measured value of the monotonic relationship between two variables and can be employed to discover characteristic parameter useful for diagnostic and prognostic. For a data set of size and where each point is distinct and nonrepeated, the Spearman rank correlation coefficient is calculated as:
In this formula, the raw samples, , are converted into ranks ( is degradation time vector, and is electrical parameter vector at a certain frequency), and is the distance between the ranks. When , the collected electrical parameter vector is a good monotone function of the degradation time vector. In this paper, Spearman rank correlation coefficient is used to evaluate the monotonicity of the collected electrical data and degradation time of the electromagnetic coil in order to construct the feature set for MD transformation
3.2. Mahalanobis Distance (MD)
MD is a unified multivariate distance measure that is calculated using the normalized value of the performance parameters and their correlation coefficients [11,12,13]. MD is a distance measurement method proposed by Indian statistician P.C. Mahalanobis [14]. The collection of MD values is known as the Mahalanobis space (MS). This method measures the similarity by calculating the covariance distance between two samples [15]. Like Euclidean distance, Chebyshev distance, MD can also transform the multivariate variable problem into a single variable problem, and compared with the other distance measurement methods, MD is sensitive to the change of multivariate variables, and is not affected by dimensions [16,17,18,19]. MD can effectively describe the correlation between data distribution characteristics and variables, so it can better reflect the relationship between the state characteristics [20,21,22,23].
A data set formed by measuring the characteristic parameters of a healthy equipment is used as training data. The characteristic parameters collected from the equipment are denoted as , where . Here, is the total number of characteristic parameters. The observation of the th parameter, on the th instance, is denoted by , where , and ; is the total number of times an observation is made for all parameters. Thus, the (n) data vector for the normal group is denoted by , where . Each individual parameter is normalized using the mean and the standard deviation of that parameter calculated from the baseline data. Thus, the parameter’s normalized values are shown in (7)
Where I and are shown in formula (8):
Finally, the MD value of the test sample is calculated, and the calculation formula is shown in formula (9):
Where is composed of , is the transpose of row vector , and the calculation formula of correlation coefficient matrix is shown in (10):
MD is composed of the product of the normalized vector and the correlation matrix. The two vectors are dimensionless and can realize the effective fusion of different types of data under the same metric. The trend change degree of MD can evaluate the health status and fault classification of equipment.
3.3. Determination of Fault Detection Threshold Based on Box-Cox Power Transformation
the characteristic parameters of electromagnetic coil based on MD could only intuitively represent the degradation state, which could not judge whether the electromagnetic coil is fault. Therefore, this paper proposes MD based on Box-Cox transformation as a method to evaluate the fault state of electromagnetic coil. Box-Cox transformation is a parameterized generalized power transformation method proposed by box and Cox in 1964, and it is a common data transformation method in statistical modeling[24,25]. The main target of Box-Cox is to conduct monotonic transformation of data, thereby normality is achieved in skewed interpolation[26,27]. Box-Cox transformation is defined as follows:
Where is the initial vector of nonnormal distribution and is the vector based on Box-Cox power transformation. The logarithmic maximum likelihood function is obtained, as shown in equation 12:
Where,
The mean () and standard () deviations of the transformed variable is used to determine the state threshold of electromagnetic coil. The samples that satisfy the normal distribution are distributed in ) when the probability of interval is 99.7%, according to the rule, the threshold value corresponding to a fault limit ) is defined, another threshold value corresponding to a degradation limit ) is also defined. Therefore, the MD value greater than the threshold ) are considered as unhealthy variables (fault state), and the MD value greater than the threshold ) are considered as degradation variables (degradation state).
The implementation framework of this paper is shown in Figure 5. For the collected electromagnetic coil electrical data, the Spearman rank correlation coefficient is used to construct feature set, MD transformation is used to establish the characteristic parameter for health assessment, Box-Cox power transformation is used to construct the variable based on normal distribution, and then the fault threshold and degradation threshold are defined, finally, the real-time MD variables of electromagnetic coil are used to evaluate the current health state.
4. Experiment and Results Analysis
4.1. Experimental Platform and Data Acquisition
In order to analyze the changes of electrical parameters at multi frequency in the degradation process of electromagnetic coil, the accelerated fatigue test of electromagnetic coil samples was completed. Considering that thermal stress is the main stress source of electromagnetic coil insulation failure, the experimental scheme is determined as follows: the electromagnetic coil is implanted into 260℃ thermal aging constant temperature test chamber for accelerated fatigue test, and the fatigue test time of 6 hours is regarded as an accelerated cycle; then the electromagnetic coil is implanted into 25℃ constant temperature drying oven and cooled for 12 hours; the high precision impedance measurement instrument (E4980A) is used to collect multispectral electrical data of electromagnetic coil; finally, the DC resistance(DCR) is used to determine whether the electromagnetic coil is faulty(if there is short circuit or open circuit fault in the electromagnetic coil, then the experiment is over, otherwise, the experiment continues); the Figure 6 is the accelerated fatigue test plan and data acquisition system.
The purpose of the experiment is to validate the electrical parameters as the characteristic parameter for insulation degradation and fault monitoring under thermal loading conditions. The electromagnetic coil was hand-wound using the magnet wire whose information is shown in Table 1.
The data of healthy coil was measured by sweeping frequencies from 50 kHz to 1 MHz, which is the measured frequency range of the Keysight E4980A. The data of 47 cycles are measured, and in the 45th cycle, the electromagnetic coil has short circuit fault, that is, the life-cycle data have been collected, and part of the collected data are shown in Table 2 and Table 3.
In Table 2, DCR is collected, which is the average from DCR1 to DCR8, it can be seen that the DCR of the electromagnetic coil is constant in the degradation process until the DCR in the 45th cycle drops significantly to 5.31. The decrease of DCR indicated that the electromagnetic coil had a short circuit fault. As shown in Figure 6, the change of DCR in the life cycle of the electromagnetic coil is in the degradation process, but when the inter turn short circuit fault occurs, the value of DCR decreases significantly, and the degree of decrease is related to the degree of short circuit fault.
In the degradation process, the reactance, impedance, inductance and resistance of electromagnetic coil have no significant changes in the low frequency range, but the high frequency electrical parameters have significant changes in a certain range, which also verified the effect of parasitic capacitance (formula 3). Under the condition of 314khz high frequency, some measured data of the electromagnetic coil are shown in Table 3, the data of impedance and reactance have a certain trend change during the degradation process (the value of measured data decrease with aging time), while the inductance tends to be constant. Figure 7, Figure 8 and Figure 9 shows the measured data of the life cycle of the electromagnetic coil.
The curves gradually change from black to red in Figure 7 and Figure 8, with the progress of fatigue test, the data of impedance and reactance of the electromagnetic coil gradually shift to the left, the high frequency measured value of impedance and reactance at single frequency decrease with the aging, but the low frequency measured value of impedance and reactance at single frequency is relatively constant with the aging (Figure 8 and Figure 9). However, both the low frequency and high frequency inductance measured value are approximately constant in the degradation process. Therefore, Through the analysis of the collected reactance spectrum and impedance spectrum data, it can be seen that the reactance and impedance at a specific frequency can be used as the characteristic parameters to evaluate the health state of the electromagnetic coil.
4.2. Experimental Platform and Data Acquisition
The electrical parameters in high frequency state are easily affected by multiple factors of the measurement environment, and then the collected data cannot accurately reflect the real health state. Therefore, it is feasible and effective to realize the whole life cycle health assessment of the electromagnetic coil by using the low and medium frequency data. However, the whole life cycle data of medium and low frequency obtained by accelerated fatigue experiment do not have remarkable change trend, as shown in Figure 8 and 9. As shown in Figure 10 and Figure 11, the impedance data collected at 20kHz and 14kHz frequency showed weak upward trend during degradation process, while the impedance in fault state showed a significant downward trend. Due to the influence of external factors, the impedance value of a certain frequency in the whole life cycle of the electromagnetic coil did not have monotonic trend change characteristics, the current health state of the electromagnetic coil cannot be determined only by the impedance value of a single frequency at a certain time.
The spearman rank correlation coefficient can be used to measure linear or nonlinear monotonic relationships between two variables, and the coefficient can be used to identify regions of the frequency spectrum that closely correspond to the degradation time. This is important when attempting to find characteristics for prognostics and diagnostics. The spearman rank correlation coefficient for partial frequencies, was calculated using the measurements (impedance mode and reactance) at each frequency as a time series and then correlating these data with the time vector. Figure 12 shows the correlations of partial frequencies to the degradation time in what can be referred to as an impedance frequency correlation and reactance frequency correlation. The frequencies with correlations closer to -1 are those where impedance measurements are most closely monotonically with the degradation cycle. In the whole life, the characteristic parameters corresponding to the five largest value are selected as the degradation feature set of electromagnetic coils by MD calculation, that is the impedance at five specific frequencies.
The health data of 5 measurement cycles were selected as training samples, and the data of 42 measurement cycles under accelerated fatigue test were selected as test samples. The degradation characteristics were extracted based on MD method to evaluate the state of electromagnetic coil during operation. The degradation process of the electromagnetic coil can be evaluated as MD degradation process, and the MD degradation process can be regarded as MD degradation process. Figure 13 shows that MD is used as a degradation sensitive feature to characterize the effectiveness of electromagnetic coil health. Firstly, the degradation presents a monotonous upward trend, which makes up for the shortcoming that single parameter characterization is not monotonous. Secondly, the MD value under fault state increases significantly, indicating that the electromagnetic coil is abnormal.
The health status of the electromagnetic coil is evaluated by the MD value of the electromagnetic coil, however, it could not identify the fault status, as shown in Figure 13.Therefore, this paper carries out Box-Cox transformation on the MD characteristics to transform MD value into the normal distribution, and the threshold value of fault status is determined by statistical theory, which is used for the health status analysis of the electromagnetic coil. The threshold value is shown in Figure 14, At the beginning of the whole cycle of the accelerated fatigue test, the electromagnetic coil has a short circuit fault, that is, the eigenvalues of the last three cycles in the figure exceed the upper limit threshold, at this moment, the electromagnetic coil is in fault status, which shows the effectiveness of using Box-Cox transformation to carry out criterion early fault warning and fault detection.
5. Conclusions
Taking the electromagnetic coil widely used in industrial equipment as the research object, this paper analyzes the failure mechanism of the electromagnetic coil, and theoretically studies the changes of high-frequency capacitance, reactance and impedance in the degradation process of the electromagnetic coil. The experimental platform of accelerated fatigue aging was established, and the life data of electromagnetic coil was obtained by taking constant high temperature as accelerated stress. The Spearman rank correlation coefficient is introduced and the characteristic parameters for evaluating the degradation of electromagnetic coils are obtained. In order to reduce the dimension of characteristic parameters and reduce the interference of high-frequency data, MD is introduced to reduce the dimension of multiple characteristic parameters to obtain MD, which is used as the evaluation feature of electromagnetic coil. Finally, the effectiveness of MD as the evaluation feature of electromagnetic coil degradation is verified by experimental data. With the help of Box-Cox, MD is transformed into normal distribution, and the insulation fault threshold of the electromagnetic coil is determined. The health status of the electromagnetic coil is divided into four states: mild degradation, moderate degradation, severe degradation and fault, and the condition monitoring and fault detection are realized. The effectiveness of this method is verified by experiments, and then the real-time monitoring of electromagnetic coil health status and fault early warning are realized.
Author Contributions
For research articles with six authors; methodology, Yiyang.Wang.; software, Jianan.Li.and Haifeng.Guo.; validation,Yiyang.Wang. and Haifeng.Guo.; formal analysis, X.X.; literature investigation, Chao.Shen.and Zhongbo.Du.; data curation, Chao.Shen., Zhongbo.Du. and Xiang.Li.; writing—original draft preparation, Yiyang.Wang. And Jianan.Li.; writing—review and editing, Jianan.Li.and Haifeng.Guo.; supervision,Haifeng.Guo.; project administration, Yiyang.Wang. All authors have read and agreed to the published version of the manuscript.
Funding
This research was funded by “the Basic Research Projects of the Educational Department of Liaoning Province in 2024, grant number LJ212411430022”, “the 2023 Doctoral Research Launch Fund Project of Liaoning University of Science and Technology, grant number 2307B05”and “the Basic Research Projects of the Educational Department of Liaoning Province in 2023, grant number JYTMS20231798”.
Data Availability Statement
Due to this project being in the execution phase, it is temporarily not suitable to open the dataset mentioned in the article. The dataset will be opened after the completion of subsequent projects. If there are scholars who need data, they can contact the author by email( guohaifeng15@mails.ucas.edu.cn ).
Conflicts of Interest
The authors declare no conflicts of interest.
References
- Jameson, N.J.; Wang, K.; Azarian, M.H.; Morillo, C.; and Pecht, M. Impedance-based Health Monitoring of Solenoid Valve Electromagnetic Coil Insulation Under Thermal Deterioration, Joint Conference on Machinery Failure Prevention Technology Conference, MFPT 2016 and ISA's 62nd International Instrumentation Symposium, IIS 2016. Dayton, OH, USA., May 24-26, 2016:1-25.
- Jameson, N.J.; Azarian, M.H.; Pecht, M. Impedance-based Condition Monitoring for Insulation Systems used in Low-voltage Electromagnetic Coils, IEEE Transactions on Industrial Electronics, May, 2017, 64(5):3748-3757. [CrossRef]
- Wang, K.; Guo, H.; Xu, A.; Liu, Y.; Han, X. Degradation Monitoring Method of Electromagnetic Coil Insulano for Smart Manufacturing. Information and Control. 2017, 46(4): 469-473.
- Wang, K.; Guo, H.; Xu, A.; Jameson, N. J.; Pecht, M.; Yan, B. Creating Self-Aware Low-Voltage Electromagnetic Coils for Incipient Insulation Degradation Monitoring for Smart Manufacturing. IEEE ACCESS,2018, 6(1): 69860-69868. [CrossRef]
- Guo, H.; Xu, A.; Wang, K.; Sun, Y.; Han, X.; Hong, S. H.; Yu, M. Particle Filtering Based Remaining Useful Life Prediction for Electromagnetic Coil Insulation, Sensors, 2021, 21(2):473-487. [CrossRef]
- Yong, D.; Zhang, P. A Review of Fault Diagnosis and Online Condition Monitoring of Stator Insulation in AC Electrical Machine. Proceedings of the CSEE, 2019, 39(2): 395-406.
- Gyftakis, K. N.; Cardoso, A. Reliable Detection of Stator Inter-Turn Faults of Very Low Severity Level in Induction Motors, IEEE Transactions on Industrial Electronics, 2021,4(68):3475- 3484. [CrossRef]
- Mosavi, A. A.; Dicken, D.; Seracino, R. et al. Identifying damage locations under ambient vibrations utilizing vector autoregressive models and Mahalanobis distances. Mechanical Systems & Signal Processing, 2012, 26(1):254-267. [CrossRef]
- Zhou, Y. L. ; Figueiredo, E. ; Maia, N. et al. Damage detection in structures using a transmissibility-based Mahalanobis distance. Strutural Control & Health Monitoring, 2015,22(10):1209-1222. [CrossRef]
- Gandhi, A.; Corrigan, T; Parsa, L. “Recent advances in modeling and online detection of stator interturn faults in electrical motors,” IEEE Trans.Ind. Electron.,May 2011,58(5):1564–1575. [CrossRef]
- Wang, K.; Guo, H.; Xu, A.; Pecht, M. Degradation Monitoring of Insulation Systems Used in Low-Voltage Electromagnetic Coils under Thermal Loading Conditions from a Creep Point of View. Sensors. 2020, 13(20): 3696-3712. [CrossRef]
- Liu, L.; Zhang, X.; Lei, Y.; Zheng, Z. Structural Damage Localization under Unknown Seismic Excitation Based on Mahalanobis Squared Distance of Strain Transmissibility Function. Appl. Sci. 2022, 12, 3115. [CrossRef]
- Chen, J.; Liu, Z.; Zhao, Y.; Yang, S.; Zhou, Z. Generalized Weighted Mahalanobis Distance Improved VIKOR Model for Rockburst Classification Evaluation. Mathematics 2024, 12, 181. [CrossRef]
- Lv, P.; Yan, Y.; Li, Y. Research on fault diagnosis of improver kernel fisher based on mahalanobis distance in the field of chemical industry. Acta Automatica Sinica, 2020.03, Network publishing.
- Kobayashi, Y. Improved method for correcting sample Mahalanobis distance without estimating population eigenvalues or eigenvectors of covariance matrix. International Journal of Data Science and Analytic. 2020,2(10):121-134. [CrossRef]
- Chen, Y.; Su, S.; Ni, K.; Li, C. Integrated Intelligent Control of Redundant Degrees-of-Freedom Manipulators via the Fusion of Deep Reinforcement Learning and Forward Kinematics Models. Machines. 2024, 12, 667–689. [Google Scholar] [CrossRef]
- Huang, Z.; Zhang, X.; Wang, X.; Huang, X.; Wang, C.; Liao, L.; Dong, Y.; Hou, X.; Cao, Y.; Zhou, X. Machine Learning Prediction of Fuel Cell Remaining Life Enhanced by Variational Mode Decomposition and Improved Whale Optimization Algorithm. Mathematics 2024, 12, 2959–2975. [Google Scholar] [CrossRef]
- Su, Z.; Gao, S.; Li, Z.; Li, T.; Kang, N. Integrated Waterflooding Effect Evaluation Methodology for Carbonate Fractured-Vuggy Reservoirs Based on the Unascertained Measure-Mahalanobis Distance Theory. Processes 2024, 12, 274–295. [Google Scholar] [CrossRef]
- Wang, Z.; Kang, D.; Zhang, C. S2AC: Self-Supervised Attention Correlation Alignment Based on Mahalanobis Distance for Image Recognition. Electronics 2023, 12, 4419–4438. [Google Scholar] [CrossRef]
- Liu, J.; Corbita, N. T.; Lee, R.; Wang, C. Wind Turbine Anomaly Detection Using Mahalanobis Distance and SCADA Alarm Data. Appl. Sci. 2022, 12, 8661–8873. [Google Scholar] [CrossRef]
- Dong, S.; Wu, W.; He, K.; Mou, X. Rolling bearing performance degradation assessment based on improved convolutional neural network with anti-interference. Measurement. 2020, 151:107219-107230. [CrossRef]
- Liu, L.; Zhang, X.; Lei, Y.; Zheng, Z. Structural Damage Localization under Unknown Seismic Excitation Based on Mahalanobis Squared Distance of Strain Transmissibility Function. Appl. Sci. 2022, 12, 3115. [Google Scholar] [CrossRef]
- Wu, X.; Xiong, W. kNN Fault Detection Based on Multi-block Information Extraction and Mahalanobis Distance. Information and control, 2021, 50(3): 287-296. [CrossRef]
- Zhang, J.; Li, N.; Li, S.; Huang, M. Health Assessment of Windturbine Generator Based on Data. Information and Control. 2018, 48(6):694-701.
- Xue, Q.; Shen, S.; Guang, L.; Zhang, Y.; Chen, Z.; Liu, Y. Remaining Useful Life Prediction for Lithiumion Batteries on Capacity Estimation and Box-Cox Transformation. IEEE Transactions on Vehicular Technology. 2020, 12(69):14765 - 14779. [CrossRef]
- Cai, C.; Lu, Z.; Zhao, Y. MASCE. Moment Method with Box–Cox Transformation for Structural Reliability. Journal of Engineering Mechanics. 2020:146(8):480-495. [CrossRef]
- Liu, S.; Fang, L.; Zhou, A.; Hong, Y. Uncertain Box-Cox regression analysis with rescaled least squares estimation. IEEE ACCESS. 2020:84769-84776. [CrossRef]
Figure 1.
The framework of electromagnetic coil health condition monitoring.
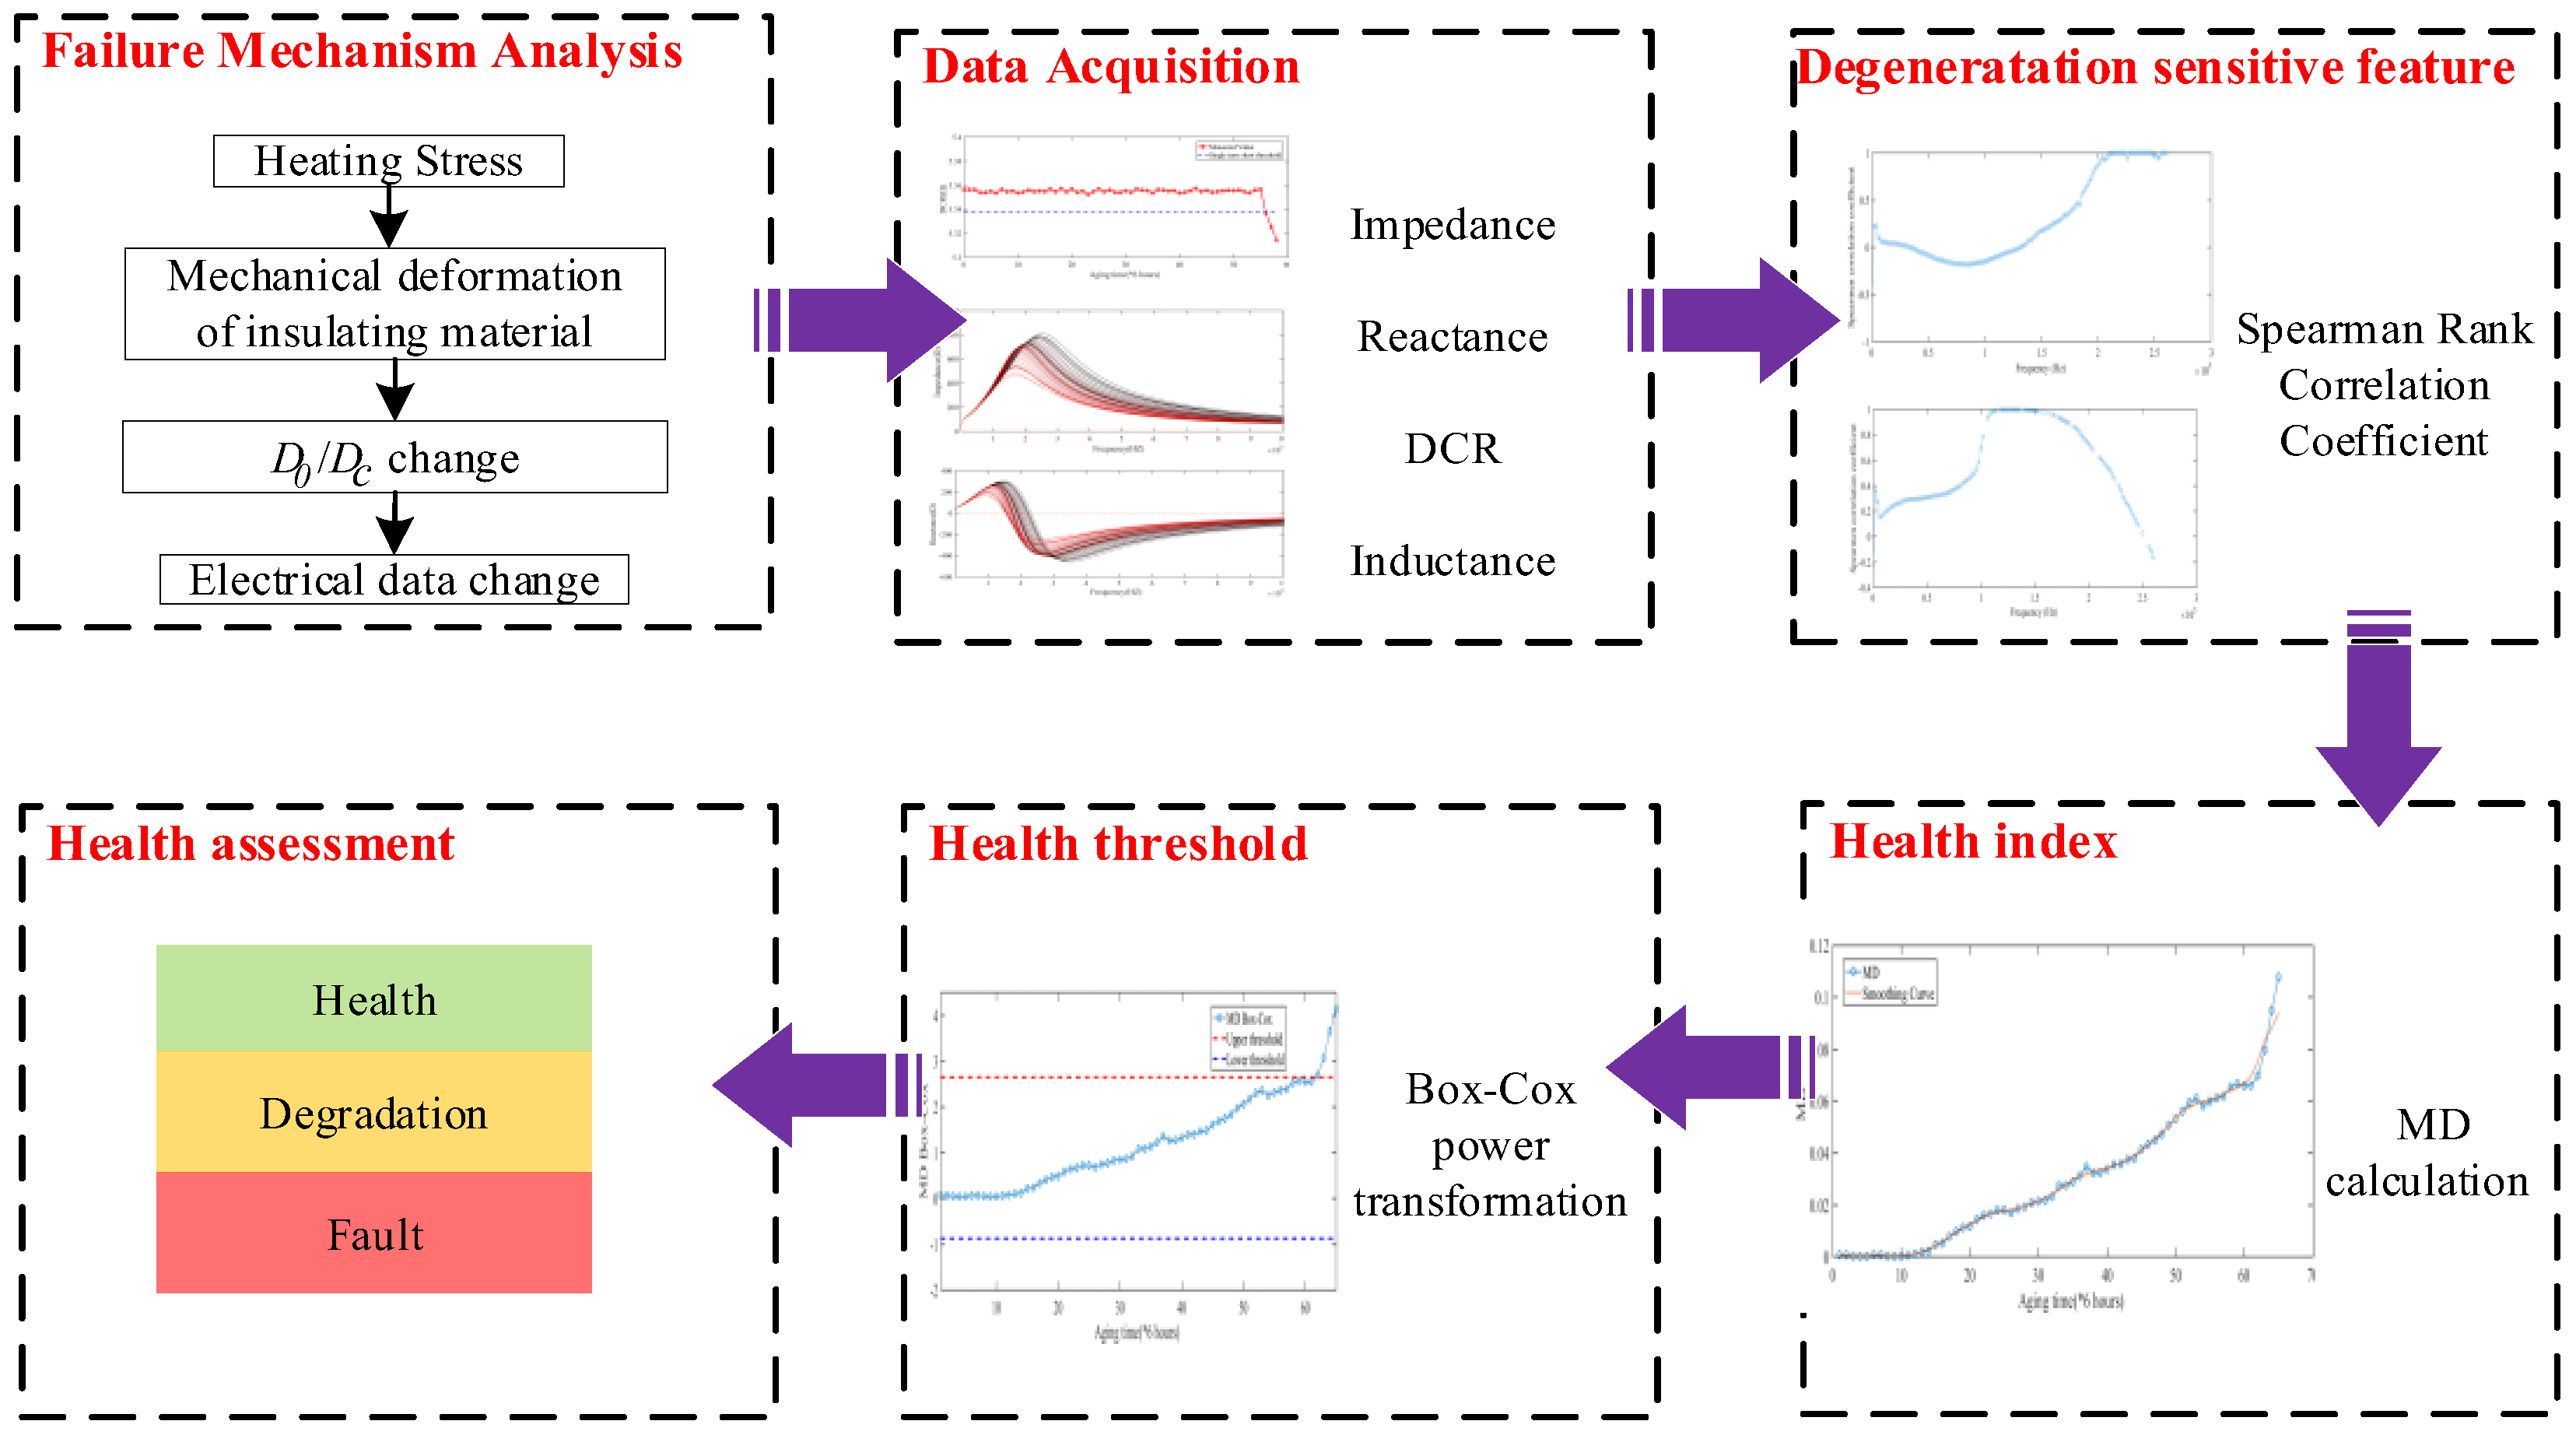
Figure 2.
Electromagnetic coil cross section and degradation process.
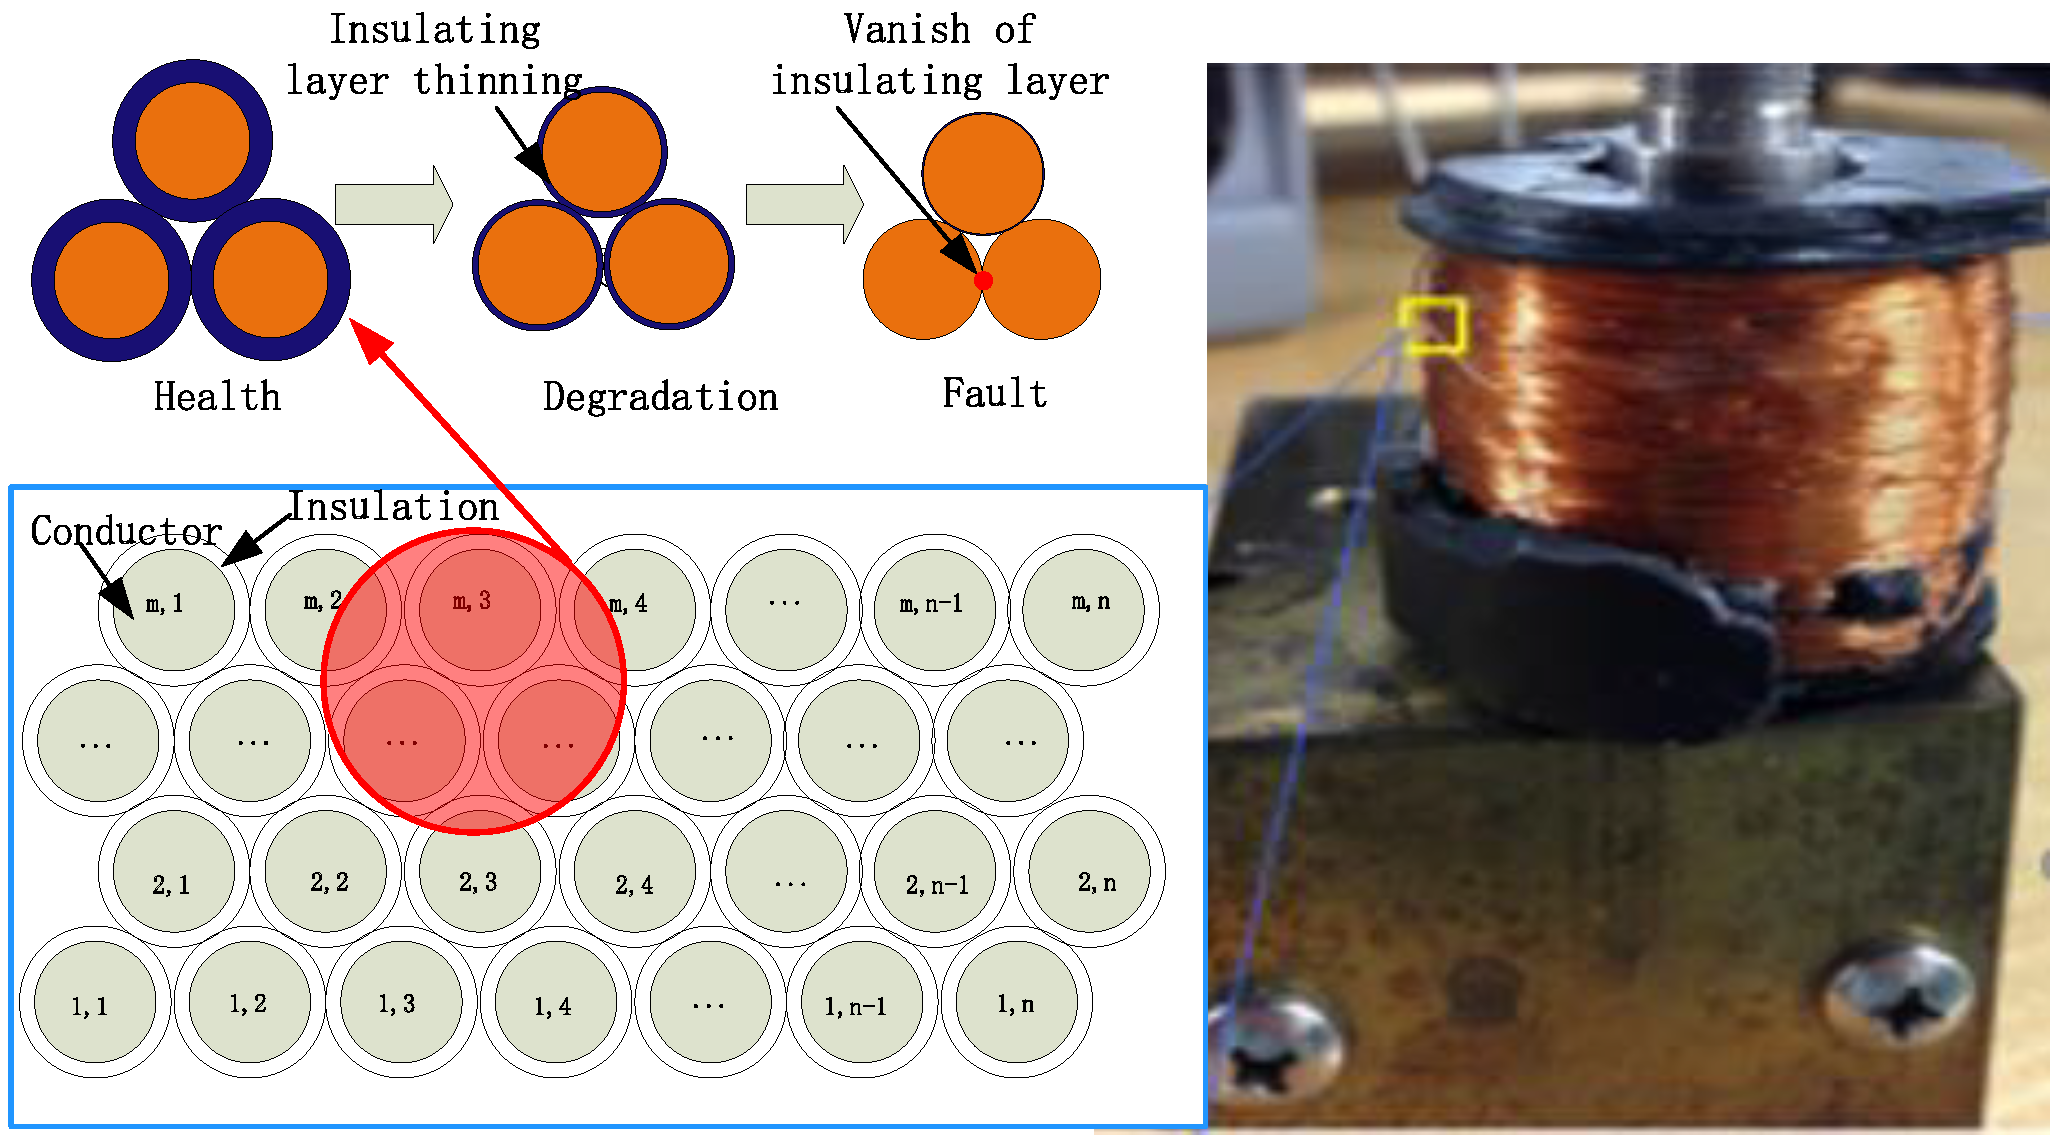
Figure 3.
Cross section of electromagnetic coil.
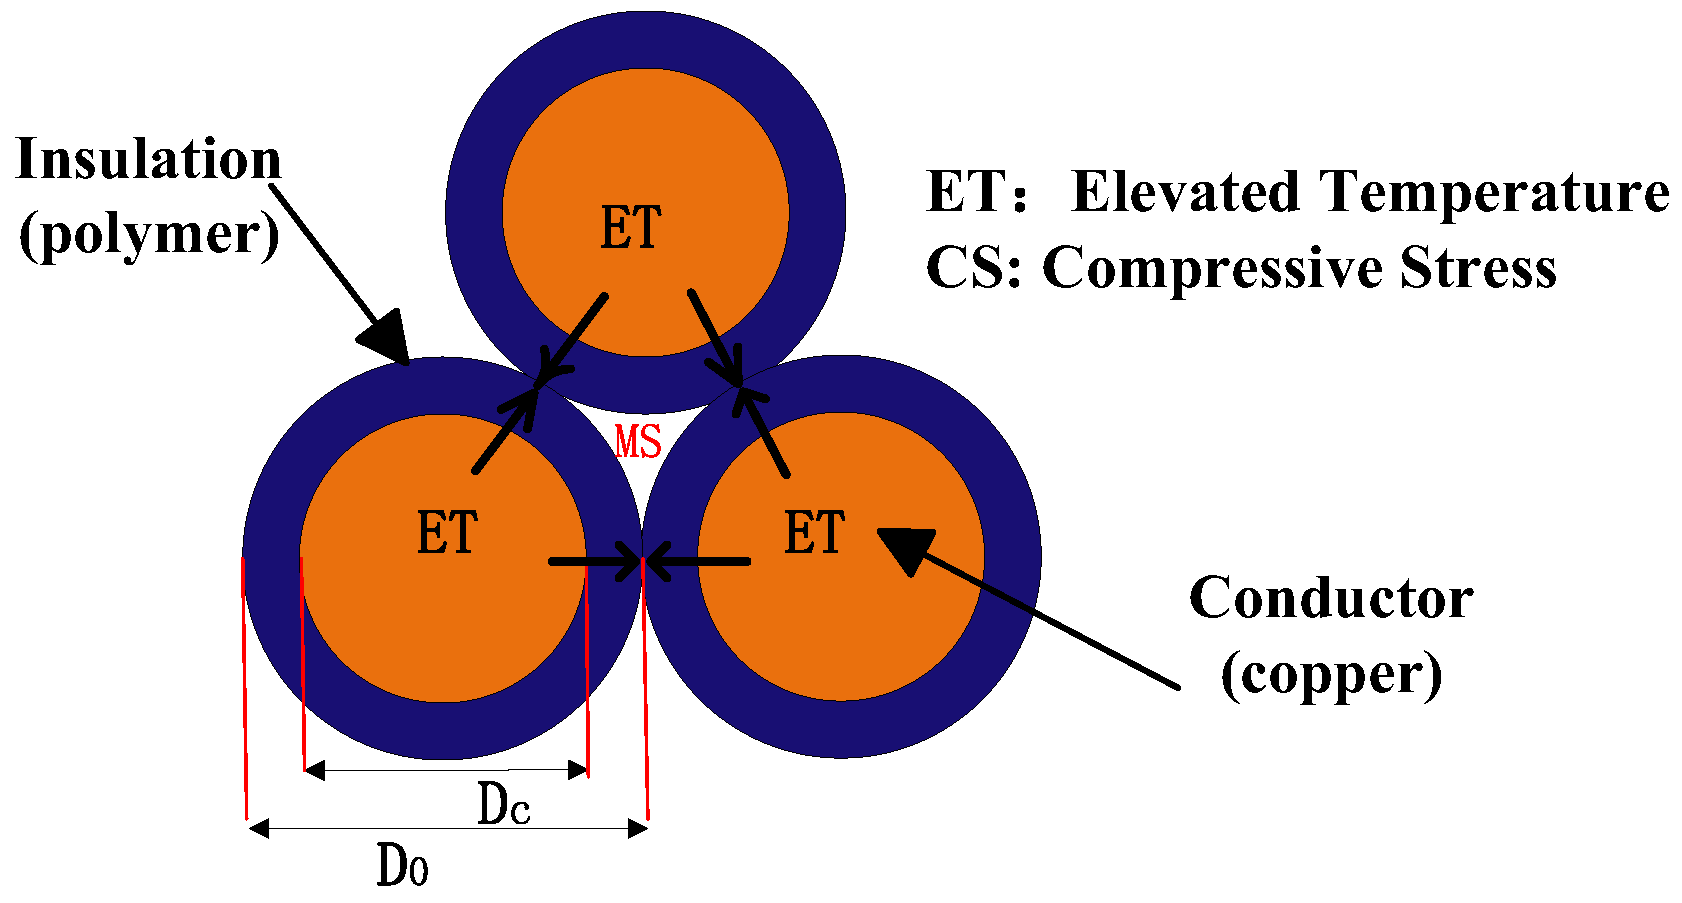
Figure 4.
Equivalent circuit models of an electromagnetic coil.
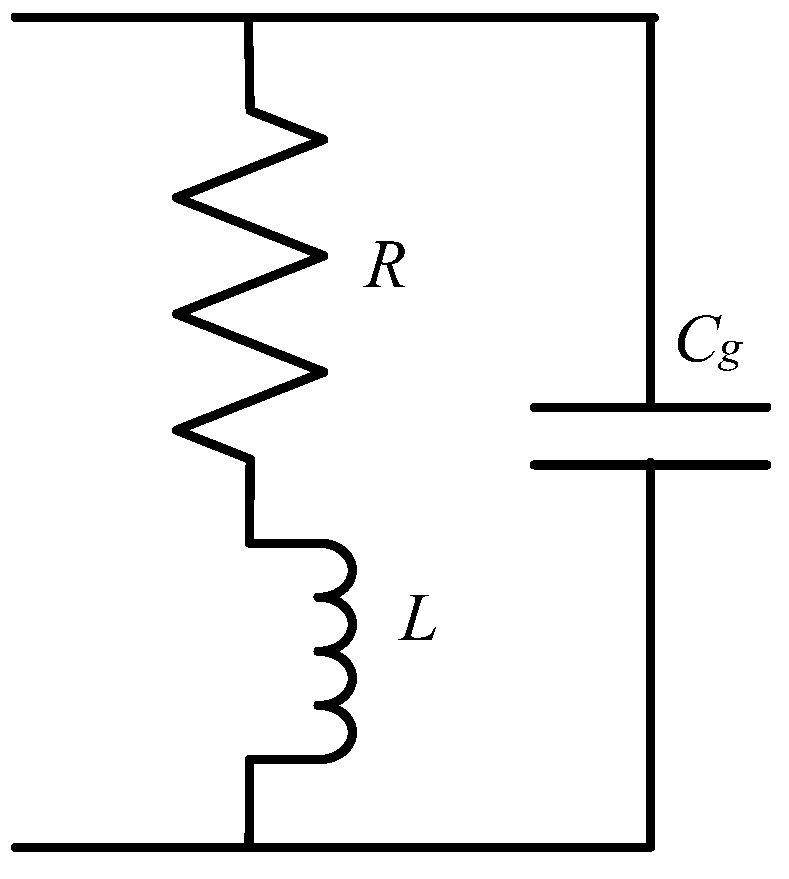
Figure 5.
Implementation framework.
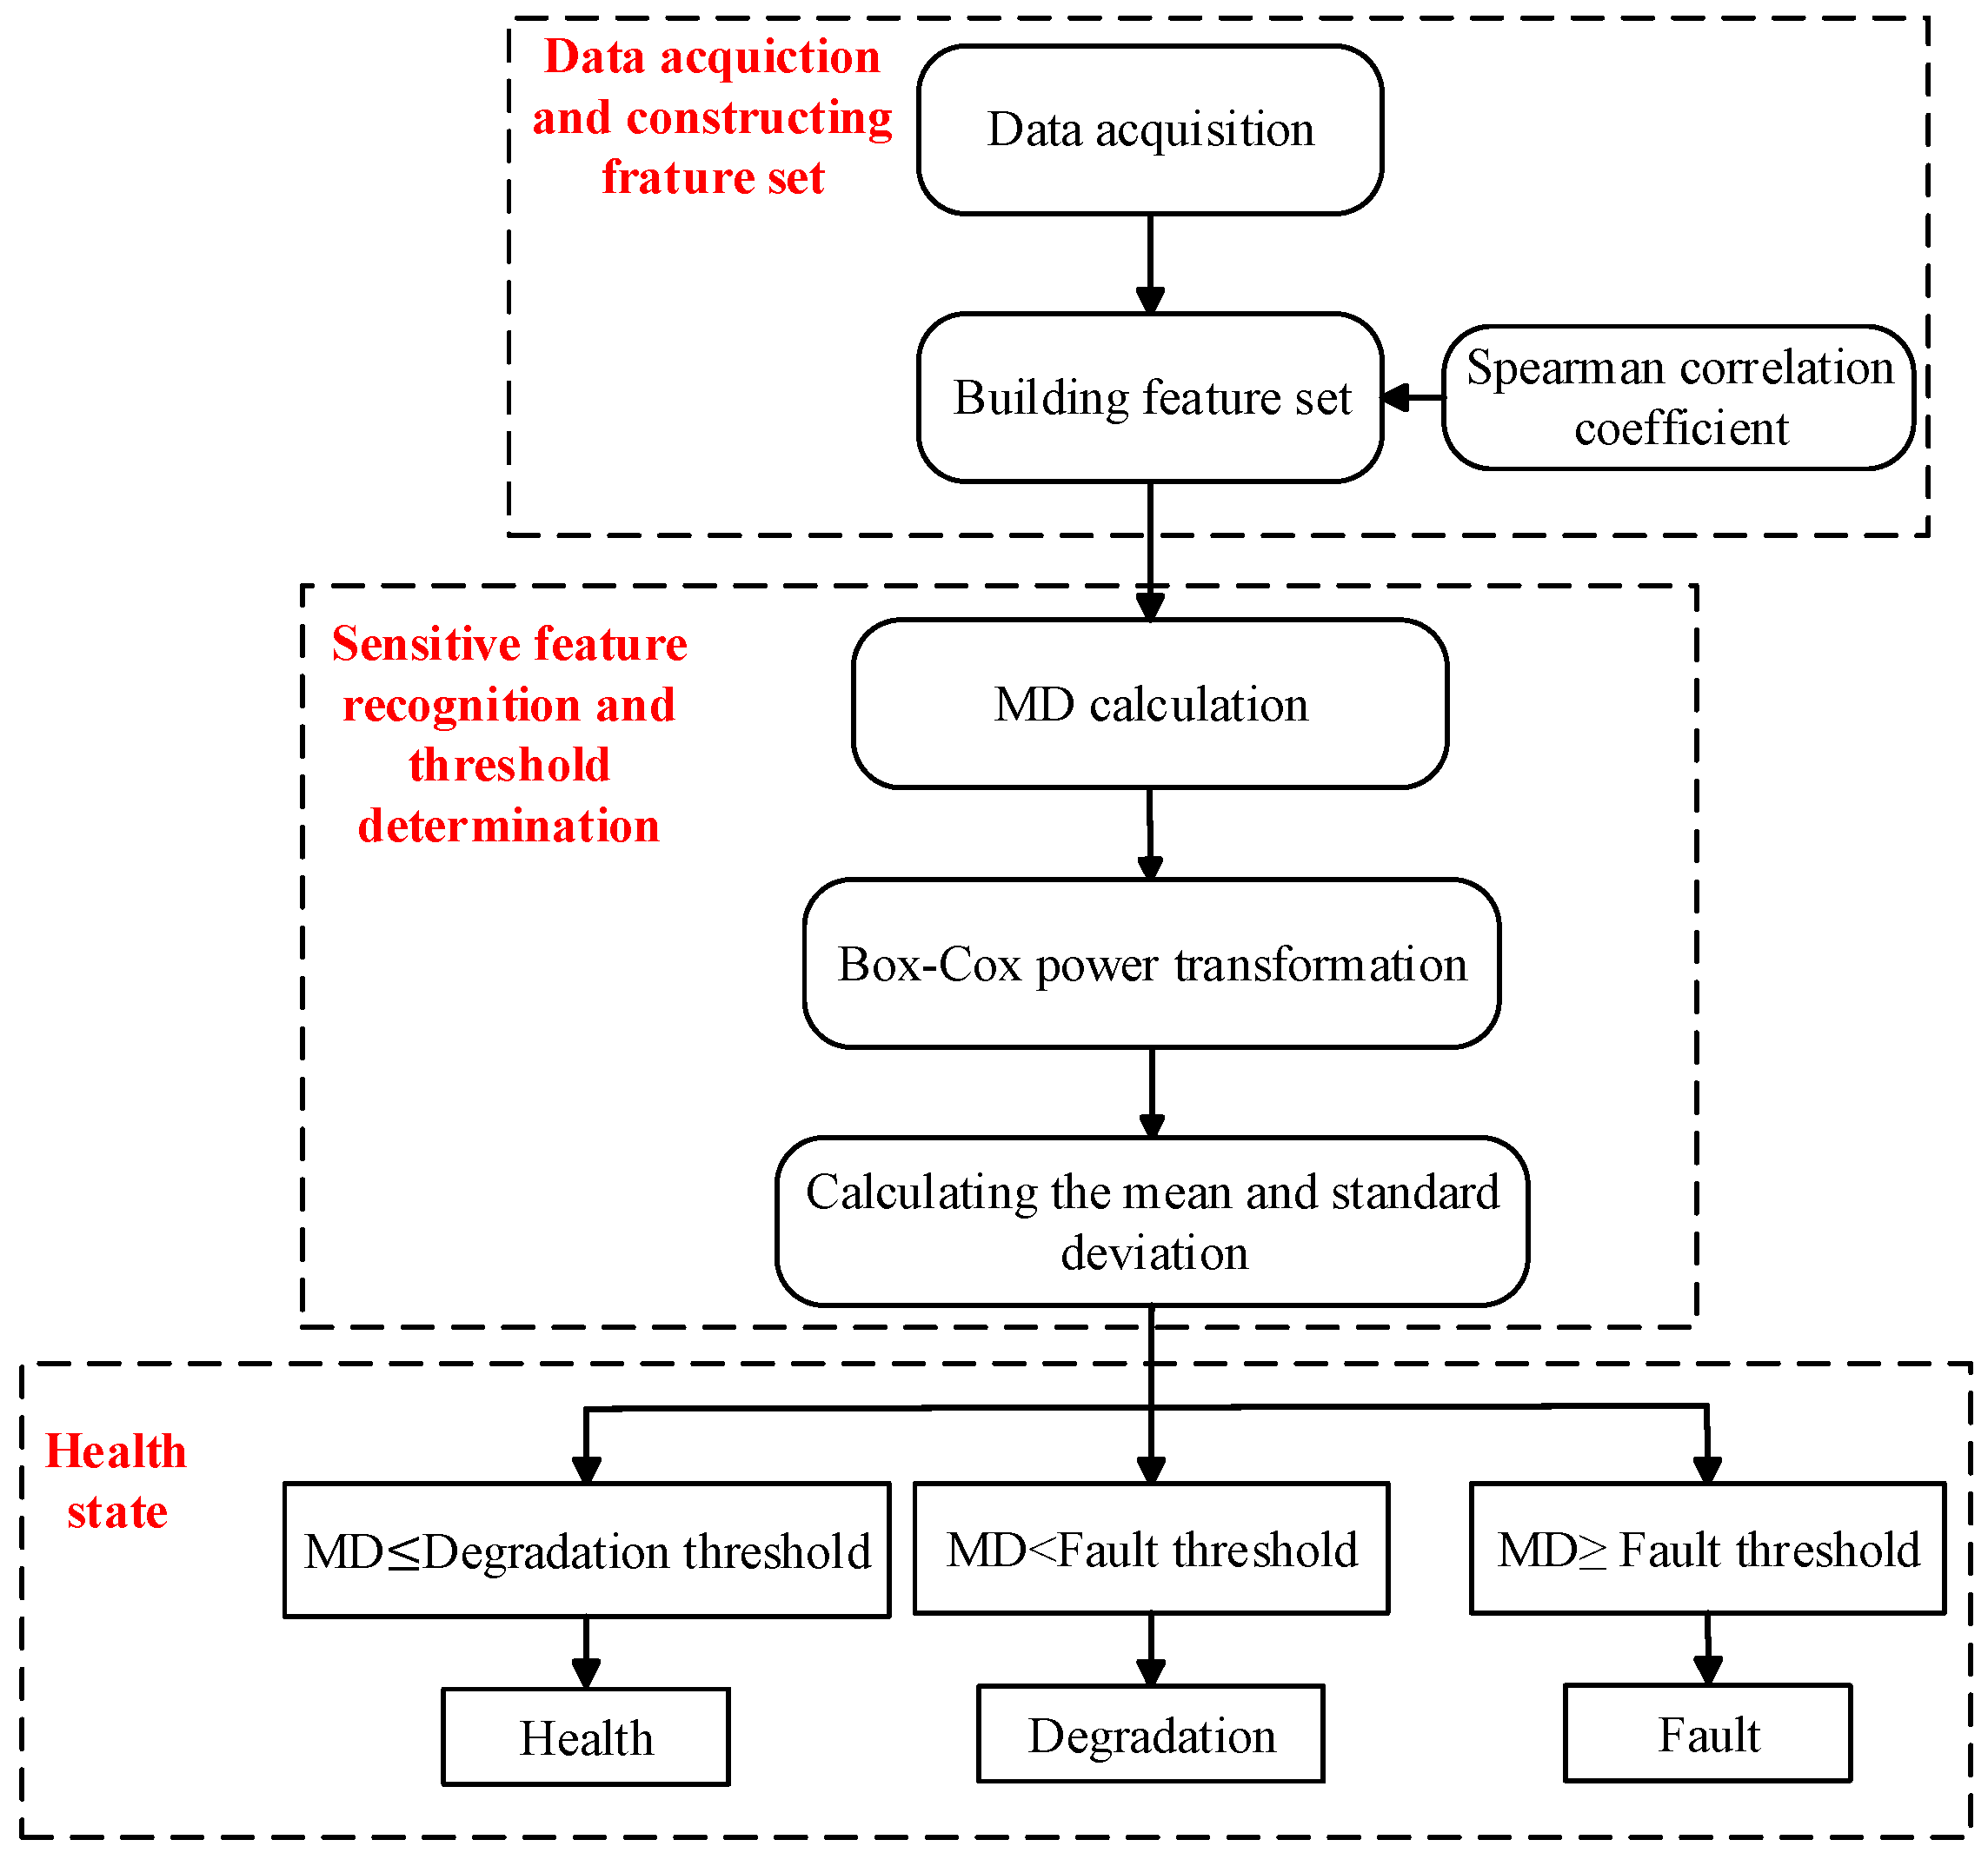
Figure 6.
Accelerated fatigue test box and data acquisition platform.
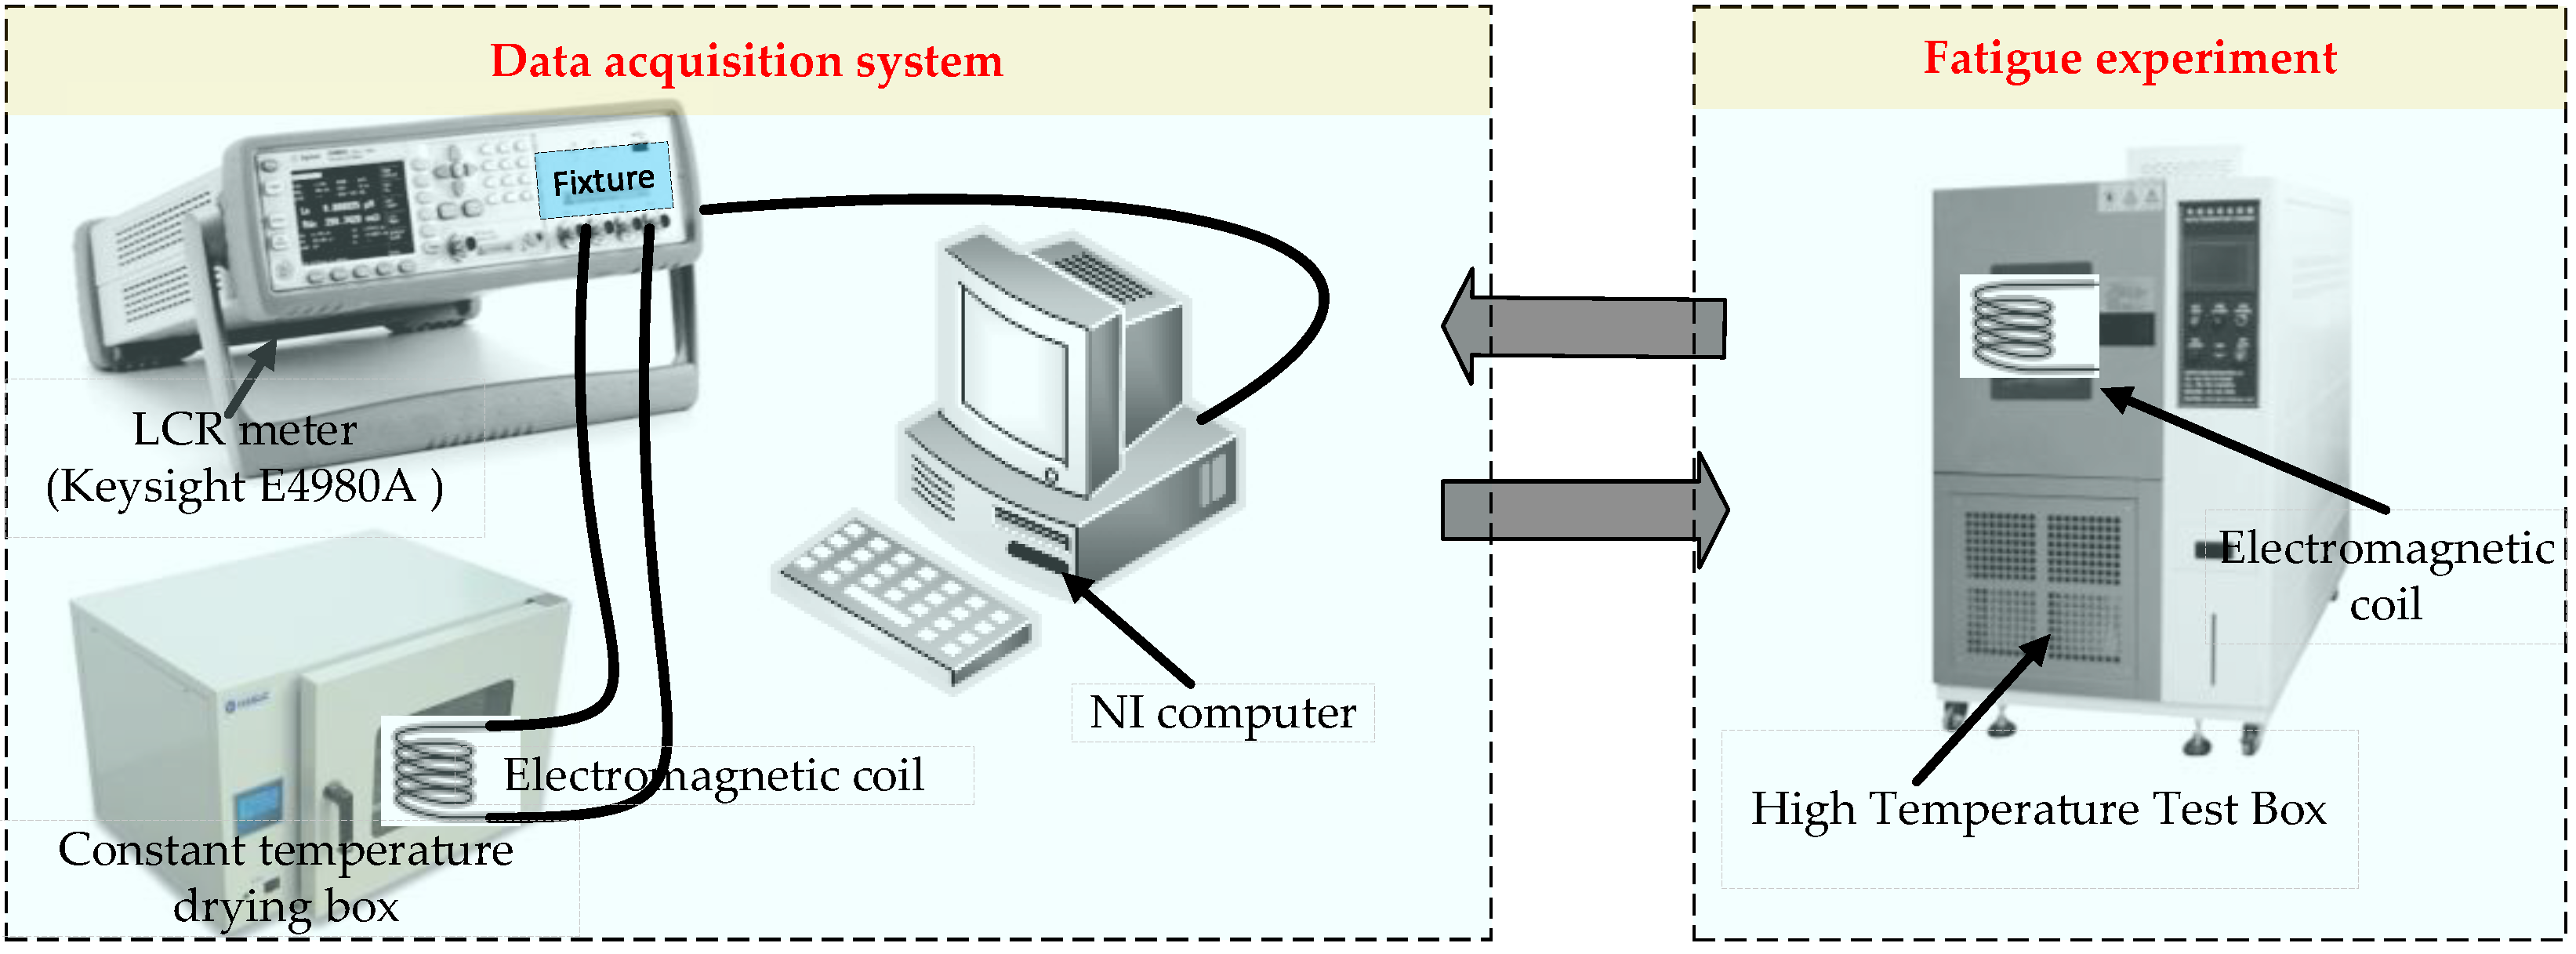
Figure 7.
Measured value of electromagnetic coil DCR in whole life cycle.
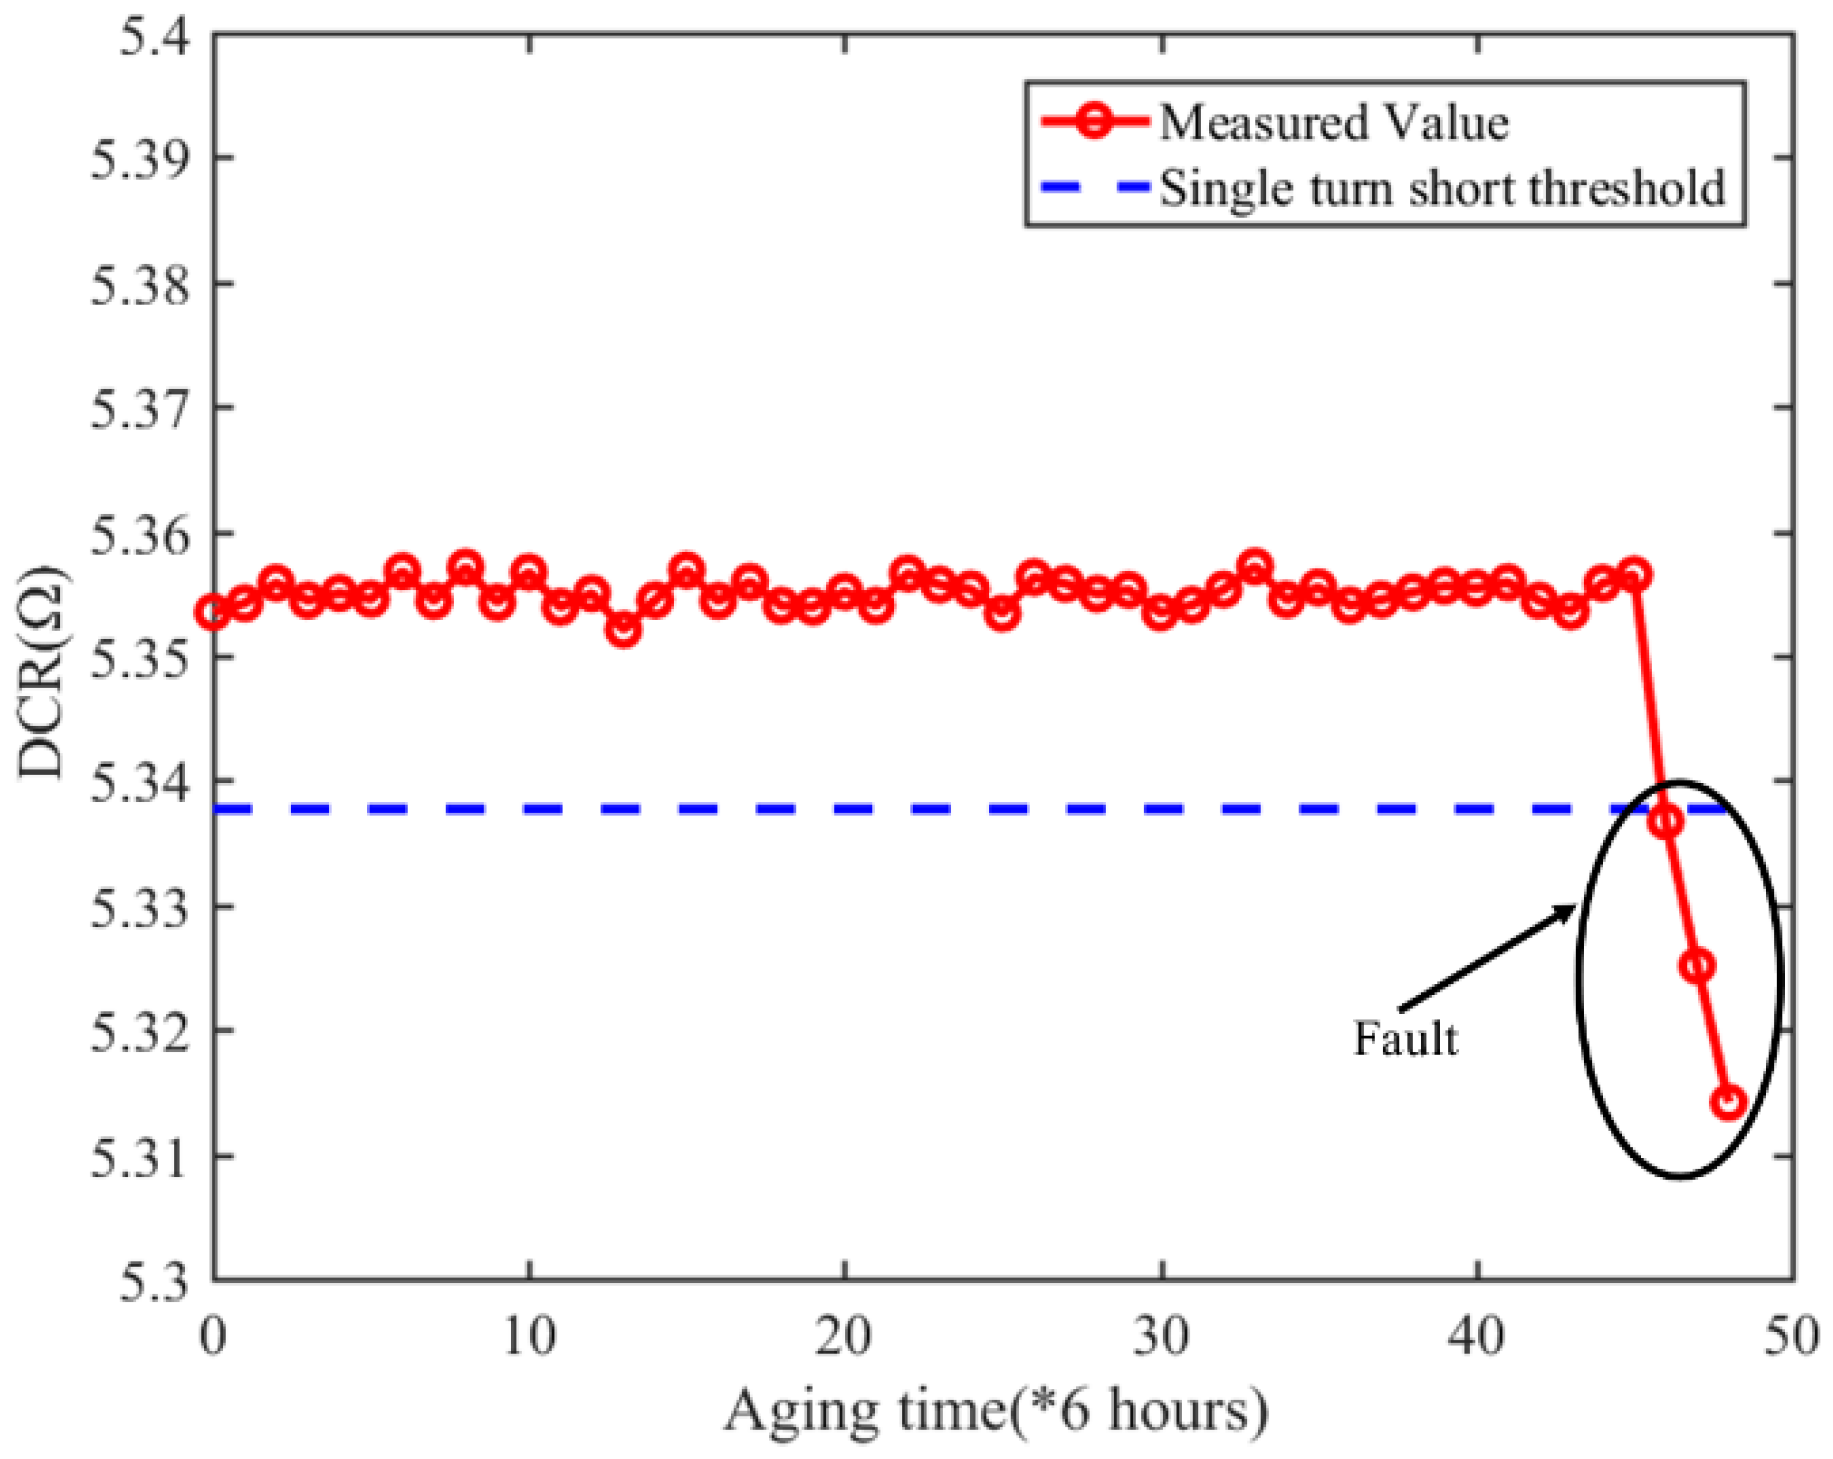
Figure 8.
Reactance measured value in the life cycle of electromagnetic coil.
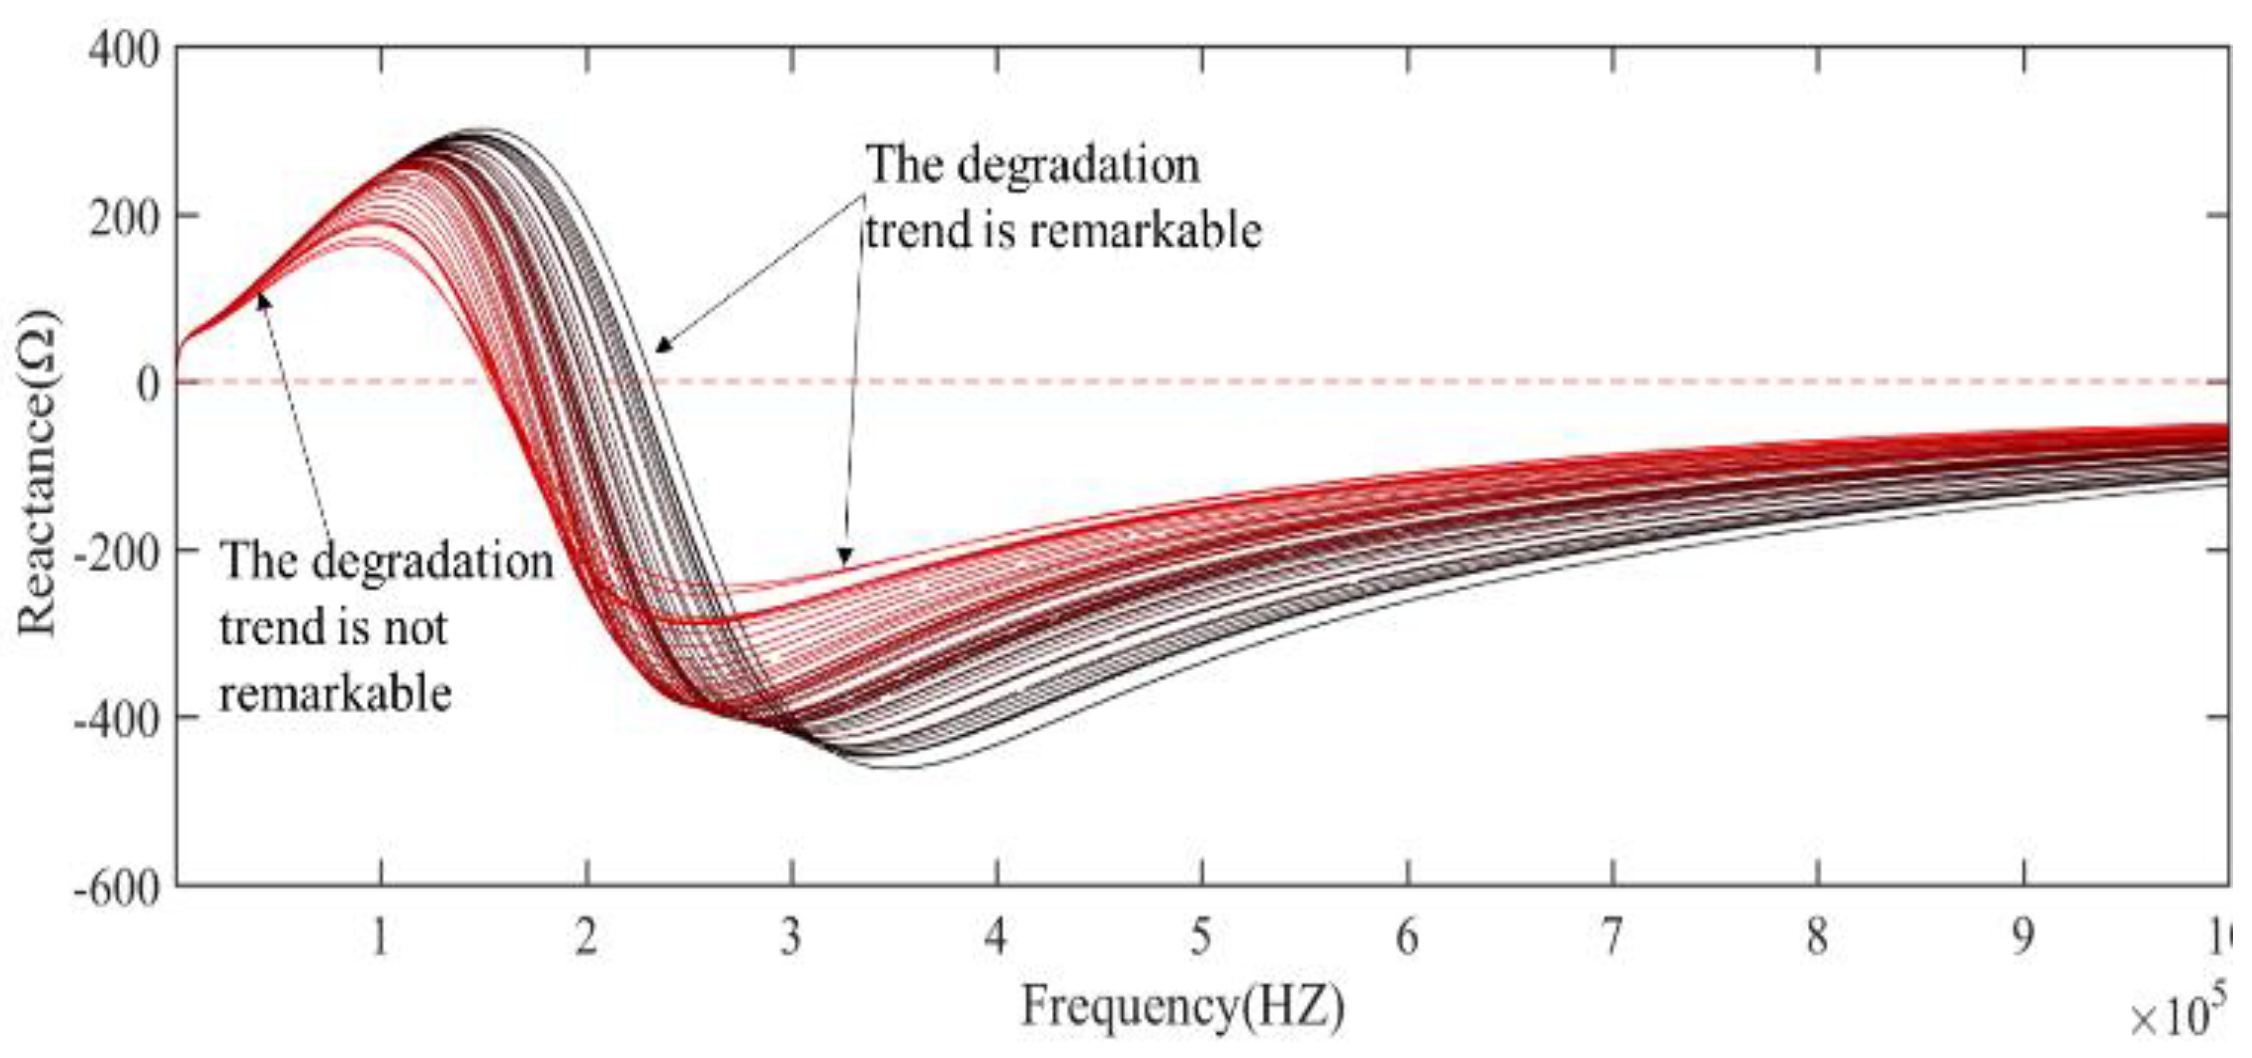
Figure 9.
Impedance measured value in the life cycle of electromagnetic coil.
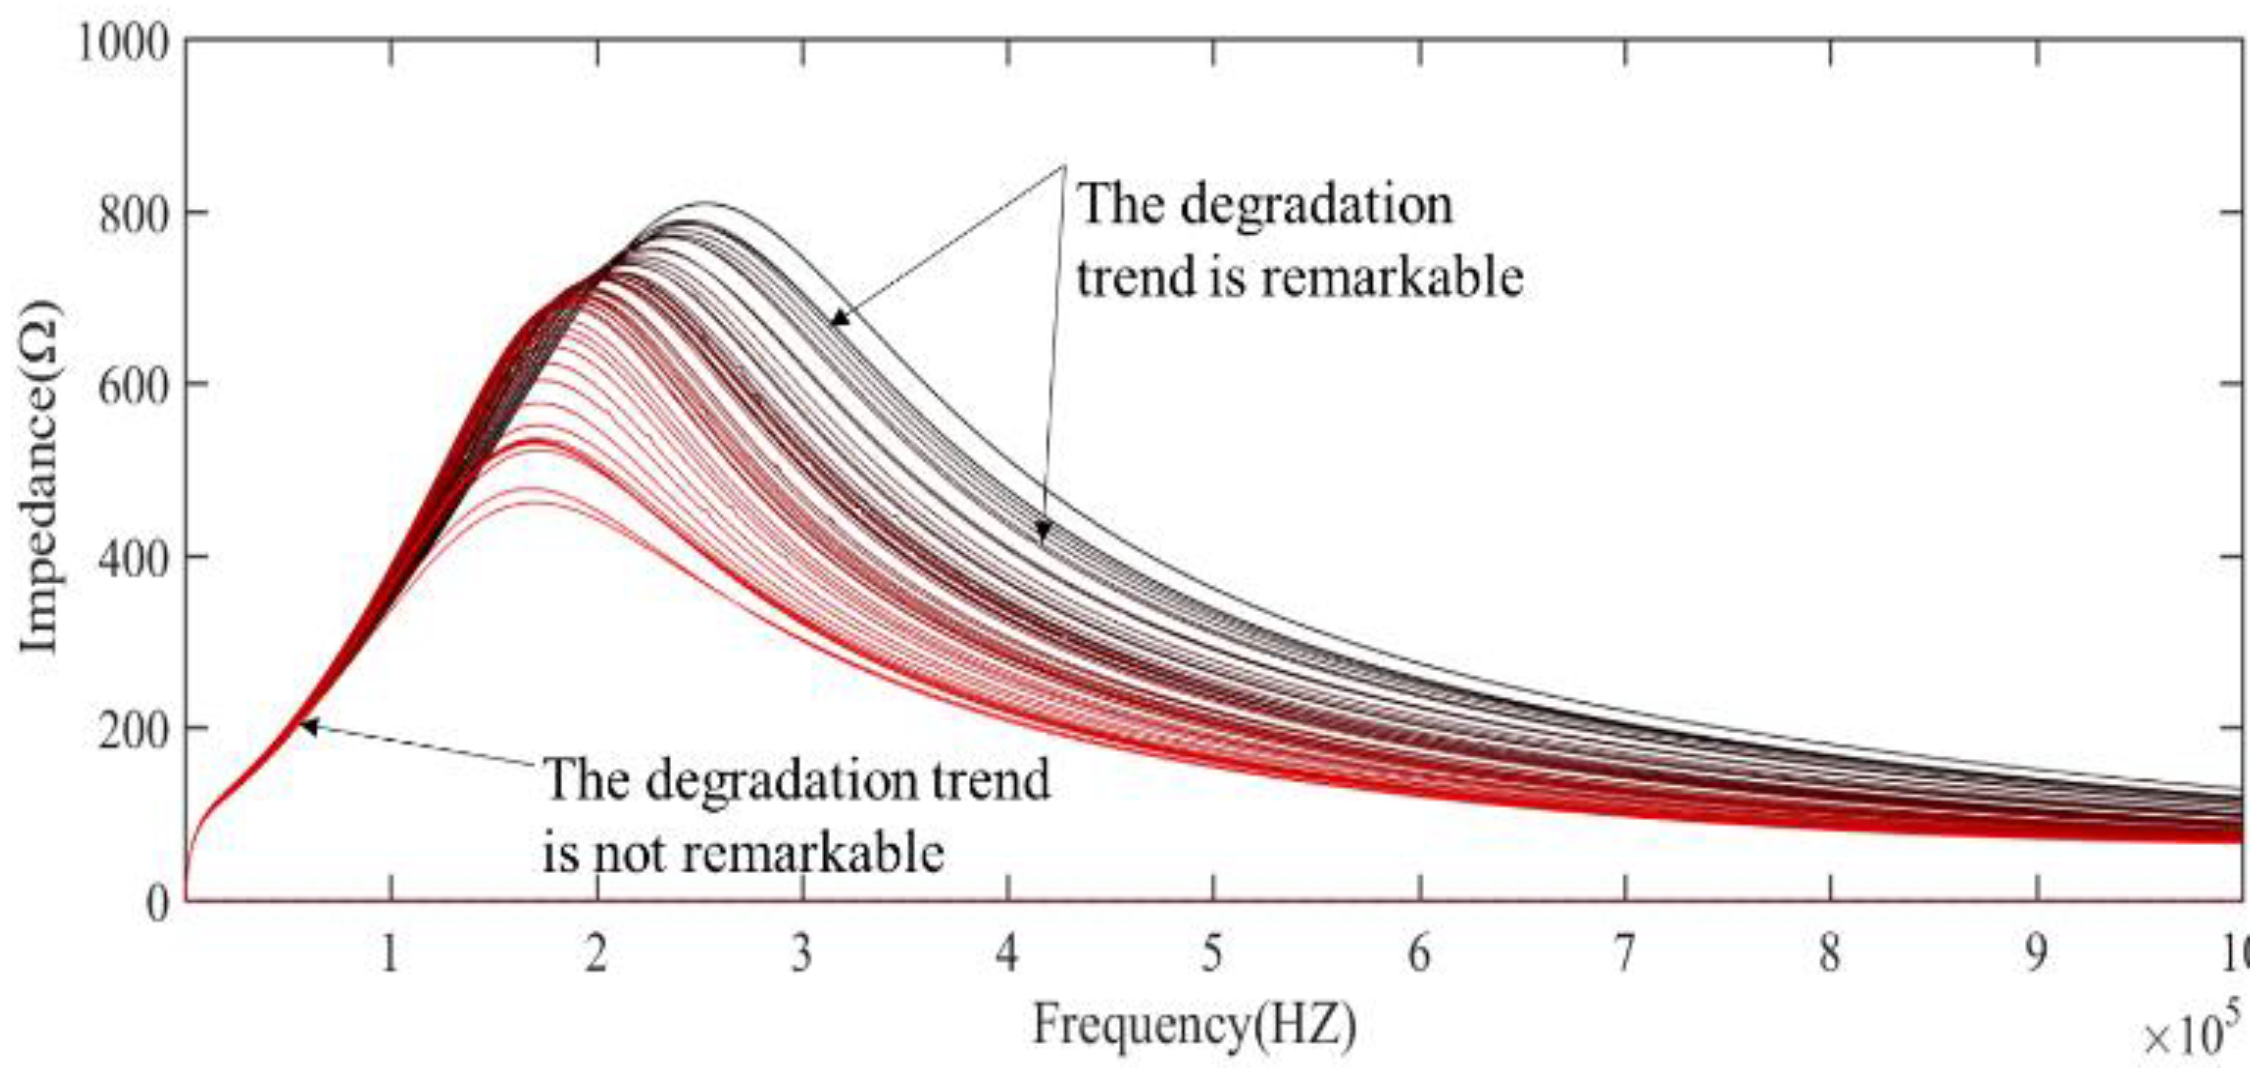
Figure 10.
Impedance degradation data at 20kHz.
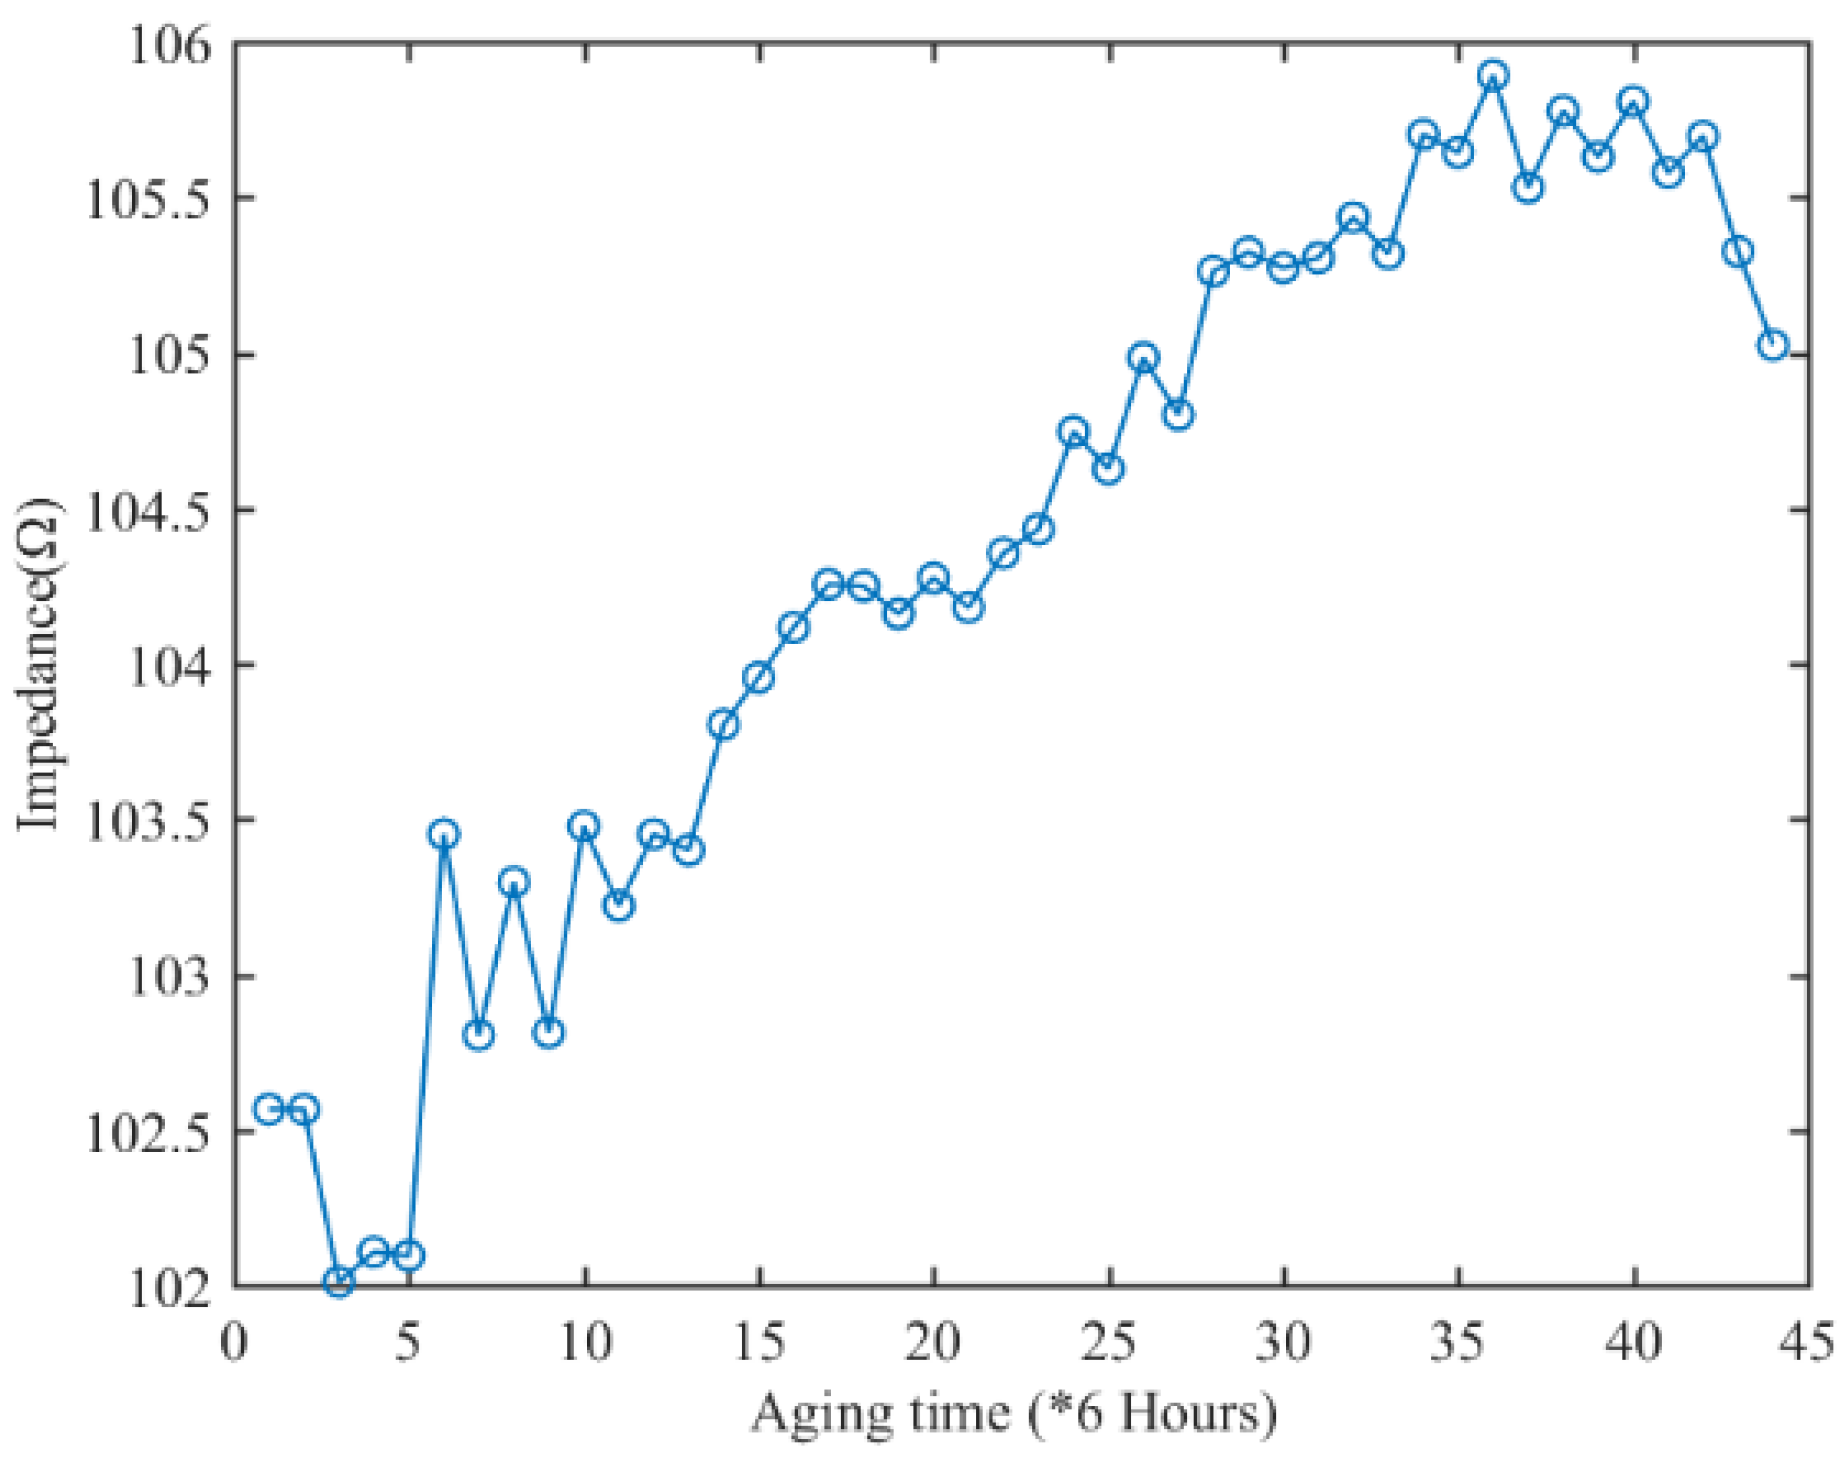
Figure 11.
Impedance life cycle data of electromagnetic coil at 14kHz.
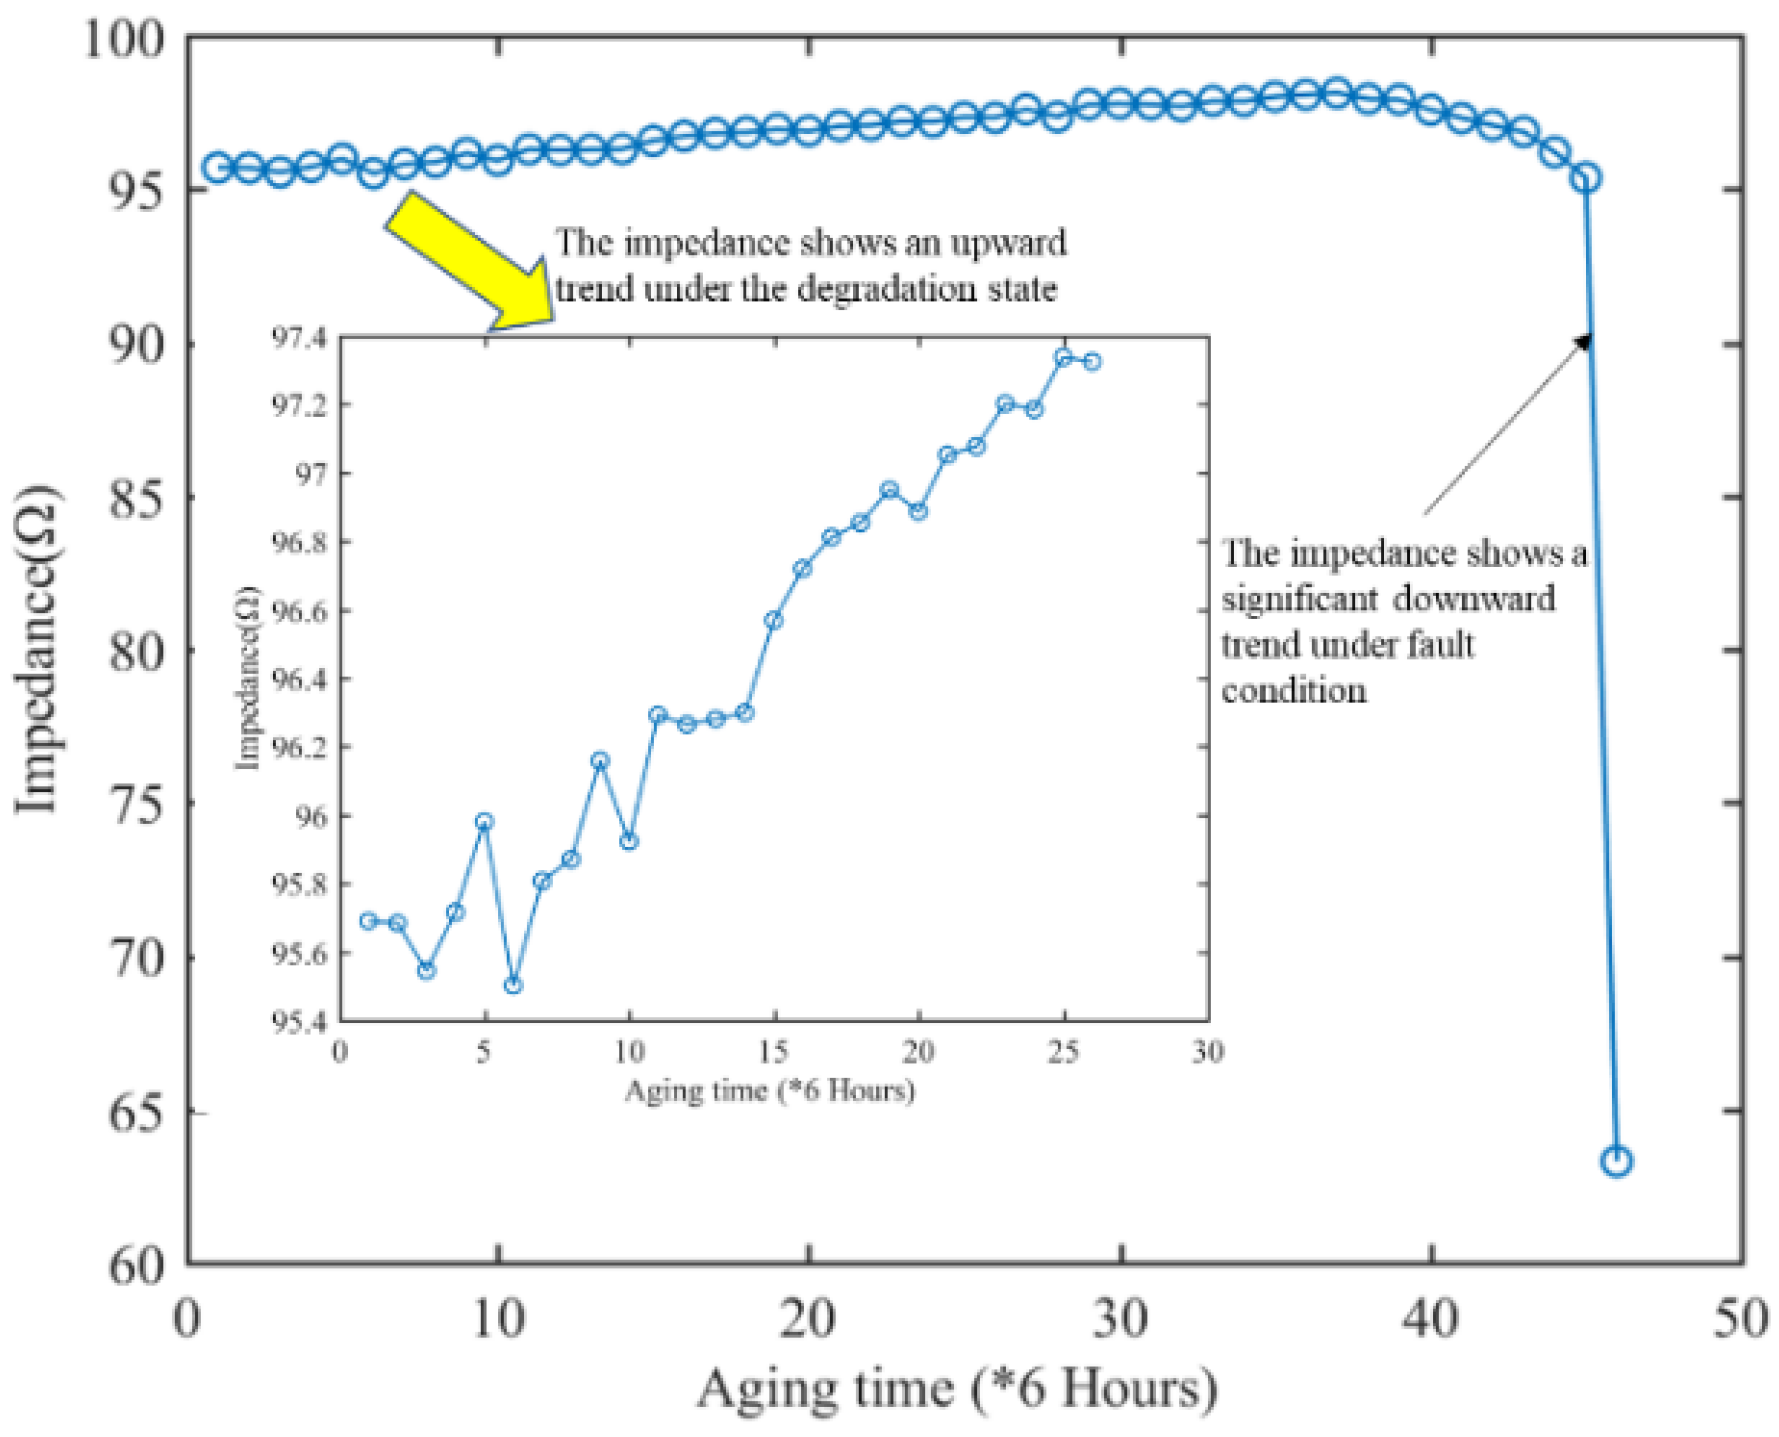
Figure 12.
Spearmen correlation coefficient of electromagnetic coil from 50Hz to 26KHz.
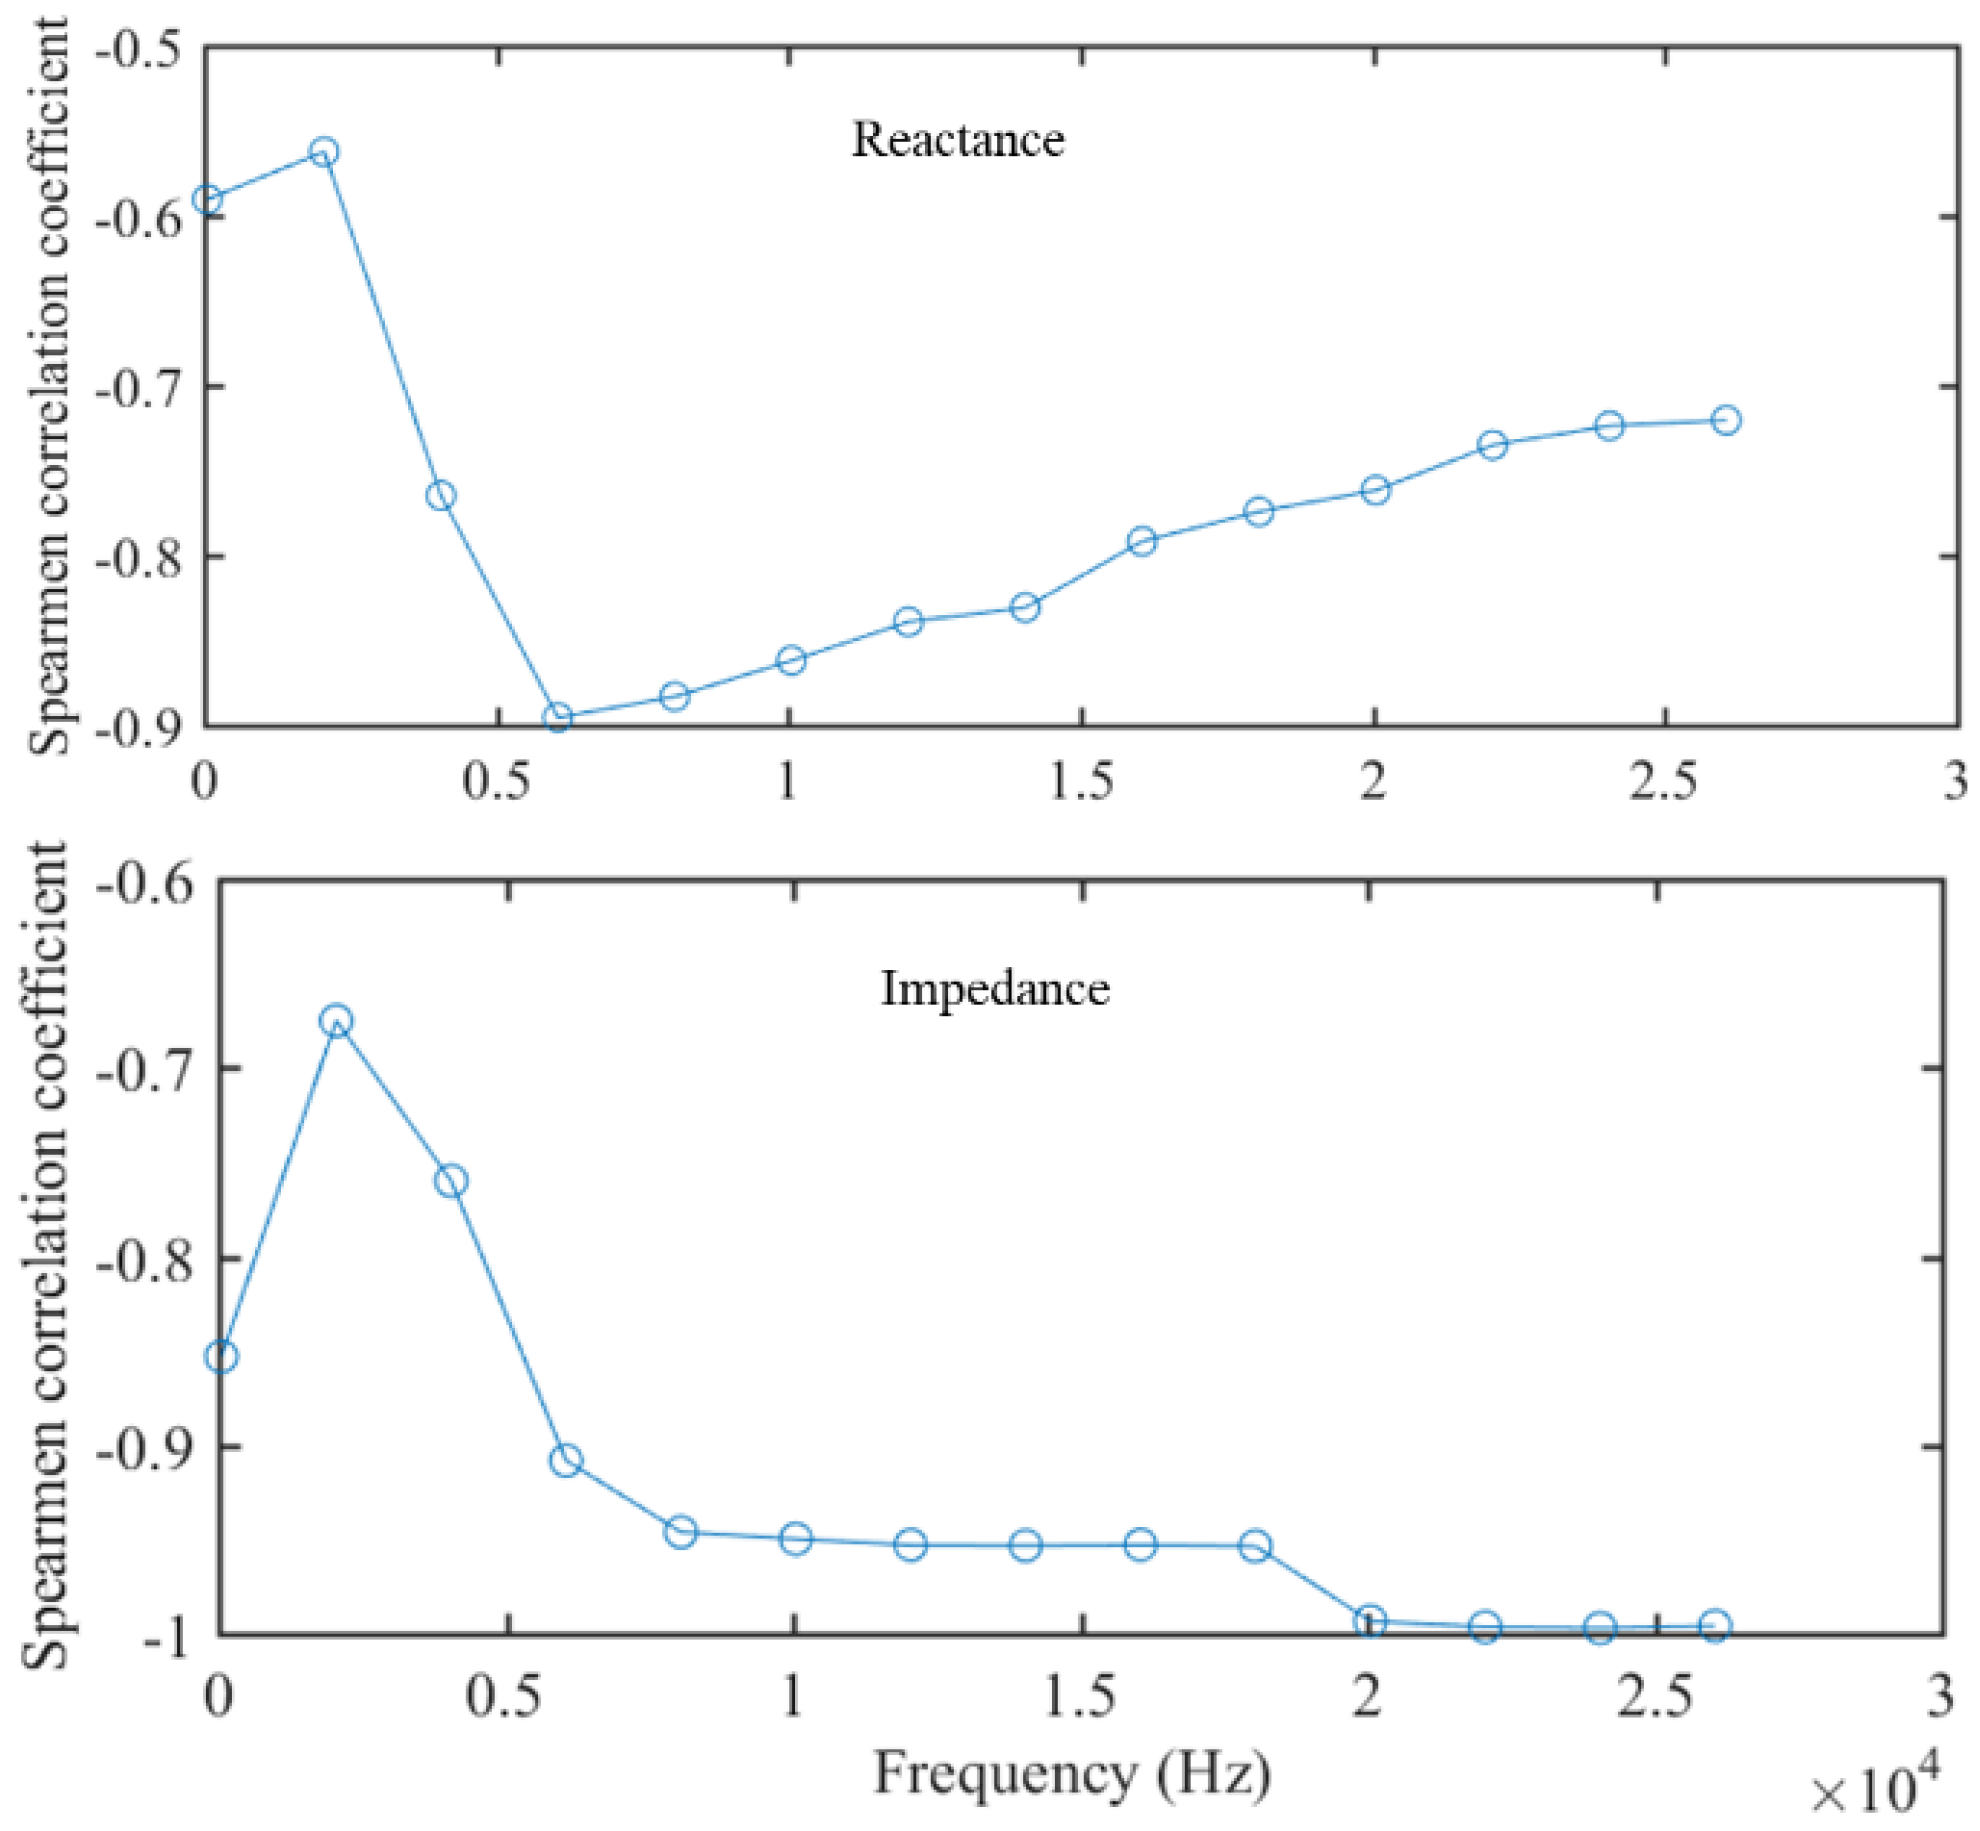
Figure 13.
MD degradation trend based on five characteristics.
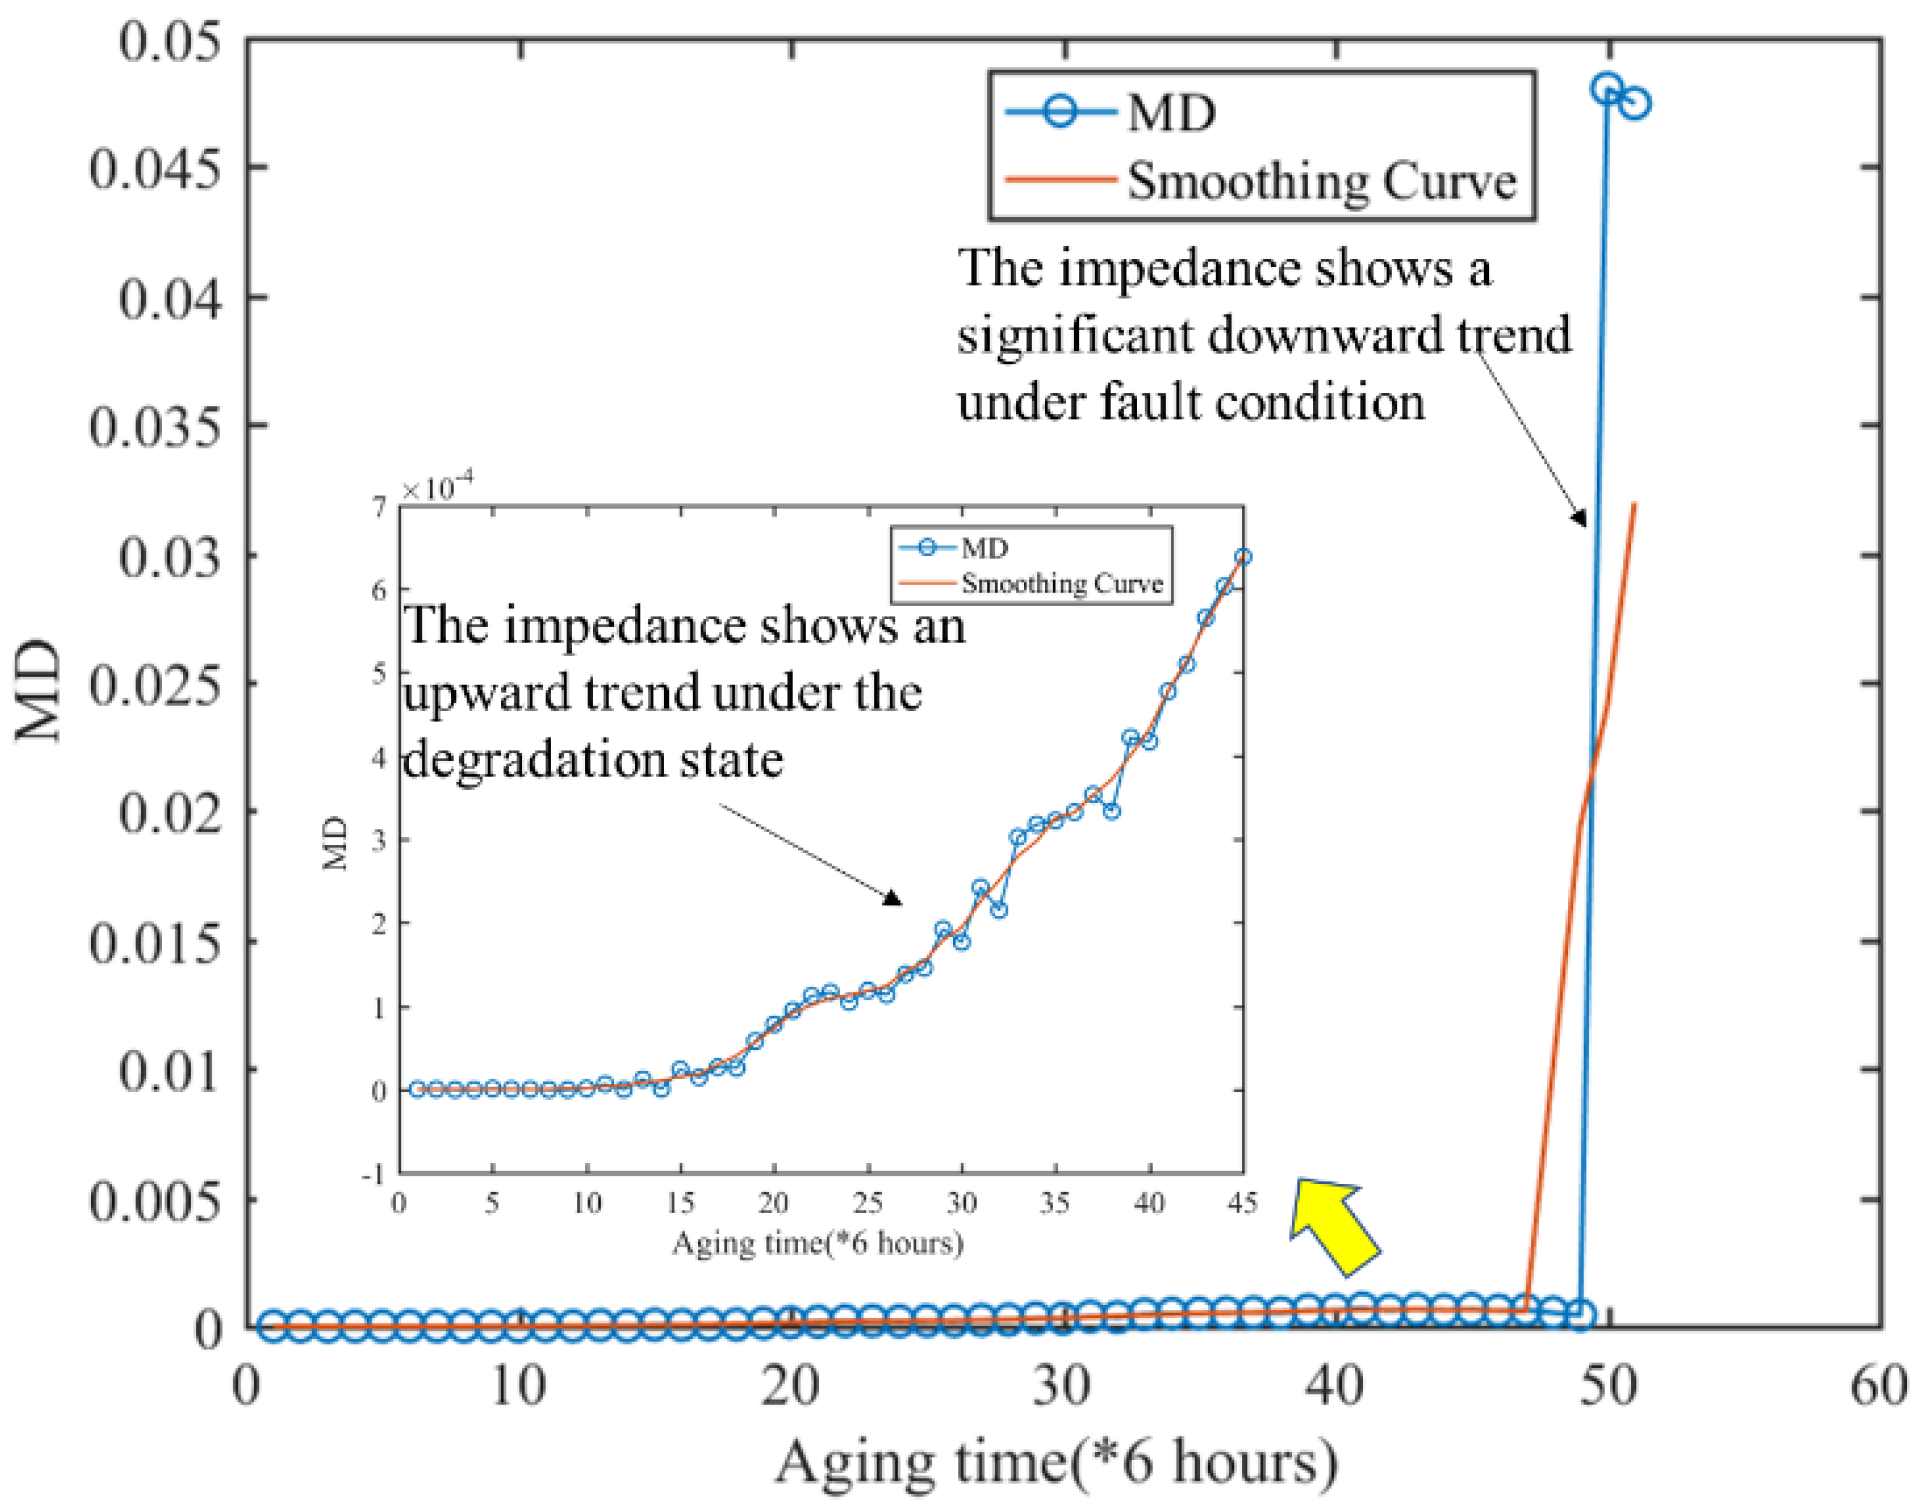
Figure 14.
Threshold determination process of electromagnetic coil insulation fault detection based on Box-Cox transform.
Figure 14.
Threshold determination process of electromagnetic coil insulation fault detection based on Box-Cox transform.
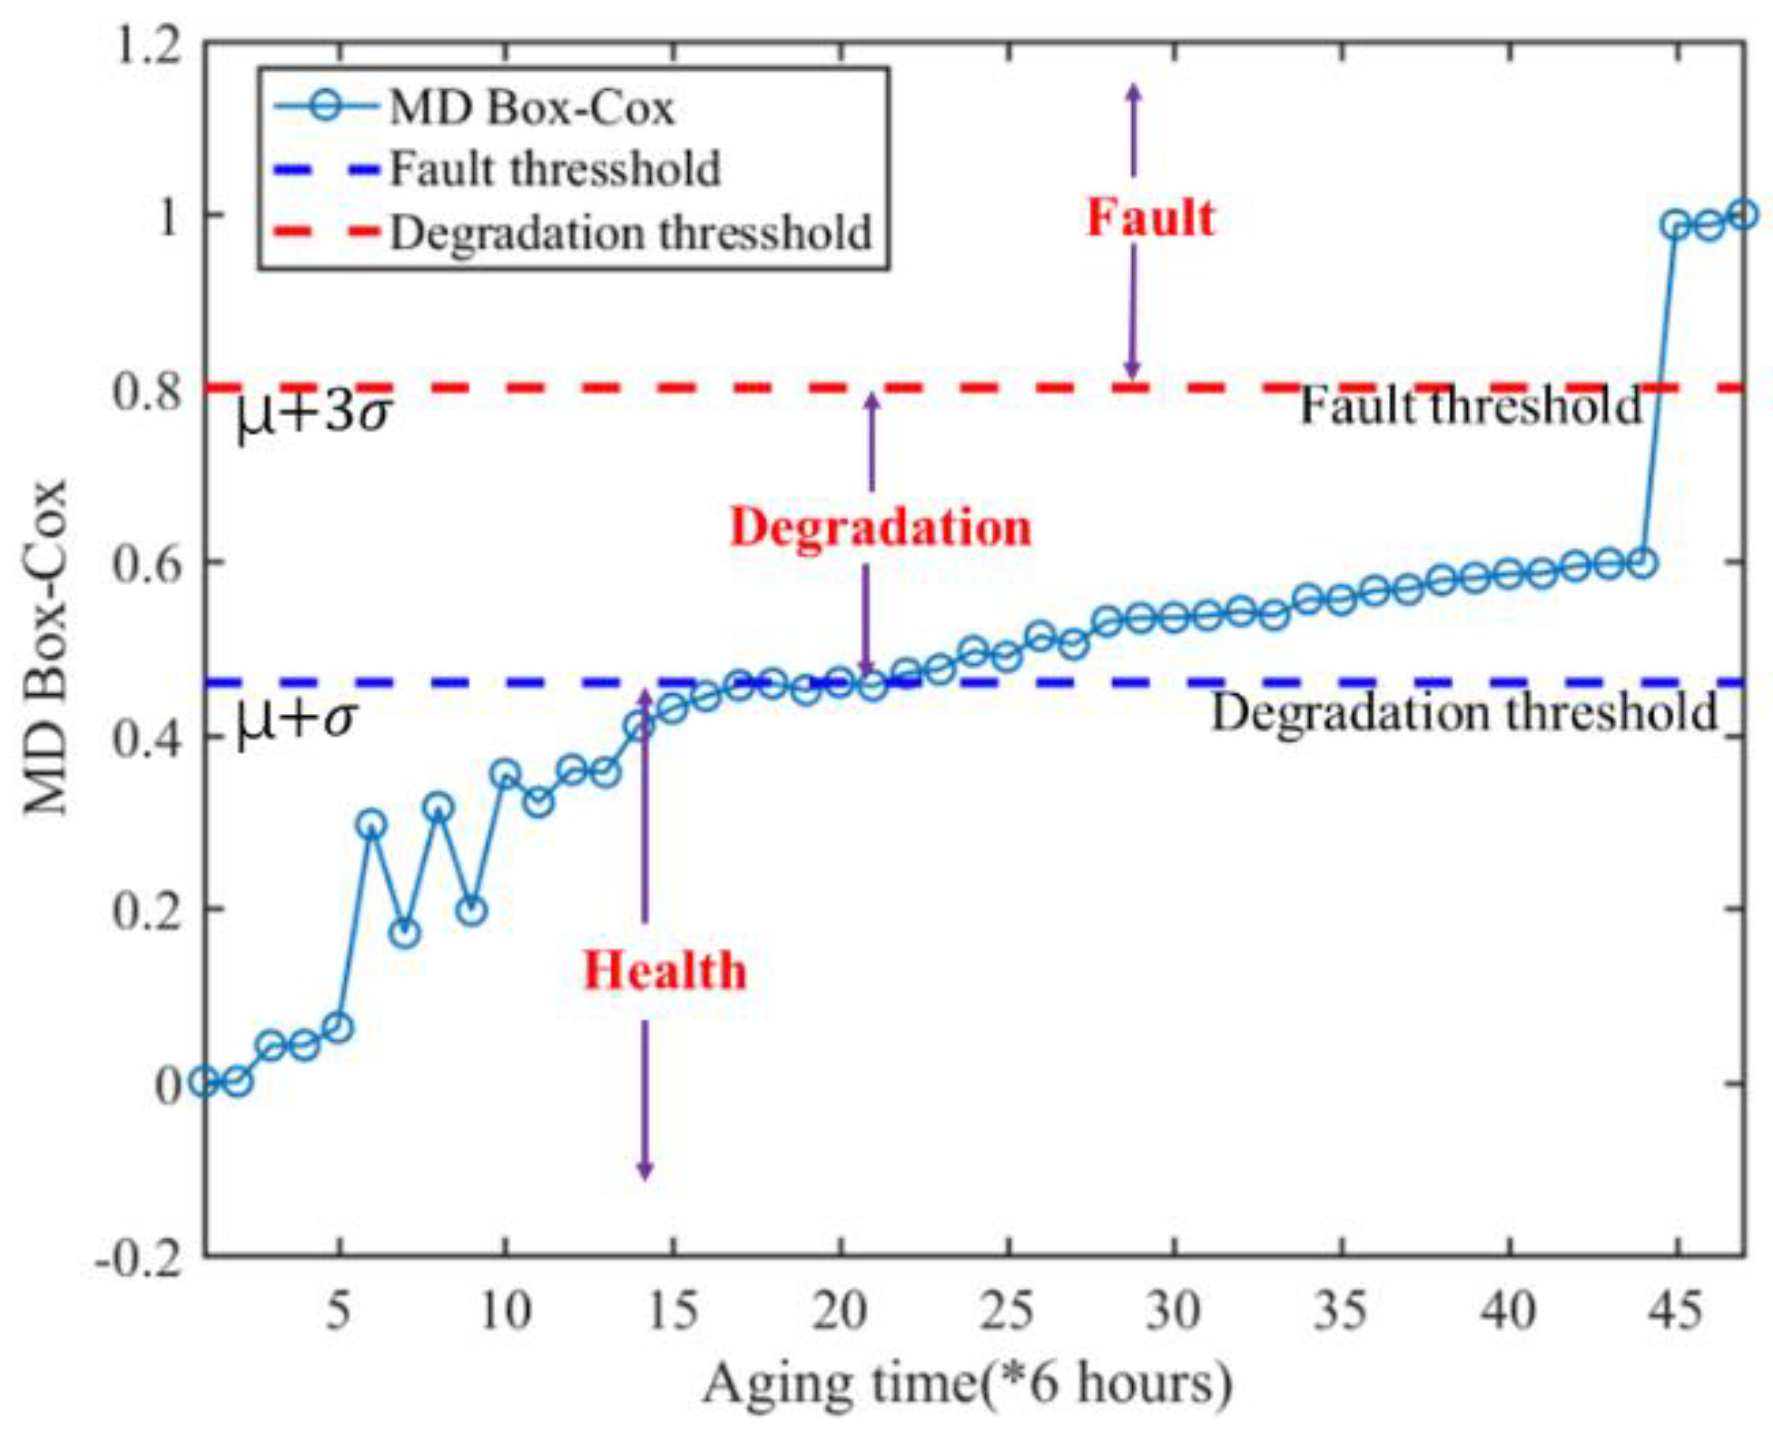

Table 1.
Specimen information.
| Symbol | Performance parameter |
|---|---|
| Nominal coil resistance | 5.35Ω (25 °C) |
| Magnet wire insulation class | Class B (130 °C) |
| Insulation composition | Polyester |
| Voltage rating | 24 VDC |
| temperature | −5 °C−120 °C |
Table 2.
Part of DCR collected by LCR meter.
| Cy-cle | DCR1 (Ω) |
DCR2 (Ω) |
DCR3 (Ω) |
DCR4 (Ω) |
DCR5 (Ω) |
DCR6 (Ω) |
DCR7 (Ω) |
DCR8 (Ω) |
DCR (Ω) |
|---|---|---|---|---|---|---|---|---|---|
| 1 | 5.35305 | 5.35613 | 5.35898 | 5.35421 | 5.35999 | 5.35334 | 5.35509 | 5.35898 | 5.35622 |
| 5 | 5.35342 | 5.35737 | 5.35677 | 5.35442 | 5.35431 | 5.35492 | 5.35663 | 5.3501 | 5.35474 |
| 10 | 5.35158 | 5.35312 | 5.35316 | 5.35119 | 5.35182 | 5.35279 | 5.35718 | 5.35717 | 5.35350 |
| 15 | 5.35187 | 5.35742 | 5.35061 | 5.35983 | 5.35212 | 5.35376 | 5.35734 | 5.35345 | 5.35455 |
| 20 | 5.3580 | 5.35753 | 5.356 | 5.35492 | 5.3517 | 5.35703 | 5.35895 | 5.35948 | 5.35670 |
| 25 | 5.35391 | 5.35923 | 5.35407 | 5.35394 | 5.35885 | 5.35917 | 5.35616 | 5.35949 | 5.35685 |
| 30 | 5.35856 | 5.35514 | 5.3503 | 5.35368 | 5.35638 | 5.3516 | 5.35582 | 5.35961 | 5.35513 |
| 35 | 5.35225 | 5.35256 | 5.35962 | 5.35043 | 5.35385 | 5.35091 | 5.3538 | 5.35378 | 5.35343 |
| 40 | 5.35092 | 5.35279 | 5.35204 | 5.35407 | 5.35691 | 5.35100 | 5.35476 | 5.3552 | 5.35346 |
| 42 | 5.35577 | 5.35407 | 5.35268 | 5.35245 | 5.35769 | 5.35582 | 5.35657 | 5.35877 | 5.35547 |
| 43 | 5.35137 | 5.35700 | 5.35620 | 5.35859 | 5.35961 | 5.35033 | 5.35958 | 5.35067 | 5.35541 |
| 44 | 5.35601 | 5.35412 | 5.35969 | 5.35930 | 5.35472 | 5.35727 | 5.35878 | 5.35221 | 5.35651 |
| 45 | 5.31120 | 5.31484 | 5.31291 | 5.31991 | 5.31050 | 5.31002 | 5.31539 | 5.31847 | 5.31415 |
Table 3.
Part of the data collected by LCR meter under the frequency of 314050 Hz.
| Cycle | Frequency (Hz) | Impedance (Ω) | Reactance (Ω) | Inductance (H) |
|---|---|---|---|---|
| 1 | 314050 | 718.347 | 428.8184 | 0.000218 |
| 5 | 314050 | 675.246 | 426.8897 | 0.000219 |
| 10 | 314050 | 591.119 | 424.60510 | 0.000217 |
| 15 | 314050 | 531.931 | 411.14700 | 0.000214 |
| 20 | 314050 | 492.91 | 396.3493 | 0.000212 |
| 25 | 314050 | 475.131 | 388.4816 | 0.000218 |
| 30 | 314050 | 437.415 | 368.4161 | 0.000218 |
| 35 | 314050 | 415.732 | 355.6835 | 0.000215 |
| 40 | 314050 | 382.99 | 331.9688 | 0.000209 |
| 42 | 314050 | 336.03 | 290.3824 | 0.000208 |
| 43 | 314050 | 309.479 | 257.6583 | 0.000212 |
| 44 | 314050 | 286.385 | 183.1177 | 0.000202 |
| 45 | 314050 | 242.866 | 183.6419 | 0.000124 |
Disclaimer/Publisher’s Note: The statements, opinions and data contained in all publications are solely those of the individual author(s) and contributor(s) and not of MDPI and/or the editor(s). MDPI and/or the editor(s) disclaim responsibility for any injury to people or property resulting from any ideas, methods, instructions or products referred to in the content. |
© 2024 by the authors. Licensee MDPI, Basel, Switzerland. This article is an open access article distributed under the terms and conditions of the Creative Commons Attribution (CC BY) license (http://creativecommons.org/licenses/by/4.0/).
Copyright: This open access article is published under a Creative Commons CC BY 4.0 license, which permit the free download, distribution, and reuse, provided that the author and preprint are cited in any reuse.


