
Submitted:
25 October 2024
Posted:
31 October 2024
You are already at the latest version
Abstract
This study investigated vegetable farmers’ willingness-to-pay (WTP) for private advisory services in northwestern Ethiopia. Understanding farmers' preferences for modernizing agricultural advisory services is essential for enhancing the productivity and profitability of smallholder farming. The study assessed WTP for improved advisory services using data from 393 farm households in northwestern Ethiopia. Data from discrete choice experiments were analysed using a random parameter logit model. The results revealed the existence of heterogeneity in farmers’ WTP for vegetable advisory services. Household educational status and age influenced preferences for advisory service features. Farmers preferred enhanced services with frequent visits from agricultural experts and hands-on, field assistance over digital short message service (SMS) and voice-based advice. Additionally, they were more willing to invest in services that focused on leafy vegetables than on fruity vegetables or roots and tubers. The results suggest that the push for commercializing agricultural advisory services should consider contextual differences in smallholders’ preferences.
Keywords:
mobile-based extension service
; practice-oriented extension service
; random parameter logit
; willingness-to-pay
; private agricultural advisory
; preference heterogeneity
1. Introduction
Agricultural advisory services (AAS) play a vital role in food system transformation by promoting productivity, increasing food security, improving rural livelihoods, and promoting agriculture as an engine of pro-poor economic growth (1–4). Improved AAS is especially critical in lower- and middle-income countries (LMICs) where agriculture is an engine of growth (5). The (6) defines agricultural extension as “systems that should facilitate the access of farmers, their organizations, and other market actors to knowledge, information, and technologies; facilitate their interaction with partners in research, education, agribusiness, and other relevant institutions; and assist them in developing their own technical, organizational and management skills and practices.”
Poor public agricultural extension service in African nations poses a significant obstacle to achieving productivity gains. Recent research showed that the introduction of private extension services in legume-based and cereal farming systems in countries like Ghana, Mali, Tanzania, and Niger resulted in an increase in the adoption of enhanced agricultural inputs, such as pesticides (7–11). Similarly, a study conducted in Burkina Faso found that the agricultural extension service offered by private groups was superior to the service provided by the government (12). Studies in Kenya and Cape Verde demonstrated the effectiveness of private AAS, when combined with public extension systems, in improving efficiency (13,14).
In Ethiopia, the establishment of AAS dates to the imperial regime in 1953 (15) Over the years, the publicly operated system has undergone significant changes, particularly in terms of geographic coverage. Despite its long history and increasing access in several parts of the country, research has shown that the system has struggled to keep up with evolving needs primarily due to factors such as overworked extension agents, limited collaboration with research, lack of institutional innovation, and inadequate facilities at farmer training centers (15–17).
The horticultural crops sector suffers most from inefficient AAS (3,18–20). Despite massive diet shifts in LMICs, experts encourage fruit and vegetable crops for their health and economic benefits (21–23). Many sub-Saharan African countries, including Ethiopia (24) and others with inefficient AAS, struggle to produce these essential foods. The low responsiveness of the public AAS to the diverse and dynamic needs of smallholders sustains previously ineffective management of diseases and pest outbreaks, outdated inputs and agronomic information, lack of improved storage and transportation systems, and dysfunctional markets.
Therefore, some have called for building private, responsive, and demand-driven services to address the inefficiencies created by the current public AAS (16,25). While calls for private extension gain momentum in Ethiopia, their feasibility remains questionable, especially among farmers used to free public extension. Specifically, are farmers willing to pay for private extension services to receive tailored and efficient information? How might farmers respond to such services? Previous studies in Ethiopia have alluded to farmers' willingness-to-pay (WTP) for AAS. For example, (26) found that only 10% of farmers are willing to pay for current AAS in eastern Ethiopia. Most respondents to their survey (64.2%) were favorably disposed to pay if the service was satisfying them and increased their profits (see also (27)). These findings imply low willingness in some areas but fail to address which features of AAS are demanded by farmers, especially those engaged in vegetable production. This study responds to this need by focusing on the vegetable sub-sector. The research employed a discrete choice experiment approach to examine this critical niche associated with high-end vegetable produce. The study investigated whether vegetable farmers in northwest Ethiopia are prepared to pay for a paid extension service that provides timely, adequate, and appropriate information.
2. Methods
2.1. Study area, sampling, and data
For this study, we collected data from two districts in the Amhara region of northwestern Ethiopia, Fogera and North Mecha (Figure 1). These districts, near the Lake Tana, Rib, and Koga irrigation schemes provide access to irrigation water facilities, allowing for the cultivation of a variety of vegetables, including onions, tomatoes, cabbage, and potatoes (28). We used a choice experiment approach to gather data from smallholder vegetable producers. Using a Modified Fedorov algorithm, the Ngene software generated 18-choice tasks with an efficient d-error-minimizing design (29).
Investigators interviewed the sampled household heads for the in-person survey. Two-stage random sampling was utilized to choose sample households. Initially, two vegetable-growing districts were targeted. In the second stage, our team randomly picked three kebeles from each district. The study selected 393 households from selected kebeles using systematic random sampling, ensuring sample households were proportional to kebele populations. Households from North Mecha made up 46% of the sample, while those from Fogera accounted for 54%.
2.2. Discrete Choice Experiment Design
The choice experiments assume that a service or policy links to attributes and attribute levels (30). Investigators asked sample respondents to choose among various competing alternatives, such as different vegetable advisory services. Identifying relevant attributes and levels is vital for designing a stated preference study. Our approach determined the critical features of vegetable advisory services based on preference elicitation research on extension services and on advice from horticulture specialists (31–34). Accordingly, the main attributes of the vegetable advisory service were identified as the frequency of advisory service, the advisory knowledge/information exchange approach, the types of vegetables covered, and the service fee in Ethiopian currency (ETB; Birr) expressed in purchasing power parity for non-OECD countries (PPP1 of 14.17). We developed three alternatives for the choice experiment, two vegetable extension services, and the option to refuse service. Respondents were asked to indicate their preferred alternatives in the choice experiment.
Of the five vegetable advisory attributes included in the experimental design, three had three levels, one had four, and the remaining had two. We designed the choice sets using NGENE software, resulting in 18 choice sets. The sets were grouped into three blocks, each with six choice sets, which were randomly provided to respondents. The number of choice sets was limited to six to avoid response fatigue. A single respondent was presented with six choices out of the 18 in the survey. Hence, 393 respondents generated 7074 observations (see Table 1 and Table 2).
The discrete choice experiment (DCE) attributes and their levels include fruity vegetables (FV), leafy vegetables (LV), and roots and tubers (R&T); ETB stands for Ethiopian birr, and P is the price.
2.3. Empirical Strategy
Random utility theory (35) and Lancaster's theory of characteristics(36) are the theoretical foundations for DCE. Our approach assumes the farmer will choose the vegetable advisory service alternative that provides the highest level of utility. This choice depends on the properties or attributes of the options provided and the characteristics of the individual making the choices.
Decision makers (farmers in this case) demonstrate their preferences for specific attributes and their willingness to accept trade-offs for these attributes embedded in the alternatives by choosing one alternative over another (37). Following previous research (38,39), we define a latent variable Vnjs*, as an indirect utility function associated with selecting alternative j by farmer n from a given set of choices. Consequently, farmer n is provided with K possible alternatives within a choice set s. Producers are presumed to optimize their utility in every conceivable scenario, commonly referred to as a choice set. Thus:
farmer n will choose alternative j if >∀ K ≠ j. In Eq. 1, actual utility is observed through the utility maximizing choice , but indirect utility is not directly observable. Indirect utility is assumed to be linear, whereas marginal utility is monotonic (i.e., not increasing nor decreasing), yielding corner solutions in which one choice is selected (40,41). Based on this assumption, the utility function of farmer n can be written as
Where represents the vector of attributes of each choice for the jth alternative observed by farmer n, β is the vector of parameters that explain the influence each attribute has on the choice (e.g., frequency of advisory service), and is the unobserved (stochastic) component of utility, independent of the observed components (i.e., X) and equally distributed across individuals and choices. The unobserved component reflects the hypothesis that unobserved variations and errors occur in a farmer’s preference for an alternative in any given choice set.
The random parameter logit model allows us to examine farmers’ preferences and willingness to improve vegetable extension services by varying randomly assigned attributes. (Hensher et al., 2003) used this model to evaluate the heterogeneity of choices among individuals. The model shows which attribute preferences are associated with specific types of farmers (e.g., male and female). The probability that farmer n chooses alternative j in choice set s is assumed to be(42)
where is the marginal utility parameter at various attribute levels. Λ refers to the parameters that characterize the distribution of random parameters, such as the mean and covariance of β (43). In this study, we specify the parameters (i.e., the attributes of vegetable advisory services) and their respective attribute levels. In Eq. 3, the probability was numerically approximated using a maximum-likelihood simulation. The coefficients corresponding to each attribute were assumed to follow a normal distribution. By doing so, their sign can be either positive or negative, indicating preferences for each attribute. The random parameter logit model was estimated using Stata 15.
Because of the non-cardinal nature of utility, the coefficients generated by a random parameter logit (RPL) have a limited economic interpretation(41). To gain insights into the behavior of sampled individuals, economic trade-offs are calculated by dividing non-monetary attributes (e.g., types of vegetables in the vegetable advisory service) by monetary ones, such as service fee (44).
The values indicate a positive, negative, or null WTP ratio. Instead of giving everyone an identical value for all their traits, the RPLs show whether the coefficients for each person follow a testable distribution (42). In this study, it is defined as the additional amount of money a farmer is willing to pay for a marginal change in the vegetable advisory service(45). When an attribute parameter has a positive ratio, it means that people are ready to pay more for an attribute that increases their utility — more payment for practical farm advice, for example (46). The monetary cost that people are willing to bear to accept a modification to a feature that reduces its value may be represented as a negative ratio (47).
3. Results
3.1. Characteristics of Sample Households
Table 3 provides an overview of the demographic and socioeconomic characteristics of the sample households. Almost all household heads (97%) were male, while females accounted for only 3%. The mean family size was 7.4 members, while on average, 3.8 members of the household were in the working age group of above 17 years old. The observed value was comparatively higher than the mean size of Ethiopian families (4.6) at the national level (48). The average age of the sample household heads was 44 years, while on average household heads had 23 years of agricultural experience. The age of the household heads ranged from 19 to 81 years.
Livestock ownership ranged from households with none to those with over 16 tropical livestock units (TLU). The average livestock holding was 5.2 based on the total number of households. Along the same lines, the average size of cultivated landholdings held by households in the sample is 1.2 ha, over twice as much as the national landholding, which is 0.55 ha(49). Sample households allotted an average of 0.4 ha of land for irrigated farming out of the total cultivated land, with a minimum of 0.01 ha and a maximum of 2 ha allocated to the same purpose.
Half of all heads of household sampled were unable to read and write. Of the half of household heads who could read and write, 25% had completed formal education.
household heads who could read and write, 25% had completed formal education.
3.2. Households Access to basic services
The survey assessed farmers' access to general and vegetable-specific advisory services, access to credit, membership in at least one local association (such as village savings, religious or non-religious associations, etc.), and participation in at least one activity that generates income outside farming. Forty-two percent of the households included in the sample did not make use of any of the extension services offered in their area, while the remaining 58% of the households took advantage of at least one extension service. Similarly, 34% of the households included in the sample did not receive any extension services specifically related to the production and marketing of vegetables. In comparison, 66% of the households received these services. The survey showed that 84.5 % of households had access to credit, while 58.3% of those households showed an interest in obtaining credit for vegetable production. However, less than 5% of households received credit for the agricultural production of vegetables.

Table 5.
Institutional characteristics of HH (N =393).
| Variables | Yes | No | ||
| Frequency | Percent | Frequency | Percent | |
| Access to Extension/ training | 229 | 58.27 | 164 | 41.73 |
| Access to credit | 332 | 84.48 | 61 | 15.52 |
| Membership in local association | 356 | 90.59 | 37 | 9.41 |
| Advisory service related to vegetable production and marketing | 258 | 65.65 | 135 | 34.35 |
| Credit for vegetable farming | 18 | 4.58 | 375 | 95.42 |
| Off farm participation | 78 | 19.85 | 315 | 80.15 |
3.3. Vegetable advisory service choices and preferences
The findings from the DCE data are presented in Table 6. A positive coefficient suggests a positive impact of an attribute increase on the selection of a vegetable advice service, whereas a negative coefficient indicates a negative influence. On occasions where the attribute has three discrete levels — such as the approach used for knowledge exchange (AKE) and the vegetable focus in the advisory service (TVAS) — one level is used as a comparison reference to the other levels.
For estimation purposes, the continuous variables price fee for advisory services (P) and frequency of the advisory services (FAS) were coded by their levels. However, the levels of the categorical attributes were coded as a dummy variable, where one was given for their presence and zero otherwise. Management-oriented services delivered in the field and leafy vegetable services were used as base levels for the focus of vegetable advisory services, approach of knowledge exchange, and types of vegetables in the advisory service attributes. The price attribute is fixed in the estimation. All other variables have a normal distribution. RPL was specified as a fixed or random coefficient for the attributes of vegetable extension services.
Before estimating the parameters, the choice data were checked. The inspection results showed that the opt-out alternative was chosen in approximately 0.83% of the cases, or 59 observations. The other attributes — including the focus of vegetable advisory service (MVAS), frequency of advisory service (FAS), approach of knowledge exchange (AKE), and types of vegetables in the advisory service (TVAS) —are set to random.
The results showed that the frequency of advisory service, face-to-face practice-oriented mode (on-field) of advisory, leafy vegetables focused services (the base level), and monthly advisory fee significantly influenced the type of service preferred by vegetable-producing farmers (Table 6). Advisory service features that were input delivery focused did not influence preferences. The coefficient of the fixed variable of price attribute is negative and significant at the 5% level (− 0.008), which indicates that the respondents’ preferences decrease as the price increases. This result is consistent with the theory of demand; demand increases as price decreases and vice versa.
In the study area, vegetable producers preferred frequent visits from advisory providers, at the 1% significance level. As hypothesized, vegetable producers responded to increases in advisory fees by shifting to self-management and traditional options. The negative coefficients of the advice delivered through mobile calls and SMS and the advice offered to farmers going to one-stop-shops implies that practical advisory types, accompanied by expert field-level visits, were preferred more by vegetable producers than mobile-assisted and one-stop-shop services, with 1% and 5% levels of significance, respectively. However, this result contradicts the current efforts in Ethiopia to replace field-level advisory visits with digitally assisted services.
Research conducted in northern Ethiopia has shown that farmers are willing to pay for mobile-based advisory services Abebe (2023). However, compared to face-to-face advisory services, the research results indicate that farmers prefer practice-oriented face-to-face advice.
Moreover, the significant standard deviations associated with random parameters indicate unobserved sources of preference heterogeneity in the sample. The RPL model results also indicated that each variable exhibited a preference for heterogeneity depending on whether the variable had statistically significant standard deviations. Here, advice delivered by farmers going to a one-stop-shop is not statistically significant. Other attributes are significant at the 1% level, such as advice delivered through mobile calls, SMS frequency of the advisory services, the focus of the advisory (which is input delivered focus), the type of vegetable (root type), and fruit type vegetable attributes. This result indicates that the attributes exhibit preference heterogeneity. However, the insignificant standard deviation for the variable on farmers going to the one-stop-shops implies that all farm households, regardless of their socioeconomic background, agree that the one-stop-shop extension service has no more important vegetable extension service attributes than the other attributes.
3.4. Heterogenous effects on choices of vegetable advisory services: Interaction of mixed logit results
The RPL model was estimated by using the included interaction terms. Table 7 shows the heterogeneous effects on advisory service choice with respect to socioeconomic status based on the mixed logit/random parameter logit model. These interaction terms allowed us to consider that people with different demographic, socioeconomic, and attitudinal variables may have different utilities concerning vegetable-producing advisory services. The interaction between the frequency of the advisory service attribute and gender is positive and statistically significant at the 5% level (Table 7). This finding indicates that male-headed household farmers have a higher preference for frequent vegetable extension advisories.
The interaction between the frequency of advisory services and age of the household head was negative and statistically significant at the 10% level of significance. As farmers grow older, their preferences for more frequent vegetable advisory services become lower than those of the youngest. However, the interaction between education status and frequency of advisory services is positive and statistically significant at the 5% level. This result shows that farmers who have received education prefer frequent vegetable advisory services.
The interaction between education and advisory services delivered through mobile devices is negative and statistically significant at the 1% level, implying that farmers who have received education are less concerned about advisory services delivered through mobile devices. This result indicates that farmers with more education prefer the field-visit mode of deliveries by field experts than receiving information over mobile phones.
The interaction between extension training and root-type vegetable advisory attributes had a negative significance at 1%, indicating that farmers who received extension training had less preference for root and tuber-type vegetable extension services than those who did not receive extension training. However, the statistically significant standard deviation estimates of the interaction between those attributes and variables suggest that the level of heterogeneity of the attribute varies beyond what can be explained by the variables.
3.5. Estimation of marginal willingness-to-pay for advisory services
Table 8 displays the marginal willingness to pay (MWTP) values expressed in Ethiopian birr, which indicate the intensity of respondents' preferences for each attribute. Respondents anticipated that they would obtain less value from an advisory visit for vegetable expansion with a lower MWTP. By contrast, a higher MWTP for the same characteristic suggests that respondents anticipate greater utility. One indicator of limited WTP was the frequency of the advisory service attribute (1.89 visits). The results showed that farmers are not willing to pay higher margin for frequent advisory visits after they started obtaining the required vegetable advisory services. Compared to the leafy type of vegetable, farmers would rather pay a higher margin for acquiring the advisory service for fruity vegetables is 203.94 ETB, and for root-type vegetables, it is 120.89 ETB.
The study result suggests that the inclusion of preferred features of advisory services can improve the acceptance and potential of future vegetable productivity. Compared to input-focused advising services, vegetable producers in the Mecha and Fogera regions are prepared to spend five and eight times as much for fruit-based and root-based services, respectively, as for management-focused ones. For mobile advisory services, the average WTP was -119.39, whereas for one-stop shop services, it was -50. Based on the field expert visit results, farmers did not want certain traits as much as they did at the basic level. In addition, the findings showed that farmers were not very interested in the frequency of the practice, as shown by their relatively low WTP, even after they began obtaining the required advising information and practices. Advising services that concentrate on the root and fruit types of vegetables and those that are practice-based tend to have a greater WTP from vegetable growers.
4. Discussion
Agriculture remains the backbone of many sub-Saharan African countries, as it contributes to maintaining food security, generating employment opportunities, producing foreign exchange, and providing raw materials for industries (51–53). Therefore, food systems are transformative for most countries in the region. However, the accessibility of agricultural information to smallholder farmers, who form the sector's core, remains a critical barrier (54,55) to ensuring equity and inclusivity in food systems transformation. Many regional governments prioritize identifying the optimal conditions to ensure that the right information reaches farmers at the right time to aid production decisions. The Ethiopian government has struggled to facilitate access to information through extension, prompting calls for private extension to expand its reach to as many farmers as possible. Therefore, this study examined the conditions under which smallholders in Ethiopia are willing to pay for privately provided extension services.
The choice experiment showed the heterogeneity in farmers’ WTP for extension. As anticipated through prior literature on Ethiopian farmers’ WTP for extension services (27,50,56), vegetable farmers showed some WTP for private extensions delivered through various media. However, a notable finding of the study was the conditionality associated with willingness. Specifically, the results indicate that farmers’ willingness is moderated by the elements of the service, such as the mode of delivery, cost of the service, and type of information provided. There was no blanket acceptance or WTP for extension services. The findings of this study align with previous research (16), which emphasizes the need to enhance agricultural extension services in Ethiopia by offering specialized training tailored to the unique situation. Hence, efforts to establish private extension will likely fail without paying attention to the differences in farmers' preferences (57). This argument is further supported by the propensity of farmers to opt out of services when they are not designed to meet the right conditions.
Furthering the understanding of the specificities of farmers’ WTP is the effect of socioeconomic (age and education) interaction with extension service attributes. Specifically, there was a significant association between advisory service frequency and age. As farmers grow older, their preferences for more frequent vegetable advisory services become lower than those of younger farmers. The age element, consistent with prior results (27,56,58), could be attributed to experiences gained from farming as people aged. Farmers gain more experience with age, reducing their need for external knowledge and information. However, as climate change and many other shocks continue to emerge, these relationships can be tested over time and must be considered an important topic for research. Novel research must be conducted to understand how emergent shocks, with the risk of undermining the existing knowledge older farmers, can influence responses to external knowledge. The results show a significant association between educational status and the frequency of advisory services that farmers require and are willing to pay. Specifically, educated farmers prefer vegetable advisory services more frequently. Educated farmers may know more about the vulnerability of vegetables to different diseases during production and the importance of extension services for reducing this vulnerability(58). However, the relationship between education, frequency, and WTP was not generic for all types of extension services. The negative result of the interaction between education and advisory services delivered through mobile phones indicated that farmers with more education prefer the field visit mode of delivery. This critical finding, when applied to a general sample, is worth discussing further.
Farmers were generally more willing to pay for advisory services delivered by expert field-level visits than for mobile-assisted and one-stop-shop services, with 1% and 5% levels of significance, respectively. The potential source of this might be inadequate digital accessibility resulting from the substandard digital infrastructure experienced by smallholder farmers in Ethiopia (59). This result is essential for the broader efforts to enhance access to advisory services in Africa and Ethiopia. Governments and international development entities in the last decade have favored and promoted widespread digitalization of agriculture, with extension and advisories at the center of such programs (60–62) Digital extensions and advisories aim to reach hard-to-reach farmers left out of the overstretched public extension schemes. Ironically, some have questioned whether such digital efforts are truly built in the interests of farmers. For example, (63) found that farmers tend to prefer traditional face-to-face meetings. There are several reasons for this preference. Farmers will not benefit from the delivery of digital extensions in languages (mostly English) inaccessible to smallholders or when that information is poorly delivered (one-way communication). Digital extension services suffer when farmers lack the knowledge to take advantage of them, among many other shortcomings of digital extension(62–64). While this finding casts doubt on the feasibility and acceptability of digital extension for vegetable farmers in Ethiopia, it is essential to note that it does not entirely discount the value that such services may offer farmers.
Finally, farmers’ WTP for private extension depends on product/crop lines. Specifically, vegetable producers in the Mecha and Fogera areas were prepared to spend five and eight times more, respectively, for extension advice on leafy vegetables (such as lettuce and cabbage) than on root and fruit vegetables (such as potatoes). The result implies that improved vegetable extension services with a focus on leafy vegetables (i.e., the comparison base) are considered desirable advisory services. Although the reason for these preferences was not apparent from the experiment, it could be based on the variations in the susceptibility of these different crops to disease risk and the agronomic care required. According to one case study (65) , leafy vegetables are increasingly exposed to new pathogens, such as Alternaria leaf spot and Fusarium wilt that attack basil and lettuce vegetables, require constant adaptation and new knowledge (65–67). Whatever the reason for this finding, extension services should be designed for the specific needs of farmers rather than blanket services that do not consider differences in preferences.
5. Conclusions
This study found heterogeneity in farmers’ WTP for private, improved extension services, with the type of crop information (root vs. leafy vegetables) and mode of extension delivery (face-to-face vs. digital) among some critical differences that impact farmers’ preferences. Farmers emphasized the importance of in-person extension service delivery. Younger and educated farmers showed more WTP for frequent private extensions, underscoring socioeconomic variation, including age and level of education.
The results provide critical insights into the future potential design and implementation of private extension services in Ethiopia and beyond. Farmers’ WTP for private extension must not be viewed blindly, regardless of heterogeneities within the smallholder sector and population. Instead, any attempt to improve such a service must be discussed in the context of questions such as what type of extension farmers demand. How can an extension service be delivered? What type of products will such a service be based on? Specialists must design extension services for the specific needs of farmers, rather than blanket programs that ignore differences in preferences.
References
- Yitayew A, Abdulai A, Yigezu YA. The effects of advisory services and technology channeling on farm yields and technical efficiency of wheat farmers in Ethiopia. Food Policy. 2023 Apr 1;116.
- Lartey VC, Antwi S, Boadi EK. The Relationship between Liquidity and Profitability of Listed Banks in Ghana. International Journal of Business and Social Science. 2013;4(3):48–56.
- Buehren N, Goldstein M, Molina E, Vaillant J. The impact of strengthening agricultural extension services on women farmers: Evidence from Ethiopia. Agricultural Economics (United Kingdom). 2019 Jul 1;50(4):407–19.
- Elias A, Nohmi M, Yasunobu K, Ishida A. Effect of Agricultural Extension Program on Smallholders’ Farm Productivity: Evidence from Three Peasant Associations in the Highlands of Ethiopia. Journal of Agricultural Science. 2013;5(8).
- Danso-Abbeam G, Ehiakpor DS, Aidoo R. Agricultural extension and its effects on farm productivity and income: Insight from Northern Ghana. Agric Food Secur. 2018;7(1).
- FAO Food and Agriculture Organization. Ethiopia Country Brief. Addis Ababa ; 2010.
- Tabe-Ojong MP, Nyam YS, Lokossou JC, Gebrekidan BH. Farmer advisory systems and pesticide use in legume-based systems in West Africa. Science of the Total Environment. 2023;867.
- Abed R, Sseguya H, Flock J, Mruma S, Mwango H. An evolving agricultural extension model for lasting impact: How willing are tanzanian farmers to pay for extension services? Sustainability (Switzerland). 2020;12(20).
- Jensen PF, Prowse M, Larsen MN. Smallholders’ demand for and access to private-sector extension services: A case study of contracted cotton producers in northern Tanzania. Journal of Agrarian Change. 2019;19(1).
- Yegbemey RN, Yabi JA, Heubach K, Bauer S, Nuppenau EA. Willingness to be informed and to pay for agricultural extension services in times of climate change: the case of maize farming in northern Benin, West Africa. Clim Dev. 2014;6(2).
- Bakang JEA, Wongnaa CA, Tham-Agyekum EK, Fatimatu S, Obeng JA, Nsafoah EB, et al. Determinants of maize farmers willingness to pay for private extension services in Ejisu municipality, Ghana. Heliy [Internet]. 2024 Sep 15 [cited 2024 Sep 30];10(17):e37464. Available from: https://ui.adsabs.harvard.edu/abs/2024Heliy..1037464B/abstract.
- Sylla AY, Mahama Al-Hassan R, Egyir IS, Anim-Somuah H. Perceptions about quality of public and private agricultural extension in Africa: Evidence from farmers in Burkina Faso. Cogent Food Agric. 2019;5(1).
- Muyanga M, Jayne TS. Private Agricultural Extension System in Kenya: Practice and Policy Lessons. The Journal of Agricultural Education and Extension. 2008;14(2):111–24.
- Conradie B, Galloway C, Renner A. Private extension delivers productivity growth in pasture-based dairy farming in the Eastern Cape, 2012–2018. Agrekon. 2022;61(2).
- Berhane G, Ragasa C, Abate GT, Assefa TW. The state of agricultural extension services in Ethiopia and their contribution to agricultural productivity. ESSP Working Paper. 2018.
- Davis KE, Babu SC, Ragasa C. Agricultural extension: Global status and performance in selected countries [Internet]. 2020 [cited 2024 Mar 25]. Available from: https://books.google.com/books/about/Agricultural_extension_Global_status_and.html?
- Leta G, Kelboro G, Stellmacher T, Hornidge AK. The agricultural extension system in Ethiopia: Operational setup, challenges and opportunities. ZEF Development Studies. 2017;(158).
- Aliyi I, Faris A, Ayele A, Oljirra A, Bayessa M. Profitability and market performance of smallholder vegetable production: evidence from Ethiopia. Heliyon. 2021 Sep 1;7(9):e08008.
- Gebru KM, Leung M, Rammelt C, Zoomers A, van Westen G. Vegetable business and smallholders’ food security: Empirical findings from Northern Ethiopia. Sustainability (Switzerland). 2019 Jan 31;11(3).
- Gebremariam YA, Dessein J, Wondimagegnhu BA, Breusers M, Lenaerts L, Adgo E, et al. Undoing the development army: a paradigm shift from transfer of technology to agricultural innovation system in Ethiopian extension. Environ Dev Sustain. 2023.
- Keller KL, Lehmann DR. Brands and branding: Research findings and future priorities. Marketing Science. 2006;25(6):740–59.
- Deribe H, Mintesnot A. Review on Contribution of Fruits and Vegetables on Food Security in Ethiopia. Journall of Biology, Agriculture and Healthcare. 2016;6(11).
- Wolfenden L, Barnes C, Lane C, McCrabb S, Brown HM, Gerritsen S, et al. Consolidating evidence on the effectiveness of interventions promoting fruit and vegetable consumption: an umbrella review. Vol. 18, International Journal of Behavioral Nutrition and Physical Activity. 2021.
- Bekele, M. Challenges and Opportunities of Marketing Fruit and Vegetables at Logia, Northeastern Ethiopia. The Case of Onion, Tomato and Banana. Journal of Marketing and Consumer Research. 2016;22:51–8.
- Uddin E, Gao Q, Mamun-Ur-Rashid MD. Crop Farmers’ Willingness to Pay for Agricultural Extension Services in Bangladesh: Cases of Selected Villages in Two Important Agro-ecological Zones. Journal of Agricultural Education and Extension. 2016;22(1):43–60.
- Tolera T, Temesgen D, Rajan DS. Factors affecting farmers ’ willingness to pay for agricultural extension services : The case of Haramaya District, Ethiopia. Agric Sci Res. 2014;3(December):268–77.
- Temesgen D, Tola T. Determinates of small holder farmers willingness to pay for agricultural extension services : A case study from Eastern Ethiopia. 2015;10(20):2152–8.
- Kassahun B, Tegegne GEgziabher. Socio-Economic Base-Line Survey of Rural and Urban Households in Tana Sub-Basin, Amhara National Regional State [Internet]. Addis Ababa: Forum for Social Studies (FSS); 2014. Available from: www.fssethiopia.org.
- Choice Metrics. Ngene 1.2 USER MANUAL & REFERENCE GUIDE [Internet]. 2018. Available from: www.choice-metrics.
- Louviere JJ, Pihlens D, Carson R. Design of Discrete Choice Experiments: A Discussion of Issues That Matter in Future Applied Research. Journal of Choice Modelling [Internet]. 2009;4(1):1–8. Available from: www.jocm.org.
- Mugunieri GL, Omiti JM. Decentralization, community-based organizations and access to agricultural extension services in eastern Kenya. Decentralization and the Social Economics of Development: Lessons from Kenya. 2007 Jul 24;64–83.
- Tesfaye A, Hansen J, Kagabo D, Birachi E, Radeny M. Rwanda Climate Services for Agriculture: Farmers willingness to pay for improved climate services [Internet]. 2020. Available from: https://ccafs.cgiar.org/donors.
- James PA, Smart JC, Smith J, Bulling M, Beed FD, Luwandagga D. The effect of participation in the Ugandan National Agricultural Advisory Services on willingness to pay for extension services. AfJARE. 2011;6(1).
- Altobelli F, Marta AD, Heinen M, Jacobs C, Giampietri E, Mancini M, et al. Irrigation Advisory Services: Farmers preferences and willingness to pay for innovation. https://doi.org/101177/00307270211002848 [Internet]. 2021 Mar 29 [cited 2024 Mar 23];50(3):277–85. Available from: https://journals.sagepub.com/doi/abs/10.1177/00307270211002848?journalCode=oa.
- List JA. Using Choice Experiments to Value Non-Market Goods and Services University of Maryland value with random utility theory ( McFadden , 1974 ). 2002;(June).
- Lancaster KJ. A New Approach to Consumer Theory. Journal of Political Economy [Internet]. 1966;74(2):132–57. Available from: http://www.journals.uchicago.edu/doi/10.1086/259131.
- Altobelli F, Lall U, Dalla Marta A, Caracciolo F, Cicia G, D’urso G, et al. Willingness of farmers to pay for satellite-based irrigation advisory services: a southern Italy experience. 2018 [cited 2024 Mar 23]; Available from: https://doi.org/10.1017/S0021859618000588.
- Schaafsma M, Ferrini S, Turner RK. Assessing smallholder preferences for incentivised climate-smart agriculture using a discrete choice experiment. Land use policy [Internet]. 2019 [cited 2024 Mar 27];88. Available from: https://doi.org/10.1016/j.landusepol.2019.104153.
- Teferi ET, Kassie GT, Pe ME, Fadda C. Are farmers willing to pay for climate related traits of wheat? Evidence from rural parts of Ethiopia. Agric Syst [Internet]. 2020;185(August):102947. Available from: https://doi.org/10.1016/j.agsy.2020.102947.
- Useche P, Barham BL, Foltz JD. Trait-based adoption models using ex-ante and ex-post approaches. In: American Journal of Agricultural Economics. 2013.
- Silberg TR, Richardson RB, Lopez MC. Maize farmer preferences for intercropping systems to reduce Striga in Malawi. Food Secur. 2020 Apr 1;12(2):269–83.
- Train, K. Discrete choice methods with simulation, second edition. Vol. 9780521766, Discrete Choice Methods with Simulation, Second Edition. Cambridge University Press; 2009. 1–388 p.
- Waldman KB, Ortega DL, Richardson RB, Snapp SS. Estimating demand for perennial pigeon pea in Malawi using choice experiments. Ecological Economics. 2017;131.
- Knowler D, Philcox N, Nathan S, Delamare W, Haider W, Gupta K. Assessing prospects for shrimp culture in the Indian Sundarbans: A combined simulation modelling and choice experiment approach. Mar Policy. 2009;33(4).
- Gibson JM, Rigby D, Polya DA, Russell N. Discrete Choice Experiments in Developing Countries: Willingness to Pay Versus Willingness to Work. Environ Resour Econ (Dordr) [Internet]. 2016 Dec 1 [cited 2021 Dec 13];65(4):697–721. Available from: https://link.springer.com/article/10.1007/s10640-015-9919-8.
- Nahuelhual L, Loureiro ML, Loomis J. Using random parameters to account for heterogeneous preferences in contingent valuation of public open space. Vol. 29, Journal of Agricultural and Resource Economics. 2004.
- Rigby D, Burton M. Preference heterogeneity and GM food in the UK. European Review of Agricultural Economics. 2005;32(2).
- CSA. Population Projection of Ethiopia for All Regions at Woreda Level from 2014-2017. Addis Ababa, Ethiopia; 2017.
- CSA. Agricultural sample survey. Volume I, Report on area and production for major crops (private peasant holdings, main season). 2017.
- Abebe A. Farmers’ willingness to pay for mobile phone-based agricultural extension service in northern Ethiopia. Cogent Food Agric [Internet]. 2023 Dec 31 [cited 2024 Mar 22];9(1). Available from: https://www.tandfonline.com/doi/abs/10.1080/23311932.2023.2260605.
- Modi R. The Role of Agriculture for Food Security and Poverty Reduction in Sub-Saharan Africa. In: The Palgrave Handbook of Contemporary International Political Economy. 2019.
- Diao X, Hazell P, Resnick D, Thurlow J. The role of agriculture in development: Implications for Sub-Saharan Africa. Research Report of the International Food Policy Research Institute. 2007;(153).
- Christiaensen L, Demery L, Kuhl J. The (evolving) role of agriculture in poverty reduction-An empirical perspective. J Dev Econ. 2011;96(2).
- Ndimbwa T, Mwantimwa K, Ndumbaro F. Channels used to deliver agricultural information and knowledge to smallholder farmers. IFLA Journal. 2021;47(2).
- Megerssa GR, Gemede BG, Jarsa AW. Challenges of smallholder farmers in accessing agricultural information in Southern Ethiopia. Agricultural Science and Technology. 2020;12(1).
- Gebreegziabher KT, Mezgebo GK. Smallholder Farmers Willingness to Pay for Privatized Agricultural Extension Services in Tigray National Regional State, Ethiopia. Journal of Agricultural Extension. 2020;24(4).
- Steinke J, Achieng JO, Hammond J, Kebede SS, Mengistu DK, Mgimiloko MG, et al. Household-specific targeting of agricultural advice via mobile phones: Feasibility of a minimum data approach for smallholder context. Comput Electron Agric. 2019 Jul 1;162:991–1000.
- Gosbert LS, Athman KA, Jumanne MA. Factors determining crop farmers willingness to pay for agricultural extension services in Tanzania: A case of Mpwapwa and Mvomero Districts. Journal of Agricultural Extension and Rural Development. 2019;11(12).
- Tamene LD, Ashenafi A. Digital Agriculture Profile: Ethiopia. 2022.
- Abdulai AR, KC KB, Fraser E. What factors influence the likelihood of rural farmer participation in digital agricultural services? experience from smallholder digitalization in Northern Ghana. Outlook Agric. 2023;52(1).
- Abdulai, AR. Toward digitalization futures in smallholder farming systems in Sub-Sahara Africa: A social practice proposal. Front Sustain Food Syst. 2022;6.
- Tsan M, Benjamin K, Totapally S, Hailu M, Addom. The Digitalisation of African Agriculture Report 2018–2019. Wageningen, The Netherlands: CTA/Dalberg Advisers. Vol. 53, African Affairs. 2019.
- McCampbell M, Schumann C, Klerkx L. Good intentions in complex realities: Challenges for designing responsibly in digital agriculture in low-income countries. Sociol Ruralis. 2022;62(2).
- Kansiime MK, Mugambi I, Rware H, Alokit C, Aliamo C, Zhang F, et al. CHALLENGES AND CAPACITY GAPS IN SMALLHOLDER ACCESS TO DIGITAL EXTENSION AND ADVISORY SERVICES IN KENYA AND UGANDA. Front Agric Sci Eng. 2022;9(4).
- Gilardi G, Garibaldi A, Gullino ML. Emerging pathogens as a consequence of globalization and climate change: Leafy vegetables as a case study. Vol. 57, Phytopathologia Mediterranea. 2018.
- Ebert, AW. Vegetable production, diseases, and climate change. Frontiers of Economics and Globalization. 2017;17.
- Golding J, Tesoriero L, Daniel R. Leafy Vegetables. In: Pathology of Fresh Horticultural Produce. 2019. p. 339–72.
Figure 1.
Location of the study area. The left panel shows the study districts of Mecha and Fogera within the Amhara region in northwestern Ethiopia. The right panel shows the two districts, the main roads and their location near Lake Tana.
Figure 1.
Location of the study area. The left panel shows the study districts of Mecha and Fogera within the Amhara region in northwestern Ethiopia. The right panel shows the two districts, the main roads and their location near Lake Tana.
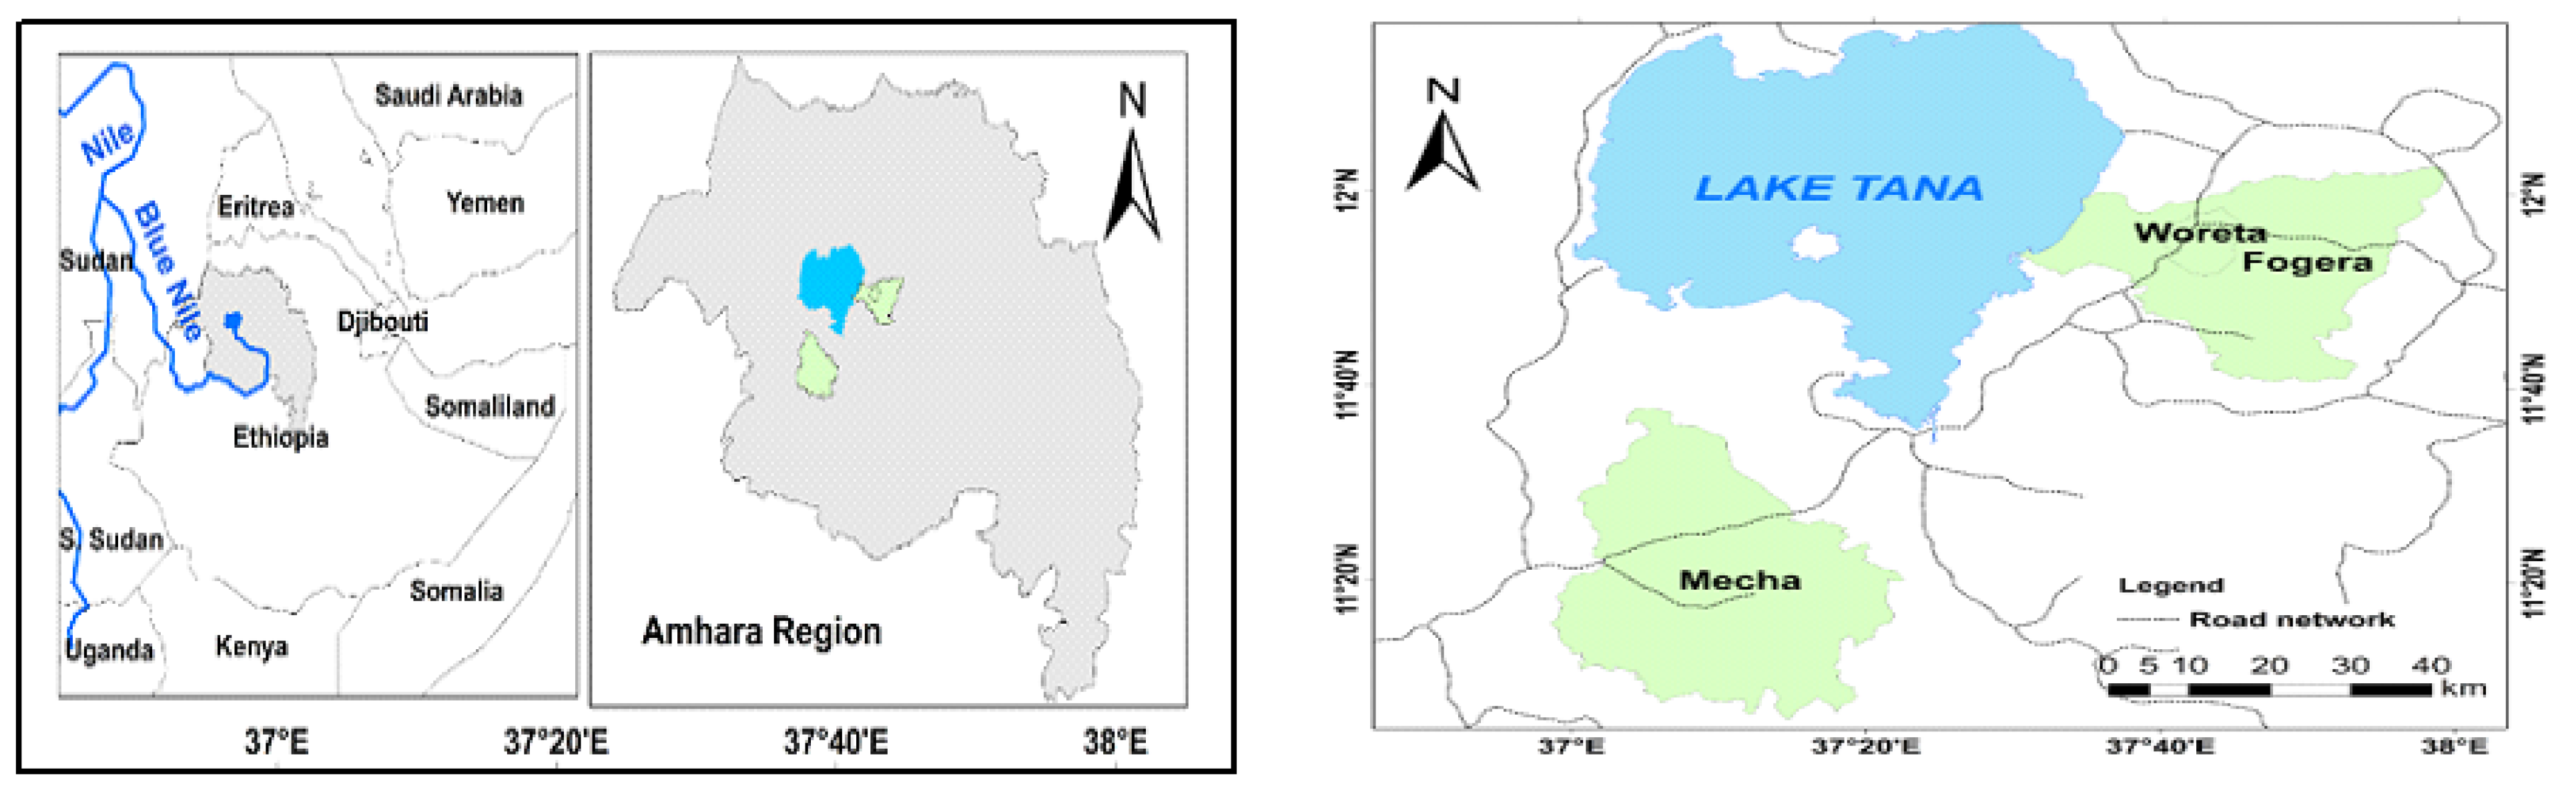
Table 1.
the DCE attributes and their levels/categories.
| Attributes | Values used to represent each level | Description of each Levels |
| Focus of vegetable advisory service (MVAS) | 1, 2 | Input focused and Management focused |
| Frequency of advisory service (FAS) | -1,0,1 | per week, per two weeks, per month |
| Approach of knowledge exchange (AKE) | 0,1,2 | On shops, on-field, by mobile |
| Types of Vegetables (TVAS) | 0,1,2 | On FV, on LV and on R&T vegetables |
| Service fee for advisory in ETB (P) | 80,100,120,140 | 40% less, 20% less, proposed amount, 14.5% more |
Table 2.
example of single choice set.
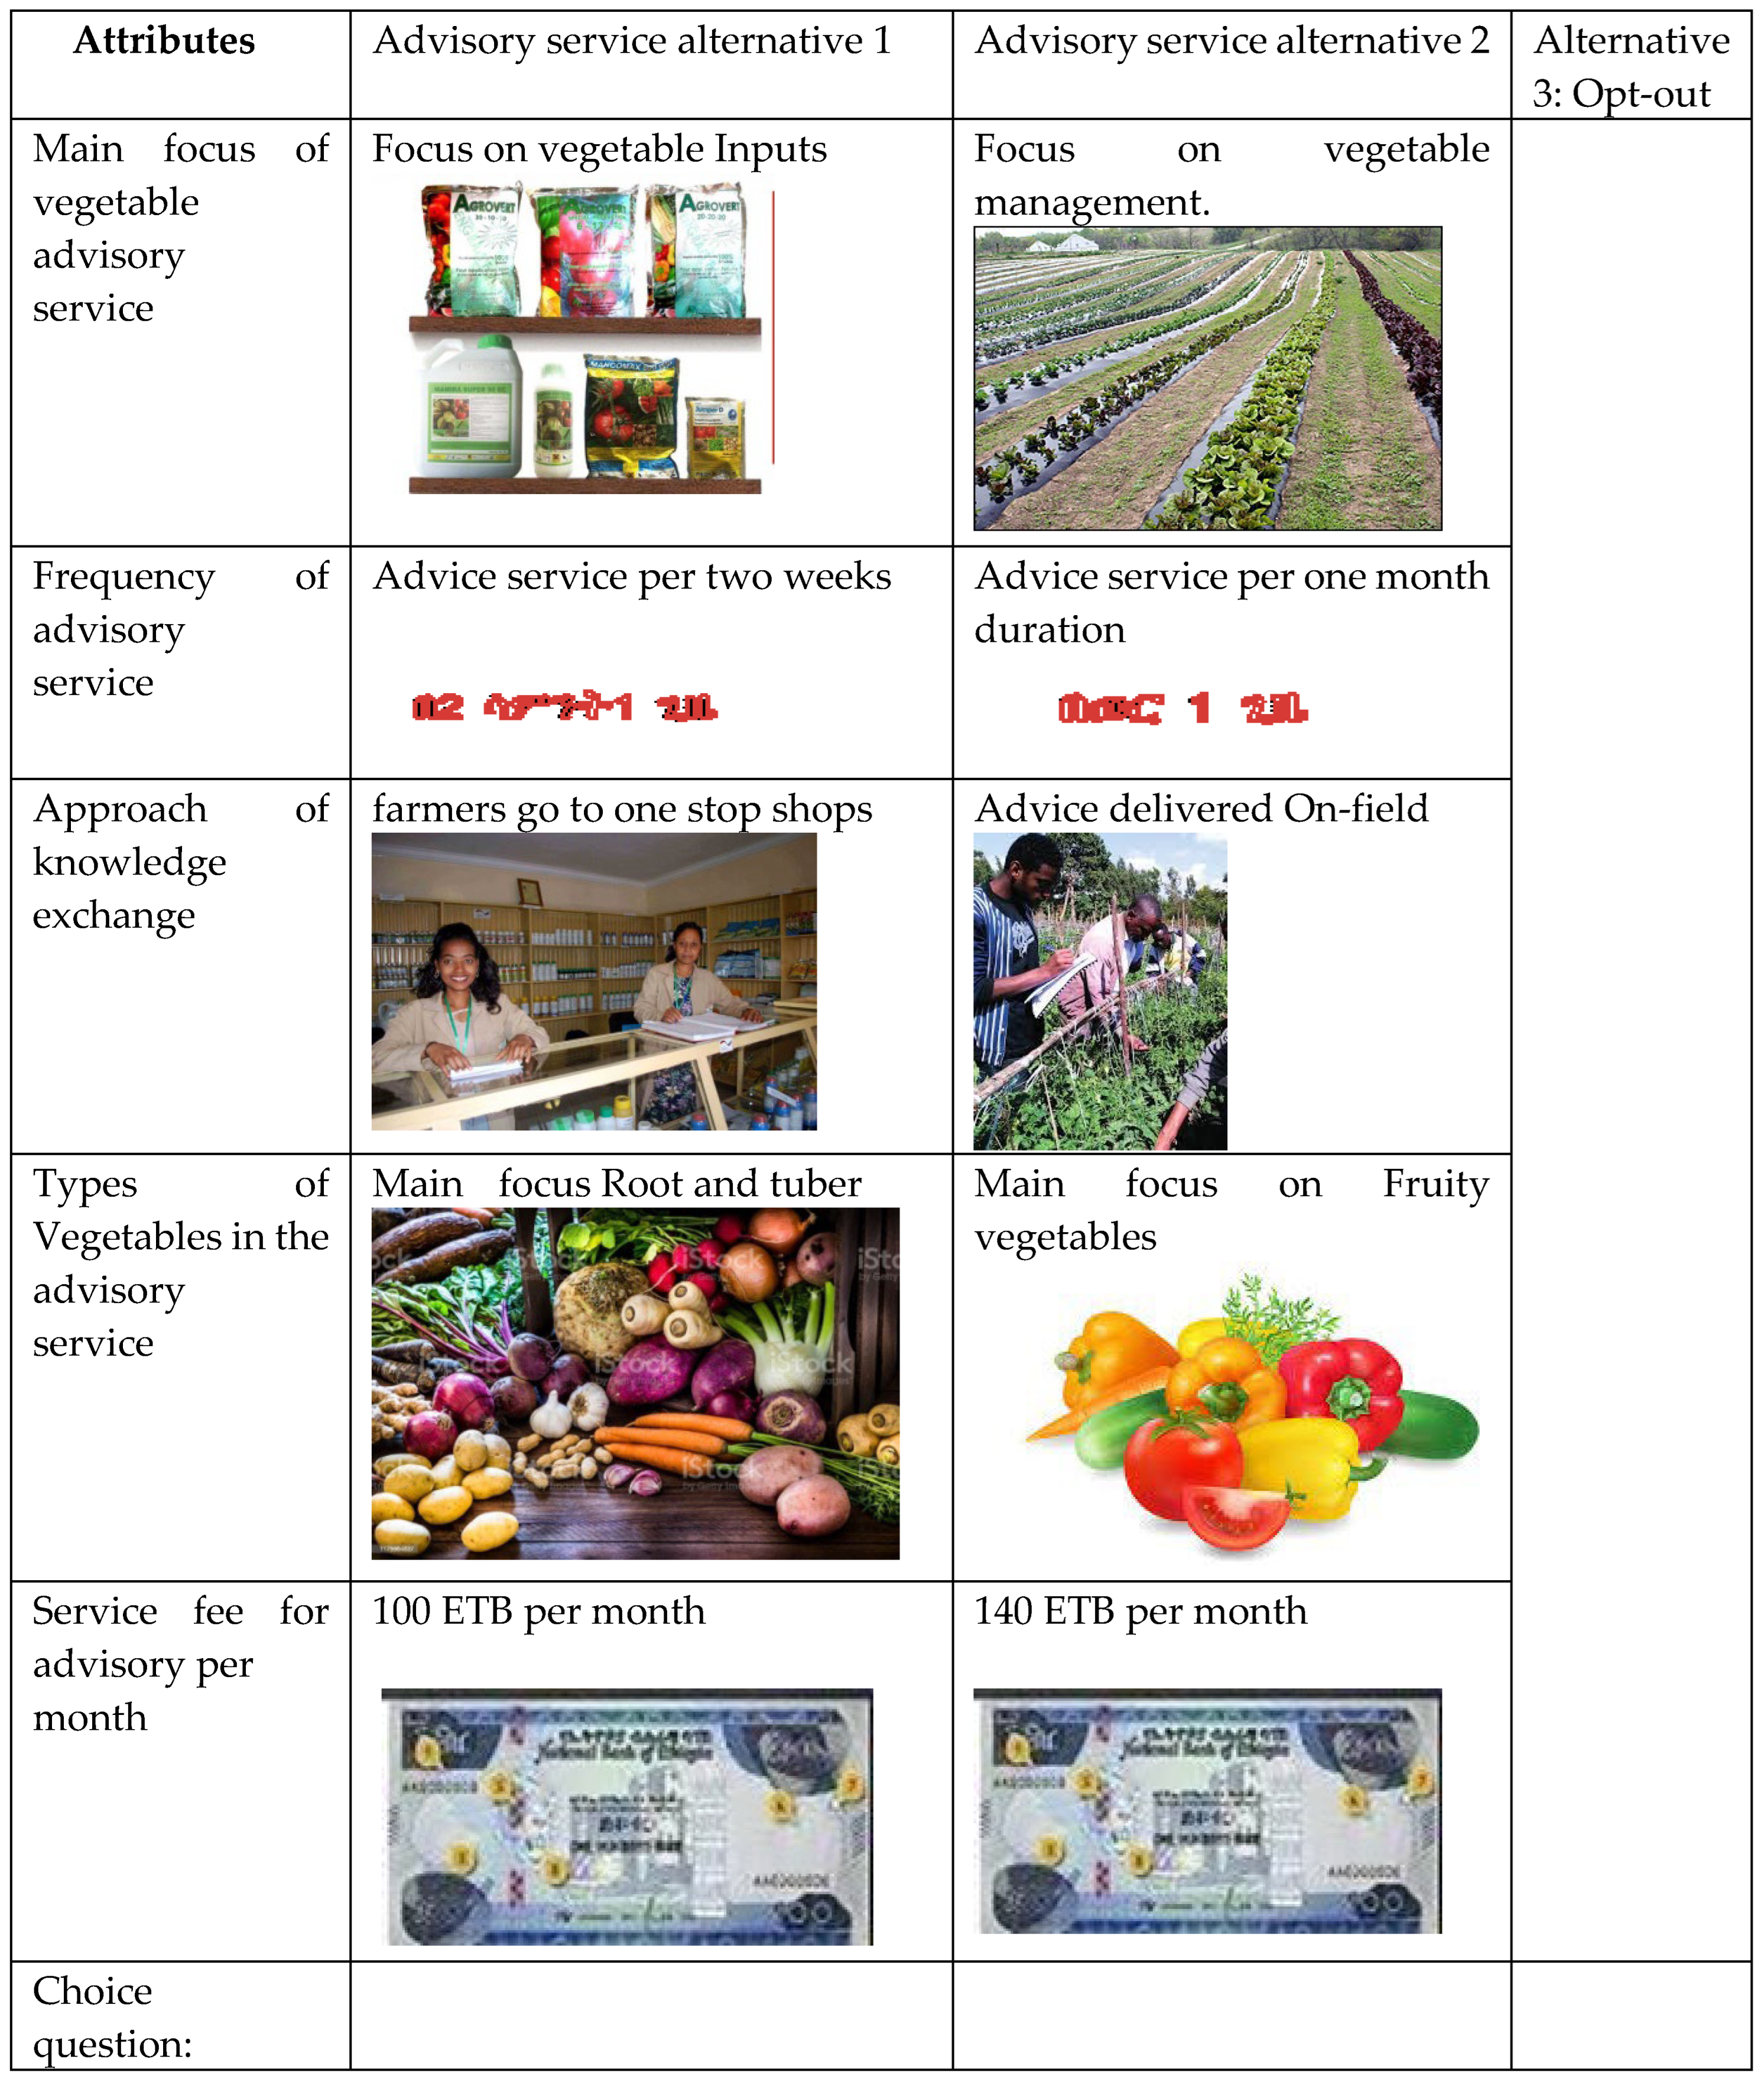 |
Table 3.
Demographic and socioeconomic characteristics of sample households. N= 393.
| Variable | Mean | Std. Dev. | Min | Max |
| Age of HH | 43.7 | 12 | 19 | 81 |
| Farm experience | 23 | 12.1 | 1 | 58 |
| Family Size | 7.4 | 2.1 | 1 | 11 |
| Working family members | 3.8 | 1.6 | 1 | 10 |
| Tropical Livestock Units (TLU) | 5.2 | 2.3 | 0 | 16.7 |
| Total cultivated land | 1.2 | 0.6 | 0.08 | 5.8 |
| Land for vegetable | 0.39 | 0.02 | 0.01 | 2 |
Table 4.
Education status of sampled household heads.
| Education Status HH | Frequency | Percent | Cumulative |
| Cannot read and write | 198 | 50.4 | 50.4 |
| Can read and write, but with no formal education | 95 | 24.2 | 74.6 |
| Have formal education | 100 | 25.5 | 100.0 |
Table 6.
RPL model results with attribute only.
|
Mean of fixed parameter |
Attributes only model | |||
| Coefficient | standard Error | Z | P > (Z) WTP | |
| Advisory Fee | -0.0080 | 0.009 | -2.04 | 0.041 |
|
Mean of random parameter Input delivery focused Frequency of advisory service Advice by mobile phone One-stop shops Fruity vegetables Roots and tuber vegetables |
0.2024 0.0150 -0.9488 -0.3984 0.9607 1.6208 |
0.3368 0.0044 0.1714 0.2009 0.0948 0.1276 |
0.60 3.41 -5.54 -1.98 10.14 12.71 |
0.548 25.47 0.001 1.89 0.000 -119.39 0.047 -50.14 0.000 120.89 0.000 203.94 |
| Standard Deviation random parameter | Coefficient | standard Error | Z | P > (Z) |
| Input delivery focused Frequency of advisory service Advice by mobile phone One-stop shops Fruity vegetables Roots and tuber vegetables |
0.85835 0.00319 0.99874 0.03019 0.76422 1.27165 |
0.28376 0.00037 0.15475 0.23527 0.14829 0.14543 |
3.02 8.71 6.45 0.13 5.15 8.74 |
0.002*** 0.000*** 0.000*** 0.898 0.000*** 0.000*** |
| Log likelihood = -1546.0302 LRchi2(6) = 255.40 Prob >chi2 = 0.0000 | ||||
Notes: Dependent variable is choice; Standard errors in parentheses *** p<0.01, ** p<0.05, * p<0.1; or are statistically significant at 1%, 5% and 10-% level of significance, respectively.
Table 7.
RPL attribute vs sociodemographic interaction result.
| VARIABLES | Variable definition | Mean | SD |
| FeeA | Monthly Fee for vegetable advisory service | -0.0139*(0.0025) | |
| SeXFrAS | Sex interacted with frequency of adv. service | 0.0029**(0.001) | |
| AgeVI | Age interacted with Input focused adv. service | 0.0207(0.0149) | |
| AgeFrAS | Age of household head interacted with frequency of adv. service | -5.77e-05*(0.0003) | |
| EducOnM | Education interacted with Advice by mobile | -0.373***(0.125) | |
| EducFrAS | Education interacted with frequency of adv. service | 0.0016**(0.0007) | |
| ExtTrainingXFrAS | Extension training interacted with frequency of adv. service | 0.001(0.0007) | |
| ExtTrainingXRTV | Extension training interacted with Root tuber vegetable focused advisory | -0.599***(0.219) | |
| TLUXVI | Livestock size interacted with frequency of adv. service | 0.0938(0.0738) | |
| ExtencontactforvegeXFrAS | Extension on Vegetables interacted with frequency of adv. service | -0.000450(0.0004) | |
| totallandforvegetablesXRTV | Land allocated for vegetavles interacted with Root tuber vegetable focused advisory | -0.121(0.375) | |
| Input delivery focused | -1.763**(0.718) | 1.154***(0.304) | |
| Frequency of Adv. Service | 0.0219***(0.0035) | -0.0065***(0.0011) | |
| Advice through by mobile | -0.0677(0.239) | 1.036***(0.157) | |
| One-stop shops | 1.025***(0.103) | 0.911***(0.142) | |
| Fruity vegs | 2.061***(0.242) | 1.412***(0.156) | |
| Log likelihood = -1544.6939 LR chi2(5) = 225.15 Observations = 7,074 |
Note: Standard errors in parentheses *** p<0.01, ** p<0.05, * p<0.1. Table 6 shows heterogeneous effects on advisory service choice with respect to socioeconomic status based on the mixed logit/random parameter logit.
Table 8.
Estimation of marginal willingness to pay.
| Input-based advisory services | Frequency advisory visits | Advisory. Through. Mobile | Advisory. Through. 1-stop shops | Fruit vegetable focused advisory service | Root veg focused advisory service | |
|
WTP |
25.47 |
1.89 |
-119.39 |
-50.14 |
120.89 |
203.94 |
| Lower limit |
-78.28 |
1.13 |
-264.53 |
-142.42 |
4.88 |
3.08 |
| Upper Limit |
129.22 |
2.65 |
25.75 |
42.15 |
236.90 |
404.80 |
| 1 | Ethiopia ET: Purchasing Power Parity for non-OECD countries. 14.17 ETB equals 1 US dollar. |
Disclaimer/Publisher’s Note: The statements, opinions and data contained in all publications are solely those of the individual author(s) and contributor(s) and not of MDPI and/or the editor(s). MDPI and/or the editor(s) disclaim responsibility for any injury to people or property resulting from any ideas, methods, instructions or products referred to in the content. |
© 2024 by the authors. Licensee MDPI, Basel, Switzerland. This article is an open access article distributed under the terms and conditions of the Creative Commons Attribution (CC BY) license (http://creativecommons.org/licenses/by/4.0/).
Copyright: This open access article is published under a Creative Commons CC BY 4.0 license, which permit the free download, distribution, and reuse, provided that the author and preprint are cited in any reuse.


