
Submitted:
27 October 2024
Posted:
28 October 2024
You are already at the latest version
Abstract
Acute myeloid leukemia (AML) is a severe blood cancer in myeloid cells which is found to be developed due to mutation in genes that causes dysregulation in the gene’s expression, affecting the cellular function and signaling pathways. STK24 is a protein belonging to the Germinal Center Kinase III (GCK III) sub-family, found to be related to many intracellular and intercellular processes. In the following study the expression of the gene STK24 is studied using the web-based tool TNM plot, in which the expression is found dysregulated in AML with a significant p-value of 9.76e - 23. In addition to expression analysis, survival analysis is carried out, the dysregulated expression of STK24 is found to be related to lower overall survivable outcome indicated by significant p-value of 1.6e - 05 with median survival for lower expression of the STK24 for 10.7 month time. In the protein-protein interaction analysis, the targeted protein STK24 was found to interact with several proteins, among them some of the proteins which are found to be related to AML pathogenesis are PDCD10, PPP2R1B, STK11, TCP1, STK25, STK26 and STRN3 with combined score between .5 to 1.00. Among the interacting proteins 20 proteins are found to have higher interaction efficiency which is represented in circular format. A correlation study of the target protein STK24 with AML and glutamine metabolism related protein FLT3, NPM1, RUNX1, RARA, IDH1, IDH2, GLS, SLC1A5, GLUD1 and SLC7A11 showed a significant correlation with Pearson’s coefficient r value between -1 to 1 and p-value < 0.05. With the analysis of expression and survival and protein-protein interaction and gene correlation it can be indicated that STK24 may have a role in pathogenesis in AML. But to conclude the study, further expression of the gene STK24 in the AML is needed to prove its correlation with the disease progression and further in vitro and in vivo analysis are needed to be carried out.
Keywords:
Acute myeloid leukemia
; Gene ontology
; Protein-protein interaction
; Protein Correlation
; STK24
; Survival analysis
1. Introduction
AML, or also known as myeloid leukemia, is the severe blood cancer that arise in the blood forming cells in the bone marrow. This disease is characterised by accumulation in bone marrow, peripheral blood and other related tissues by poorly differentiated and uncontrollably multiplied myeloid cells [1]. It is a group of related disorders which can be distinguished by cytogenetic abnormalities with other mutations that cause abnormality in signal transduction and others [2]. This group of related disorders are the malignancy that occurs in the myeloid stem cell lineage precursors like RBC, platelets, and WBC due to the genetic mutations that leads to neoplastic changes and clonal proliferation in the bone marrow and peripheral blood and other related tissues. It is curable for up to 35-40% of the patients that are young age [3,4,5]. The rise of this disease can be due to underlying hematological disorder or other factors like prior therapy with alkylating agents, treatment with topoisomerase II or with radiation, but mostly it appears to be related with occurrence of de novo mutations [5]. This malignancy is believed to arise in the small population of quiescent stem cells that express CD34, CD123. Most of these cells lose their stemness and proceed to proliferate, differentiate, and finally die but the cells that remain in the reservoir are enough to arise and maintain the AML bulk population [6]. The cause of the occurrence of AML is not clear but it is found to be related to mutations in the genes. A study carried out using whole exome sequencing, in which several genes are identified along with 57 novel fusions are found to be related with AML. Though mutations are related to the AML, finding the genes that make important contribution in AML pathogenesis and use it for accurate diagnosis is necessary [7]. By profiling the pattern of expression of genes in AML it is revealed to be grouped into prognostic markers like cytogenetics and molecular markers. Many profiling of gene expression studies is carried out which are reported to have correlation with the risk classification, pathogenesis, and diagnosis [8].
GCK is a family of STE20 like kinase which has a role in determining the fate of the cells and also in regulation of the function. There are many subgroups of this family which are GCK-I, GCK-II. GCK-III, GCK-VI and GCK-VIII are reported to be involved in inflammatory response and their functions are linked with human disease such as cancer and immunological disorders [9]. The subfamily of GCK-III proteins function is related to the apoptotic process, comprises of proteins like MST3 (STK24), MST4 and STK25. The family of the GCK III proteins also regulates processes such as proliferation of cells, migration and cytoskeleton remodeling [10]. MST3 or STK24, a member of the GCK III subfamily, is an important regulator of cellular processes such as cell cycle and growth, migration and development of synapse. In a kinase dependent manner this protein plays a role in regulating different signaling pathways that sum up in promoting the cell proliferation and tumorigenicity [11]. STK24 belongs to kinase proteins that are involved in regulation of cascade of mitogen-activated protein kinase (MAPK) that are involved in various cellular processes. Recently this protein has been identified to be regulator of antitumor immunity that includes AKT and PD-L1/PD-1 signaling pathways [12]. Deletion of STK24/STK25 interacting with CCM3 in the endothelial cells cause the defect in the patterning of the vascular system during development and postnatal development, deletion of these two kinase impairs the angiogenesis in the regions of brain and retina [13].
STK24 is a kinase protein belonging to the GCK III subfamily which contains several other kinase proteins that have important roles in many cellular functions. In a study carried out by [14] pediatric AML patient, STK24 is mentioned that it may be related to the pathogenesis of the disease but no studies are carried out to explore the role of this gene in AML pathogenesis. Therefore, in the following study the gene STK24 will be studied utilizing various bioinformatic applications and tools.
2. Materials and Methods
2.1. Expression Analysis
STK24 is a kinase protein belonging to the GCK III subfamily which has been found to have roles in different molecular functions that take place in the cells and its organelles. In the following study the mRNA expression of this gene has been studied using the web-based tool TNM plot (https://tnmplot.com/analysis/). TNM plot is a web-based tool that enables mining of databases in transcriptome levels belonging to different cancer conditions to the normal and metastatic conditions using samples from the repositories of Gene Expression Omnibus of the National Center for Biotechnology Information, The Cancer Genome Atlas, Therapeutically Applicable Research to Generate Effective Treatments and The Genotype-Tissue Expression [15].
2.2. Co-Expression Genes
Co-expression of the genes is carried out to identify the different groups with similar patterns of expression in different cellular conditions like certain anomalic conditions occurring in body [16]. In the following study the genes co-expressed with STK24 are carried out by using the online web-based tool Gepia (http://gepia2.cancer-pku.cn/) to identify the possible genes. Gepia is a web-based tool that analyse the data available in The Cancer Genome Atlas and The Genotype-Tissue Expression and provides function like differential expression analysis, correlation analysis, similar gene detection and others [17].
2.3. Gene Ontology
Gene ontology is a group of independent ontology is carried out to know the enrichment of the protein expressed by the genes. In the following study the curated gene from co-expression analysis are used to classify on the basis of cellular location, biological and molecular process. The following experiment is carried out using web-based tool Gene Ontology (https://geneontology.org/) to classify the co-expressed genes into three ontologies, biological process, molecular process and cellular component. Gene Ontology the web-based tool produces a concordance which can be used in case for all the eukaryotes for the knowledge of the role of the protein and genes in the cells [18].
2.4. Pathway Analysis
Pathway analysis is carried out to connect genes with different functions in different cellular pathways in an interacting network [19]. The following study is carried out by analyzing the list of curated genes from co-expression analysis by using the web-based tool Gene Ontology (https://geneontology.org/).
2.5. Survival Analysis
The survival analysis is carried out to relate the survival time with differential expression of a target gene STK24. Kaplan meier plotter (https://kmplot.com/analysis/) is a web-based tool used for survival analysis using different data sets utilizing the survival time with relation to the expression of the target gene. Kaplan meier plotter is a survival analysis tool that carry out the analysis by customising the data in a univariate and multivariate analysis method [19].
2.6. Protein-Protein Interaction
The protein-protein interaction is carried out to identify the functional aspect of the target protein. In the following experiment the proteins that have possible interaction with the protein STK24 are carried out using the web-based tool String database (https://string-db.org/) and utilizing Cytoscape tool to analyse the interaction and then visualise in a circular form. String is an updated global resource for exploring and analysing the interactions between proteins and has a unique framework for scoring on different associations and provides graphical representation that predicts the protein interaction with high level functional linkage [20]. Cytoscape is a bioinformatic application that is utilized for visualising of biological networks. It is a standard tool with organizing principle of the network that represents the nodes, and interaction that are represented by edges [21].
2.7. Correlation Analysis with the Genes Related to AML and Glutamine Metabolism Related Proteins
In the following study, the co-relation analysis of co-expression of the STK24 and the genes related with AML like FLT3, NMP1, RUNX1, RARA, IDH1, IDH2 and genes related with glutamine metabolism like GLS, SLC1A5, GLUD1 and SLC7A11 are carried out by utilizing the web-based tool Correlation AnalyzeR (https://gccri.bishop-lab.uthscsa.edu/shiny/correlation-analyzer/). Correlation Analyzer is a tool that explores less characterised genes and its relationship with other genes and identify their roles in different biological signaling pathways [22].
3. Result
3.1. Expression Study
The mRNA expression of the target gene STK24 is carried out between AML and control individuals, and the observation shows expression difference of STK24 in the AML than controls with a significant p-value 9.76e-23. The expression of the target gene is plotted in both bar diagram and violin diagram as shown in Figure 1(a) and Figure 1(b).
3.2. Co-Expressed Genes
In co-expression gene analysis 200 genes are found to have similar expressions as the target gene STK24 and on further analysis the correlation coefficient is found to be between -1 to 1. The co-expression of the genes is found to have significant correlation with correlation r value ranging between .87 to .81 as listed in Table 1.
3.3. Gene Enrichment Analysis (Gene Ontology)
The co-expressed gene curated in the previous section is used for the gene ontology analysis for classifying into three individual ontologies biological processes, molecular process, and cellular component. For the biological process the 10 highly enriched processes are listed in Table 2. with fold enrichment ranging between 39.38 to 12.35. In the molecular process the top 10 with high enrichment range between the fold enrichment of 26.25 to 15.75 are listed in Table 3. For the cellular component ontology, the top 10 enriched components with the fold enrichment ranging between 31.5 to 12.35 are listed in Table 4. Figure 2, Figure 3 and Figure 4 depict the biological process, molecular function and cellular component of the curated co-expressed genes.
3.4. Pathway Analysis
The co-expressed genes curated are utilized to identify enrichment in different pathways by analysis in Gene Ontology (Figure 6) and are found to be significantly enriched in B cell activation, T cell activation and Wnt signaling pathway. Table 5 is contained with the p-value, false discovery rate (FDR) and Fold enrichment of the three signaling pathways. Figure 6 represents the enrichment of the genes in these three pathways.
3.5. Survival Analysis
The survival analysis is carried out to predict the survival time correlation with the expression of the target protein. The survival analysis is carried out using Kaplan meier plotter a tool using the STK24 expression, the expression difference of this protein shows lower survival with a significant p-value of 1.6e – 05 (Figure 7) with 1% False Displacement Rate.. The median survival with lower expression of STK24 is 10.8 months but for higher expression of the protein STK24, the median survival is 17.5 months as shown in Table 6.
3.6. Protein-Protein Interaction
The interaction between proteins is carried out identifying the functional aspect of the respective protein in the cell. In the following study carried out, it identified and analysed the top 50 proteins interacting with the protein STK24 in String database (Figure 8). The top 20 interacting proteins among the 50 proteins are further analysed and are visualised with cytoscape in circular format (Figure 9). Among the top 50 proteins the proteins PDCD10, PPP2R1B, STK11, TCP1, STK25, STK26 and STRN3 are found to be related to AML pathogenesis and high combined score interaction with the target protein STK24 (Table 7).
3.7. Correlation Analysis
The correlation of the gene STK24 with the genes related with AML like FLT3, NPM1, RUNX1, RARA, IDH1 and IDH2 and glutamine metabolism GLS, SLC1A5, GLUD1 and SLC7A11 are carried out. In the correlation analysis the correlation of the AML related genes and glutamine metabolism related genes with the gene STK24 is found to have significant correlation r value between -1 to 1 and Pearson’s r value between -1 to 1 with significant p value < 0.05 (Table 8) (Figure 10, Figure 11, Figure 12, Figure 13, Figure 14, Figure 15, Figure 16, Figure 17, Figure 18 and Figure 19).
4. Discussion
The following bioinformatic analysis is carried out to study STK24 expression and its role in prognosis of AML. In the following study the expression of STK24 is found to be deregulated. Similar results are being found in some of the studies that have been carried out previously. STK24 or serine threonine kinase 24 is a kinase protein that acts upstream of MAPK protein. In the studies carried out previously, the anomalous expression of the gene STK24 could be indicated as a possible prognostic indicator for cancer like lung adenocarcinoma, gastric tumorigenesis, colon tumours [23,24,25]. TAOK1 protein localized in the cytosol and cytoskeleton is reported to be phosphorylated at the position 440 by STK24 that promoted the interaction with Myosin for recruitment in dendrites [26]. In bioinformatic analysis the gene STK24 was shown to have role in immunoregulatory process in lung adenocarcinoma, and due to its enhanced expression, the protein STK24 was found to stimulate the migration and growth of lung cancer cells by triggering KLF5 [27]. STK24 has been recently identified as the regulator of the signaling pathway of IL-17, knockdown of the expression of this protein inhibited phosphorylation of IL-17 and induced expression of the chemokines and cytokines. Overexpression of the same induced the activation of NF-κB through IL-17. It was reported further that the protein STK24 directly interacts with the protein TAK1 and IKKβ and regulated the formation of the complex TAK1/IKK that enhanced the activation of NF-κB and induction in the expression of cytokines and chemokines [28]. Also deregulated expression of this protein, was the cause of poor and short survival of the patient suffering from certain cancer types. This protein can positively regulate the signal transducer and activator of transcription 3 (STAT3)/ vascular endothelial growth factor A signaling pathway by inhibiting the degradation of STAT3 by polyubiquitination [29]. A loss of the protein expression of STK24/STK25 leads to gain of function of MAP3K3 that encodes MEKK3, and activation of the signaling pathway, which leads to cerebral cavernous malformation [13]. Difference in the expression of the protein STK24 was related with the secretion of CCL2 and expansion of CD11b+Ly6C+ M-MDSCs and F4/80+ macrophage and, promoted metastasis in gastric cancer mouse model [30]. Regulation of the progression of the disease mediated by STK24 was mainly due to change in the activity of the protein which may be caused by cleavage of the protein, subcellular distribution and modification occurring in the mRNA of the STK24 post-transcription [31]. In Lung adenocarcinoma upregulation in the expression of STK24 was negatively related with methylation of DNA and alteration in the copy number of DNA [23]. By the loss of the expression of both the kinase protein STK24 and STK25 resulted in development of aggressive lesions with cavernoma characteristics in cerebral regions in mice model and in human samples loss of expression of both the kinase protein showed relation with loss of the expression of CCM3 that played role in inhibition of formation of cavernoma [32]. STK24 was identified to be inhibitor of metastasis in gastric cancer as downregulation of the expression suppresses CDH1 and enhances CD44 and increased the migration of the cells and suppressed the immune system by expansion of macrophages CD11b+Ly6C+ MDSCs and F4/80+ [30].
There are several proteins present in protein-protein interaction which were found to be related to the prognosis of AML and are found to have interacted with the target protein STK24 with high combined score. Novel gene fusion STRN3-PDGFRB was identified which resulted in formation of chromosomal rearrangements t (5;14) (q32; q12), by FISH, in 15 percent of the leukemic cells were found to carry this rearrangement which was not reported previously. The fusion of the genes resulted in chimeric protein expression, which was found to have distinct localization in the cytosol and found to exhibit leukemogenic effect causing fatal myeloproliferative neoplasm by transforming Ba/F3 cells independent of any growth factor in mice which then further transforms to T-cell lymphoblastic lymphoma [33]. In Acute promyelocytic leukemia a novel fusion of STRN3-RARA was found. It was found to have a corporate UTX deficiency and was identified to be related to quick relapse in leukemia [34]. The higher expression of the gene LOC541471, GDAP1, SOD1 and STK25 were found to be potential biomarkers for identification of risk in AML patients as knockdown of the following genes were found promoting apoptosis and inhibiting the proliferation of the leukemic cells [35]. STK25 a kinase protein belong to the GCK III subfamily, is a reported to be part of death signaling pathway which is regulated by Trk A and CCM2. Downregulation of the expression of the protein inhibited the cell death of the medulloblastoma cells induced by TrkA [36]. In activation of the gene PP2A a tumour suppressor had a role in inhibiting cellular transformation by inhibiting the malignant cell by regulating various signaling proteins. The inactivity of this protein was found to be related with relapse of AML and restoration of its phosphatase activity blocks the cell proliferation and causes caspase-dependent apoptosis of the cells and affects the activity of AKT and ERK1/2 [37]. PP2A was one of the promising therapeutic targets in AML as it was found to be inactivated in many cases of AML, by restoring the activity of PP2A pharmacologically by using PP2A-activating drugs can produce a promising personalized treatment in the patients of AML [38]. PDCD10 is a protein involved in programmed cell death, in pan cancer analysis the expression of PDCD10 was found to be upregulated in AML along with other cancer types like thymoma but in other cancer types the expression is found to be downregulated [39]. In a case study reported earlier, a patient with AML condition with mutation in the gene STK11 and THBD is found to have family members suffering with hematological disorders like Waldenström macroglobulinemia, NK/T-cell lymphoma, and angioimmunoblastic T-cell lymphoma which signifies that the mutation found in both the genes may be related with aggregation of these disease in the family members [40]. STK11 is a tumour suppressor protein, loss of this protein may lead to progression of the myeloproliferative neoplasm to AML in some cases by stabilizing HIF1a [41]. TCP1 is a chaperonin-containing T complex subunit protein, involved in the process of protein folding, proliferation of cell, regulation of cell cycle, apoptosis and others. This protein is found to be elevated in AML patients with poor survival, inhibition of its expression suppressed drug resistance while its over expression increased the drug resistance [30]. The expression of TCP1 is regulated by the protein METTL14, overexpression of this protein regulated in increasing of the expression for the protein TCP1 which leads to increase in proliferation, invasion, migration and apoptosis inhibition in AML [42]. Increased in expression of the protein STK26 in leukemia stem cell is found to be highly significant with relapse free survival in pediatric AML [14].
There are several AML related genes and glutamine metabolism related proteins are present which are found to have significant correlation with the target gene STK24. FLT3 or feline McDough sarcoma like type 3 is a tyrosine kinase receptor related with AML. Mutation in this gene is found to be related with AML occurrence, it plays crucial role in survival and multiplication of hematopoietic stem cells and is not only restricted to be related with AML but with other hematological disorders like acute lymphoblastic leukemia, myelodysplasia, chronic myelomonocytic leukemia too. Mutation in FLT3 was found in one-fourth of AML patients and was mostly found in second transmembrane domain and internal tandem domains and juxta membrane domains [43]. Mutation in FLT3 is the common genetic abnormalities found in AML and it negatively impacted the prognosis [44]. Mutation in the internal tandem by duplication in FLT3 occurs recurrently in AML and increases the risk of relapses of malignancy [45]. NPM1 or nucleoplasmin mutations are related with AML in 30% of adult AML cases. Most frequently 12 number exons of the NPM1 with three mutation A/B/D subtypes were related with 90% of NPM1 mutation related AML [46]. AML with NPM1 mutation was classified with different commodities and was found in 30% of the AML cases [47]. RUNX1 is a core transcription factor that has a role in cell differentiation. Rearrangement in this gene is related commonly to tumours in myeloid and lymphoid cells. A novel fusion RUNX1::WIF1 with RUNX1 exon2 and WIF1 exon 3 was identified by transcriptome sequencing and RT-PCR in a 79 year old AML patient [48]. A patient with acute promyelocytic leukemia, a subtype of AML clinical feature was found to have the fusion transcript involving IRF2BP1 exon1 and exon 3 of RARA. The following fusion formed a new intron by paired splicing at GT 9bp downstream of break point of RARA and AG acceptor of RARA 5’ end of exon 3 [49]. A novel fusion protein RARA::ANKRD34C was identified in acute promyelocytic leukemia, which was identified as the one of the effective target for clinical therapy [50].
Glutamine is the most essential amino acid and found to contribute to the growth and proliferation of AML cells. As glutamine metabolism is associated with multiple cellular pathways targeting strategies using glutamine like glutamine uptake inhibitors, glutamine analogues and glutaminase inhibitors can be one of the effective treatments for the patients of AML in future [51]. Lower glutamine levels in the plasma are inversely proportional to the higher risk of leukemia, which explains the role of glutamine in pathophysiology in leukemia [52]. Increase in the glutamine metabolism is related with increase in the growth of the cell line HL-60, which was suppressed due to deprivation of glutamine and inhibition of glutaminolysis and rescued by the oxaloacetic acid a tricarboxylic acid intermediate [53]. GLS or glutaminase is a mitochondrial protein that converts the glutamine amino acid to glutamate, two splicing variants of the gene GLS1 expression are found to be higher in AML. Inhibition using GLS inhibitors can be useful therapy for AML which decreases the growth of the cells, regulates apoptosis and differentiation [54].
5. Conclusions
The following study is carried out to analyze the gene STK24 using different bioinformatic web-based tools and application in AML in which the gene STK24 is found to be positively related with the AML pathogenesis by expression analysis and survival analysis with dysregulated expression in AML then controls. In protein-protein interaction analysis the target gene STK24 and several proteins are found to interact, among the interacting proteins, the proteins PDCD10, PPP2R1B, STK11, TCP1, STK25, STK26 and STRN3 are found to be the positive markers of AML and have high degree of interaction with the target protein with a combined score ranging between 0.5 – 1.00. Further it was also found to have positive correlation with AML related proteins FLT3, NPM1, RUNX1, RARA, IDH1 and IDH2 and glutamine metabolism related proteins GLS, GLUD1, SLC1A5 and SLC7A11 which indicates STK24 role in AML and glutamine metabolism. The following correlation with glutamine metabolism was carried out as the glutamine metabolism process is found to be positively related to the progression of AML. All the above analysis carried out indicates that the gene STK24 may have a positive role in AML pathogenesis and progression, but to conclude further, study of the expression of the gene is required in AML patient and further in vitro and in vivo analysis are needed to be carried out to study its role in progression of AML.
Conflicts of Interest
The authors declare no conflicts of interest.
References
- Döhner, H.; Weisdorf, D.J.; Bloomfield, C.D, Acute myeloid leukemia. New England Journal of Medicine. 2015, 373(12), 1136-52.
- Appelbaum, F.R.; Rowe, J.M.; Radich, J.; Dick, J.E, Acute myeloid leukemia. ASH Education Program Book. 2001, 2001(1), 62-86.
- Pelcovits, A.; Niroula, R., Acute myeloid leukemia: a review. Rhode Island Medical Journal. 2020,103(3), 38-40.
- Saultz, J.N.; Garzon, R., Acute myeloid leukemia: a concise review. Journal of Clinical Medicine. 2016, 5(3), 33. [CrossRef]
- 5. De, Kouchkovsky, I.; Abdul-Hay, M., Acute myeloid leukemia: a comprehensive review and 2016 update. Blood Cancer Journal. 2016, 6(7), e441-.
- Estey, E.H.; Estey, E.H.; Estey, E.H., Acute myeloid leukemia (AML). Leukemia And Related Disorders: Integrated Treatment Approaches. 2012, 1-36.
- Cao, X.X.; Cai, H.; Mao, Y.Y.; Wu, Q.; Zhang, L.; Zhou, D.B.; Li, J., Next-generation sequencing-based genetic landscape and its clinical implications for Chinese acute myeloid leukemia patients. Cancer Cell International. 2018, 18, 1-6. [CrossRef]
- Miller, B.G.; and Stamatoyannopoulos, J.A., Integrative meta-analysis of differential gene expression in acute myeloid leukemia. PLoS One. 2010, 5(3), e9466. [CrossRef]
- Yin, H.; Shi, Z.; Jiao, S.; Chen, C.; Wang, W.; Greene, M.I.; Zhou, Z., Germinal center kinases in immune regulation. Cellular & Molecular Immunology. 2012, 9(6), 439-45. [CrossRef]
- Zhang, M.; Dong, L.; Shi, Z.; Jiao, S.; Zhang, Z.; Zhang, W.; Liu, G.; Chen, C.; Feng, M.; Hao, Q.; Wang, W., Structural mechanism of CCM3 heterodimerization with GCKIII kinases. Structure. 2013, 21(4), 680-8. [CrossRef]
- Qin, Q.; Li, M.; Gu, M.; Meng, Z.; Xu, P.; Meng, H.; Wang, X., Stk24 protects against obesity-associated metabolic disorders by disrupting the NLRP3 inflammasome. Cell reports. 2021, 35(8). [CrossRef]
- Wang, N.; Jiang, Y.; Li, M.; Wang, H.; Pan, J.; Tang, Y.; Xie, S.; Xu, Y.; Li, X.; Zhou, X.; Xu, P., Protein Kinase STK24 Promotes Tumor Immune Evasion via the AKT-PD-L1 Axis. Advanced Science. 2024, 2304342.
- Yang, X.; Wu, S.T.; Gao, R.; Wang, R.; Wang, Y.; Dong, Z.; Wang, L.; Qi, C.; Wang, X.; Schmitz, M.L.; Liu, R., Release of STK24/25 suppression on MEKK3 signaling in endothelial cells confers cerebral cavernous malformation. JCI Insight. 2023, 8(5).
- Thakral, D.; Singh, V.K.; Gupta, R.; Jha, N.; Khan, A.; Kaur, G.; Rai, S.; Kumar, V.; Supriya, M.; Bakhshi, S.; Seth, R.; Integrated single-cell transcriptome analysis of CD34+ enriched leukemic stem cells revealed intra-and inter-patient transcriptional heterogeneity in pediatric acute myeloid leukemia. Annals of Hematology. 2023, 102(1), 73-87. [CrossRef]
- Bartha Á, Győrffy B. TNMplot.com: A Web Tool for the Comparison of Gene Expression in Normal, Tumor and Metastatic Tissues. Int J Mol Sci. 2021 Mar 5;22(5):2622. PMID: 33807717; PMCID: PMC7961455. [CrossRef]
- Montenegro, J.D., Gene co-expression network analysis. InPlant Bioinformatics: Methods And Protocols, 2022, (pp. 387-404). New York, NY: Springer US.
- Tang Z, Li C, Kang B, Gao G, Li C, Zhang Z. GEPIA: a web server for cancer and normal gene expression profiling and interactive analyses. Nucleic Acids Res. 2017 Jul 3;45(W1):W98-W102. PMID: 28407145; PMCID: PMC5570223. [CrossRef]
- Ashburner M, Ball CA, Blake JA, Botstein D, Butler H, Cherry JM, Davis AP, Dolinski K, Dwight SS, Eppig JT, Harris MA, Hill DP, Issel-Tarver L, Kasarskis A, Lewis S, Matese JC, Richardson JE, Ringwald M, Rubin GM, Sherlock G. Gene ontology: tool for the unification of biology. The Gene Ontology Consortium. Nat Genet. 2000 May;25(1):25-9. PMID: 10802651; PMCID: PMC3037419. [CrossRef]
- Kanehisa, M.; Goto, S., KEGG: kyoto encyclopedia of genes and genomes. Nucleic Acids Research. 2000, 28(1), 27-30. [CrossRef]
- Mering CV, Huynen M, Jaeggi D, Schmidt S, Bork P, Snel B. STRING: a database of predicted functional associations between proteins. Nucleic acids research. 2003 Jan 1;31(1):258-61.
- Smoot ME, Ono K, Ruscheinski J, Wang PL, Ideker T. Cytoscape 2.8: new features for data integration and network visualization. Bioinformatics. 2011 Feb 1;27(3):431-2. [CrossRef]
- Miller HE, Bishop AJ. Correlation AnalyzeR: functional predictions from gene co-expression correlations. BMC bioinformatics. 2021 Dec;22:1-9. [CrossRef]
- Huang, N.; Lin, W.; Shi, X.; Tao, T., STK24 expression is modulated by DNA copy number/methylation in lung adenocarcinoma and predicts poor survival. Future Oncology. 2018, 14(22), 2253-63. [CrossRef]
- Chen X, Chen X, Huang Y, Lin J, Wu Y, Chen Y. TCP1 increases drug resistance in acute myeloid leukemia by suppressing autophagy via activating AKT/mTOR signaling. Cell Death & Disease. 2021 Nov 8;12(11):1058. [CrossRef]
- Hennig, E.E.; Mikula, M.; Rubel, T.; Dadlez, M.; Ostrowski, J., Comparative kinome analysis to identify putative colon tumor biomarkers. Journal Of Molecular Medicine. 2012, 90, 447-56. [CrossRef]
- Xu, D.; Han, G.; Zhou, X.; Yong, H.; Jia, Y.; Zhao, F.; Shi, H., TEAD4 activates PCSK9 to promote stomach adenocarcinoma cell stemness through fatty acid metabolism. Digestion. 2024. [CrossRef]
- Li, Y.; Liu, Y.; Wang, K.; Xue, D.; Huang, Y.; Tan, Z.; Chen, Y., STK24 Promotes Progression of LUAD and Modulates the Immune Microenvironment. Mediators of Inflammation. 2023, 2023(1), 8646088. [CrossRef]
- Jiang, Y.; Tian, M.; Lin, W.; Wang, X.; Wang, X., Protein kinase serine/threonine kinase 24 positively regulates interleukin 17-induced inflammation by promoting IKK complex activation. Frontiers In Immunology. 2018, 9, 921. [CrossRef]
- Lai, S.; Wang, D.; Sun, W.; Cao, X., Serine/threonine-protein kinase STK24 induces tumorigenesis by regulating the STAT3/VEGFA signaling pathway. Journal of Biological Chemistry. 2023, 299(3).
- Chen, Y.L.; Wang, C.Y.; Fang, J.H.; Hsu, H.P., Serine/threonine-protein kinase 24 is an inhibitor of gastric cancer metastasis through suppressing CDH1 gene and enhancing stemness. American Journal of Cancer Research. 2021, 11(9), 4277.
- Qiu, J.; Xiong, J.; Jiang, L.; Wang, X.; Zhang, K.; Yu, H., Molecular mechanisms involved in regulating protein activity and biological function of MST3. Cell Division. 2023, 18(1), 8. [CrossRef]
- Sartages, M.; García-Colomer, M.; Iglesias, C.; Howell, B.W.; Macía, M.; Peña, P.; Pombo, C.M.; Zalvide, J., GCKIII (germinal center kinase III) kinases STK24 and STK25 (serine/threonine kinase 24 and 25) inhibit cavernoma development. Stroke. 2022, 53(3), 976-86. [CrossRef]
- Wang Z, Liu T, Liu W, Gao X, Wan L, Qiu S, Song Y, Gu R, Tian Z, Wang M, Wang J. A novel subclonal rearrangement of the STRN3:: PDGFRB gene in de novo acute myeloid leukemia with NPM1 mutation and its leukemogenic effects. Cancer Gene Therapy. 2023 Nov;30(11):1471-84. [CrossRef]
- Zhang N, Miao XJ, Shuai YR, Yao H, Fan FY, Liu YL. Family aggregation of hematological malignancies discovered from an acute myeloid leukemia patient with STK11 and THBD gene mutation. Case Reports in Oncology. 2023 Mar 7;16(1):728-32. [CrossRef]
- Yu X, Chen C, Hu Y, Li K, Zhang Y, Chen Z, Nie D, Gao R, Huang Y, Zhong M, Wang C. High expression of LOC541471, GDAP1, SOD1, and STK25 is associated with poor overall survival of patients with acute myeloid leukemia. Cancer Medicine. 2023 Apr;12(7):9055-67. [CrossRef]
- Costa, B.; Kean, M.J.; Ast, V.; Knight, J.D.; Mett, A.; Levy, Z.; Ceccarelli, D.F.; Badillo, B.G.; Eils, R.; König, R.; Gingras, A.C., STK25 protein mediates TrkA and CCM2 protein-dependent death in pediatric tumor cells of neural origin. Journal of Biological Chemistry. 2012, 287(35), 29285-9. [CrossRef]
- Cristobal I, Garcia-Orti L, Cirauqui C, Alonso MM, Calasanz MJ, Odero MD. PP2A impaired activity is a common event in acute myeloid leukemia and its activation by forskolin has a potent anti-leukemic effect. Leukemia. 2011 Apr;25(4):606-14. [CrossRef]
- Arriazu E, Pippa R, Odero MD. Protein phosphatase 2A as a therapeutic target in acute myeloid leukemia. Frontiers in oncology. 2016 Apr 6;6:78. [CrossRef]
- Tang H, Chen Y, Zhang N, Deng J, Zhou K. Higher expression of programmed cell death 4 (PDCD4) in acute myeloid leukemia is associated with better prognosis after chemotherapy. Annals of Hematology. 2023 Dec;102(12):3401-12. [CrossRef]
- Zhang Q, Li H, Chen X, Gu F, Zhang L, Zhang L, Chen T, Chen Q, Meng W, Wu Y, Chang H. Identifying STRN3-RARA as a new fusion gene for acute promyelocytic leukemia. Blood. 2023 Oct 26;142(17):1494-9. [CrossRef]
- Marinaccio C, Suraneni P, Celik H, Volk A, Wen QJ, Ling T, Bulic M, Lasho T, Koche RP, Famulare CA, Farnoud N. LKB1/STK11 is a tumor suppressor in the progression of myeloproliferative neoplasms. Cancer discovery. 2021 Jun 1;11(6):1398-410.
- Zhang M, Xie Z, Tan Y, Wu Y, Wang M, Zhang P, Yuan Y, Li J. METTL14-mediated N6-methyladenosine modification of TCP1 mRNA promotes acute myeloid leukemia progression. Cellular Signalling. 2024 Oct 1;122:111304. [CrossRef]
- Ruglioni M, Crucitta S, Luculli GI, Tancredi G, Del Giudice ML, Mechell S, Galimberti S, Danesi R, Del Re M. Understanding mechanisms of resistance to FLT3 inhibitors in adult FLT3-mutated Acute Myeloid Leukemia (AML) to guide treatment strategy. Critical Reviews in Oncology/Hematology. 2024 Jun 23:104424.
- Lap CJ, Abrahim MS, Nassereddine S. Perspectives and challenges of small molecule inhibitor therapy for FLT3-mutated acute myeloid leukemia. Annals of hematology. 2024 Jul;103(7):2215-29. [CrossRef]
- Tan Y, Xin L, Wang Q, Xu R, Tong X, Chen G, Ma L, Yang F, Jiang H, Zhang N, Wu J. FLT3-selective PROTAC: Enhanced safety and increased synergy with Venetoclax in FLT3-ITD mutated acute myeloid leukemia. Cancer letters. 2024 Jun 28;592:216933. [CrossRef]
- Mutti M, Cordella S, Parisotto A, Bettelli F, Morselli M, Cuoghi A, Bresciani P, Messerotti A, Gilioli A, Pioli V, Giusti D. Characteristics and clinical behavior of acute myeloid leukemia harboring rare non-A/B/D nucleophosmin (NPM1) gene mutation subtypes: a single-center experience and review of the literature. Leukemia & Lymphoma. 2024 Mar 20;65(4):511-5.
- Petiti J, Pignochino Y, Schiavon A, Giugliano E, Berrino E, Giordano G, Itri F, Dragani M, Cilloni D, Lo Iacono M. Comprehensive Molecular Profiling of NPM1-Mutated Acute Myeloid Leukemia Using RNAseq Approach. International Journal of Molecular Sciences. 2024 Mar 24;25(7):3631. [CrossRef]
- Yang S, Sun M, Chen L, Zhang H, Sun L, Liu E, Tian X, Hou X, Lin Y, Lu M. WNT inhibitory factor 1 (WIF1) is a novel fusion partner of RUNX family transcription factor 1 (RUNX1) in acute myeloid leukemia with t (12; 21)(q14; q22). Journal of Hematopathology. 2024 Jul 27:1-5. [CrossRef]
- Jiang M, Wang X, Yu M, Jiang S, Hong M, Zhou Y, Li F, Liu H, Zhang Z. Report of IRF2BP1 as a novel partner of RARA in variant acute promyelocytic leukemia. American Journal of Hematology. 2024 May;99(5):1005-7. [CrossRef]
- Chen Y, Pan M, Chen L, Peng M, Liu Z, Fang Y, Du Y, Yang Y, Xu P. Identification of a novel fusion gene, RARA:: ANKRD34C, in acute promyelocytic leukemia. Annals of Hematology. 2024 Apr;103(4):1181-5.
- Xiao Y, Hu B, Guo Y, Zhang D, Zhao Y, Chen Y, Li N, Yu L. Targeting glutamine metabolism as an attractive therapeutic strategy for acute myeloid leukemia. Current Treatment Options in Oncology. 2023 Aug;24(8):10. [CrossRef]
- Li N, Wang T, Zhang H, Li X, Bai H, Lu N, Lu K. Exploring the causal relationship between glutamine metabolism and leukemia risk: a Mendelian randomization and LC-MS/MS analysis. Frontiers in Immunology. 2024 Jul 10;15:1418738. [CrossRef]
- Goto M, Miwa H, Shikami M, Tsunekawa-Imai N, Suganuma K, Mizuno S, Takahashi M, Mizutani M, Hanamura I, Nitta M. Importance of glutamine metabolism in leukemia cells by energy production through TCA cycle and by redox homeostasis. Cancer investigation. 2014 Jul 3;32(6):241-7. [CrossRef]
- Matre P, Velez J, Jacamo R, Qi Y, Su X, Cai T, Chan SM, Lodi A, Sweeney SR, Ma H, Davis RE. Inhibiting glutaminase in acute myeloid leukemia: metabolic dependency of selected AML subtypes. Oncotarget. 2016 Nov 11;7(48):79722. [CrossRef]
Figure 1.
(a) and (b): Expression of STK24 between AML and control carried out using TNM plot in both box plot and violin plot. Description: The expression of the gene STK24 is analysed in TNM plot where the expression of the gene is found to be varied in AML condition from the expression in the controls with significant p-value of 9.76e-23.
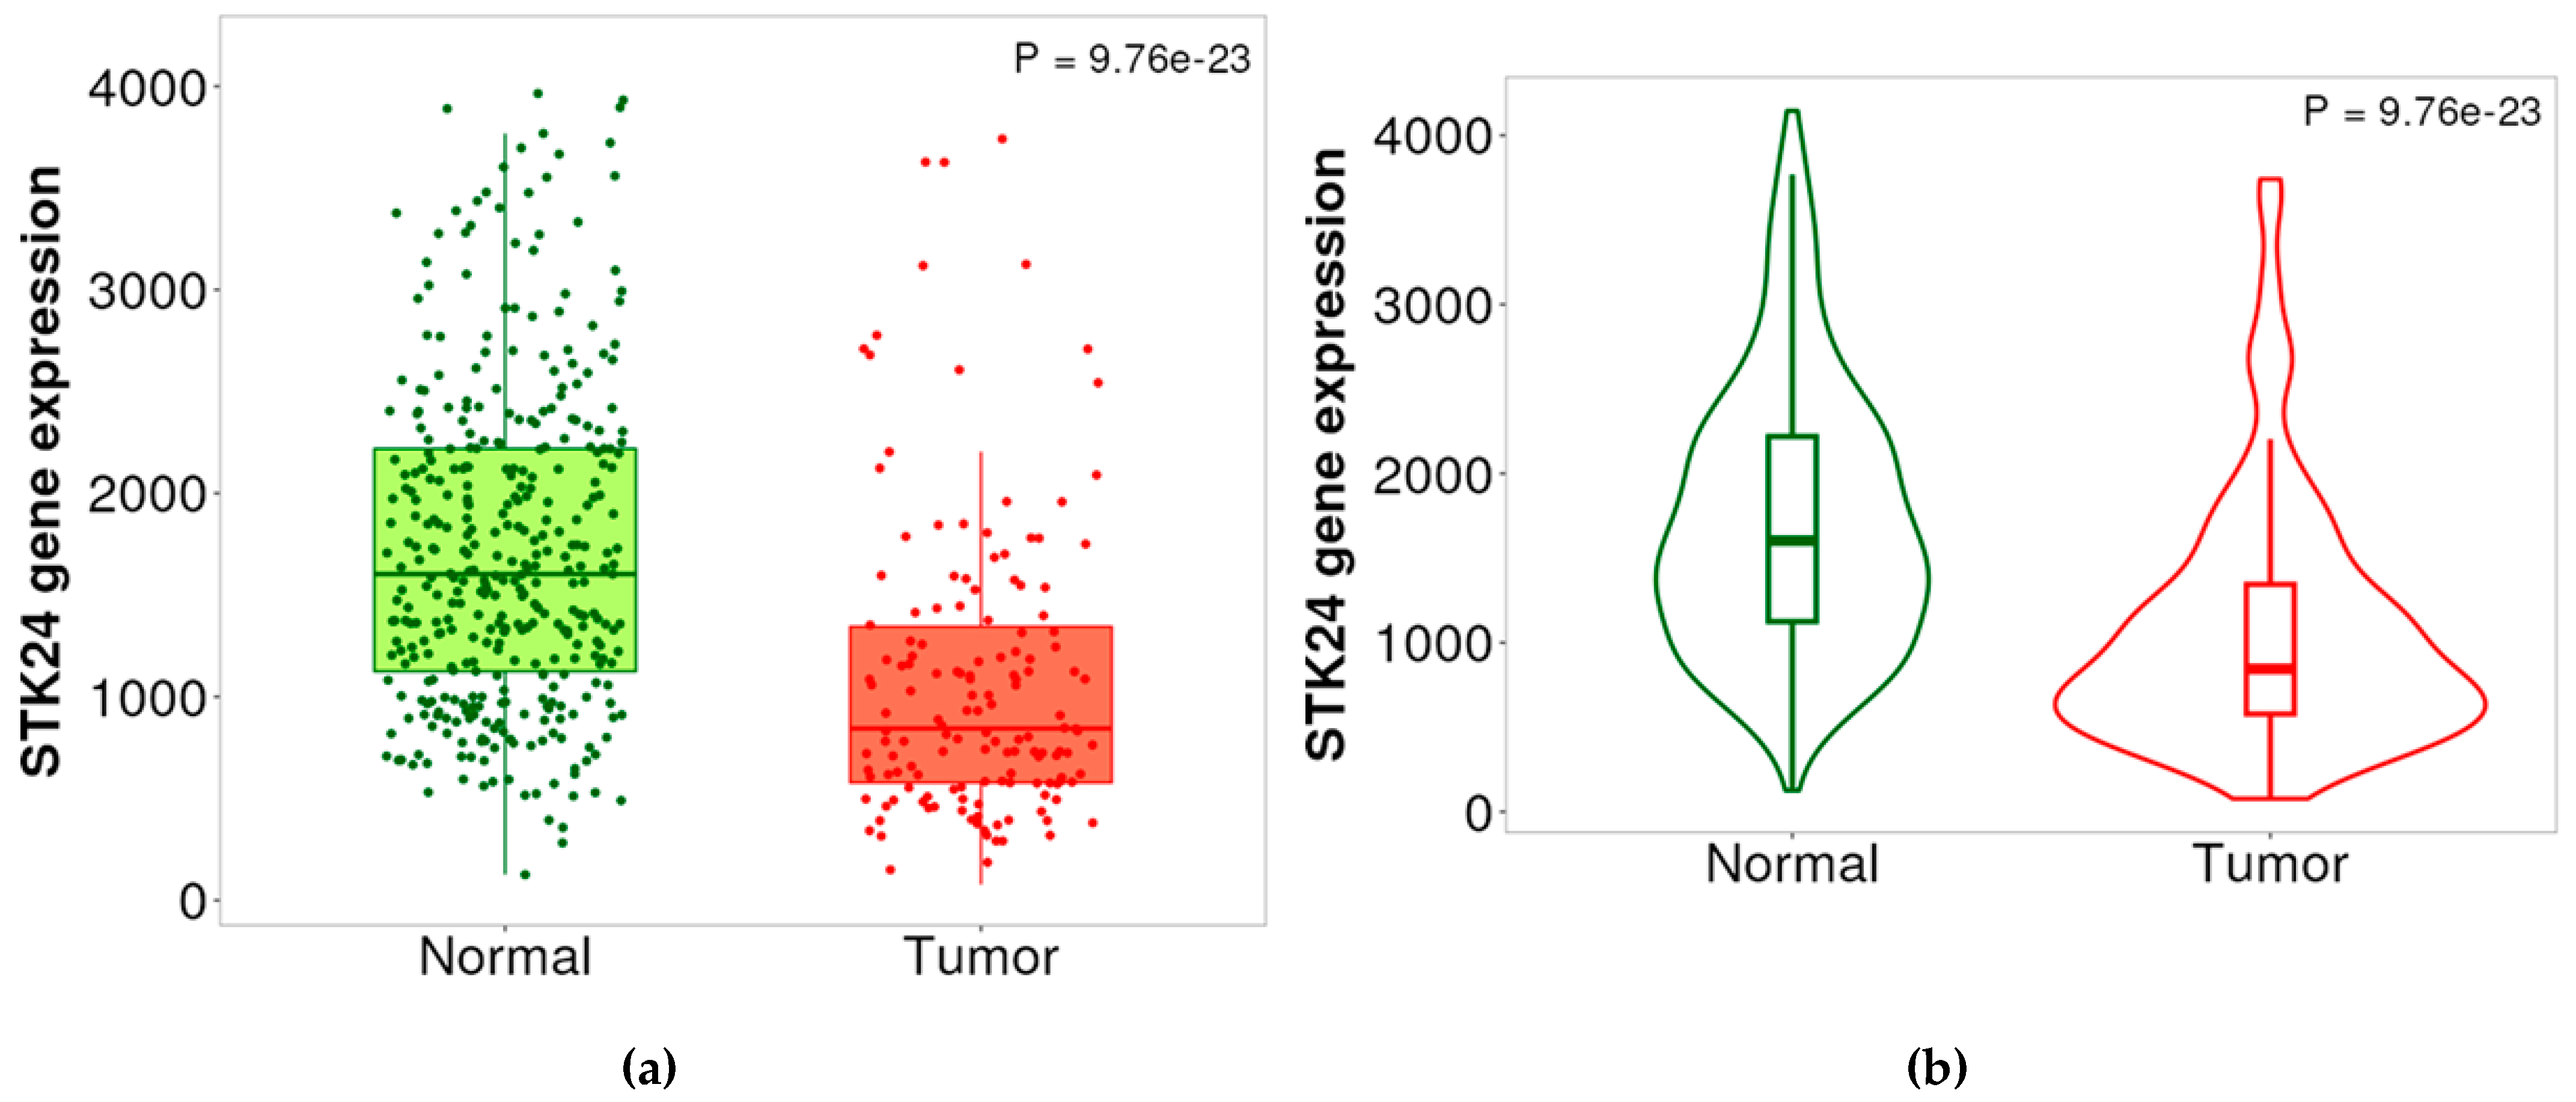
Figure 3.
Gene ontology analysis of co-expressed genes (Biological function). Description: Biological process of 200 co-expressed genes with enrichment in different biological process.
Figure 3.
Gene ontology analysis of co-expressed genes (Biological function). Description: Biological process of 200 co-expressed genes with enrichment in different biological process.
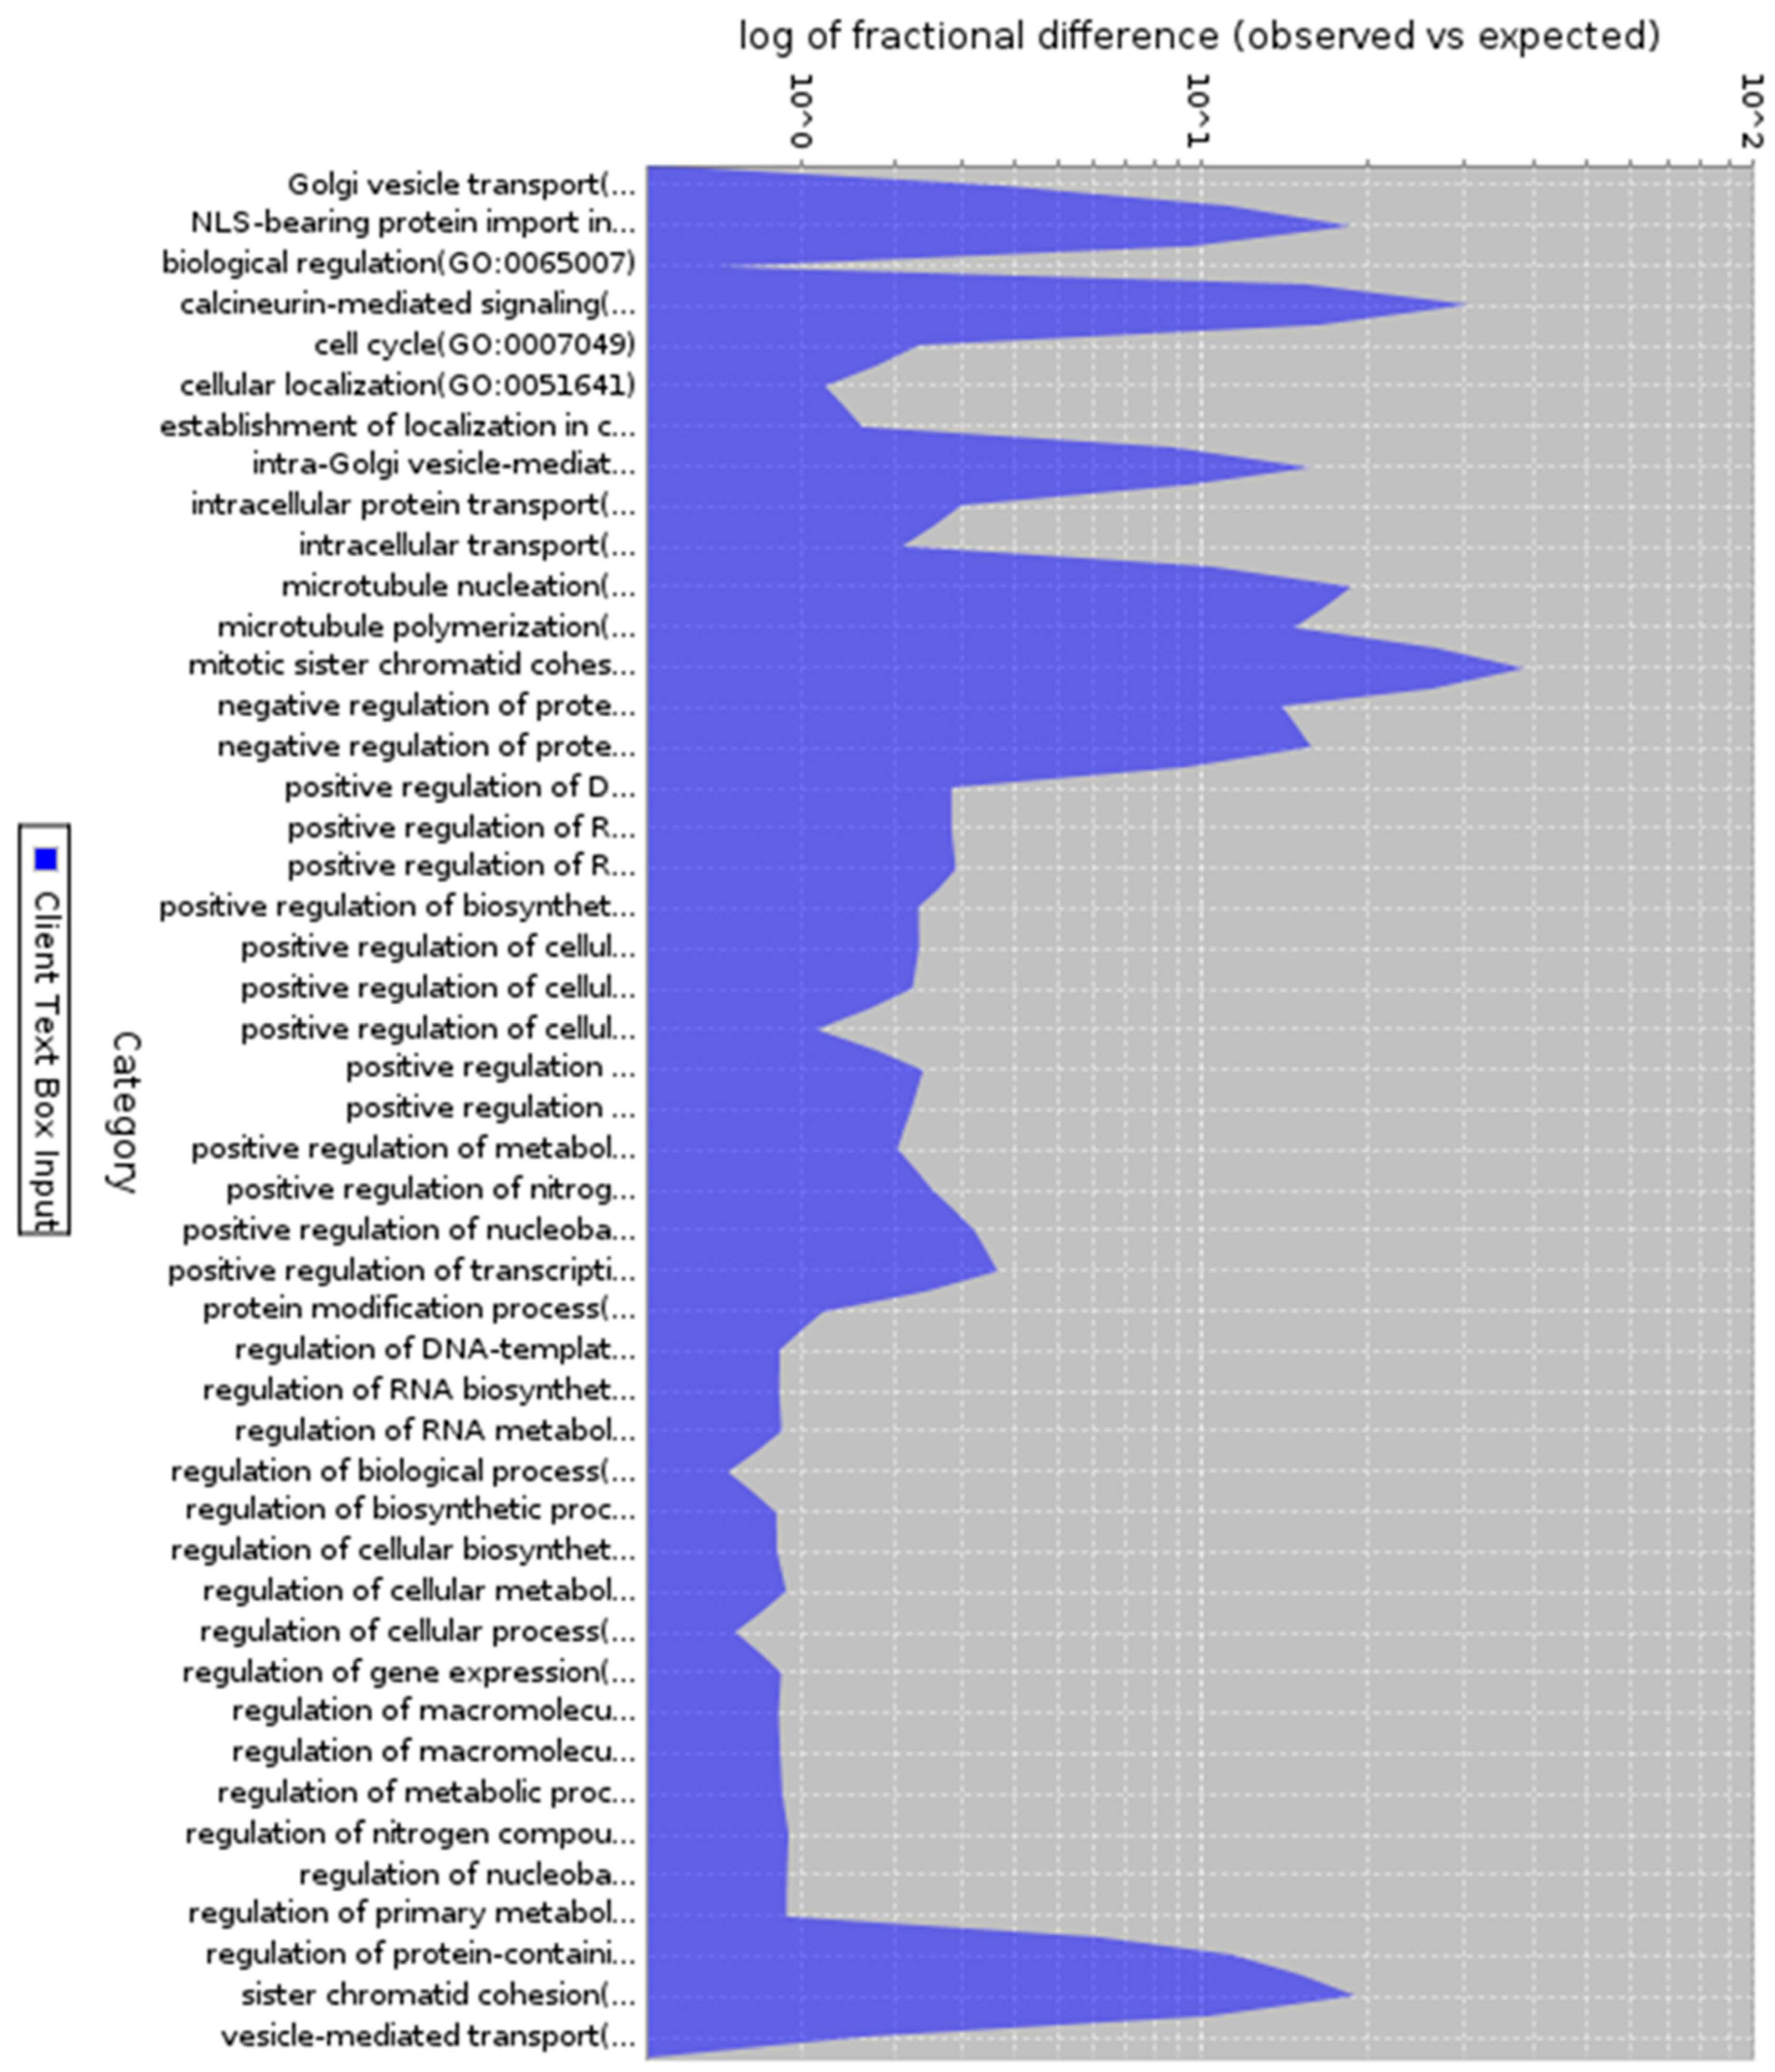
Figure 4.
Gene ontology analysis of co-expressed genes (Molecular process). Description: Molecular process of 200 co-expressed genes with enrichment in different molecular process.
Figure 4.
Gene ontology analysis of co-expressed genes (Molecular process). Description: Molecular process of 200 co-expressed genes with enrichment in different molecular process.
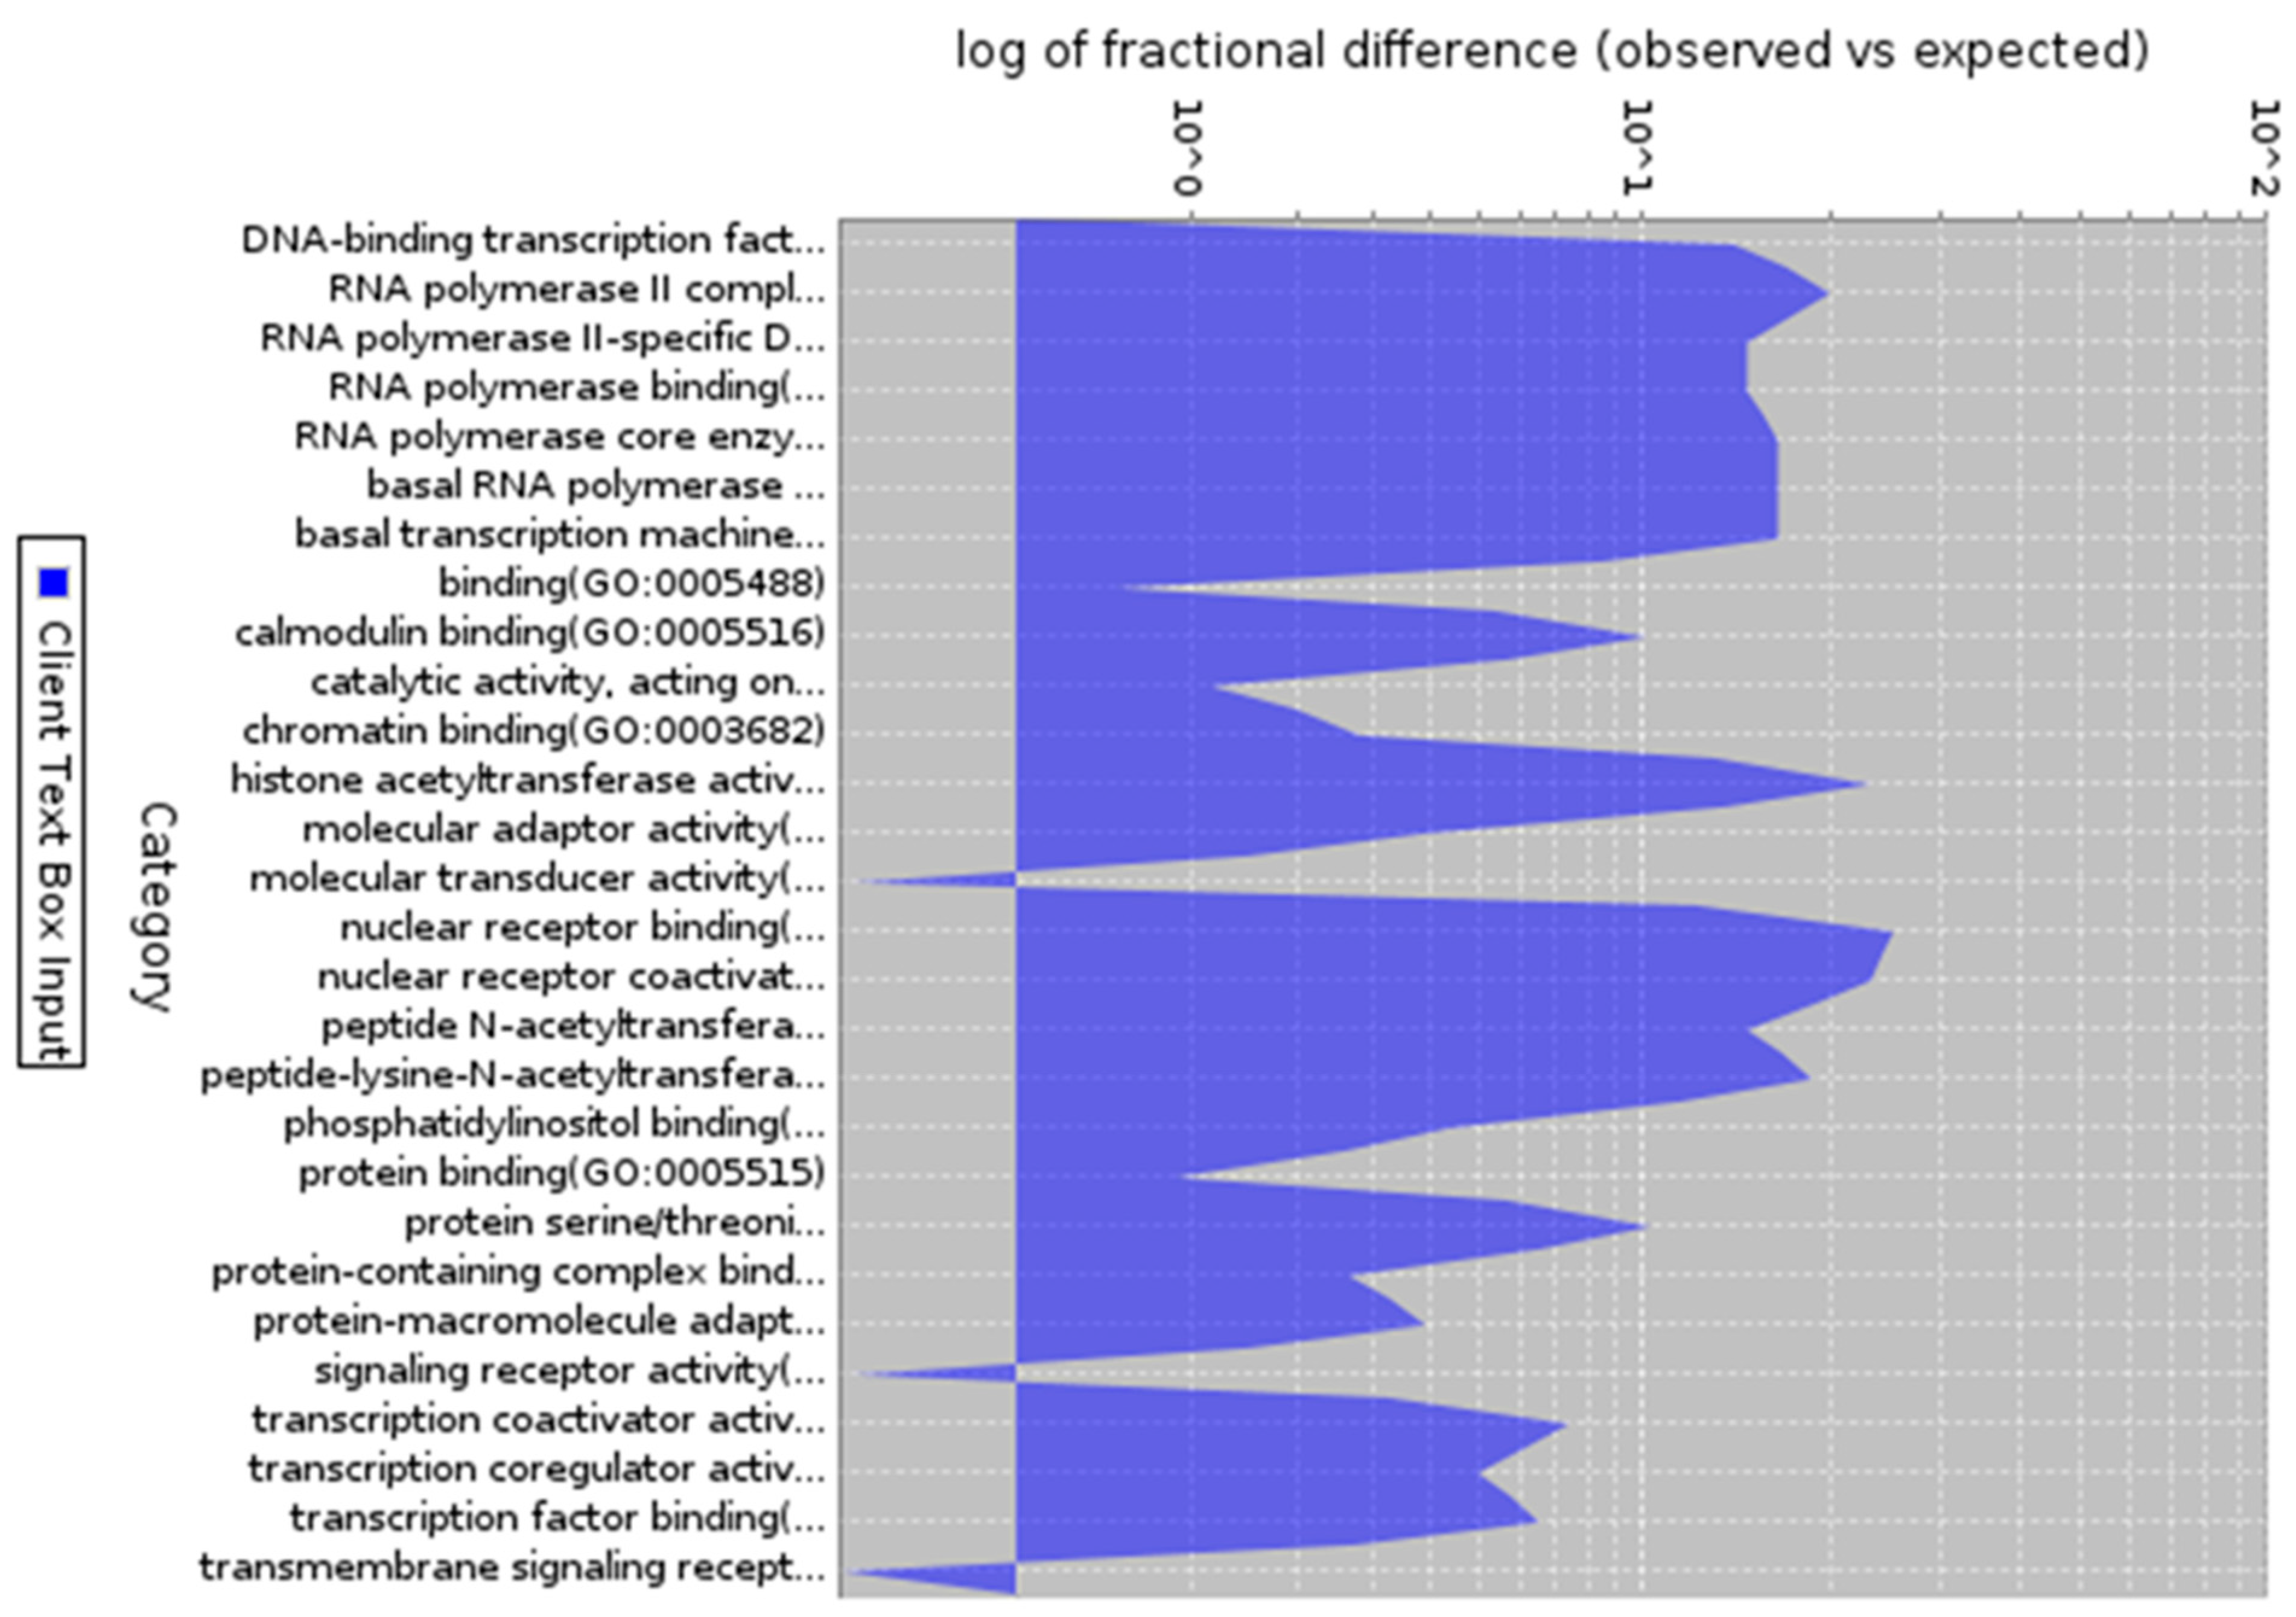
Figure 5.
Gene ontology analysis of co-expressed genes (Cellular component). Description: Cellular of 200 co-expressed genes with enrichment in different cellular localization.
Figure 5.
Gene ontology analysis of co-expressed genes (Cellular component). Description: Cellular of 200 co-expressed genes with enrichment in different cellular localization.
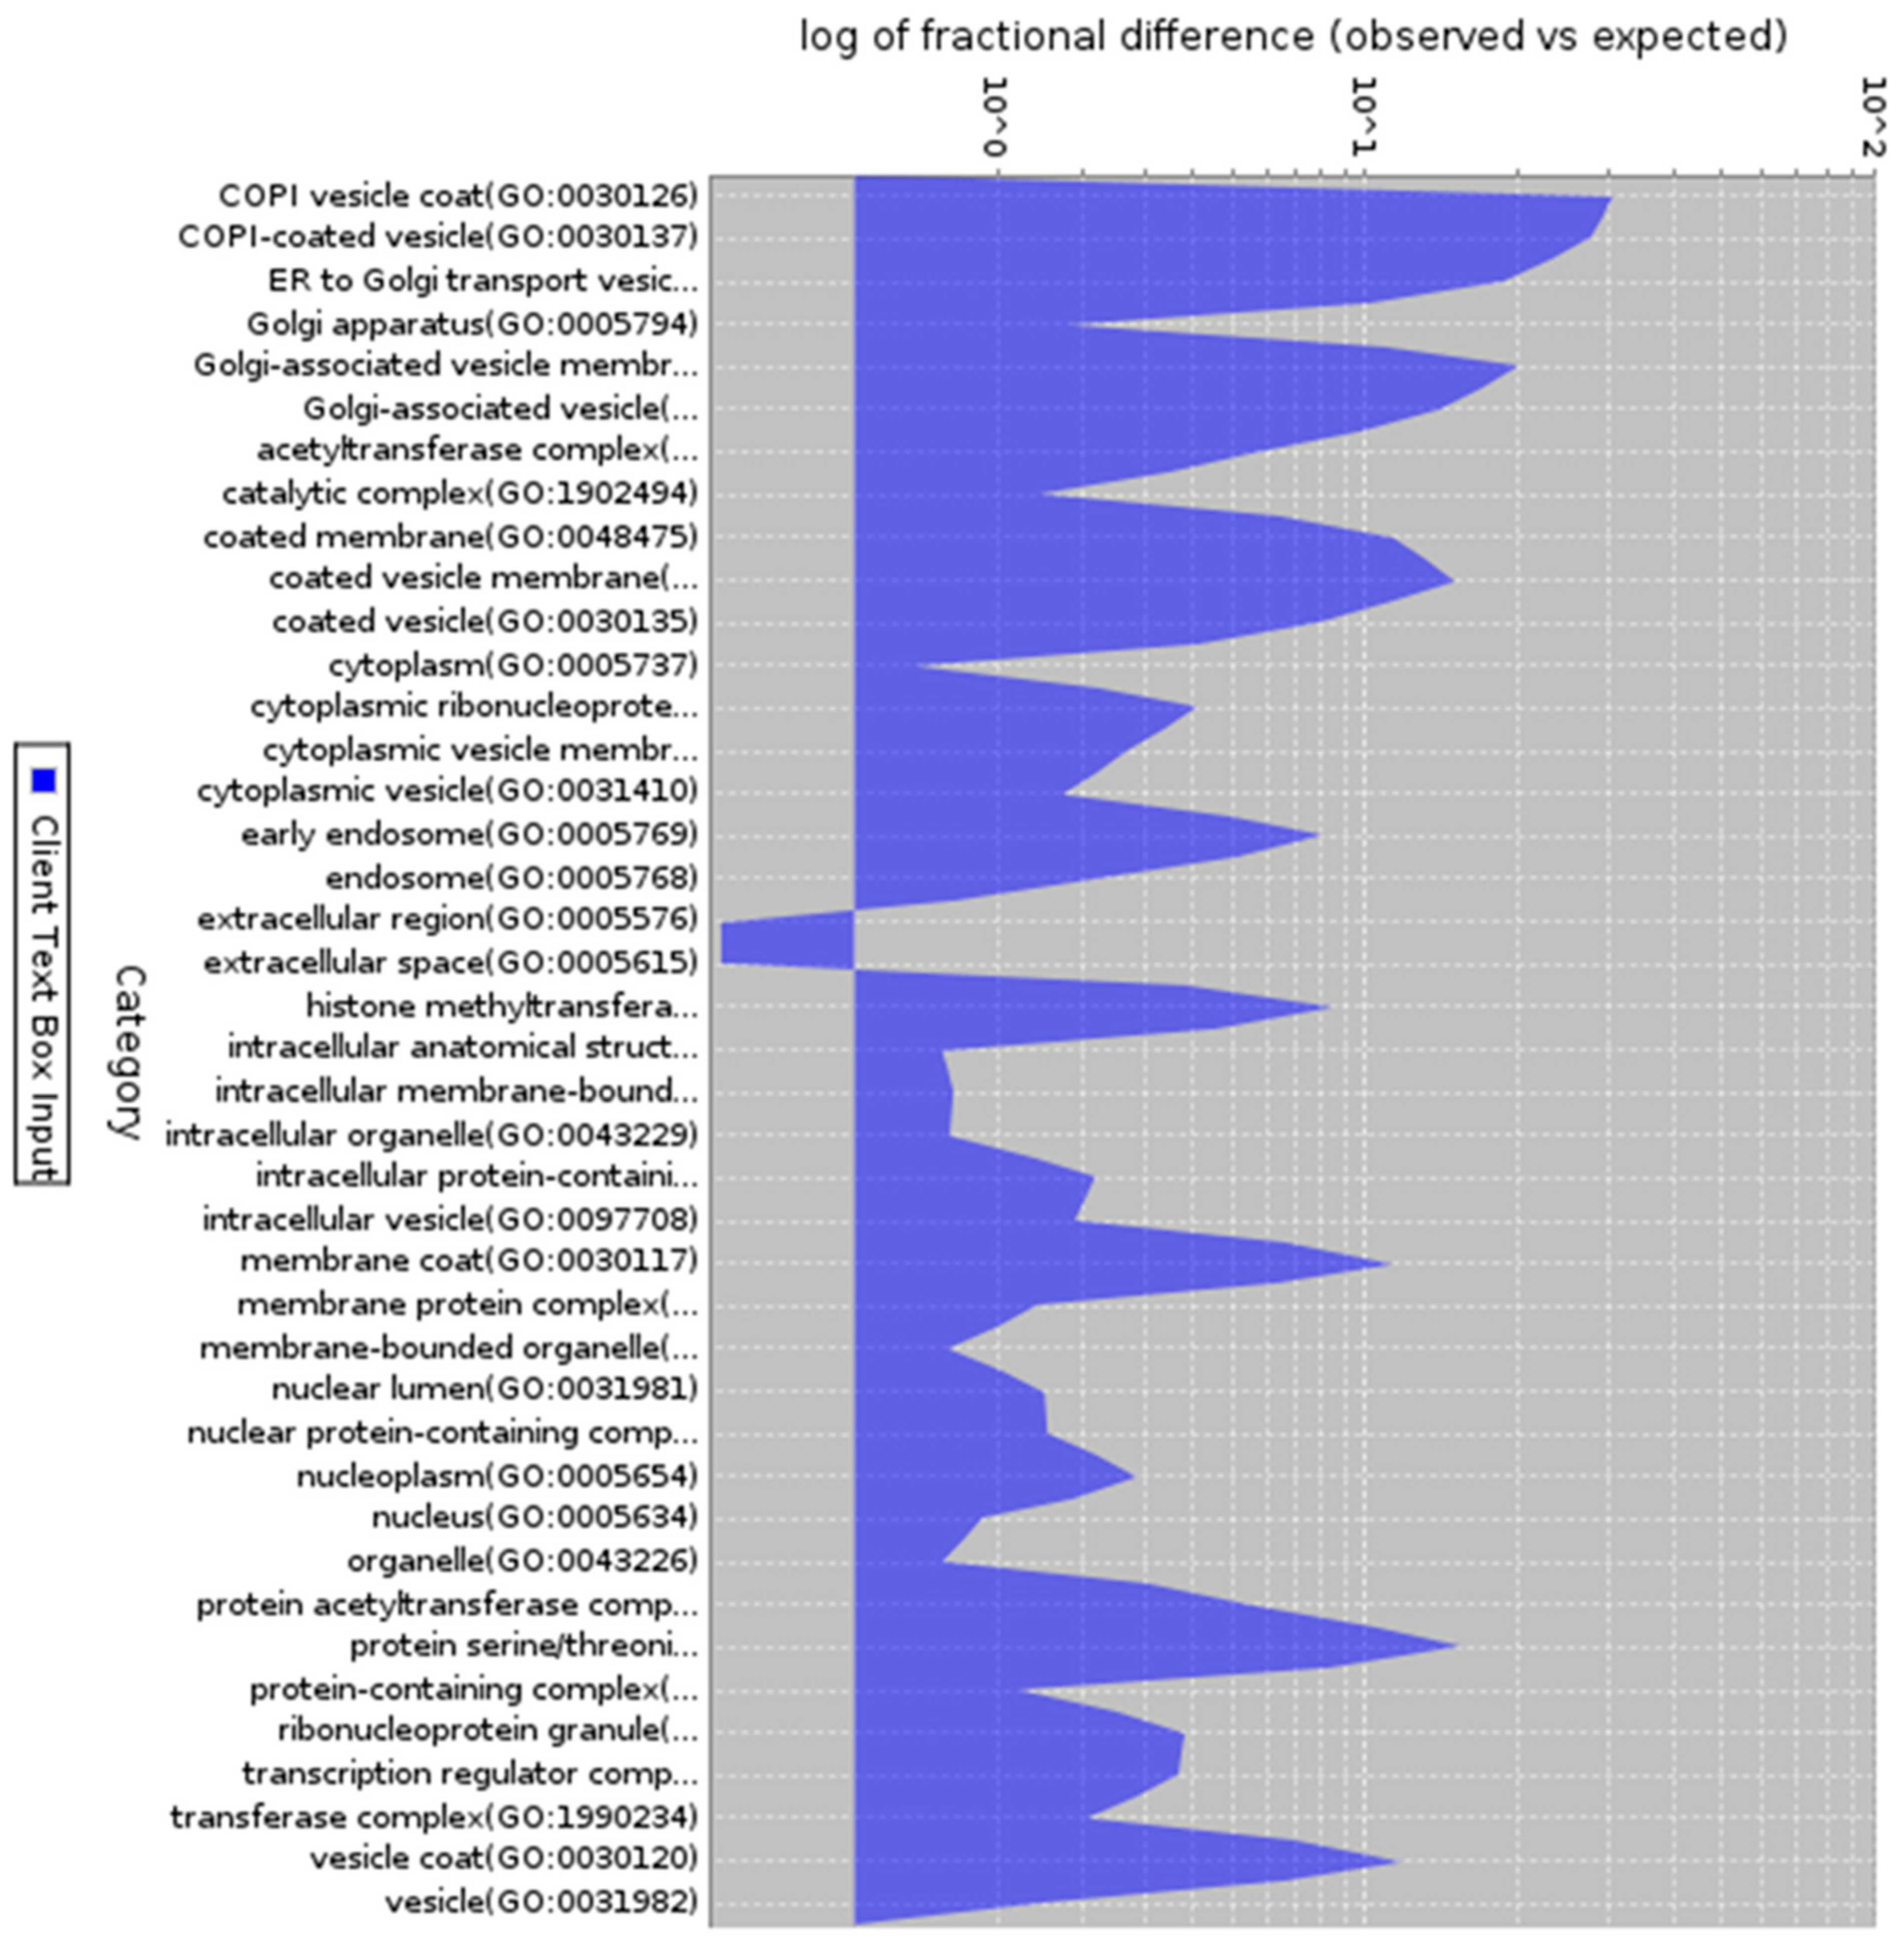
Figure 6.
Enrichment analysis in pathway analysis. Description: Pathway analysis of the 200 co-expressed genes that have enrichment in B-cell activation, T cell activation and Wnt Signaling pathway with fold enrichment of 7.61, 7.41 and 3.43.
Figure 6.
Enrichment analysis in pathway analysis. Description: Pathway analysis of the 200 co-expressed genes that have enrichment in B-cell activation, T cell activation and Wnt Signaling pathway with fold enrichment of 7.61, 7.41 and 3.43.
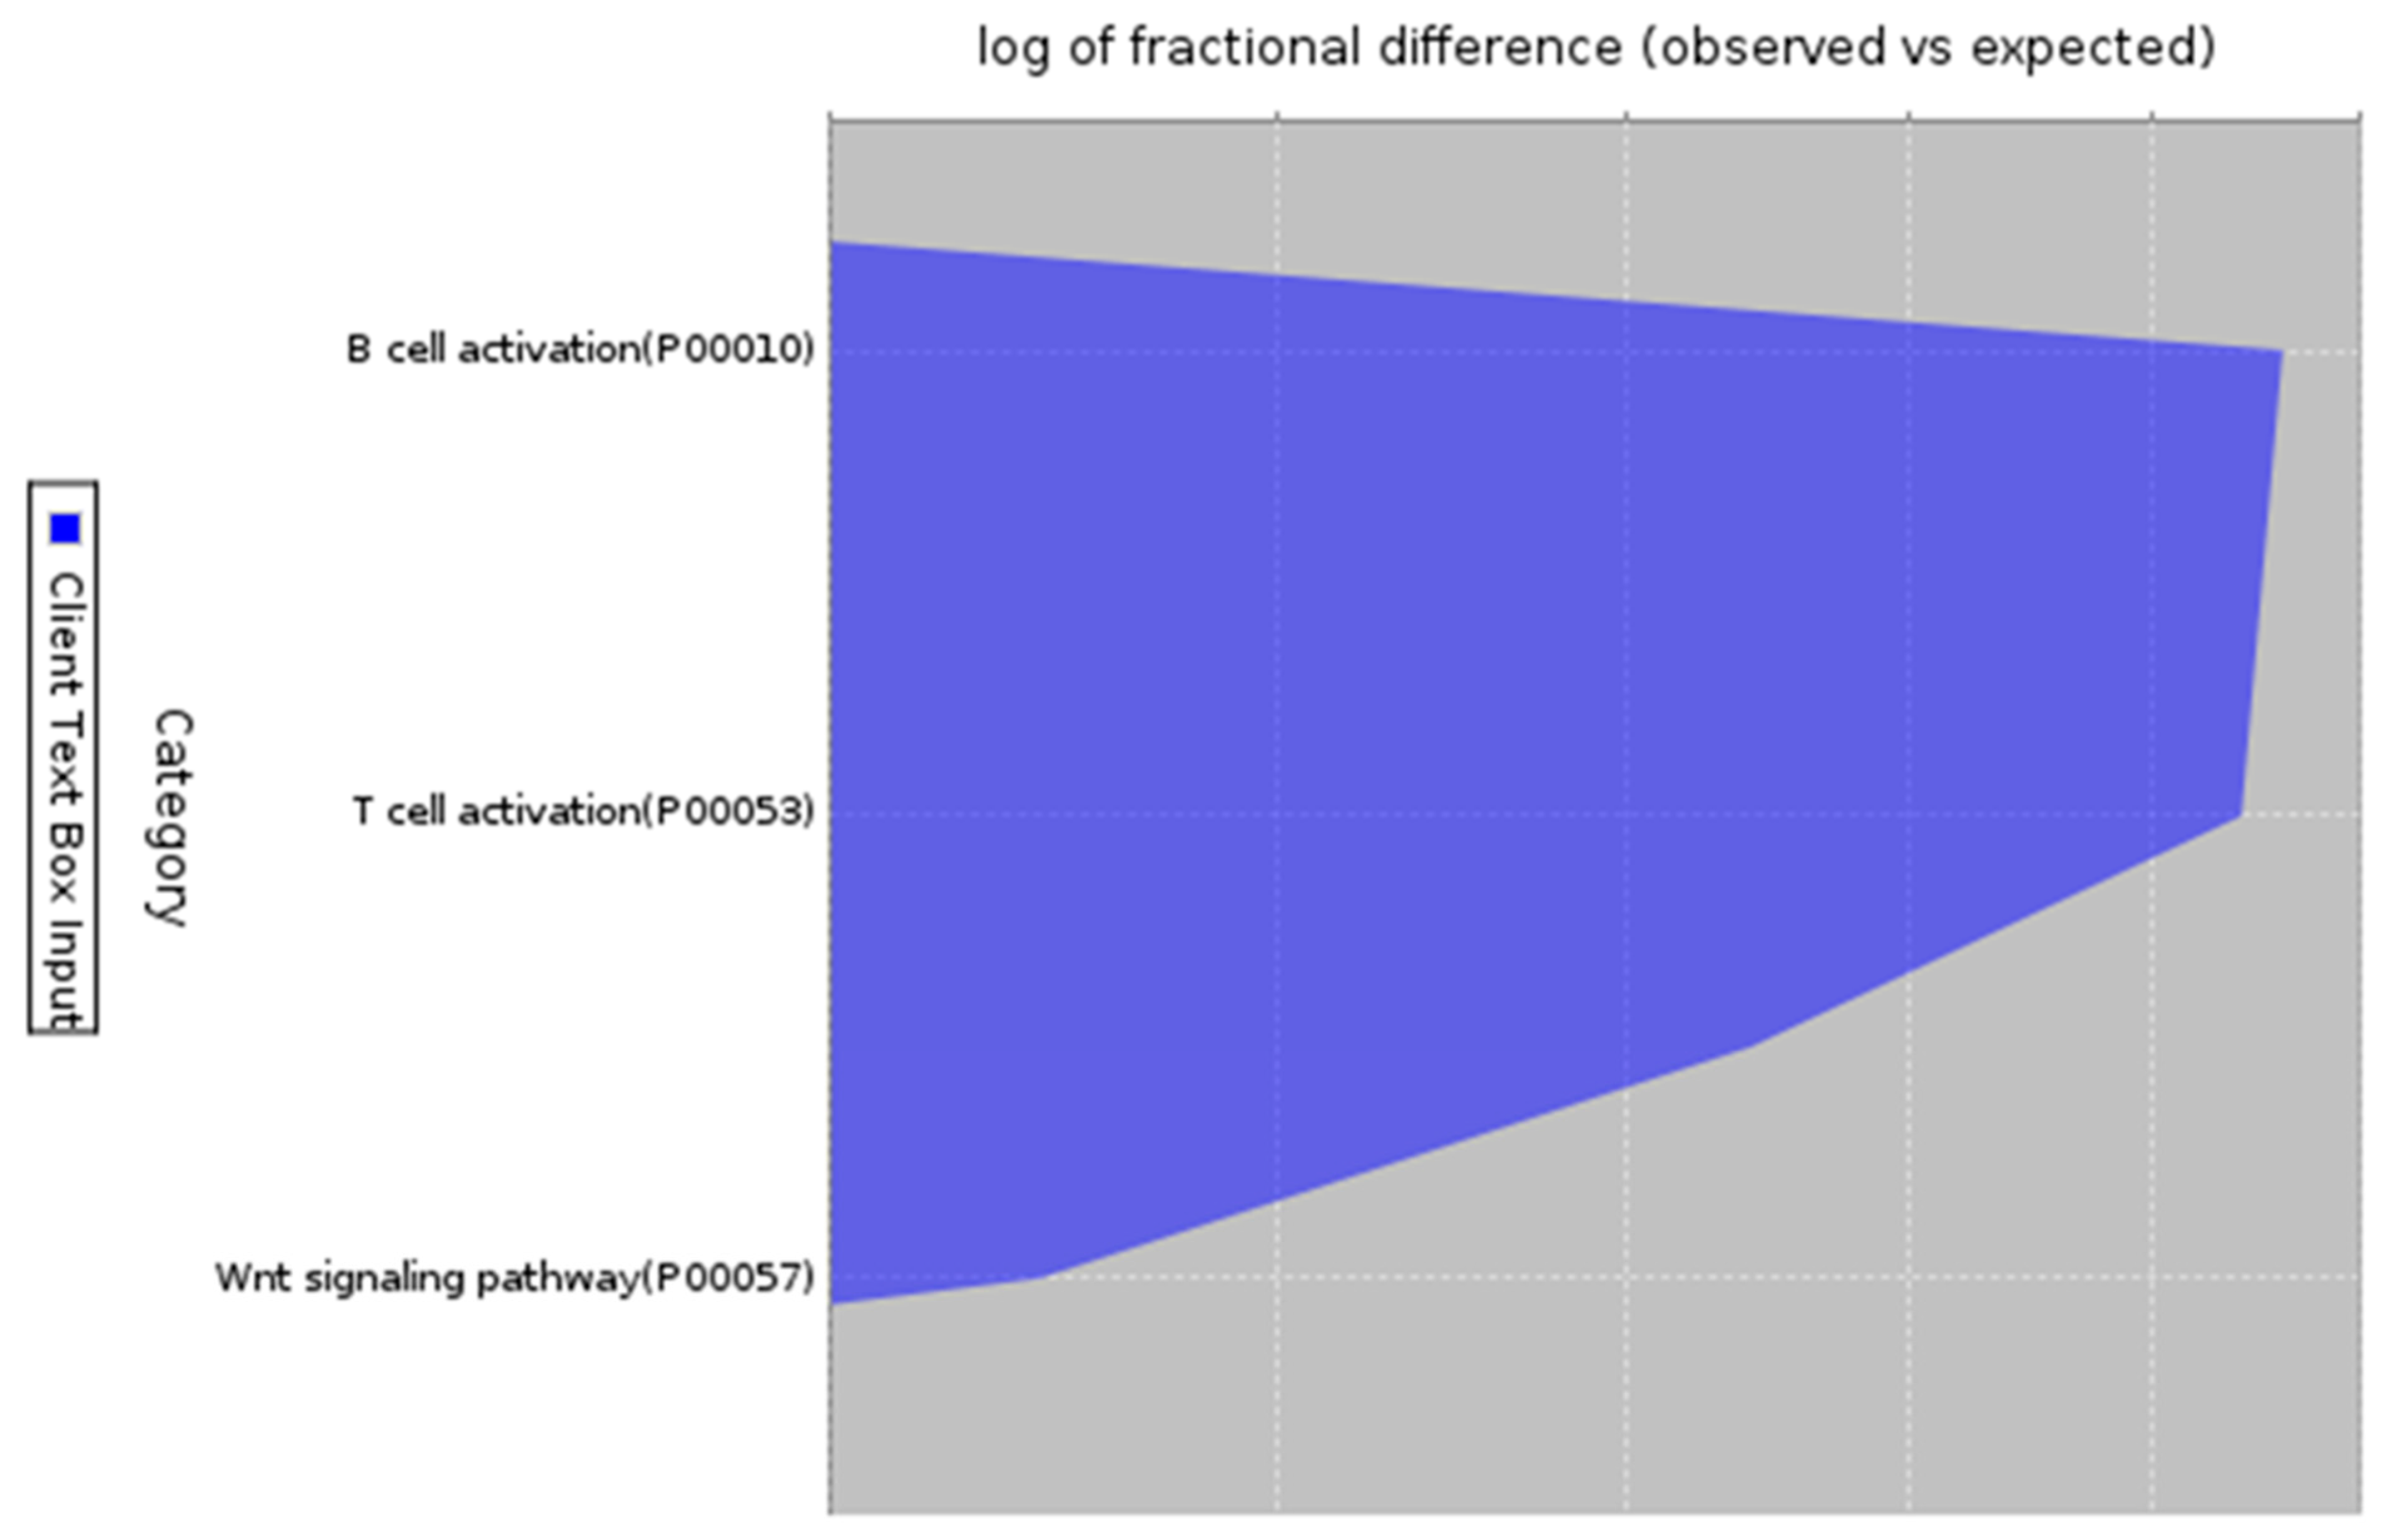
Figure 7.
Survival analysis related with the expression of STK24 for 5-year analysis. Description: The survival analysis of AML patient with relation to the expression of STK24 is found to be significant with p-value of 1.6e – 05. Median survival with lower expression of STK24 is 10.8 months and with higher expression the median survival time is 17.5 months.
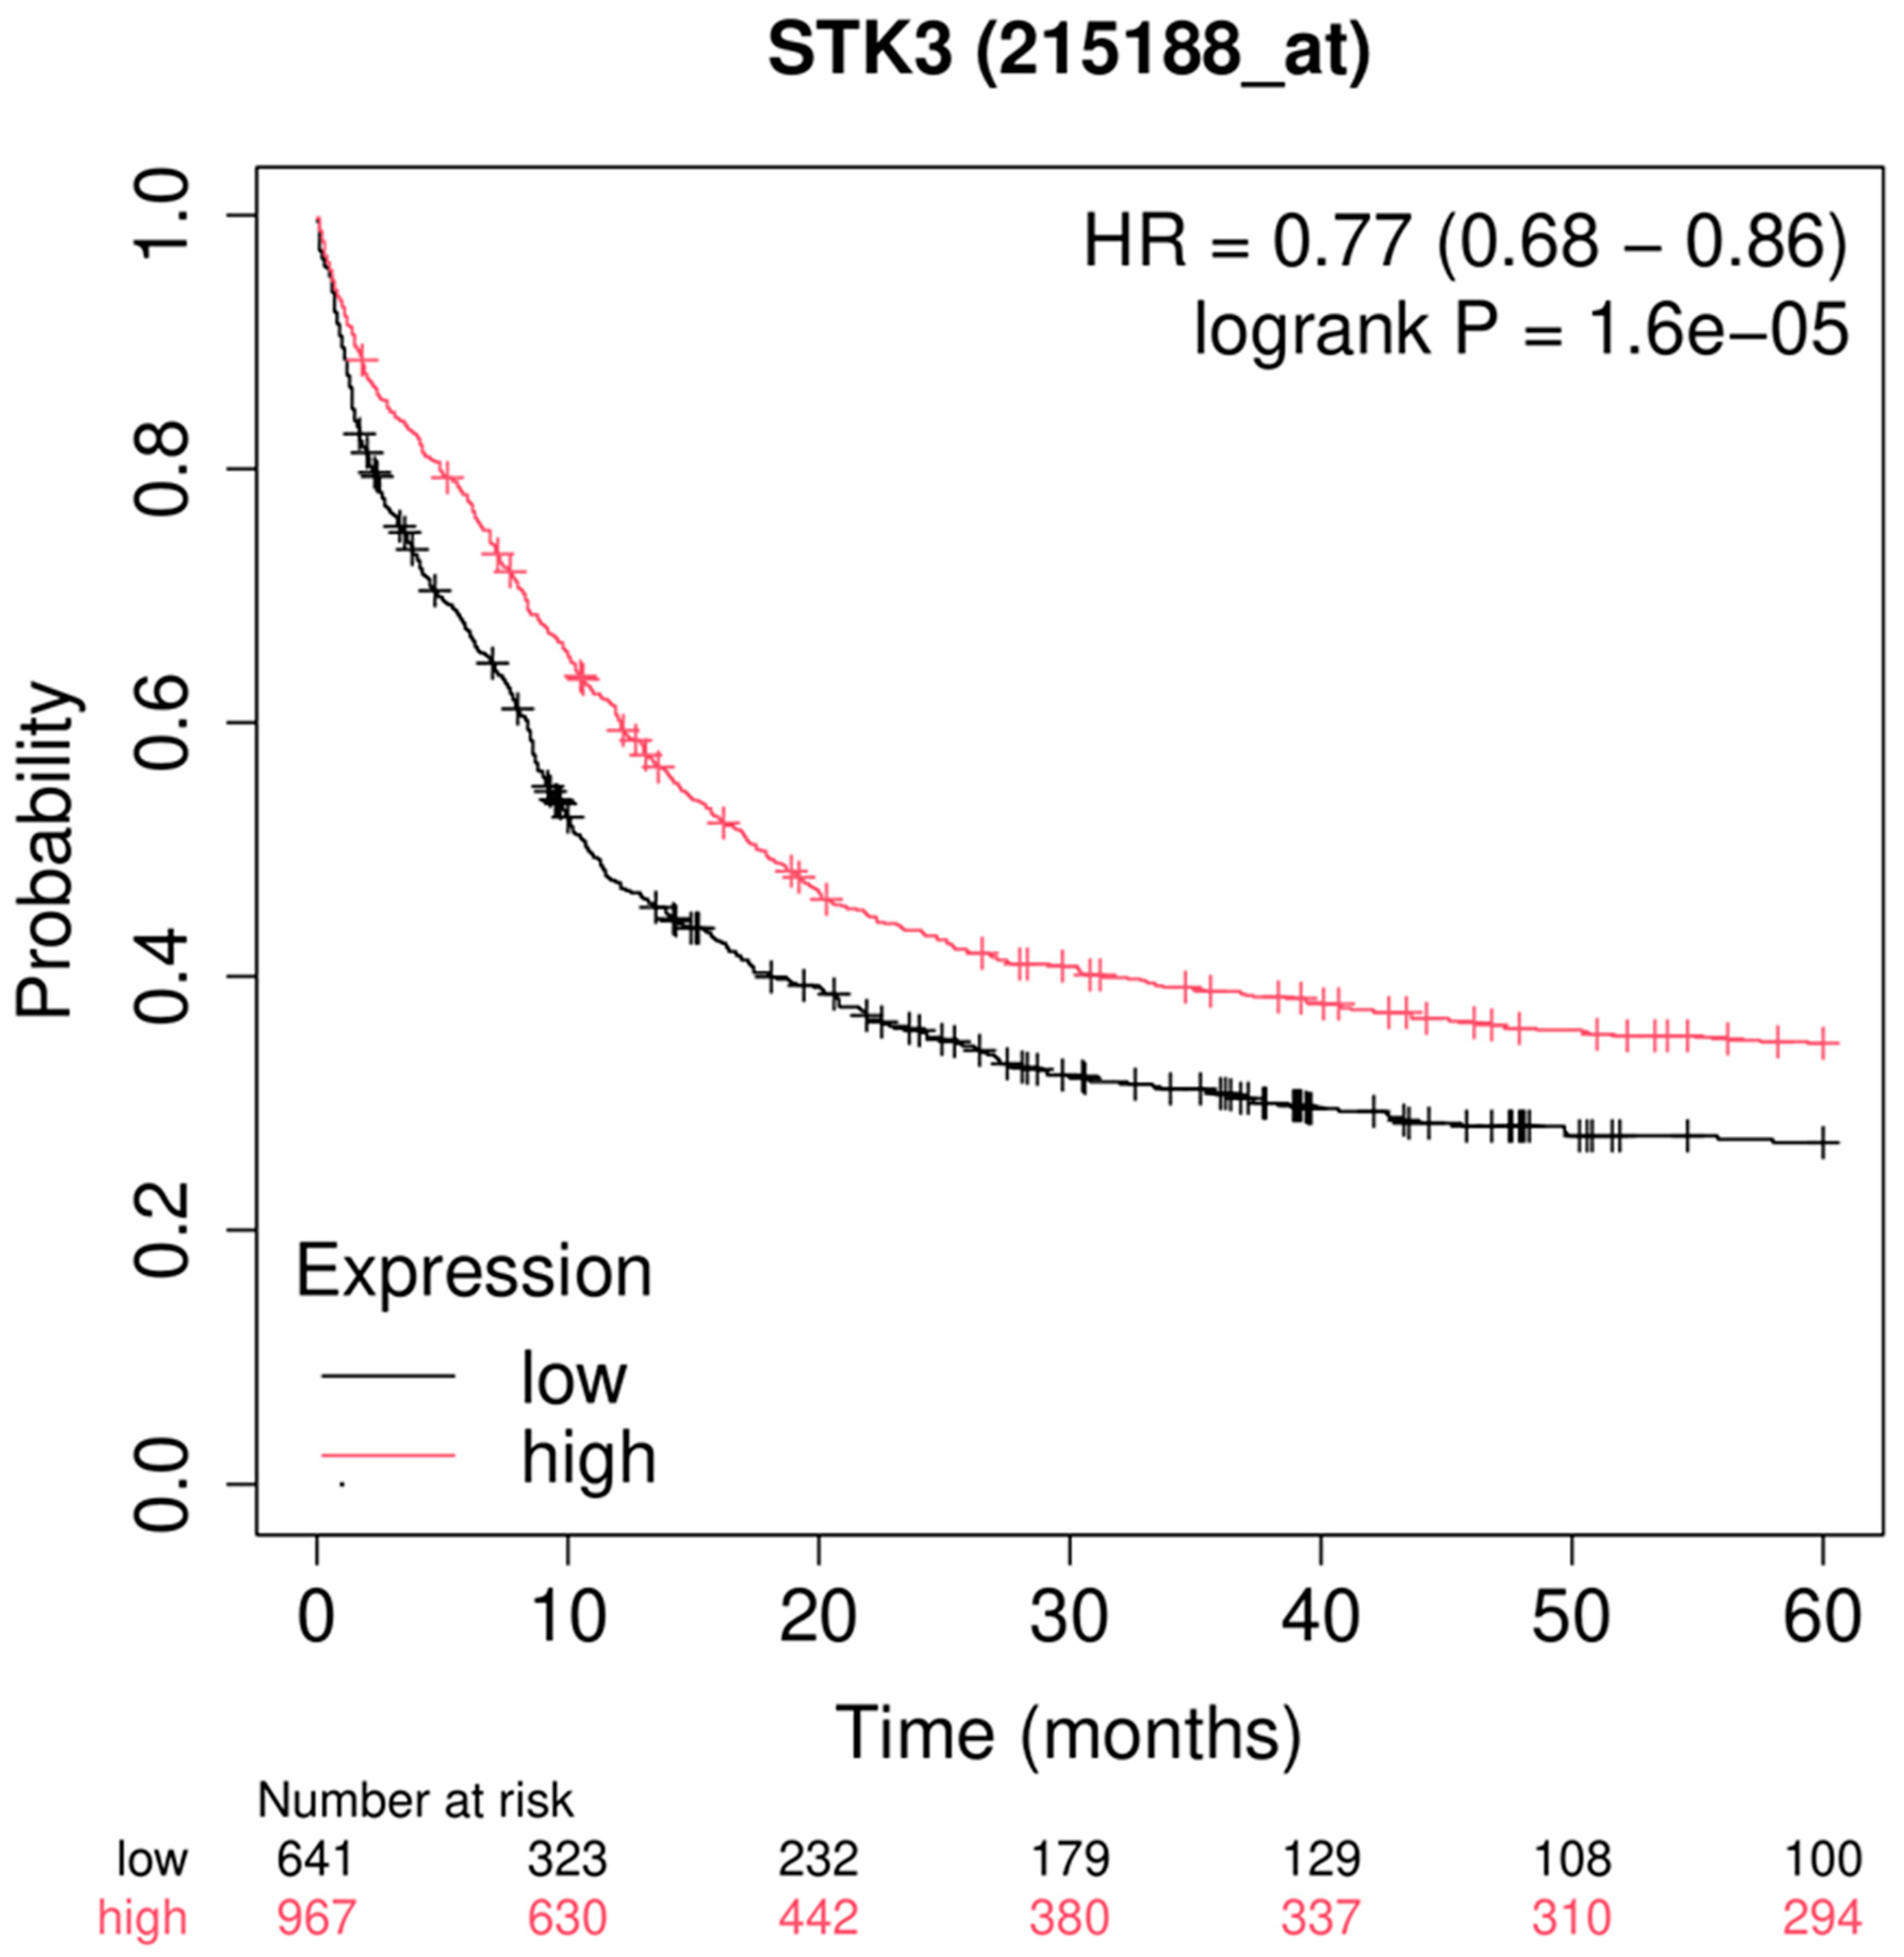
Figure 8.
Interaction of different protein with STK24 (String Database). Description: The interaction of more than 50 protein with STK24 are visualised by STRING database.
Figure 8.
Interaction of different protein with STK24 (String Database). Description: The interaction of more than 50 protein with STK24 are visualised by STRING database.
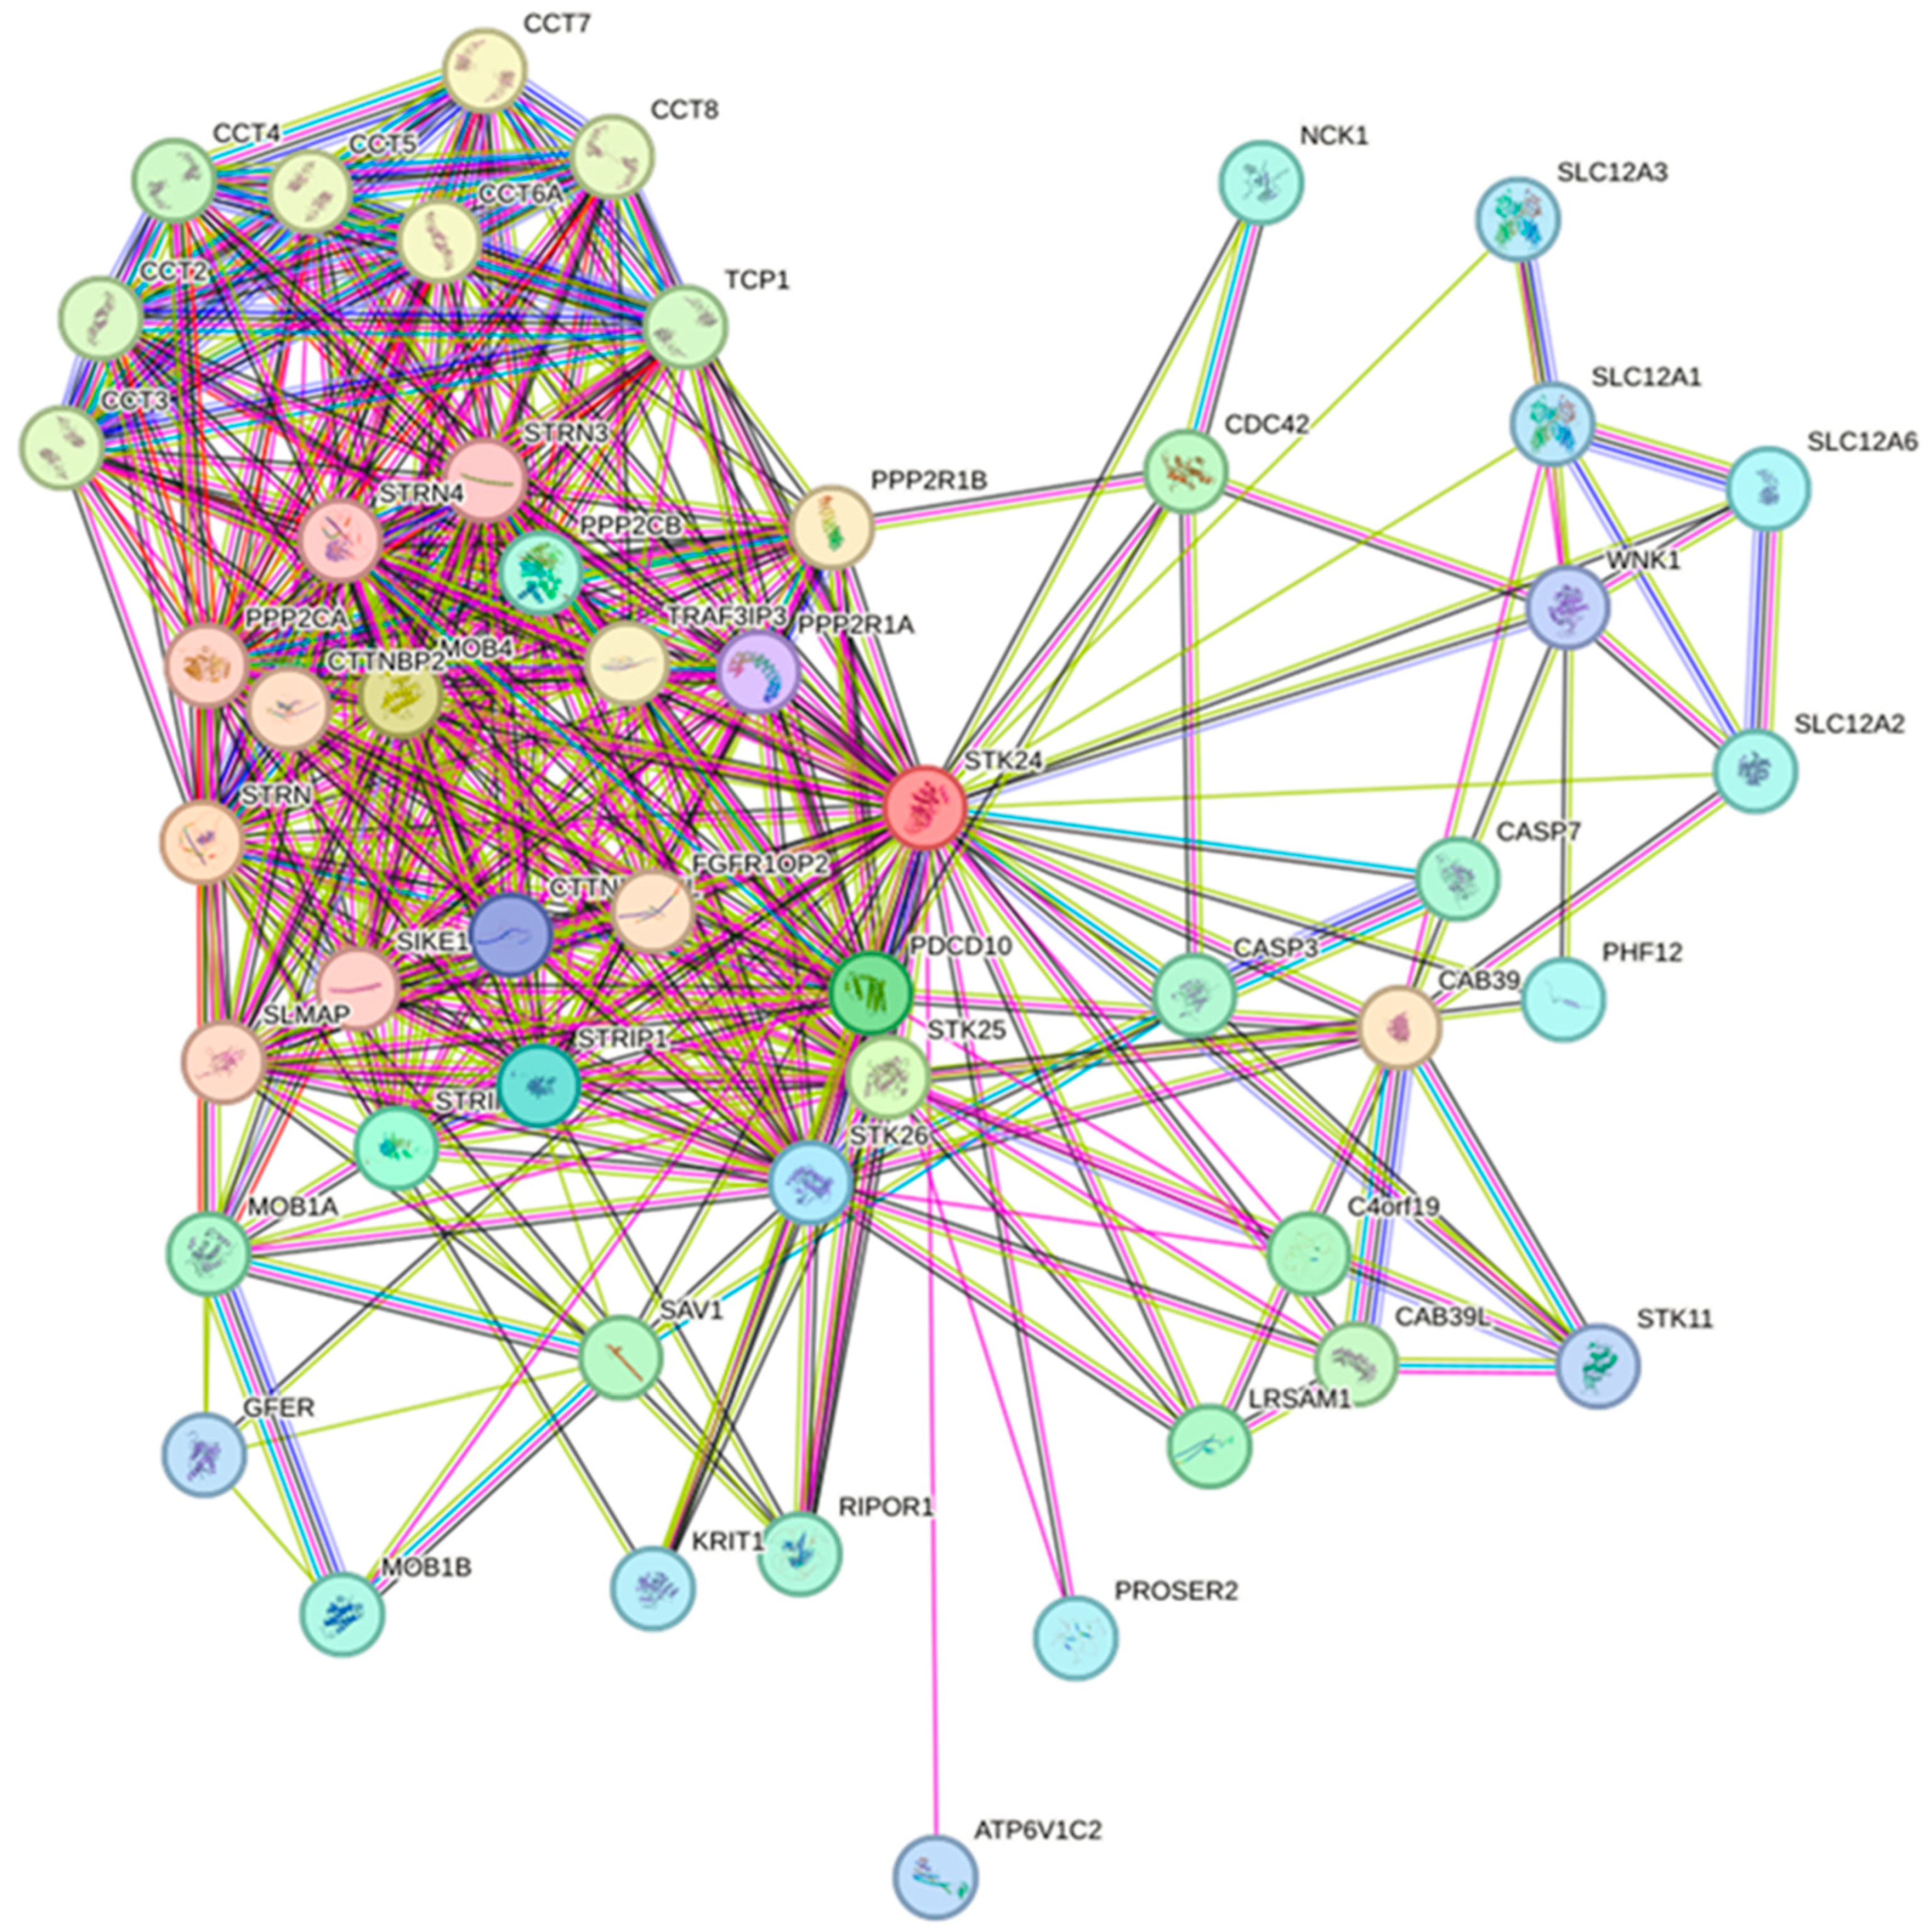
Figure 9.
Protein-protein interaction of the STK24 with other proteins. Description: Among the gene top 20 gene are found to have high degree of interaction which is visualised in a circle format by Cytoscape with 4 highest degree depicted.
Figure 9.
Protein-protein interaction of the STK24 with other proteins. Description: Among the gene top 20 gene are found to have high degree of interaction which is visualised in a circle format by Cytoscape with 4 highest degree depicted.
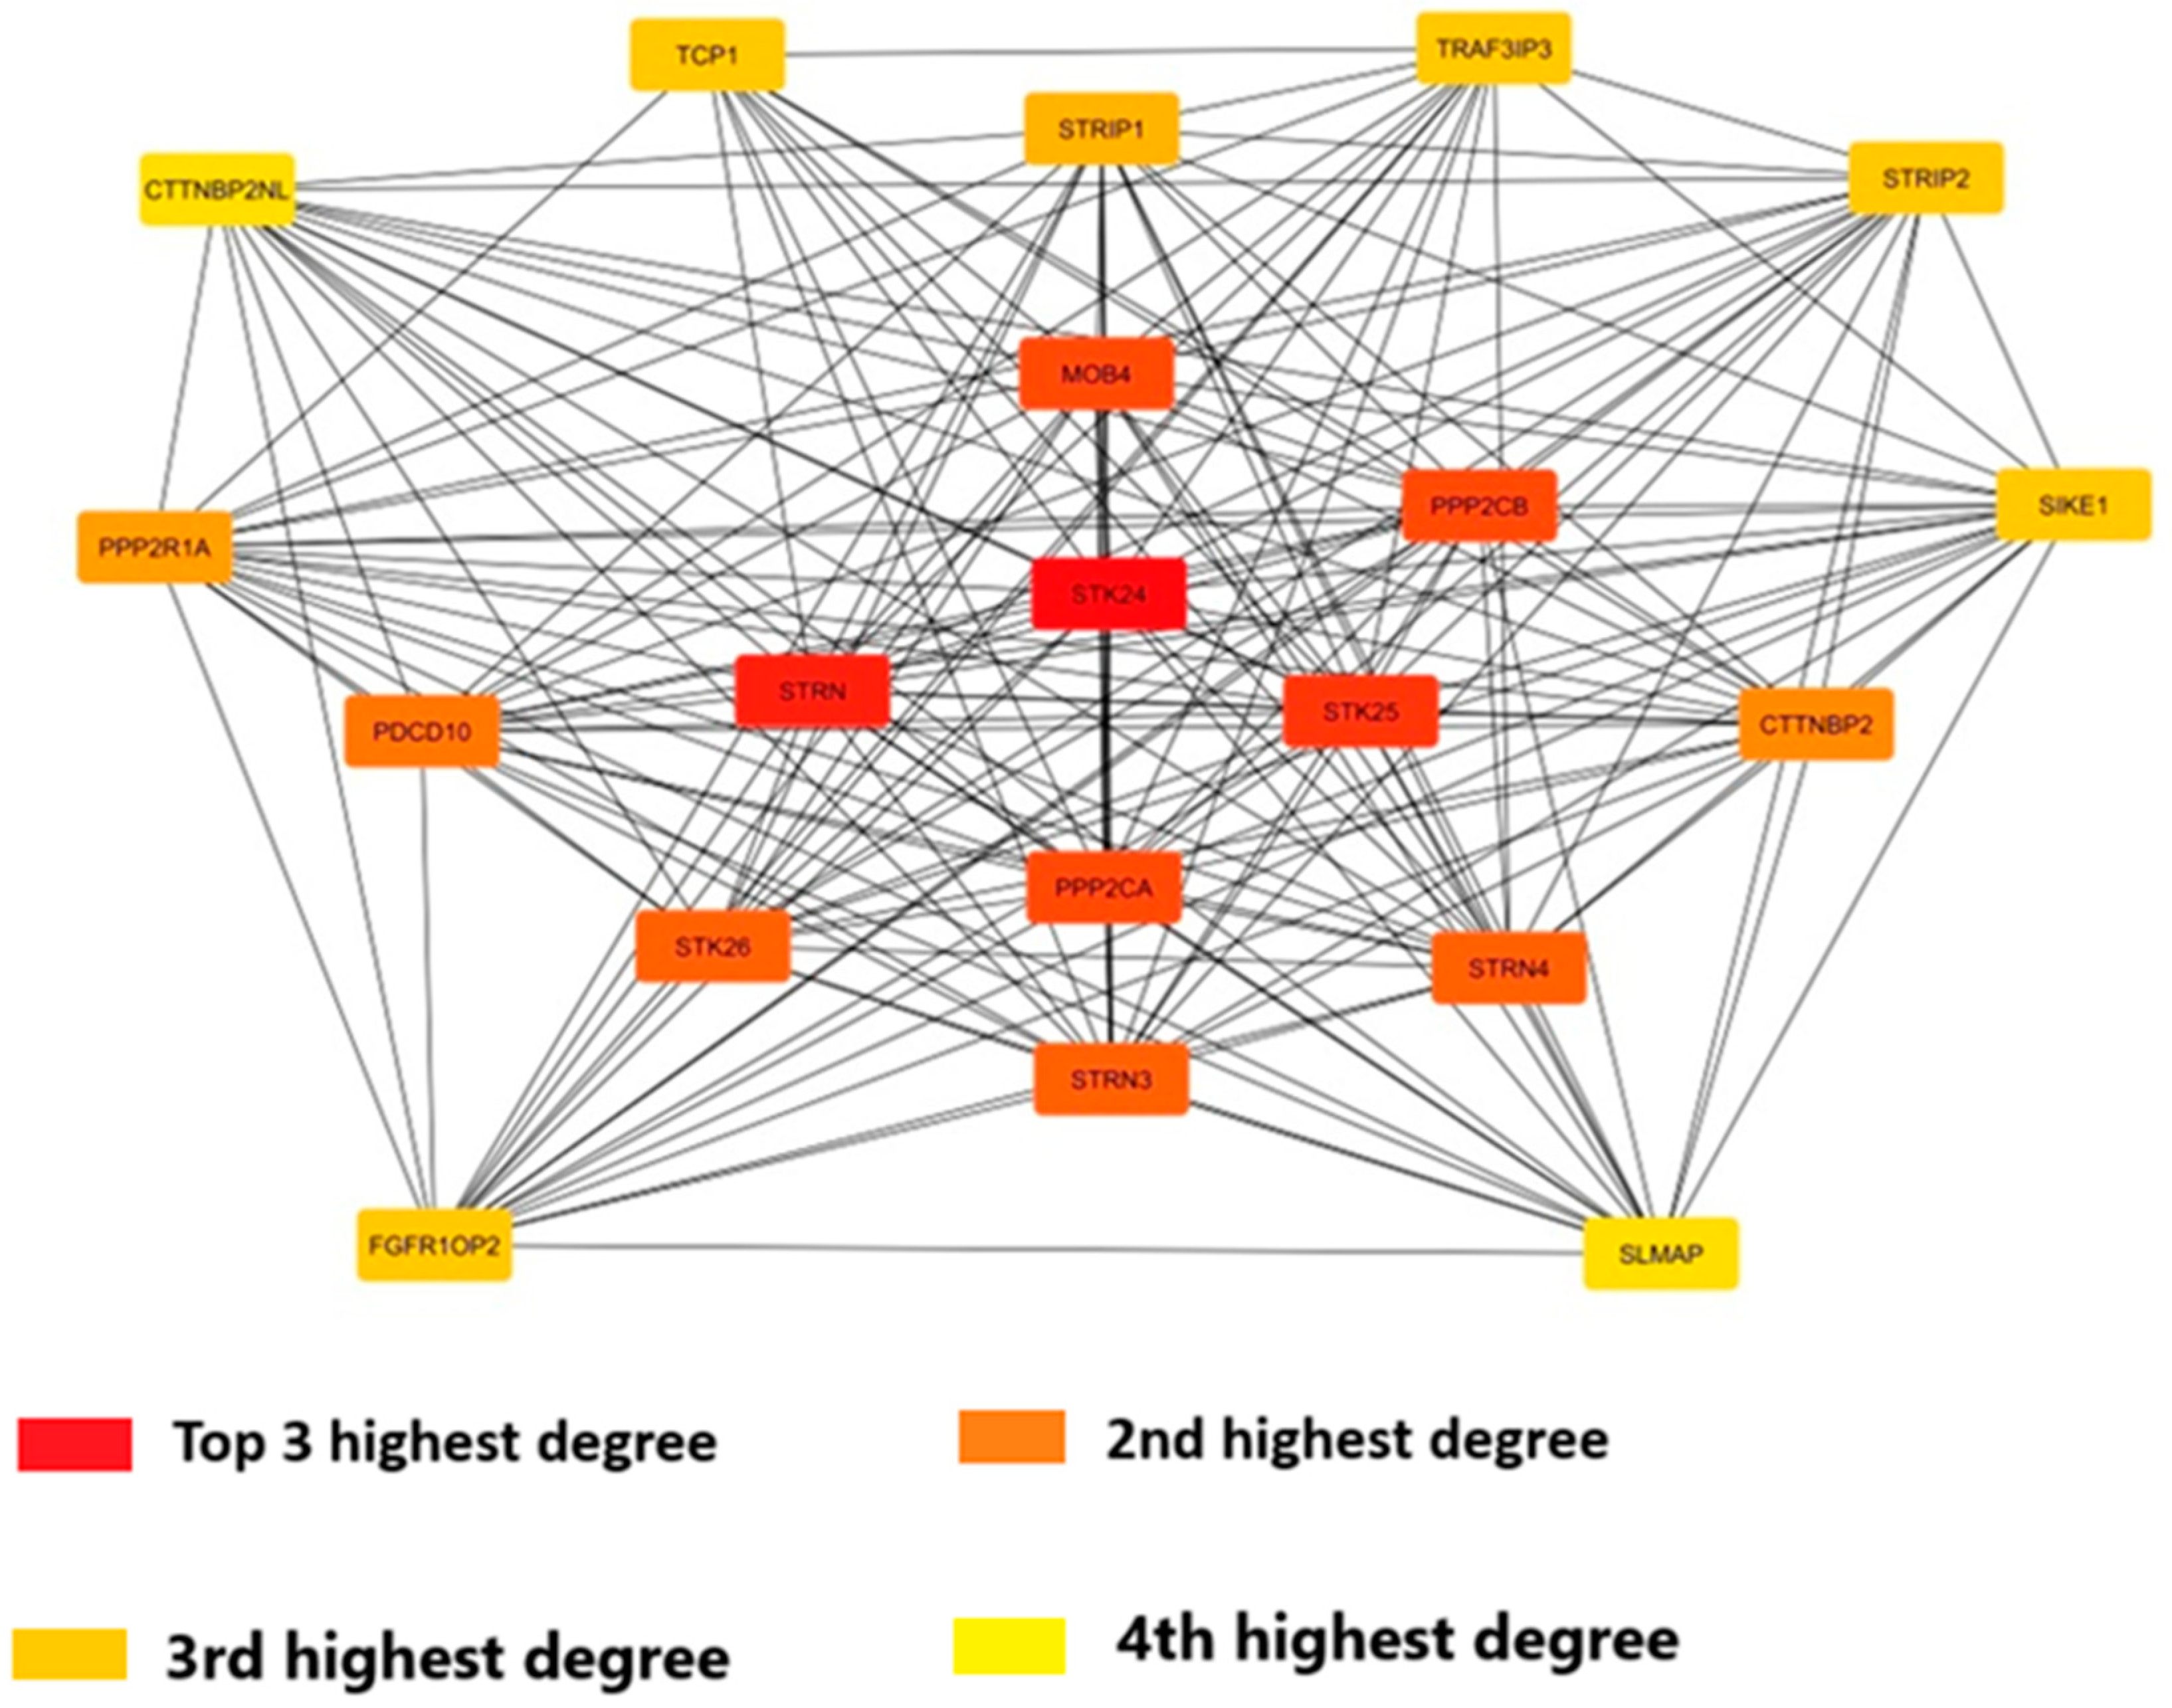
Figure 10.
Correlation analysis of STK24 to FLT3. Description: The correlation analysis of the target gene STK24 with FLT3 is found to have significant correlation with a significant p value of 0.000141 and r value of -0.6.
Figure 10.
Correlation analysis of STK24 to FLT3. Description: The correlation analysis of the target gene STK24 with FLT3 is found to have significant correlation with a significant p value of 0.000141 and r value of -0.6.
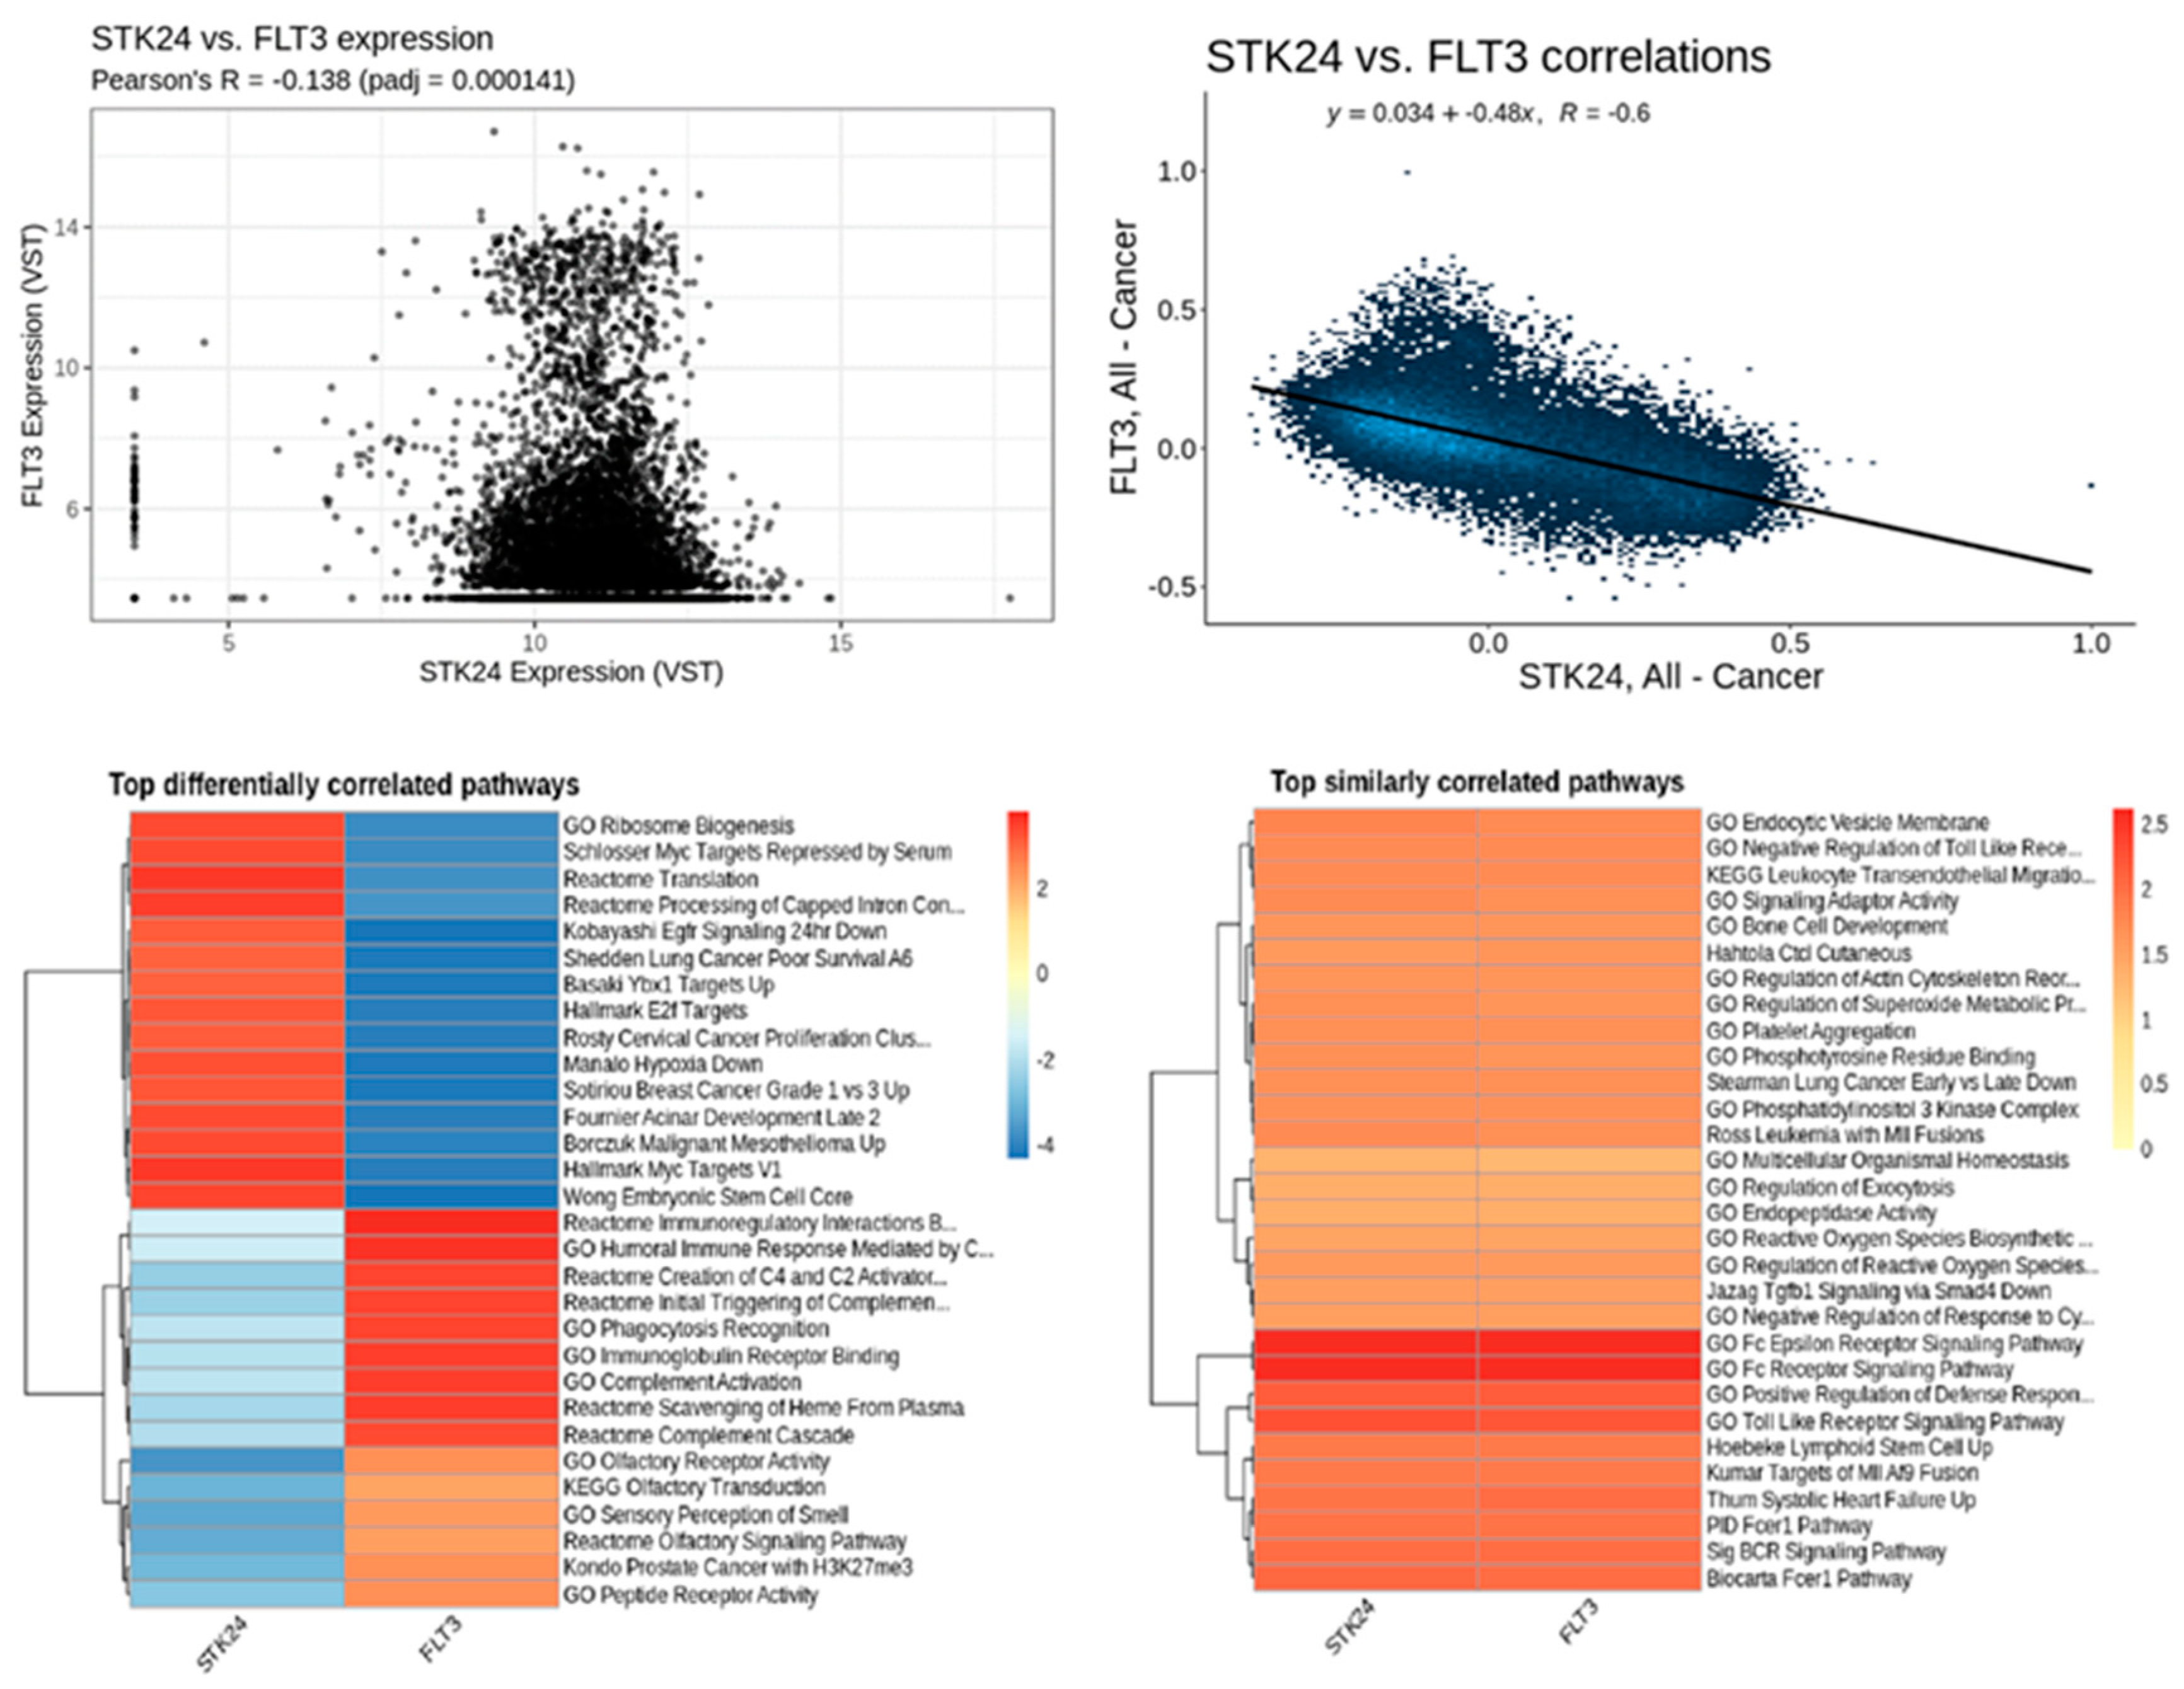
Figure 11.
Correlation analysis of STK24 to NPM1. Description: The correlation analysis of the target gene STK24 with NPM1 is found to have significant correlation with significant p-value of 5.27e – 05 and r value of 0.85.
Figure 11.
Correlation analysis of STK24 to NPM1. Description: The correlation analysis of the target gene STK24 with NPM1 is found to have significant correlation with significant p-value of 5.27e – 05 and r value of 0.85.

Figure 12.
Correlation analysis of STK24 to RUNX1. Description: The correlation analysis of the target gene STK24 with RUNX1 is found to have significant correlation with significant p-value of 7.15e – 05 and r value of 0.14.
Figure 12.
Correlation analysis of STK24 to RUNX1. Description: The correlation analysis of the target gene STK24 with RUNX1 is found to have significant correlation with significant p-value of 7.15e – 05 and r value of 0.14.
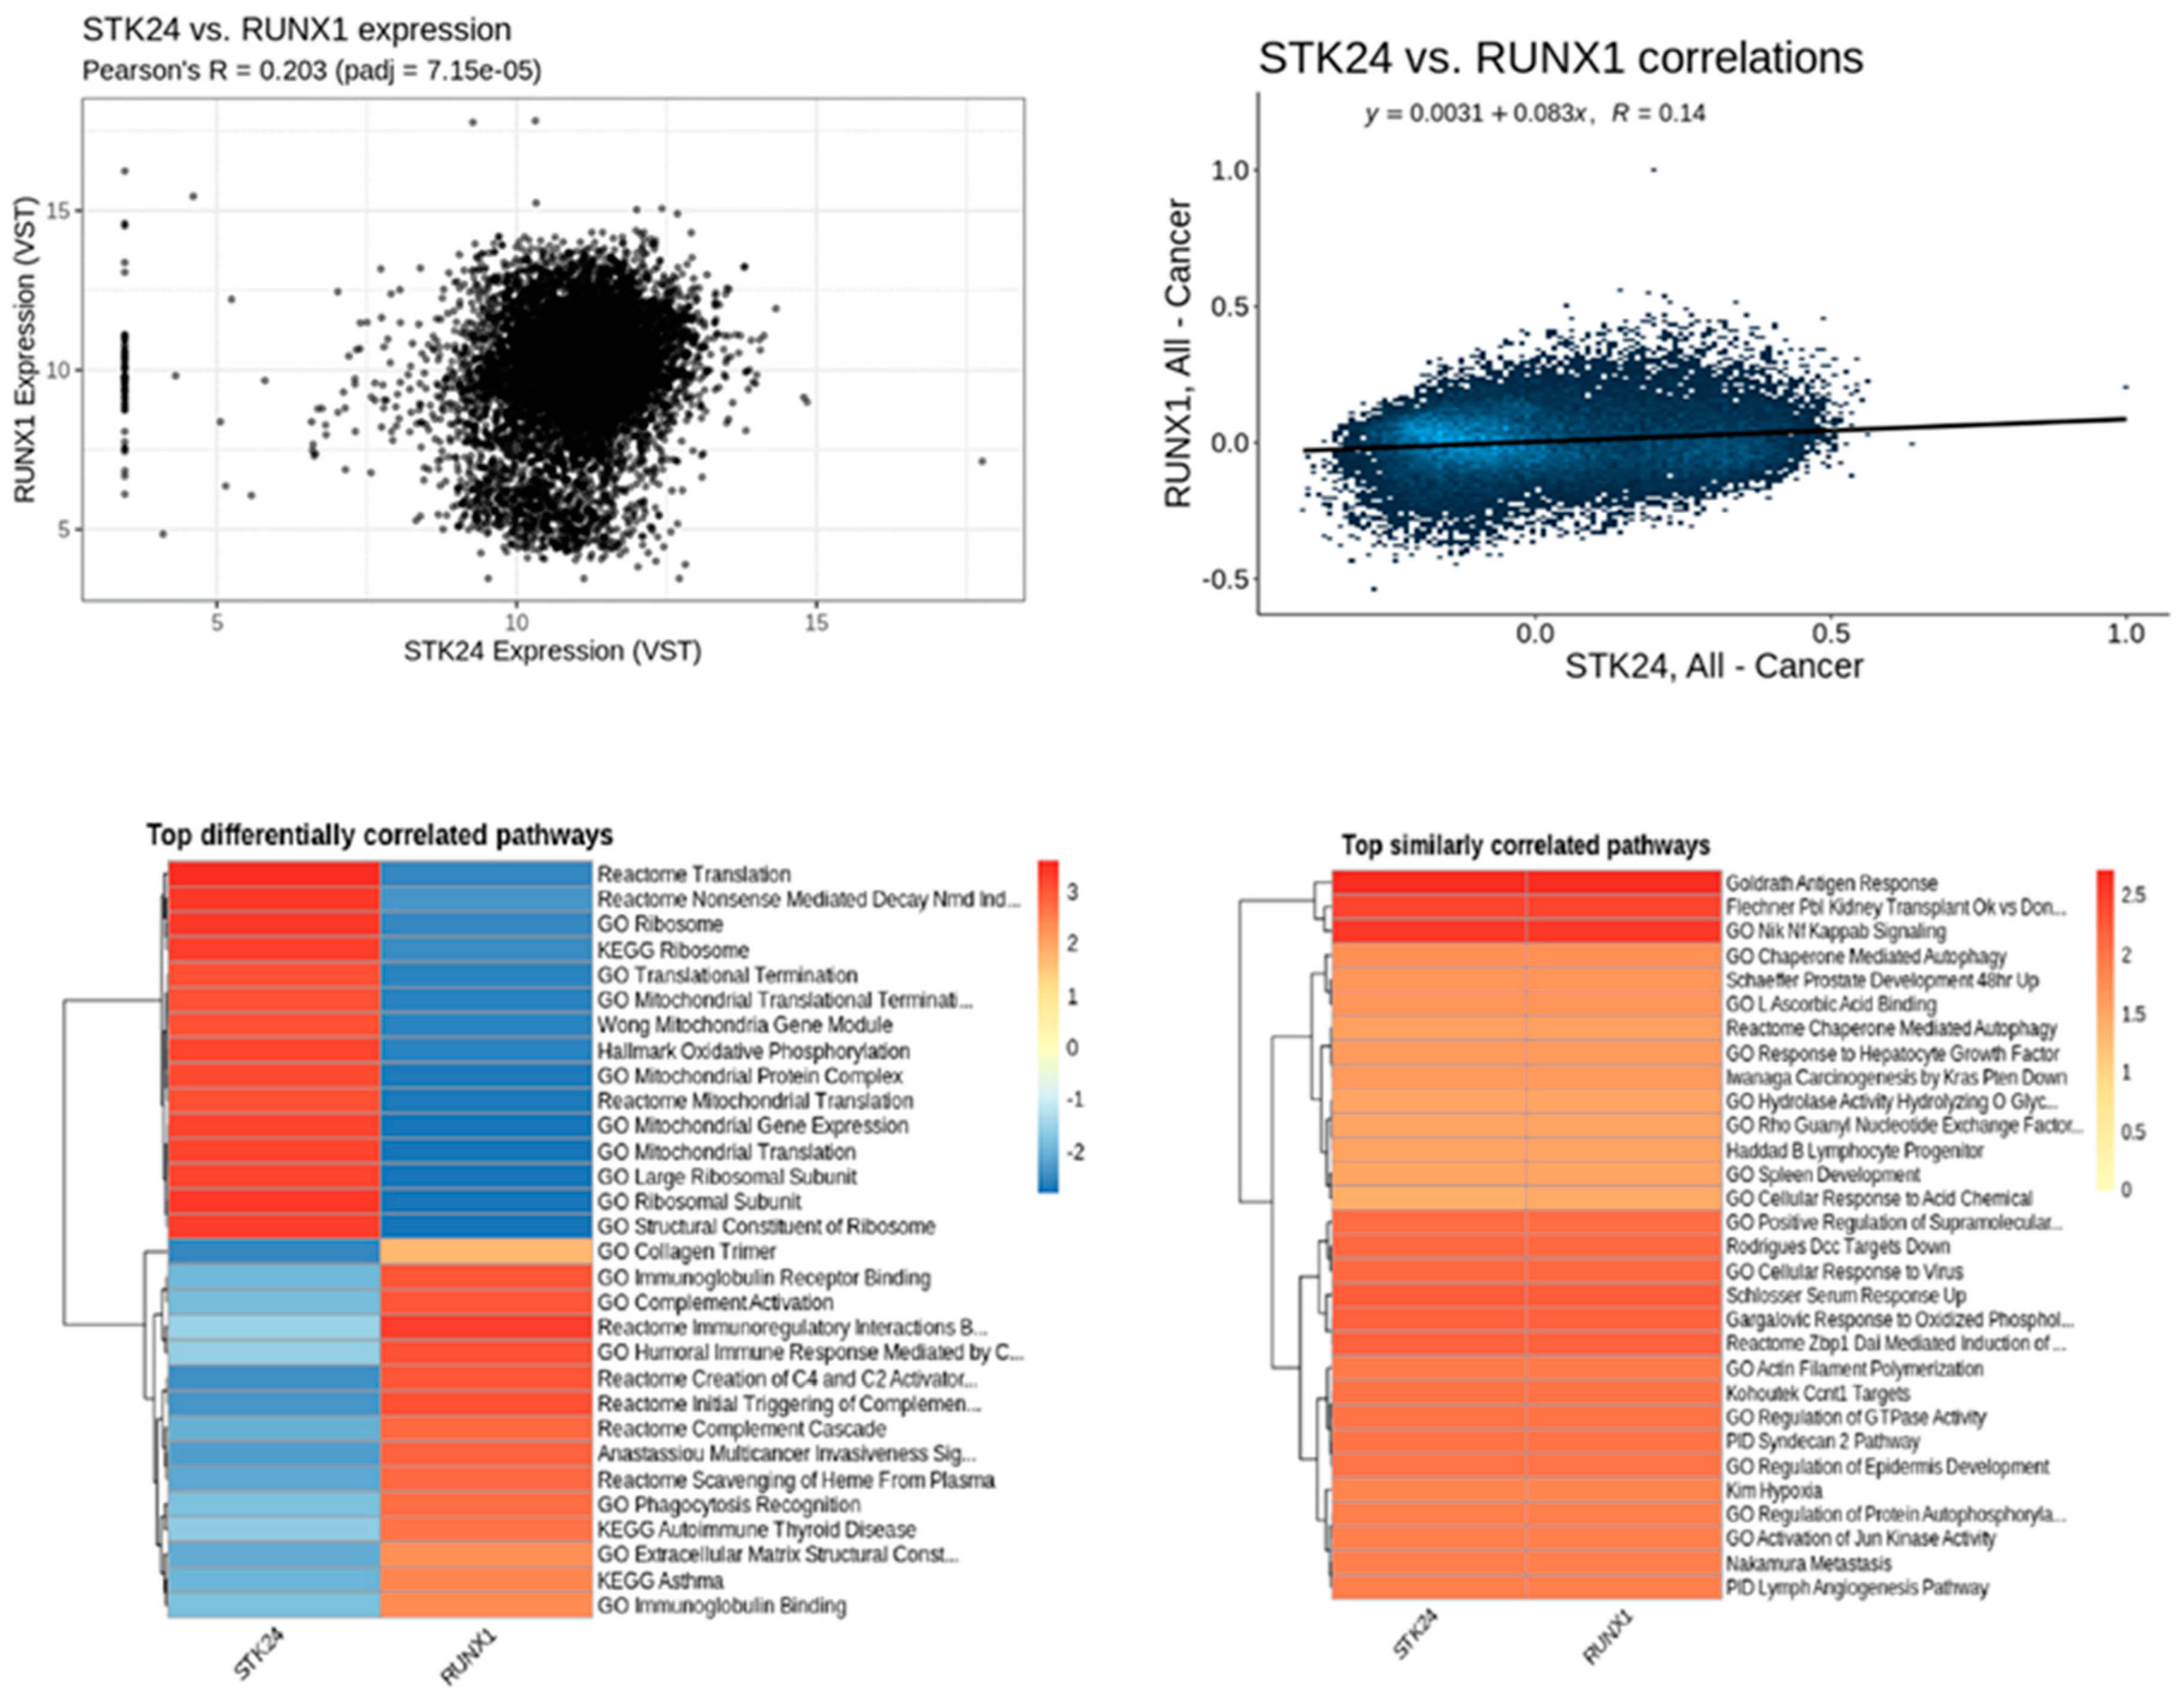
Figure 13.
Correlation analysis of STK24 to RARA. Description: The correlation analysis of the target gene STK24 with RARA is found to have significant correlation with significant p-value of 6.5e – 05 and r value of 0.64.
Figure 13.
Correlation analysis of STK24 to RARA. Description: The correlation analysis of the target gene STK24 with RARA is found to have significant correlation with significant p-value of 6.5e – 05 and r value of 0.64.
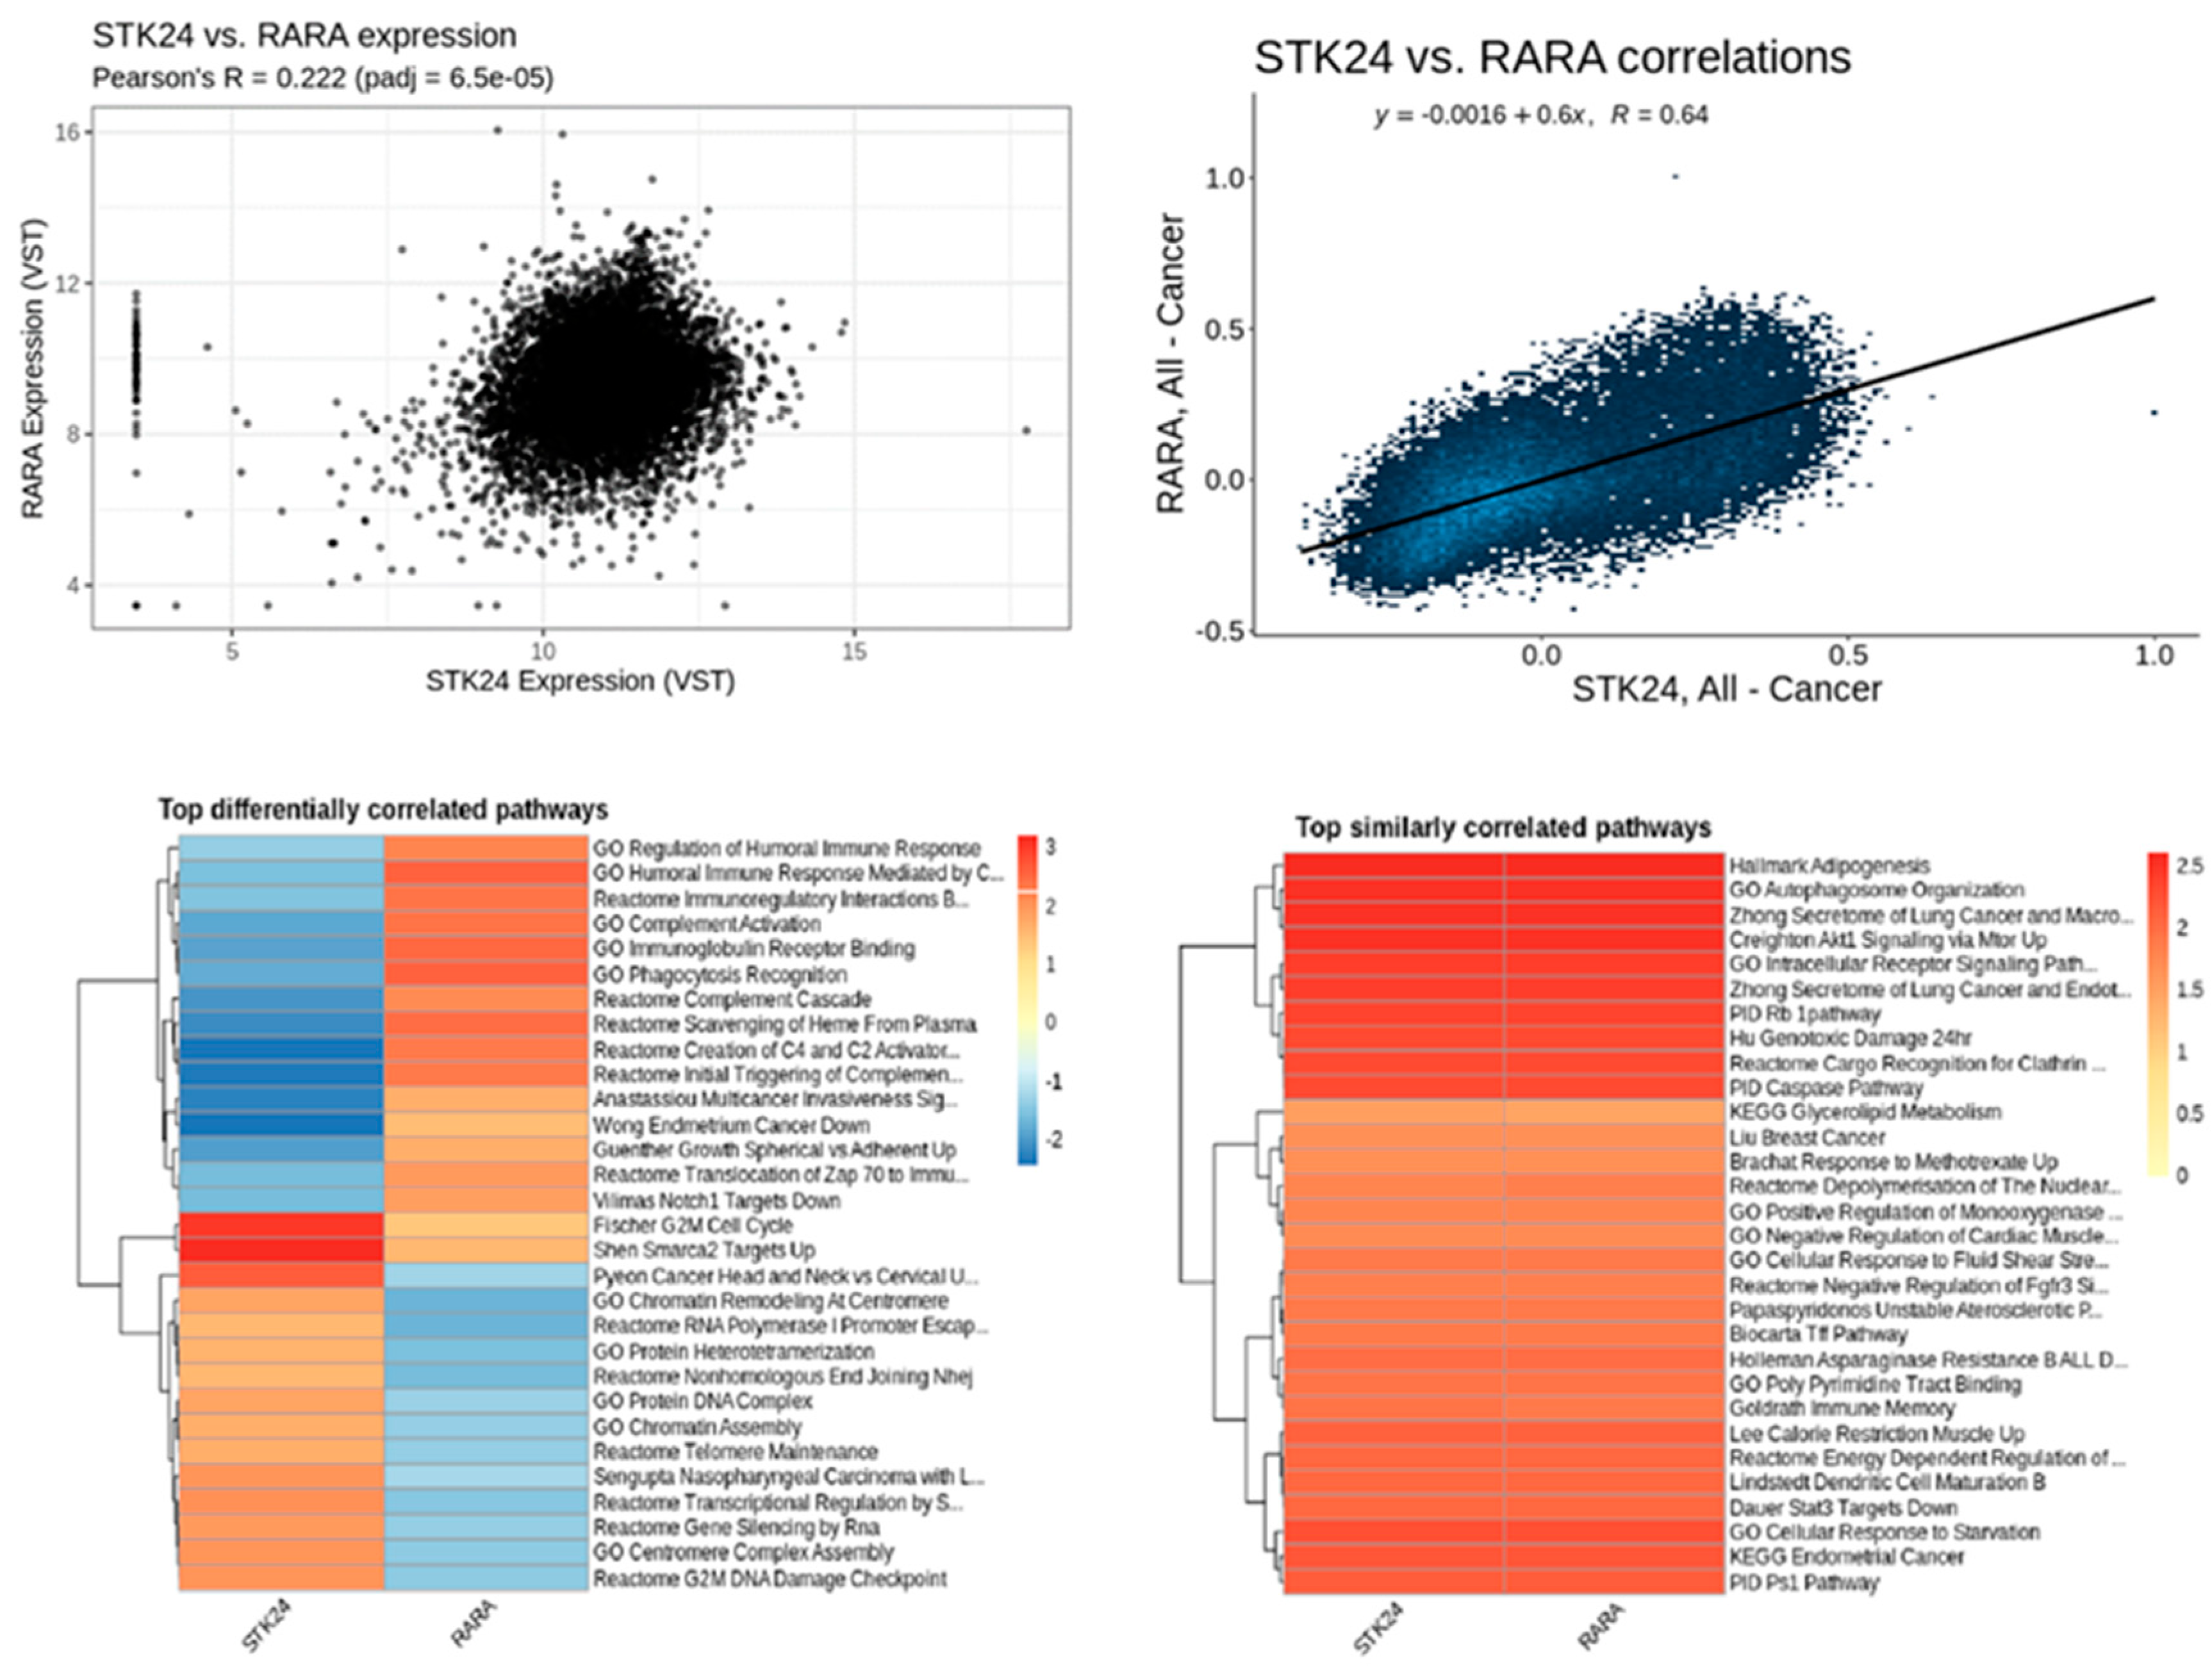
Figure 14.
Correlation analysis of STK24 to IDH1. Description: The correlation analysis of the target gene STK24 with IDH1 is found to have significant correlation with significant p-value of 5.48e – 05 and r value of 0.86.
Figure 14.
Correlation analysis of STK24 to IDH1. Description: The correlation analysis of the target gene STK24 with IDH1 is found to have significant correlation with significant p-value of 5.48e – 05 and r value of 0.86.
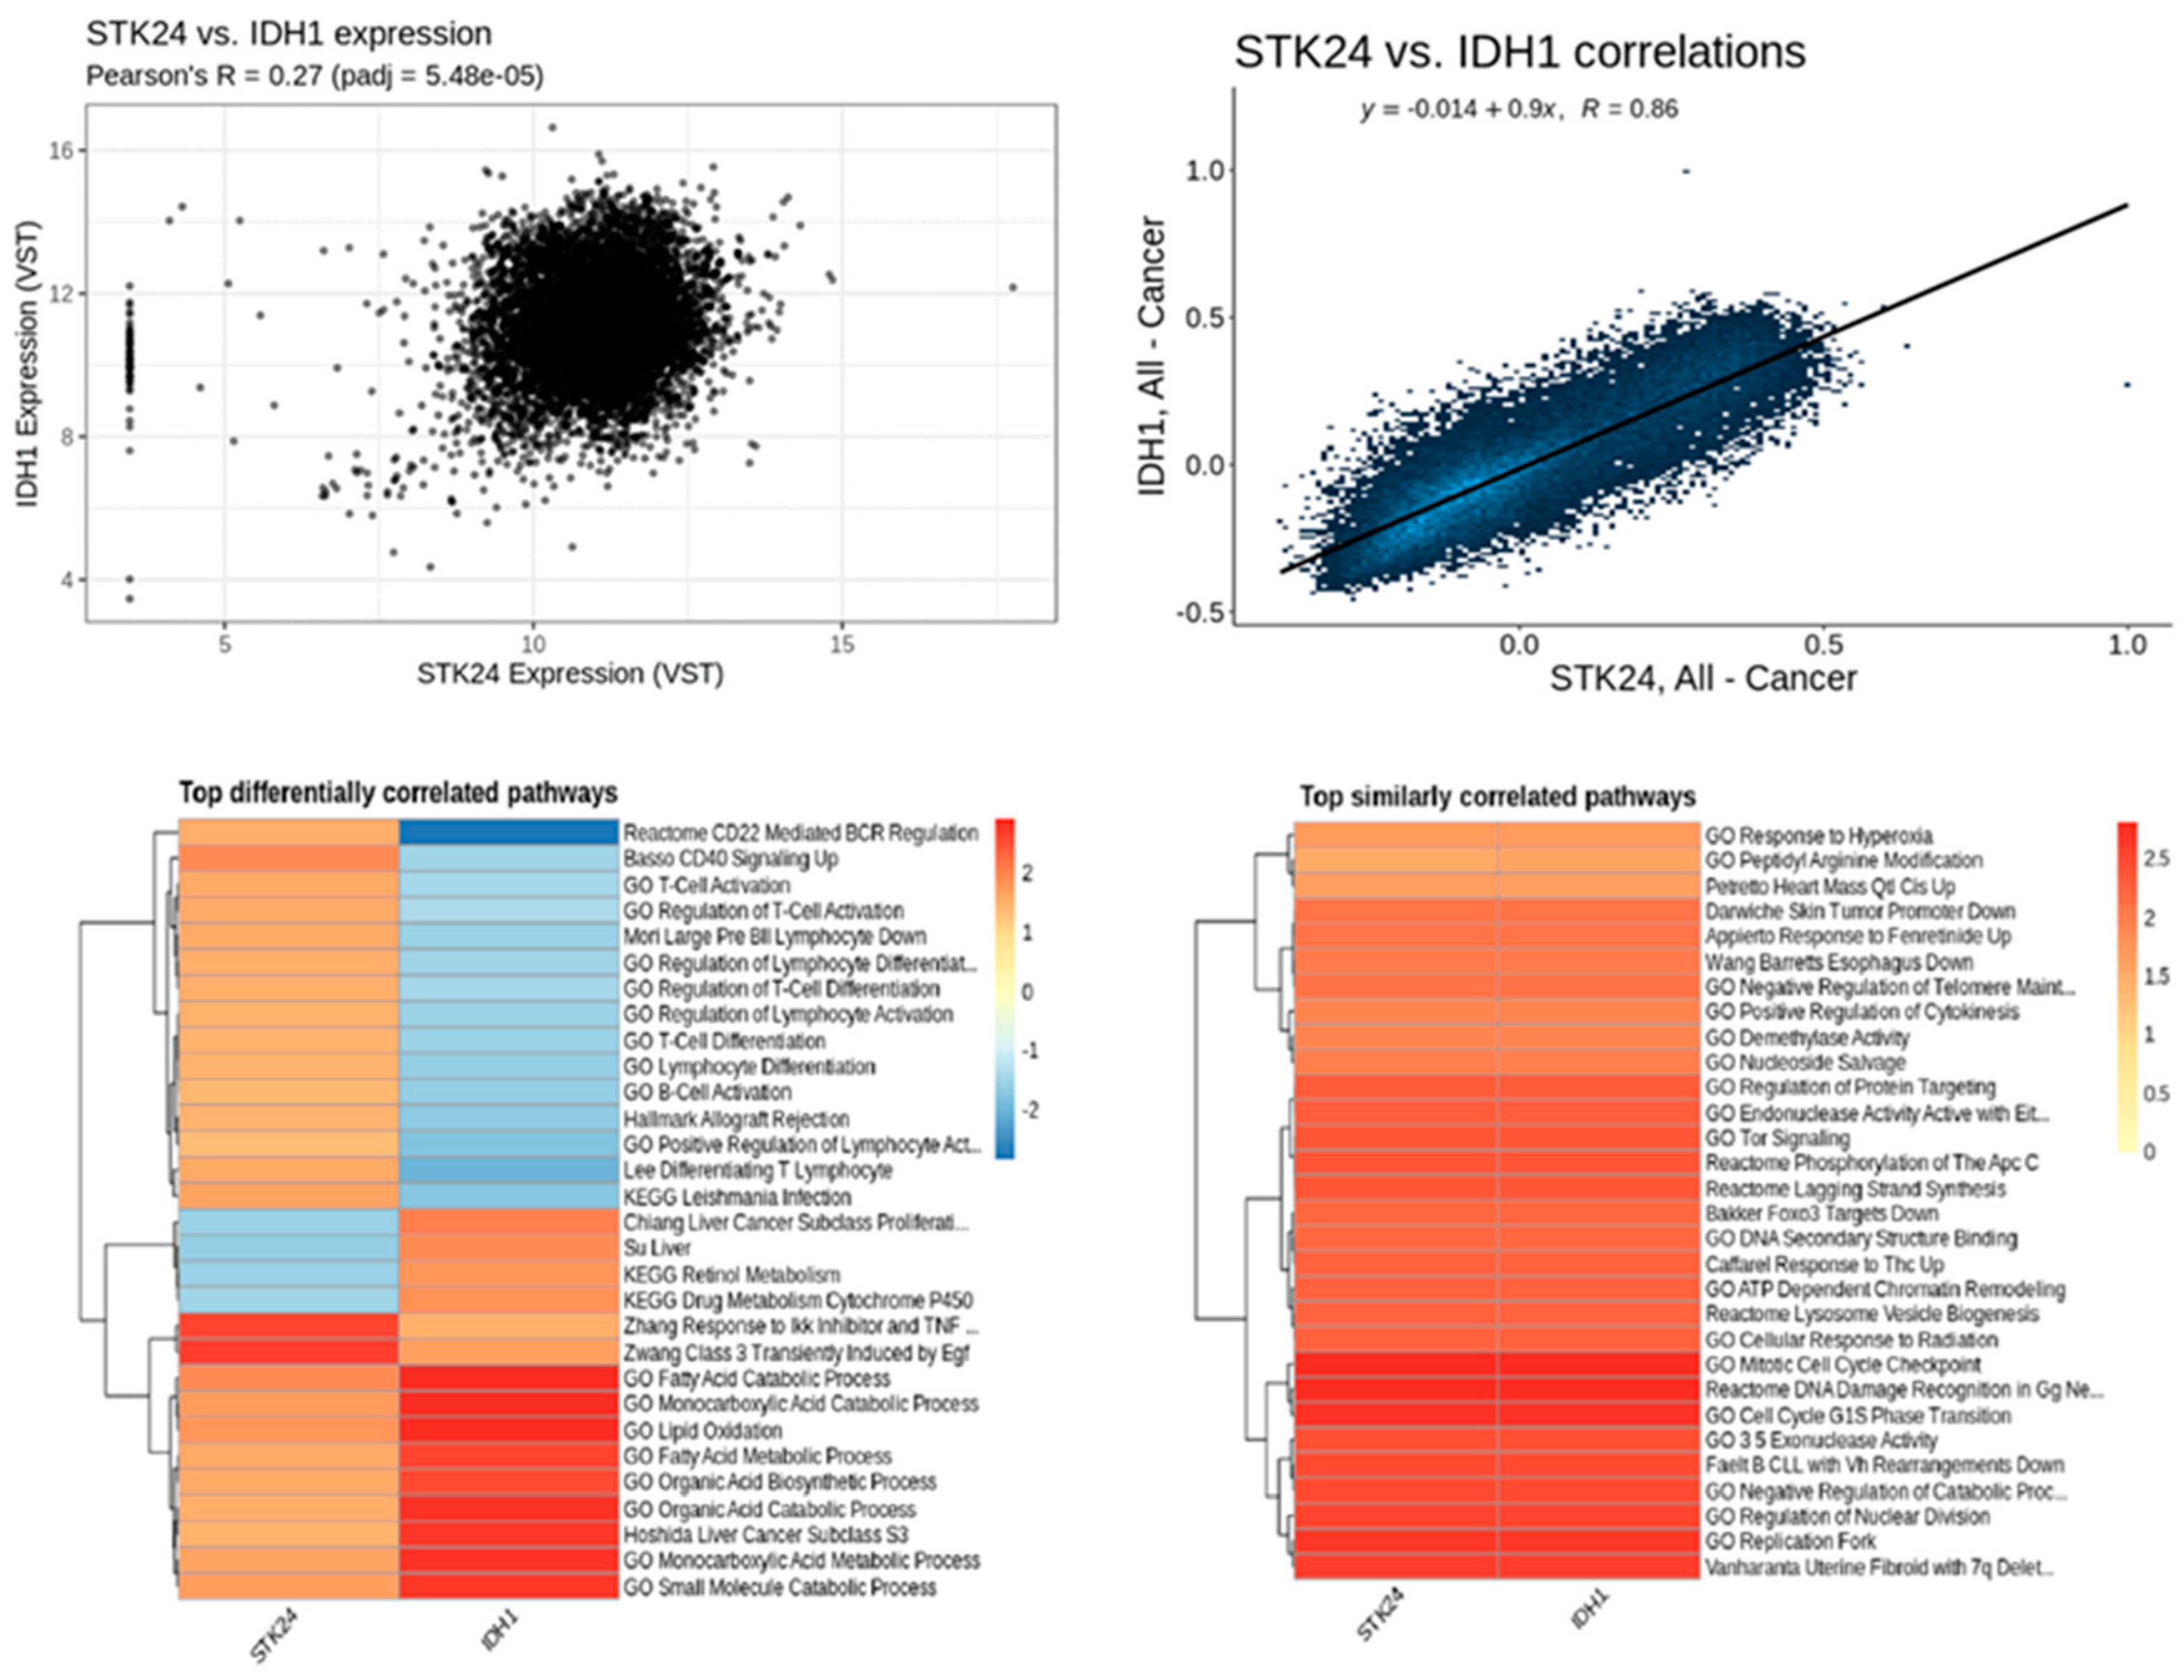
Figure 15.
Correlation analysis of STK24 to IDH2. Description: The correlation analysis of the target gene STK24 with IDH2 is found to have significant correlation with significant p-value of 0.000146 and r value of 0.68.
Figure 15.
Correlation analysis of STK24 to IDH2. Description: The correlation analysis of the target gene STK24 with IDH2 is found to have significant correlation with significant p-value of 0.000146 and r value of 0.68.
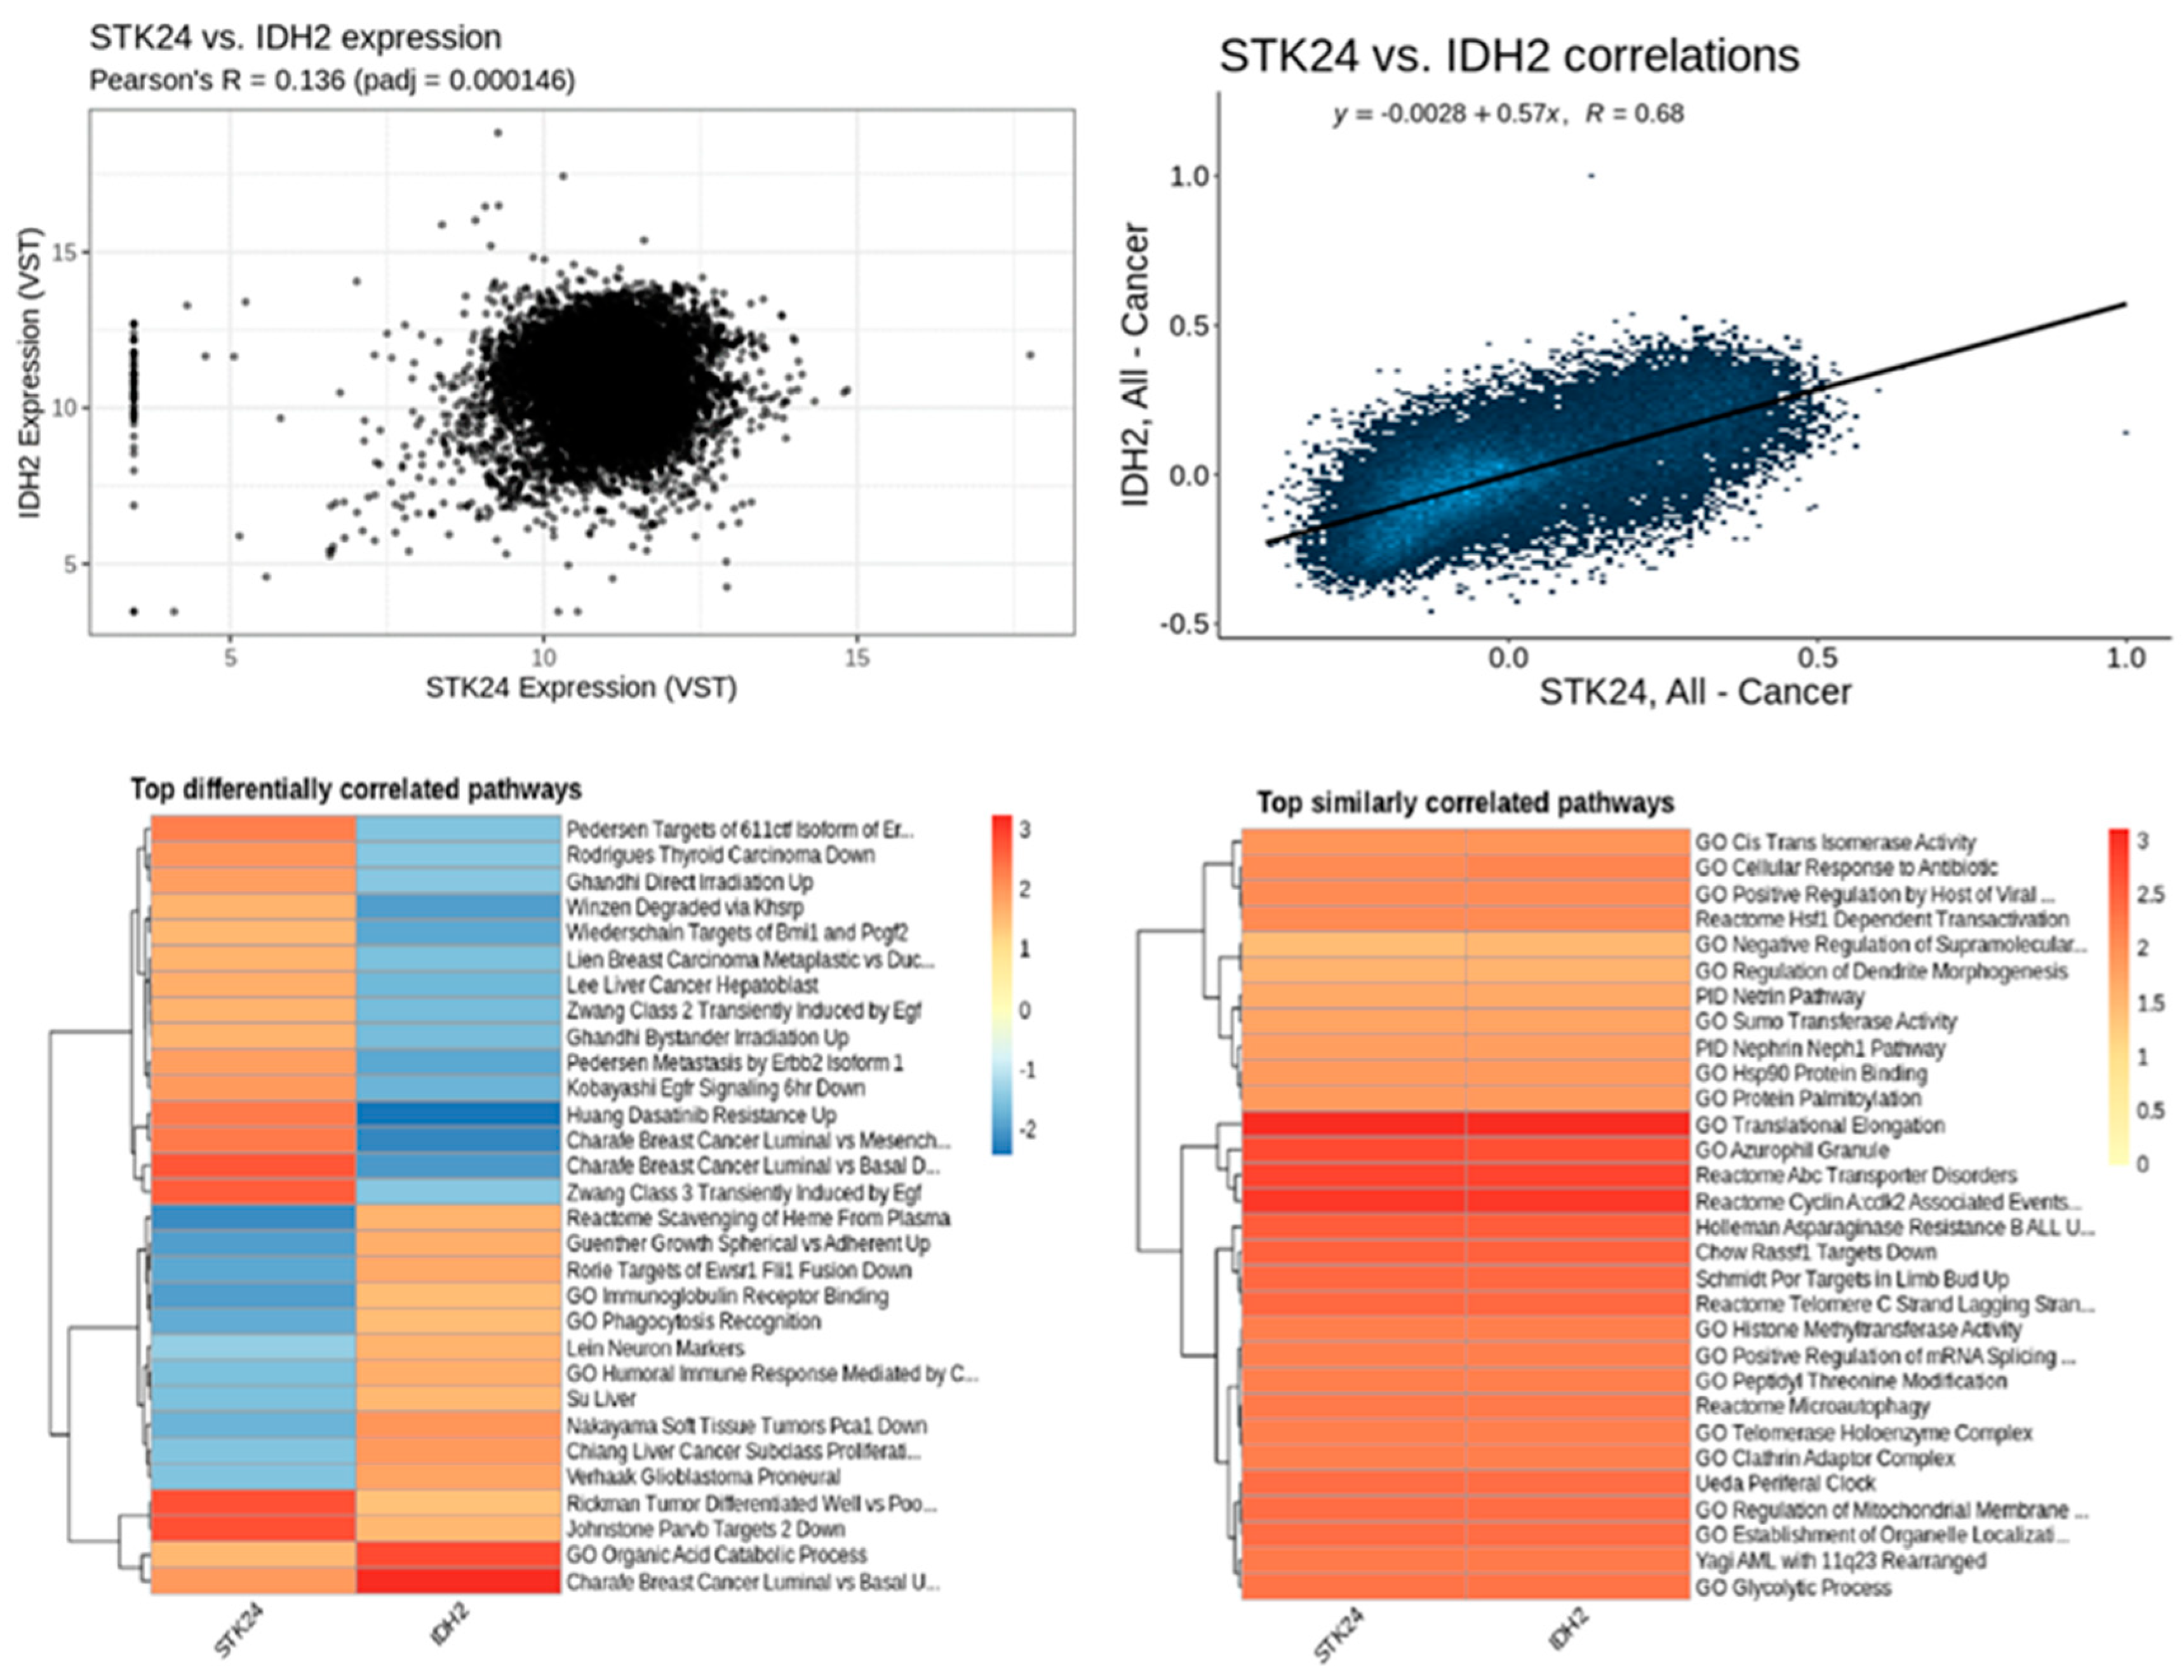
Figure 16.
Correlation analysis of STK24 to GLS. Description: The correlation analysis of the target gene STK24 with GLS is found to have significant correlation with significant p-value of 5.59e – 05 and r value of 0.76.
Figure 16.
Correlation analysis of STK24 to GLS. Description: The correlation analysis of the target gene STK24 with GLS is found to have significant correlation with significant p-value of 5.59e – 05 and r value of 0.76.

Figure 17.
Correlation analysis of STK24 to SLC1A5. Description: The correlation analysis of the target gene STK24 with SLC1A5 is found to have significant correlation with significant p-value of 5.27e – 05 and r value of 0.91.
Figure 17.
Correlation analysis of STK24 to SLC1A5. Description: The correlation analysis of the target gene STK24 with SLC1A5 is found to have significant correlation with significant p-value of 5.27e – 05 and r value of 0.91.
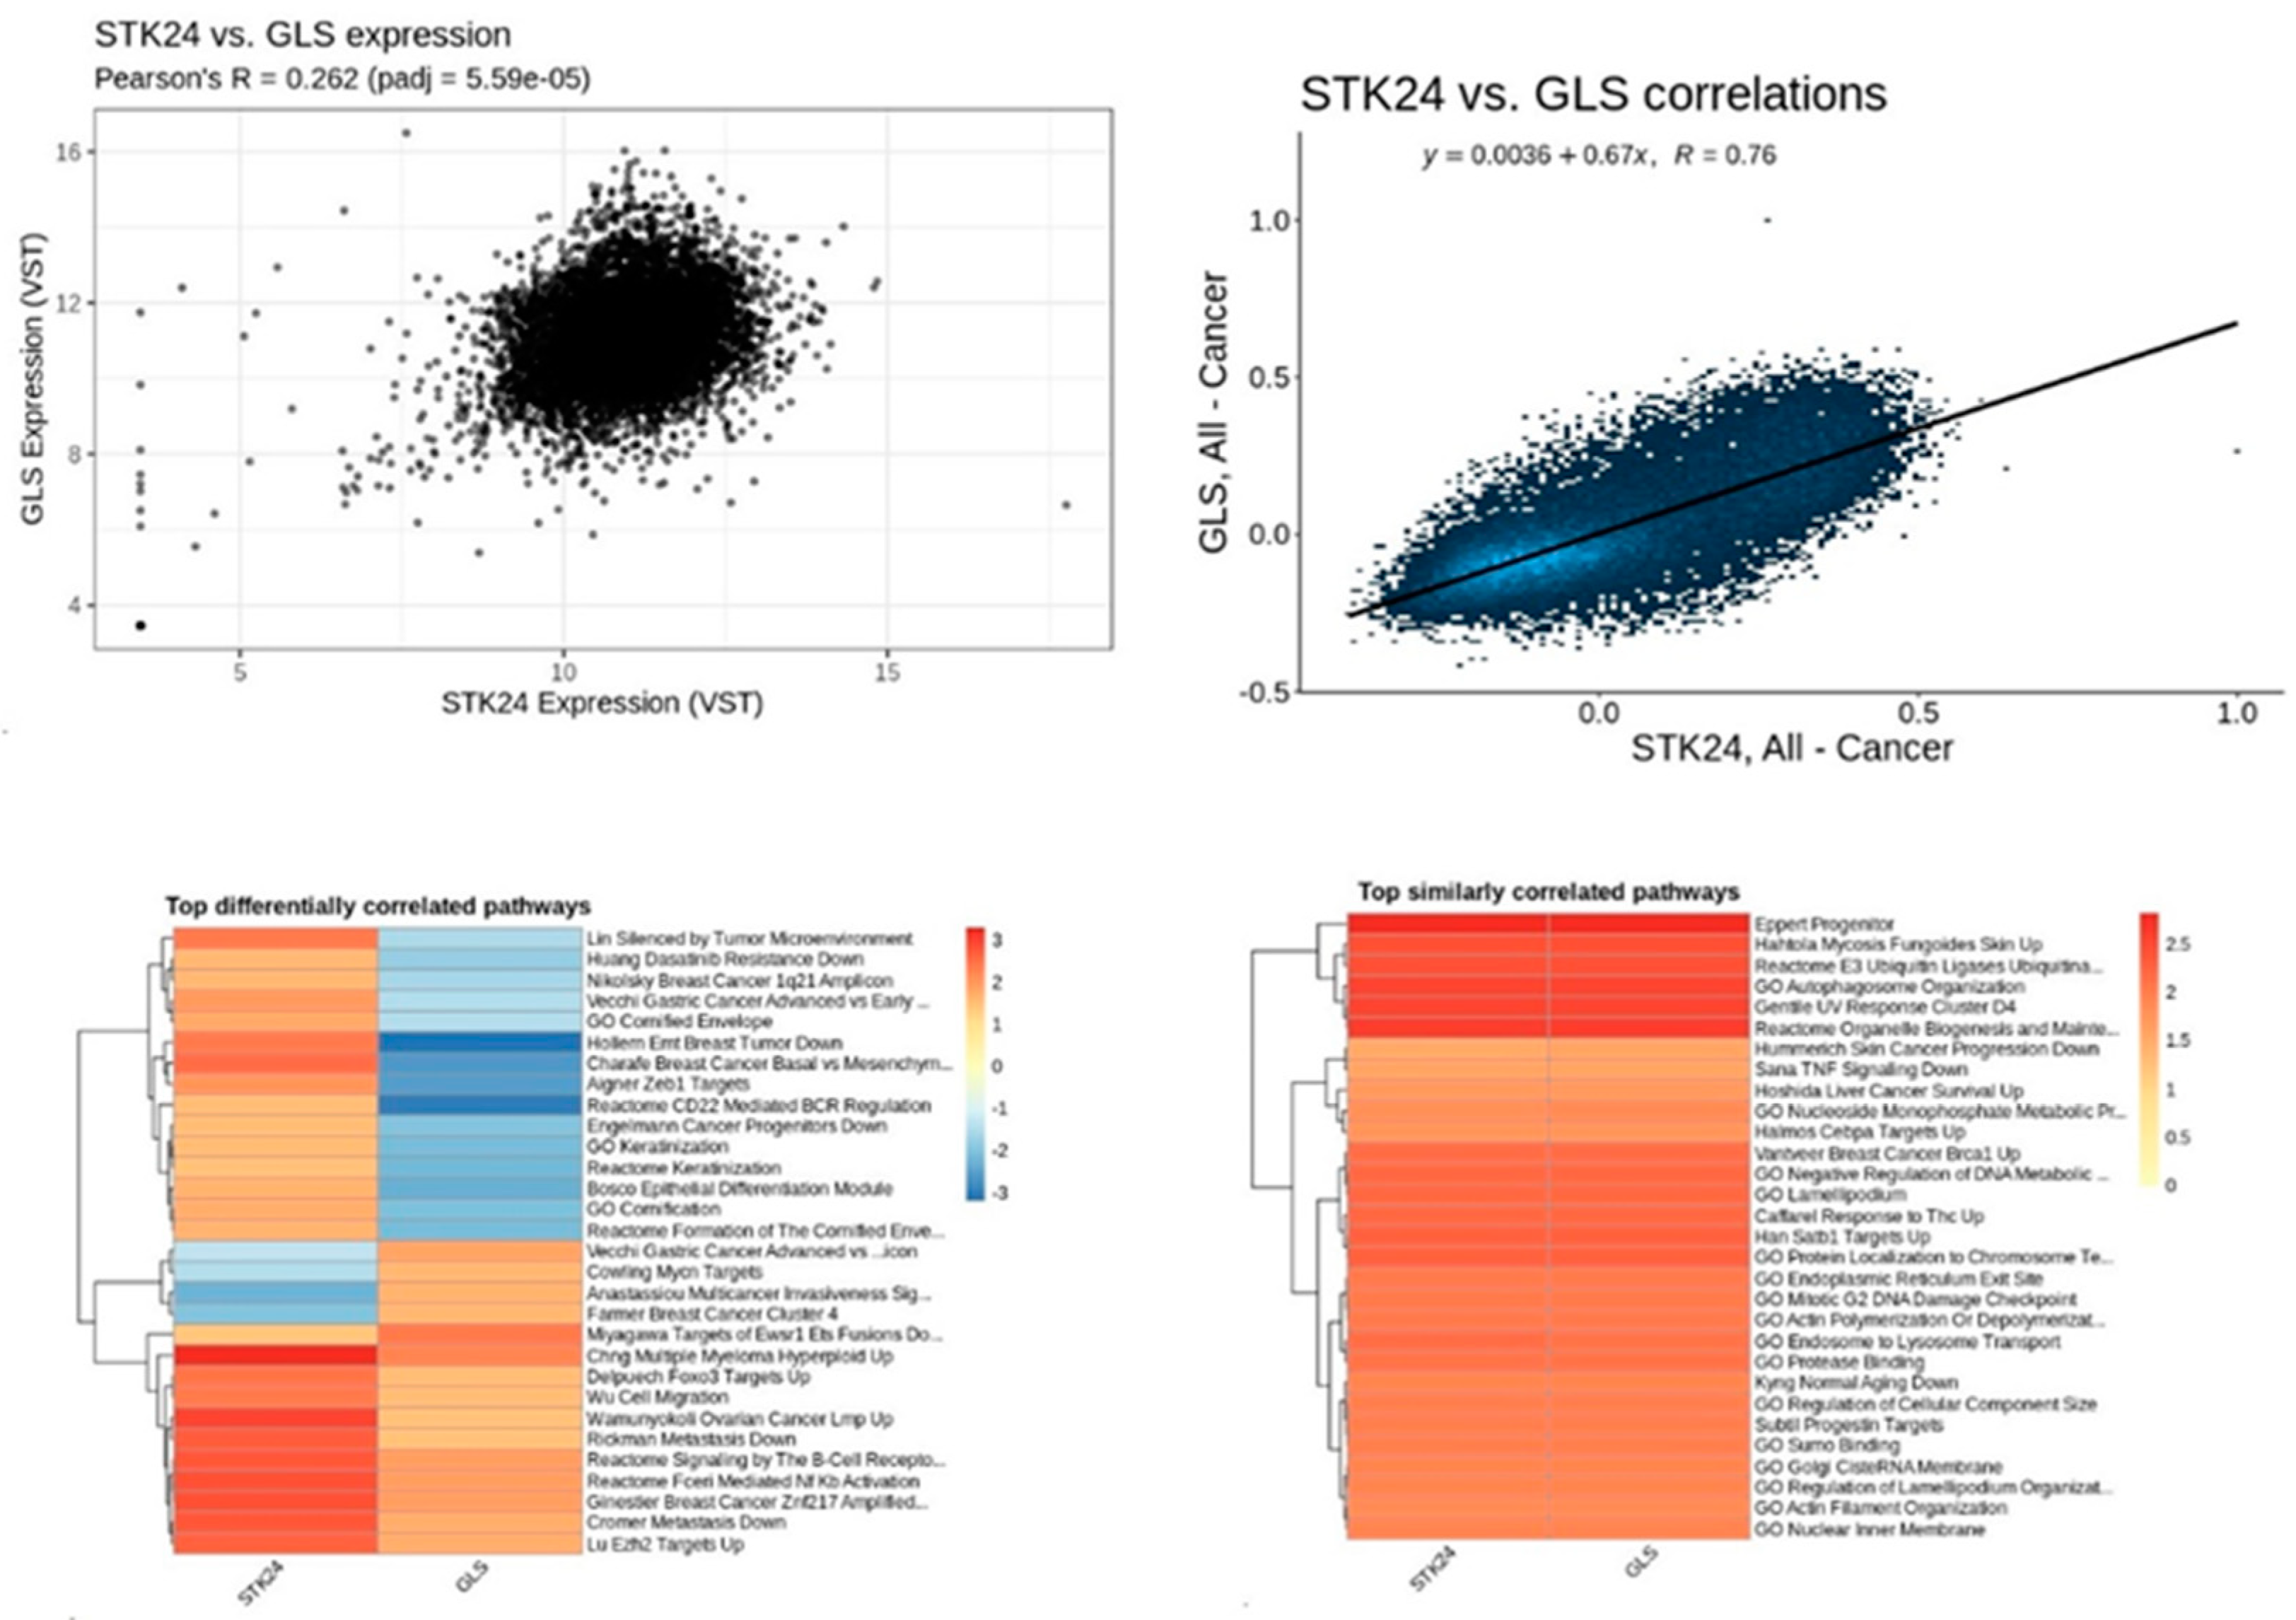
Figure 18.
Correlation analysis of STK24 to GLUD1. Description: The correlation analysis of the target gene STK24 with GLUD1 is found to have significant correlation with significant p-value of 5.27e – 05 and r value of 0.9.
Figure 18.
Correlation analysis of STK24 to GLUD1. Description: The correlation analysis of the target gene STK24 with GLUD1 is found to have significant correlation with significant p-value of 5.27e – 05 and r value of 0.9.
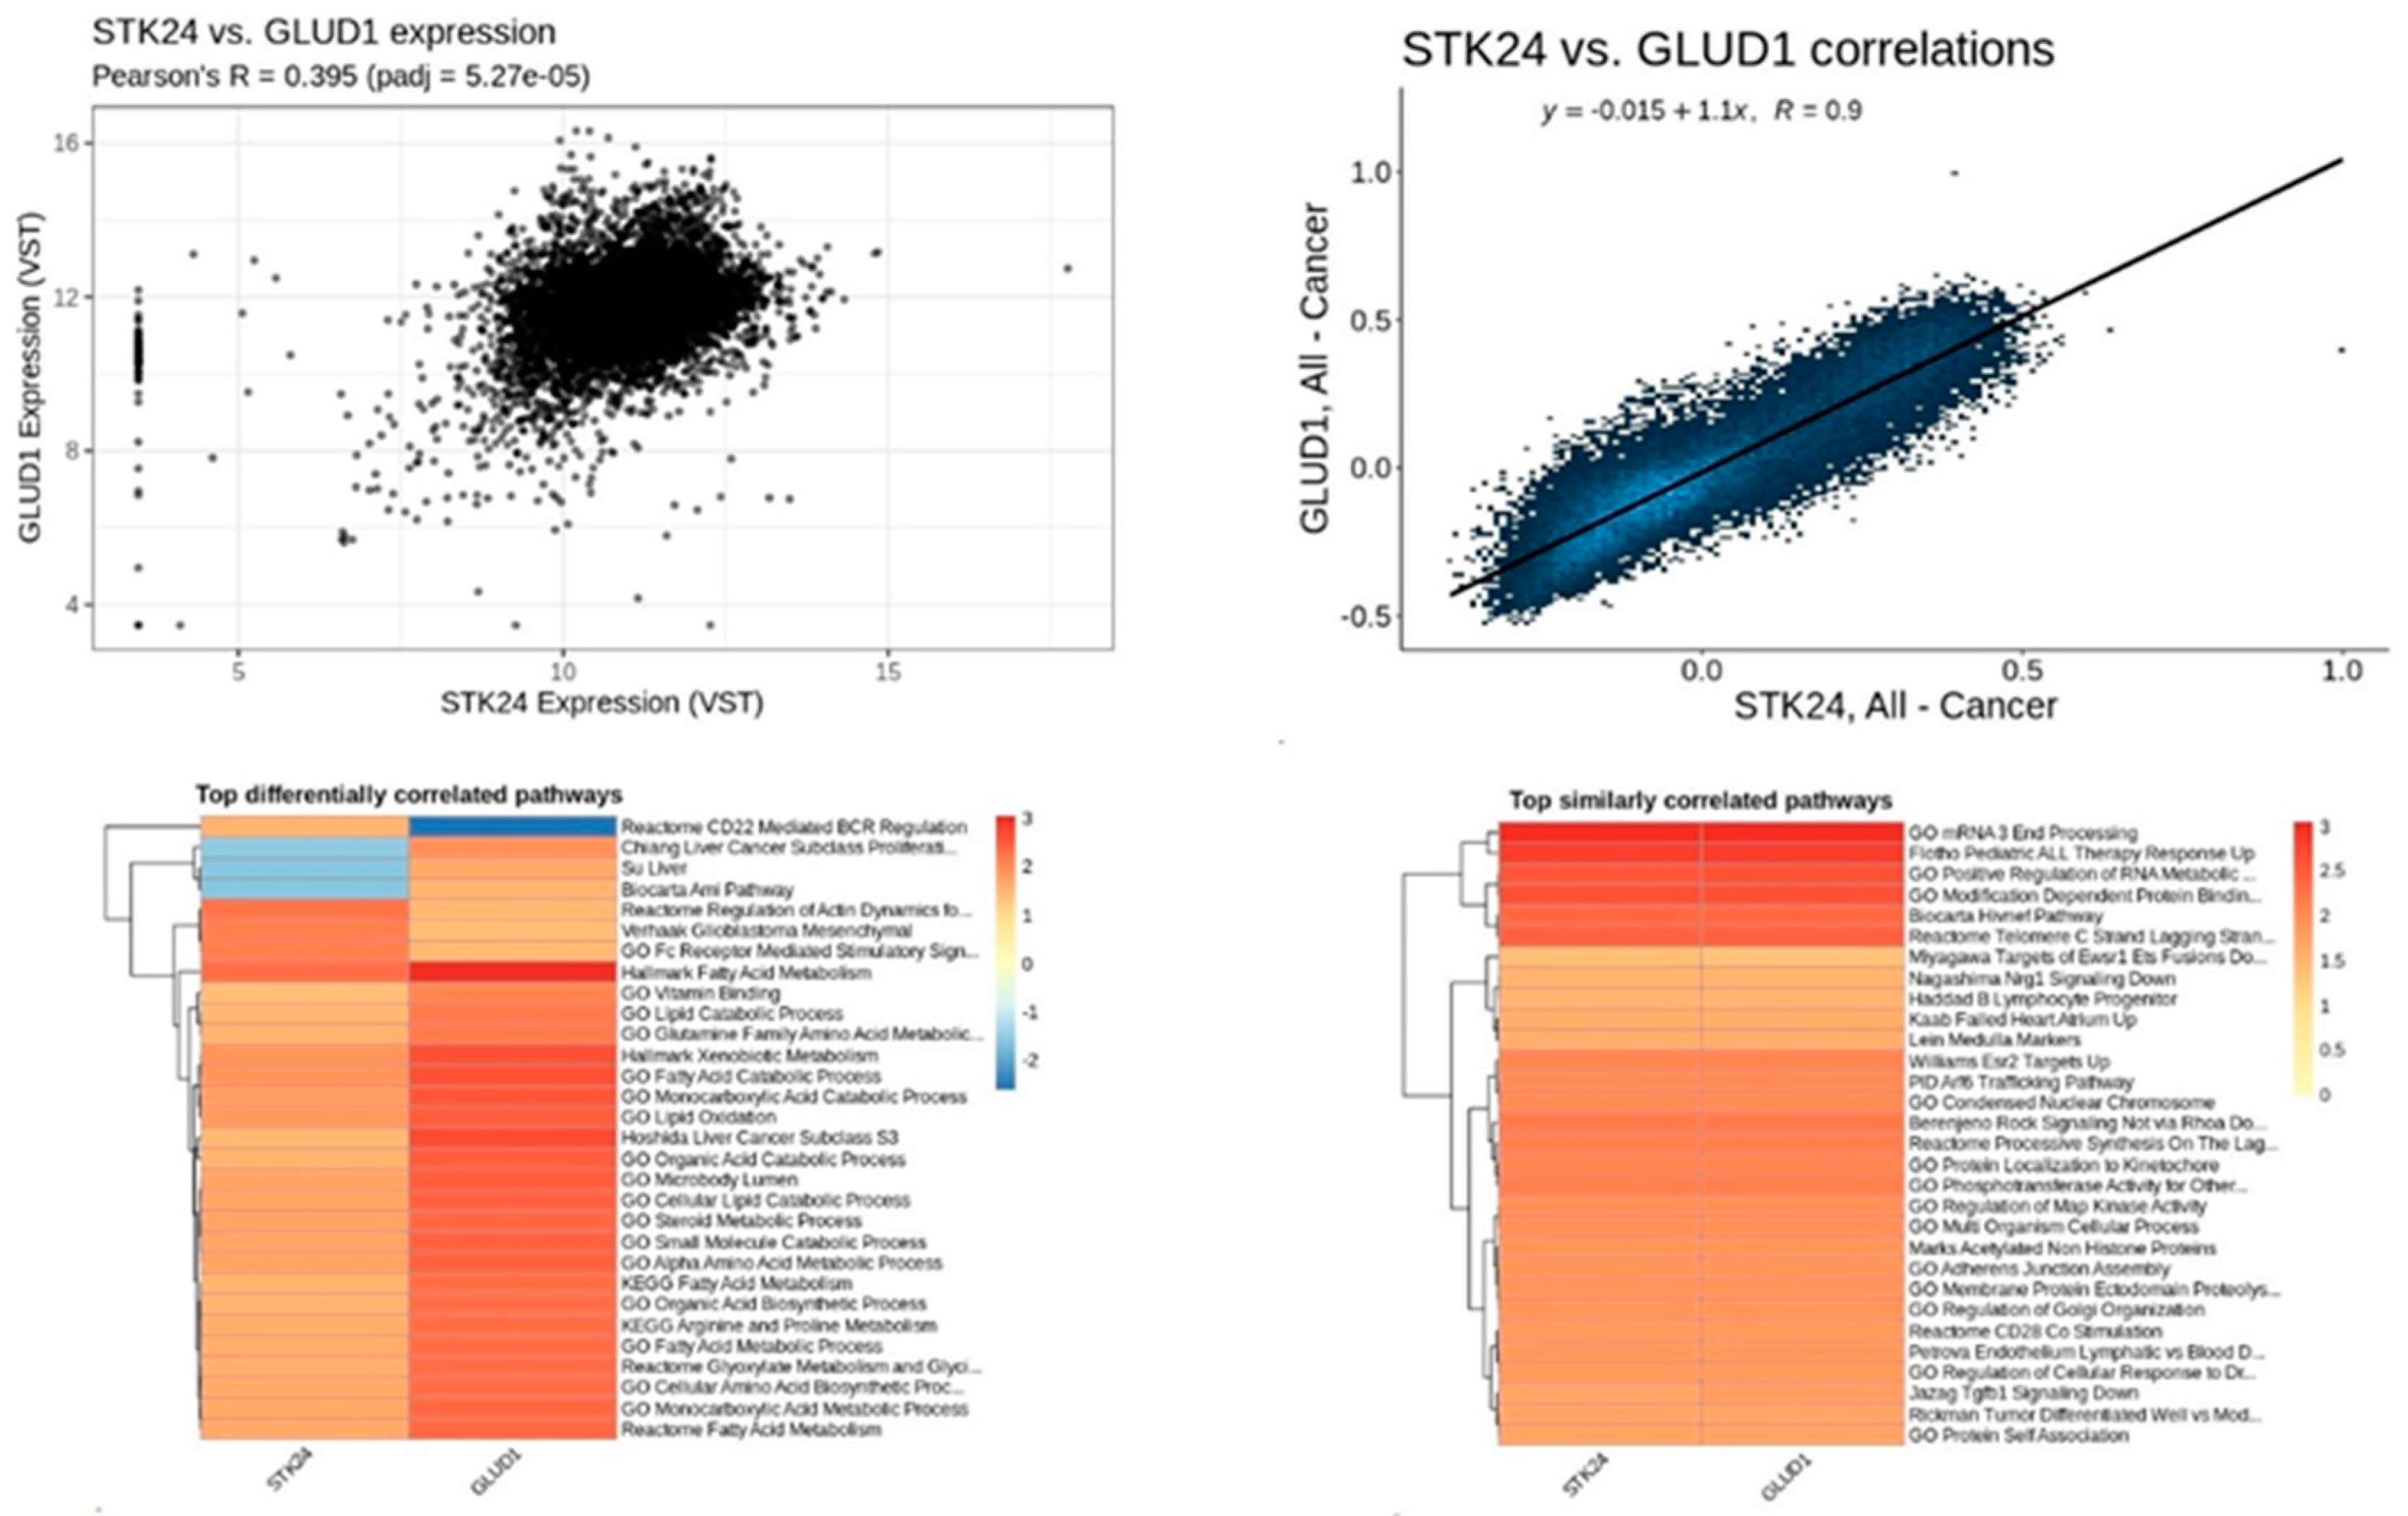
Figure 19.
Correlation analysis of STK24 to SLC7A11. Description: The correlation analysis of the target gene STK24 with SLC7A11 is found to have significant correlation with significant p-value of 7.68e – 05 and r value of 0.69.
Figure 19.
Correlation analysis of STK24 to SLC7A11. Description: The correlation analysis of the target gene STK24 with SLC7A11 is found to have significant correlation with significant p-value of 7.68e – 05 and r value of 0.69.
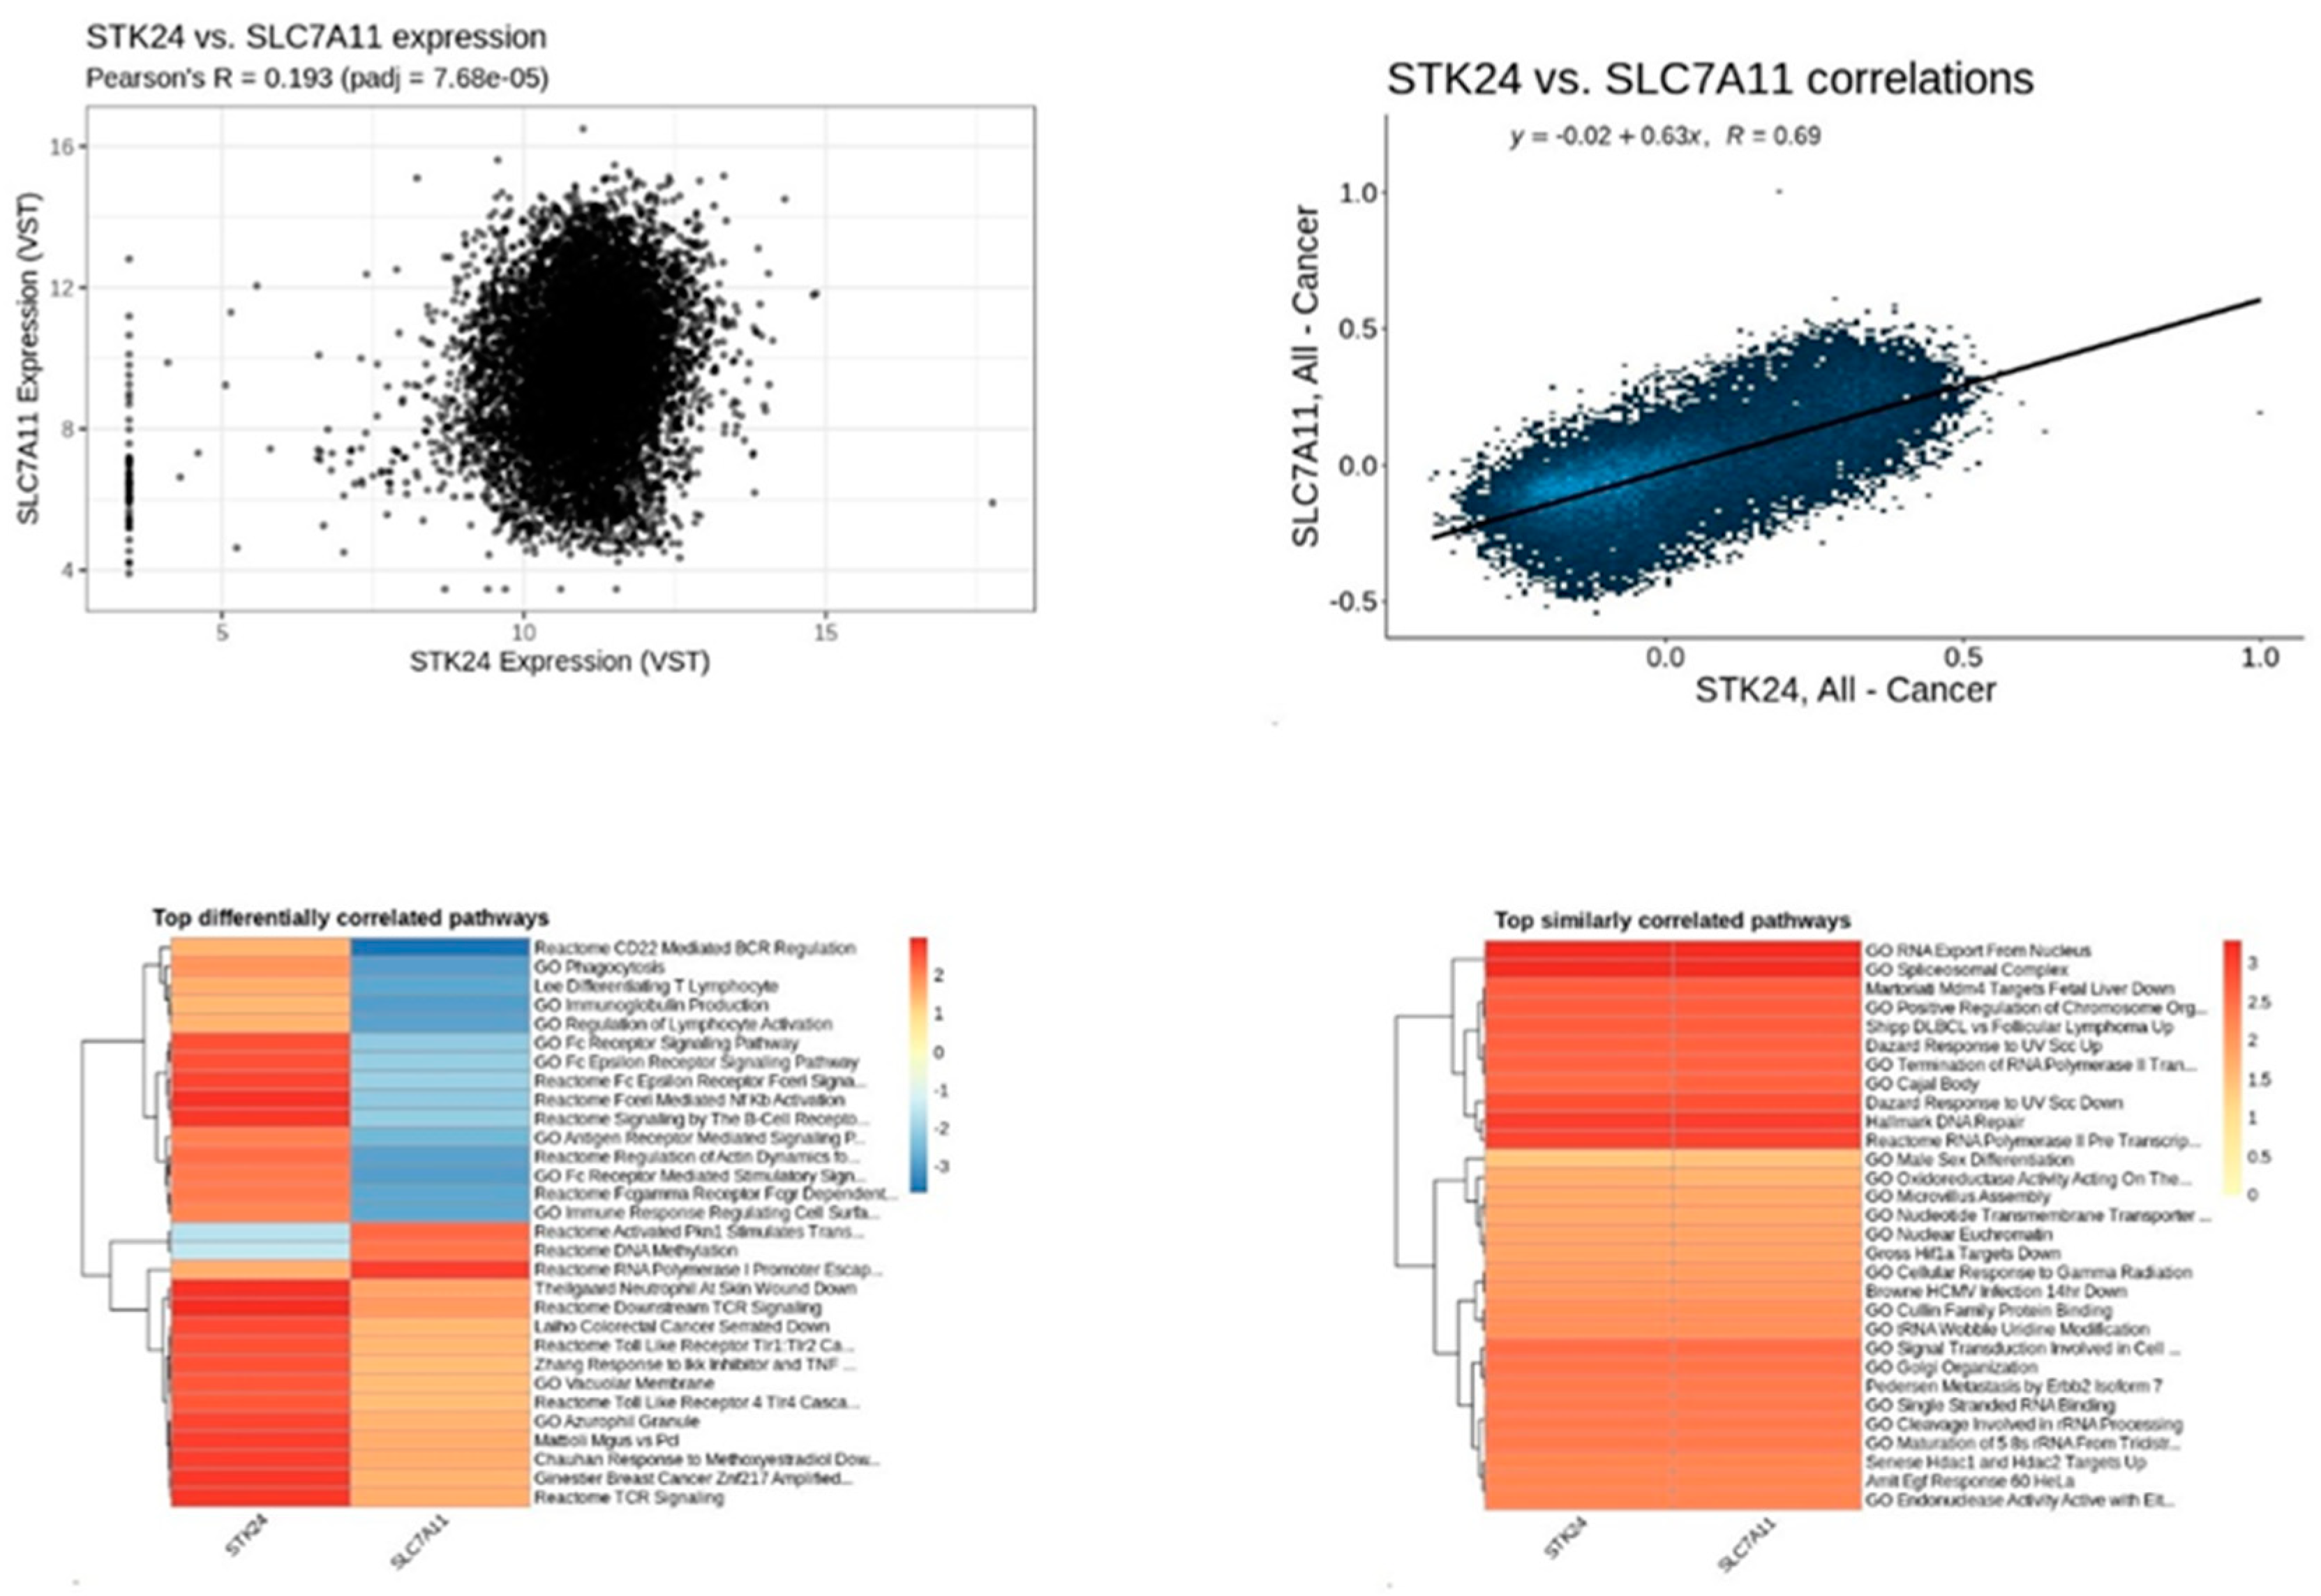

Table 1.
Co-expressed genes of the target gene STK24.
| Co-expressed genes | Pearson’s Correlation Coefficient (-1 to 1) |
| ABI1 SETX KIF13B LSM14A FLI1 RBM18 SFT2D2 PPP2R5E HERC1 GOSR2 SP3 RAP2A CSNK2A2 MMGT1 MFSD11 SMEK1 C9orf91 EFR3A YME1L1 UBQLN1 COPA PANX1 GOLGA5 SCFD1 BRD4 LATS1 NCOA3 KLHL6 XPA VEZF1 FAM102B CUL4B ADD3 SCAF8 PPP6R3 VAPB GTF2A1 KHDRBS1 DDX6 EP300 COPB1 STYX SMG7 GABPB1 SETD2 APC SENP1 TROVE2 TUBGCP3 LRCH1 CRTC3 TNKS2 ERBB2IP PRKRIR GLTSCR1L VTI1A WNK1 MED4 SNAPC3 EFCAB14 SPTLC1 ARCN1 RCOR1 FAM120B SMAD2 RCSD1 NIPBL PAPOLA NEDD1 KPNA6 SRP54 THRAP3 TRAF6 TLK1 HIAT1 KAT6A MTMR12 SYNRG CREBBP ZYG11B ITGB1 NCK1 RBBP5 FBXL3 PPFIA1 HCFC2 TAB2 CUL2 DENND4C STRN PPP3CB FAM168A KDM5A JAK1 NAA50 KDM2A ITCH LEMD3 PLEKHF2 ATF1 RAB3GAP1 NCOA2 TANGO6 AIDA SMU1 ITSN2 RDH11 SLK WAC FOXN3 VPS13D PRKCB SP100 WDR20 CLCC1 BROX KIAA0226 NCOA1 KIDINS220 ECD WDR44 HELZ RAB5A GMEB1 CORO1C SART3 PRDM4 STAG2 CTCF RABGAP1L ERCC6L2 WDR82 TCF20 KLHL5 KPNA1 USP8 WWP1 XIAP OTULIN CLTC LRRFIP1 RBMXL1 TACC1 KPNA3 SUV420H1 RAB22A EPC2 CEP350 WAPAL NSL1 UBL3 PPP3CA CDC73 WBP11 PAK2 PTPRA ADAM10 VHL SETD3 DR1 SEC24B ST3GAL1 PHF3 OXR1 WASF2 RAD23B ZNF148 KIAA2018 IKZF1 CLCN3 FOXJ2 CTDSP2 FAM13A FBXW11 RAB6A PDS5B UHMK1 MAPKAP1 LRRC8D TNRC6B MAGT1 RERE PIK3CA PPP3CC MICU2 ANKRD13C SLC25A30 ADD1 PSIP1 UBAC2 ST6GAL1 FBXO11 NR3C1 PARP11 IQGAP2 USP38 KCTD20 RNF169 NIN PLEKHA2 |
.87 - .81 |
Table 2.
Biological process enrichments.
| PANTHER GO-Slim Biological Process | fold Enrichment | P-value | FDR |
|---|---|---|---|
| Mitotic sister chromatid cohesion (GO:0007064) | 39.38 | 4.60E-05 | 6.51E-03 |
| Calcineurin-mediated signaling (GO:0097720) | 31.5 | 9.72E-05 | 1.03E-02 |
| Sister chromatid cohesion (GO:0007062) | 20 | 4.21E-05 | 6.37E-03 |
| NLS-bearing protein import into nucleus (GO:0006607) | 19.69 | 4.35E-04 | 2.64E-02 |
| Microtubule nucleation (GO:0007020) | 19.69 | 4.35E-04 | 2.56E-02 |
| Negative regulation of protein-containing complex disassembly (GO:0043242) | 16.8 | 8.63E-05 | 1.02E-02 |
| Intra-Golgi vesicle-mediated transport (GO:0006891) | 16.8 | 8.63E-05 | 9.64E-03 |
| Microtubule polymerization (GO:0046785) | 15.75 | 8.61E-04 | 3.80E-02 |
| Negative regulation of protein depolymerization (GO:1901880) | 15 | 9.97E-04 | 4.32E-02 |
| Regulation of protein-containing complex disassembly (GO:0043244) | 12.35 | 2.96E-04 | 2.03E-02 |
Table 3.
Molecular process enrichment.
| PANTHER GO-Slim Molecular Function | fold Enrichment | P-value | FDR |
|---|---|---|---|
| Nuclear receptor binding (GO:0016922) | 26.25 | 1.76E-04 | 8.86E-03 |
| Nuclear receptor coactivator activity (GO:0030374) | 24.23 | 2.27E-04 | 1.06E-02 |
| Histone acetyltransferase activity (GO:0004402) | 24.23 | 2.27E-04 | 9.80E-03 |
| RNA polymerase II complex binding (GO:0000993) | 21 | 3.56E-04 | 1.27E-02 |
| Peptide-lysine-N-acetyltransferase activity (GO:0061733) | 19.69 | 4.35E-04 | 1.38E-02 |
| Basal RNA polymerase II transcription machinery binding (GO:0001099) | 17.5 | 6.25E-04 | 1.64E-02 |
| Basal transcription machinery binding (GO:0001098) | 17.5 | 6.25E-04 | 1.57E-02 |
| RNA polymerase core enzyme binding (GO:0043175) | 17.5 | 6.25E-04 | 1.51E-02 |
| Peptide N-acetyltransferase activity (GO:0034212) | 15.75 | 8.61E-04 | 2.00E-02 |
| RNA polymerase binding (GO:0070063) | 15.75 | 8.61E-04 | 1.93E-02 |
Table 4.
Cellular component enrichment.
| PANTHER GO-Slim Cellular Component | fold Enrichment | P-value | FDR |
|---|---|---|---|
| COPI vesicle coat (GO:0030126) | 31.5 | 9.72E-05 | 2.38E-03 |
| COPI-coated vesicle (GO:0030137) | 28.64 | 1.33E-04 | 2.95E-03 |
| Golgi-associated vesicle membrane (GO:0030660) | 21 | 3.43E-05 | 1.12E-03 |
| ER to Golgi transport vesicle membrane (GO:0012507) | 19.69 | 4.35E-04 | 7.33E-03 |
| Protein serine/threonine phosphatase complex (GO:0008287) | 16.41 | 1.22E-05 | 4.58E-04 |
| Coated vesicle membrane (GO:0030662) | 15.98 | 2.50E-07 | 1.53E-05 |
| Golgi-associated vesicle (GO:0005798) | 15 | 1.37E-04 | 2.90E-03 |
| Vesicle coat (GO:0030120) | 12.8 | 4.22E-05 | 1.29E-03 |
| Membrane coat (GO:0030117) | 12.35 | 8.71E-06 | 4.26E-04 |
| Coated membrane (GO:0048475) | 12.35 | 8.71E-06 | 3.87E-04 |
Table 5.
Enrichment in different pathways.
| PANTHER Pathways | fold Enrichment | P-value | FDR |
|---|---|---|---|
| B cell activation (P00010) | 7.61 | 5.11E-04 | 4.08E-02 |
| T cell activation (P00053) | 7.41 | 1.62E-04 | 2.59E-02 |
| Wnt signaling pathway (P00057) | 3.43 | 7.33E-04 | 3.91E-02 |
Table 6.
Median survival in both lower and higher expression of the target gene STK24.
| Median survival | |
| Low expression cohort (months) | High expression cohort (months) |
| 10.8 | 17.5 |
Table 7.
Interaction combined score of the proteins related to Acute Myeloid Leukemia.
| No | Protein related with AML | Interaction with STK24 combined score |
| 1 | PDCD10 | 0.999 |
| 2 | PPP2R1B | 0.995 |
| 3 | STK11 | 0.59 |
| 4 | TCP1 | 0.994 |
| 5 | STK25 | 0.999 |
| 6 | STK26 | 0.997 |
| 7 | STRN3 | 0.998 |
Table 8.
Correlation of the protein STK24 with AML and glutamine metabolism related proteins.
| Proteins | P-value | Pearson’s r value | R value |
|---|---|---|---|
| FLT3 | 0.000141 | -0.138 | -0.6 |
| NMP1 | 5.27e – 05 | 0.398 | 0.85 |
| RUNX1 | 7.15e – 05 | 0.203 | 0.14 |
| RARA | 6.5e – 05 | 0.222 | 0.64 |
| IDH1 | 5.48e – 05 | 0.27 | 0.86 |
| IDH2 | 0.000146 | 0.136 | 0.68 |
| GLS | 5.59e – 05 | 0.262 | 0.76 |
| SLC1A5 | 5.27e – 05 | 0.48 | 0.91 |
| GDH | 5.27e – 05 | 0.395 | 0.9 |
| SLC7A11 | 7.68e – 05 | 0.193 | 0.69 |
Disclaimer/Publisher’s Note: The statements, opinions and data contained in all publications are solely those of the individual author(s) and contributor(s) and not of MDPI and/or the editor(s). MDPI and/or the editor(s) disclaim responsibility for any injury to people or property resulting from any ideas, methods, instructions or products referred to in the content. |
© 2024 by the authors. Licensee MDPI, Basel, Switzerland. This article is an open access article distributed under the terms and conditions of the Creative Commons Attribution (CC BY) license (http://creativecommons.org/licenses/by/4.0/).
Copyright: This open access article is published under a Creative Commons CC BY 4.0 license, which permit the free download, distribution, and reuse, provided that the author and preprint are cited in any reuse.


