
Submitted:
11 October 2024
Posted:
28 October 2024
You are already at the latest version
Abstract
Academic performance is the level of achievement that students reach in their educational activities. It is influenced by several factors that should be analysed and prioritised, especially in engineering courses, characterised by their difficulty and low success rates compared to other careers. This paper analyses the impact of these factors on academic performance during exams in a technical college in southwestern Spain, with a particular focus on environmental conditions, identified as a relevant and independent variable. The results show a significant connection with thermal comfort and academic performance. Temperatures within the comfort range (23-26°C) improved students' satisfaction with exams. In contrast, those who experienced thermal discomfort pointed to environmental conditions as the main obstacle to their performance, overcoming factors such as prior preparation and coincidence of exams. These findings underline the importance of optimising the classroom's thermal environment through strategies that promote a more favourable learning space, improving both students' well-being and their academic performance.
Keywords:
discomfort
; environmental conditions
; exam
; temperature
; higher education
; satisfaction
; engineering undergraduates
1. Introduction
Academic performance refers to students' level of achievement in their educational activities, which is usually assessed through grades, exams, papers and other indicators of progress [1,2]. This performance is influenced by various factors, including gender, IQ, family background, motivation, teaching methods, culture and socio-economic conditions [3,4,5]. Overall, good academic performance reflects effective learning and achievement of educational goals [6].
Engineering courses tend to have lower success rates compared to other academic disciplines [7]. This reality generates a climate of demotivation among students [8], who are fully aware of the inherent difficulty in these programmes [9]. In this context, academic performance is mainly evaluated through written exams [10], which assess theoretical mastery and practical skills [2,11]. There is no doubt that students' performance is influenced by several variables [12]. These include the learning strategies employed [13], the design of the tests [14] and the level of stress experienced by the students [15].
Appropriate teaching strategies are key to successful learning in Engineering [16]. Teaching must be flexible, adapting to the needs of the students and the characteristics of each subject [17]. Also, as these careers are constantly evolving like the technologies being learned, teaching must be continuously updated [18].
Regarding the configuration of exams, Ortega-Sanchez proposed methods for designing efficient written tests according to the sequence and difficulty of the questions [19]. Florido et al. showed that the order of tests influences performance [20]. In addition, Kuzilek et al. stressed the importance of adequate time for exam preparation [21].
For their part, engineering students face high levels of stress and anxiety due to concerns such as lack of sleep, marks and competition [22,23]. This impairs their academic experience, performance and continuity in their studies [24,25,26], although they often ignore it [27]. To address this problem, Balaji et al. suggested adopting new ways of communication and learning to reduce classroom stressors [28]. Jensen and Cross examined the connection with stress, anxiety and depression in engineering, highlighting the need for attention to mental health, especially in women and first-year students [29]. Lastly, several authors demonstrated that stress and lack of motivation increased in students with a higher number of exhausted exam attempts [30,31].
In addition to these factors, other variables affect performance [32,33], such as socio-economic status [34], the available resources in exams [35,36] and the characteristics of universities and classrooms [37].
As mentioned, the literature recognises the importance of socio-economic status on academic performance, but there are discrepancies about which specific variables are more important determinants (parental education and occupation, income, resources, etc.) [34,38]. Some studies indicate that students with better economic status and more educated parents tend to perform better [39,40]. However, other researchers suggest this relationship is less relevant at the university stage [34,41]. Smith found that, despite the obstacles, low socioeconomic students admitted to university share a similar educational experience to better-off students [42]. Similarly, the importance of cultural and social capital has been highlighted [43,44], as have learning resources at home (computer, internet connection, study space, etc.) [34,45]. These factors became more relevant during the COVID-19 confinement [46,47,48].
The resources that teachers provide in exams (notes, computers, etc.) can improve results by reducing anxiety and allowing them to better demonstrate their knowledge [36,49]. This approach is also considered beneficial in preparing students for future career decisions [50,51].
The physical characteristics of classrooms, such as size, distribution and quality of furniture, can hinder or facilitate performance [52,53,54,55]. Thus, the need to reduce class sizes to improve performance has been reported [56], particularly in Engineering and Science [57]. In addition, inadequate chairs or tables can affect students' concentration [58,59].
On the other hand, it is relevant to highlight the impact of indoor environmental conditions on educational activities [60]. Elements such as temperature, humidity, air velocity, indoor air quality (IAQ) and ventilation are crucial for the learning environment and concentration [61]. Brink et al. noted that optimal thermal comfort conditions improve emotional, cognitive and performance [62]. Hoque and Weil concluded that they also increase satisfaction and qualifications [63]. Meanwhile, Kim et al. analysed the psychophysiological effect of indoor thermal conditions on learning. They found that in warm conditions, there was a significant connection with alertness and memory capacity, while in cold environments, executive capacity and mental workload were related [64].
This effect was even more noticeable during the COVID-19 pandemic, as the natural ventilation (NV) measures imposed may have altered the indoor temperature [65]. Therefore, the need to balance ventilation and thermal comfort has been raised [66]. This problem was pointed out by several authors, who investigated the adverse impact of NV on the thermal comfort of students during the pandemic, even though these measures are essential to ensure IAQ [67,68,69,70,71]. In the current post-pandemic context, concerns about maintaining good IAQ conditions persist [72], although NV measures are gradually shifting back towards the pursuit of thermal comfort, especially in non-air-conditioned classrooms during the summer [73]. Despite the demonstrated relevance of thermal comfort in the educational environment, when reviewing the literature, no studies have been found that specifically analyse how this has affected not only the well-being but also the learning and performance of university students in key situations such as exams.
Finally, after identifying the predominant factors affecting academic performance, a limited number of studies have been observed that integrate all these variables and compare them, analysing the weight of each of them [6,14,74]. Furthermore, how different environmental settings may influence the importance students attach to these factors has not been addressed. It would also be valuable to examine how each factor may affect student satisfaction with exam performance.
Therefore, this study aims to identify, examine and prioritise the factors that most negatively influence academic performance and the satisfaction perception of university students regarding exams. It also aims to analyse whether the influence of these factors varies according to the different climatic scenarios recorded and the students' thermal perceptions of these environments.
To conduct this analysis, surveys were distributed to students to understand their perception and comfort level, and measurements of environmental parameters were made in a technical college located in the southwest of Spain during the late spring and early summer of 2022. The results of this research could help identify the variables that most influence adequate performance during exams, as well as allow for the optimisation of environmental conditions in educational centres. This would promote a more favourable environment for exams, improving both academic performance and the general well-being of students.
2. Materials and Methods
Figure 1 shows the different stages of the methodology used to carry out this research.
2.1. Preparation Stage
Field studies require careful preparation due to the large amount of information that needs to be collected in advance [75].This process was divided into two phases (operational and methodological) that were carried out between January and May 2022. Thus, in the operational planning phase, the areas to be examined were defined, and the population participating in the study was identified. Simultaneously, in the methodological planning phase, the parameters to be analysed were determined, and the evaluation tools were prepared.
2.1.1. Operational planning
The Industrial Engineering School (38°53′2.5″N, 7°00′11″) belonging to the University of Extremadura in Badajoz (Spain) was selected for the study, as it is the reference centre of the research team and therefore provided considerable operational advantages. This building, constructed in 1999, has a surface area of 11,418 m² distributed over three floors, a basement and a flat roof. The building consists of 4 parallel rectangular pavilions housing laboratories and teachers' offices, connected by a perpendicular pavilion with 13 classrooms, the surface areas of which vary between 65.50 and 135.50 m². The windows of the classrooms face north and are located on the wall opposite the entrance door. All classrooms have three fixed wooden tables per row, each with three fixed seats. The number of rows varies according to the classroom size, ranging from 6 to 15. The tables are arranged in front of the blackboard to provide a clear view of the class for all students.
Once the educational institution was selected, its management team was contacted to present the objective of the research and to request general permission.
After analysing the assessment calendar, two periods were selected for the study: (1) the ordinary exams of the second semester of the academic year 2021-2022, from 18 to 30 May 2022; and (2) the extraordinary final exams for students who did not pass the exams in the ordinary exams, from 23 June to 8 July 2022. These periods were chosen because they included a significant number of tests, which is relevant to avoid biases in the experiment. In addition, in this institution, due to the characteristics of its degrees, many exams with many students are usually held during the extraordinary exam period. Consideration was also given to the fact that, during this period, the highest temperatures of the academic year are recorded in Badajoz due to its Mediterranean climate, characterised by hot, dry summers with temperatures that can exceed 40°C [73,76].
Subsequently, for the selection of classrooms and exams to be sampled, criteria such as the number of tests on all floors of the building, of different degrees and courses, with different numbers of students, and the duration of each exam were considered. Once the possible exams were selected, a final request for permission was made to the lecturers in charge of the exams, with a positive response in most cases.
Thus, considering the aforementioned criteria, the student surveys and environmental measurements were planned to be carried out over 20 days. It was decided to use 9 classrooms out of the 13 (64.29%) that were available for the exams of the two exam sessions (the classrooms not selected have identical characteristics to the rest). Thus, it was planned to analyse 20 of the 52 exams scheduled for the ordinary exams (38.46%) and 12 of the 74 exams for the extraordinary exams (16.22%). All the exams were scheduled in the morning, starting at 8:00 or 11:30 a.m., with duration varying between one and four and a half hours.
2.1.1. Methodological Planning
This phase focused, firstly, on reviewing the literature to identify factors that may negatively affect the performance of undergraduates, especially engineering students, during exams. To ensure process validity, the methodology adopted in the JBI Evidence Synthesis Manual [77]. Table 1 shows the main inclusion and exclusion criteria used for the literature review.
A search for information was then carried out in different recognised databases in the field of Educational Sciences (Scopus, Web of Science (WoS) and Google Scholar) using the following terms: influencing factors, educational performance, university students, higher education, engineering, exams and assessment tests.
After an initial review of the results in terms of titles, keywords and abstracts, and a subsequent exhaustive analysis of the full texts, a total of 73 articles and conference papers were selected. From these papers, we extracted and classified the main influencing factors shown in Table 2 and previously discussed in the Introduction of this paper.
Once the elements of influence were established, the questionnaire used in the study was designed and prepared in paper format and Spanish. The questionnaire consisted of three parts: (1) collection of personal and demographic information about the students (age, gender, degree, classroom, subject, etc.); (2) questions about the experience of the exam; and (3) analysis of the thermal sensation and comfort level.
For the analysis of the student's perception of the exam, firstly, the number of times they had taken the exam was asked. Subsequently, a question was included to assess the satisfaction degree with taking the exam. In this case, a scale ranging from 1 "Not at all satisfied" to 5 "Completely satisfied" was used. For the identification of factors negatively influencing performance (Error! Reference source not found.), again a scale from 1 to 5 was used, where a value of 1 means " Not affected me at all" and a value of 5 means " Affected me decisively".
On the other hand, this study has shown an interest in the students' thermal comfort assessment and its impact. Specifically, questions were included to assess thermal sensation (Thermal Sensation Vote, TSV) and degree of comfort (Thermal Comfort Vote, TCV) [112]. For the TSV, a seven-point scale was used to rate responses from hot (+3) to cold (-3). As can be seen in Table 3, values of -1, 0 and +1 indicate comfort, while -3 and -2 indicate cold discomfort, and +2 and +3 indicate heat discomfort [112]. For the TCV, a five-point scale was used to quantify responses from very comfortable (+2) to very uncomfortable (-2). This scale was created by McCartney and Nicol in 2002 [113] and has since been used in multiple studies [60,73,114].
Finally, the evaluation of thermal comfort was also planned using objective environmental measurements. In this case, it was decided to measure the temperature following the guidelines of the ISO 7730:2005 Standard for the period during which the study was planned to be carried out. Thus, to achieve optimal thermal comfort conditions, the operating temperature (Top) should be within the range of 24.50 ± 1.50°C [115].
2.2. Data Collection Stage
In this case, the data collection stage comprises three steps: (1) completion of questionnaires; (2) physical measurements of environmental parameters; and (3) observation. This stage's purpose is to gather information mainly from three sources: the building, the occupants and the researchers [75].
2.2.1. Surveys
Once all the students had entered the corresponding classroom and sat down, leaving as much space as possible between them, with the teacher's permission, one of the researchers explained the aim of the study, presented the equipment used and handed out the questionnaires to all the students present, informing them that the completion of the questionnaire was completely anonymous and voluntary. Although the questionnaires were handed out before the exam so as not to interrupt the exam or distract the students, they were asked to complete them after the end of the assessment test and before leaving the classroom. This allowed them to assess how they felt, and their perception of the parameters analysed. After completion, the students who filled in the questionnaires handed them in with their exams.
2.2.2. Physical Measurements
First, during the tests, a thermal environment meter (model HD32.1, DeltaOHM, GHM Group, Germany) was used to measure the temperature. This device was placed in the centre of the classrooms to ensure a representative climate assessment at a height of 0.60 metres for seated occupants [112]. It was activated 15 minutes before students entered the classrooms to ensure stable measurements [116]. At the end of each test, data was downloaded to a computer using the DeltaLog 10 software associated with the meter.
2.2.3. Observations
During the tests, the researcher (who is present during the test) recorded on the registration form the most relevant data on the characteristics observed in the configuration of the classrooms (orientation, open windows and doors, operation of any air-conditioning system, etc.) and the student's behaviour.
2.3. Data Reporting Stage
In this last stage of the method, all the data extracted from the questionnaires answered by the students were entered and classified. During this process, possible errors and inconsistencies in the answers and incomplete data were also detected. All valid data were organised in spreadsheets for further analysis.
2.3.1. Statistics Analyses
Microsoft Excel and IBM SPSS Statistics 22 were used for statistical analysis. Microsoft Excel was used to organise and tabulate the responses, clean the data and extract the descriptive results of the sample, while SPSS was used to develop the principal component factor analysis that was carried out to understand in more detail the internal structure of the scale of conditioning factors for the student in a written test, as well as for the data mining that allowed a deeper understanding of the hierarchy that these conditioning factors acquire according to the level of thermal comfort/discomfort perceived by the student.
3. Results and Discussion
3.1. Descriptive Analysis
Table 4 shows the distribution of exams, students and questionnaires taken during the experiment. As mentioned, 20 days were analysed, divided equally between the regular and the special exam periods. During the regular period, 20 exams were observed with an average of 24.35 students per exam. In the extraordinary period, 12 exams were held, with a slightly higher average (24.92 students per classroom). In the ordinary session, the number of participants in each exam varied more, reaching a maximum of 71 students. On the other hand, the maximum in the extraordinary exam session was 46 students. Despite the differences in the maximums, the average number of students per class was similar in both periods. This is because many more classrooms were available in the ordinary session (9 classrooms) compared to the extraordinary session (3 classrooms). The larger number of students and classrooms in the ordinary period is because most of the students take part in this exam [20]. In the extraordinary period, only those who had failed or did not show up previously took part [117]. The number of students per classroom in this study was similar to that reported by other authors [118]. For example, Bai and Chang analysed how the size and occupancy of university classrooms affect interaction and academic performance. They found that most classrooms had fewer than 31 students, although some had more than 50 students. Their results confirmed that large class sizes decrease peer support, academic performance and class participation compared to small classes [56]. In contrast, the study by Brink et al. found that the average classroom occupancy before COVID-19 was almost double that reported in this research, with an average of 51.63 students per classroom. However, after implementing capacity control measures during the pandemic, the average occupancy was reduced to 19 people per classroom. This resulted in improved indoor air quality (IAQ) and a more positive student perception of their academic performance [83].
Finally, the number of completed questionnaires (487 in the ordinary call and 299 in the extraordinary call) is proportional to the number of students in each period, which indicates a good participation rate.
A demographic and academic summary of the group of students who participated in this study is shown in Figure 2. A total of 786 questionnaires with valid responses were collected. This sample is comparable to others used in previous studies for university classrooms in different countries [73,74,83,108].
In terms of gender (Figure 2a), males are majority, representing 79.90% of the population (628 students), whereas females constitute 19.47% (153 students). Only 0.64% of the students did not identify themselves as male or female. This gender distribution is typical of engineering colleges [9,73,119,120].
Also, as can be seen in Figure 2b, where the percentage distribution by age is represented, the largest segment, representing 29.99%, corresponded to students in the age range 20-21 years (236 students). This was closely followed by the 18-19 age group with 29.73% (234 students). The minority group was the 24-25 year olds constituting 8.01% of the surveyed population (63 students).
Regarding degree distribution (Figure 2c), 38.42% of the students studied a Bachelor's Degree in Mechanical Engineering (BME), followed by a Bachelor's Degree in Electronic and Automatic Engineering (BEAE) with 31.81%. At the same time, the Bachelor's Degree in Electrical Engineering (BEE) accumulated 10.31% of the responses, and the Bachelor's Degree in Industrial Technologies (BIT) was 9.54%. Master's degrees accounted for 9.93% of the valid responses, divided between 7.98% for the Master's Degree in Occupational Risk Prevention (MORP) and 2.04% for the Master's Degree in Industrial Engineering (MIE).
In terms of academic years (Figure 2d), first-year (29.52%) and second-year (28.50%) undergraduates made up the majority of the group, with a progressive decrease in the higher years and 9.92% of students in Master's programmes. These results are in line with those obtained for the age distribution.
Finally, most of the participants have been tested only once (60.94%), and only a small percentage (0.64%) took the exams more than four times, as seen in Figure 2e.
3.2. Data Analysis
3.2.1. Scale of Satisfaction with the Exams
Figure 3 shows the percentage distribution corresponding to the scale of students' satisfaction with the performance of the exams. Within the 786 valid responses collected from the questionnaires, 35.11% (276 students) considered themselves satisfied, while 33.33% (262 students) stated that they were quite satisfied. In addition, 11.58% (91 students) were totally satisfied, making a total of 79.02% of students with a positive perception towards their exam performance. On the other hand, 14.76% (116 students) were not very satisfied and 5.22% (41 students) were not satisfied at all, representing 19.98% of students experiencing some degree of dissatisfaction. These results indicate that although most students were happy with the exams, there was a significant minority, suggesting the need to analyse which factors may negatively impact the assessment process to increase their overall satisfaction [121,122]. Furthermore, knowledge of all these factors is essential to mitigate them and improve the student experience [80]. Analysing these factors together and prioritising them is crucial, as it allows identifying which ones have the greatest impact and which ones need to be addressed more urgently. By identifying and prioritising them in this way, it is possible to implement more effective strategies that reduce their influence, contributing to a more positive and effective learning environment [123].
3.2.2. Factors Negatively Influencing Academic Performance
Figure 4 shows a disaggregated analysis of how the factors identified in the literature review, listed from 1 to 11 as shown in Table 2, have negatively affected students' academic performance during their exams. As can be seen, the main factors that students considered decisive in their performance were “Coincidence or closeness in time with other exams” (15.52%), “Exam preparation” (11.83%) and “Exam difficulty” (8.27%). These factors have highlighted the importance of planning and time management [80], as well as the tested content complexity [14].
The importance of the factor “Coincidence or proximity in time with other exams” on the academic performance of university students has also been observed by Florido et al. [20], Merino and Soto [93], and Sanz and Tena [94]. These authors have shown that the order of the exams affected negatively the percentage of students sitting the exams, that is, more students sat the first exam, and the percentage of students sitting the exams decreased as the exams went by. Also, the results obtained in the first exams systematically showed better results in the following exams. For this reason, they considered that it would be essential to rearrange the exam period with days off between exams to encourage students to obtain better grades. This conclusion is directly related to the influence of the second most influential factor, “Exam preparation”. Several authors have highlighted that having sufficient and quality time to prepare improves the exam experience and the success rate of students [21,97]. Regarding the academic activities that students should undertake to prepare for assessment tests, some discrepancies between authors have been observed. Díaz-Mora et al. reported that class attendance, self-study and group work had a positive and statistically significant effect on grades [98]. On the other hand, Grave noted that group work, particularly, was negatively correlated with exam results in science and engineering students [99]. Furthermore, Almoslamani showed that there are significant differences in how these activities influence exam preparation according to the gender of the students. In particular, the effect of self-study was found to be more positive in females [13].
Photopoulos et al. found that the ‘’Exam difficulty‘’ was higher when the tests contained concept application questions[101]. These types of questions are the most common in the exams of engineering courses [102]. Similarly, Rasul and Bukhsh [14], Rezigalla et al. [100] and Ortega-Sánchez [19] found that if the student has a perception of difficulty before the assessment test, this will be maintained after the test is taken.
On the other hand, the first factor that did not affect most students was the "Tools used" (62.60%), as most of the exams were conducted using only a calculator as an additional tool. These results are in line with those reported by Chen and Lai [104] and Bouck et al. [105] in their respective studies, where it was shown that the use of calculators in exams does not have a significant positive or negative impact on grades. However, the appropriate use of other tools, such as notes, mobile applications and software, has been shown to improve students' academic performance [35,36,51]. The “Pressure from failed exam attempts” accounted for 57.12% of the responses with no influence on performance, because most of the respondents faced their respective exams for the first time during the periods evaluated (Figure 2e) [30]. This factor becomes more relevant as students have to repeat a subject [81]. These factors are closely followed by “Health condition” (53.18%), “Family/personal situation” (52.67%) and “Exam duration” (49.87%) showing no impact on academic performance.
The results of the variable “Family/personal situation” coincide with those observed by Rodríguez-Hernández et al. [34], Richardson et al. [41] and Smith [42], who highlight that, as one progresses through the educational levels, this factor loses influence on academic performance. Along the same lines, it has been found that the “Exam duration” taken by each student seems to be adequate. Both Ellis [88] and Fengler and Ostafichuk [89] have stated that the optimal exam time should be shorter.
On the other hand, the limited influence of “Physical health condition” could be explained by the time of year in which the study was conducted (spring-summer), when the prevalence of illnesses, especially respiratory diseases such as colds and flu, is lower [124]. However, Al-Jokhadar et al., in their autumn study, showed that the symptoms associated with these pathologies have a significant impact on academic performance [109]. Regarding “Mental health conditions”, some discrepancies have been found between the results of this study and those of other authors [106]. In most of the studies reviewed, this variable is highly influential on the academic performance of university students, particularly in engineering courses [29] and during the COVID-19 pandemic period [108]. Therefore, based on these findings, and although several authors have highlighted the direct connection with mental and physical health in university students [111], it would be pertinent to ask whether it would be interesting to analyse both variables separately.
Despite the results obtained for “Health condition”, “Level of nervousness” (82.06%) was the variable that most affected the students to some degree. This may attest to the importance of emotional factors when facing different assessment tests, which may reduce the ability to concentrate, process information and make decisions under pressure [15]. Furthermore, these emotional states can reduce performance, even in well-prepared students [79]. Balaji et al. showed that students experienced increased levels of perceived stress and anxiety just before the exams began, accompanied by the belief that their academic performance would be negatively affected. However, after taking the tests, the level of anxiety decreased significantly [28].
Finally, “Classroom environmental conditions” and “Table and chair comfort” were also relevant, moderately affecting around 50% of the students. These results are supported by the findings of Yang et al. who found that students' perceptions of their academic performance were highly dependent on classroom attributes (layout and type of classroom furniture) and environmental attributes (temperature and indoor air quality) [74]. Lee et al. showed that as university students' complaints about environmental conditions increased, academic performance decreased [85]. Chen and Tsai also found that seat depth and backrest height had an interaction effect on learning tasks [91].
3.2.3. Analysis of the Internal Structure of Factors Influencing Academic Performance
Further to the analysis of the factors that the student perceives as influencing their exam, and given that this is a newly created scale, it was considered relevant to analyse to examine its internal structure. This will allow a better understanding of the nature and composition of the factors that affect the exam result. According to Churchill [125] or Gerbin and Anderson [126], exploratory factor analysis is a useful tool in the process of creating new scales to investigate, in the first steps of research on a construct [125], the structure and dimensionality of the scale. Therefore, exploratory factor analysis has been carried out using the principal components method as a means of extraction to detect the number of factors needed to account for the maximum portion of variance represented in the original data set [127]. The criterion for selecting the number of components in this case was the latent root criterion, extracting factors with eigenvalues greater than 1, that is, only those factors that explain (and therefore contain) at least one variable from the original scale were extracted. VARIMAX rotation was applied to saturate the factor scores on each factor. The adequacy of the factor analysis was verified through the Kaiser-Meyer-Olkin measure (value of 0.872) and Barlett's test of sphericity (significance 0.000). The results (Table 5) show that four factors were extracted that managed to explain 66.05% of the total variance, which is an acceptable value in the field of social sciences [127]. Moreover, the communalities were, in all cases, higher than 0.5, which allows all the original variables to be kept in the scale analysis.
Table 6 shows the results of the rotated component matrix, with the values of the factor scores obtained using VARIMAX. The result achieved is quite consistent and allows us to associate all the indicators of the original scale with a factor or principal component. Thus, the analysis of the internal structure reveals that the variables that have influenced an examination are summarised in four main factors: FACTOR 1: conditioning factors before the start of the exam; FACTOR 2: personal conditioning factors; FACTOR 3: material conditioning factors during the exam; and FACTOR 4: environmental conditioning factors during the exam.
This analysis concludes that there are four major elements or factors that influenced the outcome of an exam, according to the perceptions of the students tested and among these, environmental conditioning factors have robustly and consistently impacted the result of these assessment tests, to the extent that they are in themselves an influential factor in their own right and distinct from other influencing factors (Table 7). This grouping of factors is close to that proposed by Rasul and Bukhsh. These authors divided the variables studied into extrinsic factors (related to the classroom environment where the exams take place), intrinsic factors (related to the characteristics of the exam itself), personal factors (family problems, stress, over/lack of confidence) and miscellaneous factors (handwriting, materials used, study strategies, fear of exams) [14]. On the other hand, Baharin et al. grouped the different factors into the following groups: academic, personal, socio-economic, and curricular and guidance factors, with academic factors having the greatest influence on educational performance [6]. Finally, Yang et al. identified that factors influencing university students' satisfaction and performance can be grouped into three categories: environmental (temperature, IAQ, lighting and acoustics), spatial (classroom layout, furniture and visibility) and technological (projector, computers, smart board, etc.) attributes [74].
3.2.4. Environmental Conditions and Thermal Comfort
As has been shown in the previous analysis, environmental conditions have been revealed as a factor with a great influence on the student's perception of their performance in the tests. Therefore, it is of interest to analyse how the different weather scenarios recorded have had an impact on satisfaction with the exams, as well as on the thermal sensation and perceived degree of comfort [62,128].
First, Figure 5 analysed how the average operative temperatures (Top) measured during the tests affected the students' satisfaction. The red dashed lines represent the comfort temperature range of ISO 7730:2005 (between 23.00 and 26.00°C) [115]. The purple dotted line shows the level of satisfaction at which the perception of the exam was considered satisfactory (level 3). As can be seen, there was a clear correlation between the operative temperature and the level of student satisfaction. Temperatures within the comfort range, represented by green dots, tended to be associated with higher levels of satisfaction (green bars), while temperatures outside this range, both higher (yellow dots) and lower (blue dots), tended to be associated with lower levels of satisfaction (yellow and blue bars, respectively). This effect was observed by Li and Patel [84] and Lan et al. [129], especially in cases with elevated air temperature. In the specific case of test number 8, although the temperature was slightly above the comfort range, the average student satisfaction was above 3. This might suggest that, although Top was outside the comfort range, the perceived simplicity of this particular exam may have compensated for the small degree of thermal discomfort, resulting in a favourable average satisfaction. Ultimately, this analysis suggests that maintaining temperatures within the recommended comfort range may contribute significantly to improving students' perception of satisfaction during exams [63,85].
Figure 6 represents the distribution of votes related to thermal sensation (TSV) and the degree of thermal comfort (TCV) perceived by the surveyed university students. Specifically, Figure 6a (TSV) shows that almost half of the respondents perceived the thermal sensation as “Neutral” (43.77%), while a significant number found it “Slightly cool” (27.35%) or “Slightly warm” (16.67%). Extreme perceptions of warmth or coolness were minimal. In the study by Romero et al., which compared the thermal sensations of university students in Spain and Portugal during the same time of the year, it was observed that the distribution of votes in Spain was very similar to that obtained in this research. On the other hand, in Portugal, the votes were more inclined towards feelings of warmth, as temperatures were considerably higher [73]. This effect has also been observed in studies carried out in the same climatic zone by Aparicio-Ruiz et al. [130] and Corgnati et al. [131].
On the other hand, Figure 6b (TCV) shows that the vast majority of students felt “Comfortable” (61.96%) with the environmental conditions during the tests. At the same time, a notable proportion felt “Slightly uncomfortable” (21.50%), and few felt extremely comfortable or uncomfortable. In summary, most of the people evaluated perceived a balanced and comfortable thermal environment, with few opinions leaning toward extremes of discomfort. In the case of the research conducted by Brink et al., all students surveyed in the Brink et al. research experienced thermal discomfort due to sensations of thermal heat [62]. For their part, Hoque and Weil for the same range of indoor temperatures as those recorded in the present study, 31.54% of the students rated the thermal environment as “Comfortable”, 48.41% experienced “Moderate discomfort” and the remaining 20.05% felt “Very uncomfortable” [63]. Finally, Talukdar et al. [114] and Aparicio-Ruiz et al. [130] observed in their respective works that when students rated the TSV as “Neutral”, “Slightly hot”, or “Slightly cold”, the percentage of TCVs resulted similarly to those given in this research.
Figure 7 shows the percentage distribution of responses according to the level of satisfaction with the exams about the TSV (Figure 7a) and TCV (Figure 7b).
The first figure shows a clear connection with perceived thermal sensation and satisfaction levels. Extreme thermal sensations, both hot and cold, tended to generate higher levels of dissatisfaction among respondents. In particular, the TSV category “Hot” presented the highest percentage of dissatisfaction, with 28.60% of the responses “Not at all satisfied”. In this regard, several authors observed that higher temperatures reduce satisfaction with exam performance and scores [82,87]. On the other hand, thermal sensations close to comfort, such as “Neutral” and “Slightly cool”, were those with the highest levels of satisfaction, with approximately 16% of respondents saying “Completely satisfied”. Overall, the results suggest that people tended to feel more comfortable and satisfied in thermal environments that were in the neutral or slightly cool range, while more extreme temperatures led to greater dissatisfaction. Lan et al. stated that optimal performance was achieved when people felt “Slightly cool”, so they proposed to modify the comfort limits [129].
In the second figure, it can be seen that, at the highest comfort levels, most respondents were in the highest categories of satisfaction. The percentages of responses in “Completely satisfied”, “Quite satisfied”, and “Satisfied” exceeded 80% when students felt comfortable (“Very comfortable”, “Slightly comfortable”, and “Comfortable”), reaching up to 97.56% at the highest comfort level. However, as comfort decreased, dissatisfaction increased significantly, especially at “Very uncomfortable”, where 22.58% of respondents stated “Not at all satisfied”. This pattern suggests a direct correlation between comfort level (TCV) and satisfaction with taking the exam. Hoque and Weil found that students who felt thermal discomfort, either from cold or heat, performed worse on exams than those without thermal discomfort [63].
Figure 8 and Table 8 show the results obtained for the factors that negatively affected performance during the exams from the aggregate analysis based on the regrouping of the different levels of TSV shown in Table 3 [112].
First, when students experienced heat discomfort (Figure 8a), “Environmental conditions” had the greatest impact on their academic performance. This variable presented the highest proportion of responses in the “A lot” categories (48.68%), as reflected in the statistical results in Table 8. In addition, 39.47% of the students considered that “Environmental conditions” had a “Decisive” influence on their performance during the evaluations. This factor is followed by “Exam preparation”, “Exam difficulty”, and “Coincidence or closeness in time with other exams”, which between 15 and 20% of the students considered their influence as “Decisive”.
When there were situations of thermal comfort (Figure 8b), the factor that most negatively influenced performance was “Coincidence or closeness in time with other exams”, with more than half of the responses concentrated between “Decisive” and “Quite a lot” (57.41%). According to the mode (Table 8), this latter category concentrated most of the votes in this variable.
Finally, when students felt uncomfortable because of the cold (Figure 8c), the factor “Environmental conditions” had all their responses in the “Decisive” category. Thus, it is clear that as students felt colder, this factor weighed more heavily than when they felt discomfort from heat. As was the case in situations of heat, “Coincidence or closeness in time with other exams” and “Exam preparation” followed “Environmental conditions” as negatively influencing variables, with 46.67% and 26.67% of responses in the “Decisive” category, respectively.
In contrast, and as observed in the analysis in Figure 4 for the three grouped levels of TSV, the factor “Tools used” had no influence on the perception of exam performance for most of the students surveyed (61.84% for heat discomfort, 62.88% for thermal comfort and 53.33% for cold discomfort). Table 9 summarises the statistical results for the variable “Environmental conditions” according to the grouping made for the different levels of TSV. As can be seen, when heat discomfort was recorded, the mean was 4.25, with a median and mode of 4, suggesting a consistent perception of high thermal discomfort. The 25th percentile was also 4, indicating that most responses are clustered at high levels of discomfort (Category “A lot”). On the other hand, in terms of thermal comfort levels and according to the category that appeared most frequently within the set of recorded votes (mode), students perceived that “Environmental conditions” did not influence their perception of educational performance. However, the mean and median responses were somewhat higher (2.12 and 2.00, respectively), indicating that, although a large proportion of the participants did not perceive an influence of this factor, for another proportion it did have a slight but present influence. Because of this, this variable would be the 5th in order of priority for the students. In cold discomfort situations, the mean was 5, with a median and mode also of 5, and a 25th percentile of 5, which indicates a uniform and maximum perception of cold discomfort, as can be seen in its position in the ranking of importance of the influencing factors. These results would follow the findings of Yang et al. who concluded that “Environmental conditions” were the most important attribute for students compared to spatial and technological attributes [74].
Extreme thermal sensations, both hot and cold, tend to have a greater influence on academic performance [63,82,87]. In contrast, comfortable conditions have shown greater variability in the perceived weight of “Environmental conditions” on exam performance. Thus, this analysis has highlighted the importance of maintaining a balanced thermal environment to minimise the impact of this variable on students' academic performance and well-being and to promote a more favourable learning environment [61,64].
To conclude the analysis and to highlight the findings, Figure 9 shows the mean values of the grouping of the TSV levels for “Environmental conditions” and their comparison with the factor “Coincidence or closeness in time with other exams”. This variable was selected because it was generally the one that had the greatest influence on students' academic performance during the exams [20,93,94], as shown in Figure 4 and its subsequent evaluation.
It can be observed that the variable “Coincidence or closeness in time with other exams” has proved to be more stable compared to the factor “Environmental conditions” in the face of the variety of thermal sensations. The effect of “Temporal coincidence” did not vary according to whether the students perceived it to be hotter or colder. In contrast, the average effect of “Environmental conditions” was larger in situations of thermal discomfort [63]. Although this result could be considered predictable, it is relevant to note that the increase in the influence of this factor was so significant that it surpassed the impact of “Coincidence or closeness in time with other exams”, which was the most relevant factor. Also, as already shown in this study, cold discomfort affected students' academic performance to a greater extent than heat discomfort.
4. Conclusions, Implications and Limitations
Overall, the findings of this study reflect that although most students reported positive satisfaction with the exams, a significant minority experienced some degree of dissatisfaction. This highlights the need to analyse the factors that may have negatively influenced the assessment process, especially in engineering courses, which have lower success rates than other university careers. Among the main variables that impacted academic performance were the coincidence or closeness in time between exams, the preparation for the exams and the difficulty of the contents assessed. These results underline the importance of proper planning and efficient time management, as well as the relevance of the complexity of the content being tested. It was also observed that the level of nervousness before the exams was the factor that most affected the students' performance to some degree, which highlighted the relevance of emotional aspects in the assessments. Other factors such as the tools used, family or personal situation and state of health showed less influence on perceived academic performance. Finally, continuing with the pooled analysis, environmental conditions had a moderate impact on performance.
The internal structure analysis of the influential factor scale allowed us to group these factors into four main components: previous conditions factors, personal conditioning factors, material conditioning factors and environmental conditioning factors. Therefore, one of the most outstanding findings was that environmental conditions had a consistent and significant impact on academic performance, which positions them as a factor of their own and independent of the rest of the items. Therefore, it was considered of interest to assess how different climate scenarios may have impacted students. Thus, firstly, a clear correlation was found between temperature and average levels of satisfaction, observing that tests carried out within the recommended comfort range (between 23 and 26°C) generated higher levels of satisfaction with the exams. It was also found that students who experienced hot or cold thermal sensations were less satisfied, whereas neutral or slightly cold thermal sensations were associated with higher levels of satisfaction. Finally, it was found that in situations of thermal discomfort, environmental conditions became the main factor that had a negative impact on academic performance, surpassing the variable coincidence or proximity in time with other exams, which has been shown to have the greatest influence in general and in situations of comfort. Based on these results, one of the main implications would be the need to optimise the environmental conditions in classrooms by implementing more efficient ventilation strategies or air conditioning systems, as required by the climate, since it has been shown that environmental comfort levels directly influence students' ability to concentrate and perform optimally in exams.
Although this study provides valuable results, certain aspects should be considered when interpreting them. Firstly, since the analysis is based on students' perceptions of their performance, satisfaction and thermal sensation, self-reported data may be influenced by memory or factors external to the assessed environment. Complementing this approach with objective measures of academic performance, such as grades, could enrich the analysis and provide a more balanced perspective. On the other hand, the study was conducted at the end of the academic year, when temperatures tend to be higher. Including other periods of the year in further studies would provide a more complete picture of the impact of environmental conditions on academic performance across different seasons. Finally, besides classroom thermal conditions, it would be beneficial to explore other environmental factors, such as noise, lighting and indoor air quality. This approach could provide a more comprehensive perspective, particularly if one seeks to understand which of these factors has the most influence on student experience and performance.
In conclusion, this study could provide valuable insights into the factors affecting academic performance, especially environmental conditions. Highlighting the impact of variables such as temperature and thermal comfort on student satisfaction and performance, it underlines the importance of optimising conditions in assessment spaces. Future efforts can then be directed towards implementing strategies that favour a more conducive environment for learning and assessment. In addition, the results highlight the importance of considering other aspects related to the educational environment and student well-being in the design of future research to improve the overall academic experience.
References
- Azziz, N.H.A.; Saad, S.A.; Yazid, N.M.; Muhamad, W.Z.A.W. Factors Affecting Engineering Students Performance: The Case of Students in Universiti Malaysia Perlis. In Proceedings of the Proceeding of the International Conference on Mathematics, Engineering and Industrial applications 2018 (ICoMEIA 2018); 2018; p. 020030. [Google Scholar]
- Rockstraw, D.A. Use of the Fundamentals of Engineering Exam as an Engineering Education Assessment Tool. Chem. Eng. Law Forum 2013 - Core Program. Area 2013 AIChE Annu. Meet. Glob. Challenges Eng. a Sustain. Futur. 2013, 5. [Google Scholar]
- Barron, A.B.; Hebets, E.A.; Cleland, T.A.; Fitzpatrick, C.L.; Hauber, M.E.; Stevens, J.R. Embracing Multiple Definitions of Learning. Trends Neurosci. 2015, 38, 405–407. [Google Scholar] [CrossRef] [PubMed]
- Lalaeng, C.; Subongkod, M.; Sinlapasawet, W. Individual Competency Casual Factors Affecting Performance of Academic Personnel in Higher Education Institution. Procedia Comput. Sci. 2024, 237, 502–509. [Google Scholar] [CrossRef]
- Cataldo, A.; Bravo-Adasme, N.; Araya, P.; Ormeño, V. Why University Students Are Technostressed with Remote Classes: Study-Family Conflict, Satisfaction with University Life, and Academic Performance. Telemat. Informatics 2023, 80, 101982. [Google Scholar] [CrossRef]
- Baharin, M.; Ismail, W.R.; Ahmad, R.R.; Majid, N. Factors Affecting Students’ Academic Performance Using Analytic Hierarchy Process (AHP). In Proceedings of the 2015 International Conference on Research and Education in Mathematics (ICREM7); IEEE, August 2015; pp. 169–173. [Google Scholar]
- Wang, X.; Dai, M.; Mathis, R. The Influences of Student- and School-Level Factors on Engineering Undergraduate Student Success Outcomes: A Multi-Level Multi-School Study. Int. J. STEM Educ. 2022, 9, 23. [Google Scholar] [CrossRef]
- Sánchez-Barroso, G.; González-Domínguez, J.; García-Sanz-Calcedo, J.; Zamora-Polo, F. Analysis of Learning Motivation in Industrial Engineering Teaching in University of Extremadura (Spain). Sustainability 2020, 12, 4987. [Google Scholar] [CrossRef]
- Botejara-Antúnez, M.; Sánchez-Barroso, G.; González-Domínguez, J.; García-Sanz-Calcedo, J. Determining the Learning Profile of Engineering Projects Students from Their Characteristic Motivational Profile. Educ. Sci. 2022, 12, 256. [Google Scholar] [CrossRef]
- Paloposki, T.; Virtanen, V.; Clavert, M. From a Final Exam to Continuous Assessment on a Large Bachelor Level Engineering Course. Eur. J. Eng. Educ. 2024, 1–14. [Google Scholar] [CrossRef]
- Whitman, D. Effective and Efficient Use of the Fundamentals of Engineering Exam for Outcomes Assessment. Educ. Div. 2017 - Core Program. Area 2017 AIChE Annu. Meet. 2017, 2017, 632–652. [Google Scholar]
- Singh, M.K.; Ooka, R.; Rijal, H.B.; Kumar, S.; Kumar, A.; Mahapatra, S. Progress in Thermal Comfort Studies in Classrooms over Last 50 Years and Way Forward. Energy Build. 2019, 188–189, 149–174. [Google Scholar] [CrossRef]
- Almoslamani, Y. The Impact of Learning Strategies on the Academic Achievement of University Students in Saudi Arabia. Learn. Teach. High. Educ. Gulf Perspect. 2022, 18, 4–18. [Google Scholar] [CrossRef]
- Rasul, S.; Bukhsh, Q. A Study of Factors Affecting Students’ Performance in Examination at University Level. Procedia - Soc. Behav. Sci. 2011, 15, 2042–2047. [Google Scholar] [CrossRef]
- Ahmad, I.; Gul, R.; Zeb, M. A Qualitative Inquiry of University Student’s Experiences of Exam Stress and Its Effect on Their Academic Performance. Hum. Arenas 2022. [Google Scholar] [CrossRef]
- Ruutmann, T.; Kipper, H. Teaching Strategies for Direct and Indirect Instruction in Teaching Engineering. In Proceedings of the 2011 14th International Conference on Interactive Collaborative Learning; IEEE, September 2011; pp. 107–114. [Google Scholar] [CrossRef]
- Giridharan, K.; Raju, R. Impact of Teaching Strategies: Demonstration and Lecture Strategies and Impact of Teacher Effect on Academic Achievement in Engineering Education. Int. J. Educ. Sci. 2016, 14, 174–186. [Google Scholar] [CrossRef]
- Kapranos, P. Teaching and Learning in Engineering Education – Are We Moving with the Times? Procedia - Soc. Behav. Sci. 2013, 102, 3–10. [Google Scholar] [CrossRef]
- Ortega-Sanchez, C. Written Exams: How Effectively Are We Using Them? Procedia - Soc. Behav. Sci. 2016, 228, 144–148. [Google Scholar] [CrossRef]
- Florido, C.; Jiménez, J.-L.; Navarro, Y. Students’ Continuity Norms in the University and Exam Calendar: Do They Affect University Academic Performance? / Normas de Permanencia y Calendario de Exámenes: ¿afectan Al Rendimiento Académico Universitario? Cult. y Educ. 2019, 31, 93–119. [Google Scholar] [CrossRef]
- Kuzilek, J.; Zdrahal, Z.; Vaclavek, J.; Fuglik, V.; Skocilas, J. Exploring Exam Strategies of Successful First Year Engineering Students. In Proceedings of the Proceedings of the Tenth International Conference on Learning Analytics & Knowledge; ACM: New York, NY, USA, March 23, 2020; pp. 124–128. [Google Scholar]
- Jensen, K.J.; Cross, K.J. Board 73: Student Perceptions of Engineering Stress Culture. In Proceedings of the 2019 ASEE Annual Conference & Exposition; 2019. [Google Scholar] [CrossRef]
- Rizwan, A.; Alvi, M.S.I.; Saeed, M.-D. Analysis of Factors Affecting the Stress Level of Engineering Students. Int. J. Eng. Educ. 2010, 26, 681–686. [Google Scholar]
- Frady, K.; Brown, C.; High, K.; Hughes, C.; O’Hara, R.; Huang, S. Developing Two-Year College Student Engineering Technology Career Profiles. In Proceedings of the 2021 ASEE Virtual Annual Conference Content Access Proceedings; ASEE Conferences; 2021. [Google Scholar]
- Burt, K.B.; Paysnick, A.A. Identity, Stress, and Behavioral and Emotional Problems in Undergraduates: Evidence for Interaction Effects. J. Coll. Stud. Dev. 2014, 55, 368–384. [Google Scholar] [CrossRef]
- Hurford, D.P.; Ivy, W.A.; Winters, B.; Eckstein, H. Examination of the Variables That Predict Freshman Retention. Midwest Q. (Pittsb). 2017, 58, 248–251,302–317. [Google Scholar]
- Behere, S.P.; Yadav, R.; Behere, P.B. A Comparative Study of Stress Among Students of Medicine, Engineering, and Nursing. Indian J. Psychol. Med. 2011, 33, 145–148. [Google Scholar] [CrossRef]
- Balaji, N.; Murthy, P.; Kumar, Dn.; Chaudhury, S. Perceived Stress, Anxiety, and Coping States in Medical and Engineering Students during Examinations. Ind. Psychiatry J. 2019, 28, 86. [Google Scholar] [CrossRef] [PubMed]
- Jensen, K.J.; Cross, K.J. Engineering Stress Culture: Relationships among Mental Health, Engineering Identity, and Sense of Inclusion. J. Eng. Educ. 2021, 110, 371–392. [Google Scholar] [CrossRef]
- Go, M.B.; Golbin, R.A.; Velos, S.P.; Pocong, F.Q.; Bate, G.P.; South, P.E. Direct and Indirect Factors Affecting Course Repetition: A Secondary Data Analysis.; 2020.
- Tafreschi, D.; Thiemann, P. Doing It Twice, Getting It Right? The Effects of Grade Retention and Course Repetition in Higher Education. Econ. Educ. Rev. 2016, 55, 198–219. [Google Scholar] [CrossRef]
- Arifin, M.; Widowati, W.; Farikhin, F.; Gudnanto, G. A Regression Model and a Combination of Academic and Non-Academic Features to Predict Student Academic Performance. TEM J. 2023, 12, 855–864. [Google Scholar] [CrossRef]
- Sulaiman, M. Effects of Academic and Nonacademic Factors on Undergraduate Electronic Engineering Program Retention. Walden Diss. Dr. Stud. 2016. [Google Scholar]
- Rodríguez-Hernández, C.F.; Cascallar, E.; Kyndt, E. Socio-Economic Status and Academic Performance in Higher Education: A Systematic Review. Educ. Res. Rev. 2020, 29, 100305. [Google Scholar] [CrossRef]
- Cukierman, U.R.; Aguero, M.; Silvestri, S.; Gonzalez, M.; Drangosch, J.; Gonzalez, C.; Ferrando, D.P.; Dellepiane, P. A Student-Centered Approach to Learning Mathematics and Physics in Engineering Freshmen Courses. In Proceedings of the 2018 World Engineering Education Forum - Global Engineering Deans Council (WEEF-GEDC); IEEE, November 2018; pp. 1–5. [Google Scholar]
- Rincón Leal, L.; Vergel Ortega, M.; Paz Montes, L.S. Mobile Devices for the Development of Critical Thinking in the Learning of Differential Equations. J. Phys. Conf. Ser. 2019, 1408, 012015. [Google Scholar] [CrossRef]
- Asino, T.I.; Pulay, A. Student Perceptions on the Role of the Classroom Environment on Computer Supported Collaborative Learning. TechTrends 2019, 63, 179–187. [Google Scholar] [CrossRef]
- De Clercq, M.; Galand, B.; Frenay, M. Transition from High School to University: A Person-Centered Approach to Academic Achievement. Eur. J. Psychol. Educ. 2017, 32, 39–59. [Google Scholar] [CrossRef]
- Bonsaksen, T. Predictors of Academic Performance and Education Programme Satisfaction in Occupational Therapy Students. Br. J. Occup. Ther. 2016, 79, 361–367. [Google Scholar] [CrossRef]
- Gandarillas, M.A.; Elvira-Zorzo, M.N.; Rodríguez-Vera, M. The Impact of Parenting Practices and Family Economy on Psychological Wellbeing and Learning Patterns in Higher Education Students. Psicol. Reflexão e Crítica 2024, 37, 8. [Google Scholar] [CrossRef] [PubMed]
- Richardson, M.; Abraham, C.; Bond, R. Psychological Correlates of University Students’ Academic Performance: A Systematic Review and Meta-Analysis. Psychol. Bull. 2012, 138, 353–387. [Google Scholar] [CrossRef] [PubMed]
- Smith, E. Can Higher Education Compensate for Society? Modelling the Determinants of Academic Success at University. Br. J. Sociol. Educ. 2016, 37, 970–992. [Google Scholar] [CrossRef]
- Guimarães, J.; Sampaio, B. Family Background and Students’ Achievement on a University Entrance Exam in Brazil. Educ. Econ. 2013, 21, 38–59. [Google Scholar] [CrossRef]
- Kai, W. Social and Cultural Capital and Learners’ Cognitive Ability: Issues and Prospects for Educational Relevance, Access and Equity towards Digital Communication in China. Curr. Psychol. 2023, 42, 15549–15563. [Google Scholar] [CrossRef]
- Gouvias, D.; Katsis, A.; Limakopoulou, A. School Achievement and Family Background in Greece: A New Exploration of an Omnipresent Relationship. Int. Stud. Sociol. Educ. 2012, 22, 125–145. [Google Scholar] [CrossRef]
- Realyvásquez-Vargas, A.; Maldonado-Macías, A.A.; Arredondo-Soto, K.C.; Baez-Lopez, Y.; Carrillo-Gutiérrez, T.; Hernández-Escobedo, G. The Impact of Environmental Factors on Academic Performance of University Students Taking Online Classes during the COVID-19 Pandemic in Mexico. Sustainability 2020, 12, 9194. [Google Scholar] [CrossRef]
- Selvanathan, M.; Hussin, N.A.M.; Azazi, N.A.N. Students Learning Experiences during COVID-19: Work from Home Period in Malaysian Higher Learning Institutions. Teach. Public Adm. 2023, 41, 13–22. [Google Scholar] [CrossRef]
- Purwanto, A. University Students Online Learning System during COVID-19 Pandemic: Advantages, Constraints and Solutions 2020.
- Myyry, L.; Joutsenvirta, T. Open-Book, Open-Web Online Examinations: Developing Examination Practices to Support University Students’ Learning and Self-Efficacy. Act. Learn. High. Educ. 2015, 16, 119–132. [Google Scholar] [CrossRef]
- Moore, C.P. Adding Authenticity to Controlled Conditions Assessment: Introduction of an Online, Open Book, Essay Based Exam. Int. J. Educ. Technol. High. Educ. 2018, 15, 26. [Google Scholar] [CrossRef]
- Ferrante, S.G.; Heppard, C.J. Using Open-Book Exams to Enhance Student Learning, Performance, and Motivation. J. Eff. Teach. 2016, 16, 19–35. [Google Scholar]
- Said, Y.N.; Husaini, A.; Syufiza, N.; Shukor, A. Factors Affecting Students’ Academic Performance: A Review. RES Mil. 2022, 12, 284–294. [Google Scholar]
- Kwabena, A.; Baafi, R. School Physical Environment and Student Academic Performance. Adv. Phys. Educ. 2020, 10, 121–137. [Google Scholar] [CrossRef]
- Zurainan, A.M.; Mat Nazir, E.N.; Md Sabri, S. The Impact of Facilities Management on Students’ Academic Achievement. J. Intelek 2021, 16, 27–39. [Google Scholar] [CrossRef]
- Perks, T.; Orr, D.; Al-Omari, E. Classroom Re-Design to Facilitate Student Learning: A Case Study of Changes to a University Classroom. J. Scholarsh. Teach. Learn. 2016, 16, 53–68. [Google Scholar] [CrossRef]
- Bai, Y.; Chang, T.-S. Effects of Class Size and Attendance Policy on University Classroom Interaction in Taiwan. Innov. Educ. Teach. Int. 2016, 53, 316–328. [Google Scholar] [CrossRef]
- Johnson, I.Y. Class Size and Student Performance at a Public Research University: A Cross-Classified Model. Res. High. Educ. 2010, 51, 701–723. [Google Scholar] [CrossRef]
- Abdullahi, I.; Wan Yusoff, W.Z. Influence of Facilities Performance on Student’s Satisfaction in Northern Nigerian Universities. Facilities 2019, 37, 168–181. [Google Scholar] [CrossRef]
- Shohel Parvez, M.; Tasnim, N.; Talapatra, S.; Ruhani, A.; Hoque, A.S.M.M. Assessment of Musculoskeletal Problems among Bangladeshi University Students in Relation to Classroom and Library Furniture. J. Inst. Eng. Ser. C 2022, 103, 279–292. [Google Scholar] [CrossRef]
- Rodríguez, C.M.; Coronado, M.C.; Medina, J.M. Thermal Comfort in Educational Buildings: The Classroom-Comfort-Data Method Applied to Schools in Bogotá, Colombia. Build. Environ. 2021, 194, 107682. [Google Scholar] [CrossRef]
- Villarreal Arroyo, Y.P.; Peñabaena-Niebles, R.; Berdugo Correa, C. Influence of Environmental Conditions on Students’ Learning Processes: A Systematic Review. Build. Environ. 2023, 231, 110051. [Google Scholar] [CrossRef]
- Brink, H.W.; Lechner, S.C.M.; Loomans, M.G.L.C.; Mobach, M.P.; Kort, H.S.M. Understanding How Indoor Environmental Classroom Conditions Influence Academic Performance in Higher Education. Facilities 2024, 42, 185–200. [Google Scholar] [CrossRef]
- Hoque, S.; Weil, B. The Relationship between Comfort Perceptions and Academic Performance in University Classroom Buildings. J. Green Build. 2016, 11, 108–117. [Google Scholar] [CrossRef]
- Kim, H.; Hong, T.; Kim, J.; Yeom, S. A Psychophysiological Effect of Indoor Thermal Condition on College Students’ Learning Performance through EEG Measurement. Build. Environ. 2020, 184, 107223. [Google Scholar] [CrossRef]
- Romero, P.; Miranda, M.T.; Montero, I.; Sepúlveda, F.J.; Valero-Amaro, V. Critical Review of the Literature on Thermal Comfort in Educational Buildings: Study of the Influence of the COVID-19 Pandemic. Indoor Air 2023, 2023, 1–36. [Google Scholar] [CrossRef]
- Ding, E.; Zhang, D.; Hamida, A.; García-Sánchez, C.; Jonker, L.; de Boer, A.R.; Bruijning, P.C.J.L.; Linde, K.J.; Wouters, I.M.; Bluyssen, P.M. Ventilation and Thermal Conditions in Secondary Schools in the Netherlands: Effects of COVID-19 Pandemic Control and Prevention Measures. Build. Environ. 2023, 229, 109922. [Google Scholar] [CrossRef]
- Aguilar, A.J.; de la Hoz-Torres, M.L.; Martínez-Aires, M.D.; Ruiz, D.P. Thermal Perception in Naturally Ventilated University Buildings in Spain during the Cold Season. Buildings 2022, 12, 890. [Google Scholar] [CrossRef]
- Rodríguez-Vidal, I.; Martín-Garín, A.; González-Quintial, F.; Rico-Martínez, J.M.; Hernández-Minguillón, R.J.; Otaegi, J. Response to the COVID-19 Pandemic in Classrooms at the University of the Basque Country through a User-Informed Natural Ventilation Demonstrator. Int. J. Environ. Res. Public Health 2022, 19, 14560. [Google Scholar] [CrossRef]
- Alegría-Sala, A.; Clèries Tardío, E.; Casals, L.C.; Macarulla, M.; Salom, J. CO2 Concentrations and Thermal Comfort Analysis at Onsite and Online Educational Environments. Int. J. Environ. Res. Public Health 2022, 19, 16039. [Google Scholar] [CrossRef]
- Rus, T.; Moldovan, R.; Albu, H.; Beu, D. Impact of Pandemic Safety Measures on Students’ Thermal Comfort—Case Study: Romania. Buildings 2023, 13, 794. [Google Scholar] [CrossRef]
- Miranda, M.T.; Romero, P.; Valero-Amaro, V.; Arranz, J.I.; Montero, I. Ventilation Conditions and Their Influence on Thermal Comfort in Examination Classrooms in Times of COVID-19. A Case Study in a Spanish Area with Mediterranean Climate. Int. J. Hyg. Environ. Health 2022, 240, 113910. [Google Scholar] [CrossRef] [PubMed]
- de la Hoz-Torres, M.L.; Aguilar, A.J.; Costa, N.; Arezes, P.; Ruiz, D.P.; Martínez-Aires, M.D. Reopening Higher Education Buildings in Post-epidemic COVID-19 Scenario: Monitoring and Assessment of Indoor Environmental Quality after Implementing Ventilation Protocols in Spain and Portugal. Indoor Air 2022, 32. [Google Scholar] [CrossRef] [PubMed]
- Romero, P.; Valero-Amaro, V.; Isidoro, R.; Miranda, M.T. Analysis of Determining Factors in the Thermal Comfort of University Students. A Comparative Study between Spain and Portugal. Energy Build. 2024, 308, 114022. [Google Scholar] [CrossRef]
- Yang, Z.; Becerik-Gerber, B.; Mino, L. A Study on Student Perceptions of Higher Education Classrooms: Impact of Classroom Attributes on Student Satisfaction and Performance. Build. Environ. 2013, 70, 171–188. [Google Scholar] [CrossRef]
- Rodriguez, C.M.; Coronado, M.C.; Medina, J.M. Classroom-Comfort-Data: A Method to Collect Comprehensive Information on Thermal Comfort in School Classrooms. MethodsX 2019, 6, 2698–2719. [Google Scholar] [CrossRef]
- Beck, H.E.; Zimmermann, N.E.; McVicar, T.R.; Vergopolan, N.; Berg, A.; Wood, E.F. Present and Future Köppen-Geiger Climate Classification Maps at 1-Km Resolution. Sci. Data 2018 51 2018, 5, 1–12. [Google Scholar] [CrossRef]
- JBI <i>JBI Manual for Evidence, Synthesis</i>; Aromataris, E. JBI JBI Manual for Evidence Synthesis; Aromataris, E., Munn, Z., Eds.; JBI, 2020; ISBN 9780648848806.
- Cross, K.J.; Jensen, K.J. Work in Progress: Understanding Student Perceptions of Stress as Part of Engineering Culture. Am. Soc. Eng. Educ. Conf. Proc. 2018. [Google Scholar]
- Gratchev, I.; Howell, S.; Stegen, S. Academics’ Perception of Final Examinations in Engineering Education. Australas. J. Eng. Educ. 2024, 29, 20–29. [Google Scholar] [CrossRef]
- Fojcik, M.; Fojcik, M.; Stafsnes, J.A.; Pollen, B. Identification of School Depended Factors, Which Can Affect Students’ Performance on Assessments.; 21 June 2019; pp. 146–150.
- Arnold, I. Resitting or Compensating a Failed Examination: Does It Affect Subsequent Results? Assess. Eval. High. Educ. 2017, 42, 1103–1117. [Google Scholar] [CrossRef]
- Zivin, J.S.G.; Song, Y.; Tang, Q.; Zhang, P. Temperature and High-Stakes Cognitive Performance: Evidence from the National College Entrance Examination in China; Cambridge, MA, 2018. [Google Scholar]
- Brink, H.W.; Krijnen, W.P.; Loomans, M.G.L.C.; Mobach, M.P.; Kort, H.S.M. Positive Effects of Indoor Environmental Conditions on Students and Their Performance in Higher Education Classrooms: A between-Groups Experiment. Sci. Total Environ. 2023, 869, 161813. [Google Scholar] [CrossRef]
- Li, X.; Patel, P.C. Weather and High-Stakes Exam Performance: Evidence from Student-Level Administrative Data in Brazil. Econ. Lett. 2021, 199, 109698. [Google Scholar] [CrossRef]
- Lee, M.C.; Mui, K.W.; Wong, L.T.; Chan, W.Y.; Lee, E.W.M.; Cheung, C.T. Student Learning Performance and Indoor Environmental Quality (IEQ) in Air-Conditioned University Teaching Rooms. Build. Environ. 2012, 49, 238–244. [Google Scholar] [CrossRef]
- Ma, X.; Liu, H.; Zhang, Z.; Li, Y. How Does Indoor Physical Environment Differentially Affect Learning Performance in Various Classroom Types? Build. Environ. 2023, 234, 110189. [Google Scholar] [CrossRef]
- Vu, T.M. Effects of Heat on Mathematics Test Performance in Vietnam. Asian Econ. J. 2022, 36, 72–94. [Google Scholar] [CrossRef]
- Ellis, J.L. A Simple Model to Determine the Efficient Duration of Exams. Educ. Psychol. Meas. 2021, 81, 549–568. [Google Scholar] [CrossRef]
- Fengler, M.; Ostafichuk, P.M. Successes with Two-Stage Exams in Mechanical Engineering. Proc. Can. Eng. Educ. Assoc. 2015. [Google Scholar] [CrossRef]
- Bhute, V.J.; Campbell, J.; Kogelbauer, A.; Shah, U. V; Brechtelsbauer, C. Moving to Timed Remote Assessments: The Impact of COVID-19 on Year End Exams in Chemical Engineering at Imperial College London. J. Chem. Educ. 2020, 97, 2760–2767. [Google Scholar] [CrossRef]
- Chen, H.-F.; Tsai, C.-Y. The Impact of School Classroom Chair Depth and Height on Learning Tasks. Educ. Sci. 2024, 14, 661. [Google Scholar] [CrossRef]
- Muhammad, S.; Sapri, M.; Sipan, I. Academic Buildings and Their Influence on Students’ Wellbeing in Higher Education Institutions. Soc. Indic. Res. 2014, 115, 1159–1178. [Google Scholar] [CrossRef]
- Merino, F.; Soto, G.M. Does the Exam Calendar Affect the Probability of Success? In Proceedings of the INTED2015 Proceedings; 2015; pp. 3617–3625. [Google Scholar]
- Sanz, I.; Tena, J. de D. The Impact of Instruction Time and the School Calendar on Academic Performance: A Natural Experiment.; 2021.
- Manzano Agugliaro, F.; Salmerón-Manzano, E.; Martínez, F.; Nievas-Soriano, B.; Zapata-Sierra, A.J. Impact Analysis on Academic Performance of the Change in the Extraordinary Resit Exam Period of September Análisis Del Impacto En Los Resultados Académicos Del Cambio de La Convocatoria Extraordinaria de Exámenes de Septiembre. ESPIRAL. Cuad. DEL Profr. 2023, 16, 14–24. [Google Scholar] [CrossRef]
- Schmidt, H.G.; Baars, G.J.A.; Hermus, P.; van der Molen, H.T.; Arnold, I.J.M.; Smeets, G. Changes in Examination Practices Reduce Procrastination in University Students. Eur. J. High. Educ. 2022, 12, 56–71. [Google Scholar] [CrossRef]
- Nonis, S.A.; Hudson, G.I. Performance of College Students: Impact of Study Time and Study Habits. J. Educ. Bus. 2010, 85, 229–238. [Google Scholar] [CrossRef]
- Díaz-Mora, C.; García, J.A.; Molina, A. What Is the Key to Academic Success? An Analysis of the Relationship between Time Use and Student Performance / ¿Dónde Está La Clave Del Éxito Académico? Un Análisis de La Relación Entre El Uso Del Tiempo y El Rendimiento Académico. 2016, 28, 157–195. [Google Scholar] [CrossRef]
- Grave, B.S. The Effect of Student Time Allocation on Academic Achievement. Educ. Econ. 2011, 19, 291–310. [Google Scholar] [CrossRef]
- Rezigalla, A.; Eleragi, A.; Elkhalifa, M.; Mohammed, A. Comparison between Students’ Perception and Examination Validity, Reliability and Items Difficulty: A Cross-Sectional Study. Sudan J. Med. Sci. 2020. [Google Scholar] [CrossRef]
- Photopoulos, P.; Tsonos, C.; Stavrakas, I.; Triantis, D. Preference for Multiple Choice and Constructed Response Exams for Engineering Students with and without Learning Difficulties. In Proceedings of the Proceedings of the 13th International Conference on Computer Supported Education; SCITEPRESS - Science and Technology Publications, 2021; pp. 220–231.
- Clemmer, R.; Gordon, K.; Vale, J. Will That Be on the Exam? - Student Perceptions of Memorization and Success in Engineering. Proc. Can. Eng. Educ. Assoc. 2018. [Google Scholar] [CrossRef]
- Doghonadze, N.; Demir, H. Critical Analysis of Open-Book Exam for University Students. In Proceedings of the ICERI2013 Proceedings; IATED; 2013; pp. 4851–4857. [Google Scholar]
- Chen, J.-C.; Lai, Y.-L. A Brief Review of Researches on the Use of Graphing Calculator in Mathematics Classrooms. Int. J. Learn. Teach. Educ. Res. 2015, 14, 163–172. [Google Scholar]
- Bouck, E.C.; Bouck, M.K.; Hunley, M. The Calculator Effect. J. Spec. Educ. Technol. 2015, 30, 77–88. [Google Scholar] [CrossRef]
- Lipson, S.K.; Eisenberg, D. Mental Health and Academic Attitudes and Expectations in University Populations: Results from the Healthy Minds Study. J. Ment. Heal. 2018, 27, 205–213. [Google Scholar] [CrossRef]
- Aceijas, C.; Waldhäusl, S.; Lambert, N.; Cassar, S.; Bello-Corassa, R. Determinants of Health-Related Lifestyles among University Students. Perspect. Public Health 2017, 137, 227–236. [Google Scholar] [CrossRef]
- Rogowska, A.M.; Kuśnierz, C.; Bokszczanin, A. Examining Anxiety, Life Satisfaction, General Health, Stress and Coping Styles During COVID-19 Pandemic in Polish Sample of University Students. Psychol. Res. Behav. Manag. 2020, 13, 797–811. [Google Scholar] [CrossRef] [PubMed]
- Al-Jokhadar, A.; Alnusairat, S.; Abuhashem, Y.; Soudi, Y. The Impact of Indoor Environmental Quality (IEQ) in Design Studios on the Comfort and Academic Performance of Architecture Students. Buildings 2023, 13, 2883. [Google Scholar] [CrossRef]
- Rachmana, A.; Jamaluddin, A.S. The Effects of Mental Health Issues and Academic Performance. J. Soc. Sci. Humanit. 2023, 6, 23–29. [Google Scholar] [CrossRef]
- Jansen, M.; Chapman, C.; Richardson, T.; Elliott, P.; Roberts, R. The Relationship between Mental and Physical Health: A Longitudinal Analysis with British Student. J. Public Ment. Health 2022, 21, 218–225. [Google Scholar] [CrossRef]
- ASHRAE ANSI/ASHRAE Standard 55-2017: Thermal Environmental Conditions for Human Occupancy. 2017.
- McCartney, K.J.; Fergus Nicol, J. Developing an Adaptive Control Algorithm for Europe. Energy Build. 2002, 34, 623–635. [Google Scholar] [CrossRef]
- Talukdar, M.S.J.; Talukdar, T.H.; Singh, M.K.; Baten, M.A.; Hossen, M.S. Status of Thermal Comfort in Naturally Ventilated University Classrooms of Bangladesh in Hot and Humid Summer Season. J. Build. Eng. 2020, 32, 101700. [Google Scholar] [CrossRef]
- ISO ISO 7730:2005. Ergonomics of the Thermal Environment — Analytical Determination and Interpretation of Thermal Comfort Using Calculation of the PMV and PPD Indices and Local Thermal Comfort Criteria. 2005.
- ISO ISO 7726:1998. Ergonomics of the Thermal Environment Instruments for Measuring Physical Quantities. 1998.
- Tenza-Abril, A.J.; López, I.; Andreu Vallejo, L.; Vives Bonete, I.; Vicente Pastor, A. de; López Moraga, A.; García Andreu, C.; Saval Pérez, J.M.; Rivera Page, J.A.; Ibáñez Gosálvez, J.F. Análisis Del Número de Matrículas Medias En El Grado de Ingeniería Civil Para La Propuesta de Mejoras En El Plan de Estudios; Alicante (España), 2020. [Google Scholar]
- Choi, Y.-J. Effects of the Distribution of Occupants in Partially Occupied Classrooms. Appl. Acoust. 2018, 140, 1–12. [Google Scholar] [CrossRef]
- Salas-Morera, L.; Ruiz-Bustos, R.; Cejas-Molina, M.A.; Olivares-Olmedilla, J.L.; García-Hernández, L.; Palomo-Romero, J.M. Understanding Why Women Don’t Choose Engineering Degrees. Int. J. Technol. Des. Educ. 2021, 31, 325–338. [Google Scholar] [CrossRef]
- Calvo-Iglesias, E.; Epifanio, I.; Estrade, S.; Mas de les Valls, E. Gender Perspective in STEM Disciplines in Spain Universities. In; 2022; pp. 165–179.
- Neematia, N.; Hooshangib, R.; Shuridehc, A. ScienceDirect International Conference on Current Trends in ELT An Investigation into the Learners ’ Attitudes towards Factors Affecting Their Exam Performance : A Case from Razi University.; 2014.
- Granados-Ortiz, F.-J.; Gómez-Merino, A.I.; Jiménez-Galea, J.J.; Santos-Ráez, I.M.; Fernandez-Lozano, J.J.; Gómez-de-Gabriel, J.M.; Ortega-Casanova, J. Design and Assessment of Survey in a 360-Degree Feedback Environment for Student Satisfaction Analysis Applied to Industrial Engineering Degrees in Spain. Educ. Sci. 2023, 13, 199. [Google Scholar] [CrossRef]
- Rigopoulos, G. Assessment and Feedback as Predictors for Student Satisfaction in UK Higher Education. Int. J. Mod. Educ. Comput. Sci. 2022, 14, 1–9. [Google Scholar] [CrossRef]
- Nichol, K.L.; Heilly, S.D.; Ehlinger, E. Colds and Influenza-Like Illnesses in University Students: Impact on Health, Academic and Work Performance, and Health Care Use. Clin. Infect. Dis. 2005, 40, 1263–1270. [Google Scholar] [CrossRef] [PubMed]
- Churchill, G.A. A Paradigm for Developing Better Measures of Marketing Constructs. J. Mark. Res. 1979, 16, 64. [Google Scholar] [CrossRef]
- Gerbing, D.W.; Anderson, J.C. An Updated Paradigm for Scale Development Incorporating Unidimensionality and Its Assessment. J. Mark. Res. 1988, 25, 186. [Google Scholar] [CrossRef]
- Hair, J.F.; Babin, B.J.; Black, W.C.; Anderson, R.E. Multivariate Data Analysis; Cengage, 2019; ISBN 9781473756540.
- Brink, H.W.; Loomans, M.G.L.C.; Mobach, M.P.; Kort, H.S.M. Classrooms’ Indoor Environmental Conditions Affecting the Academic Achievement of Students and Teachers in Higher Education: A Systematic Literature Review. Indoor Air 2021, 31, 405–425. [Google Scholar] [CrossRef]
- Lan, L.; Wargocki, P.; Lian, Z. Quantitative Measurement of Productivity Loss Due to Thermal Discomfort. Energy Build. 2011, 43, 1057–1062. [Google Scholar] [CrossRef]
- Aparicio-Ruiz, P.; Barbadilla-Martín, E.; Guadix, J.; Muñuzuri, J. A Field Study on Adaptive Thermal Comfort in Spanish Primary Classrooms during Summer Season. Build. Environ. 2021, 203, 108089. [Google Scholar] [CrossRef]
- Corgnati, S.P.; Ansaldi, R.; Filippi, M. Thermal Comfort in Italian Classrooms under Free Running Conditions during Mid Seasons: Assessment through Objective and Subjective Approaches. Build. Environ. 2009, 44, 785–792. [Google Scholar] [CrossRef]
Figure 1.
Methodological diagram.
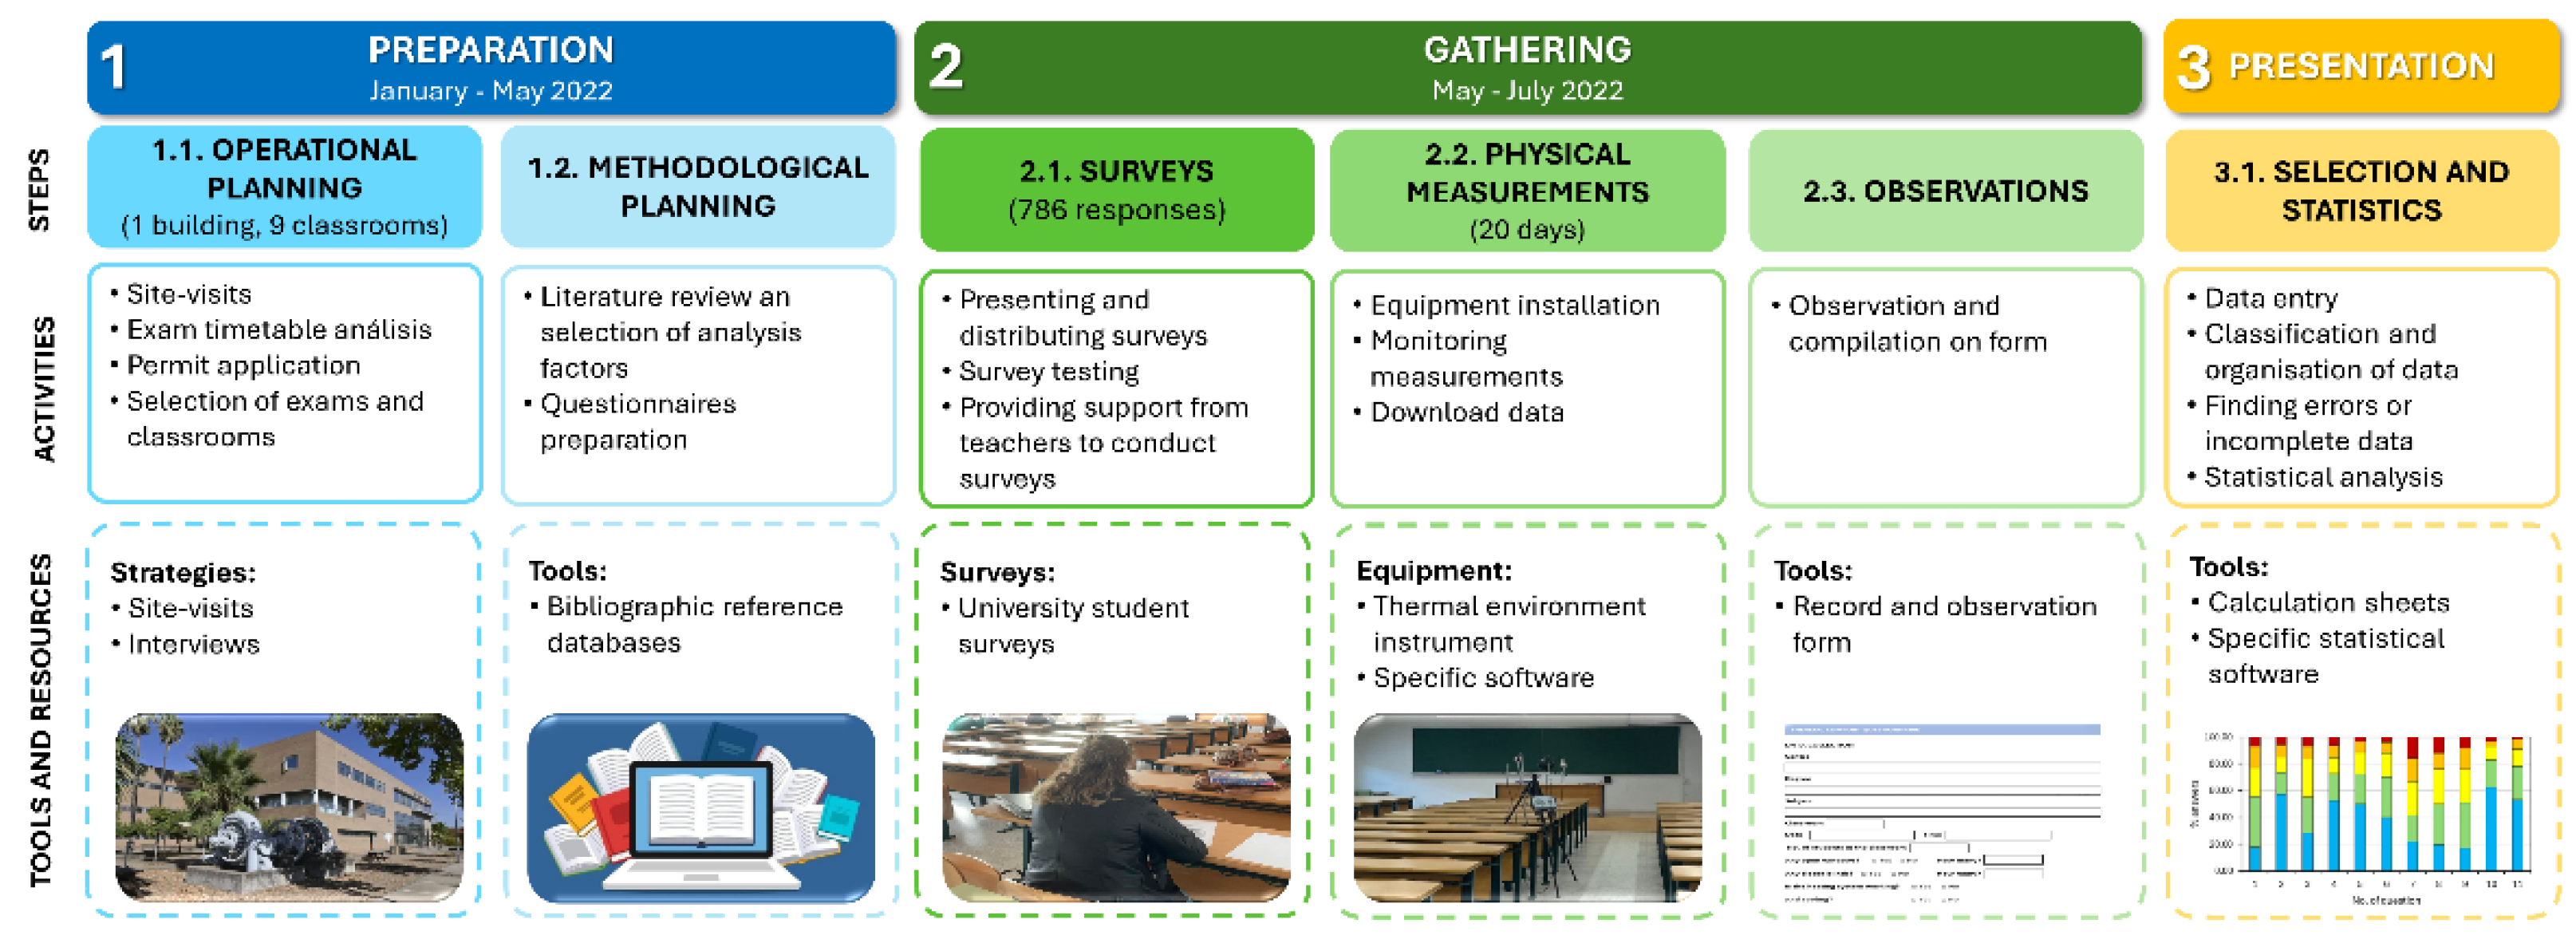
Figure 2.
Percentage distribution of students by: (a) Gender; (b) Age; (c) Degree; (d) Year; (e) Number of times the student has taken the exam.
Figure 2.
Percentage distribution of students by: (a) Gender; (b) Age; (c) Degree; (d) Year; (e) Number of times the student has taken the exam.
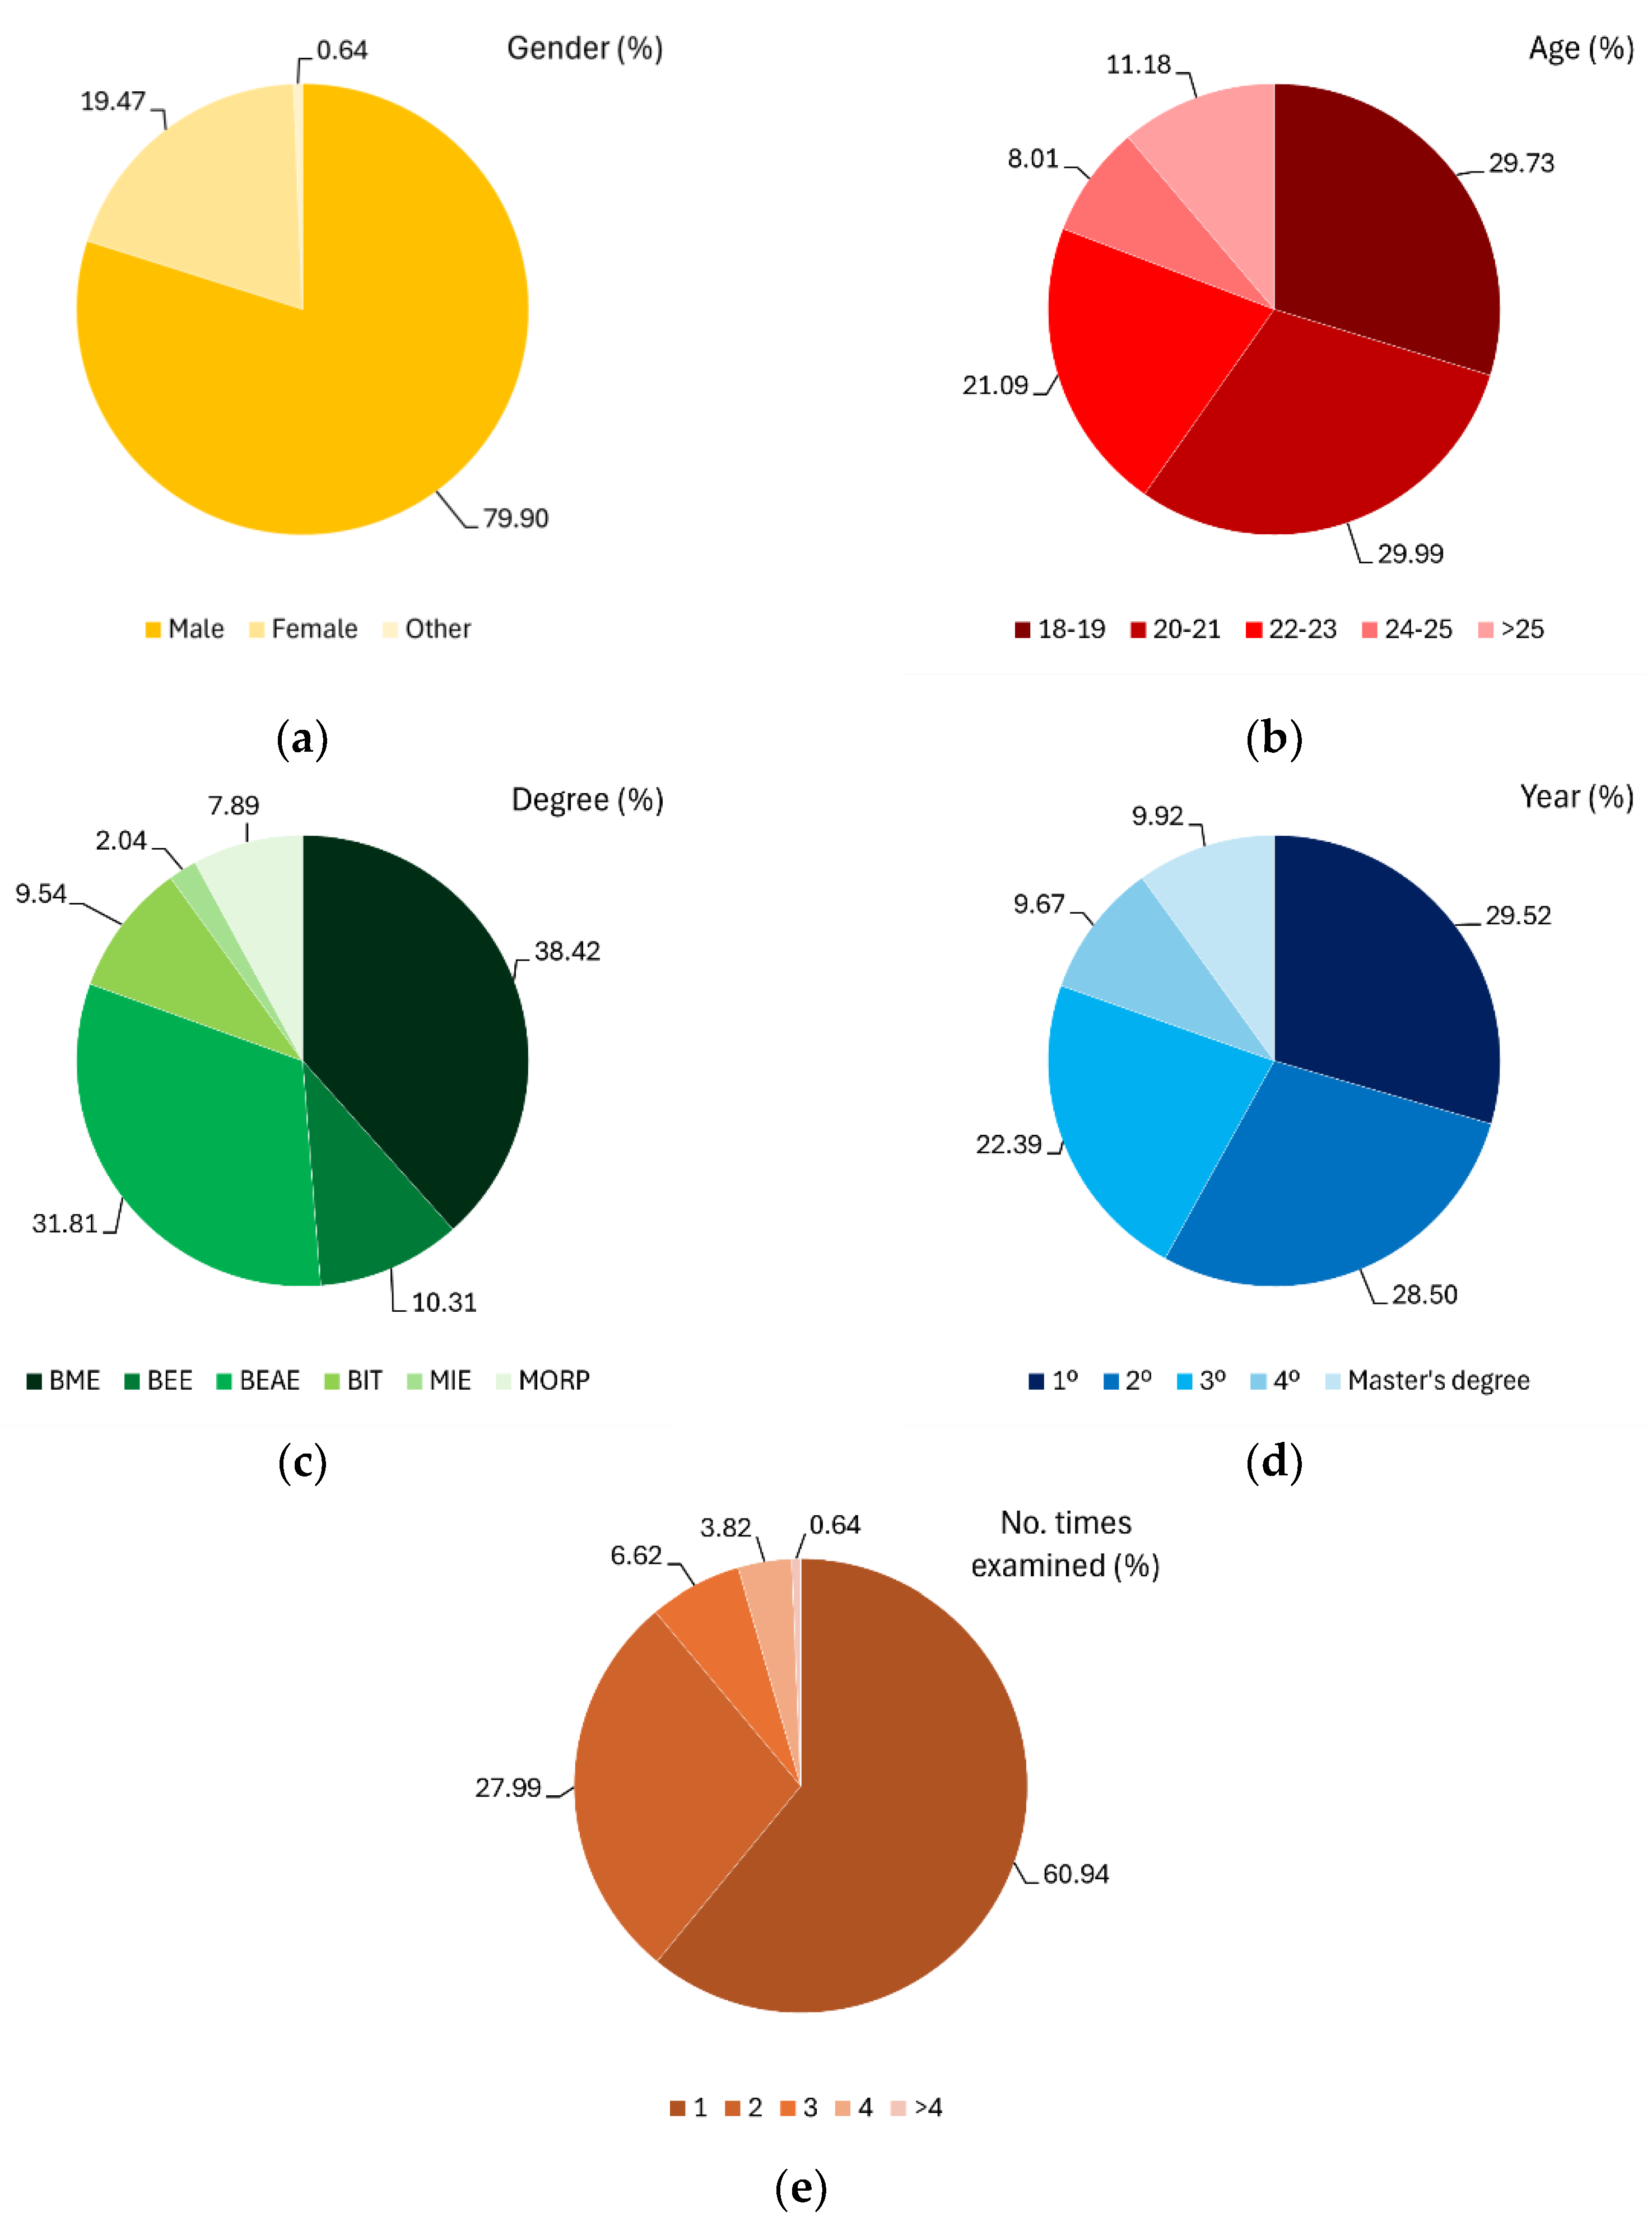
Figure 3.
Distribution of the degree of student satisfaction with the exams.
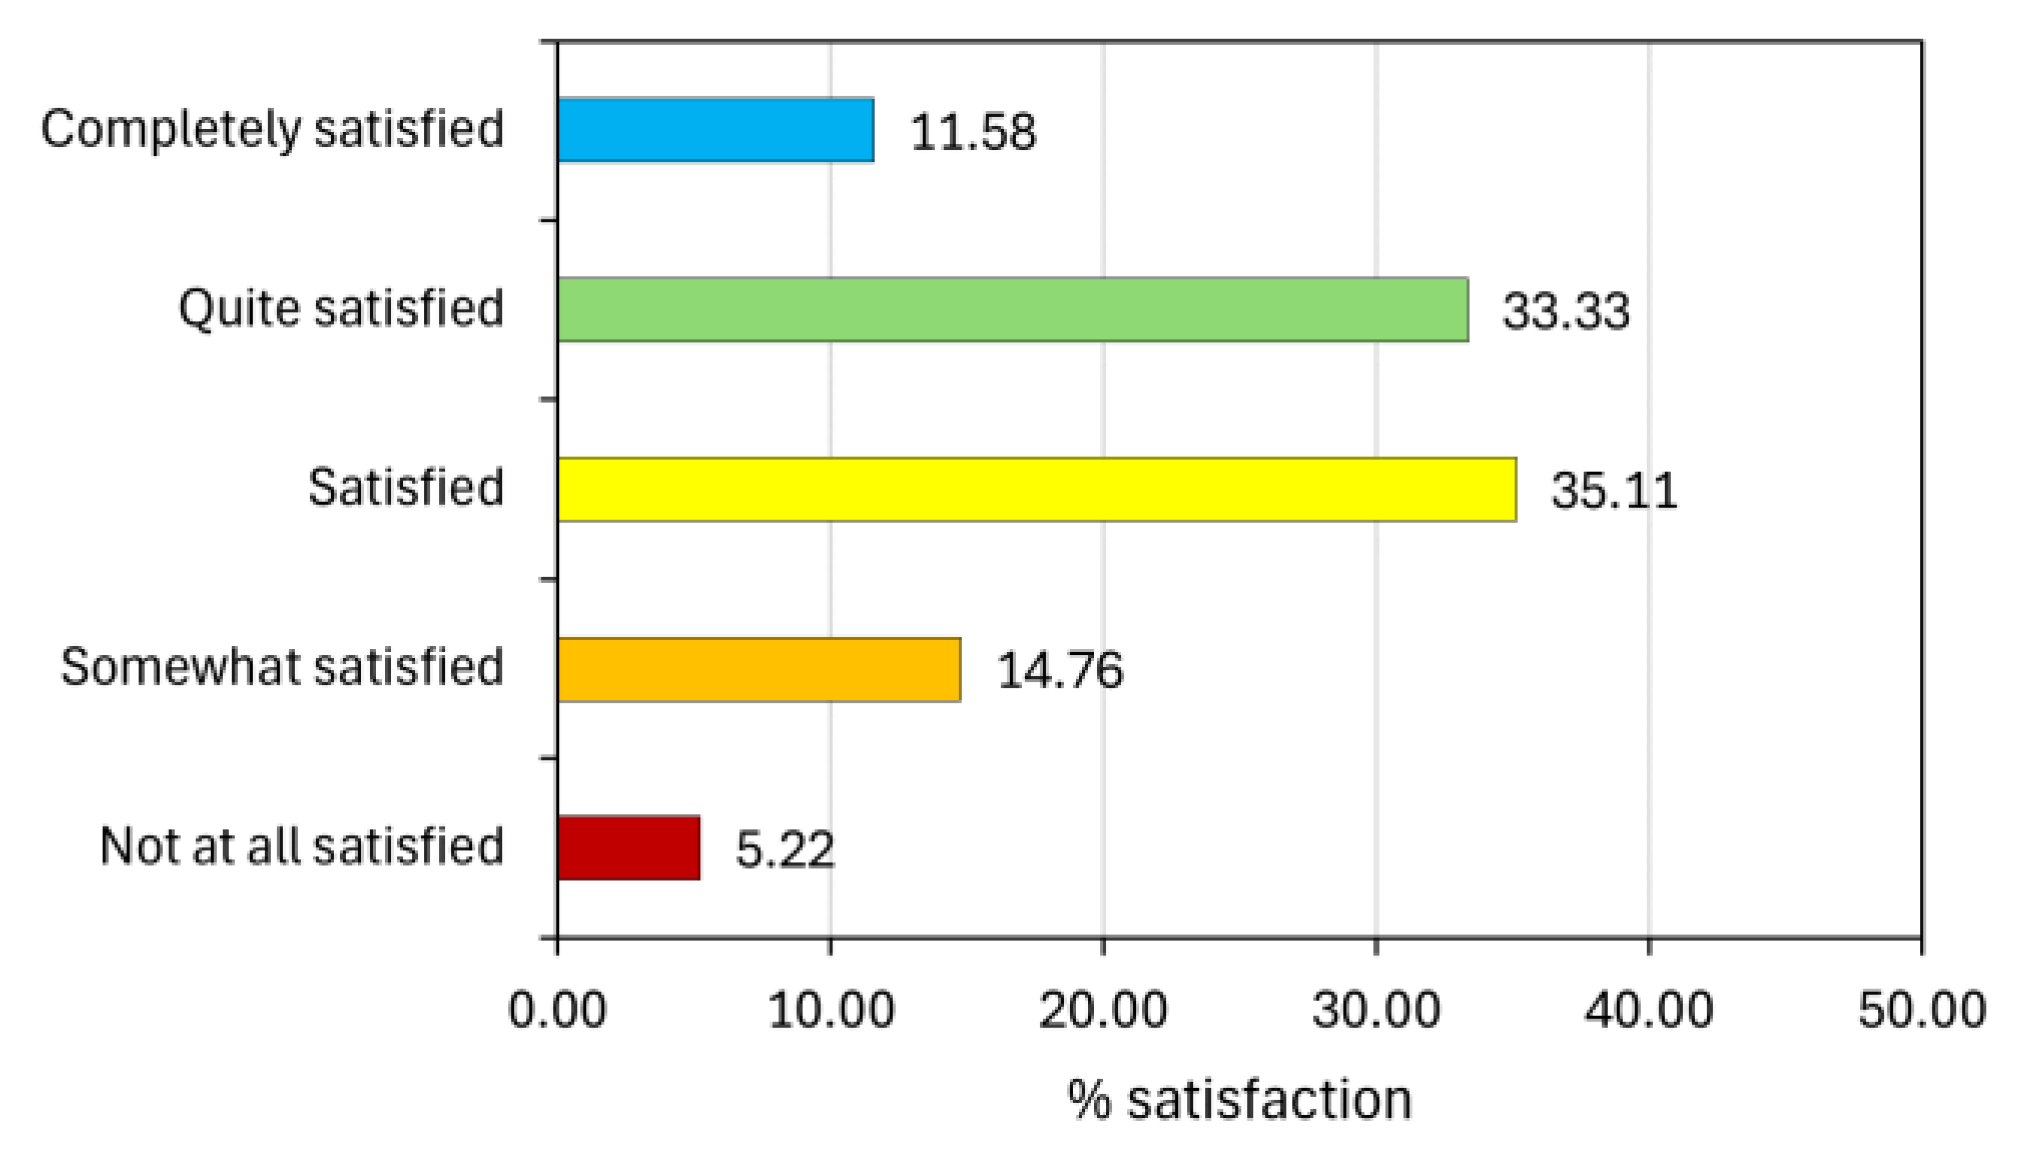
Figure 4.
Distribution of responses on which factors had a negative influence on academic performance during exams.
Figure 4.
Distribution of responses on which factors had a negative influence on academic performance during exams.
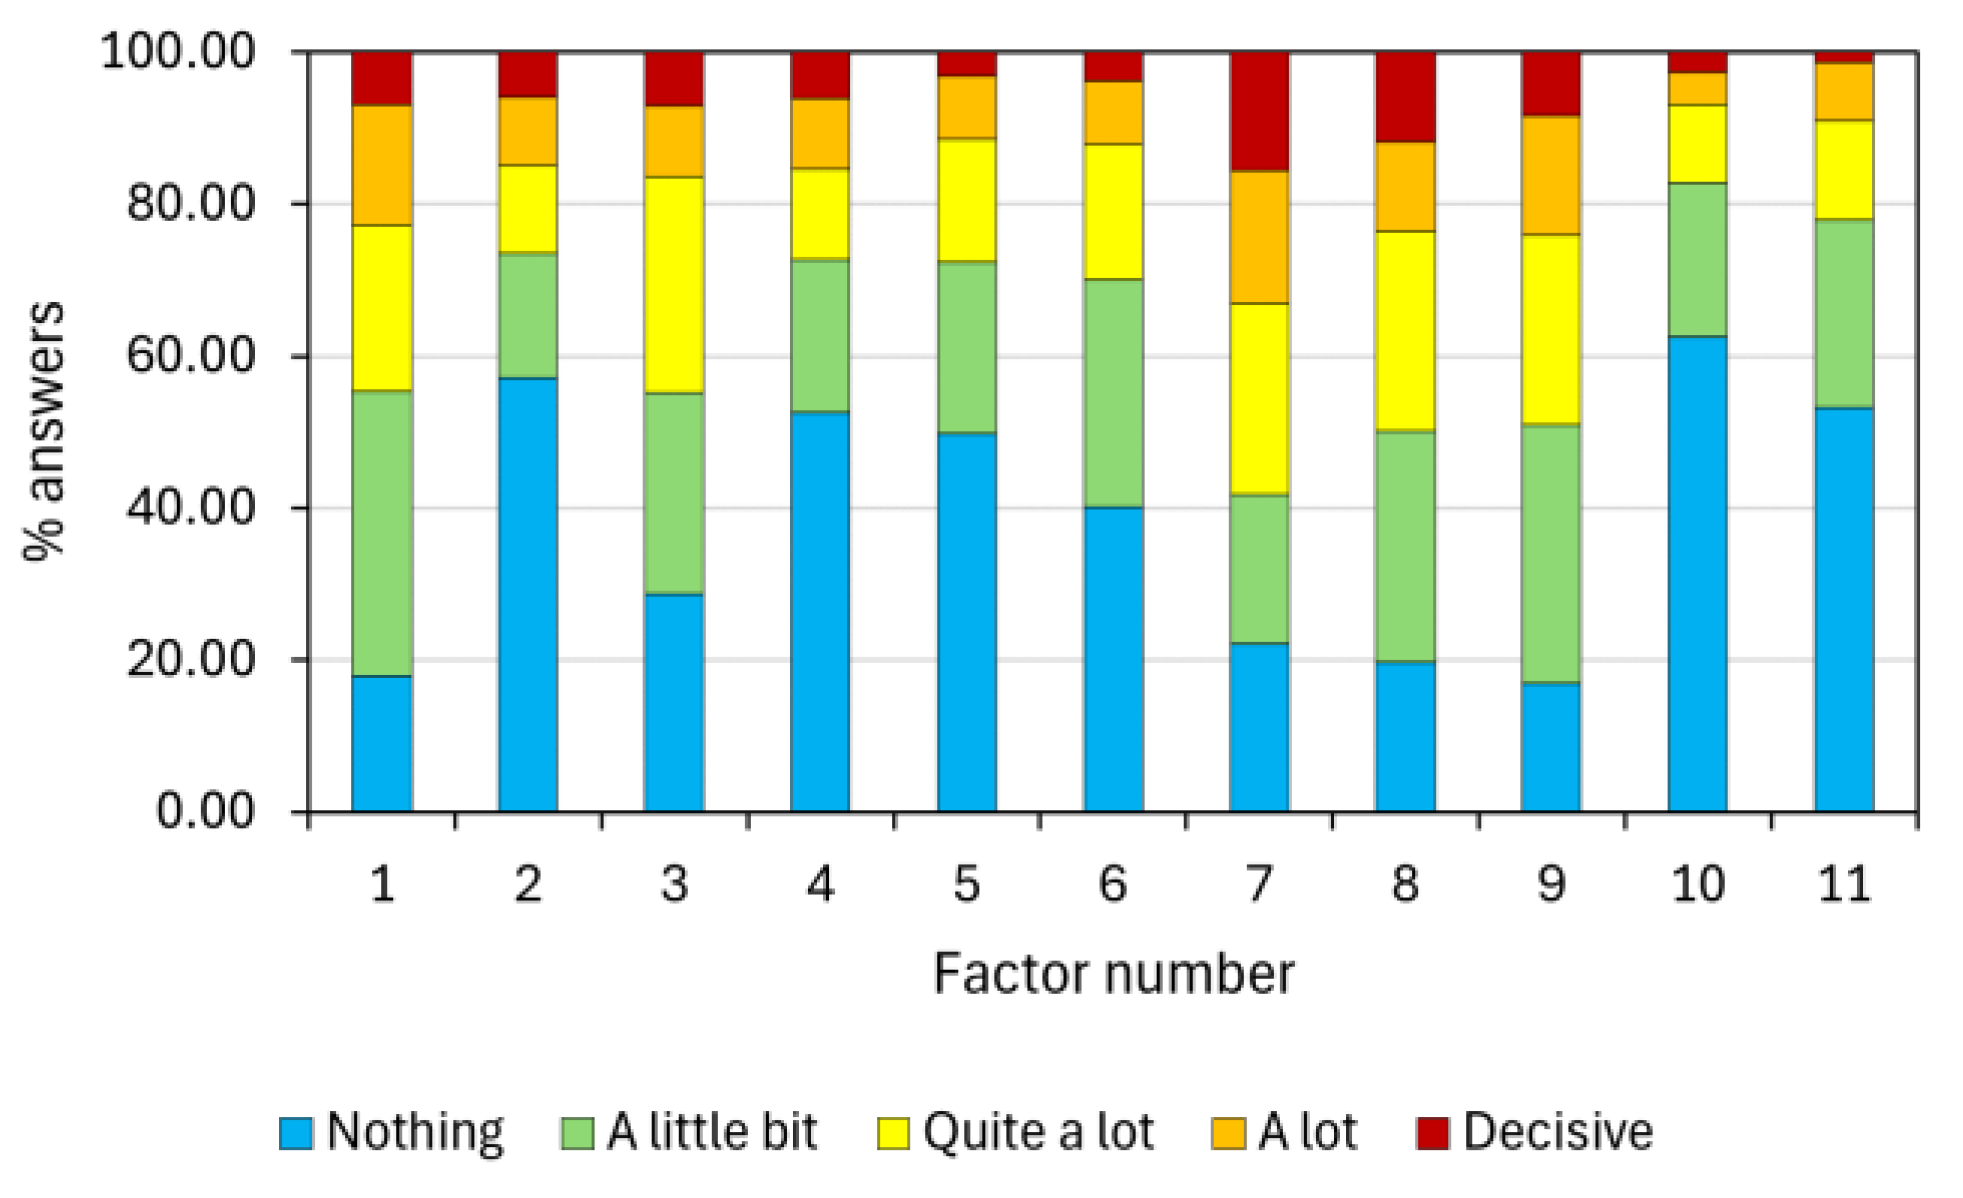
Figure 5.
Average student satisfaction with exams according to temperature by test.
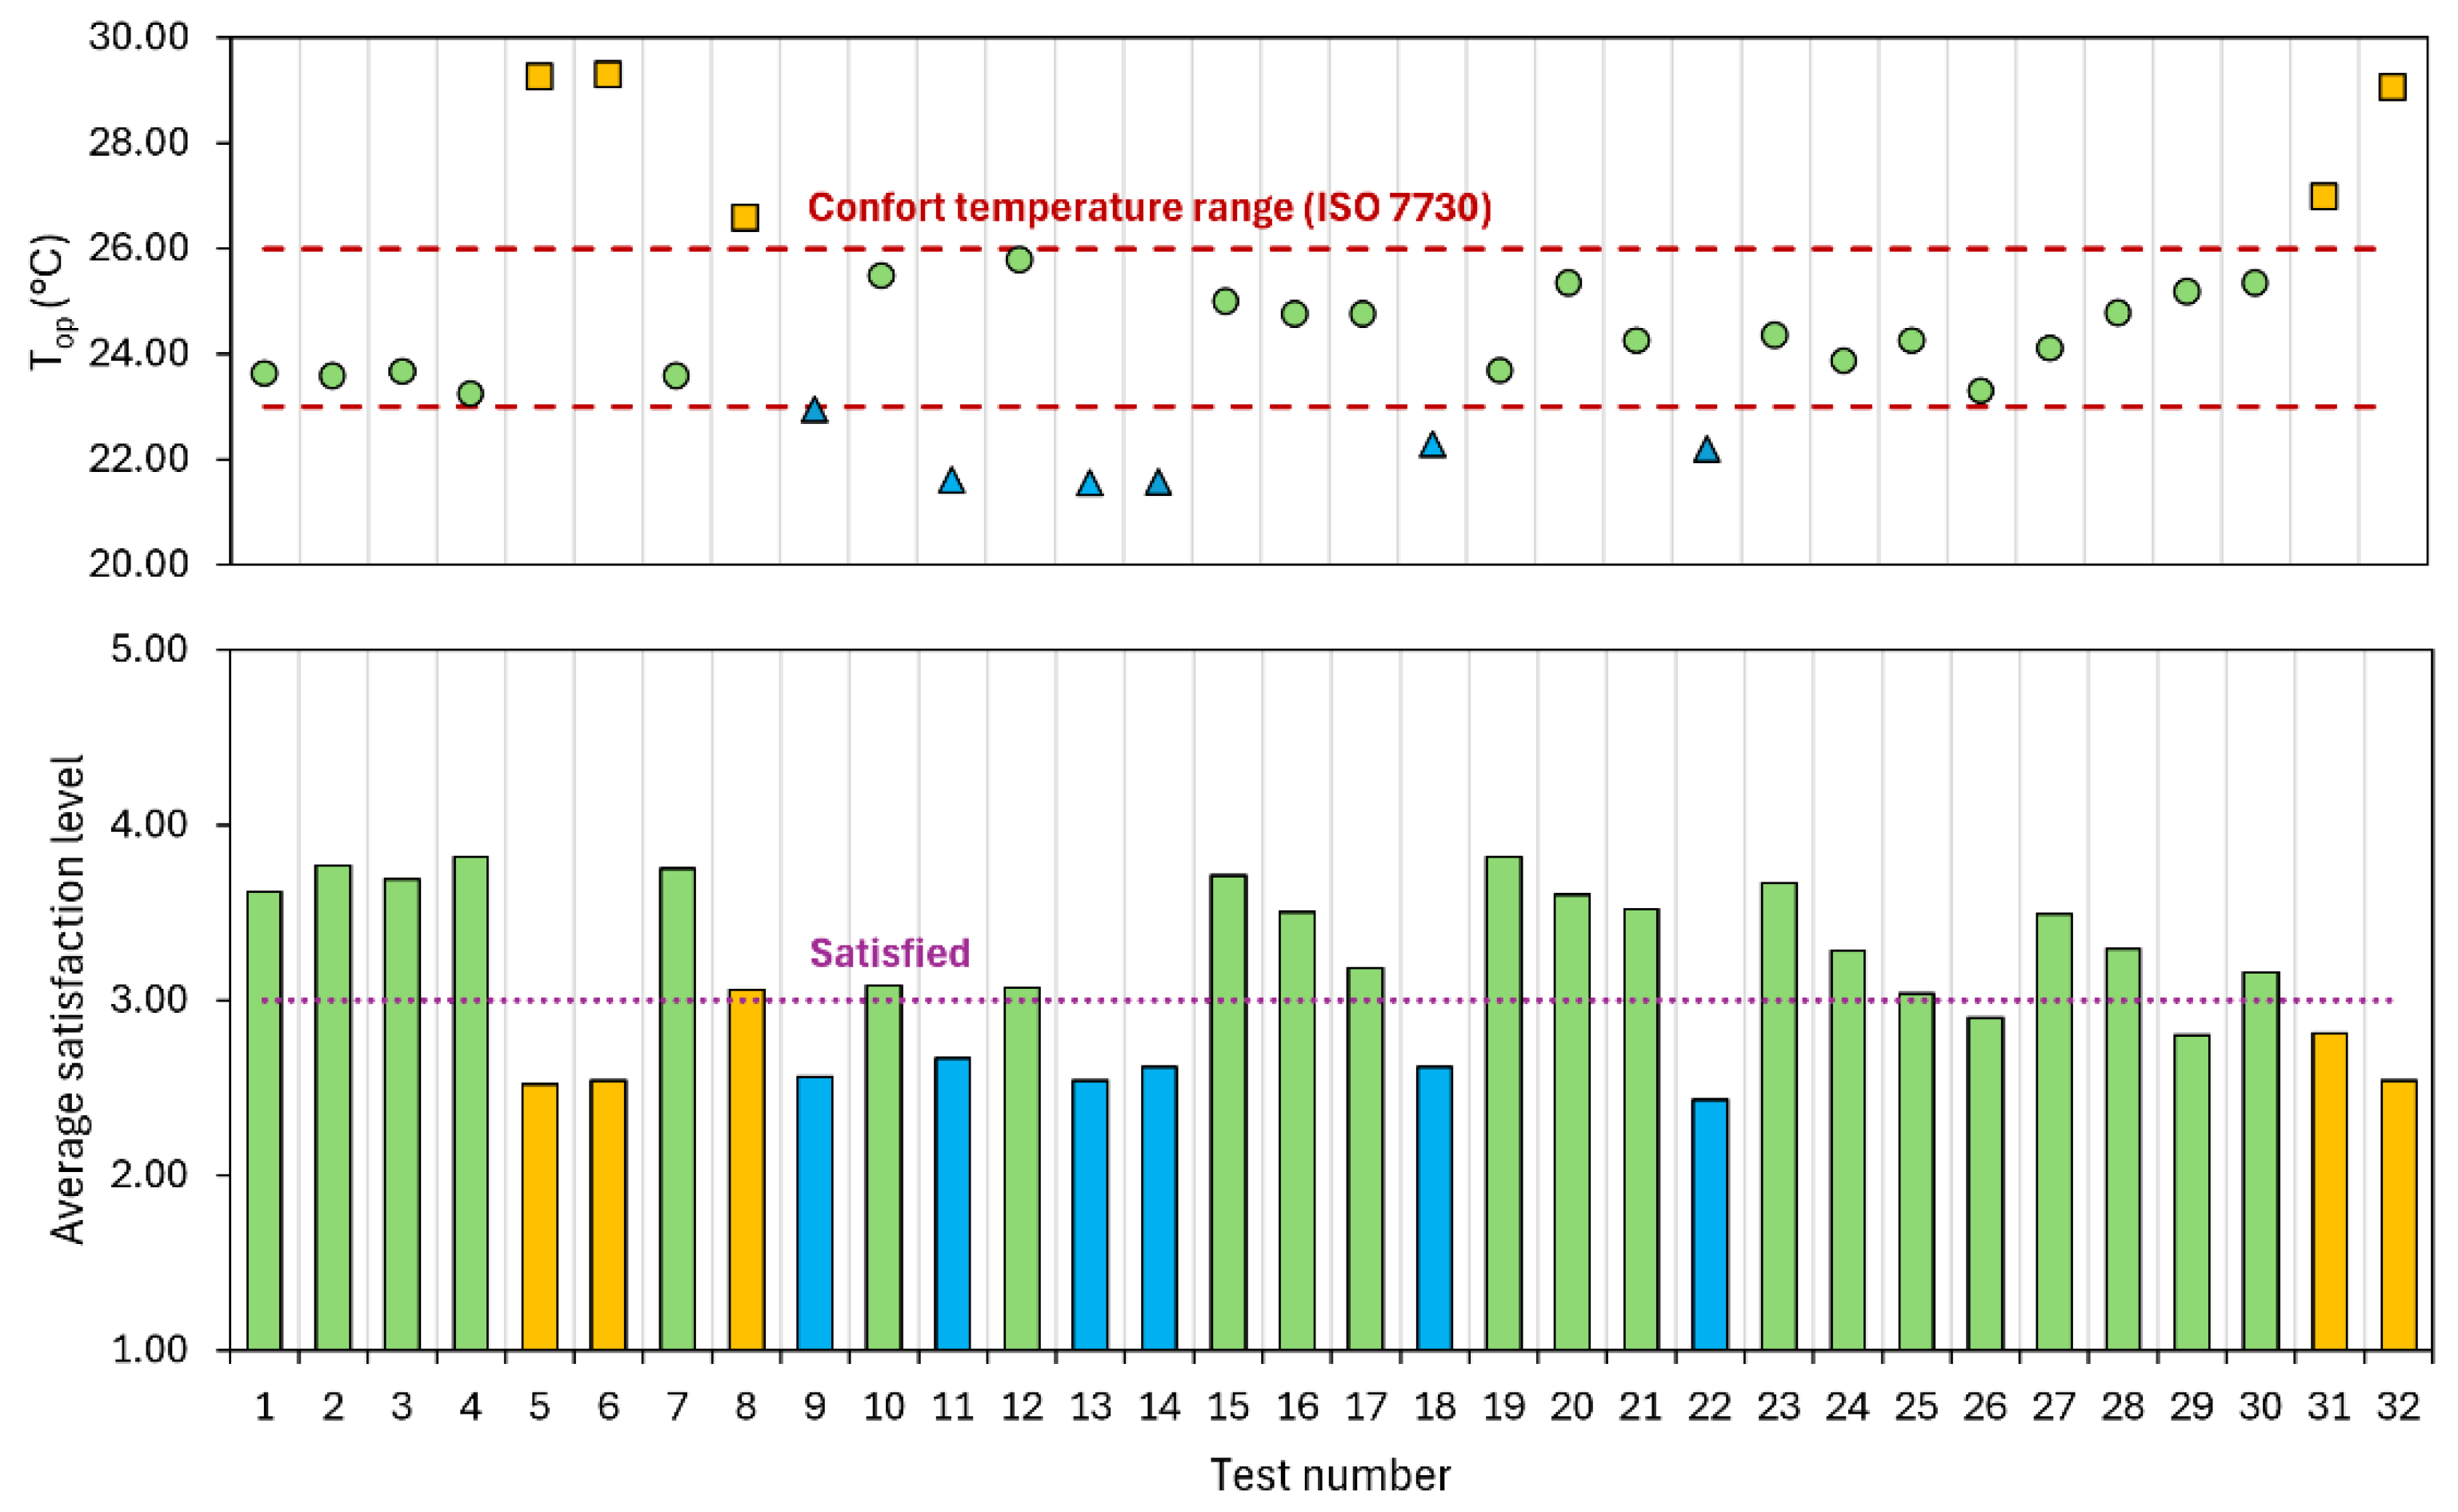
Figure 6.
Distribution of responses for: (a) Thermal Sensation Vote (TSV); (b) Thermal Comfort Vote (TCV).
Figure 6.
Distribution of responses for: (a) Thermal Sensation Vote (TSV); (b) Thermal Comfort Vote (TCV).
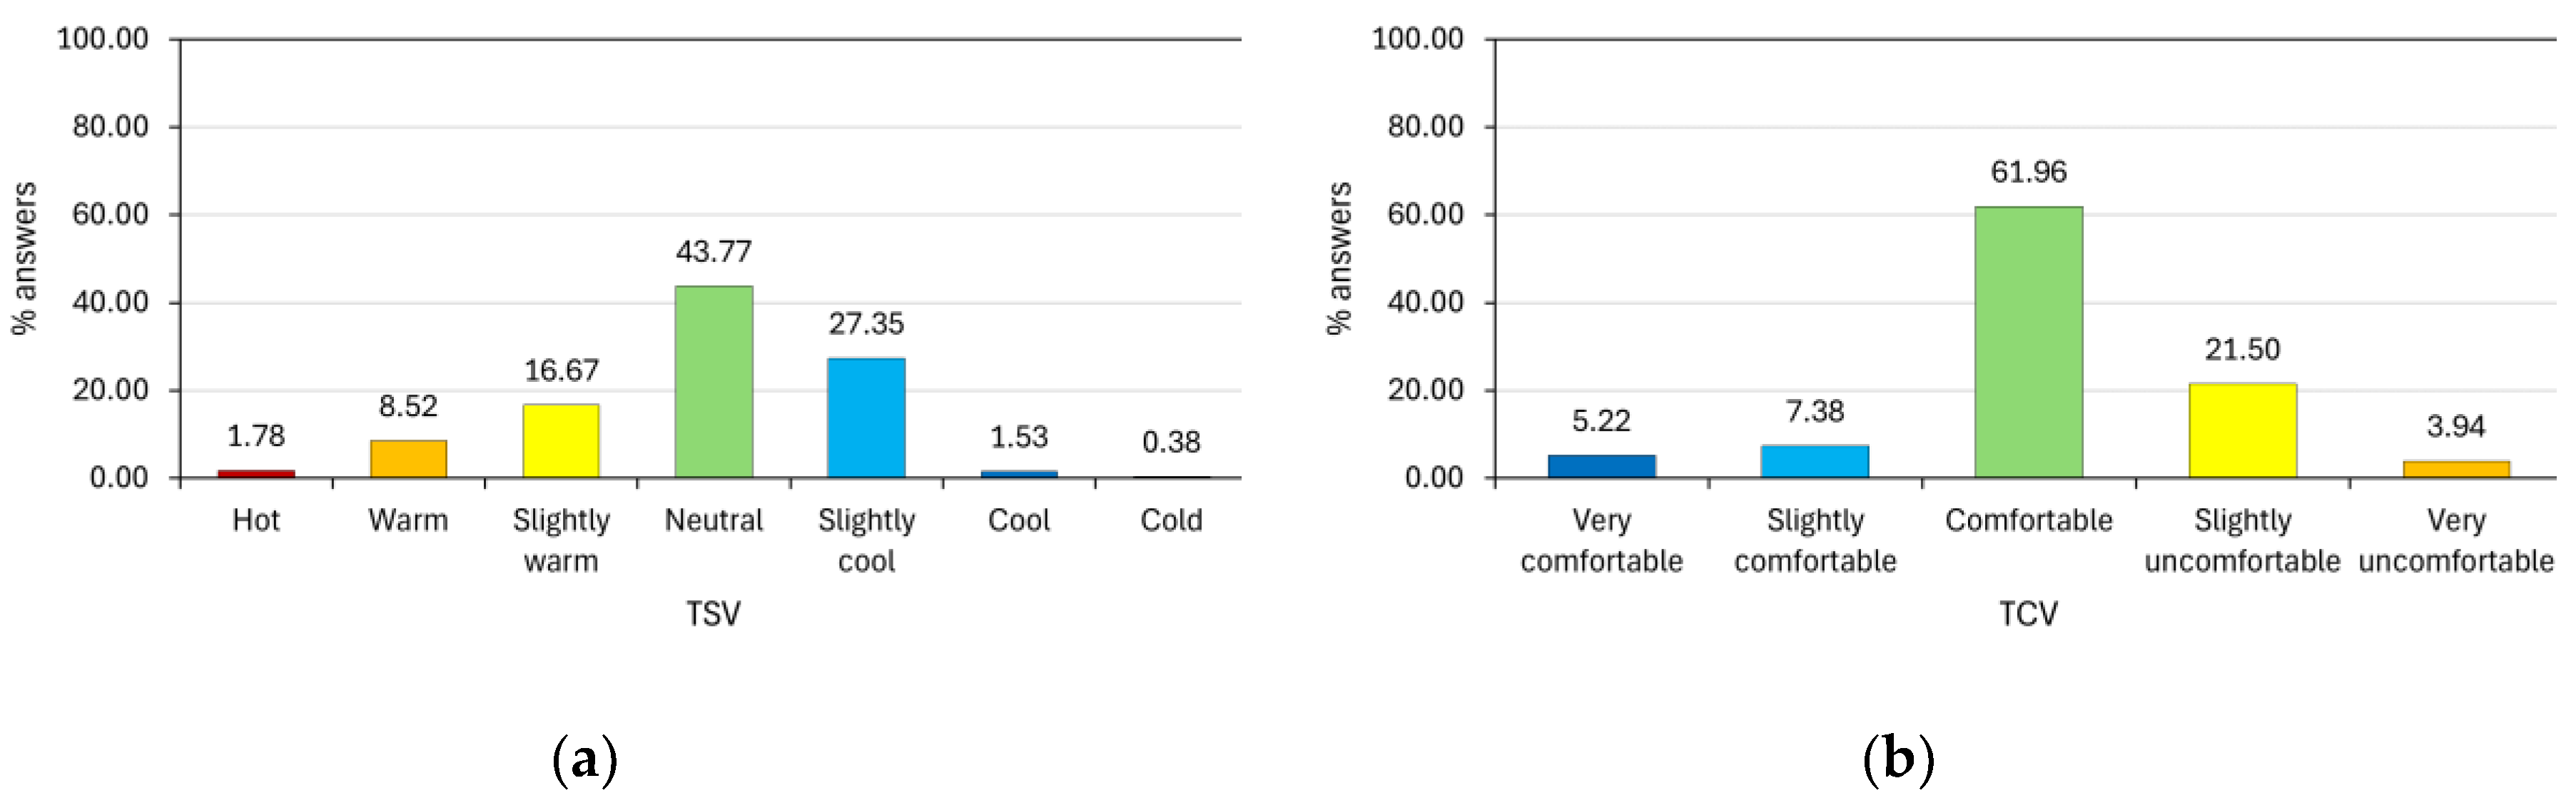
Figure 7.
Cross tabulation of satisfaction with the exams with: (a) Thermal Sensation Vote (TSV); (b) Thermal Comfort Vote (TCV).
Figure 7.
Cross tabulation of satisfaction with the exams with: (a) Thermal Sensation Vote (TSV); (b) Thermal Comfort Vote (TCV).
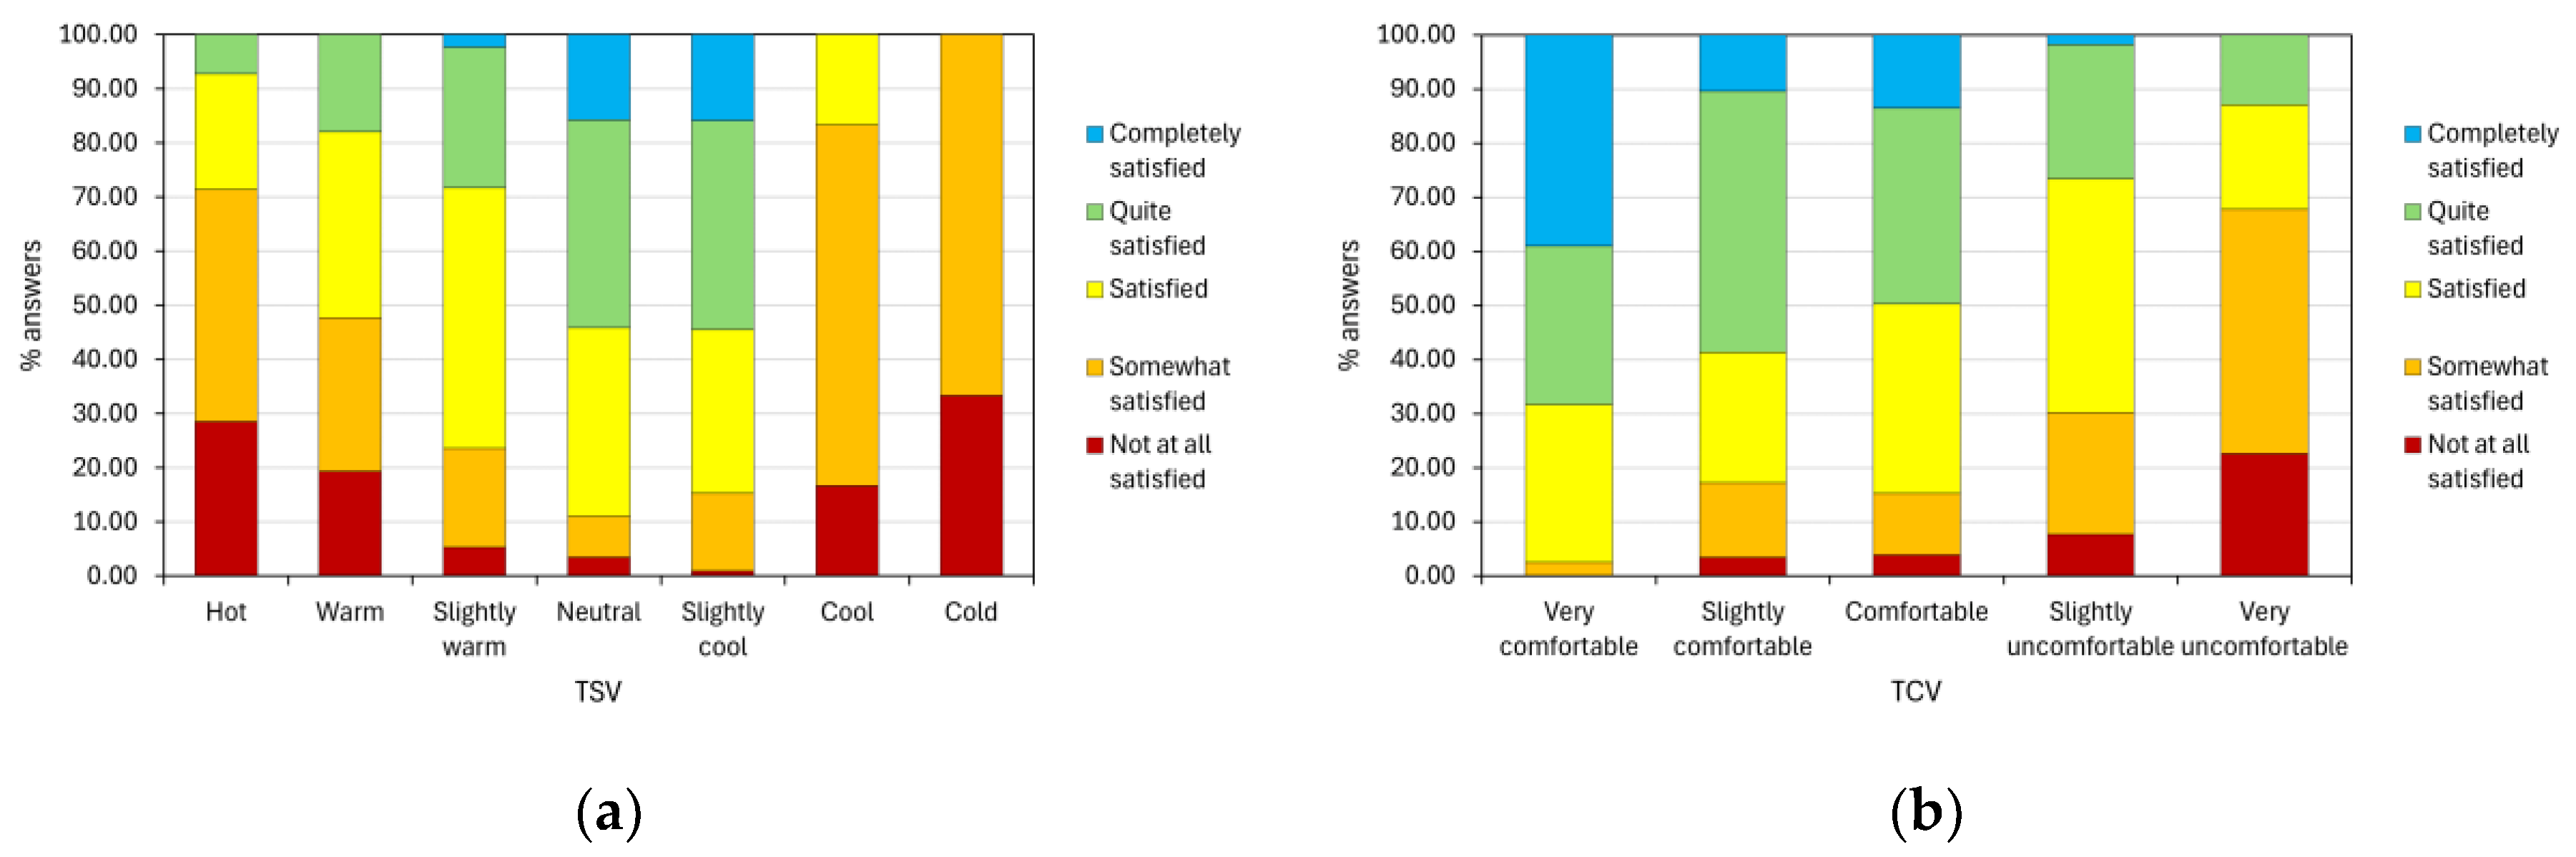
Figure 8.
Distribution of responses on which factors negatively influenced academic performance during exams according to grouping of TSV levels: (a) Heat discomfort; (b) Comfort; (c) Cold discomfort.
Figure 8.
Distribution of responses on which factors negatively influenced academic performance during exams according to grouping of TSV levels: (a) Heat discomfort; (b) Comfort; (c) Cold discomfort.
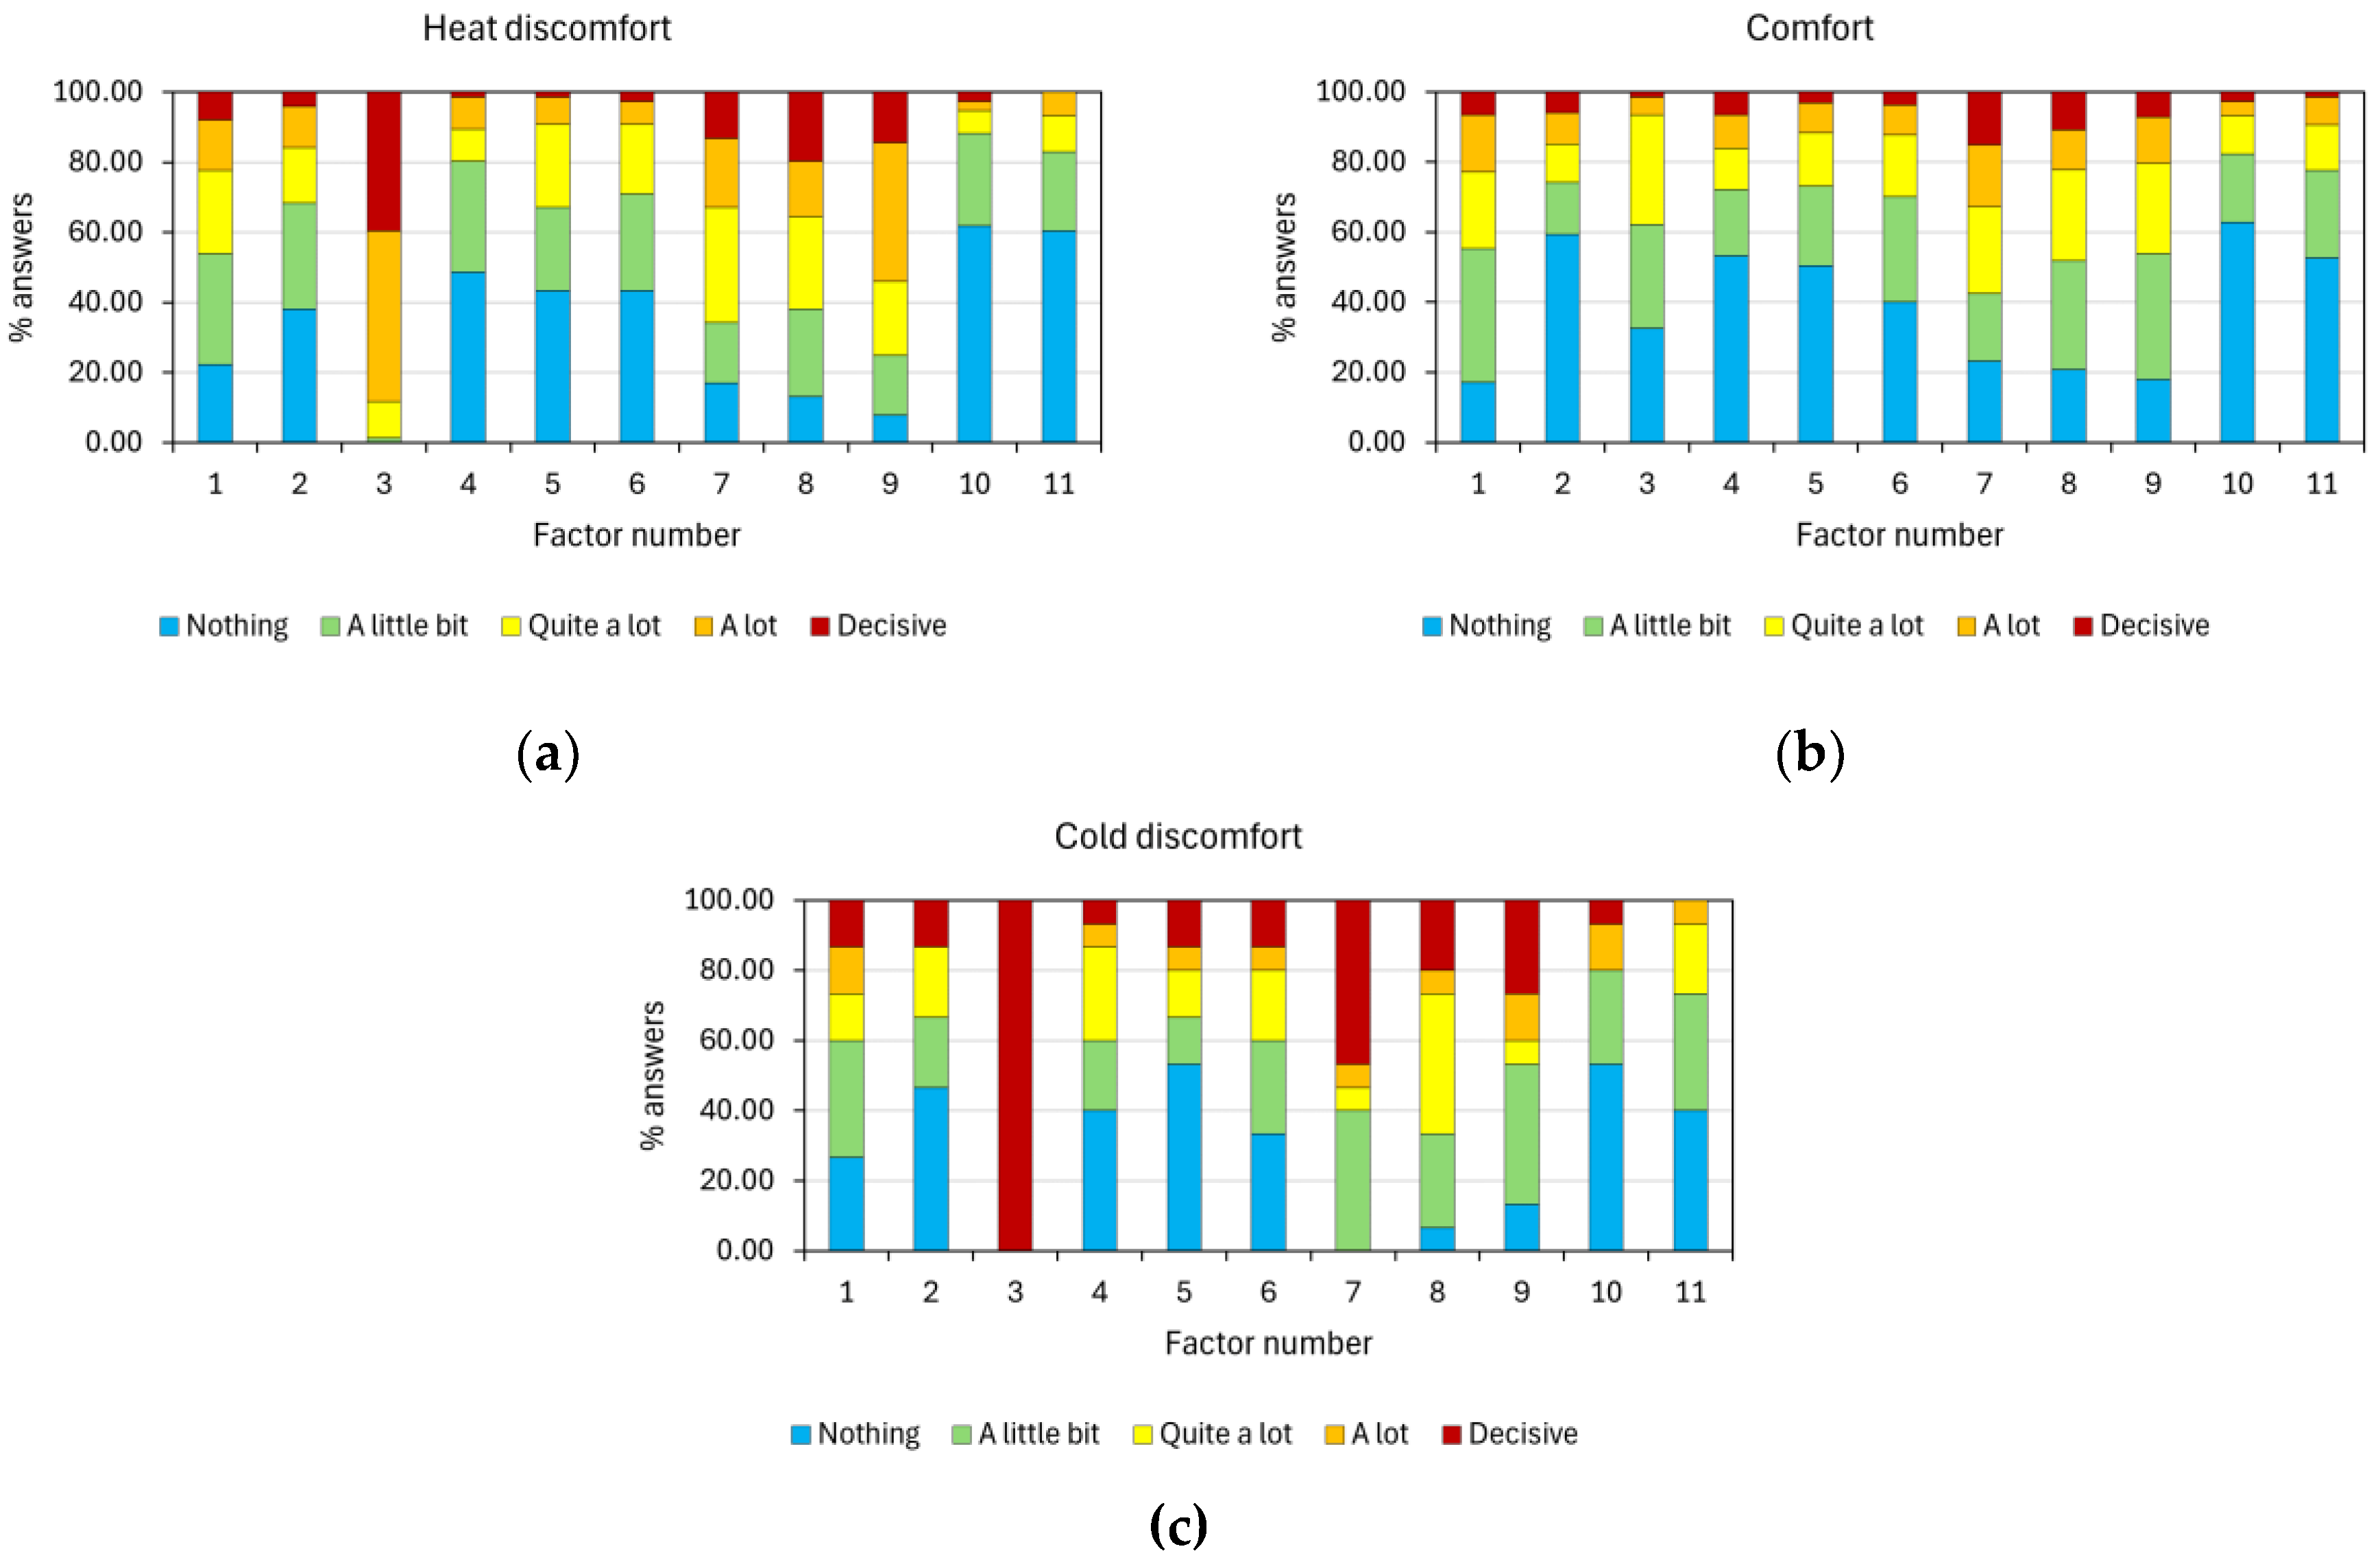
Figure 9.
Mean values of the variables “Environmental conditions” and “Coincidence with other exams” as a function of the grouping of TSV levels.
Figure 9.
Mean values of the variables “Environmental conditions” and “Coincidence with other exams” as a function of the grouping of TSV levels.
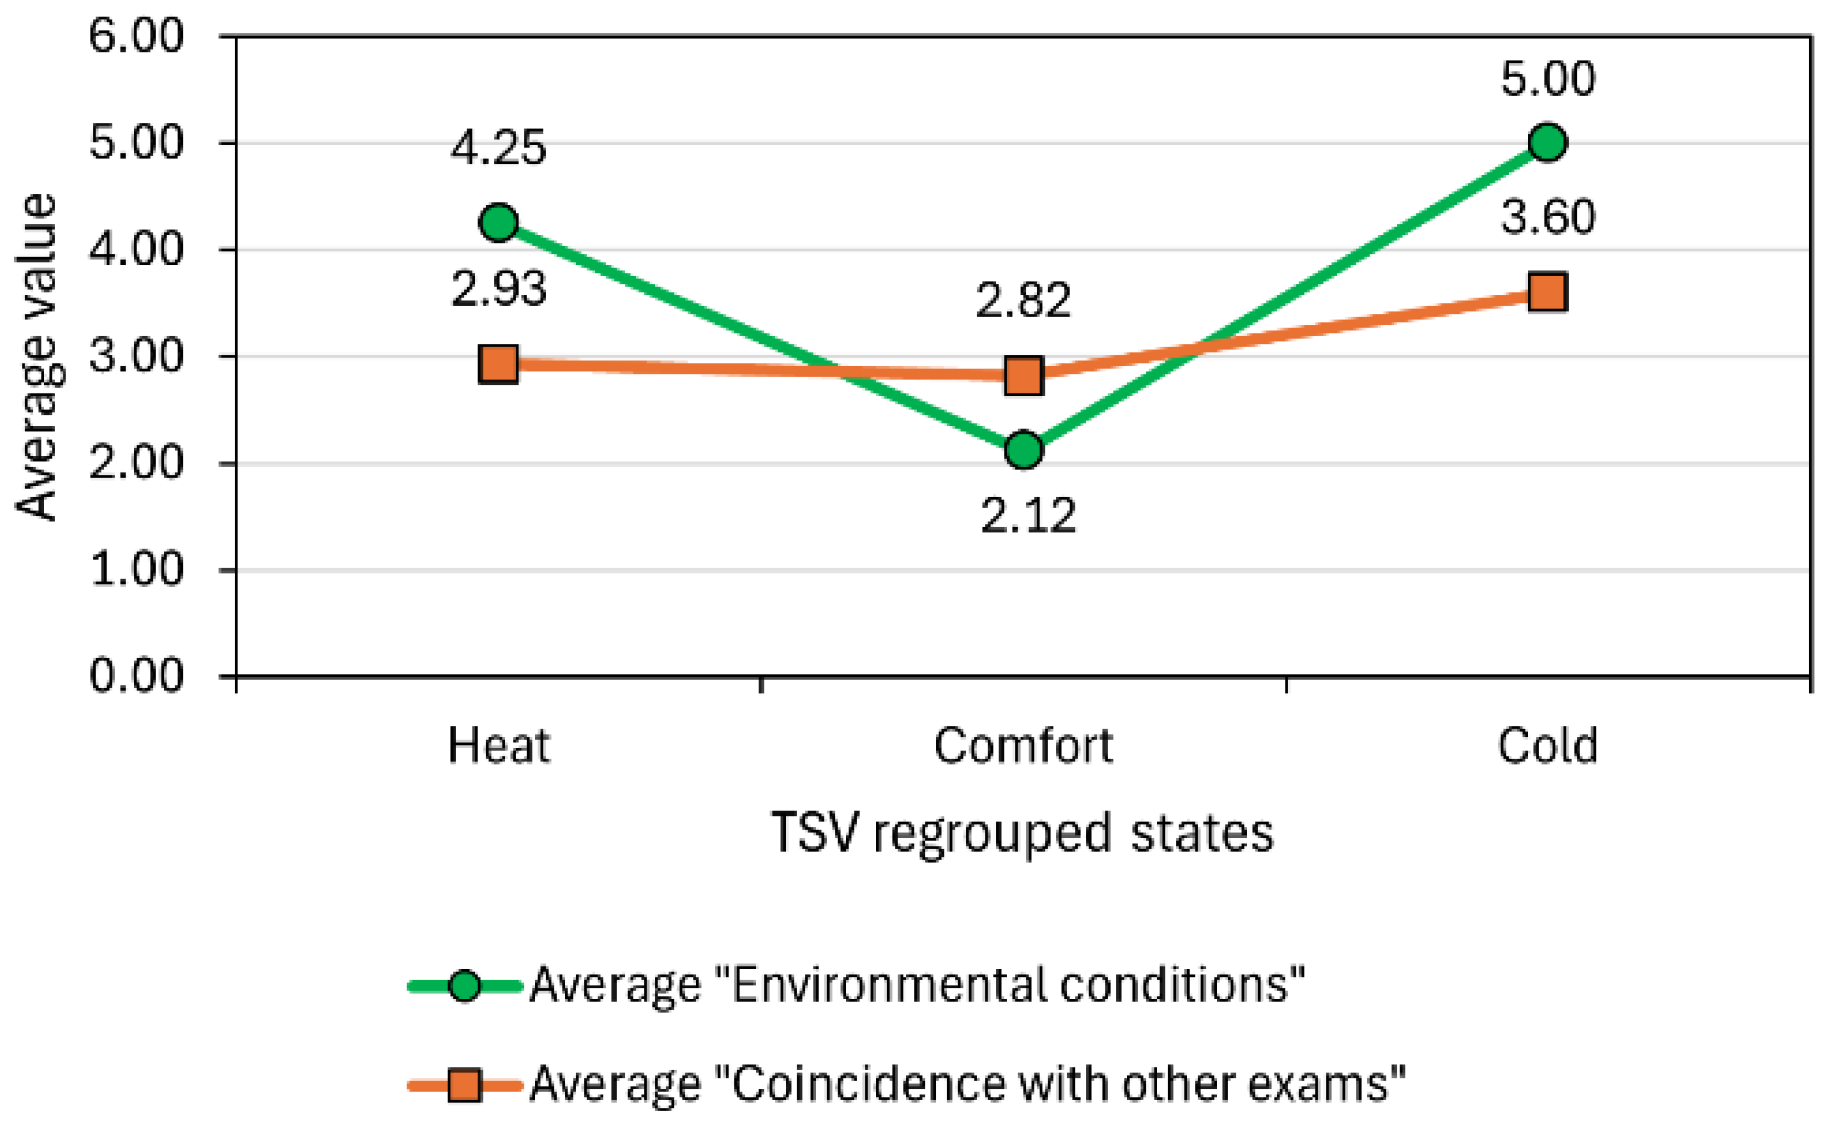

Table 1.
Inclusion and exclusion criteria.
| Criteria | Inclusion | Exclusion |
|---|---|---|
| Year | 2010-2024 | Before 2010 |
| Document type | Papers and congress communications | Doctoral dissertations, books, reports, etc. |
| Publication stage | Final publication | Papers under review |
| Language | English | Other language |
Table 2.
Influencing factors during exams.
| Item no. | Identified factor | References |
|---|---|---|
| 1 | Level of nervousness | [15,23,25,28,29,30,31,78,79,80] |
| 2 | Pressure from failed exam attempts | [30,31,81] |
| 3 | Classroom environmental conditions | [61,62,63,64,74,82,83,84,85,86,87] |
| 4 | Family/personal situation | [34,38,39,40,41,42,43,44,45] |
| 5 | Exam duration | [88,89,90] |
| 6 | Table and chair comfort | [55,58,59,74,91,92] |
| 7 | Coincidence or closeness in time with other exams | [20,21,93,94,95,96,97] |
| 8 | Exam preparation | [6,13,21,97,98,99] |
| 9 | Exam difficulty | [1,10,14,19,100,101,102] |
| 10 | Tools used (calculators, notes, etc.) | [35,36,49,50,51,103,104,105] |
| 11 | Health condition (physical or mental) | [22,29,64,92,106,107,108,109,110,111] |
Table 3.
Questions and scales used to assess thermal comfort.
| Evaluation | Question | Answer choice | Scale | Evaluation clustering |
|---|---|---|---|---|
| Sensation (TSV) | How would you describe the classroom climate during exam? | Hot | +3 | Heat discomfort |
| Warm | +2 | |||
| Slightly warm | +1 | Comfort | ||
| Neutral | 0 | |||
| Slightly cool | -1 | |||
| Cool | -2 | Cold discomfort | ||
| Cold | -3 | |||
| Satisfaction (TCV) | During the exam, how did you feel, in relation to the classroom climate? | Very comfortable | +2 | Comfort |
| Slightly comfortable | +1 | Neutral | ||
| Comfortable | 0 | |||
| Slightly uncomfortable | -1 | |||
| Very uncomfortable | -2 | Discomfort |
Table 4.
Distribution of exams, students and surveys by period.
| Total | Regular exam period | Special exam period | |
|---|---|---|---|
| No. of days analysed | 20 | 10 | 10 |
| No. of exams | 32 | 20 | 12 |
| No. of classrooms | 9 | 9 | 3 |
| No. of surveys | 786 | 487 | 299 |
| Avg. number of students per exam | 24.56 | 24.35 | 24.92 |
| Max. number of students per exam | 71 | 71 | 46 |
| Min. number of students per exam | 4 | 4 | 7 |
Table 5.
Variance explained with component extraction.
| Total variance explained 1 | |||||||||
|---|---|---|---|---|---|---|---|---|---|
| Component | Initial eigenvalues | Extraction sums of charges squared | Rotational sums of squared loads | ||||||
| Total | % of variance | % accumulated | Total | % of variance | % accumulated | Total | % of variance | % accumulated | |
| 1 | 4.454 | 40.491 | 40.491 | 4.454 | 40.491 | 40.491 | 2.780 | 25.270 | 25.270 |
| 2 | 0.997 | 9.065 | 49.556 | 0.997 | 9.065 | 49.556 | 1.846 | 16.778 | 42.048 |
| 3 | 0.926 | 8.414 | 57.970 | 0.926 | 8.414 | 57.970 | 1.536 | 13.964 | 56.012 |
| 4 | 0.890 | 8.087 | 66.057 | 0.890 | 8.087 | 66.057 | 1.105 | 10.045 | 66.057 |
| 5 | 0.760 | 6.913 | 72.970 | ||||||
| 6 | 0.673 | 6.120 | 79.090 | ||||||
| 7 | 0.557 | 5.063 | 84.153 | ||||||
| 8 | 0.510 | 4.635 | 88.788 | ||||||
| 9 | 0.456 | 4.144 | 92.932 | ||||||
| 10 | 0.436 | 3.960 | 96.892 | ||||||
| 11 | 0.342 | 3.108 | 100.000 | ||||||
1 Extraction method: principal component analysis.
Table 6.
Rotated component matrix after exploratory factor analysis.
| Rotated component matrix 2 | ||||
|---|---|---|---|---|
| Factor | Component | |||
| 1 | 2 | 3 | 4 | |
| Level of nervousness | 0.618 | 0.344 | 0.047 | 0.067 |
| Pressure from failed exam attempts | 0.619 | 0.374 | 0.018 | 0.147 |
| Classroom environmental conditions | 0.156 | 0.064 | 0.070 | 0.931 |
| Family/personal situation | 0.331 | 0.744 | 0.163 | 0.023 |
| Exam duration | 0.407 | 0.283 | 0.508 | 0.264 |
| Table and chair comfort | 0.049 | 0.112 | 0.882 | 0.010 |
| Coincidence or closeness in time with other exams | 0.623 | 0.037 | 0.427 | -0.181 |
| Exam preparation | 0.792 | 0.163 | 0.094 | 0.117 |
| Exam difficulty | 0.766 | 0.104 | 0.230 | 0.228 |
| Tools used (calculators, notes, etc.) | 0.314 | 0.430 | 0.552 | 0.203 |
| Health condition (physical or mental) | 0.110 | 0.845 | 0.216 | 0.045 |
Extraction method: principal component analysis. Rotation method: VARIMAX with Kaiser normalisation. 2 The rotation has converged in 5 iterations.
Table 7.
Internal structure of the scale of conditions in a written exam.
| FACTOR 1 Previous conditions |
FACTOR 2 Personal conditions |
FACTOR 3 Material Conditions |
FACTOR 4 Environmental conditions |
|---|---|---|---|
| Level of nervousness Failed exam attempts Coincidence in time with other exams Exam preparation Exam difficulty |
Family/personal situation Health condition |
Exam duration Table and chair comfort |
Environmental conditions under which the exam takes place |
Table 8.
Statistical analysis on which factors negatively influenced academic performance during exams according to the grouping of TSV levels.
Table 8.
Statistical analysis on which factors negatively influenced academic performance during exams according to the grouping of TSV levels.
| TSV clustering for assessment | Statistics | Factor number | ||||||||||
|---|---|---|---|---|---|---|---|---|---|---|---|---|
| 1 | 2 | 3 | 4 | 5 | 6 | 7 | 8 | 9 | 10 | 11 | ||
| Heat discomfort | Mean | 2.59 | 2.12 | 4.25 | 1.83 | 2.09 | 2.02 | 2.93 | 3.00 | 3.31 | 1.64 | 1.63 |
| Median | 2.00 | 2.00 | 4.00 | 2.00 | 2.00 | 2.00 | 3.00 | 3.00 | 4.00 | 1.00 | 1.00 | |
| Mode | 2 | 1 | 4 | 1 | 1 | 1 | 3 | 2 | 4 | 1 | 1 | |
| Comfort | Mean | 2.56 | 1.87 | 2.12 | 1.97 | 1.90 | 2.05 | 2.82 | 2.61 | 2.56 | 1.63 | 1.81 |
| Median | 2.00 | 1.00 | 2.00 | 1.00 | 1.00 | 2.00 | 3.00 | 2.00 | 2.00 | 1.00 | 1.00 | |
| Mode | 2 | 1 | 1 | 1 | 1 | 1 | 3 | 2 | 2 | 1 | 1 | |
| Cold discomfort | Mean | 2.53 | 2.13 | 5.00 | 2.20 | 2.13 | 2.40 | 3.60 | 3.07 | 3.00 | 1.93 | 1.93 |
| Median | 2.00 | 2.00 | 5.00 | 2.00 | 1.00 | 2.00 | 4.00 | 3.00 | 2.00 | 1.00 | 2.00 | |
| Mode | 2 | 1 | 5 | 1 | 1 | 1 | 5 | 3 | 2 | 1 | 1 | |
Table 9.
Statistical analysis of how environmental conditions negatively influenced academic performance during exams according to grouping of TSV levels.
Table 9.
Statistical analysis of how environmental conditions negatively influenced academic performance during exams according to grouping of TSV levels.
| Statistics | TSV clustering for assessment | ||
|---|---|---|---|
| Heat discomfort | Comfort | Cold discomfort | |
| Mean | 4.25 | 2.12 | 5.00 |
| Median | 4.00 | 2.00 | 5.00 |
| Mode | 4 | 1 | 5 |
| Std. deviation | 0.681 | 0.968 | 0.000 |
| 25 percentile | 4.00 | 1.00 | 5.00 |
| Ranking | 1º | 5º | 1º |
Disclaimer/Publisher’s Note: The statements, opinions and data contained in all publications are solely those of the individual author(s) and contributor(s) and not of MDPI and/or the editor(s). MDPI and/or the editor(s) disclaim responsibility for any injury to people or property resulting from any ideas, methods, instructions or products referred to in the content. |
© 2024 by the authors. Licensee MDPI, Basel, Switzerland. This article is an open access article distributed under the terms and conditions of the Creative Commons Attribution (CC BY) license (http://creativecommons.org/licenses/by/4.0/).
Copyright: This open access article is published under a Creative Commons CC BY 4.0 license, which permit the free download, distribution, and reuse, provided that the author and preprint are cited in any reuse.


