
Submitted:
24 October 2024
Posted:
28 October 2024
You are already at the latest version
Abstract
Nanoemulsions represent to cosmetic industry new options of formulations which are easier to apply, better functional benefit and potentially safer formulations. They are very interesting for cosmetic products intended for skin care and also for health products, due to the reduced size (range 20 to 500 nm) of the globules, which avoids processes of instability; they present transparency, fluidity, wettability, spreadability, increase skin penetration and good sensorial sensation.
The main mechanism of instability of nanoemulsions is called Ostwald ripening, responsible to increase the average diameter of the emulsion globules, which, over time, the smaller globules have their contents enveloped by the larger ones.
Recent research has investigated the effects of specific plant oils on skin hydration and barrier function, providing insights for personal care formulators. Among the so-called moisturizing agents commonly used in the cosmetic industry and which reduce Trans Epidermal Water Loss (TEWL) avoiding damage to the skin barrier, there are vegetable oils, especially sesame oil, raspberry seed oil.
High-quality vegetable oils present specific compounds with common properties such as antimicrobial, antioxidant and anti-inflammatory activities and even moisturizing, emollient and sunscreen actions, making them attractive alternative and complementary treatments to soften the process of skin aging.
This research proposes the development of nanoemulsions containing Sesame Oil (SO) added with Raspberry Oil (RO) by low energy method and consists and to evaluate in vitro SO and RO antioxidant activity; formulation studies; to instability process and in vitro evaluation HET CAM.
Keywords:
Sesame Oil (SO)
; Raspberry Oil (RO)
; nanoemulsion
; Ostwald ripening
; physical stability
; in vitro evaluation
 |
| Graphical abstract. |
1. Introduction
Current consumer interest and market trends have stimulated research into new cosmetic forms that explore the benefits associated with incorporating innovative and sustainable raw materials into cosmetic products [1]. Most consumers concerned about the skin aging process undergo chemical peelings, laser rejuvenation or simply adopt the use of new formulations called dermocosmetics cosmeceuticals, such as creams and lotions containing vitamins, sun filters, antioxidants and even healing agents. to heal wounds and burns.
Since ancient times, natural vegetable oils have been used worldwide in the development of new forms and new cosmetic products for skin care. High-quality vegetable oils are still not so expensive options and present specific compounds with common properties such as antimicrobial, antioxidant and anti-inflammatory activities and even moisturizing, emollient and sunscreen actions, making them attractive alternative and complementary treatments to soften the process of skin aging. Due to their unique characteristics, vegetable oils have different proportions of essential fatty acids, which are crucial for the recovery of the skin's hydrolipidic mantle [2].
Recent research has investigated the effects of specific plant oils on skin hydration and barrier function, providing insights for personal care formulators. Among the so-called moisturizing agents commonly used in the cosmetic industry and which reduce Trans Epidermal Water Loss (TEWL), avoiding damage to the skin barrier, there are vegetable oils, especially Sesame Oil (SO), Raspberry seed Oil (RO) among others.
1.1. Sesame Oil (SO)
The use of SO in the cosmeceutical and pharmaceutical industries is based on its content in several phytochemical agents that improve the quality and health of the skin. Sesame oil is one of the most popular natural products that have been prescribed for its benefits in the cosmeceutical industries. In fact, its antibacterial and anti-inflammatory characteristics make it effective enough to reduce pimples and prevent skin rashes and in the production of sunscreens and anti-ageing creams due to its non-sticky feel [1,3].
The antioxidant properties of SO are due to the presence of lignans, sesamol, sesamin and sesamolin [4]. According to Ghafoorunissa (2007) [5] lignans have potential application as natural antioxidants. The antioxidant activity of SO lignans after heating is greater than that of α-tocopherol [6] and can support high temperatures.
Sesame Oil contains a high percentage of fatty acids (85%) and two minor constituents namely Sesamin and Sesamolin. SO can be used as natural products in the healing and in the prevention of numerous types of tumor (anticancer potential) due to presence of Sesamin [7].
1.2. Raspberry Seed Oil (RO)
RO is gaining increasing attention by cosmetics industry and is widely used in many anti-aging skin care products to help promote youthful skin and it can be also used as a base for makeup applications. It is used as an ingredient in body and face moisturizers because of its high concentrations of vitamins A and E [8] essential for the maintenance and repair of skin cells. Vitamin A is used as an ingredient in anti-aging skin care products because its antioxidant and moisture retention capacities, reduces the appearance of wrinkles and smooths skin texture [8,9]. Vitamin E helps to protect cells from oxidative damage and assists with maintaining collagen structure [8].
Raspberry Oil can be used creating a lipid barrier that minimize the TEWL and retaining moisture helps to keep skin cells looking young and full, reduces the appearance offine lines and wrinkles protect the skin of UV radiation [10]. The primary factors that contribute to premature aging of the skin include UV from the sun, illness, smoking and drinking [11]. Unlike other emollients, RO does not clog pores, it is also noncomedogenic and encourages natural water retention in the cells [11].
1.3. Nanoemulsions
To cosmetic industry nanoemulsions represent new options of formulations which are easier to apply, better functional benefit and potentially safer formulations [12]. They allow a profit skin penetration and an effective release profile of ingredients, which contributes to superior technological and cosmetic effects [13].
Nanoemulsions are a class of emulsions kinetically stable liquid-in-liquid dispersions with droplet sizes on the order of 100 nm [14]. While many strategies are available, nanoemulsions have attracted the tremendous attention of scientists globally for the research in wound therapy due to their long-term thermodynamic stability and bioavailability [15].
The applications of nanoemulsions are numerous, from topical anti-aging care, make-up, nails, deodorants, oral care, sunscreens, and hair care. They are also employed in a diverse range of biomedical applications (ocular, intravenous, and other modes of delivery) due to the small droplet sizes that render exceptional properties such as prolonged stability and low viscosity values.
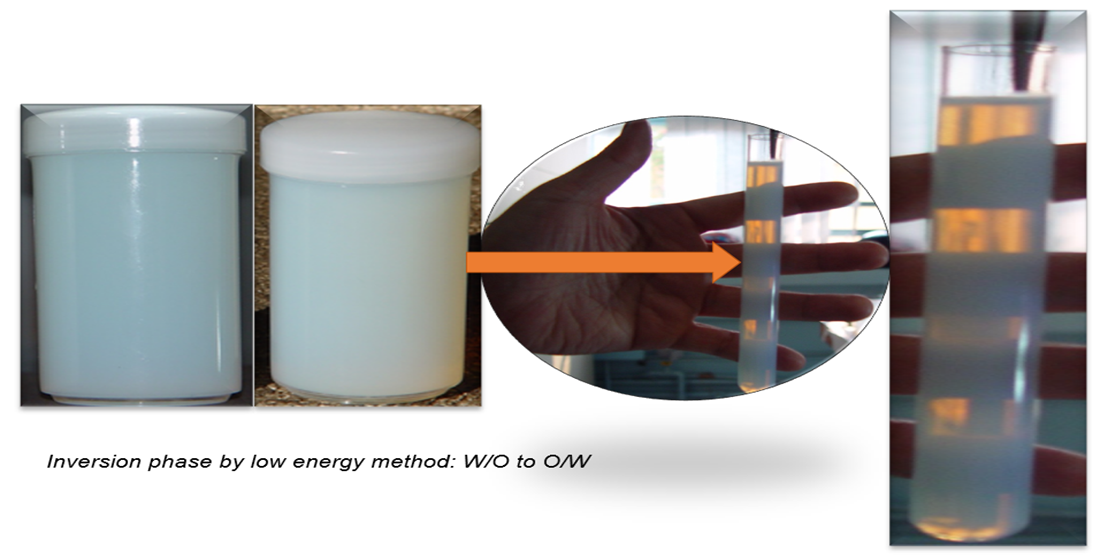
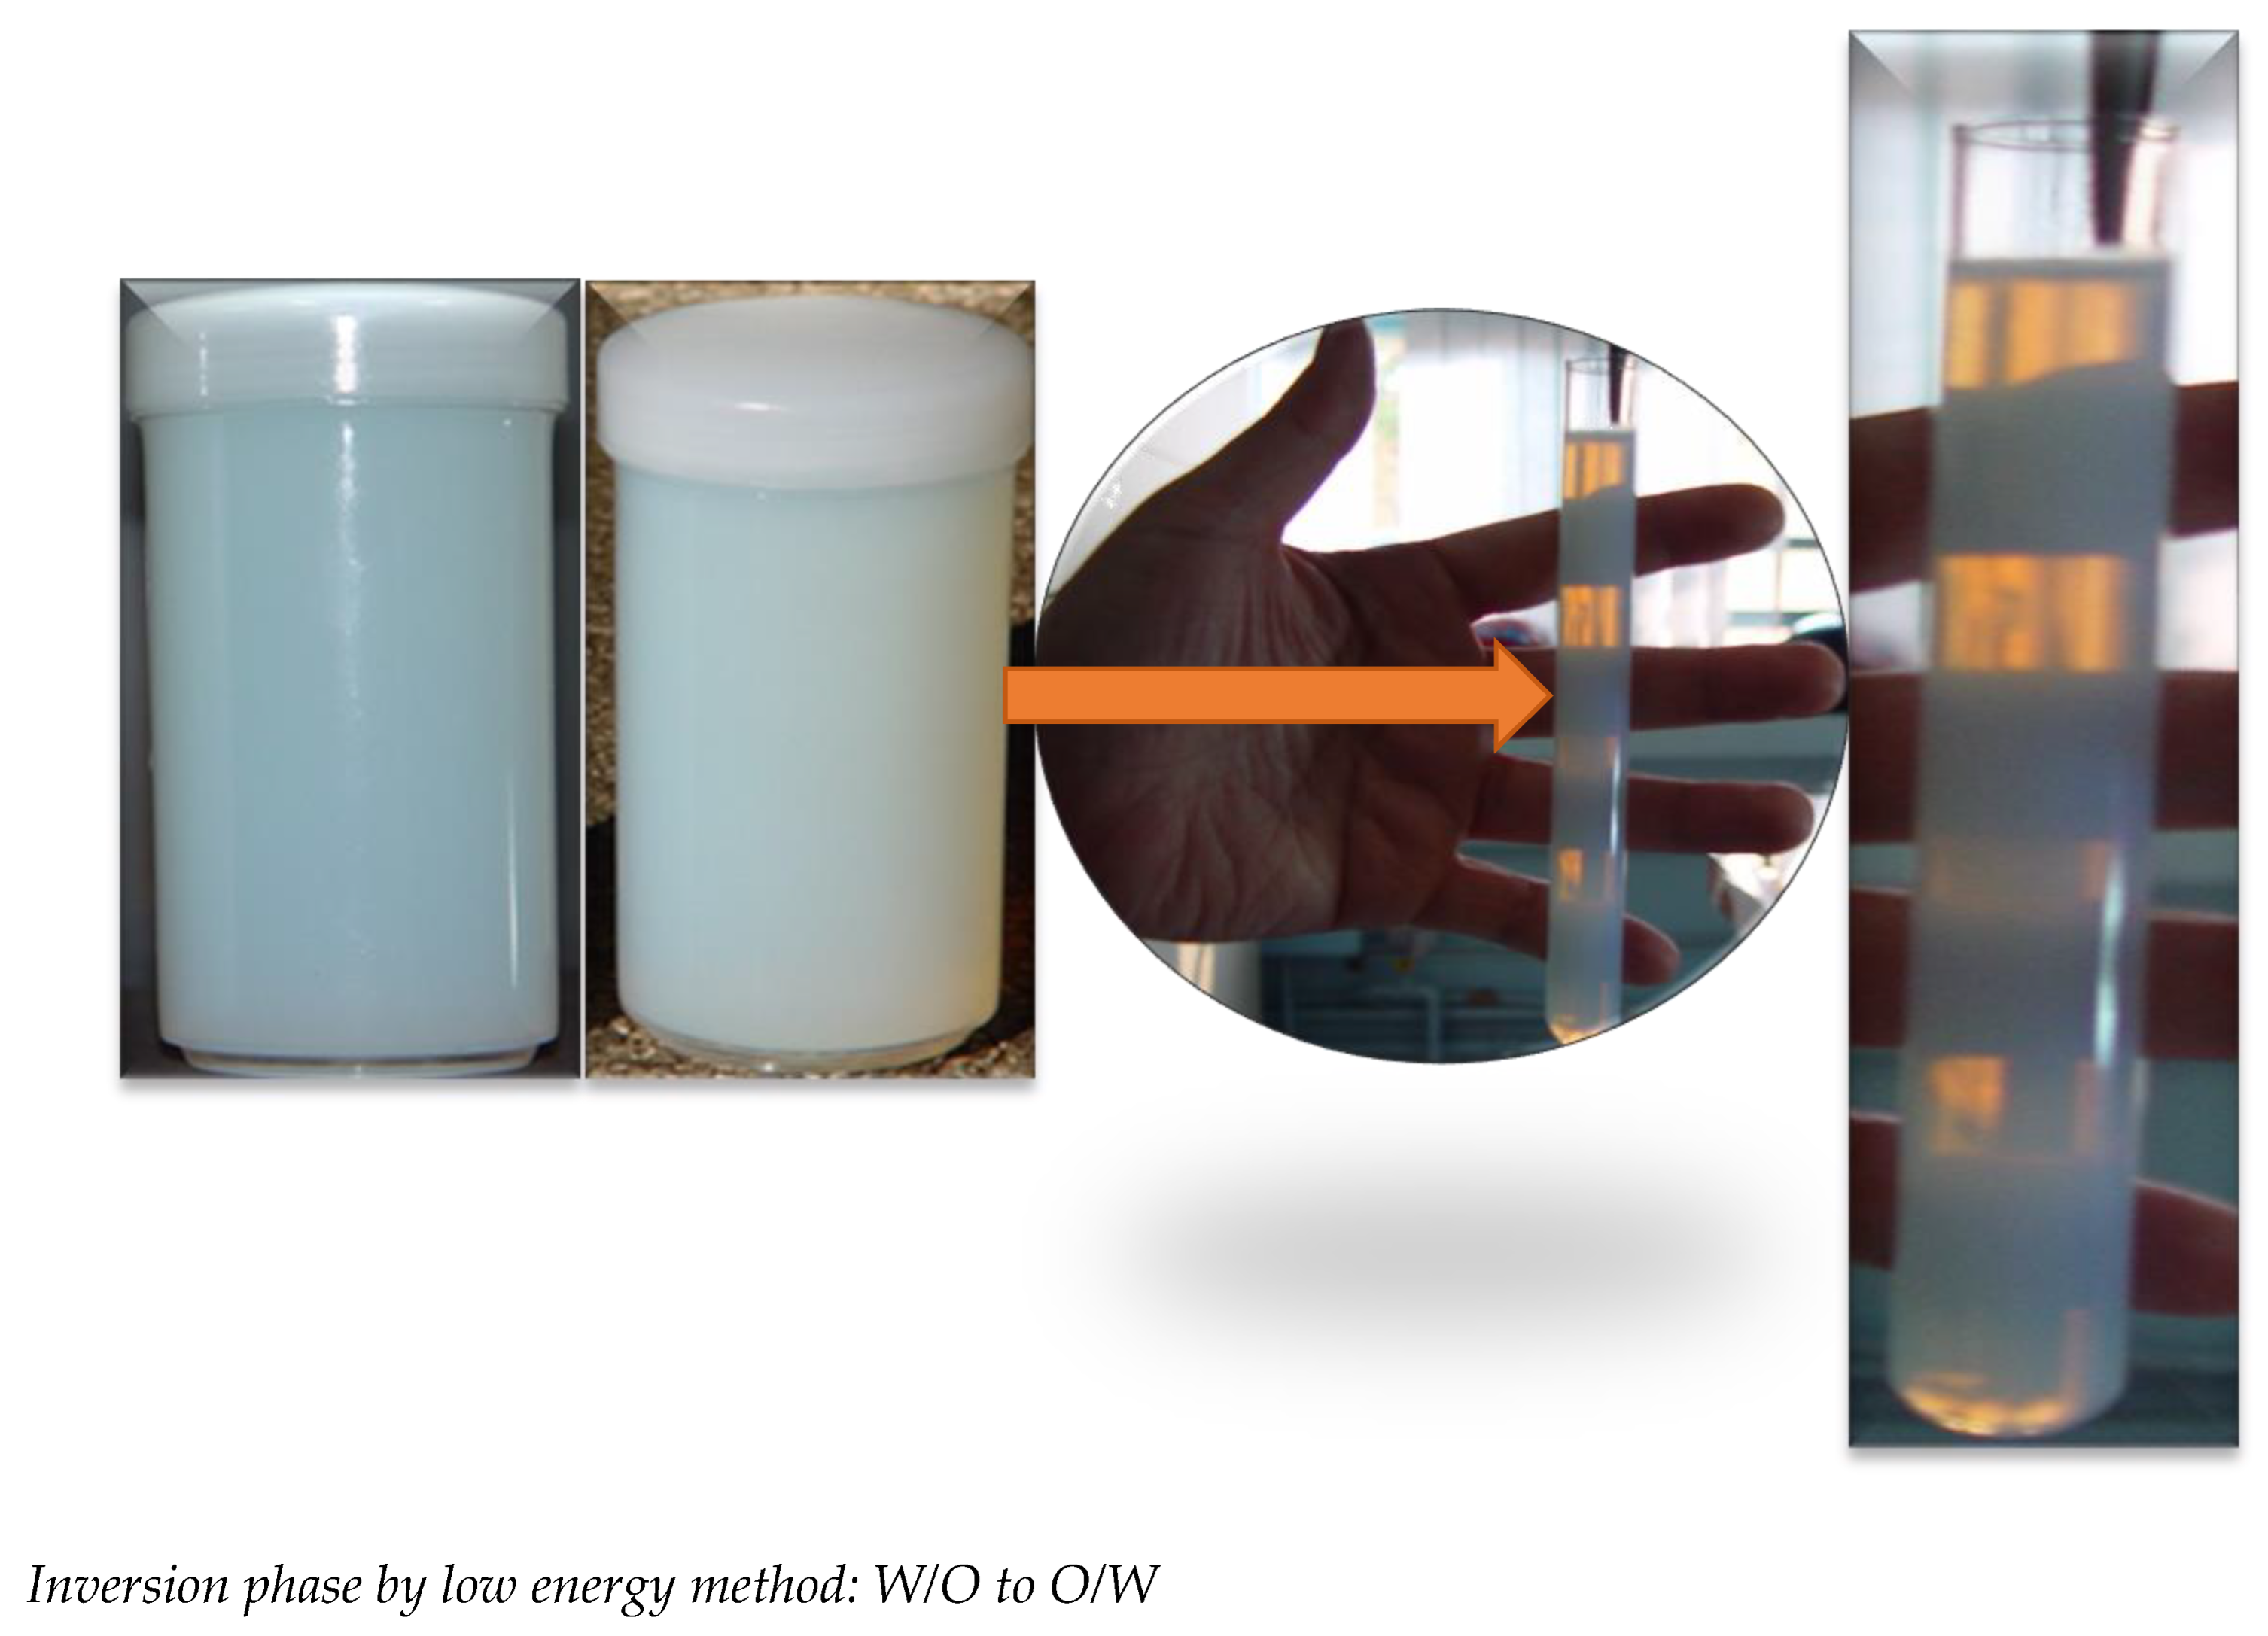
They can be prepared by emulsification methods as the Low energy used in this study, based on the change in curvature of the surfactant molecule (Phase Inversion Temperature- PIT). Low Energy Methods begin with a W/O macroemulsion formation which is then transformed into an O/W nanoemulsion following changes either in composition or temperature. In Emulsion Inversion Phase (EIP), a W/O macroemulsion can be prepared at variable temperature values and slowly diluted with water: the system passes through an inversion point where the transformation from W/O to O/W emulsion takes place [16].
The main mechanism of instability of nanoemulsions is called Ostwald ripening, which consists of the expansion of a smaller globule of the emulsion into a larger one as a result of the difference in the chemical potential originated from the variation in the radius of curvature of the droplets. There is a reduction in the free energy of the system due to the destruction of the interfacial area, causing an increase in the average diameter of the emulsion globules, with the content of the smaller globules being surrounded by the larger ones, causing instability of the nanoemulsion [17,18].
This research proposes the development of nanoemulsions containing Sesame Oil (SO) added with Raspberry Oil (RO) by Low Energy Method and consists of the following steps:
- In vitro evaluation of SO and RO antioxidant activity;
- Formulation studies based on ternary phase diagram;
- Study the Ostwald ripening instability process;
- In vitro toxicity evaluation by HET CAM method.
2. Material & Methods
2.1. Material
(International Nomenclature Cosmetics Ingredients- INCI name)
Aqueous phase: Purified water
Oily phase: (Lipo® Brasil)
Sesame seed oil: Sesamum indicum oil (SO)
Raspberry seed oil: Rubus idaeus seed oil (RO);
Surfactants (S):
Sorbitan monooleate- Span®80 (SSM); (HLB value= 4.3) (Croda Brasil)
Polysorbate 80- Tween®80 (SP80); (HLB value=15.0)
PEG- castor oil (Oxiteno Brasil):
PEG-15 castor oil- Alkest® CSO 150 (S15OE); (HLB value = 8.3);
PEG-30 castor oil- Alkest® CSO 300 (S30OE); (HLB value= 11.7);
PEG-40 castor oil- Alkest® CSO 400 (S40OE); (HLB value= 13.0);
PEG-54 castor oil- Alkest® CSO 540 (S54OE); (HLB value= 14.4);
PEG-40 hydrogenated castor oil- Alkest® CSO 400 (SH40OE); (HLB value= 14.1).
Preservatives
Liquid Germall® Plus- Diazolidinyl Urea (and) Iodine propynyl Butyl carbamate (and) Propylene Glycol (Ashland Brazil).
BHT- Butylated Hydroxy Toluene (Adicel).
2.2. Methods
1. In vitro Evaluation of Antioxidant Action
1.1 Determination of H+ donor activity
1.1.1. Choosing the best solvent to solubilize the vegetable oils
Four different types of solvents were evaluated to solubilize SO and RO: Isopropyl Alcohol (IPA), Methyl Alcohol (MA), Ethyl Alcohol (EA) and Ethyl Acetate (EtAc). The choice of the best solvent to be used was carried out through the macroscopic analysis of the solubilization of SO and RO in different oil concentrations (50μL/1mL of solvent; 100μL/1mL of solvent; 200μL/1mL of solvent; 400μL/1mL of solvent; 1mL/1mL of solvent). The solubilization analysis was classified into: homogeneous solubilization (SH), non-solubilization (NS) and non-homogeneous solubilization (SNH). Next, mixtures of solvents with SO or RO at different concentrations were tested. The antioxidant effect on the DPPH• radical will be calculated according to equation 1 [19,20,21].
where: Inhibition (%) = H+- donor activity of the DPPH• radical; A control= absorbance of the DPPH• solution without the sample A; sample= absorbance of the DPPH• solution plus the sample A; negative= absorbance of the sample without the DPPH• solution.
Inhibition (%) = [1 – (A sample – A negative)] x 100 (equation 1)
A control
A control
1. 2. Superoxide radical scavenging activity generated in the Xanthine (X)/ Luminol (L)/ Xanthine Oxidase (XOD) system by chemiluminescence
The chemiluminescent mixture was prepared before analysis by mixing 400μL Glycine buffer (0.1M, pH 9.4, 1mM EDTA), 150μL Xanthine (6mM in Glycine buffer), 10μL Luminol (0.6mM). Add 100μL of the Xanthine Oxidase solution to start the reaction. Chemiluminescence will be measured in 5 minutes at 25ºC with the Autolumar LB 953 equipment [22] The formation of the superoxide anion will be carried out through enzymatic reactions by the following reaction:
Xanthine + O2 → Uric Acid + Superoxide Radical XOD
1) Tests 1: preliminary test:
Negative – all materials except the sample (X + XO + L + Glycine Buffer); Vegetable Oil (SO and RO): Glycine Buffer (1:10); Solvent: EA: IPA (1:1)
2) Test 2: solvent interference: pure SO; pure RO; RO pure + negative
3) Test 3: turbidity interference: No L; RO; S/SO
2.3. Antioxidant Activity of Nanoemulsions
The formulations were added to the reaction medium based on the IC50 calculation for vegetable oils. The IC50 refers to the concentration of pure oils that showed 50% inhibition of the DPPH• radical. To verify the interference of the components of the formulation, two procedures were performed:
a) control antioxidant activity, consisting of oils in the proportions contained in the formulations;
b) antioxidant activity of the components of the formulations, in the corresponding proportions, without SO and RO and in formulations containing BHT.
2.4. Formulation Studies
2.4.1. Creaming Profiles of SO and RO Emulsions [23]
To determine SO and RO creaming profiles, the emulsions were prepared initially with 67.0% (w/w) aqueous phase, 30.0% (w/w) oil phase and 3.0% (w/w) emulsifier blend of Tween® 80 and Span® 80 at HLB values ranging from 5.0 to 15.0 (Table 1). Then, the aqueous phase and the oil phase containing the blend of surfactants were heated separately to 70± 3°C. The aqueous phase was added to the oil phase while stirring with a propeller mixer at 25000 rpm/min for 5 min. and the container was placed in a water bath (13± 1°C).

Table 1.
Formula for SO and RO creaming profiles determination according to Gullapalli [23].
2.4.2. Evaluation for Creaming Profiles of Emulsions
To measure the creaming profiles at 25± 2°C, 10 mL of each emulsion sample were poured into a 10 mL graduated cylinder immediately after preparation and observed for creaming at 24h intervals during four days. It was measured the percent volume of the dispersed phase creamed at the upper portion of the graduated glass tubes [23].
2.4.3. HLB`s Study- Determination of HLB Required Value for SO and RO by the Phase Inversion Method
The aqueous phase and oily phase (containing surfactant) were heated to a temperature of 75± 2ºC, then the aqueous phase was poured over the oily phase, under constant and continuous stirring at 600 rpm (RW 20 digital – IKA®) until cooling to 25± 2ºC [24]. The composition studied were show in Table 2.
Phase Inversion Temperature (PIT) Method
The emulsion was rapidly cooled in an ice bath until the temperature reaches 25± 2ºC [25,26] at the phase inversion temperature [25,26].
The amounts of SSM (A) and SP80 (B) were calculated using the equation 2 below:
A+ B = 100
HLBA x 0.01.A + HLBB x 0.01.B = HLBR
Equation 2. where: A= percentage of Lipophilic surfactant; B= percentage of Hydrophilic surfactant; HLBA = Hydrophilic Lipophilic Balance of A; HLBB = Hydrophilic Lipophilic Balance of B; HLBR = Resulting or Required Hydrophilic Lipophilic Equilibrium for the oil phase.
2.4.4. Influence of Addition of Additives on Formulation
The surfactants chosen were castor oil derivatives with different degrees of ethoxylation PEG- 15, PEG- 30, PEG- 40, PEG- 54 and a PEG- 40 hydrogenated castor oil. Macroscopic analysis was performed after 24 hours of preparation.
2.4.5. Phase Diagram for SO and RO at the Required HLB Value
After determining the HLB value required for SO and RO, the phase diagram was studied using the surfactant PEG-15 EO castor oil and PEG- 30 castor oil (25± 2ºC) and performed in two steps: 1) quantity of components varying of 10.0% (w/w); 2) quantity of components varying of 2.5% (w/w).
2.4.6. Stability Tests
Centrifugation Test
Thermal Stress
Emulsions placed in test tubes were subjected to thermal stress [30]. The samples were submitted to heating in a thermal bath (Nova Técnica Ltd – Model 281 NT) at a temperature range of 40± 2ºC to 75± 2ºC, with a temperature increase interval of 5 to 5ºC. The samples were kept at each temperature for 30 minutes and, after each period, the organoleptic characteristics and the presence of phase separation were evaluated.
Particle Size and Zeta Potential
It was determined in the Zeta sizer nano series model nano zs90 (Malvern Instruments Ltd, Malvern, United Kingdom).
Determination of the pH Value [31]
It was carried out in dilutions of the emulsion (triplicate) using the pH meter Analion-Mod. PM608 Ribeirão Preto, SP, Brazil.
Analysis of Viscosity
The measurement of viscosity was carried out in triplicate, using a Brookfield DV-I+ viscometer, using the device for small volumes and the SDC-34 shear sensor (Spindle nr. 34), at room temperature, and 8.0 g of sample were used for each reading. Analysis times were 50, 100 and 150 days after preparation of the formulations.
Ostwald Ripening Index
Polydispersity Index (Equation 4) (SPAN) [34]
IP= dw/ dn (equation 4)
where: dw= mean weight or mean volume of globules; dn = mean number of globules
2.5. In Vitro Evaluation
2.5.1. Irritation Test in Organotypic Model - HET - CAM
2.5.2. Chorioallantoic Membrane Preparation
The eggs (10days) were carefully placed in an upright position on an egg rack, with the widest and flattest part facing upwards. With the aid of flat scissors, a small hole was made in the center of the upper part of the shell, which was cut circularly with curved scissors, and later a whitish-looking membrane was removed to expose the chorioallantoic membrane. This membrane is characterized by its transparency and the presence of blood vessels. Next, the membranes were analyzed in order to find damage, which could cause rejection of the egg in the experiment.
SO and RO emulsions samples 0.3 mL or 0.3 g were applied with a micropipette directly to the chorioallantoic membrane and remained in contact with the membrane for 20 seconds. After this the membrane was washed to remove the emulsion and evaluation of the chorioallantoic membrane.
As positive controls, eggs were treated with SDS (1.0%) and 0.1 N NaOH as a model of highly irritating products and in which the three parameters to be considered are always observed (hyperemia, hemorrhage, and coagulation).
3. Results
3.1. In Vitro Evaluation of Antioxidant Capacity
3.1.1. Inhibition of DPPH•
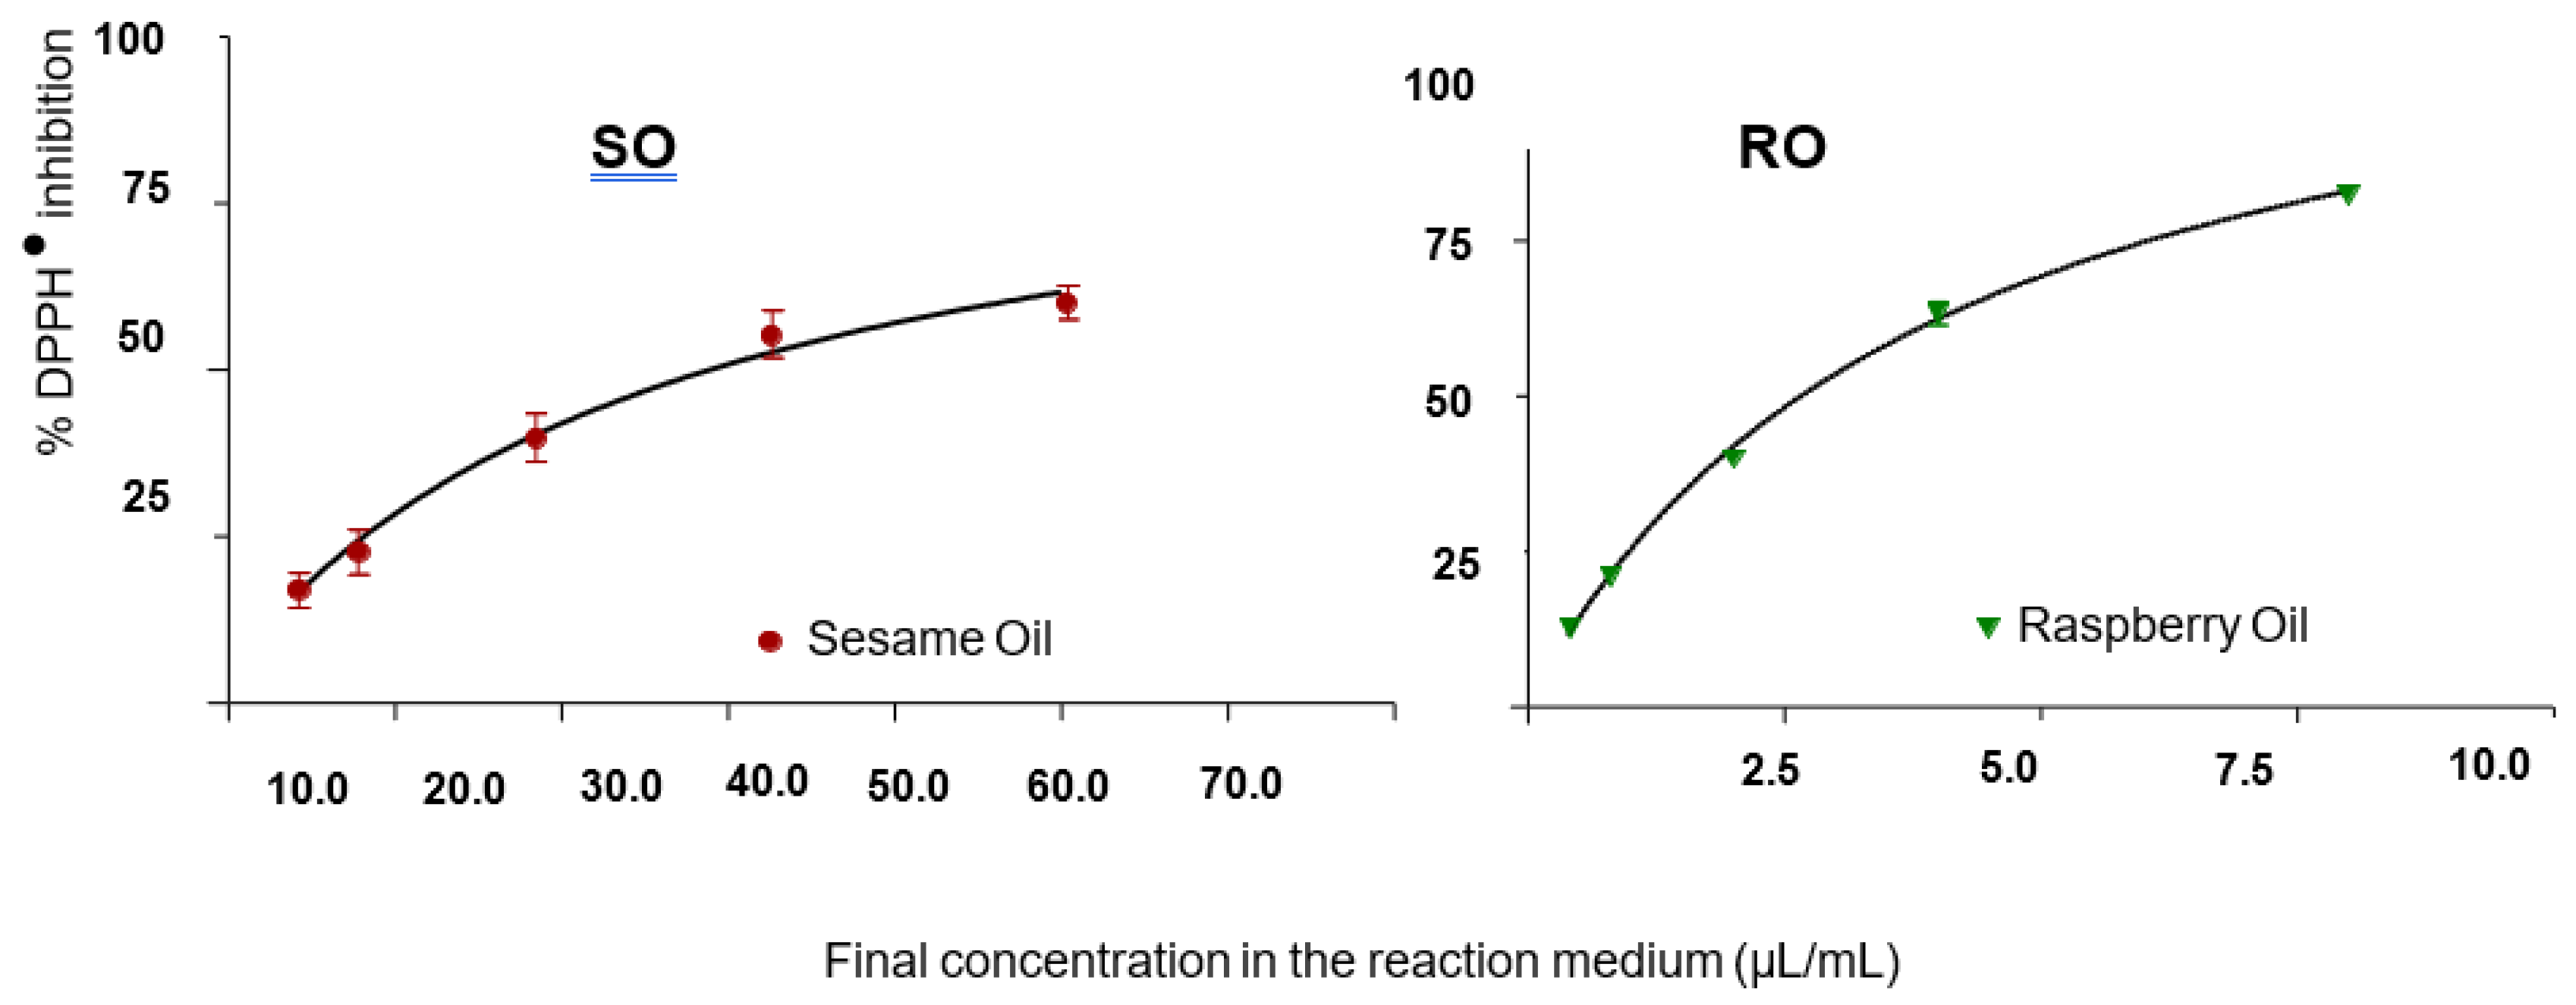
According to Bandoniene et al. (2002) and Antolovich et al., 2002) [39,40] the IC50 value expresses the amount of antioxidant raw material necessary to reduce the absorbance of DPPH• by 50% The value can be determined or calculated using the linear regression slope (Figure 1). According to the curve, the IC50 of SO and RO was 310.94 μL/mL and 34 μL/mL, respectively.
The Table 3 shows the percentage of inhibition of DPPH• in different concentrations of SO and RO, necessary to inhibits 50% of DPPH• activity sextuplicate(sextuplicate).
S2 HERE
Figure 1.
Measurement curve of H+ donating activity to DPPH• for Sesame Oil (SO) and Raspberry Oil (RO) after solubilization in Ethyl Alcohol and Isopropyl Alcohol (1:1).
Figure 1.
Measurement curve of H+ donating activity to DPPH• for Sesame Oil (SO) and Raspberry Oil (RO) after solubilization in Ethyl Alcohol and Isopropyl Alcohol (1:1).
3.1.2. Superoxide Radical Scavenging Activity Generated in the Xanthine (X)/ Luminol (L)/ Xanthine Oxidase (XOD) System by Chemiluminescence
Chemiluminescence is based on area measurements as a function of luminescent emission time in the presence of antioxidants. Luminol was used as a detector which is oxidized to superoxide anion. The inhibition of the luminescent emission caused by the decrease of the superoxide anion resulted in the evaluation of the antioxidant power. In Table 4, the 42.56% and 31.5% for SO and RO, respectively, was not real, if we consider 29.28% inhibition for solvent (EtAc: IPA).
S3 HERE
To verify the interference of this solvent, another test was performed only with pure oils, without the addition of solvents, whose values are in Table 5.
S4 HERE
The inhibition percentage shown in Table 5, so the antioxidant power of pure vegetable oils was 20.44% and 50.66% for Sesame Oil and Raspberry Oil, respectively. Therefore, RO has a higher antioxidant power than SO. In this test there was a technical problem of turbidity of the Raspberry Oil reaction medium. To verify the interference of this problem, a third test (test 3) was carried out, the results of which are shown in Table 6.
S5 HERE
The interference of the turbidity of the medium was carried out by submitting the sample with the raspberry oil and the reaction medium without Luminol to verify if there was any emission without the luminescent substance. The result obtained was that without luminol there was no emission inhibition (99.86%), therefore, there was no interference. Another test was measuring the glycine buffer mixture plus raspberry oil, also showing no interference. Therefore, the inhibition of raspberry oil was 42.08%, thus characterizing its antioxidant activity.
3.2. Formulation Studies
3.2.1. Determination of SO and RO Creaming Profiles [23]
In the Table 7 it was showed the creaming profiles and globule size of SO emulsions in HLB values between 5.0 to 15.0 using the surfactant pairs SSM and SP80.
According to Gullapalli et al. (1999) [23], the greater the percentage of creaming, expressed in the creaming profile, and the smaller the globule size, the greater the stability of the emulsion. For Zhang & Que (2008) [41] the size of the globules would be much smaller in the optimal HLB of the mixture of surfactants. To Liu et al. (2006) [42] the temperature can influence the HLB value of the system: the higher the temperature, the smaller the optimal HLB for the emulsion and also the smaller the size of the globules. In the present study, the temperature was kept at 25± 2oC, varying only the HLB range.
3.2.2. Phase Diagram for SO and RO at the Required HLB Value
The study with ternary diagram using the surfactant components (PEG- 15 Castor oil or PEG- 30 Castor oil at HLB= 8.0; oil phase (SO) and purified water, was carried out in two steps:
Step 1. Varying at 10.0% the concentration of ternary phase components.
In the Figure 2 (Step1), the ternary diagrams identify the formation of nanoemulsions in the point 29 (10.0% SO or RO, 10.0% PEG- 15 Castor oil; 80.0% purified water) common to both vegetable oils. After 24 hours of preparation, O/W nanoemulsion 29 (SO and PEG- 15 Castor oil) showed translucent appearance but showing phase separation after 15 days of preparation.
The result of the nanoemulsion prepared with PEG-15 castor oil show stability just after 24hours (Table 8). The nanoemulsion obtained with PEG- 15 castor oil showed a very reduced globule size (20 nm) and had low stability showing phase separation after 1 month. In the Table 8 were described the evaluated parameters of nanoemulsions prepared with PEG- 30 Castor oil (time of 24 hours and 6 months) at HLB= 8.0 and HLB=8.3. Nanoemulsions prepared with PEG- 30 Castor oil were stable (no phase separation), with no difference after 6 months in physical characteristics (pH value of 6.74 to 6.03; zeta potential from 35.5 to 49.1 mV; globule size from 226.7 to 264 nm).
Besides PEG- 15 castor oil PEG- 30 Castor oil it was employed PEG- 40 Castor oil and PEG- 54 Castor oil but the obtained nanoemulsions showed phase separation after 24 hours. According to Tadros et al. (2004) and Fernandez et al. (2004) [17,43] there was no steric stabilization and the degree of ethoxylation did not allow good packaging to obtain nanometric globules.
Step 2. Varying at 2.50% the concentration of ternary phase components.
In the Figure 2 (Step 2) it can be observed formulas derivatives at point 29, so numbered from 37 to 58 with 2.5 % variations in their components.
3.3. Influence of Addition of Additives on Formulation
As an additive, PEG-54 Castor oil was added as a co-surfactant at concentrations of 1.0% and 0.5% and RO was added at concentrations of 5.0% and 7.50% to the SO nanoemulsions (Table 9).
3.4. Stability Studies
3.4.1. Thermal Stress
The results of the thermal stress test (Table 10) show the stability of the SO nanoemulsions (HLB= 8.0) containing or not RO as function of temperature.
S6 HERE
S6 HERE
It was observed that the 50.3.3.F formulation containing RO was the most stable in the thermal stress test - without phase separation at 80±2ºC. Subsequently, a difference in HLB values was studied in order to analyze the stability of the system (Table 11).
3.4.2. Particle Size
By rapidly cooling the nanoemulsion A (29) at 25± 2ºC, close to the PITvalue, according to Izquierdo, P. et al. (2002, 2005), Shinoda, K. et al. (1968, 1969) and Ee et al., (2008) [25,26,44,45,46] show small and very stable globules.
According to the theory of Lifshitz-Slezov and Wagner (1961) [47] Ostwald ripening of O/W emulsions consists of the joining of smaller globules to larger ones due to the variation of the chemical potential of the oily phase between globules of different sizes and different radii of curvature with consequent increase in size and instability of the system. The results presented in the Phase Inversion Temperature study related in Table 12 demonstrate that the globule sizes were nanometric, ranging from 15.0± 2.5 nm to 61.0± 11.0 nm at 80±2ºC, over the course of 90 days. The high stability was due to the PIT methodology and small particles sizes, [25,26,44,45,46]. This kinetic stability can be confirmed by the Ostwald Ripening Index determination.
Table 13 illustrates the stability test and the diameter values of the globules of SO nanoemulsions added with RO and co-surfactants exposed to different temperatures conditions. The A sample maintain the translucent macroscopic appearance [26,42,48] and was the one with the smallest globule size and the greatest homogeneity in the size distribution, that is, 17.33± 3.06nm at 25± 2oC changing to 42.00±16.97after 30 days. At 45± 2oC the nanoemulsion has 49.85± 9.43nm smaller than 50 nm. At 4± 2oC, after 30 days there was no change in the size of the globules, assuming values around 17.33±3.06nm and 15.00±1.41nm after one and 30 days, respectively.
The other formulations at the different temperature values that were exposed, presented particle sizes smaller than 200nm, are stable nanoemulsions and did not present phase separation.
3.4.3. pH Value and Viscosity Analysis
The pH value of the nanoemulsions submitted to the stability test are showed in Table 14 (S7). It can be observed that after one month there is a slight decrease in the pH values of the samples kept at 25± 2oC, while at 4± 2oC the pH values remained unchanged. For the samples submitted to 45± 2oC, the pH values of nanoemulsions progressively decreased to values lower than 4.0. This suggests that a chemical degradation of the components may have occurred, such as the release of carboxylic acids from both the oil phase and the surfactant set, since both are composed of fatty acids.
S7 HERE
To verify the influence of temperature on the viscosity values the formula A was prepared at different temperatures and stored for different periods of time (Table 15) (S8)
S8 HERE
From the results obtained through statistical analysis (ANOVA test – Newman Keuls with p<0.05) the formulations prepared at temperature values below 65oC showed a significant difference after 90 days and phase separation within 120 days of preparation. It can be seen that the best preparation temperature was 85oC, which showed the smallest statistical difference after 120 days.
3.4.4. Ostwald Ripening
Compared with conventional emulsions, nanoemulsions often have good stability against creaming or sedimentation, flocculation and coalescence because of the small diameter of particles.
Ostwald ripening (ω) is always the main mechanism of instability of nanoemulsions [17,32,33,49]. According to Welin-Berger et al., (2000) [50], these indices can be improved from the addition of a second component with much lower solubility in water in the dispersed phase and this could increase the stability of the nanoemulsion.
According to Gutiérrez et al., (2008) and Porras et al., (2008) [51,52] the systems A is characterized as nanoemulsions, whose main instability mechanism is Ostwald ripening confirmed by linear regression [17]. By the R² values of the linear regression of the analyzed nanoemulsions in the period of 90 days, it can be observed that all are linear, except the one prepared at 55ºC presents values lower than 0.8, which infers non-linear characteristics (R² < 0.8).
The nanoemulsion A presents lower values of the Ostwald Ripening Index (1.3333) with a good correlation (0.9796) at 85ºC, which is the best temperature for the formation of the nanoemulsion (Table 16).
It can be observed that in relation to the ω values of the nanoemulsions prepared by the classical methodology, the PIT method was efficient because it presented much lower ω values, characterizing a metastable system [29].
In the case of nanoemulsion F.80, the lowest Ostwald ripening index (1.3333) with a good correlation (0.9796) at 75ºC and was the best temperature value for the formation of the nanoemulsion (Table 16).
The determination of the Ostwald ripening index is based on the theory of Lifshitz – Slezov – Wagner (LSW). The instability process Ostwald ripening [53] or molecular diffusion that starts due to the Kelvin effect that describes the effects of curvature in the chemical potential [54]. The Ostwald ripening index increases due to the difference in solubility between globules with different sizes: large globules expand due to the diffusion of the content of smaller globules through the continuous phase - there is no barrier to their passage through the interface, this diffusion being the limiting step for the growth index [32,33,42].
This analysis proposes that with time the Ostwald ripening process enters a stationary phase in which the cube of the average globule radii increases linearly with time and the shape of the distribution of globules normalized by the average radii is invariant with time.
In the table 17 (S9) the triplicates of sample A at room temperature (a, b and c) show a linear trend, the same occurring with the triplicates of sample F.80 (a, b and c). According to the LSW theory (equation 3) the linearity of the cube of the radius with time means that in macroemulsions (radius > 1 μm), the rate of increase in the mean radius is extremely smaller than in an emulsion with a radius smaller than 0.5μm. Therefore, the triplicates of the two samples demonstrate that the Ostwald ripening phenomenon is the main instability mechanism being very high values for samples A: ωAa = 3387.7x 10-22 m3 s-1, ωAb = 4282.3x 10-22 m3 s-1, ωAc = 7806.2x 10-22 m3 s-1 and
While for sample F.80 the values were very close ωF.80a = 5.2494x 10⁻²² m3 s1 and ω F80c = 5.4147x 10⁻²² m3 s-1.
S9 HERE
Under different environmental conditions, nanoemulsions formed without additional energy other than heat and their components may show inconsistent behavior, as they are influenced by temperature and in this case the main phenomenon of instability would no longer be the Ostwald ripening process, but others such as flocculation, creaming, sedimentation or coalescence. The negative values of the Ostwald ripening index can prove this discussion.
Shinoda et al. (1969, 1968) [44,45] using ethoxylated surfactants found that these surfactants are highly dependent on temperature, becoming lipophilic with increasing temperature due to the dehydration of the polyoxyethylene chains. In PIT, the size of the globules has a minimum value and the interfacial tension also reaches a minimum, however these small globules are unstable and coalesce quickly and shows a high Ostwald ripening index (Table 17).
3.4.5. Polydispersivity Index (PI)
The PI (Figure 3 and Figure 4) (S1) reveals the quality of the dispersion in relation to the particle size: values below 0.1 indicate monodisperse systems, while for values above 1.0 the system is heterogeneous, indicating the presence of particles of variable size and probable occurrence of instability (Ostwald ripening) [34,48].
Samples A and F.80 in triplicate showed irregularity in particle size under different temperature values and at the end of 30 days. PI values can justify the growth of globules in samples exposed to the stability test.
S1 HERE
3.4.6. Antioxidant Capacity of Nanoemulsions
The formulations subjected to the antioxidant test were A (SO- 10.0% and RO 3.0%) and F.80 (SO 7.5% and RO 5.0%). Table 18 presents the values of the theoretical calculation of % DPPH• inhibition of formulation A and F.80 were 60% and 85%, respectively.
By analyzing the results shown in Table 19, samples A and F.80 showed antioxidant activity (68.71% and 67.75%, respectively), and they showed a statistical difference with the controls. Among the nanoemulsions there was no statistical difference in antioxidant activity. Table 19 demonstrates the percentage of DPPH• inhibition of formulations A and F.80 and its components (except purified water).
Controls showed DPPH• inhibition of 37.53% for A and 35.5% for F.80. The mechanisms of antioxidants are diverse, including hydrogen donating compounds, metal chelators, singlet oxygen inhibitors, oxygen inhibitors and the action of antioxidant enzymes [55,56,57]. According to Lee, J. et al. (2007) [58] the DPPH• method is specifically justified in the determination of hydrogen-donating antioxidant compounds. To verify the interference of the components of the formulations in the antioxidant activity, activity measurements of the surfactant solutions were carried out in proportion used in the formulation (S. A and S. F.80), of the surfactant solution added with BHT (S. A+ BHT and S. F.80+ BHT) and the preservative solution in the concentrations used in nanoemulsions (Table 20).
All comparative results of the influence of nanoemulsion components were submitted to the Newman-Keuls multiple comparison ANOVA statistical test (p < 0.001) and showed statistically different values.
Surfactants and preservatives showed very low antioxidant activity, practically not influencing the activity of formulations A and F.80. The test with BHT, an antioxidant placed to prevent the oxidation of vegetable oils, showed considerable activity, thus contributing to the high results of % DPPH• inhibition in the A formulations (68.71% and 21.6% control with BHT) and F.80 (67.75% and 22.2% control with BHT).
Regarding the results of the difference in DPPH• inhibition in the controls and solutions of surfactants with BHT (37.53%, nanoemulsion control A + 21.6%, S. F.80 with BHT = 59.13%; 35.50%, nanoemulsion control A + 22.2%, surfactants from F.80 with BHT = 57.7%) the results are compatible with total inhibition in nanoemulsions (68.71% in 29.30 and 67.75% in F.80). By theoretical approximation of the amount of these oils in each formulation plotted on the inhibition curve of each of them shown in Table 36 (formulation 29.30 – 60% inhibition and formulation F.80 – 85% inhibition). The % inhibition of pure oils was relatively higher than the actual % in nanoemulsions A (68.71%) and F.80 (67.75%).
In the research by Hung et al. (2007) [59] the antioxidant activity of resveratrol was significantly reduced when placed in lipid emulsion or in aqueous micellar systems. According to the author, this indicates that the inclusion of resveratrol within the dispersed system can prevent the antioxidant activity of the active substance through the shield formed by the emulsion globules or liposomal vesicles. Therefore, the difference or decrease in the theoretical calculation values from pure oils and nanoemulsions is due to the protection that globules impose on the activity of vegetable oils.
The DPPH• method does not represent the concentration of all oxidation products but measures the concentration of hydrogen-donating antioxidants or generated free radicals such as alkoxyl (RO•), peroxyl (ROO•), or alkyl (R•) radicals. The results of DPPH• studies can provide important information for researchers to classify new antioxidant compounds from natural sources. The interpretation of these results must be carefully discussed because not only the free radical inhibitor compounds but also the radicals themselves can decrease the stability of DPPH• [58].
4. Toxicity Evaluation by HET-CAM Methodology
The chorioallantoic membrane test emerged as a viable alternative to the Draize test to assess ocular irritation of water-soluble cosmetic products [60,61]. According to Zanatta, CF, (2008) [62] the HET-CAM test is efficient in determining the irritating potential of products containing surfactants and emulsions.
The results obtained with the formulations (A and F.80) and the respective surfactant solutions (S. A and S. F.80) (Table 21) demonstrate that the appearance of capillaries (hyperemia) occurred in a time close to 2 minutes (between 93.75 sec and 125.0 sec) which is equivalent to a score between 3 and 1, thus classifying the samples as slightly irritating.
5. Conclusions
This research aims to demonstrate the production of nanoemulsions containing sesame and raspberry oil by the low-energy method, such as phase inversion, and to promote the potential use of nanoemulsion as an effective and safe dermocosmetic product. With this objective, this article proposes the development of nanoemulsions with studies evaluating the antioxidant activity of the oils, formulation and stability studies, and in vitro evaluation of the toxicity of the nanoemulsion by the HET CAM method.
The IC50 value for SO was 310.94 μL/ mL while for RO it was 34 μL/ mL.. The inhibition of chemiluminescent emission for SO and RO was 20.44% and 42.08%, and this result characterizes an antioxidant activity for RO twice as high as that of SO.
The required HLB value for SO was equal to 8.0 for the surfactant pair SSM: P80 as for the pairs SSM: PEG- 30 castor oil and pair SSM: PEG 15 castor oil.
SO nanoemulsions were obtained by the Low Energy Method (PIT) and the globule sizes of nanoemulsions A and F. 80 were respectively 42.00±16.97nm and 73.50±24.75 nm at 25± 2oC, and 49.85± 9.43nm and 154.50±68.59nm at 45± 2oC.
The nanoemulsions remained stable with the addition of RO and co-surfactants PEG- 40 castor oil and PEG- 54 castor oil.
The pH values of nanoemulsions have been found to be suitable for skin care products, and the lower viscosity values (cP) will allow release from the packaging and spread easily to the application external site -skin or internal site.
The nanoemulsions obtained showed antioxidant activity greater than 65%, while the values for pure SO and RO were relatively higher. The results for the Ostwald ripening index allow it to be used as a comparative indicator of nanoemulsions stability.
The in vitro evaluation by the HET-CAM method of surfactants and nanoemulsions showed that they were slightly irritating and could be used in cosmetic products.
Author Contributions
Conceptualization, methodology, writing - review and editing P.A.R.F.
Funding
This research received no external funding.
Ethical Aspects
Not applicable.
Institutional Review Board Statement
Not applicable.
Informed Consent Statement
Not applicable.
Data Availability Statement
Not applicable.
Conflicts of Interest
The authors declare no conflict of interest.
References
- Guzmán, E., Lucia, A. Essential Oils and Their Individual Components in Cosmetic Products. Cosmetics. 2021, 8, 114. [CrossRef]
- Vaughn, A.R. et al. Natural Oils for Skin-Barrier Repair: Ancient Compounds Now Backed by Modern Science. Am. J. Clin. Dermatol., 2018, 19, 103–117. [CrossRef]
- Zaid, A. et al. Impact of Sesame Oil Source: A Quality Assessment for Cosmeceutical and Pharmaceutical Use. Fabad J. Pharm. Sci., 2019, 44, 3, 189-196.
- Lin, T.K., Zhong, L, Santiago, J.L. Anti-Inflammatory and Skin Barrier Repair Effects of Topical Application of Some Plant Oils. Int J Mol Sci., 2017. Dec 27;19 (1):70. [CrossRef]
- Ghafoorunissa, H.S., Rao, M.V.V. Sesame lignans enhance antioxidant activity of vitamin E in lipid peroxidation systems. Mol. Cell. Biochem., 2004. 262, 195- 202. [CrossRef]
- Lee, J.; Lee, Y.; Choe, E. Effects of sesamol, sesamin, and sesamolin extracted from roasted sesame oil on the thermal oxidation of methyl linoleate. LTW – Food Science and Technology. 2008. [CrossRef]
- Yaseen, G. et al. Sesame (Sesamum indicum L.). in Green Sustainable Process for Chemical and Environmental Engineering and Science Plant-Derived Green Solvents: Properties and Applications. 2021, Chap 5, 253-269. Elsevier Inc. [CrossRef]
- Oomah, B.D. et al. Characteristics of raspberry (Rubus idaeus L.) seed oil. Food Chemistry. 2000, 69, 187-193. [CrossRef]
- Bramley, P. M. et al. Vitamin E. J. Agricultural and Food Chemistry. 2000, 80, 913-938.
- Wang, P.W., et al. Red Raspberry Extract Protects the Skin against UVB-Induced Damage with Antioxidative and Anti-inflammatory Properties. Oxid Med Cell Longev., 2019 6. [CrossRef]
- Ispiryan, A.; Viškelis, J.; Viškelis, P. Red Raspberry (Rubus idaeus L.) Seed Oil: A Review. Plants. 2021, 10, 944. [CrossRef]
- Tadros, T.F. Future developments in cosmetic formulations. Int. J. Cosm. Sci., 1992, 14, 93-111. [CrossRef]
- Santos, A.C. et al. Nanotechnology for the development of new cosmetic formulations, Exp Opinion on Drug Delivery. 2019 ,16 (4), 313-330. [CrossRef]
- Gupta, A. Nanoemulsions. Nanoparticles for Biomedical Applications. In: Fundamental Concepts, Biological Interactions and Clinical Applications. Micro and Nano Technologies. 2020. Chap. 21. 371-384. [CrossRef]
- Chhabra J. et al. Potential of nanoemulsions for accelerated wound healing: innovative strategies. Int. J. Surg., 2023, 109 (8), 2365-2377. [CrossRef] [PubMed] [PubMed Central]
- Gupta, A., Eral, H.B., Hatton, A.T., Doyle, P.S. Nanoemulsions: formation, properties and applications. Soft Matter. 2016, 12, 2826-2841. [CrossRef]
- Tadros, T., Izquierdo, P., Esquena, J. Solans, C. Formation and stability of nanoemulsions. Adv. Coll. Int. Sci., 2004, 108-109, 303-318. [CrossRef]
- Taylor, P. Ostwald ripening in emulsions: estimation of solution thermodinamics of the disperse phase. Adv. Coll. Int. Sci., 1998, 75, (2), 107-163. [CrossRef]
- Mello, L. D. et al. Investigations of the antioxidant properties of plant extracts using a DNA-electrochemical biosensor. Biosensors and Bioelectronics. 2006, 21. [CrossRef]
- Duan, X. J.; Zhang, W. W.; Li, X. M.; Wang, B. G. Evaluation of antioxidant property of extract and fractions obtained from a red alga, Polusiphonia urceolata. Food Chemistry. 2006, 95, 37-43. [CrossRef]
- Silva, C. G.; Herdeiro, R. S.; Mathias, C. J. et al. Evaluation of antioxidant activity of Brazilian plants. Pharmacological Research. 2005, 52, 229-233. [CrossRef]
- Marquele, F. D. et al. Assessment of the antioxidant activities of Brazilian extracts of propolis alone and in topical pharmaceutical formulations. J. Pharm. Bio. Analysis, 2005, 39, 455-463. [CrossRef]
- Gullapalli, R. P.; Sheth, B. B. Influence of an optimized non-ionic emulsifier blend on properties of oil-in-water emulsions. Eur. J. Pharm. and Biopharm., 1999, 48, 233-238. [CrossRef]
- Santos, O. D. H. Desenvolvimento e avaliação das propriedades físico-químicas e atividade cosmética in vivo de emulsões de óleo de Calendula officinalis com cristal líquido. 2006. 142 f. Tese (Doutorado em Ciências Farmacêuticas). Faculdade de Ciências Farmacêuticas de Ribeirão Preto, Universidade de São Paulo, São Paulo, 2006.
- Izquierdo, P. et al. Formation and stability of nanoemulsions prepared using the phase inversion temperature method. Langmuir. 2002, 18, 26-30. [CrossRef]
- Izquierdo, P. et al. The influence of surfactant mixing ratio on nano-emulsion formation by the pit method. J. Coll. Int. Sci., 2005, 285, 388-394. [CrossRef]
- Ribeiro A.M., Khury E., Gottardi D. Validação de testes de estabilidade para produtos cosméticos; Proceedings of the 12th Congresso Nacional de Cosmetologia; São Paulo, Brazil. 30 June–2 July 1998; São Paulo, Brazil: Associação Brasileira de Cosmetologia, ANAIS Tecnopress; 1998. p. 349- 375.
- [28]. Ferrari M. Obtenção e Aplicação de Emulsões Múltiplas Contendo óleos de Andiroba e Copaíba. (Mestrado em Ciências Farmacêuticas) Dissertação, Faculdade de Ciências Farmacêuticas de Ribeirão Preto, Universidade de São Paulo; Ribeirão Preto, SP, Brazil: 1998. p. 147.
- Mason, T.G. et al.. Nanoemulsions: formation, structure, and physical properties. J. Phys.: Condens. Matter, 2006, 18, R635. [CrossRef]
- Braconi F.L., Oliveira I.S., Baroni M.N.F., Rocha-Filho P.A. Aplicação cosmética do óleo de canola; Proceedings of XII Congresso Latino Americano e Ibérico de Químicos Cosméticos; São Paulo, Brazil. 27–31 August 1995; São Paulo, Brazil: Associação Brasileira de Cosmetologia, Tecnopress; 1995. pp. 6–19.
- BRASIL. Agência Nacional de Vigilância Sanitária. Guia de estabilidade de produtos cosméticos. Séries Temáticas. Série Qualidade 1. 2004, 1, Brasília, DF.
- Capek, I. Degradation of kinetically-stable o/w emulsions. Adv. Coll. Int. Sci., 2004, 107, 125-155. [CrossRef]
- Taylor, P. Ostwald ripening in emulsions. Adv. Coll. Int. Sci., 1995, 99, (2–3), 175-185. [CrossRef]
- Jafari, S. M.; He, Y.; Bhandari, B. Production of submicron emulsions by ultrasound and microfluidization techniques. J. Food Engineering. 2007, 82, 478-488. [CrossRef]
- {35] Luepke, N. P. Hen´s egg choriallantoic membrane test for irritation potential. Food and Chemical Toxicology. 1985, 23, 287-291. [CrossRef]
- Vinardell, M. P.; Garcia, L. The quantitative chorioallantoic membrane test using trypan blue stain to predict the eye irritancy of liquid scintillation cocktails. Toxicology In Vitro. 2000, 14, 551-556. [CrossRef]
- Murillo, G. et al. Estúdio comparativo de três variantes del ensayo de la membrana corioalantoidea del huevo de la galina para La evaluación de la irritación ocular. Revista de Toxicologia. 2003, 20, 187- 192.
- Vinardell, M.P, Mitjans M. The chorioallantoic membrane test as a model to predict the potential human eye irritation induced by commonly used laboratory solvents. Toxicology In Vitro. 2006, 20, (6), 1066-1070. [CrossRef]
- Bandoniene, D. et al. Detection and activity evaluation of radical scavenging compounds by using DPPH free radical and online HPLC-DPPH methods. Eur Food Res Tech., 2002, 214, 143-147. [CrossRef]
- Antolovich, M. et al. Methods for testing antioxidant activity. The Analyst. 2002, 127, 183-198. [CrossRef]
- Zhang, L.; Que, G. Influence of the HLB parameter of surfactants on the dispersion properties of brine in residue. Colloids Surf. A: Physicoch. Eng. Aspects. 2008, 320, 111-114. [CrossRef]
- Liu, W. et al. Formation and stability of paraffin oil-in-water nano-emulsions prepared by the emulsion inversion point method. J. Coll. Interface Sci., 2006, 303, 557-563. [CrossRef]
- Fernandez, P. et al. Nano-emulsion formation by emulsion phase inversion. Colloids & Surf., 2004, 251, 53-58. [CrossRef]
- Shinoda, K.; Arai, H. The effect of phase volume on the phase inversion temperature of emulsions stabilized with nonionic surfactants. J. Coll. Interface Sci., 1968, 25, 429-431. [CrossRef]
- Shinoda, K.; Saito, H. The stability of O/W type emulsions as functions of temperature and the HLB of emulsifiers: the emulsification by PIT-method. J. Coll. Interface Sci., 1969, 30, 258-263. [CrossRef]
- Ee, S. L. et al. Droplet size and stability of nano- emulsions produced by the temperature phase inversion method. Chemical Engineering Journal. 2008, 140, 626-631. [CrossRef]
- Lifshitz, I. M.; Slezov, V. V. The kinetics of precipitation from supersaturated solid solutions. J. Physics and Chemistry of Solids. 1961, 19, 35-50. [CrossRef]
- Anton, N. et al. Nano-emulsions and nanocapsules by the PIT method: An investigation on the role of the temperature cycling on the emulsion phase inversion. Int. J. Pharmaceutics. 2007, 344, (1-2), 11 44-52. [CrossRef]
- Morales, D. et al. A study of the relation between bicontinuous microemulsions and oil/water nanoemulsion formation. Langmuir. 2003, 19, 7196-7200. [CrossRef]
- Welin-Berger, K.; Bergenståhl, B. Inhibition of Ostwald ripening in local anesthetic emulsions by using hydrophobic excipients in the disperse phase. Int. J. Pharmaceutics. 2000, 200, 249-260. [CrossRef]
- Gutiérrez, J. M. et al. Nano-emulsions: New applications and optimization of their preparation. Current Opinion in Colloid and Interface Science. 2008, 13, 245-251. [CrossRef]
- Porras, M. et al. Studies of formation of W/O nano-emulsions. Colloids Surf. A: Phys. Eng. Aspects. 2004, 249 (1-3): 115-118. [CrossRef]
- Ostwald, W. Uber die vemeintliche Isomerie des roten und gelben quecksilberoxyds und die Oberflachen-spannung Fester Korper. Zeitschrift für Physikalische Chemie. 1901, 34, 495-512. [CrossRef]
- Thomson, W.F.R.S. XLVI. Hydrokinetic solutions and observations, The London, Edinburgh, and Dublin. Philosophical Magazine and Journal of Science. 1871, 42 (281) 362-377. [CrossRef]
- Boff, J. M.; Min, D. B. Chemistry and reaction of singlet oxygen in foods. Comprehensive Reviews in Food Science and Food Safety. 2002, 1, 58-72. [CrossRef]
- Lee, J. H.; Koo, N. S.; Min, D. B. Reactive oxygen species, aging, and antioxidative nutraceuticals. Comprehensive Review in Food Science and Food Safety. 2004, 3, 21-33. [CrossRef]
- Lee, J. M. et al. Development of a method predicting the oxidative stability of edible oils using 2,2-diphenyl-1-picrylhydrazyl (DPPH). Food Chemistry. 2007, 103, 662-669. [CrossRef]
- Lee, J. et al. Development of a method predicting the oxidative stability of edible oils using 2,2-diphenyl-1-picrylhydrazyl (DPPH). Food Chemistry. 2007, 103, (2) 662-669. [CrossRef]
- Hung, C. F. et al. The effect of oil components on the physicochemical properties and drug delivery of emulsions: Tocol emulsion versus lipid emulsion. Int. J. Pharmaceutics. 2007, 335, 193-202. [CrossRef]
- Steiling, W. et al. The HET-CAM, a useful in vitro assay for assessing the eye irritation properties of cosmetic formulations and ingredients. Toxicology In Vitro. 1999, 12, 375-384. [CrossRef]
- Doucet, O.; Lanvin, M.; Zastrow, L. Comparison of three in vitro methods for the assessment of the eye irritation potential of formulated products. In Vitro and Molecular Toxicology. 1999, 12, 63-76. ISSN 1097-9336.
- Zanatta, C.F. Aplicação do óleo de buriti no desenvolvimento de emulsões e estudo da citotoxicidade e potencial foto- protetor em cultivo celular. [thesis]. Ribeirão Preto. Faculdade de Ciências Farmacêuticas de Ribeirão Preto. 2008. [CrossRef]
Figure 2.
Diagram phase for Sesame Oil (SO) and Raspberry Oil (RO).
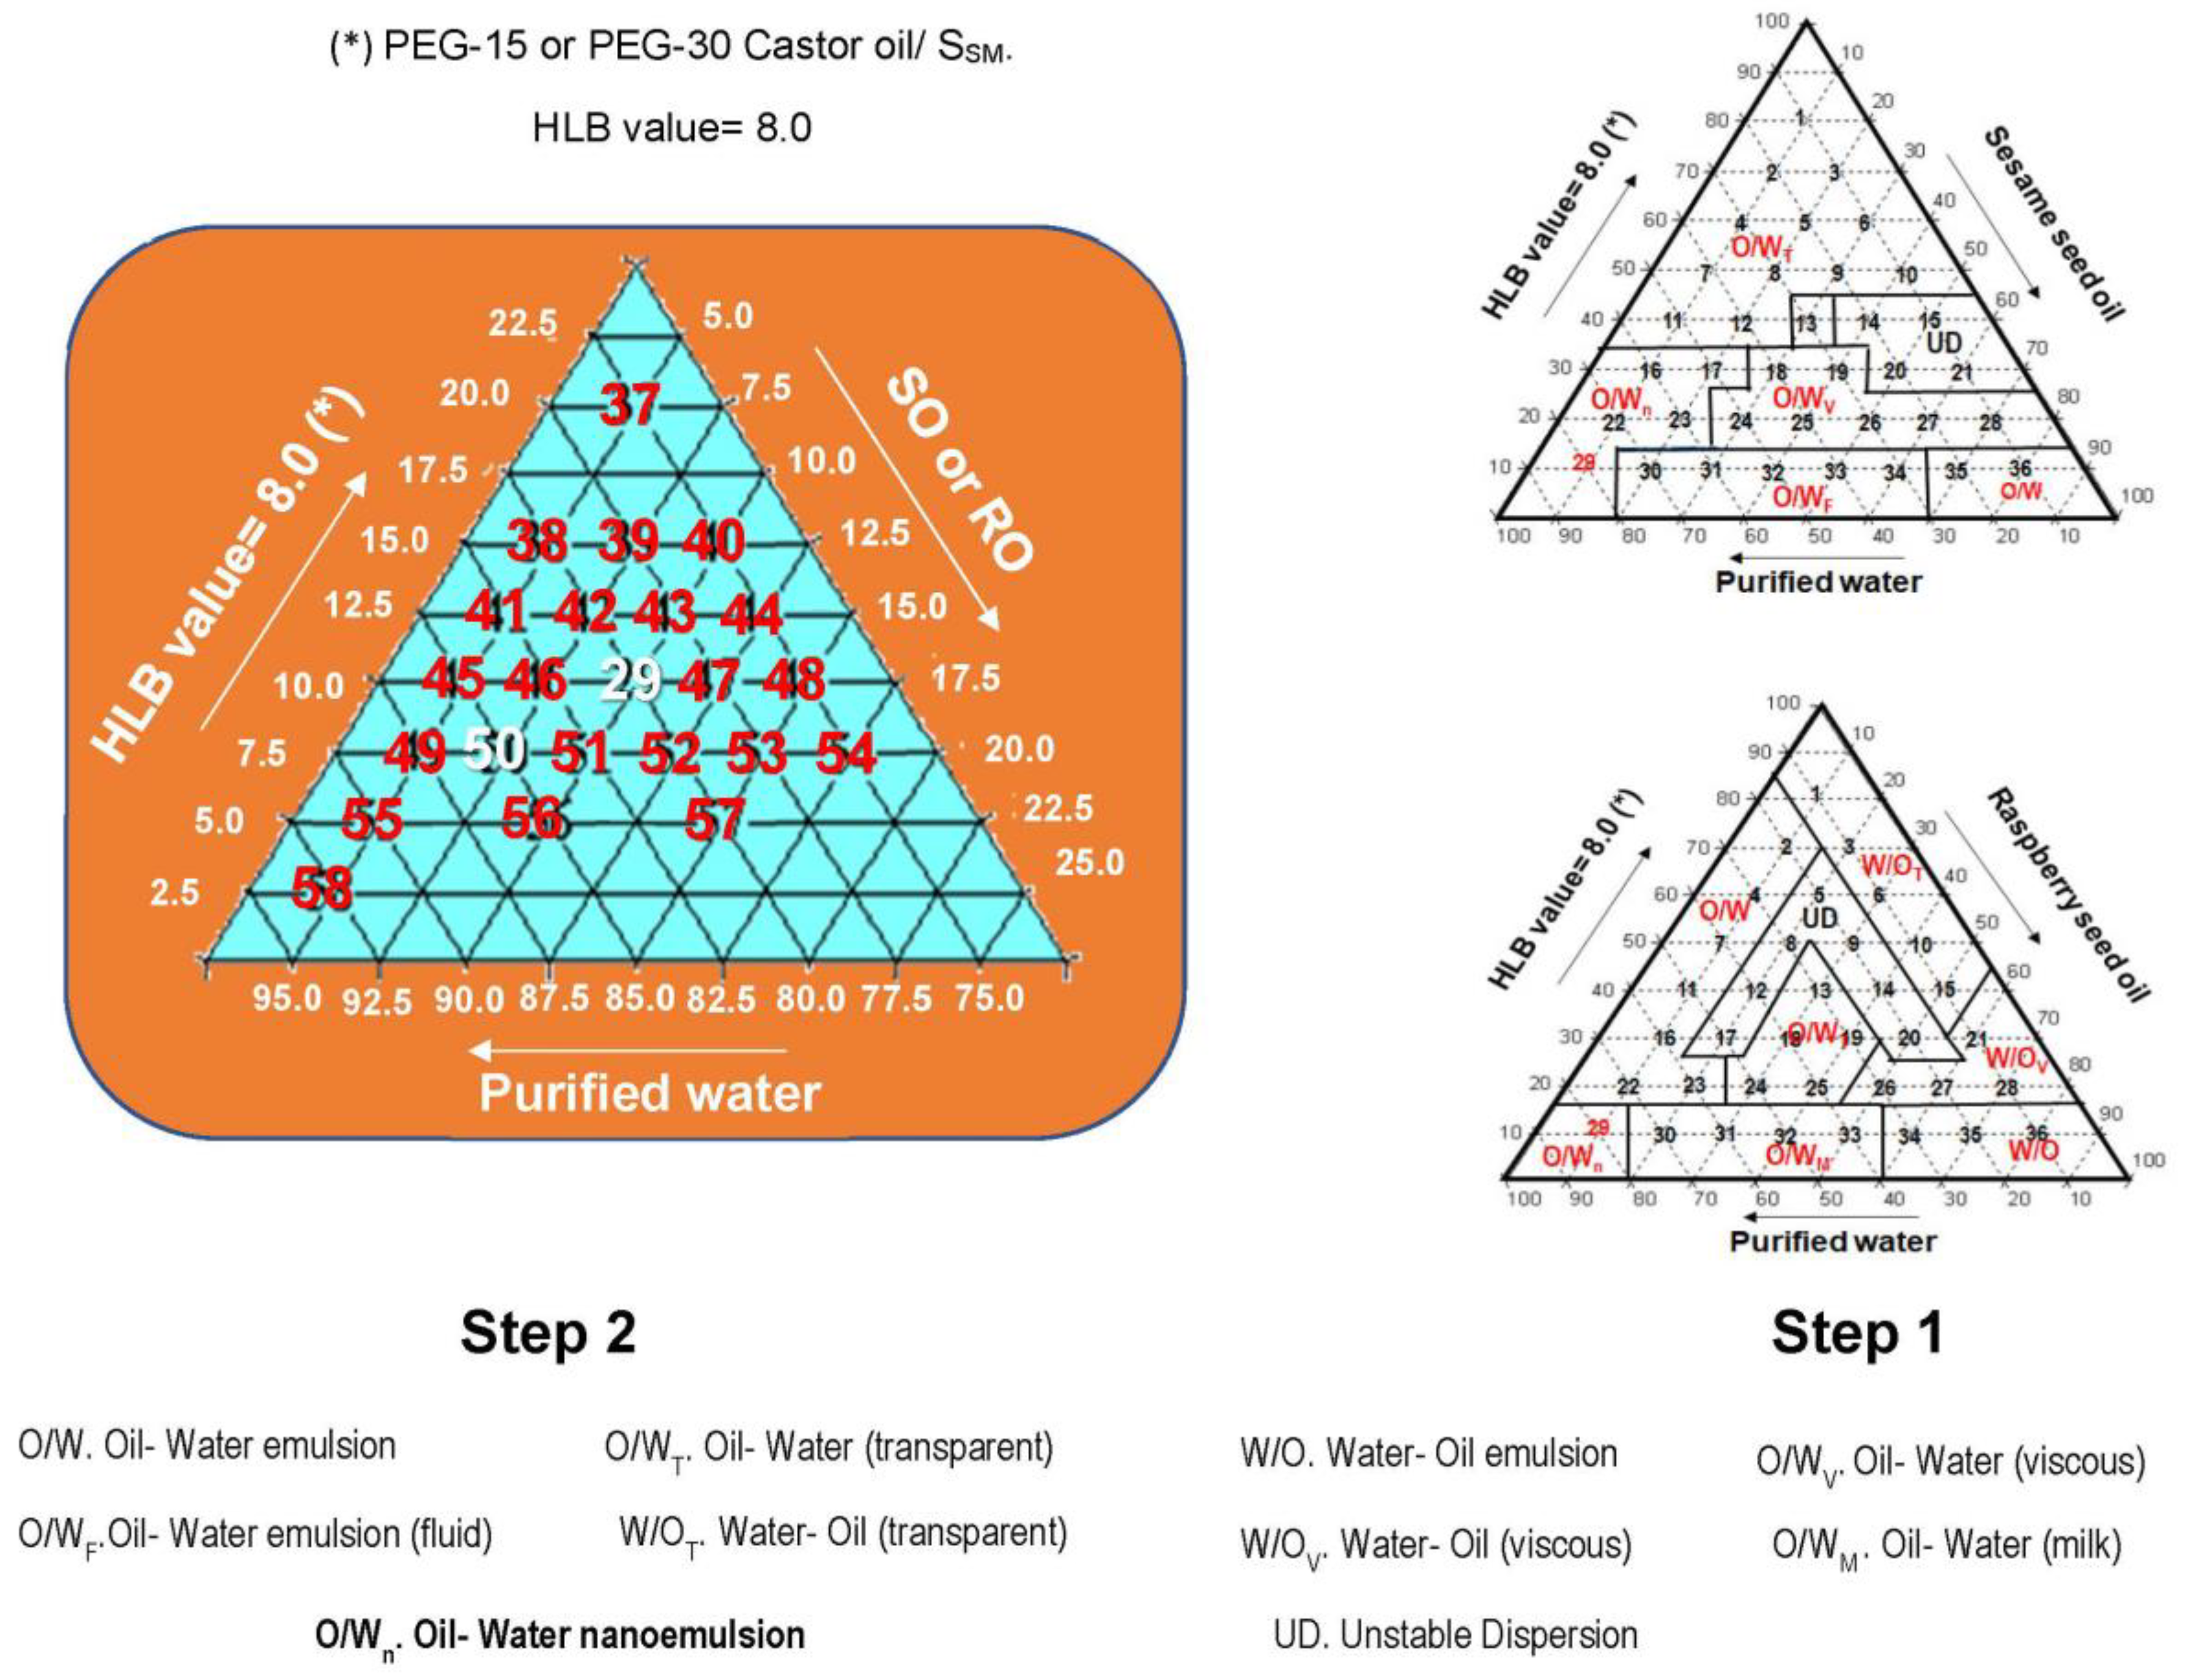
Table 2.
Determination of HLB required value for SO and RO [24].
Table 2.
Determination of HLB required value for SO and RO [24].
| Components | % w/w |
| SO or RO | 10.0 |
| SSM | A (*) |
| SP80 | B (*) |
| Purified water | 85.0 |
| (*) A+B= 5.0%. | |
Table 7.
Creaming profiles and globule size for SO emulsions (25± 2oC). .
| HLB value | Creaming profile (%) |
Globule size (nm) |
|---|---|---|
| 5.0 | 42.40± 5.41 | 662.67± 269.26 |
| 6.0 | 38.00± 7.21 | 503.67± 72.20 |
| 7.0 | 33.80± 7.50 | 653.3± 119.44 |
| 8.0 | 46.80± 31.48 | 405.00± 231.32 |
| 9.0 | 27.80± 9.44 | 466.33± 114.05 |
| 10.0 | 30.20± 12.76 | 730.00± 21.00 |
| 11.0 | 27.00± 12.47 | 729.67± 223.45 |
| 12.0 | 31.00± 13.27 | 701.67± 170.89 |
| 13.0 | 47.20± 29.64 | 496.33± 134.35 |
| 14.0 | 33.40± 8.65 | 620.33± 28.53 |
| 15.0 | 36.00± 3.67 | 427.33± 115.60 |
Table 8.
Analysis of nanoemulsions prepared with PEG- 15 castor oil and PEG- 30 castor oil/ sorbitan monooleate (at HLB= 8.0).
Table 8.
Analysis of nanoemulsions prepared with PEG- 15 castor oil and PEG- 30 castor oil/ sorbitan monooleate (at HLB= 8.0).
| Nanoemulsions |
Time | pH value | Zeta potential (mV) | Size (nm) |
|---|---|---|---|---|
| PEG-15 castor oil: SSM | 24 h | 5.75 | 31.8 | 20.0 |
| PEG- 30 Castor oil: SSM | 24 h | 6.74 | 35.5 | 226.7 |
| PEG- 30 Castor oil: SSM | 6 months | 6.03 | 49.1 | 264.0 |
Table 9.
SO nanoemulsions at HLB= 8.0 added with PEG 54 castor oil and containing or not RO.
| 29 | 50 | additives 54EO | 54EO+RO | |||||
|
Formula nr → Components (%w/w) ↓ |
29 A |
50.1 B |
50.2 C |
50.3 D |
50.3.2 E |
50.3.3 F |
50.3.4 G |
50.3.5 H |
| SO | 10.00 | 7.50 | 7.50 | 7.50 | 7.50 | 7.50 | 7.50 | 7.50 |
| RO | - | - | - | - | 5.00 | 5.00 | 7.50 | 7.50 |
| PEG-30 castor oil | 5.00 | 3.75 | 3.75 | 3.75 | 5.00 | 5.00 | 5.00 | 5.00 |
| SSM | 5.00 | 3.75 | 3.75 | 3.75 | 5.00 | 5.00 | 5.00 | 5.00 |
| PEG-54 castor oil | - | - | 1.00 | 0.50 | 0.50 | 1.00 | 1.00 | 5.00 |
| Purified water | 80.00 | 85.00 | 84.00 | 84.50 | 77.00 | 76.50 | 74.00 | 70.00 |
Table 11.
SO nanoemulsions using PEG- 30 EO and SSM (HLB= 8.0) (F.80) and (F.83) containing the additives RO and PEG- 54 castor oil.
Table 11.
SO nanoemulsions using PEG- 30 EO and SSM (HLB= 8.0) (F.80) and (F.83) containing the additives RO and PEG- 54 castor oil.
|
HLB values → Components (%w/w) ↓ |
F.80 (HLB= 8.0) |
F. 83 (HLB= 8.28) |
| SO | 7.5 | 7.5 |
| RO | 5.0 | 5.0 |
| PEG- 30 castor oil | 5.0 | 5.4 |
| SSM | 5.0 | 4.6 |
| PEG- 54 castor oil | 1.0 | 1.0 |
| Purified water | 76.5 | 76.5 |
Table 12.
Nanoemulsion A particle size (nm) prepared at different temperatures as function of time (7, 15 and 90 days).
Table 12.
Nanoemulsion A particle size (nm) prepared at different temperatures as function of time (7, 15 and 90 days).
| Time (days)→ Temperature (±2oC) ↓ |
7 | 15 | 90 |
|---|---|---|---|
| 25 | 17.0± 2.0 | 18.0± 3.3 | 52.0± 4.8 |
| 35 | 17.0± 1.8 | 18.0± 2.9 | 45.0± 3.9 |
| 45 | 17.0± 1.4 | 21.0± 2.7 | 33.0± 5.5 |
| 55 | 17.0± 1.4 | 16.0± 1.9 | 54.0± 4.4 |
| 65 | 17.0± 1.4 | 17.0± 1.4 | 46.0± 9.0 |
| 75 | 17.0± 1.4 | 17.0± 1.4 | 48.0± 7.6 |
| 85 | 15.0± 2.5 | 17.0± 1.4 | 61.0± 11.0 |
| 90 | 16.0± 1.9 | 17.0± 1.4 | 31.0± 3.8 |
Table 13.
Particle size values of SO nanoemulsions as function of different temperature conditions.
| 25± 2oC | ||||
|---|---|---|---|---|
| Days → | 1 | 7 | 15 | 30 |
| Samples ↓ | ||||
| A | 17.33±3.06 | 40.0±19.00 | 45.0±24.75 | 42.00±16.97 |
| F.80 | 88.33±11.02 | 70.0±11.00 | 71.00±19.8 | 73.50±24.75 |
| F.83 | 82.00±28.79 | 49.0±34.39 | 68.5±12.02 | 63.50±20.51 |
| E (50.3.2) | 174.00±96.23 | 79.33±43.50 | 76.00±8.49 | 58.00±5.66 |
| 4± 2oC | ||||
| A | 17.33±3.06 | 18.67±1.53 | 15.00±1.41 | 15.00±1.41 |
| F.80 | 88.33±11.02 | 124.33±89.02 | 67.00±12.73 | 77.00±22.63 |
| F.83 | 82.00±28.79 | 48.67±31.09 | 55.50±10.61 | 56.50±9.19 |
| E (50.3.2) | 174.00±96.23 | 49.33±10.79 | 61.00±0.0 | 52.00±2.83 |
| 45± 2oC | ||||
| A | 17.33±3.05 | 25.00±11.53 | 34.85± 7.81 | 49.85± 9.43 |
| F.80 | 88.33±11.01 | 67.33±17.62 | 130.00±101.82 | 154.50±68.59 |
| F.83 | 82.00±28.79 | 58.67±42.15 | 69.50±14.85 | 84.00±15.56 |
| E (50.3.2) | 174.00±96.23 | 43.67±15.31 | 79.00±25.45 | 172.00±39.60 |
Table 16.
Ostwald ripening index and Linear regression of r³ x time (days) of the nanoemulsion A and F.80.
Table 16.
Ostwald ripening index and Linear regression of r³ x time (days) of the nanoemulsion A and F.80.
| Time → | 90 | 120 | ||
|---|---|---|---|---|
| Sample A | ||||
| Temperature (±2ºC) |
ω (x10-22 m³ s-1) |
R² (linear regression) |
ω (x10-22 m³ s-1) |
R² (linear regression) |
| 35 | 0.8481 | 0.8 | - | - |
| 45 | 0.1939 | 0.9 | 4.3333 | 0.9826 |
| 55 | 0.9534 | 0.7 | 5.8333 | 0.9932 |
| 65 | 0.5776 | 0.8 | 0.6667 | 0.4286 |
| 75 | 0.6605 | 0.8 | 6.5000 | 0.4613 |
| 85 | 1.3975 | 0.8 | 1.3333 | 0.9796 |
| 90 | 0.1606 | 0.8 | 1.0667 | 0.8745 |
| Sample F.80 | ||||
| 75 | - | - | 1.3333 | 0.9796 |
| 85 | - | -5.1667 | 0.316 | |
| 90 | - | - | -7.6667 | 0.1159 |
Table 18.
Theoretical calculation of % DPPH• inhibition of formulations.
| Formulas | Oils | Oil Content (%) |
μL/mL | Inhibition (%) |
Total inhibition (%) |
|---|---|---|---|---|---|
| A | SO | 10.0 | 100.0 | 20.0 | 60.0 |
| RO | 3.0 | 30.0 | 40.0 | ||
| F.80 | SO | 7.5 | 75.0 | < 20.0 | 85.0 |
| RO | 5.0 | 5.0 | 65.0 |
Table 19.
Percentage of DPPH• inhibition by formulas A and F. 80.
| Sample | Inhibition (%) | Mean ± SD. | ||
|---|---|---|---|---|
| Control A | 34.92 | 37.79 | 39.89 | 37.53 1.44 |
| A | 65.85 | 69.66 | 70.61 | 68.71 1.45 ***£ |
| Control F.80 | 38.17 | 35.31 | 33.02 | 35.50 1.49 |
| F.80 | 67.37 | 68.51 | 67.37 | 67.75 0.38***£ |
Legend: *** statistical difference between the sample and the control (p < 0.001); £ – there is no statistical difference between the samples.
Table 20.
Percentage inhibition of DPPH• for components of nanoemulsions.
| Sample | Inhibition (%) | Mean± SD. | ||
|---|---|---|---|---|
| Control A | 34.92 | 37.79 | 39.89 | 37.53± 1.44 |
| S. A | 2.30 | 1.15 | 038 | 1.28± 0.56 |
| S. A+ BHT | 22.03 | 20.69 | 22.22 | 21.6± 0.48 |
| Control F.80 | 38.17 | 35.31 | 33.02 | 35.50± 1.49 |
| S. F.80 | 16.48 | 13.03 | 9.77 | 13.1± 1.94 |
| S.F.80+ BHT | 20.50 | 23.56 | 22.41 | 22.2± 0.89 |
| Preservative | 6.51 | 6.32 | 5.17 | 6.00± 0.42 |
Legend: S. A – S30 and S40 surfactant solution; S.A + BHT – surfactant solution S15 and S40 plus BHT; S. F.80 – surfactant solution S30, SSM and S54; T3.2 + BHT – solution of surfactants S30, SSM and S54 plus BHT.
Table 21.
Score of HET-CAM methodology for nanoemulsions.
| Formula/ MP | Time (sec.) | Score | categorie |
|---|---|---|---|
| A | 93.75 ± 6.24 | 3.0 ± 0.0 | slightly irritating |
| S. A | 99.0 ± 9.20 | 3.0 ± 0.0 | slightly irritating |
| F.80 | 122.3 ± 10.14 | 2.0 ± 1.16 | slightly irritating |
| S.F.80 | 125.0 ± 7,39 | 1.5 ± 1.0 | slightly irritating |
| A and F.80= nanoemulsions; S. A and S.F.80= respectively surfactants. | |||
Disclaimer/Publisher’s Note: The statements, opinions and data contained in all publications are solely those of the individual author(s) and contributor(s) and not of MDPI and/or the editor(s). MDPI and/or the editor(s) disclaim responsibility for any injury to people or property resulting from any ideas, methods, instructions or products referred to in the content. |
© 2024 by the authors. Licensee MDPI, Basel, Switzerland. This article is an open access article distributed under the terms and conditions of the Creative Commons Attribution (CC BY) license (http://creativecommons.org/licenses/by/4.0/).
Copyright: This open access article is published under a Creative Commons CC BY 4.0 license, which permit the free download, distribution, and reuse, provided that the author and preprint are cited in any reuse.


