
Submitted:
24 October 2024
Posted:
25 October 2024
You are already at the latest version
Abstract
The integration of advanced nuclear technologies like the System-Integrated Modular Advanced Reactor (SMART) into developing power grids presents unique opportunities for grid reliability. This network, connected to geothermal, hydro, solar, and wind power sources, comprises 220kV and 132kV transmission lines feeding 66kV, 33kV, and 11kV distribution lines to various load centers. As Kenya expands electricity access, maintaining grid stability while integrating new technologies becomes crucial for economic growth. While previous research has examined grid stability with renewable integration, the effects of advanced nuclear technologies in developing grids remain understudied. The study employs ETAP 22 simulation software to model three scenarios: a base case, compensator-only operation, and SMART-SMR integration. The analysis includes steady-state stability and reliability metrics such as SAIFI, SAIDI, CAIDI, and EENS. Results demonstrate significant improvements with SMART integration: SAIDI reduced by 2.8% to 5.0433 hours/customer-year, SAIFI improved by 5.1% to 0.0516 interruptions/customer-year, and voltage profiles stabilized between 98.21% and 98.91% of nominal. These findings highlight SMART potential to enhance grid performance in developing power systems, offering insights for policymakers towards achieving more reliable and clean energy infrastructure.
Keywords:
reliability
; load-following
; SMART
1. Introduction
Ensuring a stable, reliable, and clean energy supply is crucial for developing countries towards achieving economic and technological growth. Kenya faces the challenge of expanding and improving its power infrastructure to meet growing energy demand while ensuring grid stability and reliability. Kenya has made significant progress in recent development by doubling its electricity access rate from approximately 30% in 2013 to over 75% in 2023[1]. In this context, the integration of advanced nuclear technologies, specifically the System-Integrated Modular Advanced Reactor (SMART), presents an opportunity to further enhance grid performance and reliability. The country’s energy mix comprises geothermal, hydro, solar, and wind. The Nairobi City grid distribution network, which serves as a case study for this research is connected to these power sources through a multi-tiered system of transmission and distribution lines. The network includes 400kV, 220kV and 132kV transmission network that cover 7,676 kilometers with 66kV feeder lines and 33kV and 11kV distribution medium voltage network and ultimately 415-450V low voltage lines supplying power to various load centers, according to Kenyas Least Cost Power Development Plan (2022-2041).
Despite these developments, maintaining voltage stability and reducing failure rates remain critical challenges for Kenya’s power grid. Voltage stabilization is essential for optimal grid performance, especially as the country aims to increase its electricity access rate and support industrial growth. The integration of SMART-SMR into this existing infrastructure could potentially address these challenges. Its advanced load-following capabilities, enhanced reactive power support, and improved frequency response characteristics could contribute to more robust voltage regulation, increased frequency stability, and grid system reliability [2].However, the integration of new nuclear technologies into developing grids is not without complexities. It requires careful analysis to ensure that the addition of SMART-SMR enhances rather than compromises grid stability and reliability. This study aims to evaluate the impact of integrating 100 MW SMART reactors into Kenya’s power grid.
Using ETAP 22 simulation software, modelled various SMART integration scenarios, conducting both steady-state stability analysis and reliability assessments. The research examines voltage levels, frequency stability, and key reliability metrics such as SAIFI, SAIDI, CAIDI, and EENS. The current grid code (Transmission network) data serves as a baseline for the current grid configuration [3], while Reliability Assessment modules evaluate different integration scenarios and contingencies. The study seeks to identify the most effective strategies for incorporating SMART-SMR technology to enhance Kenya’s grid performance and reliability through this comprehensive approach. The study is limited to a specific region (Nairobi County) and may not fully represent the challenges of integration across Kenya’s entire power grid. The simulations are based on steady-state conditions and do not account for transient phenomena, which could be significant in real-world grid operations.
This research contributes to power system planning literature by integrating advanced nuclear technologies in developing power grids. The findings offer strategies for optimizing contemporary nuclear technology integration to support Kenya’s economic and developmental goals. The results of this study have implications for policymakers and stakeholders in Kenya’s energy sector, providing an understanding of strategies for achieving a stable, reliable, and clean energy supply.
The remainder of this paper is structured as follows: Section 2 provides a comprehensive literature review on distribution system reliability assessment and SMART technology. Section 3 details the methodology, including data preparation, simulation scenarios, and analysis. Section 4 presents the results of the simulations and discusses their implications. Finally, Section 5 concludes the study, summarizing key findings and offering recommendations for future research and policy considerations.
2. Literature Review
2.1. Reliability Assessment Indices and Methods
Reliability assessment of distribution systems employs various methodologies, categorized into analytical and simulation approaches. These methods are crucial for evaluating the impact of integrating advanced technologies, such as SMART-SMR into existing power grids. Analytical methods, such as the Network Equivalent Approach (NEA) utilized by [4], involve mathematical modelling of the system and the calculation of reliability indices based on component failure rates and repair times. These methods are efficient and provide deterministic results. However, they may fail to capture complex system uncertainties in real-world distribution networks, especially when considering the integration of innovative technologies like SMART reactors.
Simulation methods, equally, employ techniques like Monte Carlo simulation to model system behaviour over time. These approaches can account for the stochastic nature of component failures and repairs, providing a more realistic representation of system performance[4]. Ahmad et al. (2017) demonstrated the application of ETAP software for reliability analysis, which combines both analytical and simulation approaches[5]. This hybrid approach offers a balance between computational efficiency and the ability to model complex system dynamics, making it particularly suitable for assessing the impact of integrating advanced nuclear technologies into existing grids[5].
The choice between analytical and simulation methods often depends on the specific requirements of the analysis, the complexity of the system under study, and the available computational resources. In the context of integrating contemporary technologies, such as SMART reactors, into existing grids, the simulation method offers advantages in capturing the dynamic interactions between innovative components and the existing infrastructure. Further research in the impact of Distributed Generation (DG) on distribution system reliability using ETAP[6,7]. The study relates to the present study comparable to the SMART reactor’s integration to ensure grid stability and reliability.
2.2. Systems Reliability Indices
The concept of reliability in power distribution systems is fundamental to ensuring a consistent and dependable electricity supply. Distribution network reliability assessment employs three main concepts to evaluate grid reliability at individual load points, formulated as:
Where λi represents the load point failure rate, i and ri is the load point restoration time in minutes i.
[9–11]
Key reliability indices are calculated using the ETAP 22 simulation software by imputing the modeling data (Table 2). The primary indices utilized are formulated as;
[12]
- (i)
- System Average Interruption Frequency Index (SAIFI) measures how often the average customer experiences a sustained interruption over a year. A lower SAIFI value indicates better system reliability.
- (ii)
- System Average Interruption Duration Index (SAIDI) represents the average total duration of interruptions for a typical customer over a year. A lower SAIDI value suggests shorter average outage durations.
- (iii)
- Customer Average Interruption Duration Index (CAIDI) indicates the average time required to restore service when a sustained interruption occurs. A lower CAIDI value implies faster service restoration times.
Where Ni represents the number of customers at various load points ‘i’, and the symbol ‘Σ’ is the load points in total.
- (iv)
- Expected Energy Not Supplied (EENS) estimates the total energy not supplied to customers due to interruptions. A lower ENS value would suggest less energy loss due to outages.
where Li denoted the average load connected to load point i, and Ui is the yearly outage duration at load point i. These indices provide a quantitative basis for assessing system performance and comparing distribution networks’ reliability. System reliability hence is determined by evaluating the average energy not supplied, formulated as;
2.3. SMART Load-Following Techniques
The study focuses on the load-following capabilities of SMART within the context of its electrical output characteristics. As shown in Table 1, the SMART has a reactor thermal output of 330 MWth, which translates to a gross electrical output of 100 MWe and a net output of 90 MWe. The load-following capabilities of SMART are primarily achieved through its electrical systems, particularly the turbine-generator set. The generator, rated at 111 MVA with an active power output of 105 MW and a voltage of 18.0 kV, plays a crucial role in this process. The turbine, operating at 1800 rpm and 60 Hz, allows for rapid adjustments in electrical output to meet grid demands.
While the reactor thermal output remains constant at 330 MWth, the SMART-SMR can adjust its electrical power output to provide flexibility for grid reliability. The plant’s high availability target of > 95% indicates its reliability in maintaining a consistent power supply.[13,14]

Table 1.
SMART-SMR Electrical Parameters.
| Parameter | Value | Unit |
|---|---|---|
| Reactor thermal output | 330 | MWth |
| Power plant output, gross | 100 | MWe |
| Power plant output, net | 90 | MWe |
| Power plant efficiency, net | 30.3 | % |
| Generator rated power | 111 | MVA |
| Generator active power | 105 | MW |
| Generator voltage | 18.0 | kV |
| Generator frequency | 60 | Hz |
| Turbine speed | 1800 | rpm |
| HP turbine inlet pressure | 5.2 | MPa(a) |
| HP turbine inlet temperature | 296.4 | °C |
| Main steam pressure (nominal) | 5.2 | MPa |
| Main steam temperature (nominal) | 296 | °C |
| Feedwater temperature | 200 | °C |
| Plant availability target | > 95 | % |
| Electrical system configuration | Two train approach | - |
| Backup power | Diesel generators and batteries | - |
| Load-following capability | Yes | - |
| Seismic design (SSE) | 0.3 | g |
The implementation of advanced control algorithms in SMART electrical systems, including the turbine governor and generator excitation system, allows for precise control of electrical output. These systems work in tandem to manage the conversion of the constant thermal energy into variable electrical output as required by grid conditions.
[15,16] The contribution of SMART-SMR reactors to grid stability is characterized by inertial response, which is typically modelled using the swing equation:
Where H is the inertia constant, usually ranging between 5-7 seconds for SMRs. Ω is the angular velocity of the rotor, t defines time, Pm is the generator’s mechanical power input, while Pe denotes the generator’s electrical power. The inertial response is crucial for maintaining grid frequency stability during sudden load changes [17].
Primary frequency control in SMART-SMR follows the relationship; ΔP = -K * Δf, Where K is the governor gain, typically ranging from 20-25. Allowing a 5% power change (P) for every 0.1 Hz frequency deviation, providing rapid response to grid frequency fluctuations. SMART reactors also offer dynamic reactive power support, enhancing voltage stability. The reactive power capability is expressed as:
Where S is the apparent power (111 MVA for SMART) and P is the active power. As the SMART reactor increases its active power output (P), its available reactive power (Q) decreases, and vice versa (Figure 2). At maximum active power output, the reactor has minimal reactive power capability. When producing no active power, the reactor can provide maximum reactive power since the reactor can operate in both over-exited and under-exited generators as demonstrated in the power quadrant below;
Figure 1.
Power Quadrant.
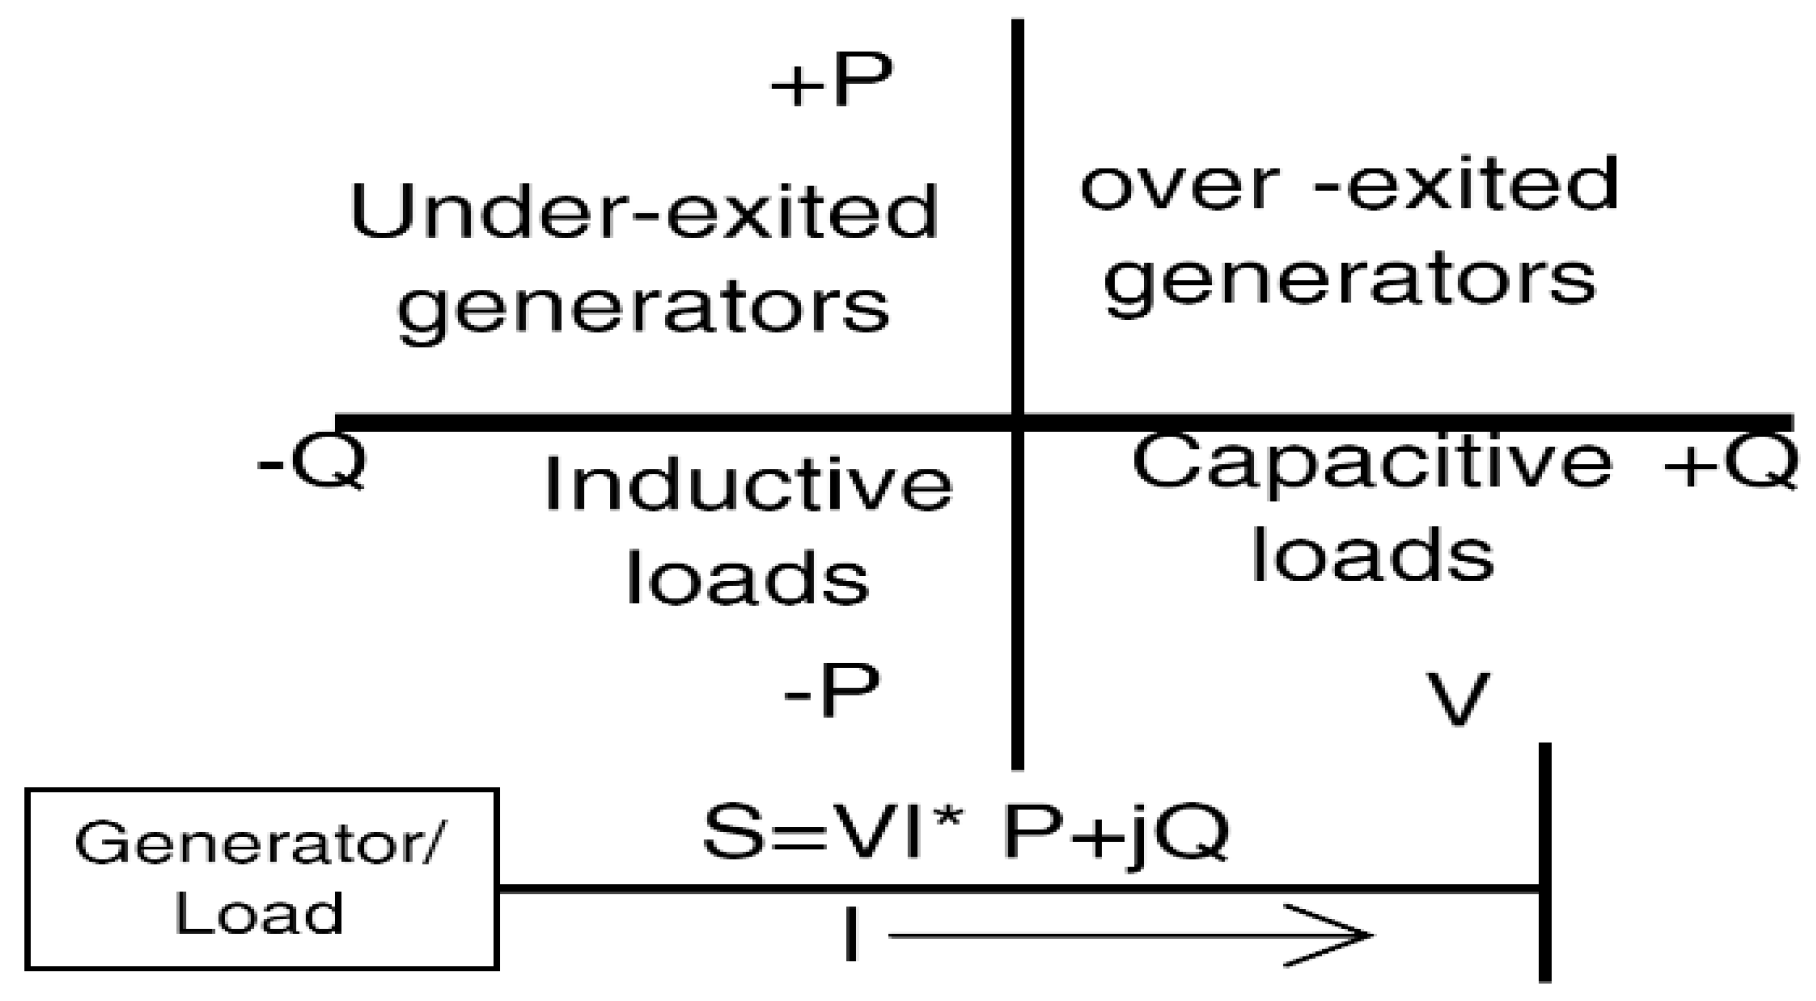
Figure 2.
Conceptual framework for the study.
The SMART reactor can operate in both the "Over-excited Generators" and "Under-excited Generators" quadrants. In the over-excited state, it produces positive reactive power (+Q), helping to raise system voltage. In the under-excited state, it absorbs reactive power (-Q), helping to lower system voltage. This capability allows SMART reactors to contribute significantly to voltage regulation in the grid [17].
3. Methodology
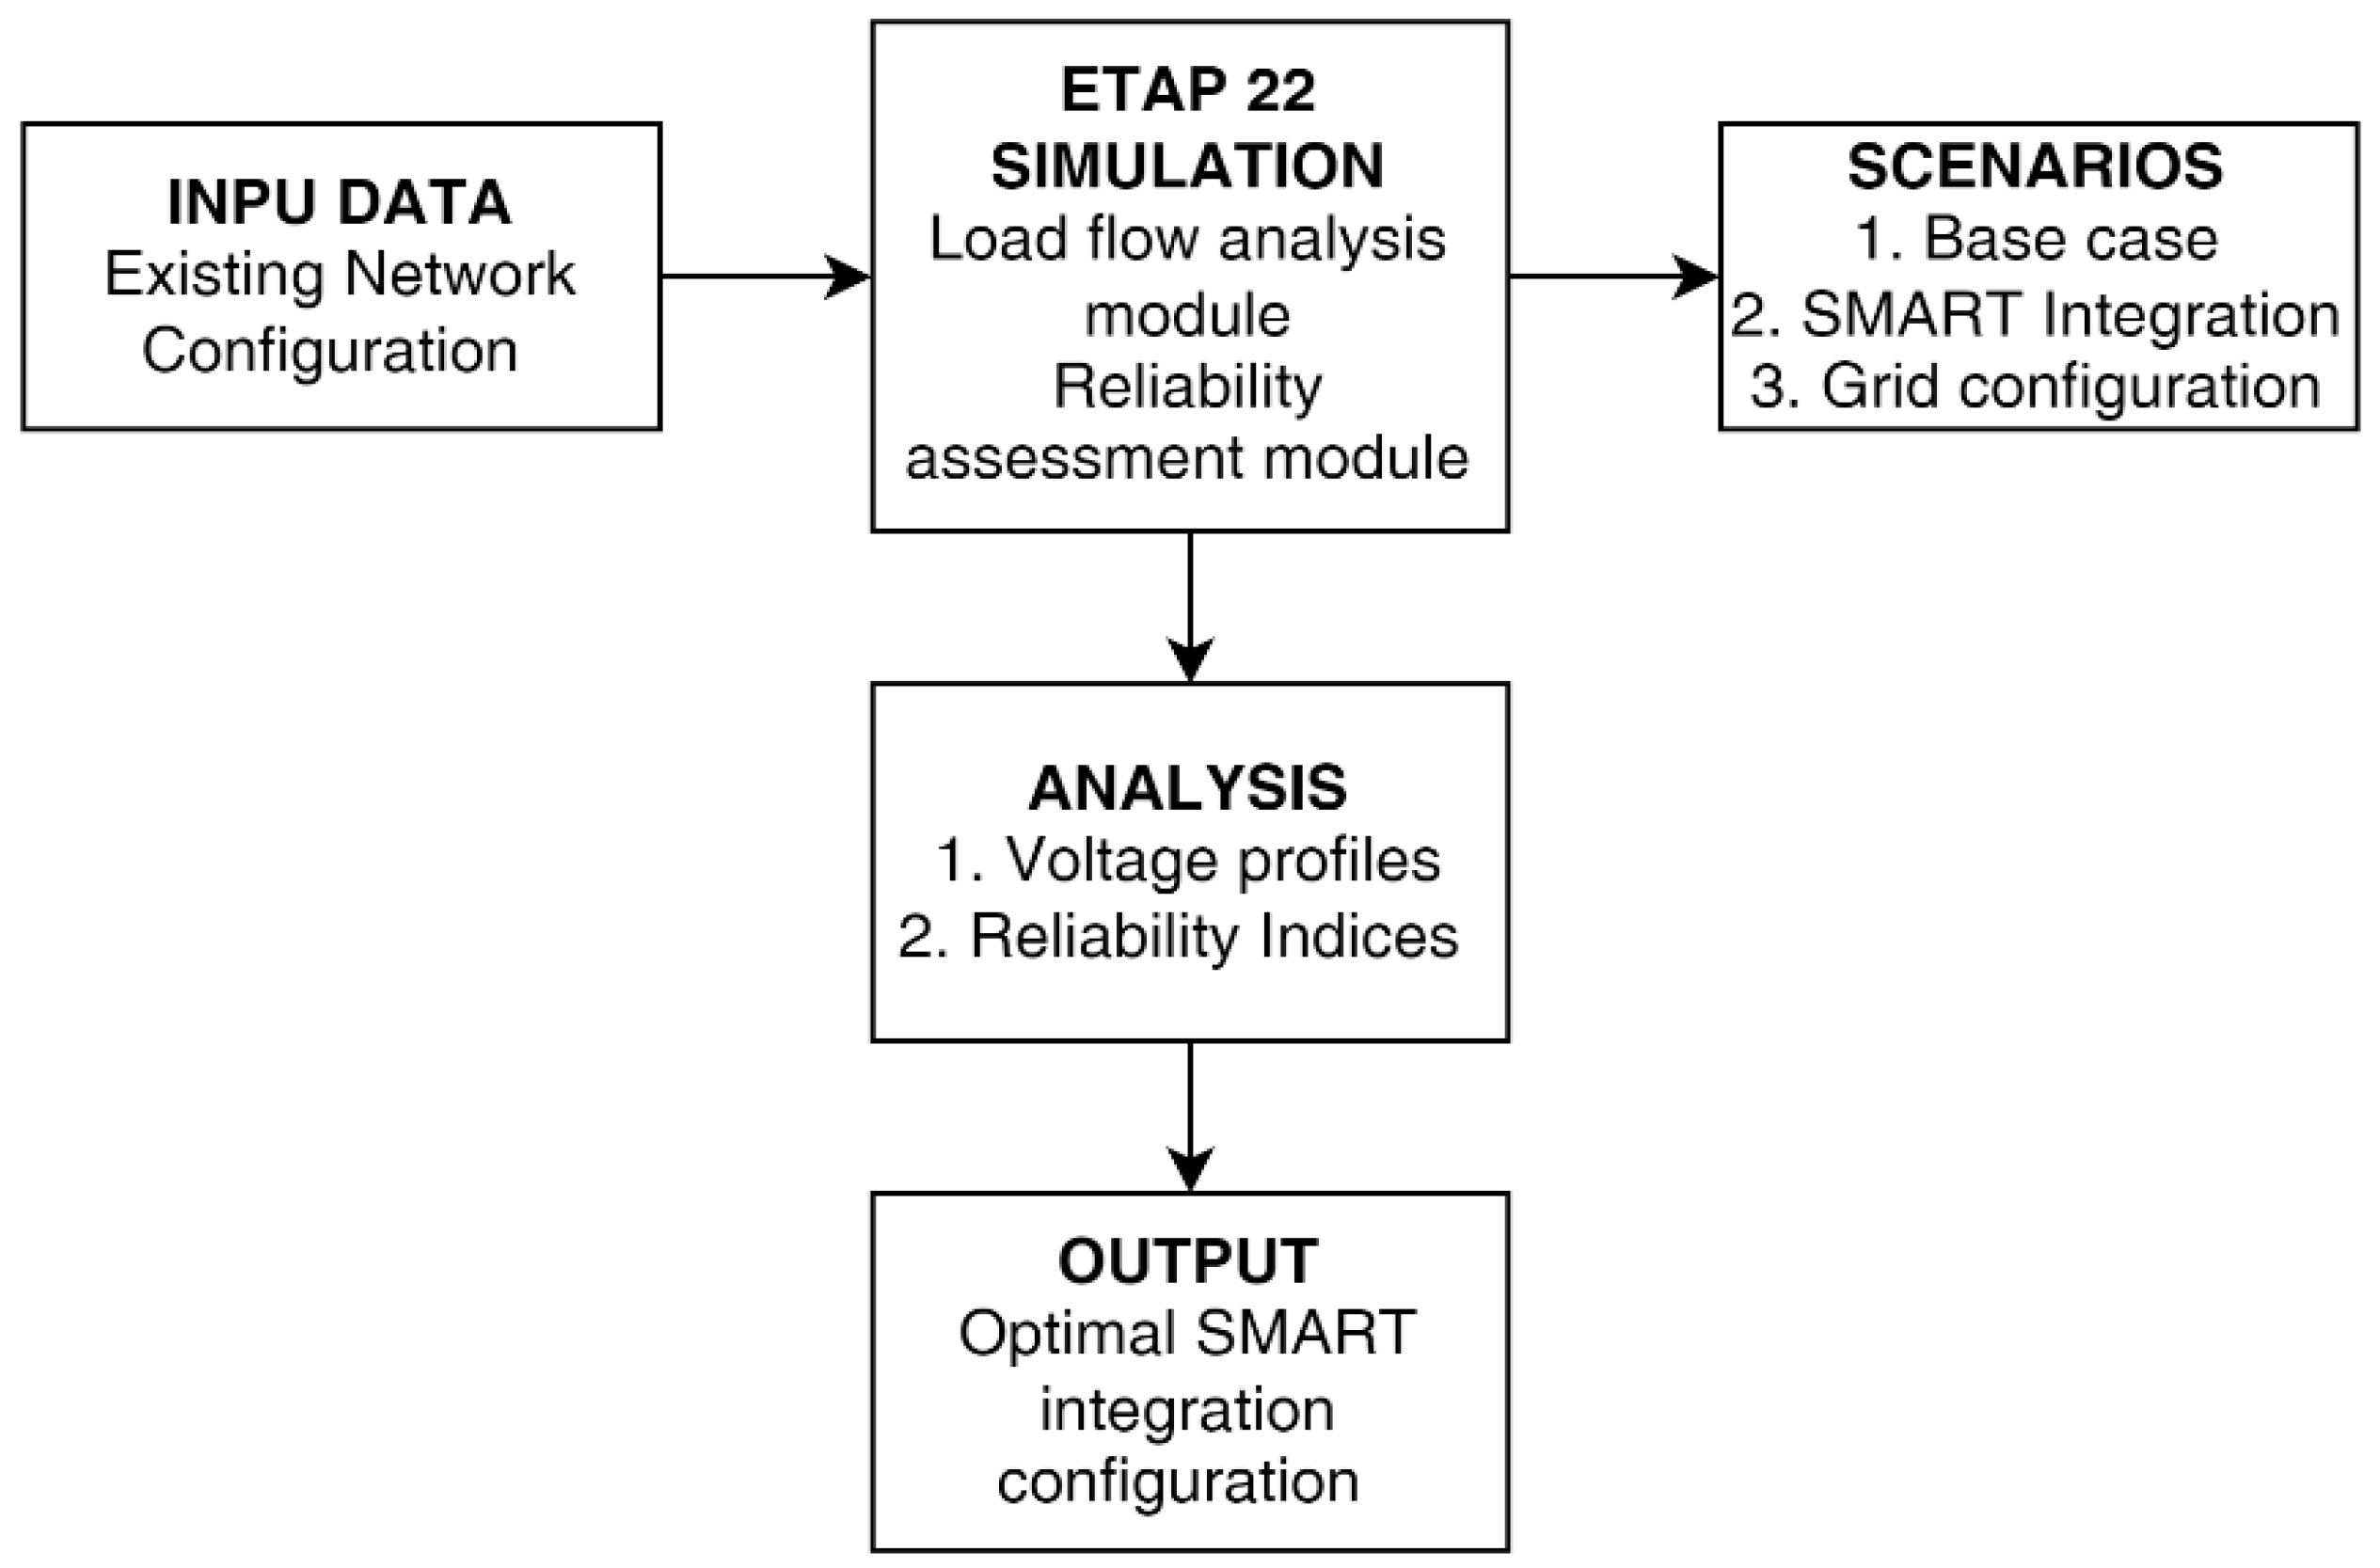
The study process involves three main phases: data preparation, ETAP simulation, and comparative analysis. The input data, including the buses, load centers, transformers and failure rates, [18] consists of historical network performance data from 2019-2023, focusing on load profiles, failure rates, and repair times [18]. The simulation phase creates detailed models of the existing network and proposed SMART integration scenarios. Load Flow Analysis module for steady-state stability assessment and Reliability Assessment module for calculating reliability indices are simulated. The comparative analysis phase evaluates the scenarios based on key performance indicators, including voltage profiles, frequency stability metrics, and reliability indices as shown in Figure 3.
3.1. System Scenario Modelling
The network topology and component specifications modelled are sourced from the latest grid expansion plans and KPLC’s asset management system. Specific reliability parameters were collected for key system components: transformers (7 units, 2-winding type) with active failure rates of 0.015 f/yr and mean time to repair (MTTR) of 200 hours; circuit breakers (34 units, both HV and LV types) with active failure rates of 0.004500 f/yr and MTTR of 50 hours; and generators, including the SMART reactor (modelled as a synchronous generator with a failure rate of 0.000000 f/yr), Olkaria II (failure rate 0.990 f/yr), and the grid interconnection point (U6 Compensator, failure rate 0.743 f/yr). The data from the Nairobi County distribution grid [18] is used to create a detailed model of the existing 132kV, 66kV, and 33kV networks, focusing on the critical load points in Nairobi County (Table 2). The model incorporates 15 buses with varying failure rates (ranging from 0.001100 to 0.011000 f/yr) and MTTRs of 2 hours, 7 transformers, and 15 lumped loads representing various sectors (commercial, industrial, residential, and governmental) with failure rates ranging from 0.005800 to 0.099000 f/yr and replacement times of 50 hours. The data enabled the simulation of the network’s response under various operational scenarios.
Table 2.
Modelling Data Summary.
| Component Type | Quantity | Specifications | Failure Rate (f/yr) |
|---|---|---|---|
| Buses | 15 | 132kV, 66kV, 33kV | Varies (0.001100 - 0.011000) |
| Transformers | 7 | 2-winding type | 0.015000 |
| Circuit Breakers | 34 | HV and LV types | 0.004500 |
| Lumped Loads | 14 | Various sectors | Varies (0.005800 - 0.099000) |
| Generators | 4 | - | - |
| *SMART Reactor | 1 | Synchronous (95 MW) | 0.000000 |
| *Olkaria II GT | 1 | Synchronous (126.255 MW) | 0.990000 |
| *U6 Compensator (Grid) | 1 | Power Grid (50 MVA) | 0.743000 |
| *Ngong WTG | 1 | Wind Turbine (25.5 MW) | 0.199000 |
3.2. Modelling Assumptions
The distribution network model selected key areas rather than the entire county, utilizing a simplified representation of the 132kV, 66kV, and 33kV Nairobi County distribution grid single line diagram (Figure 4). The model assumes only AC systems, with all switching devices operating typically as required and capable of isolating faults to restore power to load points through appropriate switching actions and available alternative supplies. All failures are treated as statistically independent, with the possibility of considering second-order faults. The analysis is limited to steady-state conditions and does not account for transient phenomena. The simulation employs IEEE Standard 1366-2012 for calculating key reliability indices and analytical methods based on the minimal cut set approach for system reliability analysis, adhering to IEEE 493 standards. Load flow calculations follow IEC 60909 standards [19].
3.3. Scenarios Modelled
- (a)
- Base case: No SMART-SMR Unit
The base case scenario models the existing distribution system without the proposed SMART reactor, represented by an open high-voltage circuit breaker. Power is supplied from three primary sources which include the Olkaria II geothermal plant (126.255 MW), a compensator network (50 MVAr grid connection), and the Ngong WTG (25.5 MW wind turbine) as shown in Figure 5. This configuration incorporates a mix of conventional and renewable energy sources, establishing a baseline for evaluating the potential impact of integrating the SMART reactor. The model assumes constant load demands at the buses during peak hours to facilitate effective calculation of system indices.
- (b)
- Scenario2: Wind and Compensator providing power
In this scenario, the distribution grid operates solely with the Ngong Wind Turbine Generator (WTG) and the compensator providing power from the grid. The model shows the Ngong WTG and the U6(Compensator). The circuit breaker connecting the Olkaria II GT is open, indicating its exclusion from this scenario. The SMART-SMR unit is also disconnected with the open high-voltage circuit breaker (Figure 6). This configuration aims to evaluate the grid’s performance and stability when relying primarily on wind power and grid compensation, without the geothermal source or the proposed SMART-SMR. The scenario helps determine the level of compensating power required from the grid to adequately meet the energy demand across various load centres, particularly during periods of variable wind generation [20].
- (c)
- Scenarion3: SMART-SMR Integration with existing power sources
Figure 5.
Scenarion 2 Modelling.
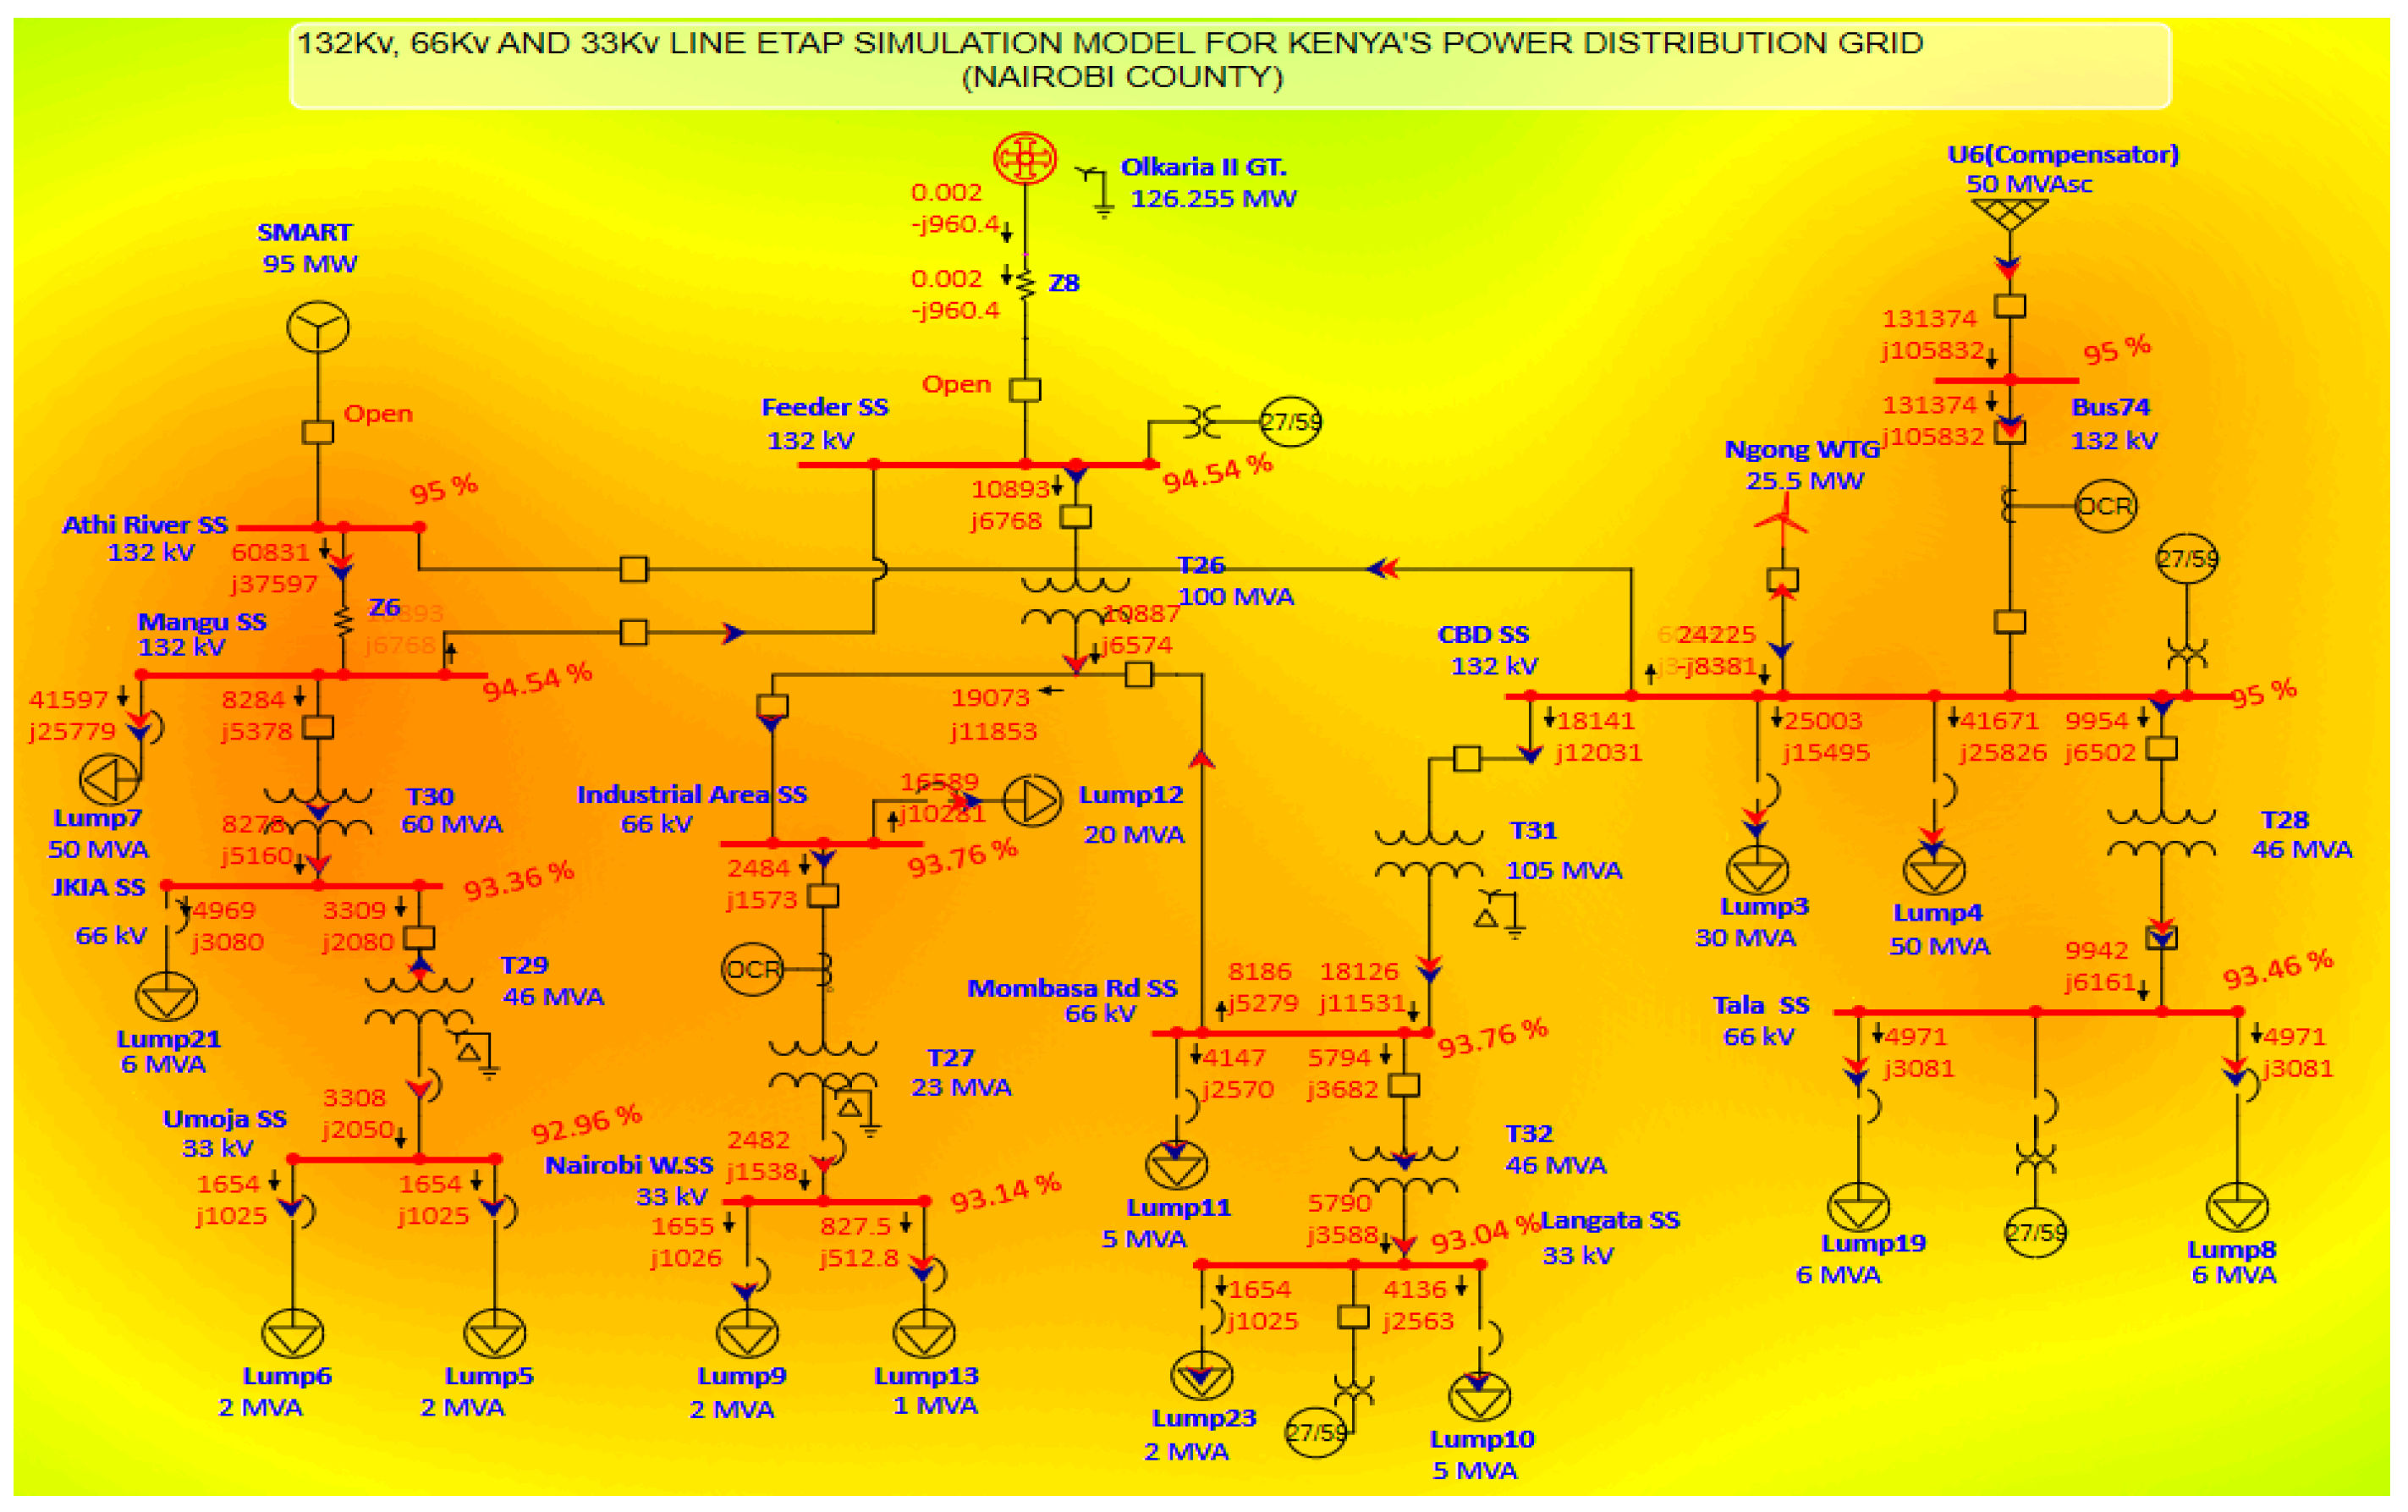
Figure 6.
key reliability indices comparison.
The scenario models the integration of the SMART-SMR unit into the power distribution grid. In this configuration, the SMART-SMR is connected and actively supplying power to the network. The circuit breaker connecting it to the main grid is closed, indicating its full integration. This scenario also includes power generation from the Olkaria II GT geothermal plant and the Ngong WTG, creating a diverse energy mix. The U6 Compensator also remains connected to provide voltage support/regulation (Figure 8). This setup demonstrates a comprehensive approach to power generation, combining nuclear, geothermal, and wind resources to meet the electricity demand. The simulation, therefore allows for analysis of how the SMART-SMR affects overall grid stability, power flow, and voltage profiles across the various substations and load points in the 132kV, 66kV, and 33kV networks.
Figure 7.
Scenario 3 with SMART-SMR Modelling.
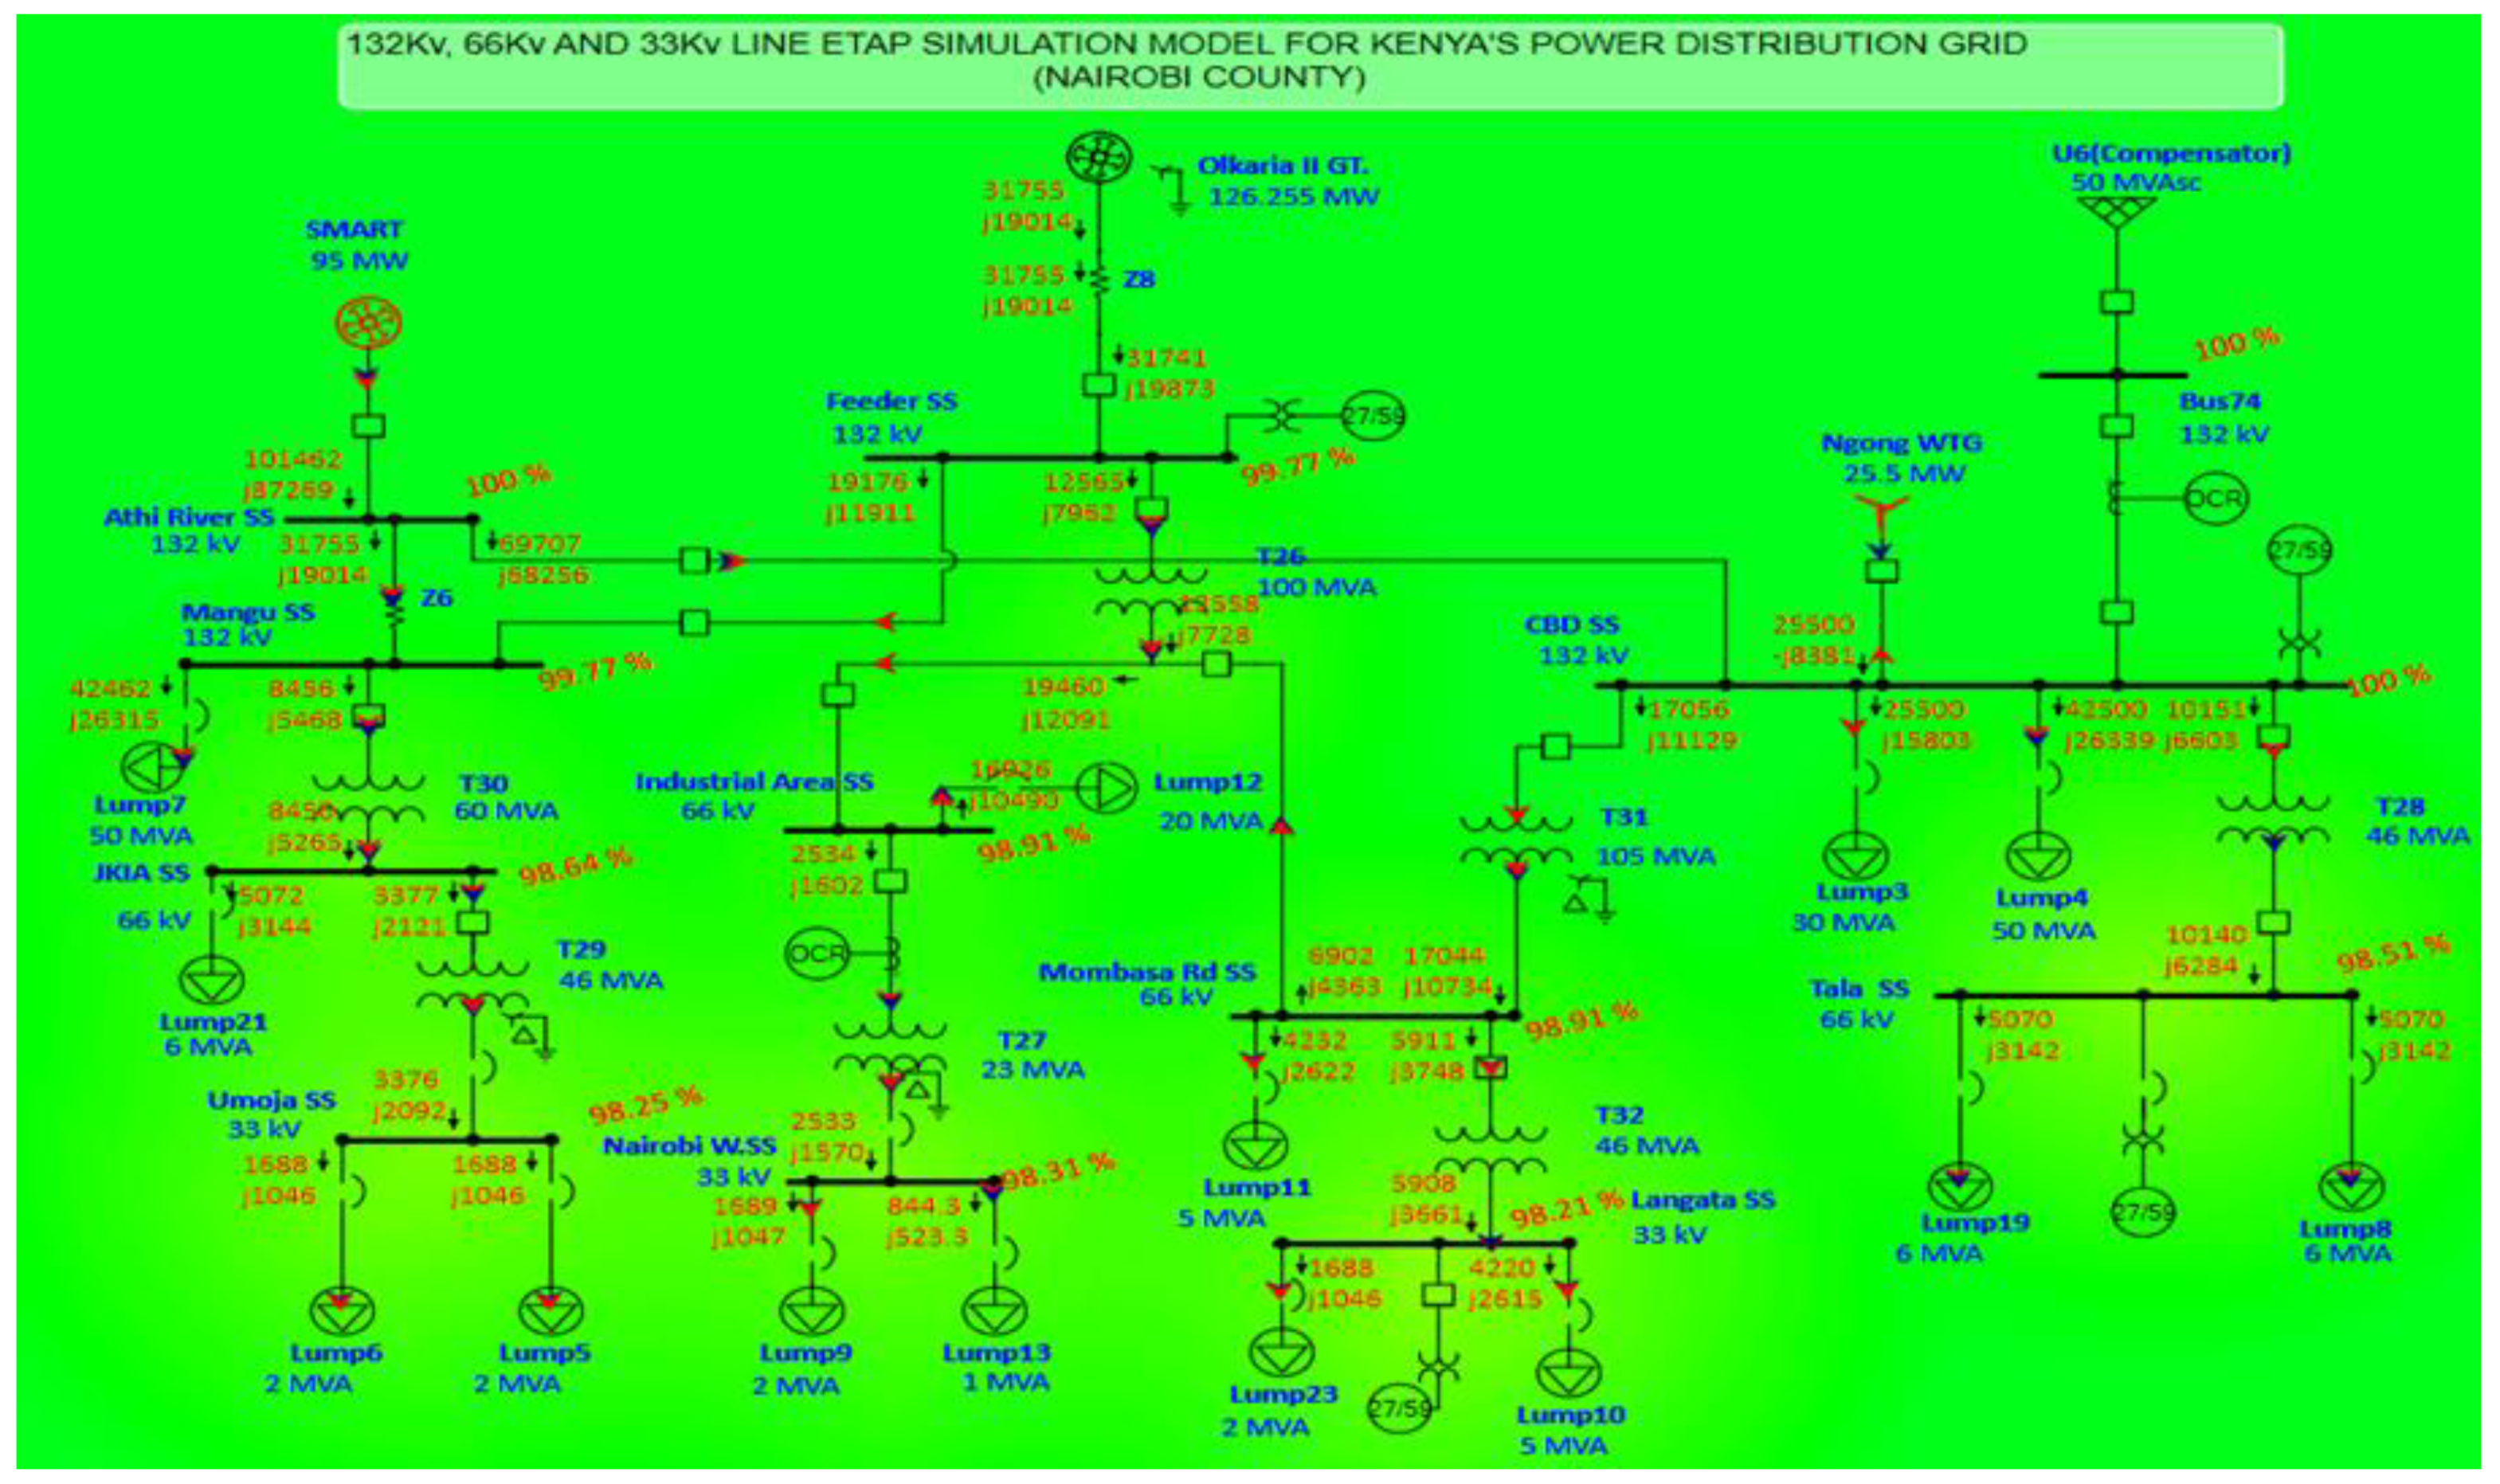
Figure 8.
Power factor results.
3.4. Network Configuration with Protection Devices
The key protection devices used in the simulation include 33 circuit breakers with a typical failure rate of 0.004500 f/yr and MTTR of 50 hours. Seven transformers (T26-T32) with failure rates of 0.015000 f/yr were also configured as per the Kenyas grid code.
4. Results and Discussion
4.1. Comparative Analysis of Scenarios
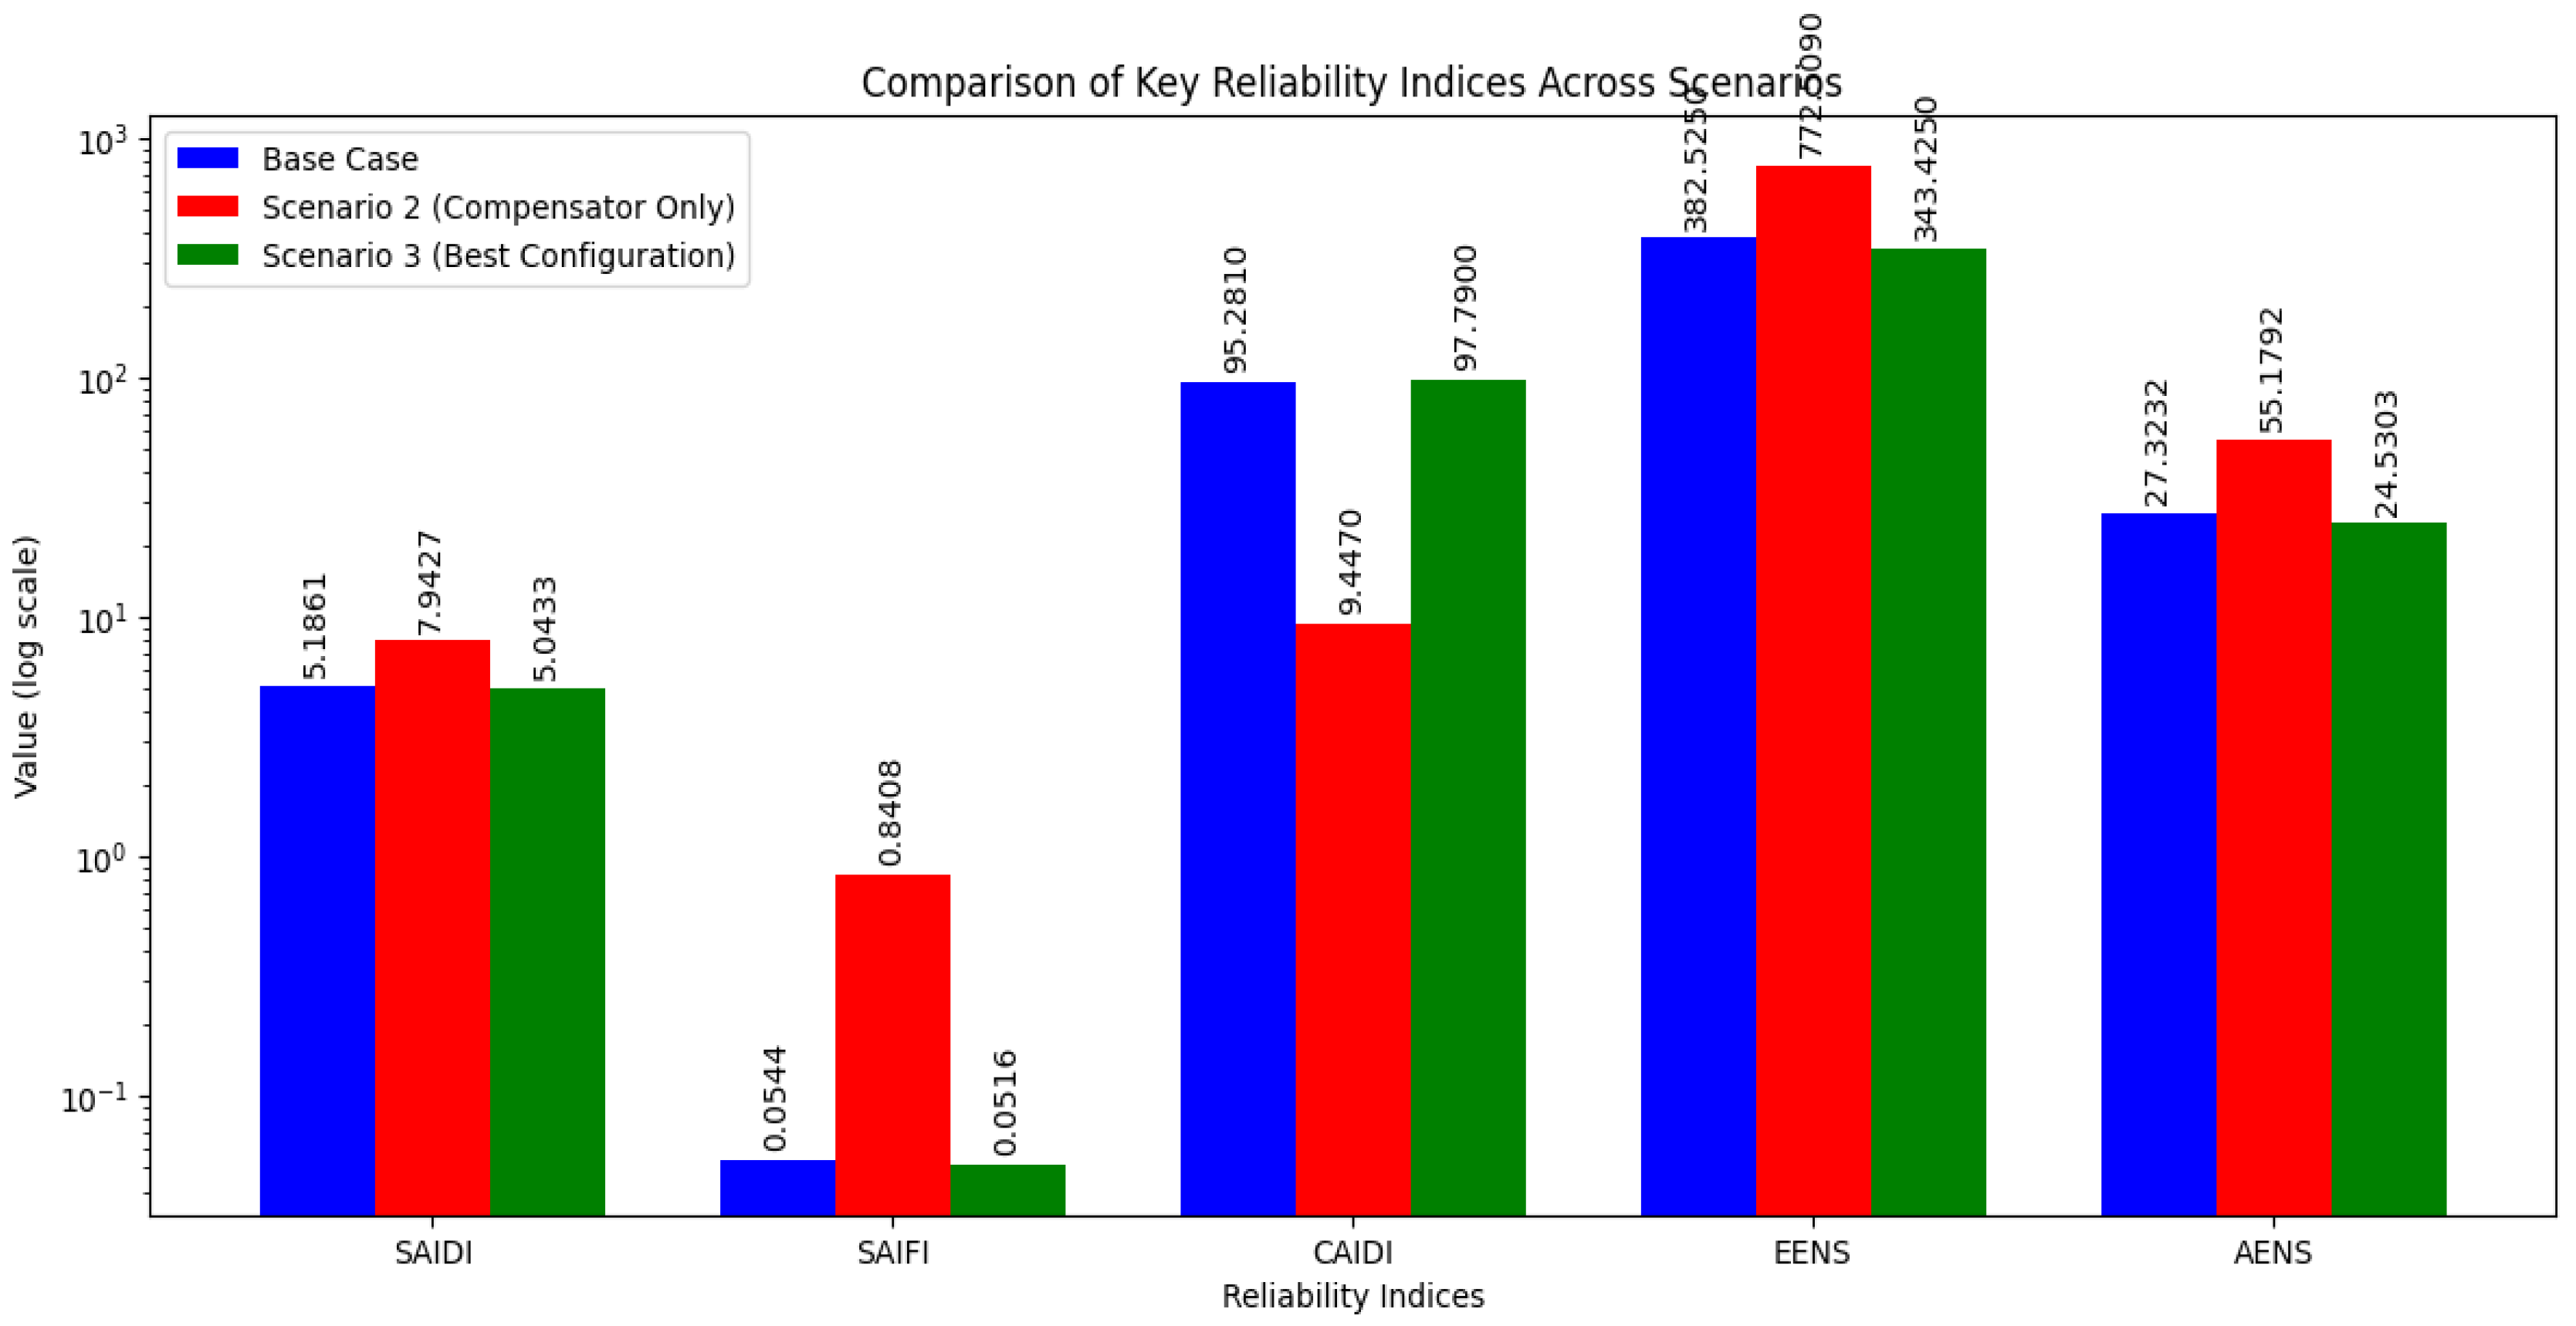
The reliability assessment of the simulated distribution network reveals significant variations across three scenarios: the base case (Scenario 1), compensator-only operation (Scenario 2), and SMART-SMR integration (Scenario 3). Scenario 3 demonstrates greater performance across all key reliability indices, as illustrated in Figure 1.
The optimized configuration in Scenario 3 achieves a SAIDI of 5.0433 hours/customer-year and SAIFI of 0.0516 interruptions/customer-year, representing improvements of 2.8% and 5.1% respectively over the base case, and 36.5% and 93.9% improvements over Scenario 2. This configuration also achieves the lowest Expected Energy Not Supplied (EENS) at 343.425 MWh/year, a 10.2% reduction from the base case and a 55.5% reduction from Scenario 2. The Average Energy Not Supplied (AENS) is optimized at 24.5303 MWh/customer-year, showing similar improvements. The high ASAI of 0.9994 (equivalent to 99.94% availability) in Scenario 3 outperforms Scenario 2, further underscoring the enhanced reliability of this optimized setup.
Scenario 3, as shown in Figure 8 and quantified in Table 3, demonstrates significant improvements in voltage profiles across the distribution network following SMART integration. The simulation results reveal that bus voltages consistently operate near their nominal values, indicating enhanced power quality throughout the system. Table 3 shows that the Industrial Area SS voltage improved to 98.84% of nominal, up from a base case of 93.76% (Figure 6). Similarly, Mombasa Rd SS operates at 98.91% of nominal voltage, while Langata SS, despite being on the lower 33 kV system, maintains 98.21% of nominal voltage. These results, spanning different voltage levels (66 kV for Industrial Area and Mombasa Rd SS, 33 kV for Langata SS), illustrate a narrow operational range of 98.21% to 98.91% of nominal voltages across the network. This consistency in high voltage levels across various substation categories suggests that SMART integration has a uniformly positive impact on voltage regulation throughout the network.
These improvements suggest reduced system stress and more efficient power distribution. Scenario 2 exhibits noticeably degraded performance across all metrics. Its SAIDI of 7.9427 hours/customer-year and SAIFI of 0.8408 interruptions/customer-year represent increases of 53.2% and 1445.6% respectively compared to the base case. The EENS in this scenario escalates to 772.509 MWh/year, a 102% increase from the base case, while the AENS reaches 55.1792 MWh/customer/year. The lower ASAI of 0.9991 further indicates reduced overall system reliability.
Table 4.
Modelled Reliability Indices Results.
| Index | Base Case | Scenario 2 (Compensator Only) | Scenario 3 (Best Configuration) |
|---|---|---|---|
| SAIDI | 5.1861 | 7.9427 | 5.0433 |
| SAIFI | 0.0544 | 0.8408 | 0.0516 |
| CAIDI | 95.281 | 9.447 | 97.790 |
| ASAI | 0.9994 | 0.9991 | 0.9994 |
| EENS | 382.525 | 772.509 | 343.425 |
| AENS | 27.3232 | 55.1792 | 24.5303 |
| IEAR | 7.918 | 8.116 | 7.797 |
The results (Table 3), hence demonstrate that relying solely on a compensator-based power supply significantly compromises the grid’s reliability. The contrast between Scenarios 2 and 3 highlights the critical importance of maintaining a diverse and well-integrated power generation mix in ensuring grid reliability.
4.2. Reliability Enhancement
The integration of SMART technology (Scenario 3) significantly improves substation reliability across all voltage levels compared to the Base Case (Scenario 1) and Compensator Only (Scenario 2) configurations. High voltage substations (132kV) show the most substantial improvements, with failure rates decreasing from 0.032400 f/yr to 0.002410 f/yr for CBD SS and from 0.017500 f/yr to 0.000540 f/yr for Mangu SS. Medium voltage substations (66kV) also exhibit marked improvements, with JKIA SS’s failure rate reducing from 0.044200 f/yr to 0.007200 f/yr and Mombasa Rd SS from 0.030100 f/yr to 0.001100 f/yr. Low voltage substations (33kV) show similar enhancements, with Umoja SS’s failure rate decreasing from 0.079510 f/yr to 0.002510 f/yr (Table 5). These improvements are attributed to the SMART advanced control systems, load-following capabilities, and ability to provide reactive power support, which enhances grid power quality while reducing stress on substation equipment.
4.3. Impact of SMART Integration
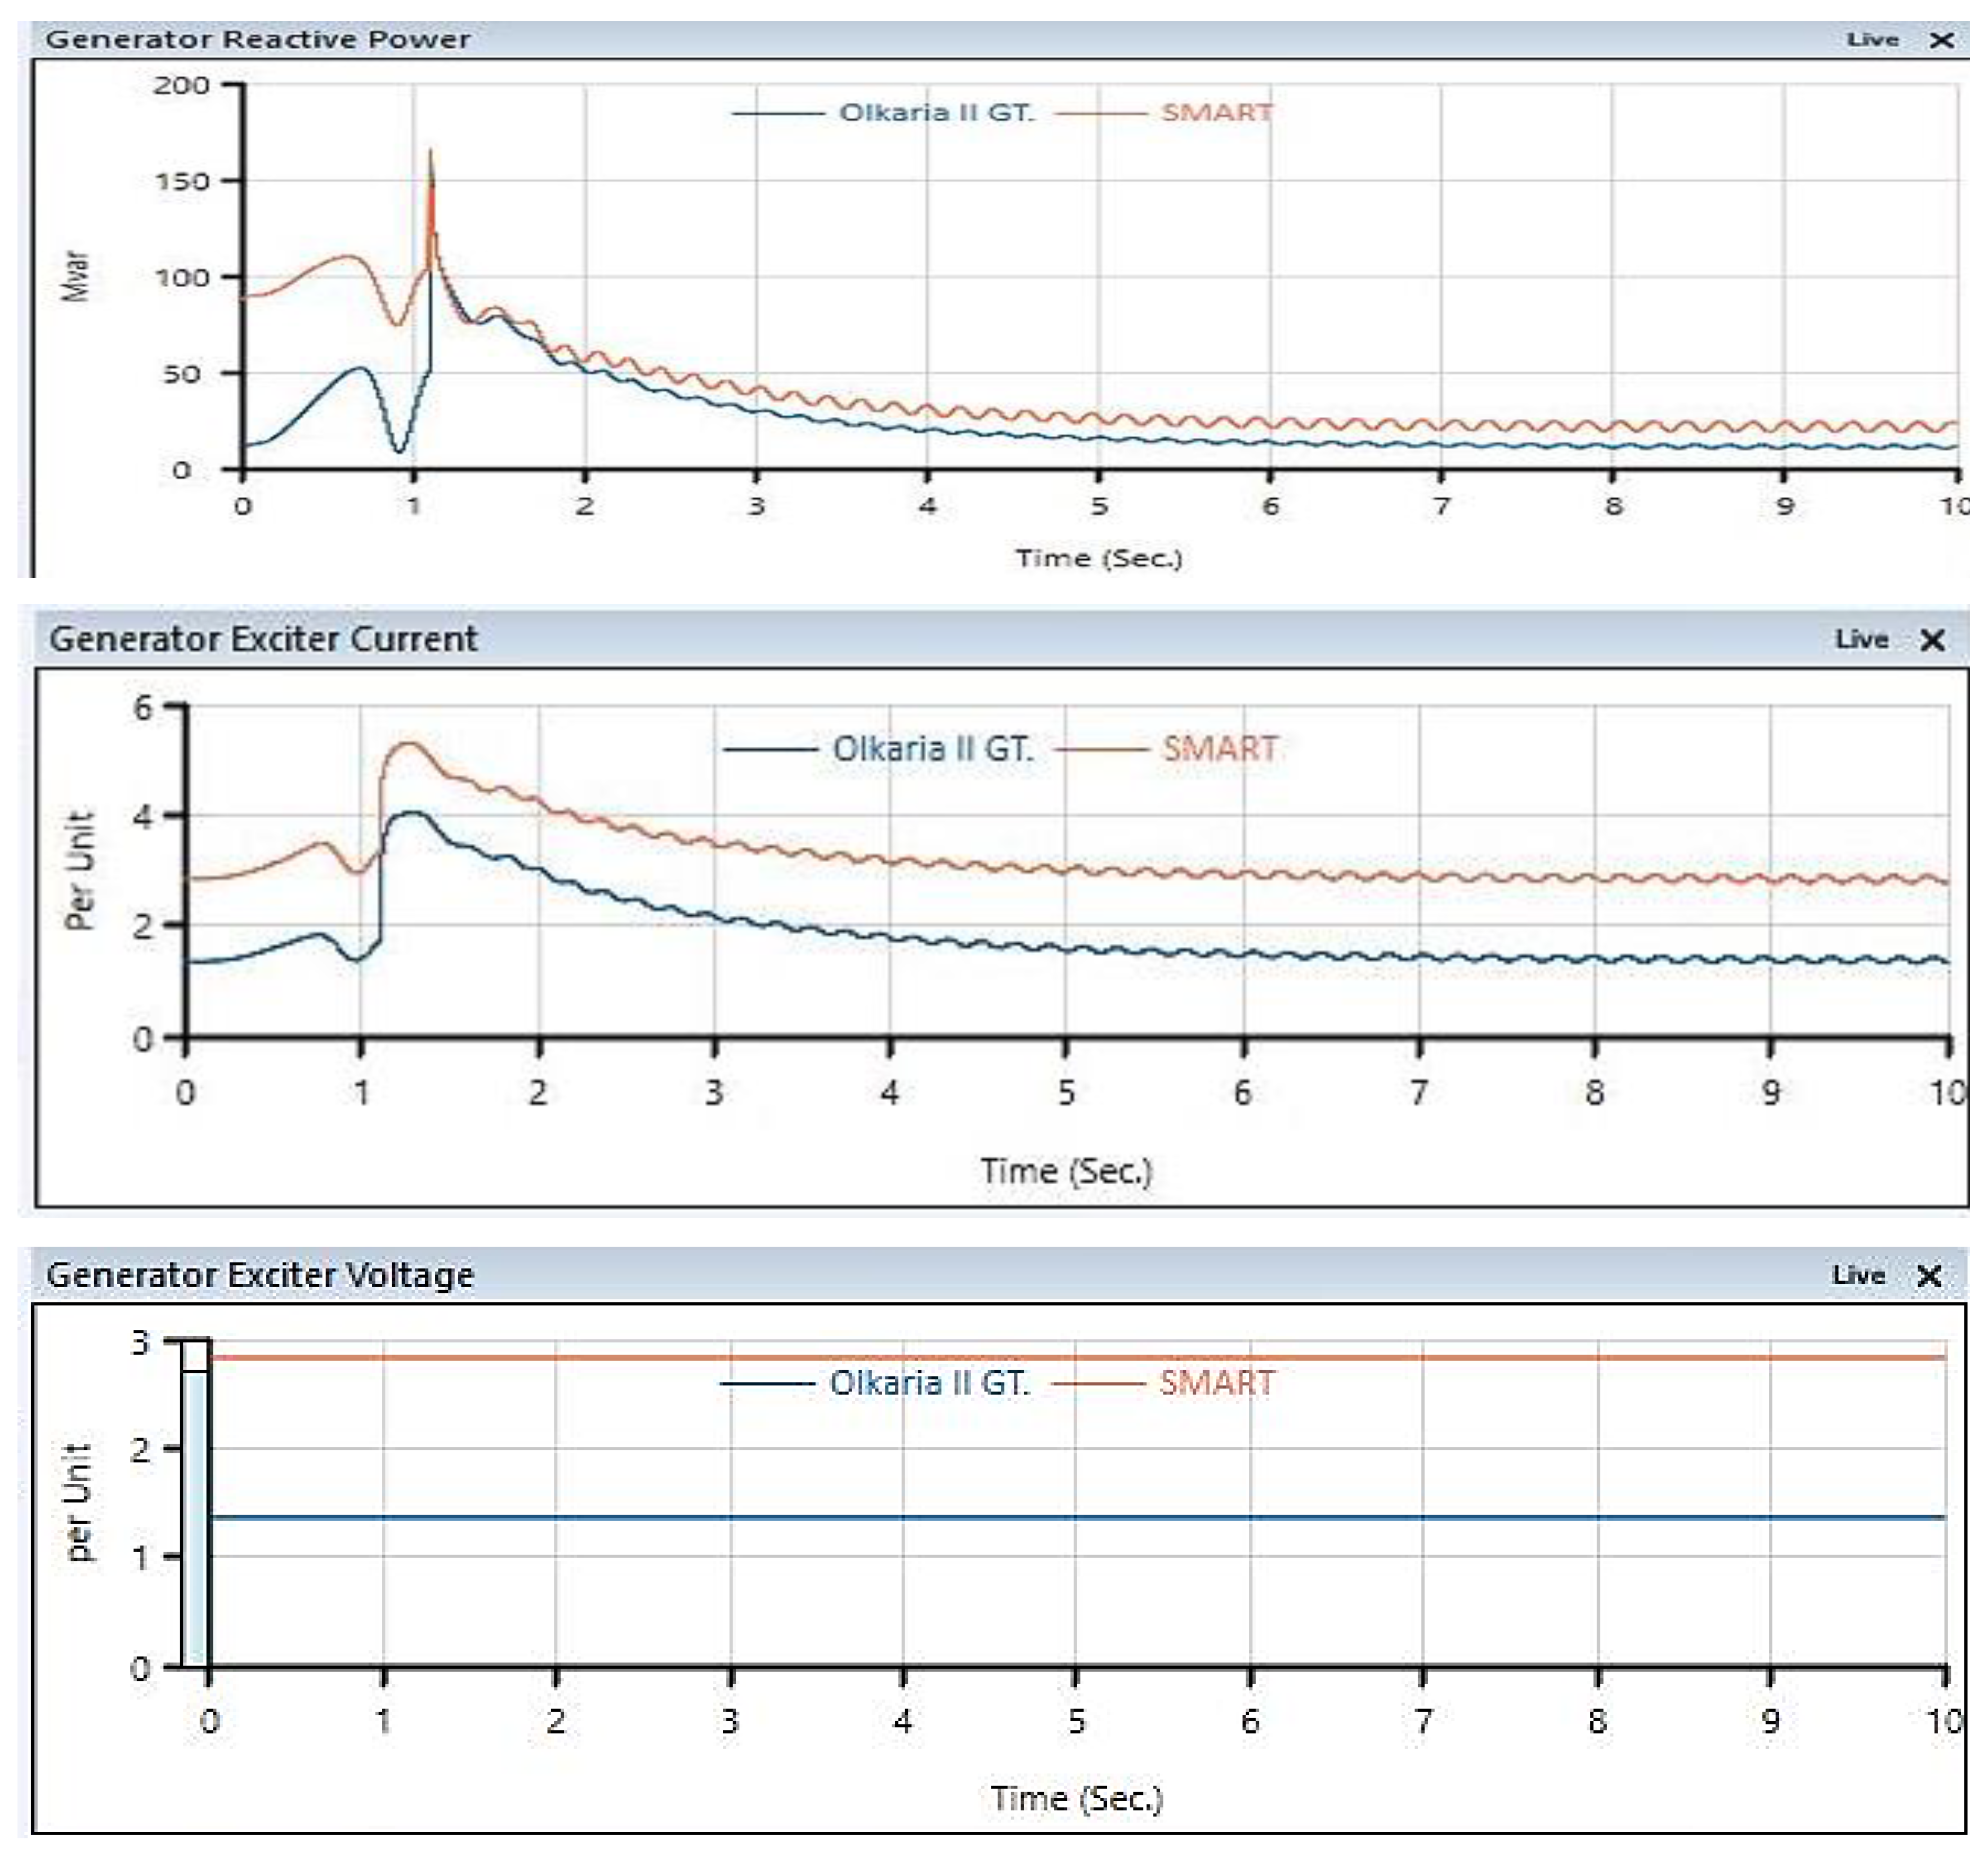
The SMART reactor’s electrical power output shows more stability with less pronounced oscillations compared to Olkaria II GT, settling at a higher steady-state value of approximately 20 MW. This stability in power output, coupled with its ability to adjust between 20-100% of rated capacity, as mentioned in the literature review, showcases SMART-SMR’s flexibility in responding to grid demand fluctuations. The reactor’s rapid stabilization after initial disturbances aligns with the implementation of Model Predictive Control (MPC) algorithms, which can reduce power output fluctuations by up to 40% compared to traditional PID control methods.
The reactive power graph illustrates SMART-SMR’s superior voltage regulation capabilities, maintaining a higher reactive power output of about 25 MVAr compared to Olkaria II GT’s 15 MVAr. This aligns with the reactor’s dynamic reactive power support capability, modelled by equation 10, where S is 111 MVA for SMART. This enhanced reactive power control contributes significantly to voltage stability, as evidenced by the improved voltage profiles across the network, with substations like Industrial Area SS increasing from 93.76% to 98.84% of nominal voltage. The higher exciter current and voltage for SMART-SMR (3 pu and 2.8 pu respectively) compared to Olkaria II GT (1.5 pu and 1.4 pu) (Figure 9) further support its higher voltage regulation and power factor correction capabilities. These characteristics, combined with SMART-SMR’s inertial response (modelled by the swing equation 9, and primary frequency control (ΔP = -K * Δf), contribute to the observed improvements in reliability indices, such as the reduction in SAIDI and SAIFI.
4.4. Effects of Network Reconfiguration and Protection Devices
The optimal SMART-SMR integration configuration for the Nairobi County distribution network demonstrates significant improvements in system performance and reliability. Operating at 117.317 MW and providing 122.885 Mvar of reactive power support, the SMART-SMR enhances voltage stability and power factor correction across the network. This configuration results in improved voltage profiles, with key substations like Industrial Area SS and Mombasa Rd SS operating at 98.84% and 98.91% of nominal voltage, respectively. The integration leads to notable enhancements in reliability indices, including a 2.8% reduction in SAIDI to 5.0433 hours/customer-year and a 5.1% improvement in SAIFI to 0.0516 interruptions/customer-year (Table 5). The SMART-SMR’s load-following capabilities, allowing output adjustment between 20-100% of rated capacity, coupled with its advanced control systems, contribute to a 10.2% reduction in Expected Energy Not Supplied (EENS) and maintain a high Average Service Availability Index (ASAI) of 0.9994.
Table 4.
Reconfiguration and Protection Devices Parameters.
| Parameter | Value |
|---|---|
| SMART-SMR Power Output | 117.317 MW |
| Reactive Power Support | 122.885 Mvar |
| Voltage Profile Improvement (Industrial Area SS) | 93.76% to 98.84% |
| Voltage Profile Improvement (Mombasa Rd SS) | 98.91% |
| SAIDI | 5.0433 hours/customer-year |
| SAIFI | 0.0516 interruptions/customer-year |
| EENS | 343.425 MWh/year |
| ASAI | 0.9994 |
| Load-Following Range | 20-100% of rated capacity |
| Exciter Voltage | 2.8 pu |
| Exciter Current | 3 pu |
| Failure Rate (132kV Substation Example - Mangu SS) | 0.000540 f/yr |
| Failure Rate (66kV Substation Example - JKIA SS) | 0.007200 f/yr |
| Failure Rate (33kV Substation Example - Umoja SS) | 0.002510 f/yr |
5. Conclusion
This study addressed the challenge of integrating System-Integrated Modular Advanced Reactor (SMART) technology into Kenya’s developing power grid, specifically focusing on the Nairobi County distribution network. The research aimed to evaluate the impact of 100 MW SMART reactor integration on grid reliability and stability. Through ETAP 22 simulations and a comparative analysis of three scenarios, the study demonstrated substantial improvements in key reliability indices and voltage profiles with SMART integration. The integration resulted in reduced SAIDI and SAIFI values, lower Expected Energy Not Supplied (EENS), and improved voltage stability across various substation categories. These findings suggest that SMART technology can effectively enhance grid performance and reliability in developing power systems.
The results of this study have important implications for energy policy and infrastructure development in Kenya and potentially other emerging economies facing similar grid stability challenges. Future research should focus on the long-term economic impacts of SMART-SMR integration, including potential reductions in energy costs and improvements in industrial productivity due to enhanced grid reliability. Additionally, investigating the scalability of this solution and its applicability in different geographical and economic contexts would be valuable. From a policy perspective, these findings provide a foundation to make strategic decisions for energy planning, potentially adapting regulatory frameworks to facilitate the adoption of advanced SMRs.[20,21]
Funding
This research was funded by the 2024 Research Fund of the KEPCO International Nuclear Graduate School and the 2023/24 National Research Fund, Republic of Korea.
Author contribution
Conceptualization, O.K.G and C.C.-k; methodology, O.K.G; software,O.K.G., C.C.-k; validation and C.C.-k.; Analysis, investigation O.K.G, resources O.K.G and C.C.-k.; data curation O.K.G and C.C.-k.; writing-original draft preparation O.K.G.; writing-review and editing O.K.G., visualization O.K.G and C.C.-k, supervision C.C.-k, project administration O.K.G, funding acquisition, C.C.-k. All authors have read, reviewed and knowledge the publication of the manuscript.
Data availability statement
The original contributions presented in the study are included in the article. Further inquiries can be directed to the corresponding authors.
Conflict of interest
No conflict of interest has been raised. The funder had no role in the study design, data collection and analysis, writing and results publication.
References
- Ministry of Energy, “Kenya National Electrification Strategy,” 2018.
- IAEA, “Nuclear Power Reactors in the World,” 2018.
- “KENYA ELECTRICITY GRID CODE,” 2008.
- O. Guimarães, A. M. Leite da Silva, L. C. Nascimento, and M. Fotuhi-Firuzabad, “Reliability assessment of distribution grids with DG via quasi-sequential Monte Carlo simulation,” Electric Power Systems Research, vol. 229, Apr. 2024. [CrossRef]
- S. Ahmad, S. Sardar, A. Ul Asar, and F. W. Karam, “Reliability Analysis of Distribution System using ETAP,” 2017. [Online]. Available: https://sites.google.com/site/ijcsis/.
- S. Ahmad, S. Sardar, A. Ul Asar, and F. W. Karam, “Reliability Analysis of Distribution System using ETAP,” 2017. [Online]. Available: https://sites.google.com/site/ijcsis/.
- K. Idowu, R. Uhunmwangho, E. C. N. Okafor, and A. Big-Alabo, “Reliability Improvement Study of a Distribution Network with Distributed Generation,” 2021. [Online]. Available: http://arqiipubl.com/ams.
- “Voltage Stabilization by SMR Support in High RES Grid.pdf”.
- Tiwary, S. Tiwary, and E. O. R. I. O. R. B. T. System, “Evaluation of Reliability Indices of Roy Billinton Test System (RBTS) Bus-2 Distribution System for Educational Purpose,” 2021.
- D. Anteneh, “Reliability Assessment of Distribution Sys-tem Using Analytical Method: A Case Study of Debre Berhan Distribution Network Reliability Assessment of Distribution System Using Analytical Method: A Case Study of Debre Berhan Distribution Network. Journal of Informatics Electrical and Elecrtonics*******************,” 2019. [Online]. Available: http://dx.doi.org/*http://creativecommons.org/licenses/by/4.0/.
- M. V Kesavakumar, V. Srihari, and B. Sarvesh, “IMPROVEMENT IN RELIABILITY INDICES OF A POWER DISTRIBUTION SYSTEM: A CASE STUDY.” [Online]. Available: http://www.ijret.org.
- H. Nyebuchi Amadi and S. Member IEEE, “RELIABILITY ASSESSMENT OF SABON-GARI DISTRIBUTION SUBSTATION BASED ON COMPONENTS PERFORMANCE”.
- “Status report 77-System-Integrated Modular Advanced Reactor (SMART).”.
- “Status report 77-System-Integrated Modular Advanced Reactor (SMART).”.
- H.-O. Kang, Y.-I. Kim, K. Koo Kim, and S.-K. Zee, “Assessment of SMART Capability for Multiple Applications.”.
- Halvgaard and Rasmus, “Model Predictive Control for,” APA, 2014. [Online]. Available: www.compute.dtu.dk.
- B. M. Weedy, | B J Cory, N. Jenkins, | J B Ekanayake, and | G Strbac, “Electric Power Systems.” [Online]. Available: www.wiley.com/go/weedy_electric.
- “Nairobi City County 132kV- 66kv-33kV - Distribution Grid Combined_20221207”.
- Tiwary and S. Tiwary, “Aditya Tiwary, Swati Tiwary EVALUATION OF CUSTOMER ORIENTATED INDICES AND RELIABILITY STUDY OF ELECTRICAL FEEDER SYSTEM Evaluation of Customer Orientated Indices and Reliability Study of Electrical Feeder System,” 2020.
- K. Bidyanath, S. D. Singh, and S. Adhikari, “Implementation of genetic and particle swarm optimization algorithm for voltage profile improvement and loss reduction using capacitors in 132 kV Manipur transmission system,” Energy Reports, vol. 9, pp. 738–746, Mar. 2023. [CrossRef]
- H. Hashemi-Dezaki, A. M. Hariri, and M. A. Hejazi, “Impacts of load modeling on generalized analytical reliability assessment of smart grid under various penetration levels of wind/solar/non-renewable distributed generations,” Sustainable Energy, Grids and Networks, vol. 20, Dec. 2019. [CrossRef]
Figure 3.
Modelled Nairobi County distribution grid Single Line Diagram.
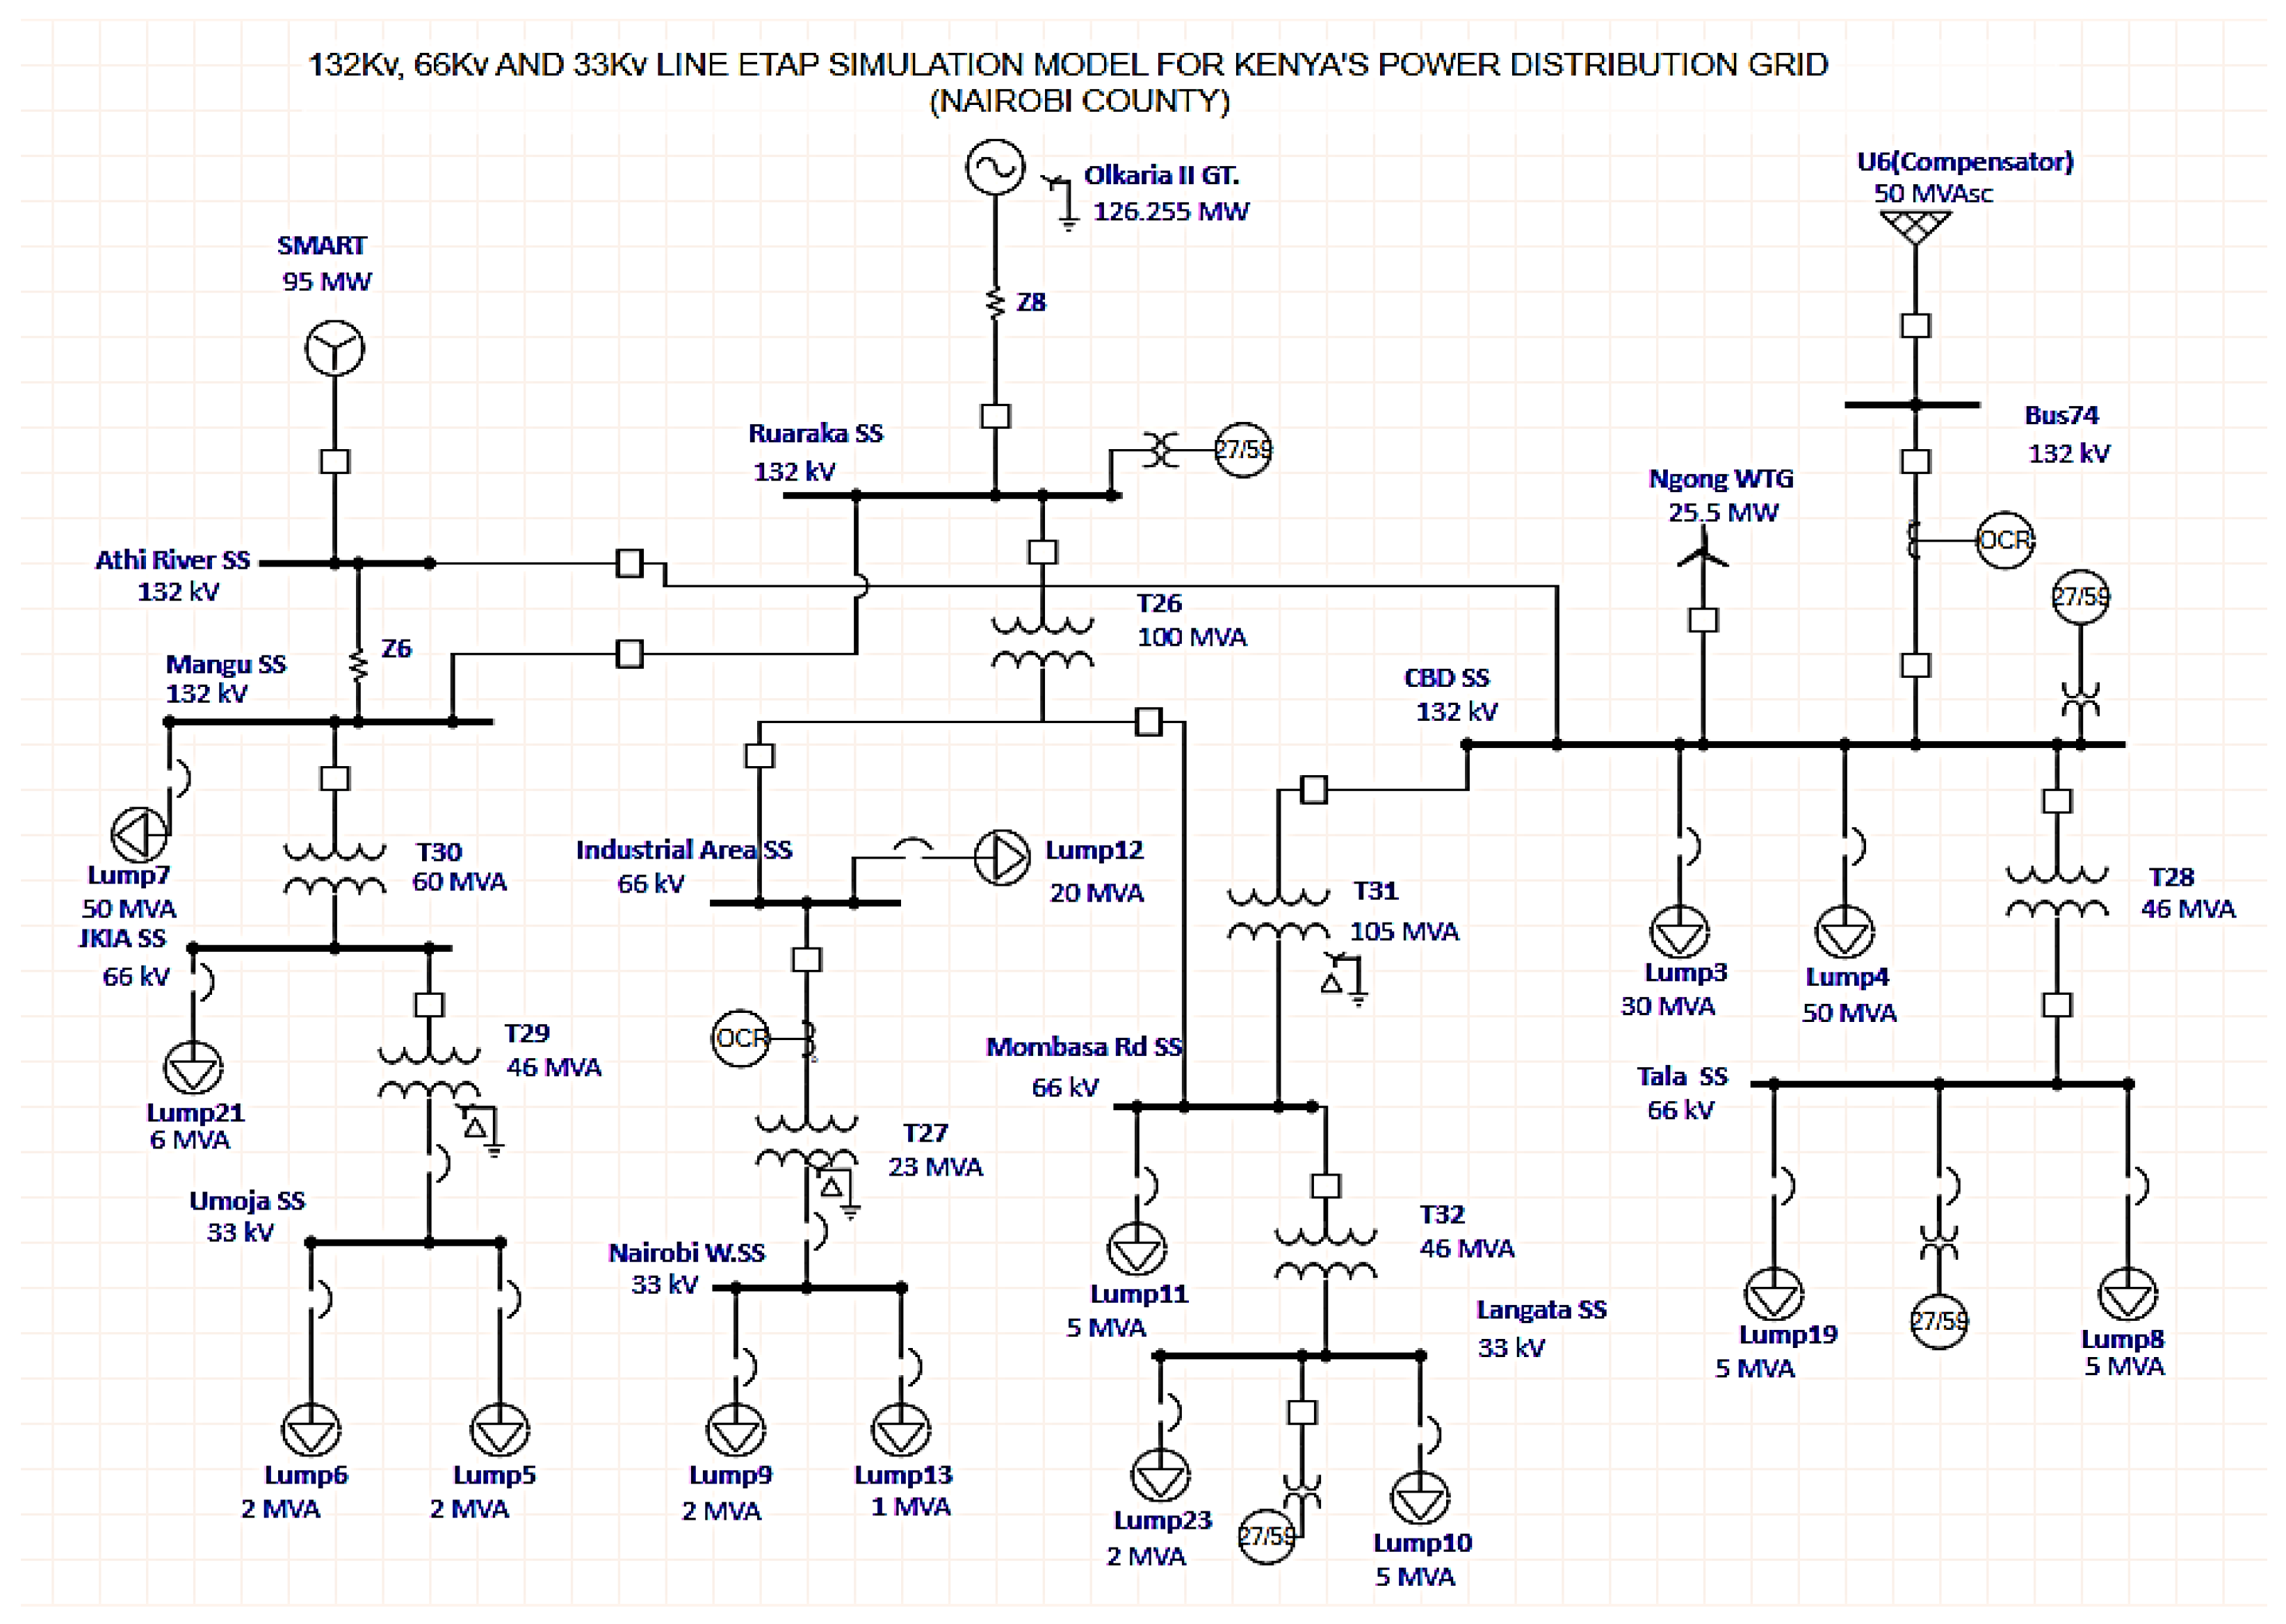
Figure 4.
Base Case Scenario.
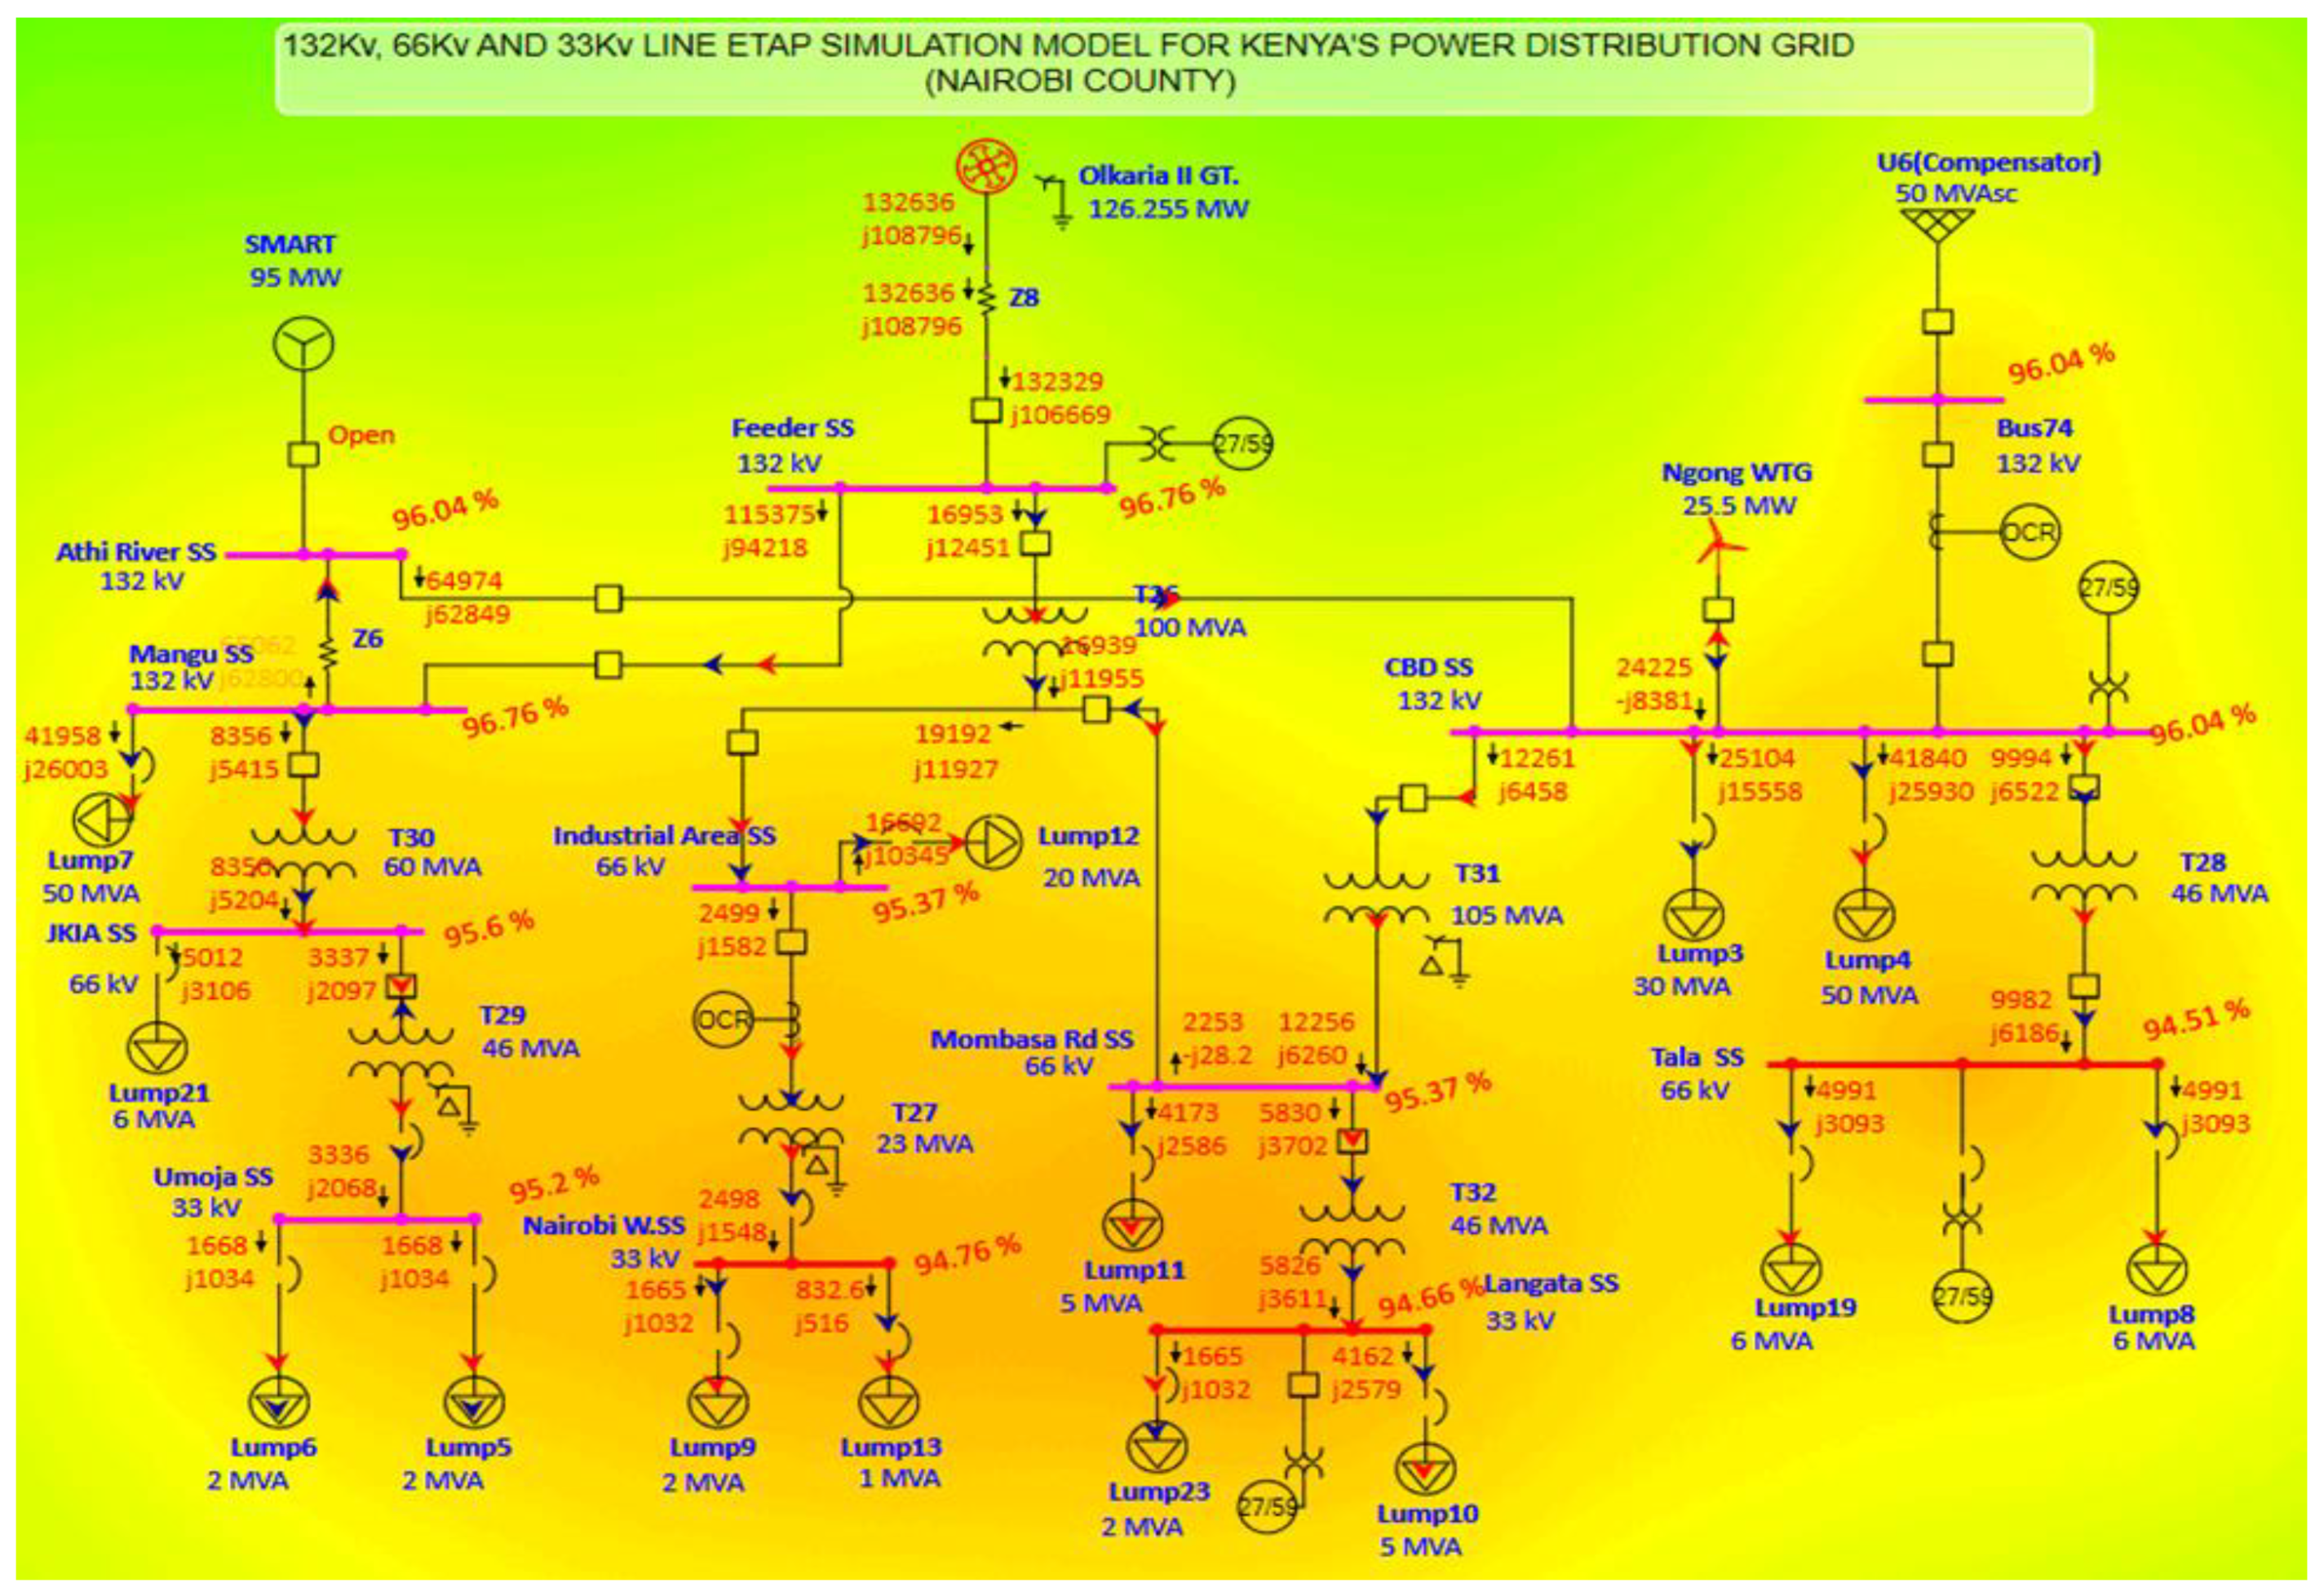
Table 3.
input data and output data.
| Component | Type | Input Data (Given) | With SMART-SMR Output Data (Simulated) |
|---|---|---|---|
| SMART Reactor | Generator | Rated Power: 111 MVA Active Power: 105 MW Failure Rate: 0.000000 f/yr |
-Power Output: 117.317 MW Reactive Power: 122.885 Mvar |
| Olkaria II GT | Generator | - Capacity: 126.255 MW - Failure Rate: 0.990000 f/yr |
- Power Output: 44.826 MW - Reactive Power: 15.081 Mvar |
| Ngong WTG | Generator | - Capacity: 25.5 MW - Failure Rate: 0.199000 f/yr |
Power Output: 26.417 MW - Reactive Power: -7.951 Mvar |
| U6 Compensator (Grid) | Power Grid | - Capacity: 50 MVA - λ: 0.743000 f/yr |
- Power Output: 0.606 MW - Reactive Power: -0.953 Mvar |
| Athi River SS | Bus (132kV) | - λ: 0.017500 f/yr | - λ: 0.020530 f/yr |
| CBD SS | Bus (132kV) | - λ: 0.032400 f/yr | - λ: 0.002410 f/yr |
| Mangu SS | Bus (132kV) | - λ: 0.017500 f/yr | - λ: 0.000540 f/yr |
| Industrial Area SS | Bus (66kV) | - λ: 0.038000 f/yr | - λ: 0.008300 f/yr |
| JKIA SS | Bus (66kV) | - λ: 0.044200 f/yr | - λ: 0.007200 f/yr |
| Mombasa Rd SS | Bus (66kV) | - λ: 0.030100 f/yr | - λ: 0.001100 f/yr |
| Tala SS | Bus (66kV) | - λ: 0.067500 f/yr | - λ: 0.007500 f/yr |
| Langata SS | Bus (33kV) | - λ: 0.059700 f/yr | - λ: 0.009700 f/yr |
| Nairobi W.SS | Bus (33kV) | - λ: 0.077000 f/yr | - λ: 0.007200 f/yr |
| Umoja SS | Bus (33kV) | - λ: 0.079510 f/yr | - λ: 0.002510 f/yr |
Table 5.
Comparative Failure Frequencies for Substations Scenarios.
| Substation | Voltage Level | Scenario 1 (Base Case) | Scenario 2 (Compensator Only) | Scenario 3 (SMART-SMR Integration) |
|---|---|---|---|---|
| 132kV Lines | ||||
| Athi River SS | 132kV | λ: 0.017500 f/yr | λ: 0.811600 f/yr | λ: 0.020530 f/yr |
| CBD SS | 132kV | λ: 0.032400 f/yr | λ: 0.797100 f/y | λ: 0.002410 f/y |
| Mangu SS | 132kV | λ: 0.017500 f/yr | λ: 0.811600 f/y | λ: 0.000540 f/yr |
| 66kV Lines | ||||
| Industrial Area SS | 66kV | λ: 0.038000 f/yr | λ: 0.835100 f/y | λ: 0.008300 f/yr |
| JKIA SS | 66kV | λ: 0.044200 f/yr | λ: 0.838300 f/yr | λ: 0.007200 f/yr |
| Mombasa Rd SS | 66kV | λ: 0.030100 f/yr | λ: 0.824200 f/y | λ: 0.001100 f/yr |
| Tala SS | 66kV | λ: 0.067500 f/yr | λ: 0.832200 f/yr | λ: 0.007500 f/yr |
| 33kV Lines | ||||
| Langata SS | 33kV | λ: 0.059700 f/yr | λ: 0.853800 f/yr | λ: 0.009700 f/yr |
| Nairobi W.SS | 33kV | λ: 0.077000 f/yr | λ: 0.874100 f/yr | λ: 0.007200 f/yr |
| Umoja SS | 33kV | λ: 0.079510 f/yr | λ: 0.873610 f/yr | λ: 0.002510 f/yr |
Disclaimer/Publisher’s Note: The statements, opinions and data contained in all publications are solely those of the individual author(s) and contributor(s) and not of MDPI and/or the editor(s). MDPI and/or the editor(s) disclaim responsibility for any injury to people or property resulting from any ideas, methods, instructions or products referred to in the content. |
© 2024 by the authors. Licensee MDPI, Basel, Switzerland. This article is an open access article distributed under the terms and conditions of the Creative Commons Attribution (CC BY) license (http://creativecommons.org/licenses/by/4.0/).
Copyright: This open access article is published under a Creative Commons CC BY 4.0 license, which permit the free download, distribution, and reuse, provided that the author and preprint are cited in any reuse.


