
Submitted:
24 October 2024
Posted:
24 October 2024
You are already at the latest version
Abstract
The goal of the study presented in this work is to evaluate the performance of a proposed adaptive beamforming approach when combined with non-orthogonal multiple access (NOMA) in cell-free massive multiple input multiple output (CF m-MIMO) orientations. In this context, cooperative beamforming is employed taking into consideration the geographically adjacent access points (APs) of a virtual cell, aiming to minimize co-channel interference (CCI) among mobile stations (MSs) participating in NOMA transmission. Performance is evaluated statistically via extensive Monte Carlo (MC) simulations in a two-tier wireless orientation. As results indicate, for high data rate services various key performance indicators (KPIs) can be improved compared to orthogonal multiple access, such as the minimum number of users in the topology as well as the available PRBs for downlink transmission. Although in NOMA transmission more directional beamforming configurations are required to compensate for the increased CCI levels, the increase in the number of hardware elements is reduced compared to the corresponding gain in the considered KPIs.
Keywords:
5G
; non-orthogonal multiple access
; massive MIMO
; millimeter wave transmission
; system level simulations
1. Introduction
The full deployment of fifth generation (5G) networks is expected to leverage the delivery of advanced services and applications to end users, such as enhanced mobile broadband (eMBB), ultra reliable low latency communications (URLLC) as well as massive machine type communications (mMTC) [1]. The 5G era is based on various novel technologies both in the physical and network layer, such as massive multiple input multiple output (m-MIMO) configurations [2], millimeter wave (mmWave) transmission [3], non-orthogonal multiple access (NOMA) [4], as well as network function virtualization (NFV) [5]. When m-MIMO is combined with mmWave transmission, multiple antenna arrays can be deployed in various access points (APs) of the wireless orientation. Hence, highly directional beams can be formulated, improving spectral and energy efficiency (SE, EE).
However, the rapid growth on the number of interconnected devices on the internet (internet of things – IoT) along with the ever-increasing user requirements for high data rates and URLLC in densely deployed networks, necessitates the deployment of new transmission protocols and architectural approaches to fulfill these demands. In this context, the goal is to improve various key performance indicators (KPIs), with minimum hardware and computational burden. The optimization of a multitude of KPIs is extremely important for the design and implementation of future broadband networks (sixth generation – 6G) where the concept of ultra dense networks (UDNs) has been proposed among others as a candidate architectural approach that can leverage eMBB and URLLC [6].
In NOMA transmission, the same resource block (e.g., physical resource block - PRB) is utilized concurrently by individual mobile stations (MSs). In this context, a challenging issue is the selection of groups of MSs to minimize co-channel interference (CCI). In cooperative NOMA, a MS with improved channel conditions may act as an intermediate relay node that forwards the requested information to another MS at the edge of the network, in the case where the direct link from the AP would significantly increase overall transmission power. The optimum selection of NOMA MSs (it will be referred to as NOMA group - NG - throughout the rest of this paper), can improve various KPIs, since more PRBs are available for uplink/downlink transmission without additional spectrum requirements.
Over the past few years, various scientific works have dealt with the deployment of NOMA transmission in m-MIMO configurations. In [7], the non-convex optimization problem of sum-rate and energy efficiency maximization was formulated, for m-MIMO NOMA systems with hybrid precoding. In this context, MS grouping metric takes into account two features, namely MS channel vector and the distance between MSs. Due to the non-convex nature of the problem, the linked variables, such as power allocation and power splitting ratio assignments were decoupled. According to the presented results, the proposed approach can significantly improve SE and EE compared to other state of the art approaches. In [8], the problem of joint task assignment, power allocation and node grouping is considered for NOMA-mmWave multi-access edge computing (MEC) environments. To this end, a device that is located in close proximity to the considered MS may also perform local computations and upload the results to the closest MEC server. This device is referred to as helper. Afterwards, an optimization problem is formulated which is solved at two steps: In the first step, a low complexity search algorithm is employed to select the helper and the MEC node. The second step includes energy consumption minimization. The non-convex problem is later solved via sub-optimal approaches. According to the presented results, the proposed cooperative NOMA approach can significantly improve energy consumption compared to other existing works.
In [9], the performance evaluation of NOMA transmission in multicellular MIMO orientations takes place, via a developed hybrid system-link level simulator. To this end, MS grouping takes into consideration the maximization of the signal to interference plus noise ratio (SINR) as well as signal to jamming ratio (SJR). According to the presented results, if up to 20% of the available PRBs are shared for NOMA transmission, the need for successive interference cancellation (SIC) at the receiver is practically eliminated. In [10], intelligent reflecting surface (IRS)-NOMA-assisted cell-free (CF) m-MIMO systems are considered. The overall optimization problem can be quite complex, since it involves the joint optimization of power allocation, phase shifts of IRSs, and MS pairing. Therefore, deep reinforcement learning approaches have been presented. Results indicate that the incorporation of NOMA into the IRS-assisted CF m-MIMO system and the use of the proposed Deep Deterministic Policy Gradient -based optimization algorithm can significantly improve downlink transmission rate. In the same context (i.e., IRS-NOMA), in [11] an adaptive MS pairing algorithm is considered, where two MSs with different channel characteristics are grouped in the same NG. In this context, multiple IRSs assist to improve the received signal quality. A deep learning (DL) framework is proposed to find the optimum solution in the joint optimization problem of precoding matrix formulation, phase shift of IRSs as well as the involved NOMA MSs. It is shown, that the proposed DL approach can significantly reduce overall execution times, when compared to classical optimization methods.
In [12], the performance of a spatial modulation system using NOMA transmission is evaluated, over multiple subchannels. In this context, a joint subchannel and power allocation problem for weighted sum rate maximization is formulated, which is decomposed into three subproblems, namely the decoding order design, the subchannel assignment, and the power allocation. Finally, in [13] NOMA is employed in unmanned aerial vehicles (UAVs), where the UAV acts as a relay to assist the ground MSs. An optimization problem is formulated to determine the optimum beamforming configuration and position of the UAV. This problem was decomposed to two subproblems that were solved via successive convex approximation techniques.
In all the aforementioned studies, either limited network deployments have been considered (i.e., limited number of users or APs) or the effect of cooperative beamforming has not been thoroughly studied. Furthermore, the majority of related studies have not taken realistic antenna radiation patterns into account. In this work, we propose and evaluate a low-complexity NG selection algorithm that can enhance various performance metrics, such as the minimum number of supported MSs in the network, and available PRBs for downlink transmission, while minimizing hardware requirements and computational overhead. The main contributions of our work are summarized as follows:
• NOMA transmission is considered in multi-AP orientations, where cooperative beamforming is employed among the APs. Unlike other works in literature, MSs in an NG are assigned with the PRBs that maximize their signal strength and CCI is minimized via cooperative beamforming.
• mmWave transmission is also considered, according to the latest 3GPP guidelines and specifications [14]. In particular, the deployed antenna radiation diagrams correspond to an 28 GHz carrier frequency.
• NOMA is combined with CF m-MIMO configurations, since a MS can be served by multiple APs according to channel conditions and CCI levels.
This work is a continuation of the work initially presented in [15], where NOMA transmission is now also considered in the CF m-MIMO multi-AP orientation. The rest of this paper is organized as follows: In Section 2, the 5G mmWave CF m-MIMO orientation is presented, while in Section 3 the antenna design aspects per AP are highlighted. In Section 4, the proposed resource allocation approach based on NOMA transmission and cooperative beamforming is analyzed. Results are presented in Section 5, where various KPIs have been considered. Finally, concluding remarks are provided in Section 6.
The following notation is used throughout the paper. An italic variable a denotes a scalar, whereas boldface lowercase and uppercase variables a and A denote vectors and matrices, respectively. A calligraphic variable denotes a set of elements. AT and AH denote the transpose and conjugate transpose of A, respectively, while stands for the Frobenius norm of x. Finally, A(i,j) is the (i,j) entry of the two-dimensional matrix A.
2. 5G Massive MIMO Millimeter Wave Cell – Free Orientations
We consider the downlink of a multi-AP wireless orientation, with N APs uniformly distributed. To this end, virtual cells (VCs) are formulated, as shown in Figure 1. Each AP is equipped with an m-MIMO configuration, as it will be described in detail in the following section. The transmitted signal can be expressed as:
where is the set of PRBs assigned to the kth MS. It should be noted at this point that in CF operational mode, a MS can be served by multiple APs according to channel conditions. The mapping of APs and PRBs for all active MSs is stored in the two-dimensional matrix T. Therefore, T(k,s) denotes the AP that servers the kth MS with respect to the sth PRB. Assuming Mt transmitting antennas for the AP of interest, then tk,T(k,s),s is the Mt×1 transmission vector (diversity combining mode has been assumed), pk,T(k,s),s is the allocated power to the sth PRB of the kth MS and Xk,s is the transmission symbol selected from a predefined constellation (i.e., QPSK, 16QAM, 64QAM). Finally, Ts is the symbol period, and fs is the corresponding frequency of the sth PRB.
The received Mr×1signal (Mr is the number of receiving antennas) per MS’s PRB is a superposition of all co-channel signals from all other APs (intercell co-channel interference, Inter-CCI) as well as from the same AP in the case of NOMA transmission (intracell co-channel interference, Intra-CCI):
The first term in (2) is the desired MS signal, while the second term denotes Intra-CCI and Inter-CCI. Moreover, matrix Hk,T(k',s),s denotes the channel matrix of the kth MS with respect to the AP of the k´th MS and TL the corresponding total losses (shadowing effects have been included as well). Each entry of the Hk,T(k',s),s matrix has been calculated according to the latest 3GPP specifications for channel modelling [14]. Finally, rk,T(k,s),s is the 1×Mr maximal ratio combining (MRC) multiplying vector and nk,s the Mr×1 noise vector.
3. Developed massive MIMO antenna configuration
A 21×21 array of rounded crossed bowtie radiating elements (REs) is proposed, as illustrated in Figure 2. For the sake of space, Figure 2 shows an indicative antenna array consisting of 7×9 REs, while the actual antenna array architecture and its electromagnetic characteristics are thoroughly detailed in [15]. The REs used are notable for their low fabrication costs and straightforward manufacturing processes. The entire antenna array is designed to achieve an unidirectional radiation pattern and prevent energy loss through the back lobe. To this end, two ground planes are positioned beneath each RE at distances of λo/4 and λo/2, respectively (λο is the carrier wavelength). The proposed REs mainly act as exciters to the reflector. Additionally, the aforementioned REs are rotated at ±45° to form a dual-polarized radiation pattern, which is commonly used in wireless communications, especially in cellular networks [16].
The rotation of these exciters, coupled with a 90° phase difference, promotes circular polarization, resulting in high cross-polarization power ratio (XPR) values exceeding 20 dB. These high XPR values ensure remarkable signal integrity, which is further enhanced by circular polarization as it eliminates the undesired high sensitivity of the receiver antenna orientation [17].
Figure 1.
m-MIMO orientation with multiple access points and virtual cells.
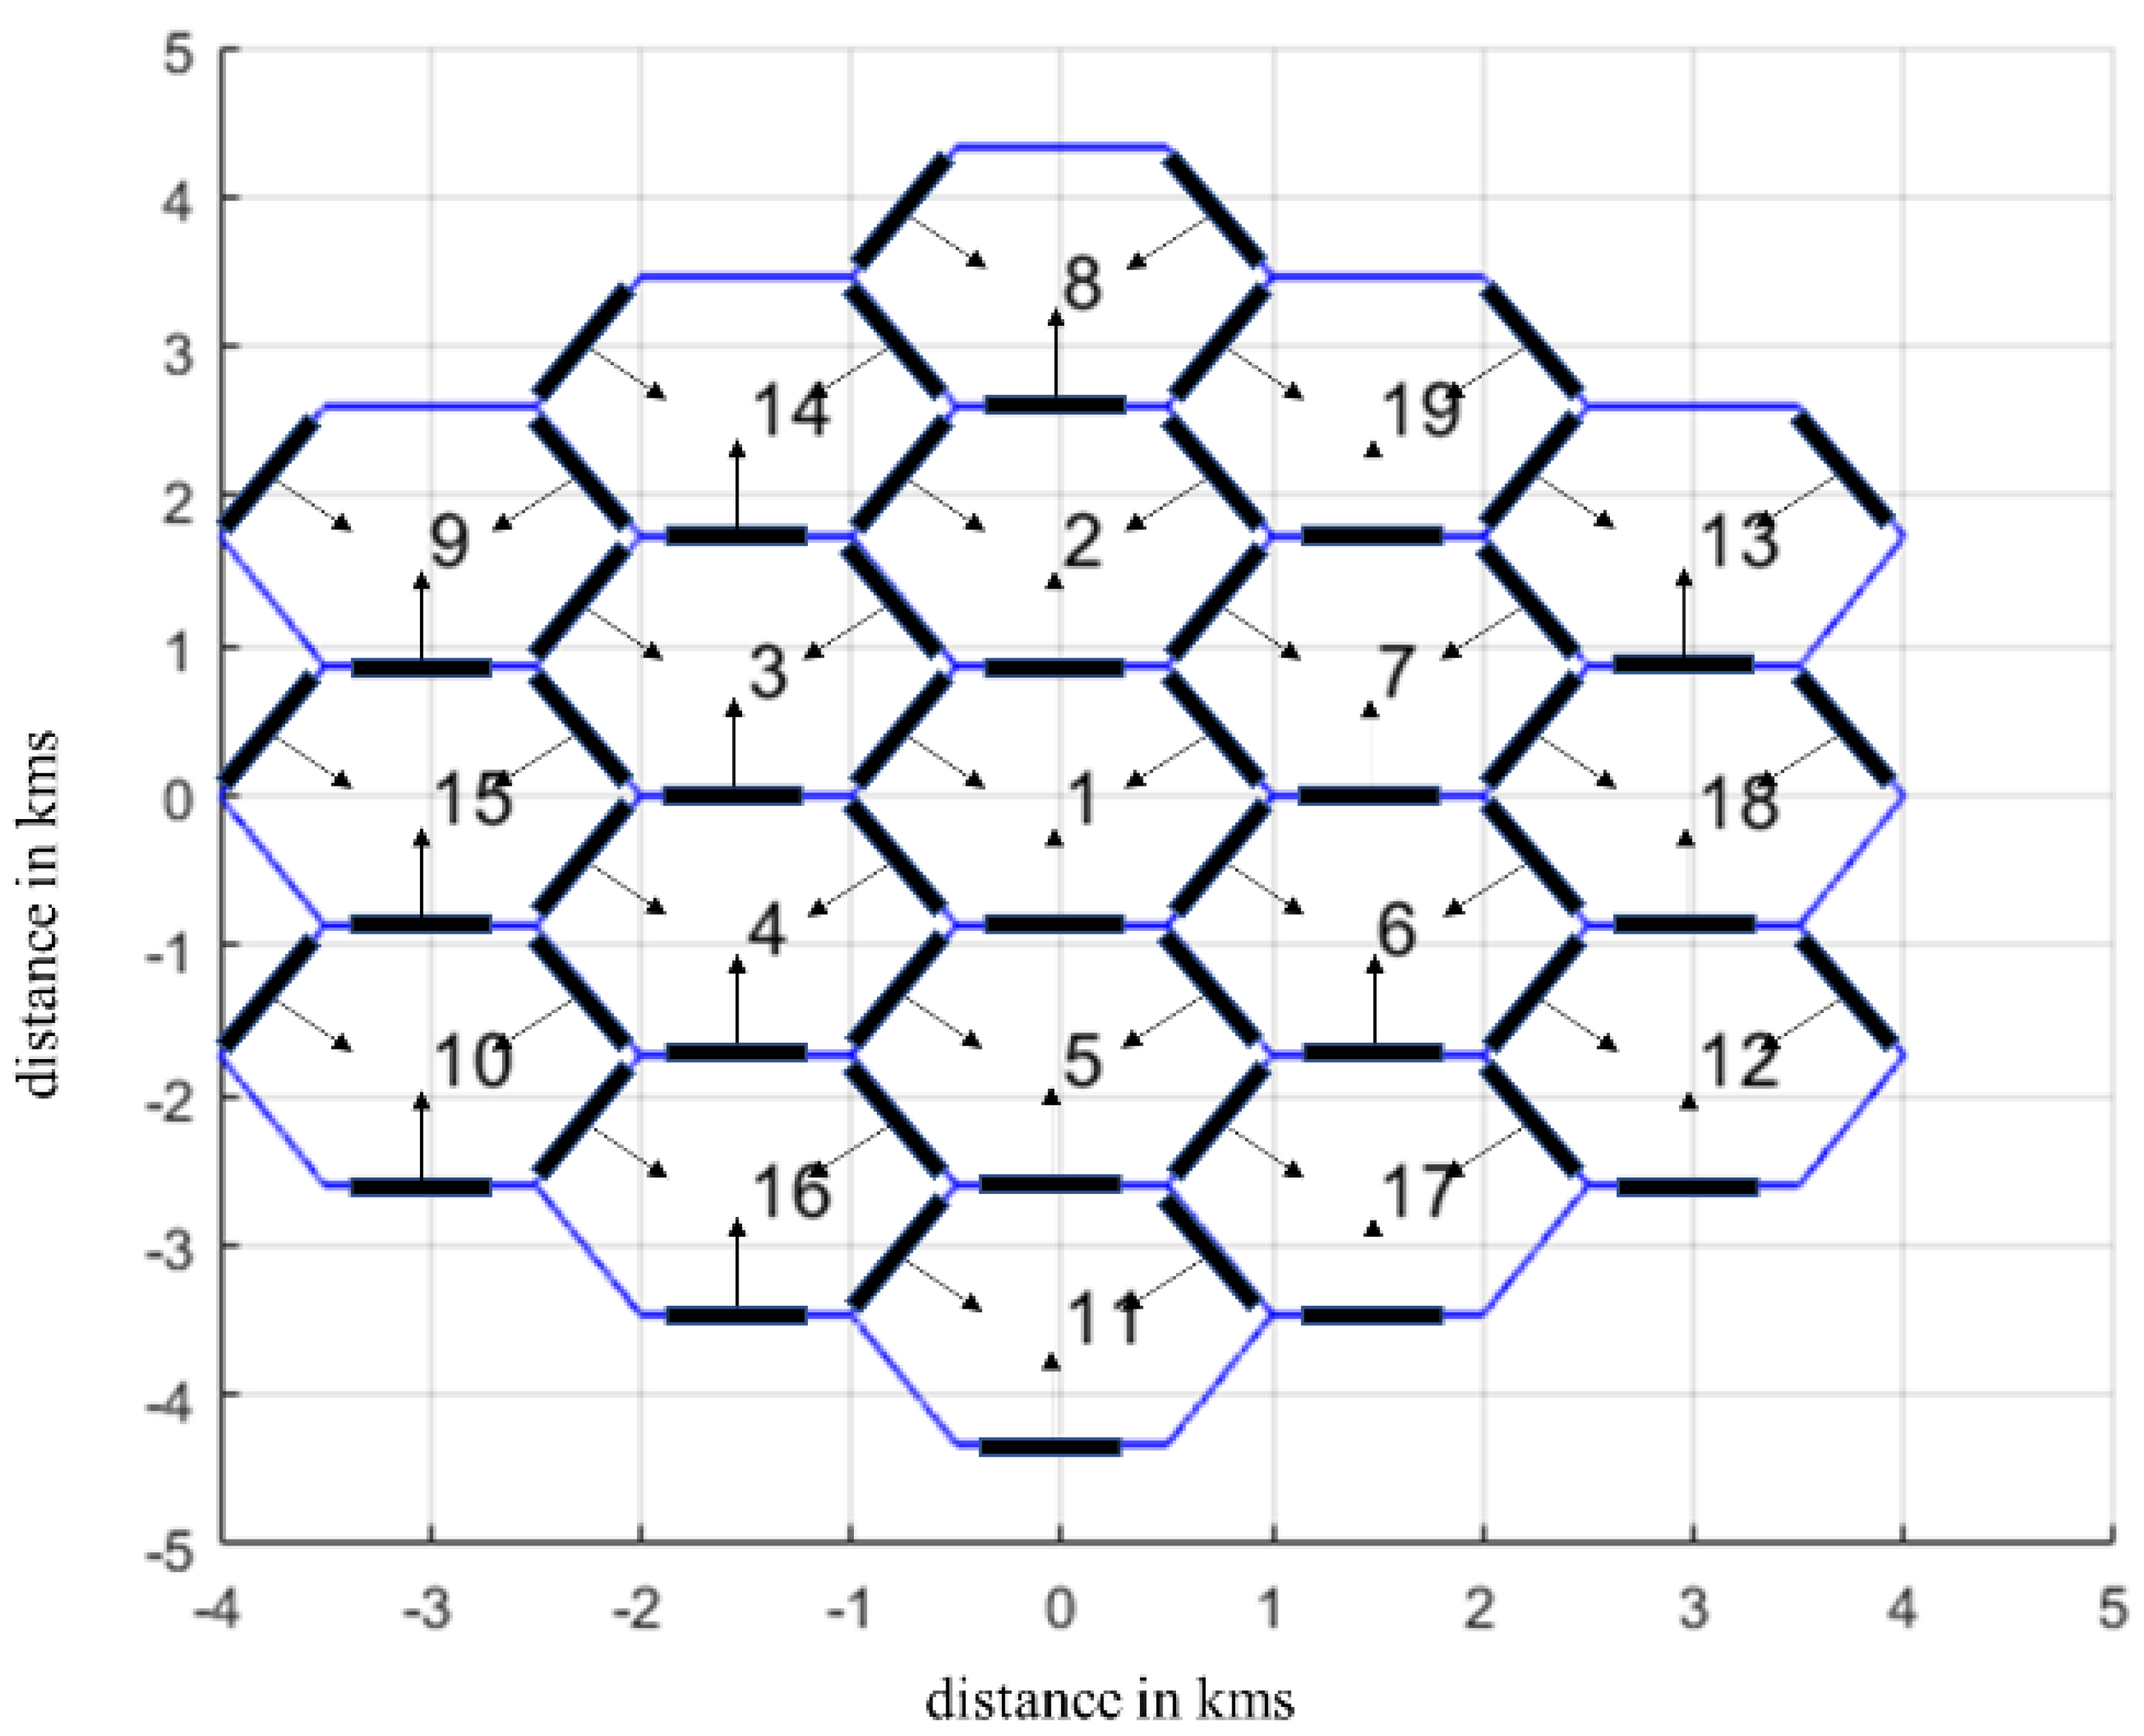
Figure 2.
Illustration of the activation of the appropriate subarrays (1×1: single element, 3×3, 5×5, 21×2) according to three key requirements: spatial coverage, QoS, and number of REs (N).
Figure 2.
Illustration of the activation of the appropriate subarrays (1×1: single element, 3×3, 5×5, 21×2) according to three key requirements: spatial coverage, QoS, and number of REs (N).
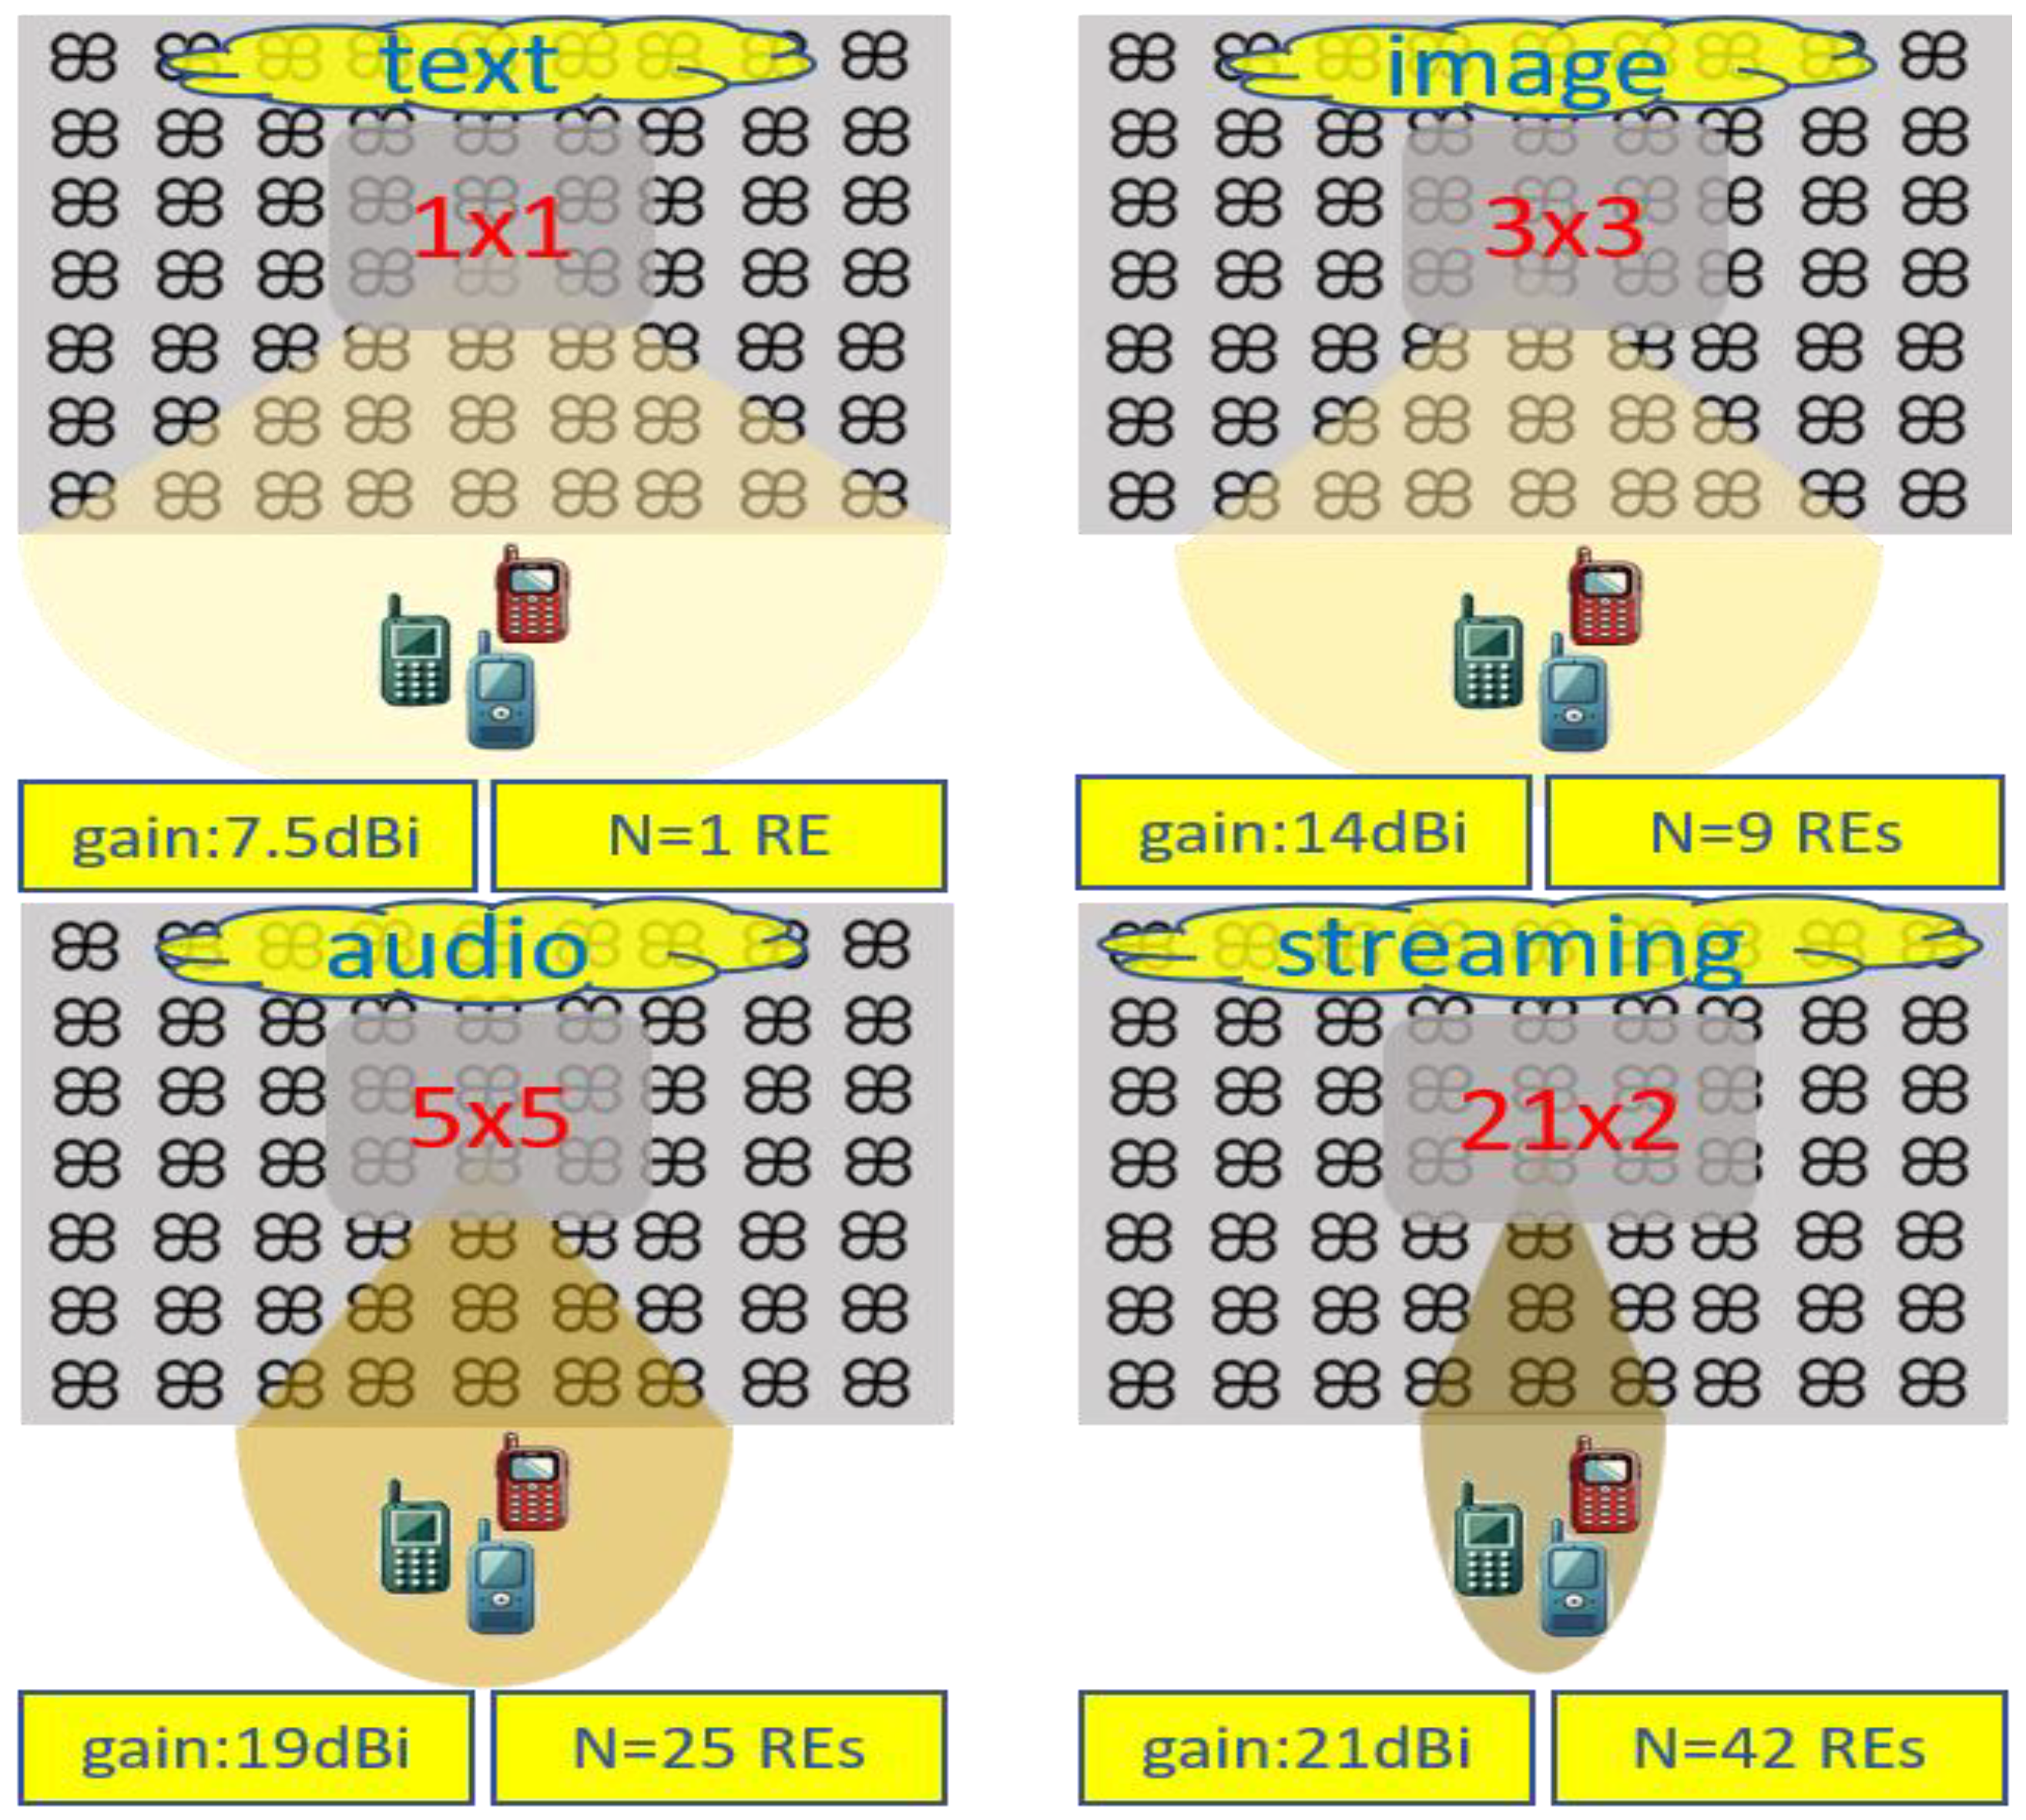
It is worth noting that the proposed antenna array configuration can support different phase activations for each RE. This can occur either across the entire array or within a subarray, supporting efficient beamforming techniques. To this end, the radiation pattern can be altered in both azimuth and elevation levels depending on the phase activation. This flexibility in beamforming allows for changes in the desired directions and gain [17]. In particular, the main radiation lobe can be steered around +30° and -30°, thereby enhancing the spatial coverage. In the same context, the activation of specific subarrays can lead to the formation of more directional radiation patterns, as shown in Figure 2, facilitating the support of different types of services. In this context, most of the related scenarios are differentiated according to the requirement of energy consumption of the antenna array, which can be translated into the desired number of activated REs, the required quality of services (QoS), and finally, the required demand of spatial coverage.
Based on the previous categories, an efficient algorithm has been implemented to activate the appropriate radiating subarray. The algorithm is oriented to deliver the necessary services efficiently while minimizing energy usage. This is achieved by changing the number of REs according to the real-time demand of QoS without changing the required spatial coverage, if possible, as shown in Figure 2. This approach not only meets service requirements but also optimizes energy efficiency, thus improving overall network performance.
4. NOMA Transmission and Cooperative Beamforming in Cell-Free Massive MIMO Orientations
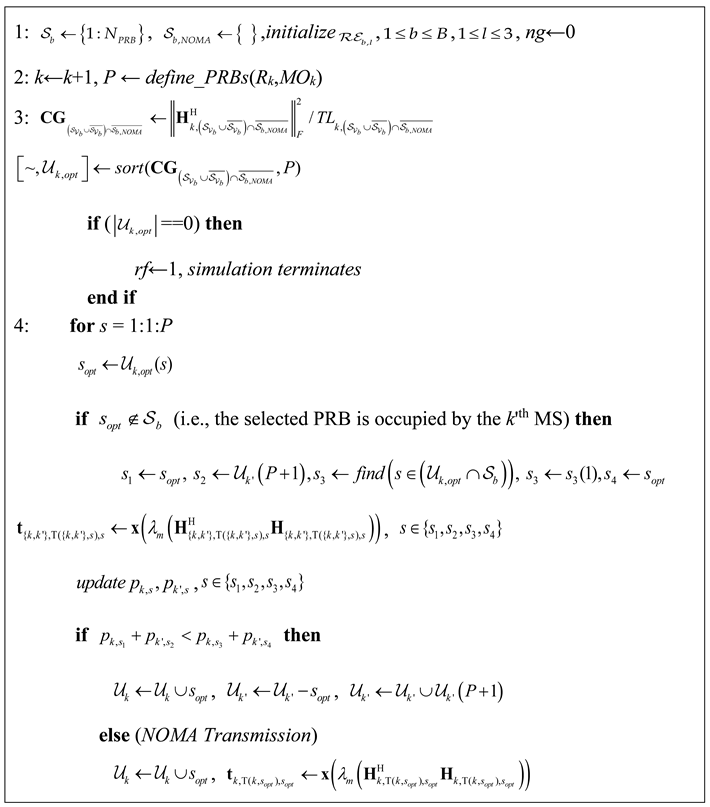
The proposed resource allocation approach is described in Table 2, while all main parameters are summarized in Table 1. At the initial stage, all VCs are initialized in Step 1 with the same number of PRBs. In the same context, all radiating REs of each VC are initialized as well (the REs of the lth AP of the bth VC are stored in the set ). MSs enter the network sequentially, requesting a specific type of service (Rk Mbps) that is translated to an equivalent number of PRBs with a specific modulation order (MO) per PRB (define_PRBs function, Step 2). For each MS that tries to access the network in the bth VC, the available PRBs are sorted according to their signal strength (Step 3). These PRBs are derived from set , where indicates all adjacent VCs with respect to the bth VC. In this case, all PRBs are considered as available, even the occupied ones, as the algorithm tries to identify the optimum PRB per MS. The sorted PRBs are stored in the set .
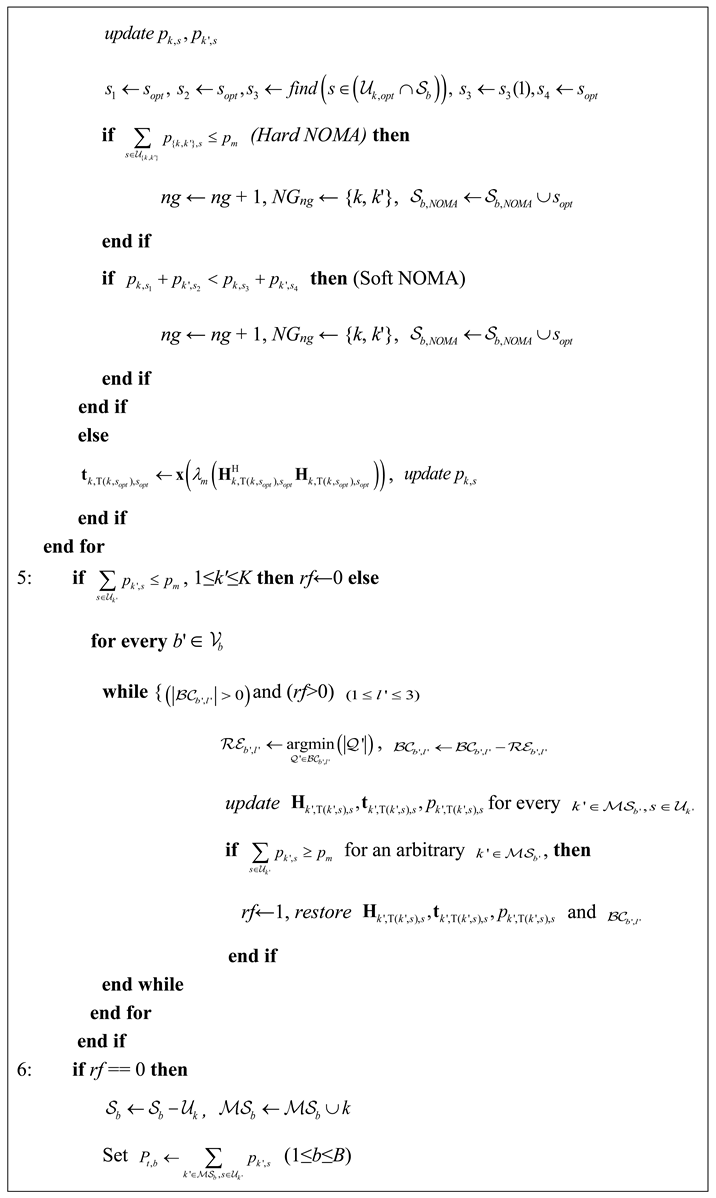
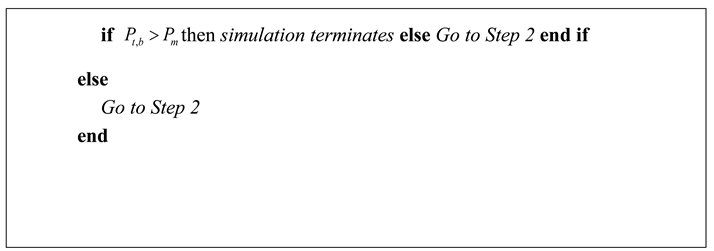
In Step 4, for each PRB power calculations take place. The algorithm initiates PRB assignment from the PRBs of the optimum set. However, if a PRB is already assigned to another MS, then PRB switching may need to take place. During PRB switching, the kth MS is allocated with the PRB that maximizes its signal strength, while the k'th MS that initially shares the same PRB with the kth MS is allocated with the next available one from its pool of PRBs. In both cases, the total downlink transmission power is evaluated. If PRB switching leads to increased transmission power, then NOMA transmission is examined. To this end, power calculations are repeated, where now both MSs share the same PRB. Hence, a new NG is formulated, that includes the kth and k'th MSs (i.e. corresponding index ng is updated). In the same context, two NOMA approaches are considered: In the first one, which will be denoted as soft NOMA (S-NOMA) throughout the rest of this work, NOMA transmission takes place only in the case where total downlink transmission power is reduced compared to the OMA case. In the second case, which will be denoted as hard NOMA (H-NOMA) the power comparison among NOMA/OMA cases is neglected. Hence, the fundamental difference between S-NOMA and H-NOMA lies in their inherent complexity, as in S-NOMA an additional power calculation step should be performed.
In Step 5, the final power calculations take place for the considered beamforming configurations per AP. The goal is to select the optimum configuration per AP of the adjacent VCs to ensure QoS for all active MSs. If no power outage takes place, then all corresponding PRB sets are updated in Step 6 (i.e., the set includes all MSs of the bth VC). Otherwise, additional beamforming configurations are examined. The simulation comes to an end either if power outage takes place in at least one VC, or there are no available PRBs for downlink transmission. In both cases, reject flag (rf) is set to 1.

Table 1.
Algorithm’s Parameters.
| Parameter | Variable |
|---|---|
| Available PRBs in the bth VC | |
| PRBs in NOMA transmission in the bth VC | |
| REs of the lth AP of the bth VC | |
| Adjacent VCs of the bth VC | |
| Available PRBs of the adjacent APs of the bth VC | |
| Beamforming configurations of the lth AP of the bth VC | |
| The MSs in the bth VC | |
| Channel gain matrix | CG |
| Maximum eigenvalue of matrix A | λm(A) |
| Eigenvector of matrix A for the λth eigenvalue | x(λ) |
Table 2.
Resource Allocation in Cell-Free Massive MIMO NOMA orientations.
5. Results
Results are presented in Figure 3, Figure 4, Figure 5, Figure 6 and Figure 7. The output KPIs are SE, EE, the assigned PRBs from adjacent VCs with respect to the serving VC, the minimum number of MSs as well as the number of REs in the topology. Moreover, two traffic scenarios (TSs) are considered: In the first case, QPSK modulation has been assumed per assigned PRB. In the second case, it is assumed that the 50%/30%/20% of the MSs are assigned with QPSK/16-QAM/64-QAM modulations per PRB, respectively. As also described in Table 3, each MS is assumed to request 15 PRBs. Hence, corresponding transmission rates may vary from 21.6 Mbps (QPSK) to 64.8 Mbps (64-QAM). Throughout the rest of the paper, all output metrics will be compared with respect to their mean values, unless otherwise stated.
MSs enter the network sequentially, as also mentioned in the previous section. Performance is evaluated statistically, with the help of a developed system-level simulator that can execute Monte Carlo (MC) simulations in parallel [9,15]. For each MC snapshot, and for each new MS that is conditionally admitted in the network, system level parameters are initially calculated, such as channel matrices, total losses, etc. Afterwards, PRB assignment takes place, based on the proposed approach described in Table 2. The potential MS is rejected if link outage takes place for another active MS. The MC simulation ends either if power outage occurs in one of the active APs, or if there are no available PRBs for downlink transmission.
All the figures depict cumulative distribution function (CDF) curves. The performance of the proposed NOMA approach is compared with respect to the OMA case in [15] (CF m-MIMO orientation). As can be observed from Fig. 3, SE can reach up to 13.5/22.2 bps/Hz for TSs 1 and 2, respectively (OMA). The increase in TS2 is expected, given the higher supported rates per MS. In H-NOMA transmission, corresponding values are 13.5/22.6 bps/Hz, respectively. However, in S-NOMA a further improvement of 4% in SE is achieved (TS2), as it reaches 23.2 bps/Hz. In this case, since NOMA is preferred only in the case where downlink transmission power is improved compared to the OMA case, more active MSs can be supported.
In Figure 4, EE is presented. As observed, EE does not degrade in the NOMA case for TS1, while a slight deterioration of approximately 4% is noted in TS2 (1.43/1.37 Mbits/J for the OMA/ NOMA cases, respectively). This reduction is rather expected, due to the more directional beamforming configurations that are required for the support of the NOMA framework. Figure 5 depicts the percentage of PRBs that are assigned to MSs of other VCs with respect to the VC of interest. It becomes apparent that in NOMA case more PRBs are available for downlink transmission for both TSs, when compared to the OMA case. Specifically, this percentage reaches 5.5%/5.9/5.9% in TS1 for the OMA/H-NOMA/S-NOMA case, respectively, leading to an improvement of almost 10%. In TS2, the corresponding values are 6.2%/6.5%/6.8%.
Figure 6 depicts the minimum number of supported MSs in the topology, as this is measured from the corresponding probability of appearance. Two cases are considered, and in particular 1/2 MSs, respectively. As it can be observed, this probability is significantly improved in TS2 for both cases of minimum MSs in NOMA transmission. In this operational mode, there are more PRBs available for downlink transmission compared to the OMA case, as previously mentioned, which in turn leverage spatial coverage. Notably, this probability improves in the S-NOMA case, due to the more effective downlink transmission power management. Specifically, for one MS (TS2), this probability reaches 1.4%,1.2%,2.1% for the OMA/H-NOMA/S-NOMA cases, respectively. It becomes apparent that this probability is significantly increased in the S-NOMA case, when compared to OMA. For two MSs, corresponding values are 1.5%,3.1%,3.7%, leading to a further probability improvement compared to the previous case. Similar conclusions can be drawn in the case of TS1 as well. For one MS, this probability reaches 22.6%,21.4%,26.4% for the OMA/H-NOMA/S-NOMA cases, respectively. For two MSs, corresponding values are now 20.7%/22.2%/24.6%. Hence probability improvement when comparing the S-NOMA/OMA cases is almost 19%.
Finally, Figure 7 illustrates the total number of REs in the topology. As expected, this number increases in NOMA transmission for high data rate services, since supporting a greater number of PRBs with higher modulation orders inevitably leads to more directive radiation patterns. However, the increase in hardware complexity, which is directly related to the total number of active REs, is offset by the corresponding gain in the number of available PRBs for downlink transmission and the minimum number of MSs in the topology. Specifically, the increase is limited to 5% for TS1 and NOMA transmission (626/636/605 REs for the H-NOMA/S-NOMA/OMA cases, respectively) and 7.5% for TS2 (758/758/705 REs for the H-NOMA/S-NOMA/OMA cases, respectively).
6. Conclusions
The performance of a cooperative adaptive beamforming approach was evaluated in combination with NOMA transmission and cell-free resource allocation. In this context, large-scale mmWave broadband networks were considered. Rather than selecting the optimal pair of NOMA users based on channel characteristics and distance, each user is assigned the physical resource block that maximizes its signal strength. Cooperative beamforming is then employed to mitigate the effects of co-channel interference. As a result, various performance metrics were improved, including the minimum number of active users in the topology and available physical resource blocks for downlink transmission, all with minimal hardware overhead. Thus, the multitude of available radiation patterns in a cell-free massive MIMO antenna orientation facilitates efficient resource optimization in multiuser scenarios.
Future work will focus on deploying machine learning techniques for selecting the optimal beamforming configuration per AP, as well as exploring cooperative NOMA strategies.
Author Contributions
Conceptualization, P.G. and S.L.; methodology, P.G.; software, L.S.; validation, P.G., G.V. and K.P.; formal analysis, G.V.; investigation, K.P.; resources, S.L.; data curation, P.T.; writing—original draft preparation, L.S.; writing—review and editing, P.G.; visualization, S.L.; supervision, P.G. All authors have read and agreed to the published version of the manuscript
Conflicts of Interest
The authors declare no conflicts of interest.
Abbreviations
The following abbreviations are used in this manuscript:
| 5G | Fifth Generation |
| 3GPP | Third Generation Partnership Project |
| 6G | Sixth Generation |
| AP | Access Point |
| CCI | Co-Channel Interference |
| CDF | Cumulative Distribution Function |
| CF | Cell Free |
| DL | Deep Learning |
| EE | Energy Efficiency |
| eMBB | enhanced Mobile BroadBand |
| Inter-CCI | Intercell Co-Channel Interference |
| Intra-CCI | Intracell Co-Channel Interference |
| IoT | Internet of Things |
| IRS | Intelligent Reflecting Surface |
| KPI | Key Performance Indicator |
| MEC | Multi-access Edge Computing |
| MC | Monte Carlo |
| MO | Modulation Order |
| mMTC | massive Machine Type Communications |
| m-MIMO | massive Multiple Input Multiple Output |
| mmWave | millimeter wave |
| MRC | Maximal Ratio Combining |
| MS | Mobile Station |
| NFV | Network Function Virtualization |
| NOMA | Non Orthogonal Multiple Access |
| NG | NOMA Group |
| OMA | Orthogonal Multiple Access |
| PRB | Physical Resource Block |
| QoS | Quality of Service |
| RE | Radiating Element |
| SE | Spectral Efficiency |
| SJR | Signal to Jamming Ratio |
| SIC | Successive Interference Cancelation |
| SINR | Signal to Interference plus Noise Ratio |
| TL | Total Losses |
| TS | Traffic Scenario |
| UAV | Unmanned Aerial Vehicle |
| UDN | Ultra Dense Networks |
| URLLC | Ultra-Reliable Low Latency Communications |
| VC | Virtual Cell |
| XPR | Cross-Polarization Power Ratio |
References
- Liu, Y.; Clerckx, B.; Popovski, P. Network slicing for eMBB, URLLC, and mMTC: An uplink rate-splitting multiple access approach. IEEE Trans. Wireless Commun. 2024, 23, 2140–2152. [Google Scholar] [CrossRef]
- Albreem, M.A.; Juntti, M.; Shahabuddin, S. Massive MIMO detection techniques: A Survey. IEEE Commun. Surv. Tutor. 2019, 21, 3109–3132. [Google Scholar] [CrossRef]
- Wang, X. Millimeter wave communication: A comprehensive survey. IEEE Commun. Surv. Tutor. 2018, 20, 1616–1653. [Google Scholar] [CrossRef]
- Makki, B.; Chitti, K.; Behravan, A.; Alouini, M.-S. A survey of NOMA: Current status and open research challenges. IEEE Open Journal of the Communications Society 2020, 1, 179–189. [Google Scholar] [CrossRef]
- Lu, Y.; Zhang, P.; Duan, Y.; Guizani, M.; Wang, J.; Li, S. Dynamic scheduling of IoV edge cloud service functions under NFV: A multi-agent reinforcement learning approach. IEEE Trans. Veh. Tech. 2024, 73, 5730–5741. [Google Scholar] [CrossRef]
- Tinh, B.T.; Nguyen, L.D.; Kha, H.H.; Duong, T.Q. Practical optimization and game theory for 6G ultra-dense networks: Overview and research challenges. IEEE Access 2022, 10, 13311–13328. [Google Scholar] [CrossRef]
- Jawarneh, A.; Kadoch, M.; Albataineh, Z. Decoupling energy efficient approach for hybrid precoding-based mmWave massive MIMO-NOMA with SWIPT. IEEE Access 2022, 10, 28868–28884. [Google Scholar] [CrossRef]
- Khazali, A.; Bozorgchenani, A.; Tarchi, D.; Shayesteh, M.G.; Kalbkhani, H. Joint task assignment, power allocation and node grouping for cooperative computing in NOMA-mmWave mobile edge computing. IEEE Access 2023, 11, 93664–93678. [Google Scholar] [CrossRef]
- Gkonis, P.; Trakadas, P.; Sarakis, L.; Giannopoulos, A.; Spantideas, S.; Capsalis, N. On the performance evaluation of 5G MIMO networks employing NOMA via system-link level simulations. IEEE 9th International Conference on Information, Communication and Networks (ICICN), Xi'an, China, 2021, 264–268. [CrossRef]
- Dang, X. -T.; Nguyen, H.V.; Shin, O.-S. Optimization of IRS-NOMA-assisted cell-free massive MIMO systems using deep reinforcement learning. IEEE Access 2023, 11, 94402–94414. [Google Scholar] [CrossRef]
- Perdana, R.H.Y.; Nguyen, T. -V.; An, B. Adaptive user pairing in multi-IRS-aided massive MIMO-NOMA networks: Spectral efficiency maximization and deep learning design. IEEE Trans. Commun. 2023, 71, 4377–4390. [Google Scholar] [CrossRef]
- Wang, J.; Liu, Y.; Mu, X.; Ma, X.; Liu, W.; Xie, W. Joint subchannel and power allocation in NOMA-based spatial modulation systems. IEEE Trans. Wirel. Commun. 2024, 23, 12020–12037. [Google Scholar] [CrossRef]
- Amhaz, A.; Elhattab, M.; Sharafeddine, S.; Assi, C. UAV-assisted cooperative downlink NOMA: Deployment and resource allocation. IEEE Trans. Veh. Tech. 2024, 73, 13651–13664. [Google Scholar] [CrossRef]
- Study Channel Model for Frequencies From 0.5 to 100 GHz, document TR 38.901, 3GPP, Version 14.3.0, Release 14, 2018.
- Gkonis, P.; Lavdas, S.; Vardoulias, G.; Trakadas, P.; Sarakis, L.; Papadopoulos, K. System level performance assessment of large-scale cell-free massive MIMO orientations with cooperative beamforming. IEEE Access 2024, 12, 92073–92086. [Google Scholar] [CrossRef]
- Zheng, W.C.; Zhang, L.; Li, Q.X.; Leng, Y. Dual-band dual-polarized compact bowtie antenna array for anti-interference MIMO WLAN. IEEE Trans. Antennas Propag. 2014, 62, 237–246. [Google Scholar] [CrossRef]
- Balanis, C. Antenna Theory: Analysis and Design. Hoboken, NJ, USA: Wiley, 2016.
- Giuliano, R.; Monti, C.; Loreti, P. WiMAX fractional frequency reuse for rural environments. IEEE Wireless Commun. 2008, 15, 60–65. [Google Scholar] [CrossRef]
Figure 3.
Cumulative distribution function of SE.
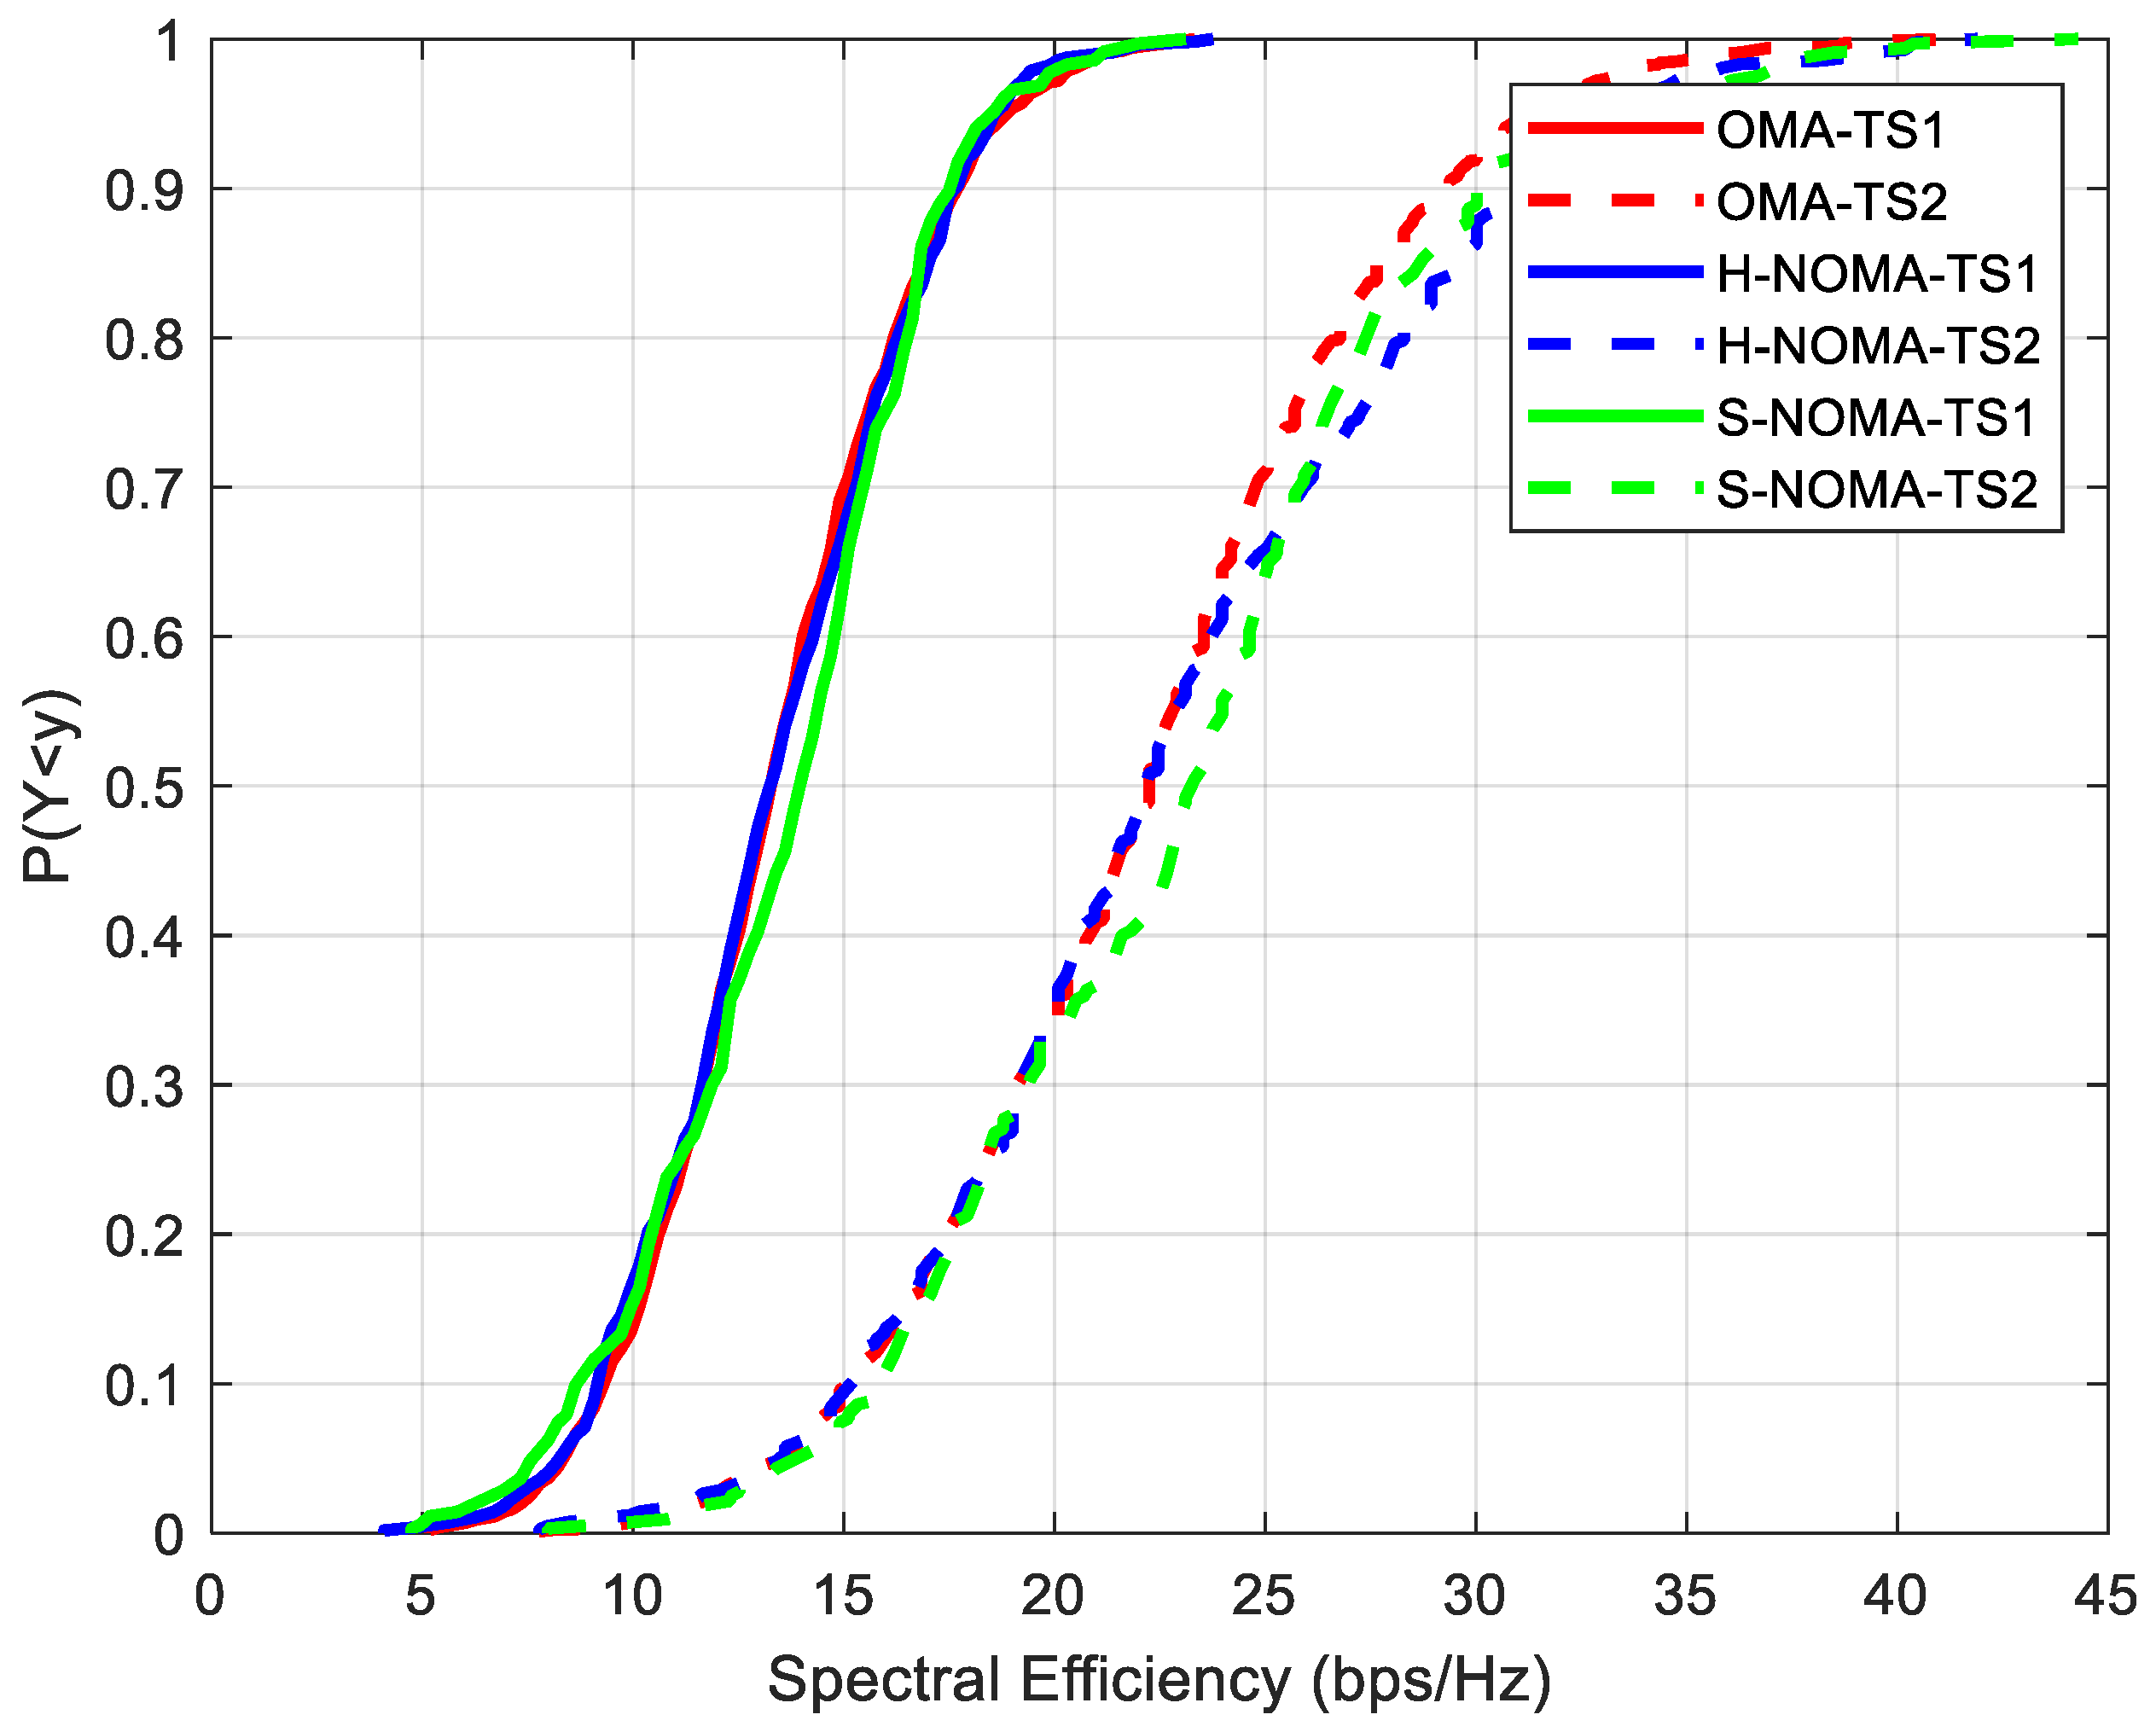
Figure 4.
Cumulative distribution function of EE.
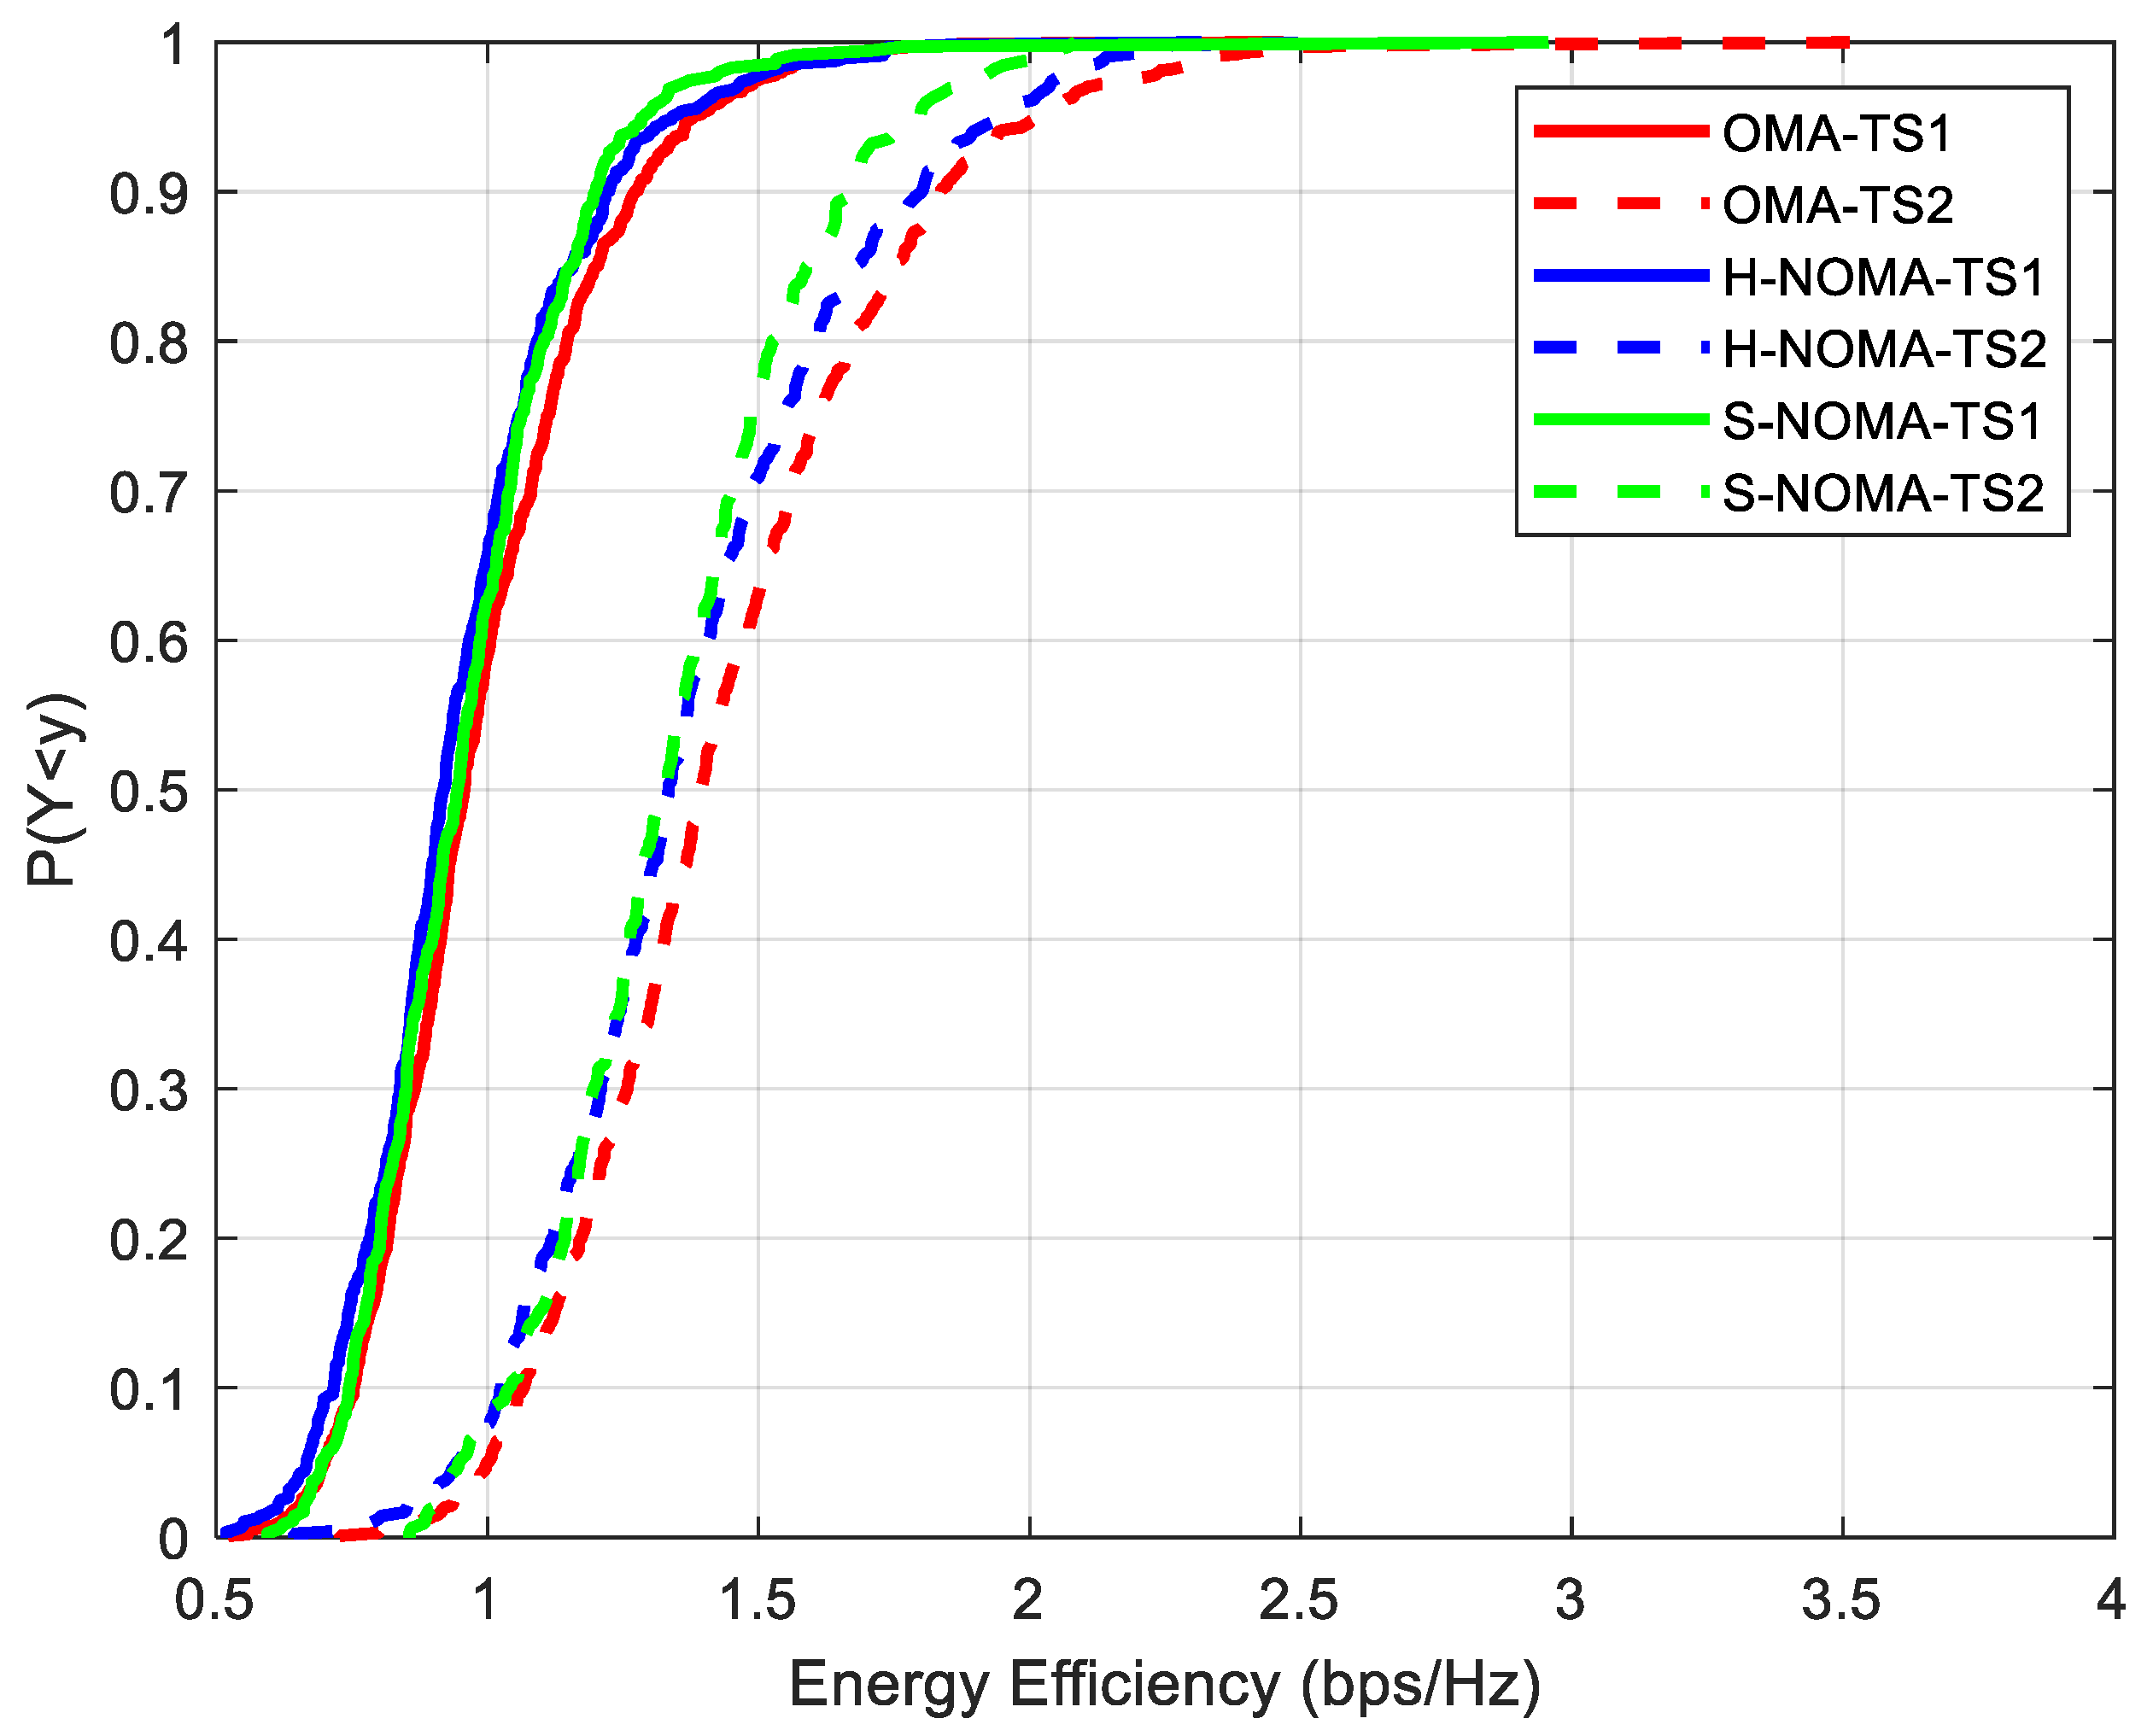
Figure 5.
Cumulative distribution function of the available PRBs for downlink transmission from adjacent VCs.
Figure 5.
Cumulative distribution function of the available PRBs for downlink transmission from adjacent VCs.
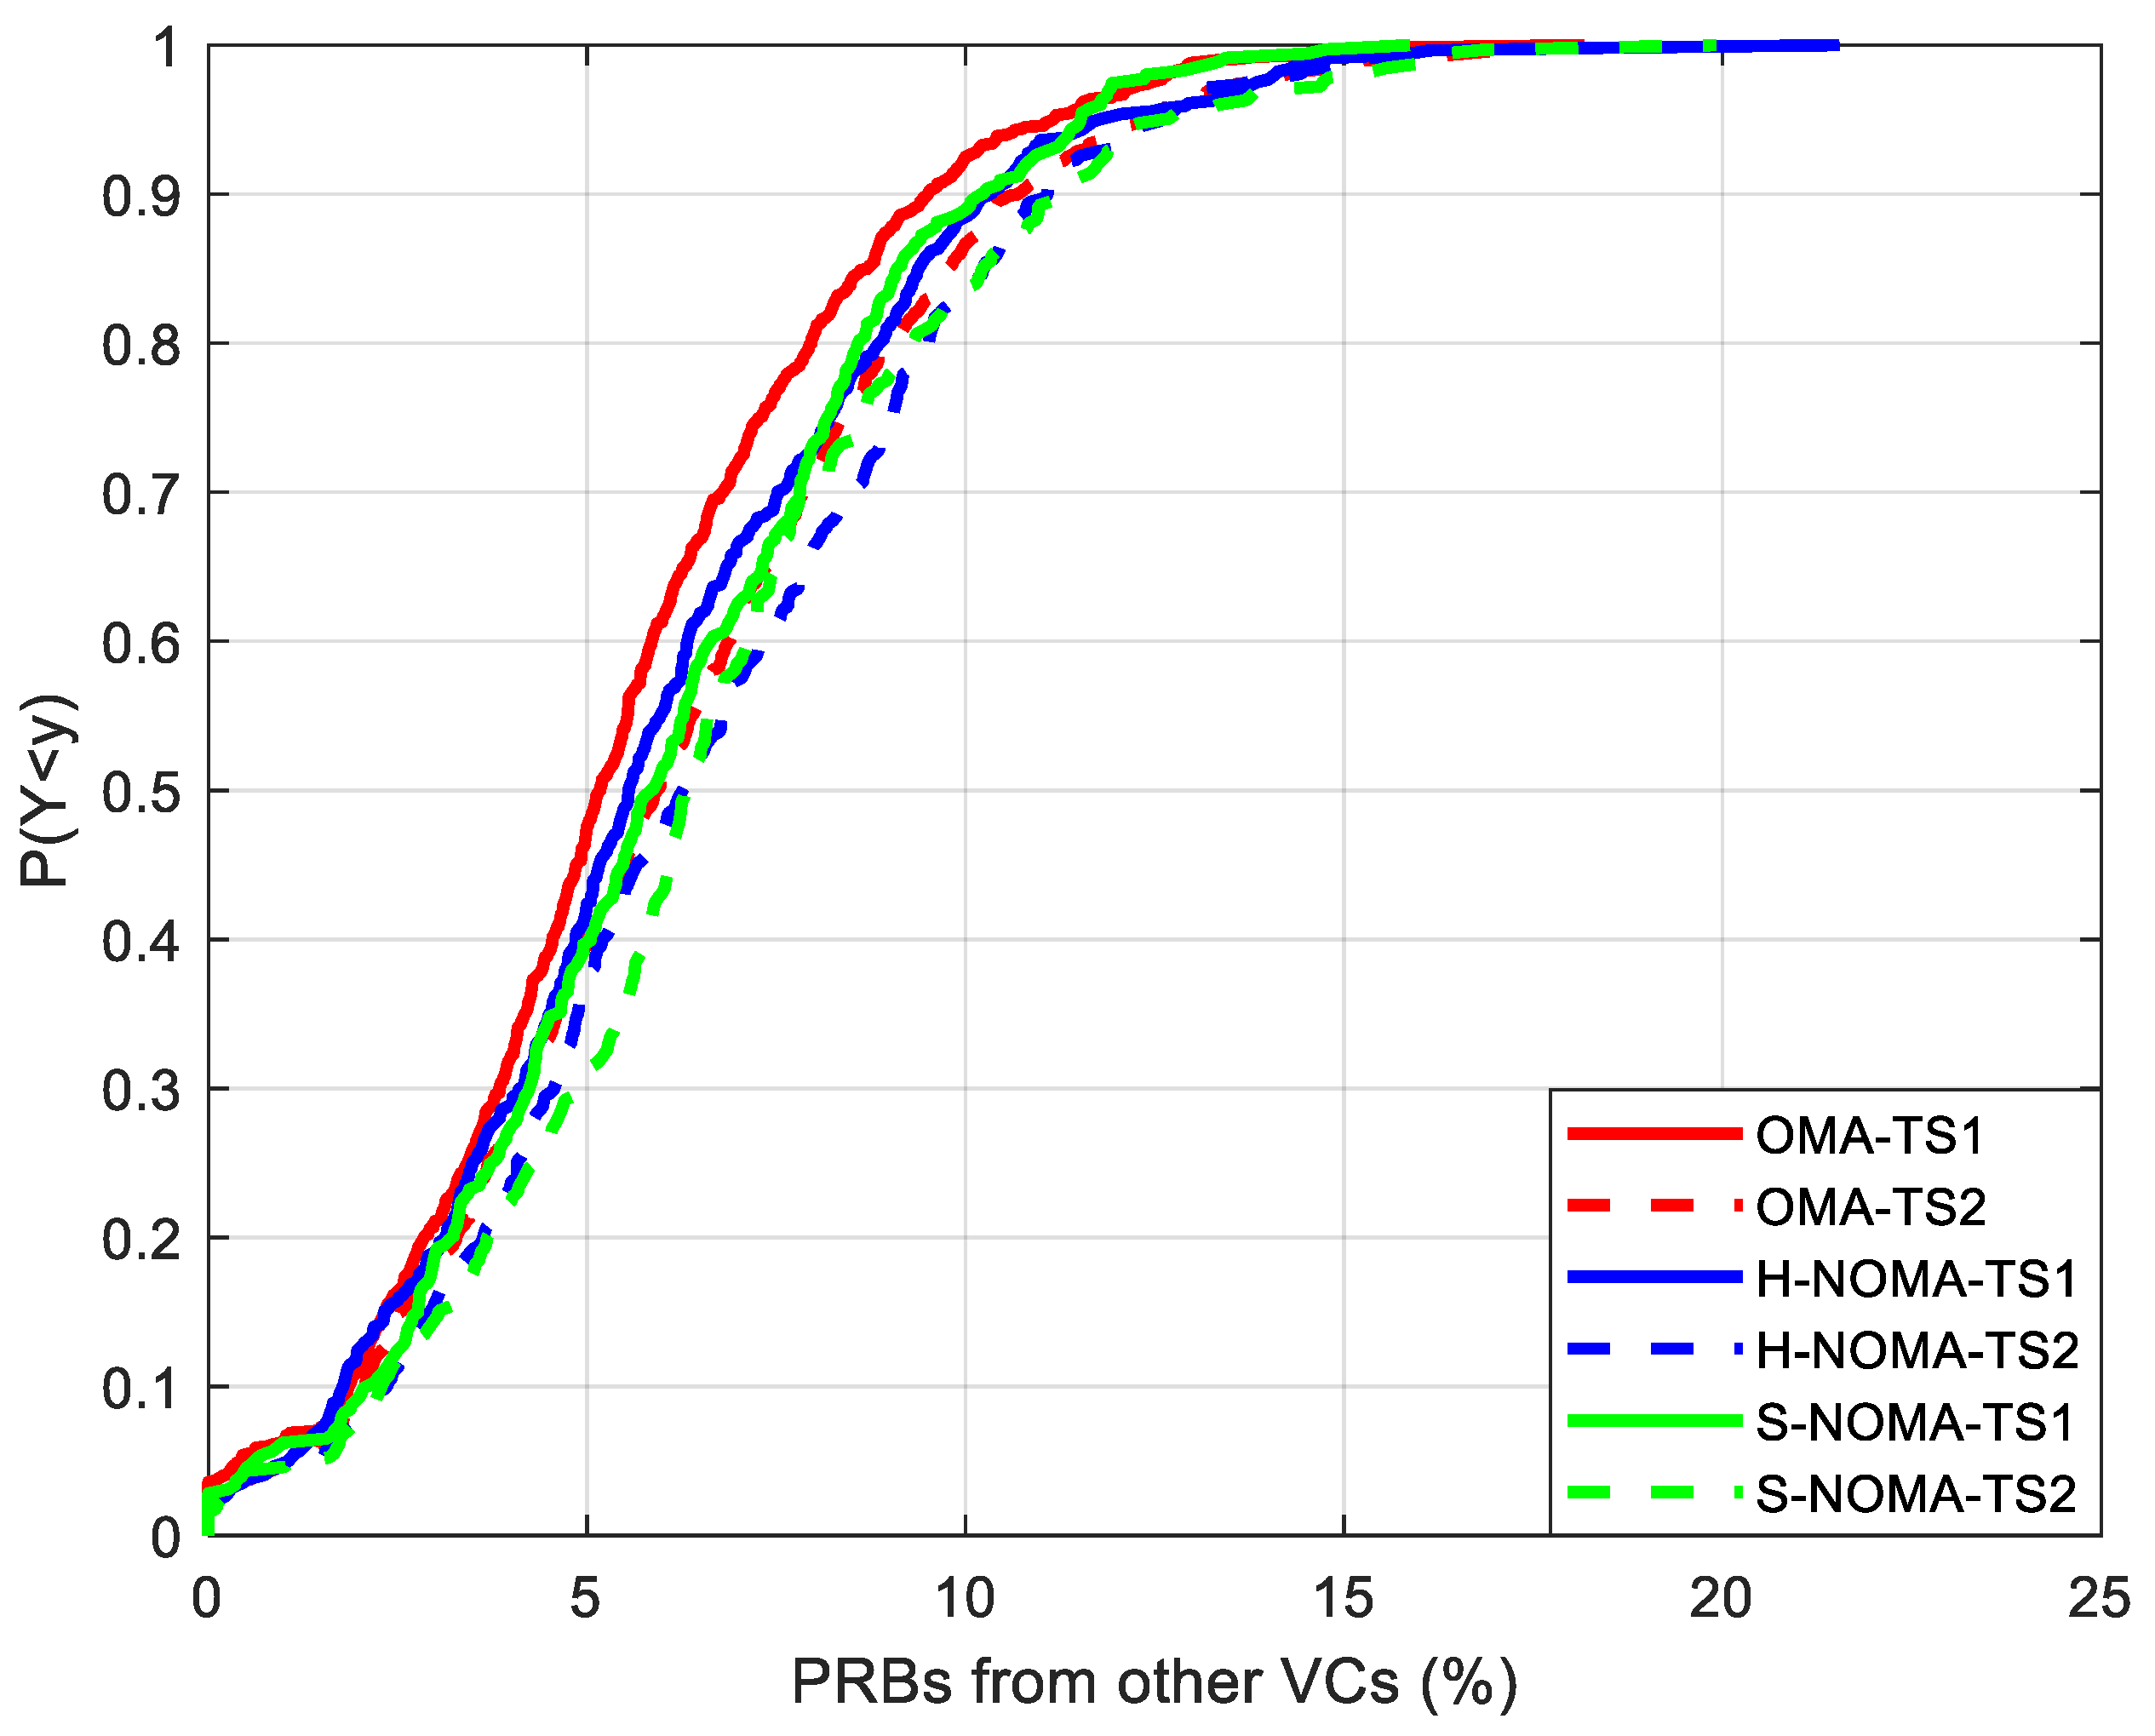
Figure 6.
Propability of appeareance of the minimum number of MSs.
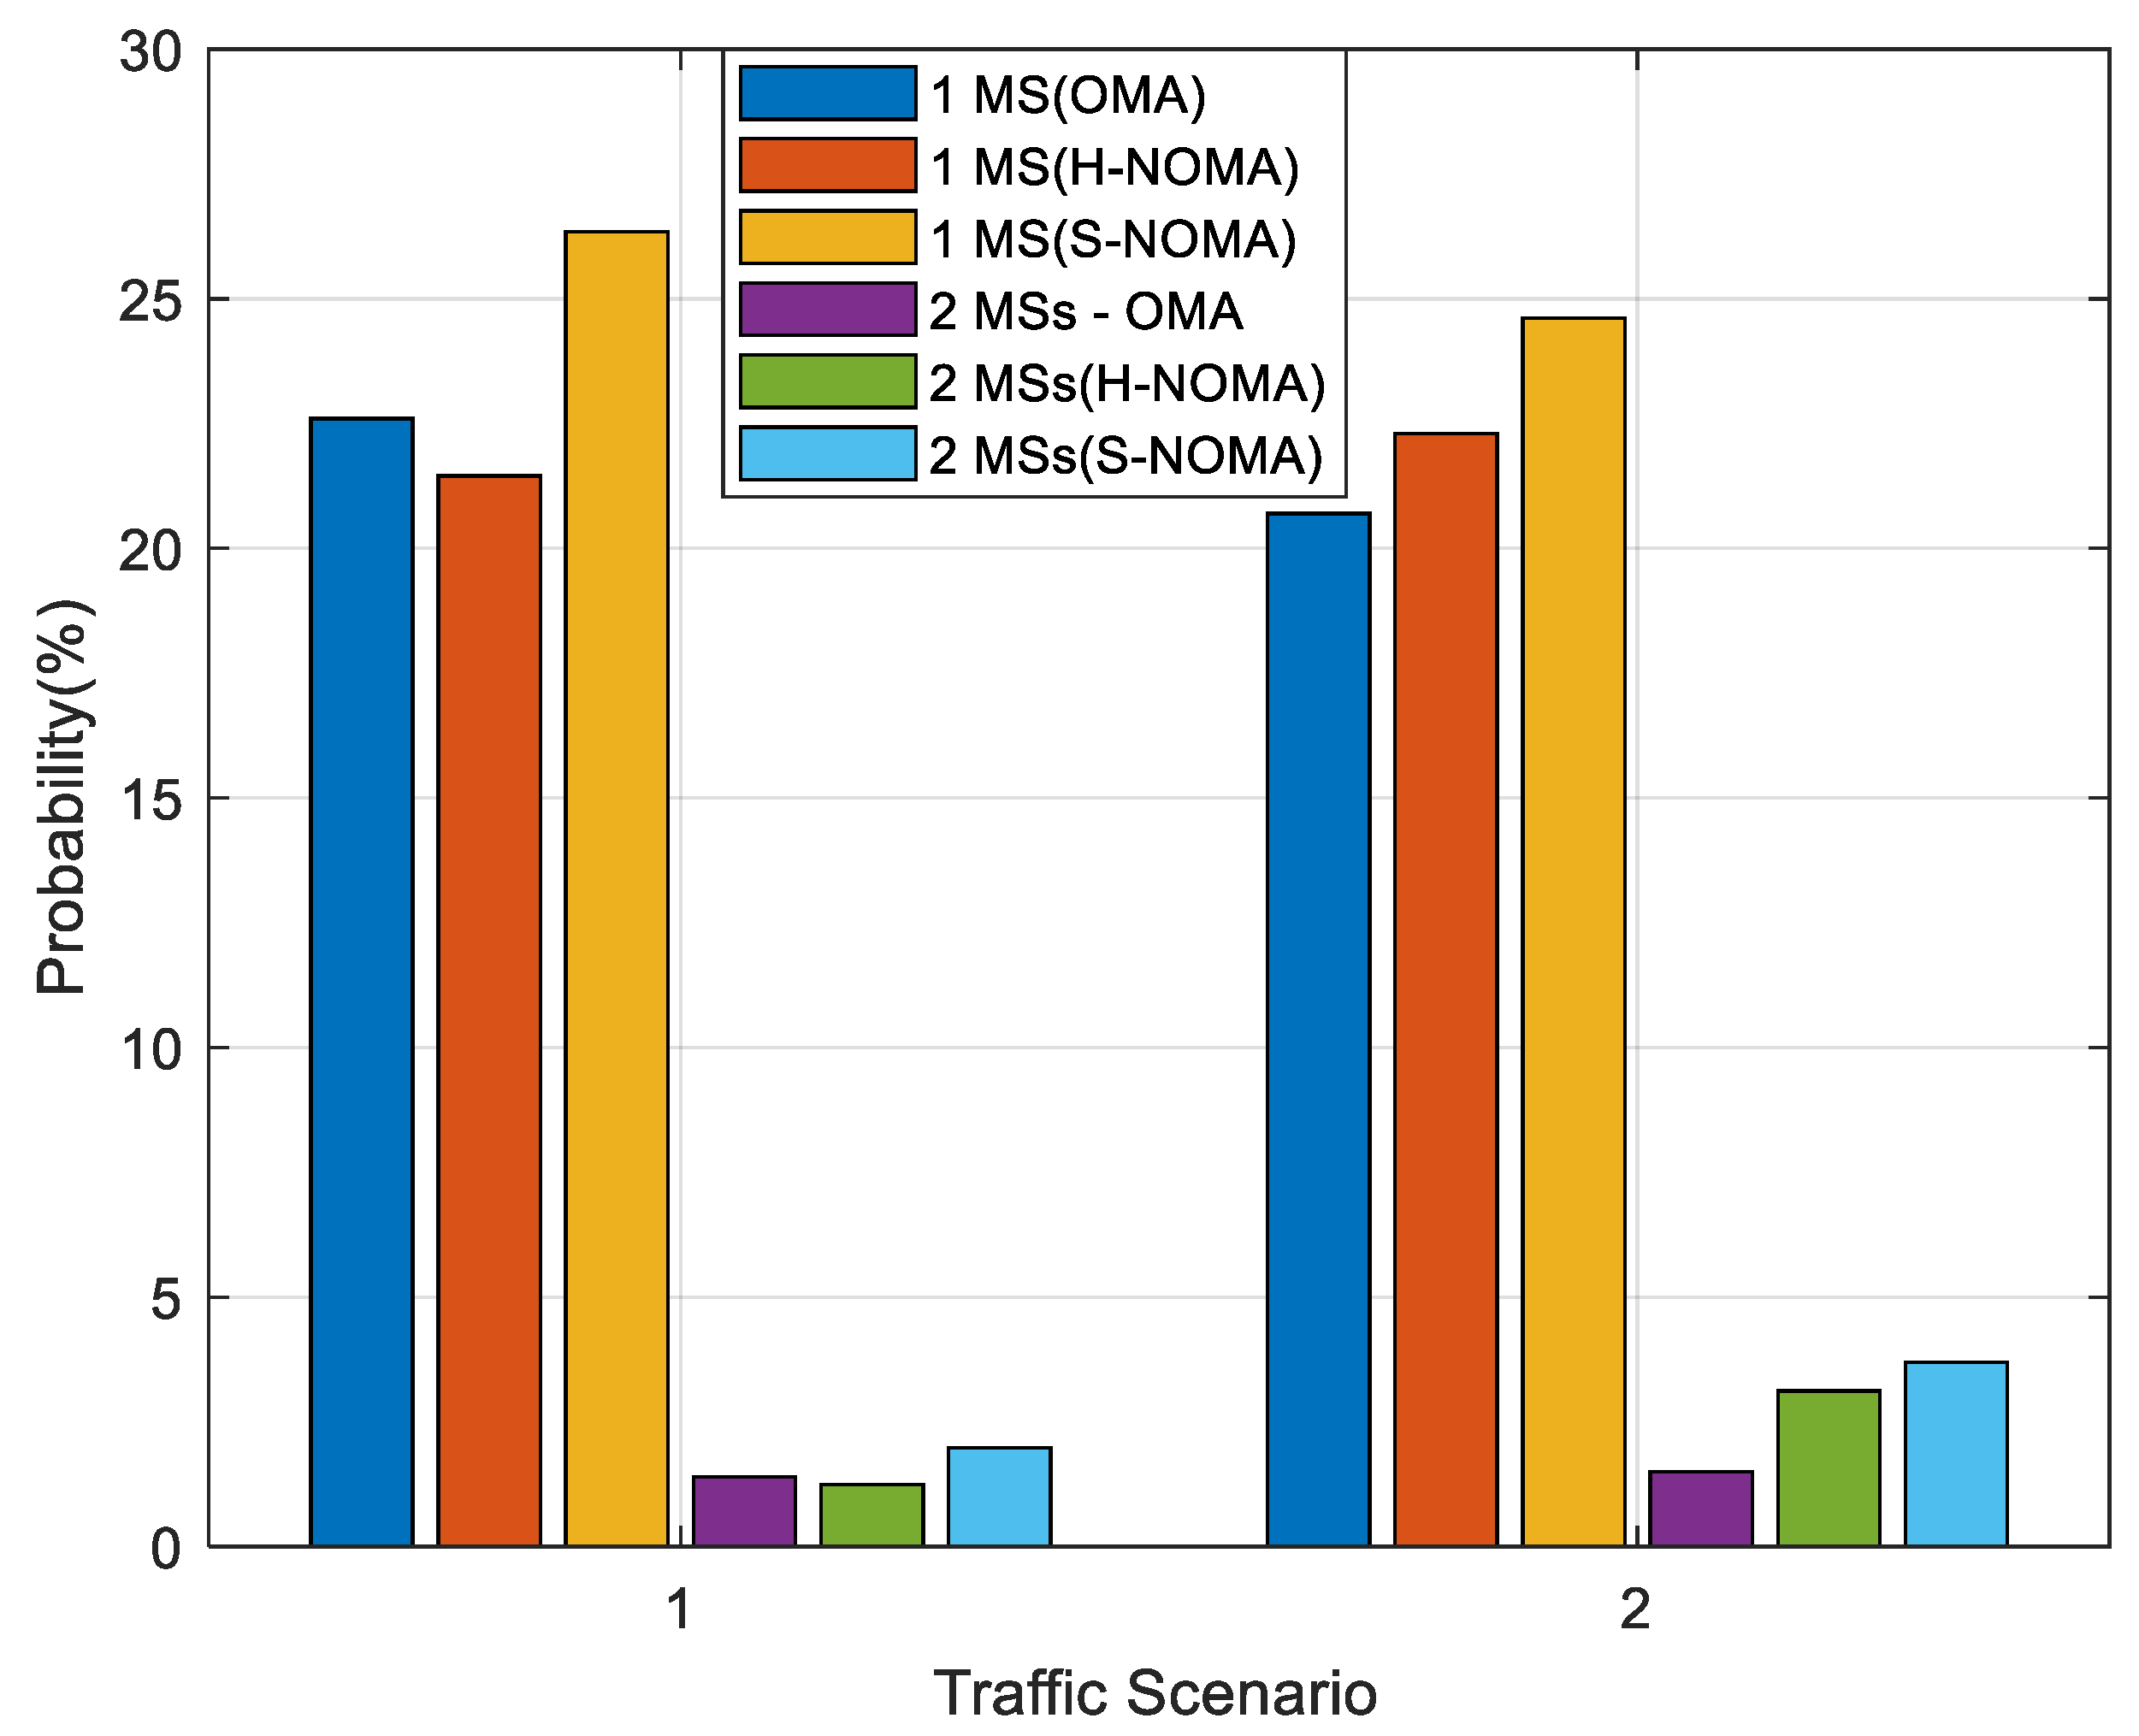
Figure 7.
Cumulative distribution function of the number of REs.
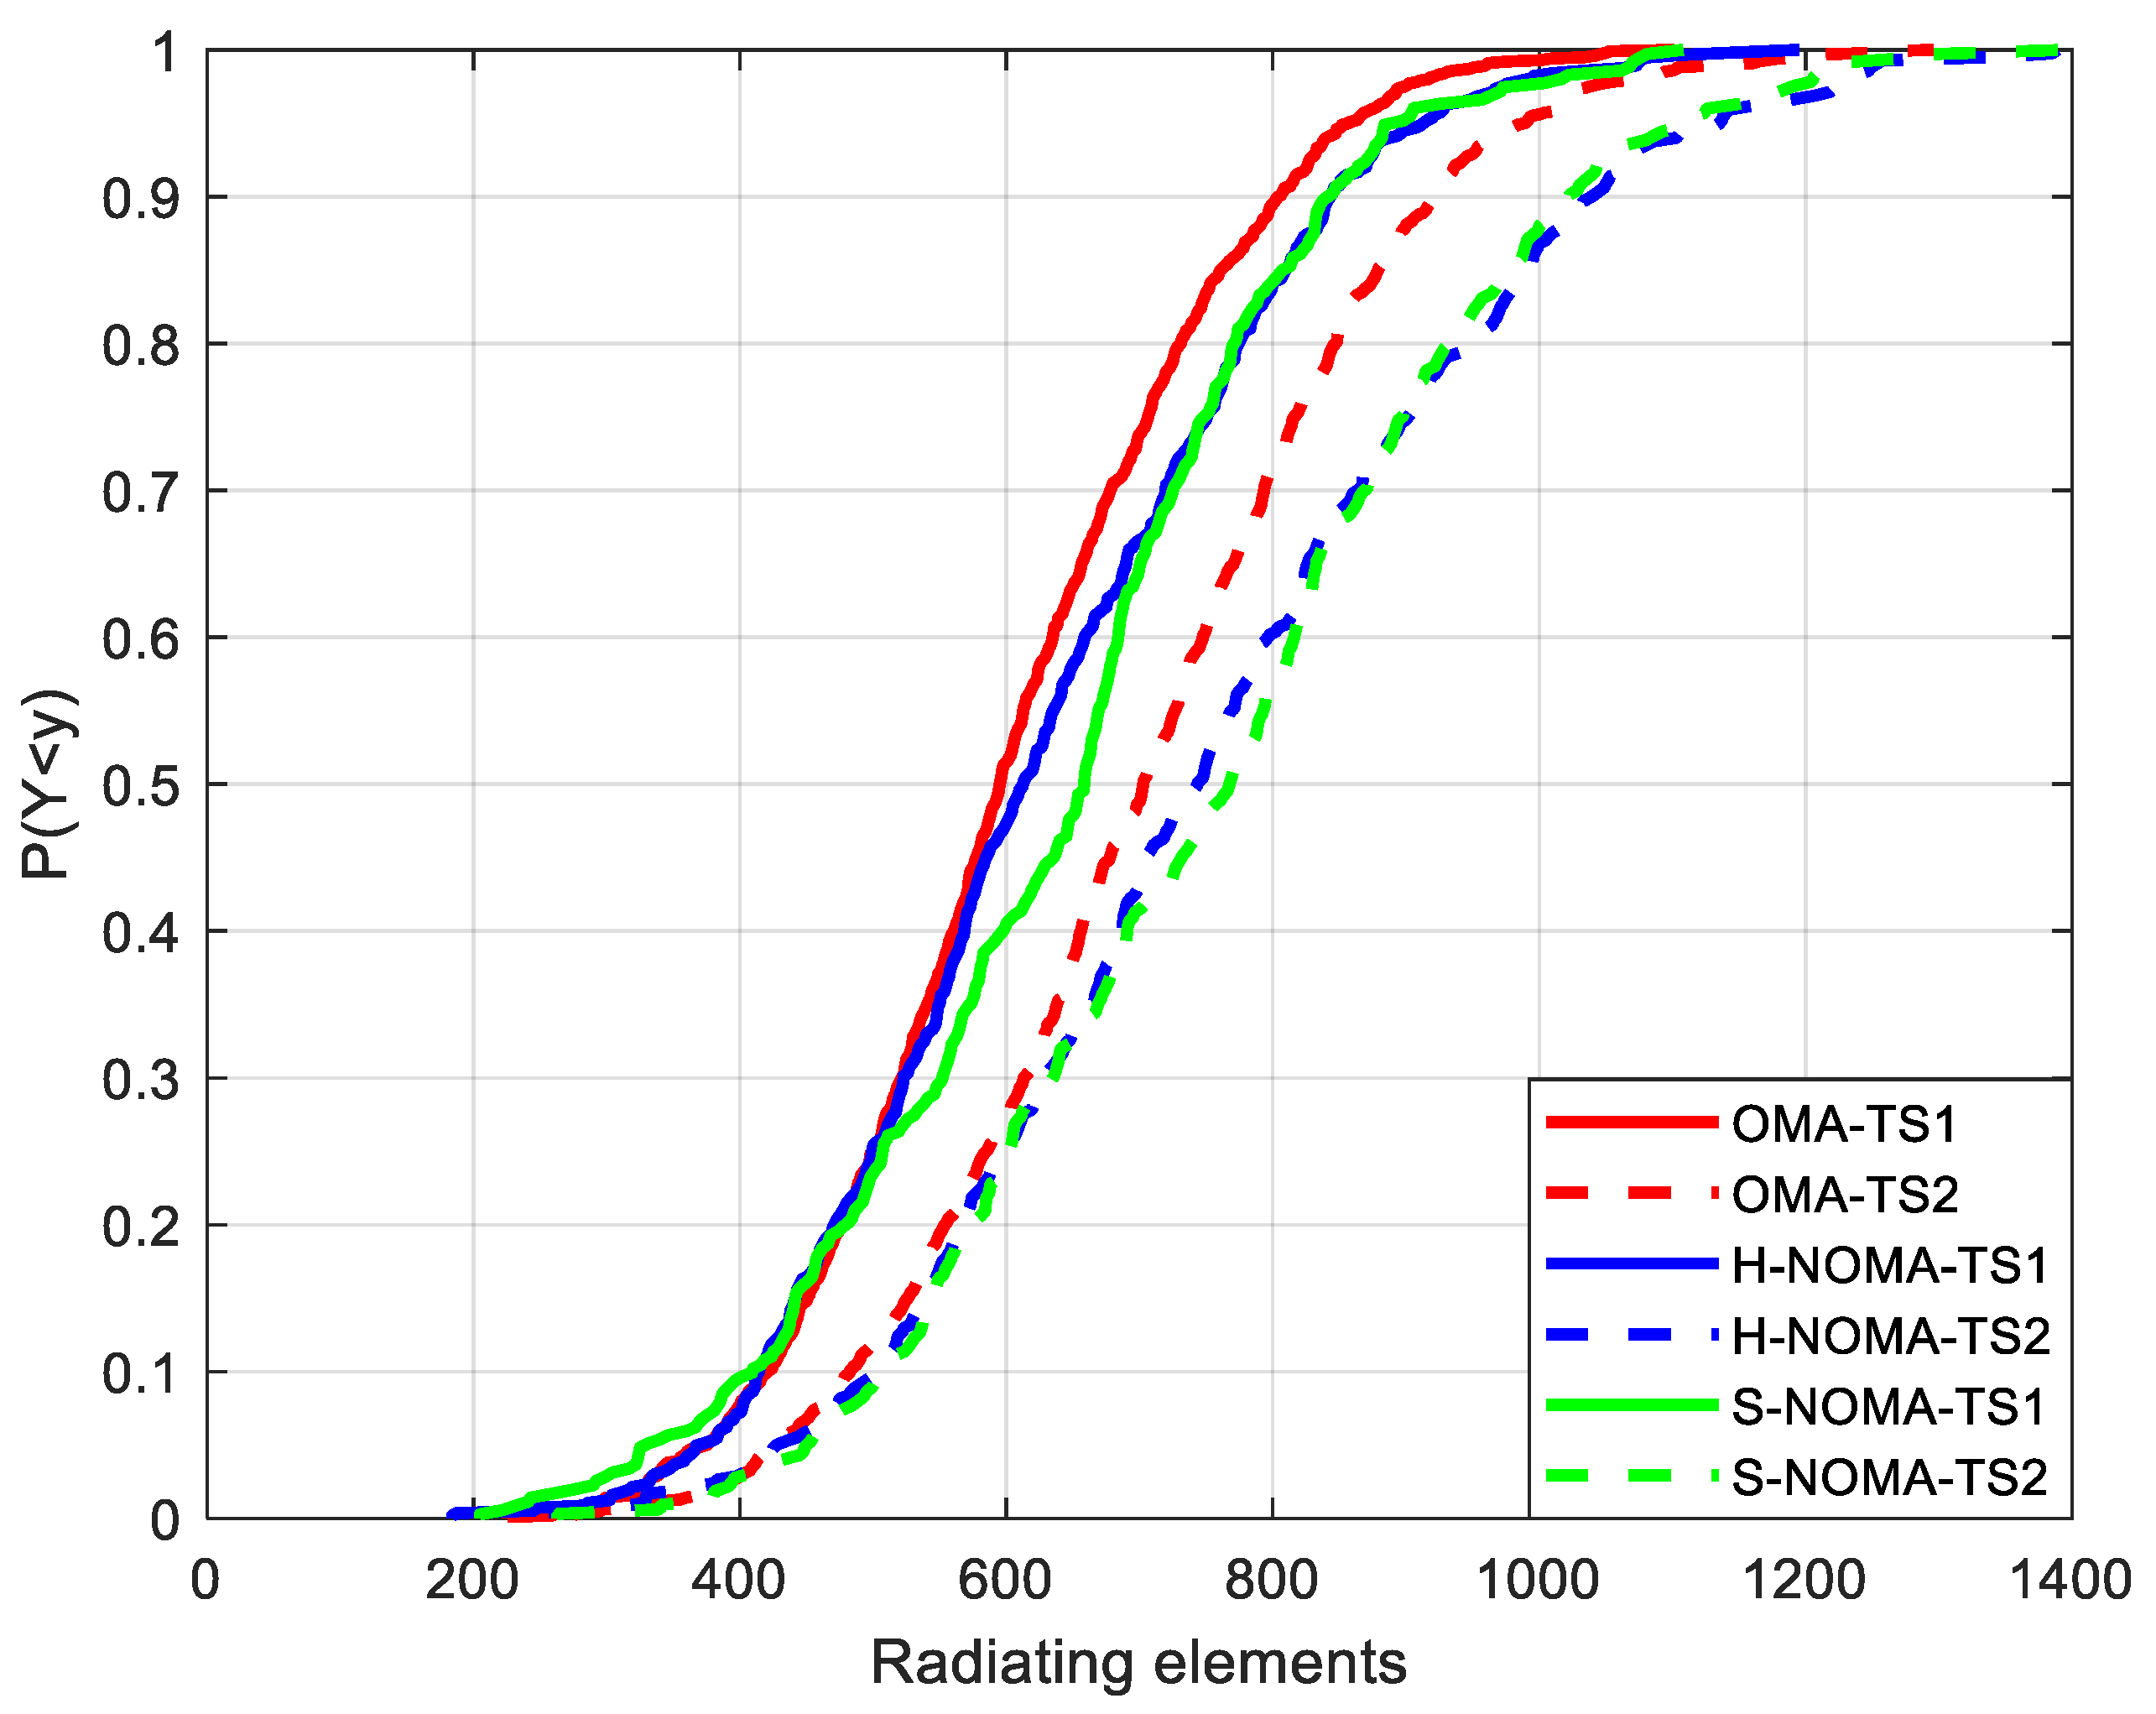
Table 3.
Simulation Parameters.
| Parameter | Value or Assumption |
|---|---|
| Number of virtual cells (B) | 19 |
| Access points per virtual cell | 3 |
| Cell radius (m) | 500 |
| Total bandwidth (MHz) | 100 |
| Pathloss model [14] | UMa |
| Carrier frequency (GHz) | 28 |
| Subcarrier spacing (kHz) | 60 |
| Subcarriers per PRB | 12 |
| PRBs per VC | 132 |
| Number of clusters/Subpaths per cluster [14] | 6/20 |
| Requested PRBs per MS | 15 |
| Monte Carlo snapshots per scenario | 103 |
| Antenna elements per MS (Mr) | 2 |
| Maximum transmission power per BS/MS (Pm/pm) (W) | 20/1 |
| Required Eb/No (dB) for QPSK/16-QAM/64-QAM modulation | 9.6/16.4/22.7 [18] |
| Transmission rate per MS for QPSK/16-QAM/64-QAM modulation (Mbps) | 21.6/43.2/64.8 |
Disclaimer/Publisher’s Note: The statements, opinions and data contained in all publications are solely those of the individual author(s) and contributor(s) and not of MDPI and/or the editor(s). MDPI and/or the editor(s) disclaim responsibility for any injury to people or property resulting from any ideas, methods, instructions or products referred to in the content. |
© 2024 by the authors. Licensee MDPI, Basel, Switzerland. This article is an open access article distributed under the terms and conditions of the Creative Commons Attribution (CC BY) license (http://creativecommons.org/licenses/by/4.0/).
Copyright: This open access article is published under a Creative Commons CC BY 4.0 license, which permit the free download, distribution, and reuse, provided that the author and preprint are cited in any reuse.


