Submitted:
21 October 2024
Posted:
24 October 2024
You are already at the latest version
Abstract
In typical whiskey, the content of higher alcohols is about 1500-2000 mg/L, lead to high intoxicating degree (ID). To produce the low-ID whiskey, the Saccharomyces cerevisiae XF0-h, XF0-H and XF0-LH were successfully constructed by CRISPR-Cas9 gene editing technology to knock out HOM2 (encoding aspartate β-semialdehyde dehydrogenase) in the original strain XF0 and the LEU1 knockout strain XF0-L. The content of higher alcohols in whiskey fermented by the XF0-h, XF0-H, and XF0-LH were 704±8 mg/L, 685±6 mg/L, and 685±19 mg/L, respectively, showing reductions of 23.93%, 25.98%, and 15.81% compared to the XF0, XF0, and XF0-L. The fermentation conditions of the XF0-LH were optimized through single-factor experiments and Box-Behnken design. The optimal conditions were the wort concentration of 9.8 °P, the hydrolyzed broken rice syrup addition of 78 g/L, and the inoculum size of 2.7 × 10⁶ cells/mL. The low-ID whiskey was brewed with higher alcohols content at 556 mg/L by 50L fermenter at the optimal conditions.
Keywords:
CRISPR-Cas9
; HOM2 gene
; Higher alcohols
; Whiskey
; Box-Behnken design
1. Introduction
Alcoholic fermentation is a critical process in whiskey production, during which yeast generates both ethanol and higher alcohols [1,2]. The higher alcohols in whiskey mainly include n-propanol, isobutanol, isoamylol, etc., which have an important influence on the flavor and taste of whiskey [3]. A moderate content of higher alcohols can make the flavor of whiskey fuller and richer. The intoxicating degree (ID) of alcohol is enhanced by excessive higher alcohols, especially when isoamylol is excessive [4,5], because of isoamylol causes ethanol and acetaldehyde to remain in the body for a longer time with intoxication symptoms such as headache, nausea and hangover [6,7,8]. The higher alcohols in whiskey mainly originate from sugar metabolism pathway and amino acid metabolism of yeast [6]. It was reported that higher alcohos can be regulated by key genes of the higher alcohols metabolic pathway in Saccharomyces cerevisiae (S. cerevisiae) [9,10,11,12]. Isopropylmalate synthase encoded by the LEU1 gene is a key enzyme in the pathway of conversion of pyruvic acid to α-ketobutyric acid. Expression of LEU1 gene affects the conversion between α-keto isovaleric and α-keto isohexanoic acid, which causes changes in the production of higher alcohols [13,14,15,16].
Aspartate β-semialdehyde dehydrogenase, which is encoded by the HOM2 gene, is a key enzyme in the second step of the pathway that synthesizes threonine and O-acetylhomoserine from aspartate [17]. Disrupted expression of the HOM2 gene affects the amount of corresponding amino acids synthesized by yeast, which in turn causes changes in the production of higher alcohols. It was reported that aspartate β-semialdehyde dehydrogenase directly influences the Ehrlich pathway [18]. The HOM2 knockout strains show a significant reduction in the production of isoamylol and isobutanol [19]. Knockout of one allele of HOM2 and both of its alleles resulted in a significant reduction of isoamylol content in Chinese rice wine [20]. Fewer studies have been conducted on the effect of the HOM2 gene on the content of higher alcohols in spirits and whiskey.
Conventional knockout methods typically require replacing the target gene with a selectable marker gene. It also necessitates the removal of this marker gene to ensure the yeast is suitable for industrial production [21,22,23]. These methods generally allow for the knockout of only one gene at a time, and when multiple genes need to be modified, the recycling of marker genes is limited. Furthermore, conventional techniques often suffer from low editing efficiency and lengthy transformation cycles. The CRISPR-Cas system, which is a self-defense mechanism used by bacteria and archaea to prevent the invasion of foreign viruses, is now widely used in gene editing research [24,25]. The CRISPR-Cas9 system is an effective tool for simultaneously editing multiple genes in S. cerevisiae. In the CRISPR-Cas9 system the target sequence is recognized by guide RNA (gRNA). The Cas9 protein then specifically cleaves the target site causing DNA double-strand breaks, which stimulates the cellular repair mechanism and realizes the genetic modification without screening markers [26,27,28].
The wort used in the fermentation of whiskey has a complex nutrient profile. Yeast obtains the nutrients for growth reproduction and producing by-products such as higher alcohols. The ratio of carbon to assimilable nitrogen (C/N) in wort is a important factor affecting the content of higher alcohols, which differed in wort fermented with different wort concentrations [29]. During alcohol fermentation, yeast primarily produces ethanol and higher alcohols. The yield of higher alcohols varies significantly with different inoculation [30].
S. cerevisiae XF0-h and XF0-H were constructed by knocking out HOM2. S. cerevisiae XF0-LH was constructed by knocking out HOM2 and LEU1. At the same time, we optimized the fermentation process to reduce higher alcohols in whiskey to decrease intoxicating degree and to improve the taste of whiskey. The brewing technology will be obtained to produce high-quality whiskey.
2. Materials and Methods
2.1. Materials and Reagents
2.1.1. Strains and Plasmids
The strains and plasmids are listed in Table S1 (Supporting Information). The Escherichia coli DH5α with p414-Cas9-BleoR or p426-gRNA-HOM2-kanMX was cultured in Luria-Bertani (LB) broth with 100 μg/mL ampicillin (Aladdin, Shanghai, China) at 37 °C. The S. cerevisiae strains were cultured at 30 °C in the YPD medium, and 200 µg/mL of Zeocin™ (Thermo Fisher, Shanghai, China) and 100 µg/mL of G418 (Aladdin, Shanghai, China) were used to screen positive transformants with Zeocin™ and KanMX resistance, respectively [31].
2.1.2. Design and Synthesis of Primers
The primers are listed in Table S2 (Supporting Information). The HOM2 gene sequence (Genomic Sequence: NC_001136) of S. cerevisiae (S288c) was retrieved from the National Center for Biotechnology Information (NCBI). Primers were designed by SnapGene and synthesized by Shanghai Sangon Bioengineering Co., Ltd (Shanghai, China).
2.1.3. Wort Preparation
The crushed malt was added with distilled water at the ratio of 1:4 (kg/L) and stirred well for saccharification. Saccharification procedure: heating to 53-55 °C for 60 minutes, 63-65 °C for 60 minutes, 72 °C for 20 minutes. Then filtered with 4 layers of sterile gauze to obtain the wort.
2.1.4. Preparation of Hydrolyzed Broken Rice Syrup [32,33]
Broken rice was crushed and collected through 80 mesh sieve was collected. It was mixed with water at 1:5 (g/mL) and enzymolysised with 30 U/g of thermostable α-amylase at 95 °C for 30 minutes to achieve liquefaction. The liquefied solution was enzymolysised with 300 U/g of glucoamylase at 55 °C for 48 hours, followed by heating and concentration to produce hydrolyzed broken rice syrup (dextrose equivalent > 95%).
2.2. Construction of CRISPR-Cas9 System
The CRISPR-Cas9 system comprises the Cas9 protein and guide RNA (gRNA). In constructing the Cas9 expression plasmid, the p414-Cas9 plasmid and the pPICZ (alpha) plasmid as templates were amplificated by PCR to obtain fragments containing the Cas9 gene and the BleoR gene, respectively. The primers were designed with 20 bp homologous sequences at ends of the BleoR gene fragment and the Cas9 gene fragment. The two purified fragments were then ligated in vitro by the ClonExpress® II One Step Cloning Kit (Vazyme, Nanjing, China). The ligation product was introduced into competent E. coli, which was plated on LB. Positive colonies were selected to extract the Cas9-expressing plasmid p414-Cas9-BleoR by the plasmid extraction kit (Magen, Shanghai, China) [14].
The construction of the gRNA expression plasmid required the replacement of the target site with the HOM2 target sequence. Using the HOM2 gene sequence, the protospacer adjacent motif (5’-NGG-3’ or 5’-NAG-3’) was identified by Snap Gene, and the 20 nt HOM2 target sequence was selected at the upstream of protospacer adjacent motif. The 60 bp fragment containing the 20 nt HOM2 target sequence was obtained through overlap extension PCR. The gRNA plasmid p426-gRNA-kanMX and the primer HOM2r-F / HOM2r-R was amplified by PCR to obtain the vector fragment (6395 bp) [14]. The primers were designed with 20 bp homologous sequences at ends of the vector fragment (6395 bp) and the 60 bp fragment. The two fragments were then ligated in vitro by the homologous recombination kit. The ligation product was introduced into competent E. coli DH5α, resulting in the gRNA expression plasmid p426-gRNA-HOM2-kanMX, capable of recognizing HOM2 targets.
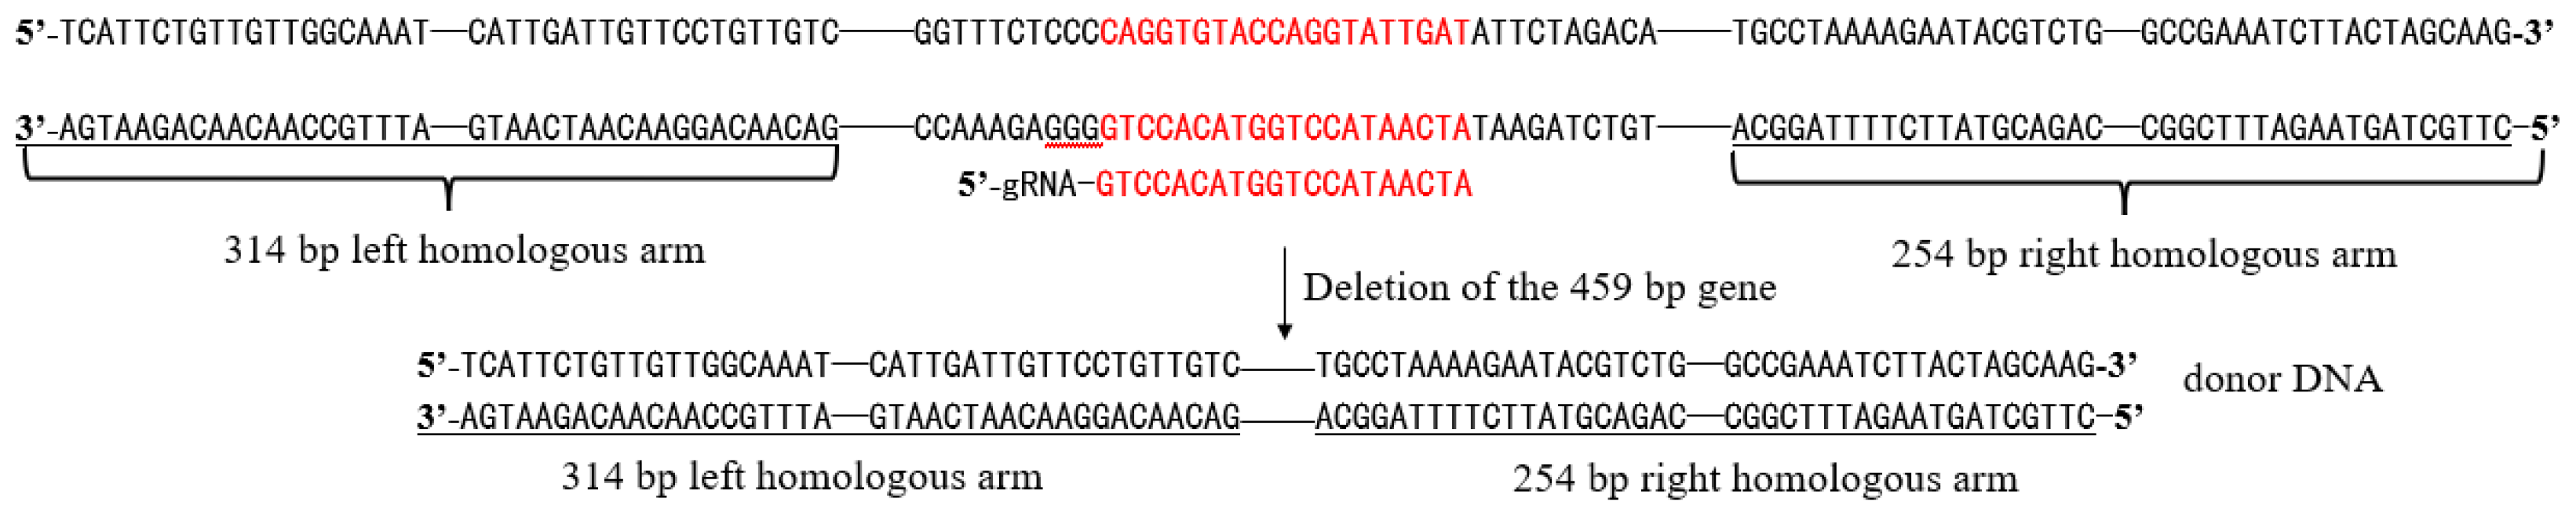
Design of HOM2 donor DNA: The genome of S. cerevisiae (S288c) was used as a template, and two homology arms upstream and downstream of the HOM2 target sequence were amplified by PCR with primers HT-F1 / HT-R1 and HT-F2 / HT-R2, respectively (20 bp of homology was set at the 5’ end of primers HT-R1 and HT-F2). The two segments were then ligated by overlap extension PCR to obtain donor DNA.
Figure 1.
Schematic diagram of donor DNA construction.
2.3. Yeast Transformation
The purified p414-Cas9-BleoR plasmid was transformed into the original strain by electrotransformation. The transformed yeasts were cultured in YPD medium (200 µg/mL Zeocin™) at 30 °C for 48 h. Then the positive transformants were selected by the colony PCR. The yeast with p414-Cas9-BleoR plasmid was used to prepare the competent yeast, mixed with purified p426-gRNA-HOM2-kanMX plasmid (100 ng/µL) and donor DNA (100 ng/µL) at a 1:10(v/v). The mixture was subjected to electrotransformation, and the transformed yeasts were cultured in YPD medium (200 μg/mL G418) at 30 °C for 48 h. Then the positive transformants were selected by the colony PCR.
2.4. Screening and Verification of Gene Knockout Strains
The positive yeast transformants were selected by the colony PCR with the primer pair HOM2-A / HOM2-D. The HOM2 knockout strains were successfully screened and were assessed the expression levels of the HOM2 gene by Real-Time Quantitative PCR with the kit [31]. Total RNA of strains were extracted by the total RNA extraction kit (Sangon, Shanghai, China).
2.5. Discard Plasmids
The gene knockout strains were cultured in 25 mL of YPD broth at 30 °C for 24 h. Then they were subcultured for over 12 generations. Recombinant yeasts XF0-h, XF0-H, and XF0-LH, which had lost the plasmid and exhibited no resistance, were selected in YPD medium with 200 μg/mL G418.
2.6. Yeast Inoculation and Fermentation
After dissolving the wort, adjust its concentration to 8 °P and add hydrolyzed broken rice syrup at the concentration of 60 g/L. Transfer the wort into the 100-mL sterile measuring cylinders, ensuring the volume of 100 mL. Centrifuge a specific volume of the seed culture (12000 rpm, 2 min.), collect the cells, wash them twice with sterile water, and then transfer the washed cells into the fermentation wort. The original and recombinant strains were inoculated with 2 × 10⁶ cells/mL in the measuring cylinders. Incubate anaerobically at 27 °C, recording the weight loss of CO2 every 24 hours. After fermentation, measure the higher alcohols content and other physical and chemical parameters.
2.7. Optimization of Fermentation Conditions
2.7.1. Effect of Wort Concentration on Higher Alcohols in Whiskey
Dissolve the wort and adjust the concentration to 4°P, 6°P, 8°P, 10°P and 12°P. Dispense 100 mL of each wort concentration into sterile 100-mL measuring cylinders, and add hydrolyzed broken rice syrup at the concentration of 60 g/L. Inoculate 2 × 10⁶ cells/mL of XF0-LH into each cylinder. Incubate anaerobically at 27 °C for 5 days.
2.7.2. Effect of Yeast Inoculum Size on Higher Alcohols in Whiskey
After dissolving the wort, adjust its concentration to 8°P and dispense 100 mL into 100-mL measuring cylinders. Add hydrolyzed broken rice syrup at the concentration of 60 g/L. The XF0-LH inoculum size of 0.5 × 10⁶, 1 × 10⁶, 2 × 10⁶, 3 × 10⁶, and 4 × 10⁶ cells/mL. Incubate anaerobically at 27 °C for 5 days.
2.7.3. Response Surface Optimization Experiment
A total of 17 experiments were conducted by the Box-Behnken design for response surface methodology. The design included three factors at three levels: wort concentration (A), hydrolyzed broken rice syrup addition (B), and yeast inoculum size (C). The levels were set at -1, 0, and 1, with the relative higher alcohols content (Y) as the response variable. This approach was employed to optimize the experimental conditions through response surface optimization.

Table 1.
Coded and actual values of factors in Box–Behnken design.
| Factors | Levels | ||
|---|---|---|---|
| -1 | 0 | 1 | |
| A: Wort concentration (°P) | 6 | 8 | 10 |
| B: Hydrolyzed broken rice syrup addition (g/L) | 40 | 60 | 80 |
| C: Inoculum size (cells/mL) | 1 × 10⁶ | 2 × 10⁶ | 3 × 10⁶ |
2.8. Analytical Methods
The supernatant of the fermentation broth was collected by Centrifuge (8,000 rpm, 5 min) and was filtered through a 0.22 μm membrane. Then the alcohol content and higher alcohols of the supernatant was determined by gas chromatography with internal standards [31].
2.9. Statistical Analysis
Due to the varying degrees of fermentation in the experimental samples, the results were uniformly converted and analyzed under a 50% vol alcohol system. Each experiment was conducted in triplicate, and results are presented as "mean ± standard deviation". Significance analysis was performed using SPSS 27.0, response surface data were processed with Design Expert 13, and bar charts, growth curves, and response surface plots were generated using Origin 2022.
3. Results
3.1. Construction of Recombinant Yeast Strains
3.1.1. Construction of gRNA targeting plasmid of HOM2 gene
3.1.2. Results of HOM2 Gene Knockout
After electrotransformation, the XF0-h, XF0-H and XF0-LH were selected by PCR with primers HOM2-A / HOM2-D and template strains’ DNA, with XF0, XF0-h and XF0-L as negative controls. The results are shown in Figure 3.
If the HOM2 gene is not knocked out, a 1376 bp negative fragment will be amplified by PCR. If both alleles of HOM2 are knocked out, a 917 bp positive fragment (knockout 459 bp) will be amplified by PCR. If one allele of HOM2 is knocked out, both 917 bp and 1376 bp fragments will be amplified by PCR. As shown in , XF0-LH, XF0-h and XF0-H were successfully constructed, respectively.
3.1.3. Relative Expression Levels of HOM2
To further validate the expression of the HOM2 gene after knockout, total RNA was extracted from XF0, XF0-h, XF0-H, XF0-L, and XF0-LH, and reverse transcription was performed to cDNA. Then Real-time Quantitative PCR was conducted using the cDNA as the template to analyze HOM2 gene expression, as shown in Figure 4. The results indicate that the HOM2 gene expression levels in the XF0-H and XF0-LH are extremely low, confirming the successful knockout of the HOM2 gene. In the case of the XF0-h with one HOM2 allele knocked out, the HOM2 gene expression level is only 6% of the XF0.
3.1.4. Verification of Plasmid Loss
Following Method 2.5, the strains XF0-h, XF0-H, and XF0-LH lossing plasmid were screened by the replica plating method. As shown in Figure 5, strains without plasmids normally grew on plates without antibiotics, but did not grow or slowly grew on plates with G418. It indicates that the plasmid p426-gRNA-HOM2-kanMX has been successfully eliminated from the XF0-h, XF0-H, and XF0-H.
3.2. Effect of HOM2 Gene Knockout on Higher Alcohols
Fermentation was conducted with the original strains XF0 and XF0-L, as well as the recombinant strains XF0-h, XF0-H, and XF0-LH. The content of higher alcohols in fermentation broth was determined, as shown in Figure 6.
As shown in Figure 6A, the relative higher alcohols content in the fermentation broth of the XF0-h (704±8 mg/L) and the XF0-H (685±6 mg/L) was reduced by 23.93% and 25.98%, respectively, compared to the XF0 (925±9 mg/L). The relative higher alcohols content in the fermentation broth of the XF0-LH (685±19 mg/L) was reduced by 15.81% compared to the XF0-L (814±29 mg/L). It indicated that the deletion of the HOM2 gene can decrease the higher alcohols content.
As shown in Figure 6B, the relative isoamylol content in the fermentation broth of the XF0-h (374±6 mg/L) and XF0-H (409±3 mg/L) was reduced by 34.99% and 28.96%, respectively, compared to the XF0 (575±12 mg/L). The relative isoamylol content in the fermentation broth of the XF0-LH (273±2 mg/L) was reduced by 49.25% compared to the XF0-L (537±15 mg/L). It indicated that the deletion of the HOM2 gene significantly decreases isoamylol content.
As shown in Figure 6C, the relative n-propanol content in the fermentation broth of the XF0-h (59±7 mg/L) and XF0-H (41±4 mg/L) was reduced by 52.53% and 67.28%, respectively, compared to the XF0 (124±13 mg/L). The relative n-propanol content in the fermentation broth of the XF0-LH (48±1 mg/L) was reduced by 55.96% compared to the XF0-L (109±12 mg/L). It indicated that the deletion of the HOM2 gene can significantly decrease n-propanol content.
3.3. Effect of HOM2 Gene Knockout on Fermentation Rate
Fermentation was conducted with the XF0, XF0-L, XF0-h, XF0-H, and XF0-LH strains. The weight loss was recorded every 24 hours to generate cumulative weight loss curves. The results are shown in Figure 7.
As shown in Figure 7, the fermentation rates of the XF0 and XF0-L are similar, with cumulative weight loss stabilizing after 4 days, marking the end of fermentation, which is indicative of a rapid fermentation process. In contrast, the HOM2 knockout strains (XF0-h, XF0-H, XF0-LH) display slower fermentation rates, with cumulative weight loss after 10 days remaining lower than that of the original strains. It indicated that the deletion of the HOM2 gene extends the fermentation cycle.
3.4. Experimental Results of Process Optimization
Based on the combined information from Figure 6 and Figure 7, it indicated that, despite having similar fermentation rates, the relative higher alcohols production of the XF0-LH shows no significant difference to the XF0-h and the XF0-H. However, the relative production of isoamylol is significantly reduced by the XF0-LH. Therefore, XF0-LH was selected as the fermentation strain for subsequent process optimization experiments.
3.4.1. Effect of Wort Concentration on Higher Alcohols in Whiskey
As shown in Figure 8, the C/N ratio in the fermentation broth of wort concentrations of 4 °P, 6 °P, 8 °P, 10 °P, and 12 °P adding of 60 g/L of hydrolyzed broken rice syrup shows a decreasing trend as the wort concentration increases from 4 °P to 12 °P. The relative content of higher alcohols in the fermentation broth initially decreases and then increases, with the lowest relative higher alcohols content of 761±65 mg/L at 8 °P wort. In 4 °P and 6 °P wort, the assimilable nitrogen content cannot satisfy the metabolic demand of yeast, and yeast will synthesize amino acids through the sugar metabolism pathway, and a large amount of α-keto acids will be formed. One part of the α-keto acids is converted to amino acids needed by yeast, and the other part is decarboxylated and dehydrogenated to produce higher alcohols. It produced more higher alcohols. In 10 °P and 12 ° P wort, osmolality increase leads to a decrease in the rate of viable cells of yeast, and the content of assimilable nitrogen is higher than the metabolic needs of yeast, amino acids will be generated to produce more higher alcohols. 8 °P wort’ C/N ratio is appropriate to produce the lowest relative higher alcohols content of 761±65 mg/L, because the synthetic α-keto acids are converted to the corresponding amino acids.
3.4.2. Effect of Yeast Inoculum Size on Higher Alcohols In Whiskey
As shown in Figure 9, as the yeast inoculum size increases from 0.5 × 10⁶ to 4.0 × 10⁶ cells/mL, the relative higher alcohols content in the fermentation broth initially decreases and then increases. The lowest relative higher alcohols content is observed at the yeast inoculum size of 2.0 × 10⁶ cells/mL. The yeast inoculum size of 0.5 × 10⁶ cells/mL and 1.0 × 10⁶ cells/mL, the yeast population in the fermentation broth is low, leading to the primary focus on growth and reproduction. During this phase of active metabolism, the yeast produces more higher alcohols. Additionally, the insufficient yeast population results in incomplete consumption of fermentable sugars, leaving a high residual sugar concentration, which further drives higher alcohols production through anabolic pathways. At the yeast inoculum size of 4.0 × 10⁶ cells/mL, the yeast population is high, causing nutrient limitation early in the fermentation process, which triggers increased production of higher alcohols.
3.5. Optimization of Fermentation Conditions Using Response Surface Methodology
3.5.1. Response Surface Methodology Model and Statistical Significance Analysis
Box-Behnken design was employed for the response surface methodology, with investigating factors including wort concentration (A), the hydrolyzed broken rice syrup addition(B), and yeast inoculum size (C). The response value was the higher alcohols content (Y) in the whiskey. The experimental results are detailed in Table 2.
The experimental data were analyzed using Design Expert 11 to obtain a multiple quadratic regression equation .
3.5.2. Variance and Confidence Analysis of Relative Higher Alcohols Content in Whiskey
Further analysis of variance was conducted on the results of each experimental group from Table 2, and the findings are presented in Table 3.
As shown in Table 3, a quadratic model was applied to regress the relative higher alcohols content in whiskey. The model showed a highly significant difference with the P-value < 0.0001, indicating a robust fit and suitability for subsequent optimization analyses. The lack-of-fit test had a P-value > 0.05, suggesting that the quadratic model provided an adequate fit across the regression range, effectively modeling the relative higher alcohols content in whiskey. Analysis of F-values revealed that the most influential factor was wort concentration (A), followed by yeast inoculum size (C), and the hydrolyzed broken rice syrup addition (B). In the significance analysis, using a threshold of P < 0.05, it was found that the linear terms A, B, C; the quadratic terms B² and C²; and the interaction terms AB, AC, and BC all had significant effects on the relative higher alcohols content in whiskey (P < 0.01). The model’s R² value was 0.9809, indicating a strong correlation between the actual and predicted values, with 98.09% of the variance in the relative higher alcohols content explained by the model. The adjusted R² value was 0.9563, suggesting that 95.63% of the variability was accounted for by the investigated variables, demonstrating that the optimized model effectively captures the process conditions. The predicted R² value was 0.7686, with the difference between the predicted and actual R² values being less than 0.2, further validating the model’s accuracy and low error rate.
3.5.3. Response Surface Analysis and Verification Test of Relative Higher Alcohols Content in Whiskey
Based on the results in Table 4, three-dimensional response surface plots were generated using Design Expert to visualize the interaction effects between the investigating factors AB, AC, and BC, as shown in Figure 10. According to the fundamental principles of response surface methodology, circular contour lines typically indicate a minimal interaction between two factors, while elliptical or saddle-shaped contour lines suggest a significant interaction. Furthermore, a steep response surface indicates strong interaction between factors, whereas a flatter surface suggests weaker interaction [34,35,36].
As shown in Figure 10, when the hydrolyzed broken rice syrup addition is constant, the relative higher alcohols content in whiskey increases with the wort concentration. When the wort concentration is constant, the relative higher alcohols content in whiskey initially decreases and then increases with the amount of the hydrolyzed broken rice syrup. The interaction between wort concentration and the hydrolyzed broken rice syrup addition is significant, with the wort concentration having a more pronounced effect on the higher alcohols content than the hydrolyzed broken rice syrup addition. When the yeast inoculum size is constant, the relative higher alcohols content in whiskey increases with the concentration of wort. When the wort concentration is constant, the relative higher alcohols content in whiskey initially decreases and then increases with the yeast inoculum size. The interaction between wort concentration and yeast inoculum size is significant, with wort concentration having a more pronounced effect on the relative higher alcohols content than the yeast inoculum size. When the yeast inoculum size is constant, the relative higher alcohols content in whiskey initially decreases and then increases as the hydrolyzed broken rice syrup addition is varied. When the hydrolyzed broken rice syrup addition is constant, the higher alcohols content in whiskey initially decreases and then increases with the yeast inoculum size. The interaction between the hydrolyzed broken rice syrup addition and yeast inoculum size is significant, with yeast inoculum size having a more pronounced effect on the higher alcohols content than the hydrolyzed broken rice syrup addition.
Based on Figure 10, it is indicated that the interactions between wort concentration and the hydrolyzed broken rice syrup addition (AB), wort concentration and yeast inoculum size (AC), and the hydrolyzed broken rice syrup addition and yeast inoculum size (BC) all significantly affect the relative higher alcohols content in whiskey. The optimal parameters were the wort concentration of 9.808 °P, hydrolyzed broken rice syrup addition of 77.743 g/L, and yeast inoculum size of 2.651× 10⁶ cells/mL. So the predicted relative higher alcohols content in whiskey is 565 mg/L. A 50L scale-up fermentation experiment was conducted to obtain whiskey with higher alcohols content 556 mg/L at the wort concentration of 9.8 °P, hydrolyzed broken rice syrup addition of 78g/L, and yeast inoculum size of 2.7 × 10⁶ cells/mL. The result is in close agreement with the theoretical optimized value, so the optimal parameters are applicable for practical whiskey production.
4. Discussion
The higher alcohols produced by yeast during alcohol fermentation play an important role in the taste of whiskey. HOM2 gene plays a key role in the metabolism of higher alcohols in yeast. Therefore, genetic analysis of the HOM2 gene is important for controlling the content of higher alcohols in whiskey. It shows that HOM2 konckout strains can reduce the content of n-propanol, isoamylol and higher alcohols in whiskey, which is consistent with previous reports [37]. It was due to the HOM2 knockout reduced the expression of aspartate β-semialdehyde dehydrogenase, which further reduced the generation of α-ketobutyric acid from aspartylphosphate, resulting in the reduced production of n-propanol and isoamylol (Figure 11 [38,39]). Isoamylol in the fermentation broths of HOM2 and LEU1 knockout strains was significantly lower than that of the HOM2 knockout strains. This is because LEU1 kockout resulted in reduced production of α-ketoglutarate to produce α-ketohexanoic acid, which in turn reduced isoamylol production.
Materials also affect the content of higher alcohols in whiskey. Differences in the composition and C/N ratio of wort and hydrolyzed broken rice syrup affect the physiology and the fermentation performance of the yeast. When the C/N ratio is large, the nitrogen content is low, yeast produce alcohol slowly and produce α-keto acids quickly, result in synthesizing higher alcohols quickly. It is consistent with Oshita et al.’s finding of an increase in higher alcohols in fermentation broths with low nitrogen concentrations by isotope labeling [40]. When C/N ratio is in the optimal range, yeast produce alcohol by normal metabolic path-ways ,result in reducing the production of higher alcohols. When the C/N ratio is small and the nitrogen content is high, yeast convert amino acids to form higher alcohols by Ehrlich metabolic pathway [40]. Adding hydrolyzed broken rice syrup to the fermentation broth can adjust the concentration of sugars, thereby increasing the alcohol content of the whiskey. A low concentration of sugars leads to insufficient yeast metabolism [41], reducing alcohol yield and affecting yeast growth, reproduction, and metabolic pathways. Excessive sugars can alter yeast metabolic pathways, resulting in increased higher alcohols production. In high osmotic pressure environments, yeast cells may be damaged, leading to inhibited metabolic activity and reduced fermentation capacity, which can cause incomplete fermentation and increased residual sugars. When the free amino nitrogen level in the fermentation broth is appropriate, moderately increasing the concentration of sugars can maximize ethanol yield when yeast cells have sufficient nutrients [42].
5. Conclusions
The optimum content of higher alcohols can enrich the flavor of whiskey. But when it is an excessive content of higher alcohols in whiskey, especially isoamylol, the drinker is more likely to experience symptoms of intoxication. It is showed that HOM2 knockout strains could reduce the content of isoamylol and higher alcohols, which could be used to brew in low-ID whiskey. It is also shows that wort concentration and yeast inoculum size affect the content of higher alcohols in whiskey. The optimal fermentation conditions for high-quality whiskey were obtained through single-factor experiments and Box-Behnken design: wort concentration of 9.8 °P, the hydrolyzed broken rice syrup concentration of 77.7g/L, and the inoculum size of 2.65 × 10⁶ cells/mL. So the low-ID whiskey is successfully brewed by 50 L fermenter of scaled-up experiments with higher alcohols content at 556 mg/L.
Supplementary Materials
The following supporting information can be downloaded at the website of this paper posted on Preprints.org, Table S1: Strains and plasmids used in this study; Table S2: List of the Primer sequences used in the current study.
Author Contributions
Conceptualization, J.H.; methodology, J.H. and H.Z.; software, J.H. and H.Z.; validation, J.H. and J.L.; formal analysis, J.H. and J.L.; investigation, J.H. and K.T.; resources, J.H. and K.T.; data curation, J.H. and Z.D.; writing—original draft preparation, J.H.; writing—review and editing, J.H. and H.Z.; visualization, J.H. and Z.D.; supervision, S.Z.; project administration, S.Z.; funding acquisition, S.Z. All authors have read and agreed to the published version of the manuscript.
Funding
This research was funded by National Natural Science Foundation of China, grant number 52070079.
Institutional Review Board Statement
Not applicable.
Conflict of Interest
The authors declare no conflict of interest.
References
- Waymark, C.; Hill, A.E. The Influence of Yeast Strain on Whisky New Make Spirit Aroma. Fermentation (Basel) 2021, 7. [CrossRef]
- Daute, M.; Jack, F.; Walker, G. The potential for Scotch Malt Whisky flavour diversification by yeast. Fems Yeast Res 2024, 24. [CrossRef]
- Shen, X.; Wang, H.; Zhuang, H.; Yao, L.; Sun, M.; Yu, C.; Li, D.; Feng, T. Comparative analysis of the aromatic profile of single malt whiskies from different regions of Scotland using GC-MS , GC-O-MS and sensory evaluation. J Food Compost Anal 2024, 133. [CrossRef]
- Liu, Y.; Ren, Q.; Zhou, Z. Baijiu hangover Correlation analysis between neurobiochemical and behavioral parameters in a mouse model and clinical symptoms. Food Biosci 2024, 59. [CrossRef]
- Lachenmeier, D.W.; Haupt, S.; Schulz, K. Defining maximum levels of higher alcohols in alcoholic beverages and surrogate alcohol products. Regul Toxicol Pharmacol 2008, 50, 313-321. [CrossRef]
- Song, X.; Ma, Z.; Lu, J.; Yang, Y.; Shen, G.; Chi, J.; Wang, D. Sources and Influencing Factors of Aroma Components in Whisky. Liquor-Making Science & Technology 2024, 102-110. [CrossRef]
- Peneda, J.; Baptista, A.; Lopes, J.M. Interaction of the constituents of alcoholic beverages in the promotion of liver damage. Acta Med Port 1994, 7 Suppl 1, S51-S55.
- Xie, J.; Tian, X.; He, S.; Wei, Y.; Peng, B.; Wu, Z. Evaluating the Intoxicating Degree of Liquor Products with Combinations of Fusel Alcohols, Acids, and Esters. Molecules 2018, 23. [CrossRef]
- Lin, Y.; Zhang, N.; Lin, Y.; Gao, Y.; Li, H.; Zhou, C.; Meng, W.; Qin, W. Transcriptomic and metabolomic correlation analysis : effect of initial SO2 addition on higher alcohol synthesis in Saccharomyces cerevisiae and identification of key regulatory genes. Front Microbiol 2024, 15. [CrossRef]
- Gao, M.; Li, W.; Fan, L.; Wei, C.; Yu, S.; Chen, R.; Ma, L.; Du, L.; Zhang, H.; Yang, W. Reduced production of Ethyl Carbamate in wine by regulating the accumulation of arginine in Saccharomyces cerevisiae. J Biotechnol 2024, 385, 65-74. [CrossRef]
- Liang, Z.; He, B.; Lin, X.; Su, H.; He, Z.; Chen, J.; Li, W.; Zheng, Y. Effect of ADH7 gene loss on fusel oil metabolism of Saccharomyces cerevisiae for Huangjiu fermentation. Lebensm Wiss Technol 2023, 175. [CrossRef]
- Xu, Z.; Lin, L.; Chen, Z.; Wang, K.; Sun, J.; Zhu, T. The same genetic regulation strategy produces inconsistent effects in different Saccharomyces cerevisiae strains for 2-phenylethanol production. Appl Microbiol Biotechnol 2022, 106, 4041-4052. [CrossRef]
- Li, W.; Chen, S.; Wang, J.; Zhang, C.; Shi, Y.; Guo, X.; Chen, Y.; Xiao, D. Genetic engineering to alter carbon flux for various higher alcohol productions by Saccharomyces cerevisiae for Chinese Baijiu fermentation. Appl Microbiol Biotechnol 2018, 102, 1783-1795. [CrossRef]
- Wang, Z.; He, J.; Lang, S.; Zhou, S. Construction of LEU1 gene deleted Saccharomyces cerevisiae based on CRISPR-Cas9 system for brewing low degree of drunkenness rice wine. China Brewing 2024, 43, 62-67.
- Pandey, A.K.; Pain, J.; Brindha, J.; Dancis, A.; Pain, D. Essential mitochondrial role in iron-sulfur cluster assembly of the cytoplasmic isopropylmalate isomerase Leu1 in Saccharomyces cerevisiae. Mitochondrion 2023, 69, 104-115. [CrossRef]
- Liu, C.; Qin, W.; Sun, Y.; Sun, X. Synthesis pathway and key genes of the higher alcohols in Saccharomyces cerevisiae. China Brewing 2018, 37, 9-13. [CrossRef]
- Thomas, D.; Surdin-Kerjan, Y. Structure of the HOM2 gene of Saccharomyces cerevisiae and regulation of its expression. Mol Gen Genet 1989, 217, 149-154. [CrossRef]
- Robichon-Szulmajster, H.; Surdin, Y.; Mortimer, R.K. Genetic and biochemical studies of genes controlling the synthesis of threonine and methionine in Saccharomyces. Genetics 1966, 53, 609-619. [CrossRef]
- Styger, G.; Jacobson, D.; Bauer, F.F. Identifying genes that impact on aroma profiles produced by Saccharomyces cerevisiae and the production of higher alcohols. Appl Microbiol Biotechnol 2011, 91, 713-730. [CrossRef]
- Qi, Y. Effect of the deletion of BAT,HOM2 in yellow rice wine yeast on production of higher alcohols. master’s degree Type, Tianjin University of Science and Technology, Tianjin, 2014.
- Zhao, J.; Wang, L.; Wei, X.; Li, K.; Liu, J. Food-Grade Expression and Characterization of a Dextranase from Chaetomium gracile Suitable for Sugarcane Juice Clarification. Chem Biodivers 2021, 18, e2000797. [CrossRef]
- Fraczek, M.G.; Naseeb, S.; Delneri, D. History of genome editing in yeast. Yeast 2018, 35, 361-368. [CrossRef]
- Li, H.; Liang, X.; Zhou, J. Progress in gene editing technologies for Saccharomyces cerevisiae. Chinese Journal of Biotechnology 2021, 37, 950-965. [CrossRef]
- Chen, X.; Liao, D.; Huang, S.; Chen, Y.; Zhilong, L.; Chen, D. Advances in CRISPR/Cas9 System Modifying Saccharomyces cerevisiae. Biotechnology Bulletin 2023, 39, 148-158. [CrossRef]
- Mans, R.; van Rossum, H.M.; Wijsman, M.; Backx, A.; Kuijpers, N.G.A.; van den Broek, M.; Daran-Lapujade, P.; Pronk, J.T.; van Maris, A.J.A.; Daran, J.G. CRISPR/Cas9: a molecular Swiss army knife for simultaneous introduction of multiple genetic modifications in Saccharomyces cerevisiae. Fems Yeast Res 2015, 15. [CrossRef]
- Singh, R.; Chandel, S.; Ghosh, A.; Gautam, A.; Huson, D.H.; Ravichandiran, V.; Ghosh, D. Easy efficient HDR-based targeted knock-in in Saccharomyces cerevisiae genome using CRISPR-Cas9 system. Bioengineered 2022, 13, 14857-14871. [CrossRef]
- Lim, S.R.; Lee, S.J. Multiplex CRISPR-Cas Genome Editing: Next-Generation Microbial Strain Engineering. J Agric Food Chem 2024, 72, 11871-11884. [CrossRef]
- Liang, Y.; Gao, S.; Qi, X.; Valentovich, L.N.; An, Y. Progress in Gene Editing and Metabolic Regulation of Saccharomyces cerevisiae with CRISPR/Cas9 Tools. Acs Synth Biol 2024, 13, 428-448. [CrossRef]
- Lei, H.; Zhao, H.; Yu, Z.; Zhao, M. Effects of wort gravity and nitrogen level on fermentation performance of brewer’s yeast and the formation of flavor volatiles. Appl Biochem Biotechnol 2012, 166, 1562-1574. [CrossRef]
- Wang, Q.; Gao, R.; Miao, L.; Liao, W.; Deng, C.; Chen, J.; Fan, P. Preparation and process optimization of rice wine by multi-yeast fermentation. China Brewing 2022, 41, 155-161. [CrossRef]
- Yan, T.; Wang, Z.; Zhou, H.; He, J.; Zhou, S. Effects of Four Critical Gene Deletions in Saccharomyces cerevisiae on Fusel Alcohols during Red Wine Fermentation. Fermentation (Basel) 2023, 9. [CrossRef]
- Mu, Y.; Xie, C.; Yang, F.; Li, Z.; Su, W. Optimization of starch syrup production process by enzymatic extrusion broken rice. Cienc Technol Aliment 2014, 39, 163-168. [CrossRef]
- Guo, H.; Qian, P.; Xu, T.; Liu, X.; Li, G. Liquefaction and Saccharification Technology of High Fructose Syrup from Broken Rice. Food Research and Development 2022, 43, 99-105.
- Yin, Y.; Han, X.; Lu, Y.; Li, J.; Zhang, Z.; Xia, X.; Zhao, S.; Liang, Y.; Sun, B.; Hu, Y. Control of N-Propanol Production in Simulated Liquid State Fermentation of Chinese Baijiu by Response Surface Methodology. Fermentation (Basel) 2021, 7. [CrossRef]
- Zhao, Q.; Meng, W.; Liu, Y. Optimization for extraction process of ferulic acid from fermented grains of sesame-flavor Baijiu by response surface methodology. China Brewing 2022, 41, 174-179.
- Wang, Y.; Yun, J.; Zhou, M.; Wang, Z.; Li, D.; Jia, X.; Gao, Q.; Chen, X.; Xie, G.; Wu, H., et al. Exploration and application of Saccharomyces cerevisiae NJ002 to improve the fermentative capacity of medium-high temperature Daqu. Bioresour Technol Rep 2023, 101571. [CrossRef]
- Styger, G.; Jacobson, D.; Prior, B.A.; Bauer, F.F. Genetic analysis of the metabolic pathways responsible for aroma metabolite production by Saccharomyces cerevisiae. Appl Microbiol Biotechnol 2013, 97, 4429-4442. [CrossRef]
- Gao, Z. Analysis of the physiological functions of methionine in the H2S overflow metabolism of Saccharomyces cerevisivae. master’s degree Type, Northwest A&F University, Yangling, 2017.
- Park, S.; Kim, S.; Hahn, J. Metabolic engineering of Saccharomyces cerevisiae for the production of isobutanol and 3-methyl-1-butanol. Appl Microbiol Biotechnol 2014, 98, 9139-9147. [CrossRef]
- Dong, S. Effects of nitrogen sources on themetabolites of Saccharomyces cerevisiae. Master’s Degree Type, Qilu University of Technology, Jinan, 2018.
- Wu, J.; Teng, F.; Yang, L. Optimization of brewing process of cudrania tricuspidata brandy original wine by response surface method. China Brewing 2024, 43, 216-220.
- Lei, H. Study of the Effects of Nitrogen Composition in HighGravity Wort on the Assimilation of Amino Acids by LagerYeast and Fermentation Control. PhD Type, South China University of Technology, Guangzhou, 2014.
Figure 2.
Recombinant plasmid p426-gRNA-HOM2-kanMX.
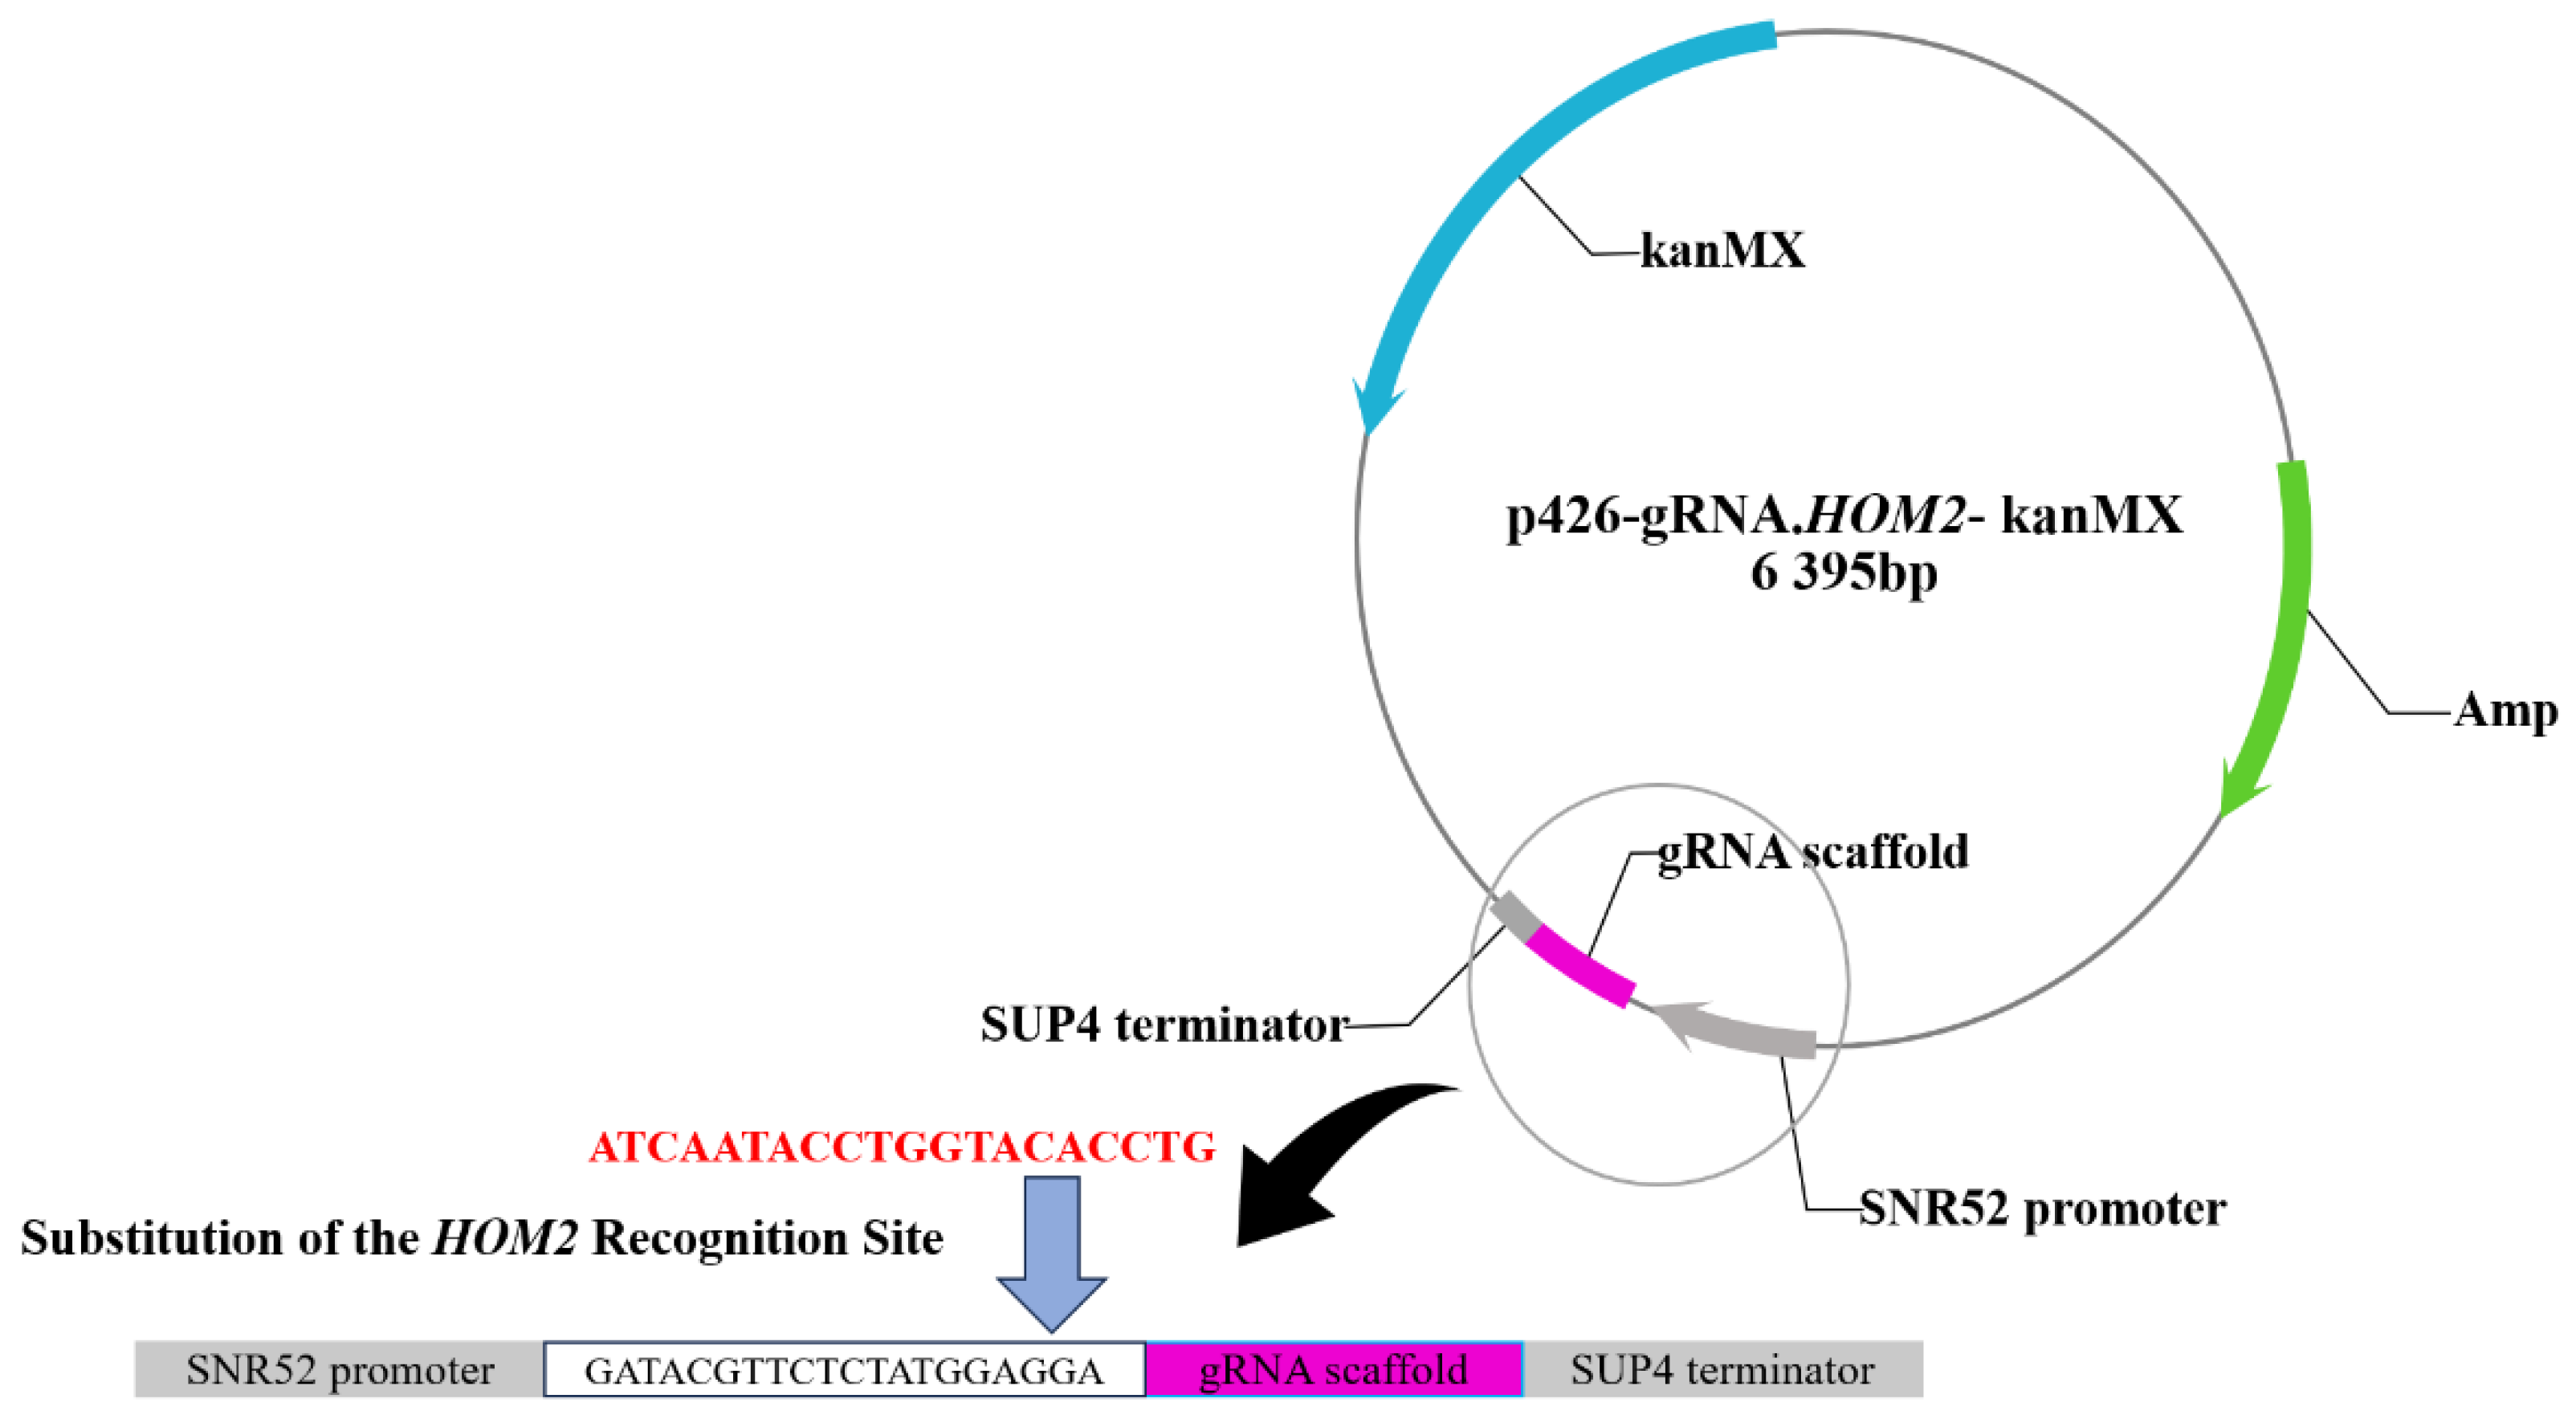
Figure 3.
Construction results of recombinant yeast strains. Lane M shows the 5000 bp marker (A) Verification results for XF0-L: Lanes 2, 3, 5, and 6 are XF0-L; Lanes 1 and 4 are XF0-LH;. (B) Verification results for XF0: Lanes 4-6 correspond to XF0; Lane 3 corresponds to XF0-h; (C) Verification results for XF0-h: Lanes 4-6 correspond to XF0-h; Lanes 1-3 correspond to XF0-H.
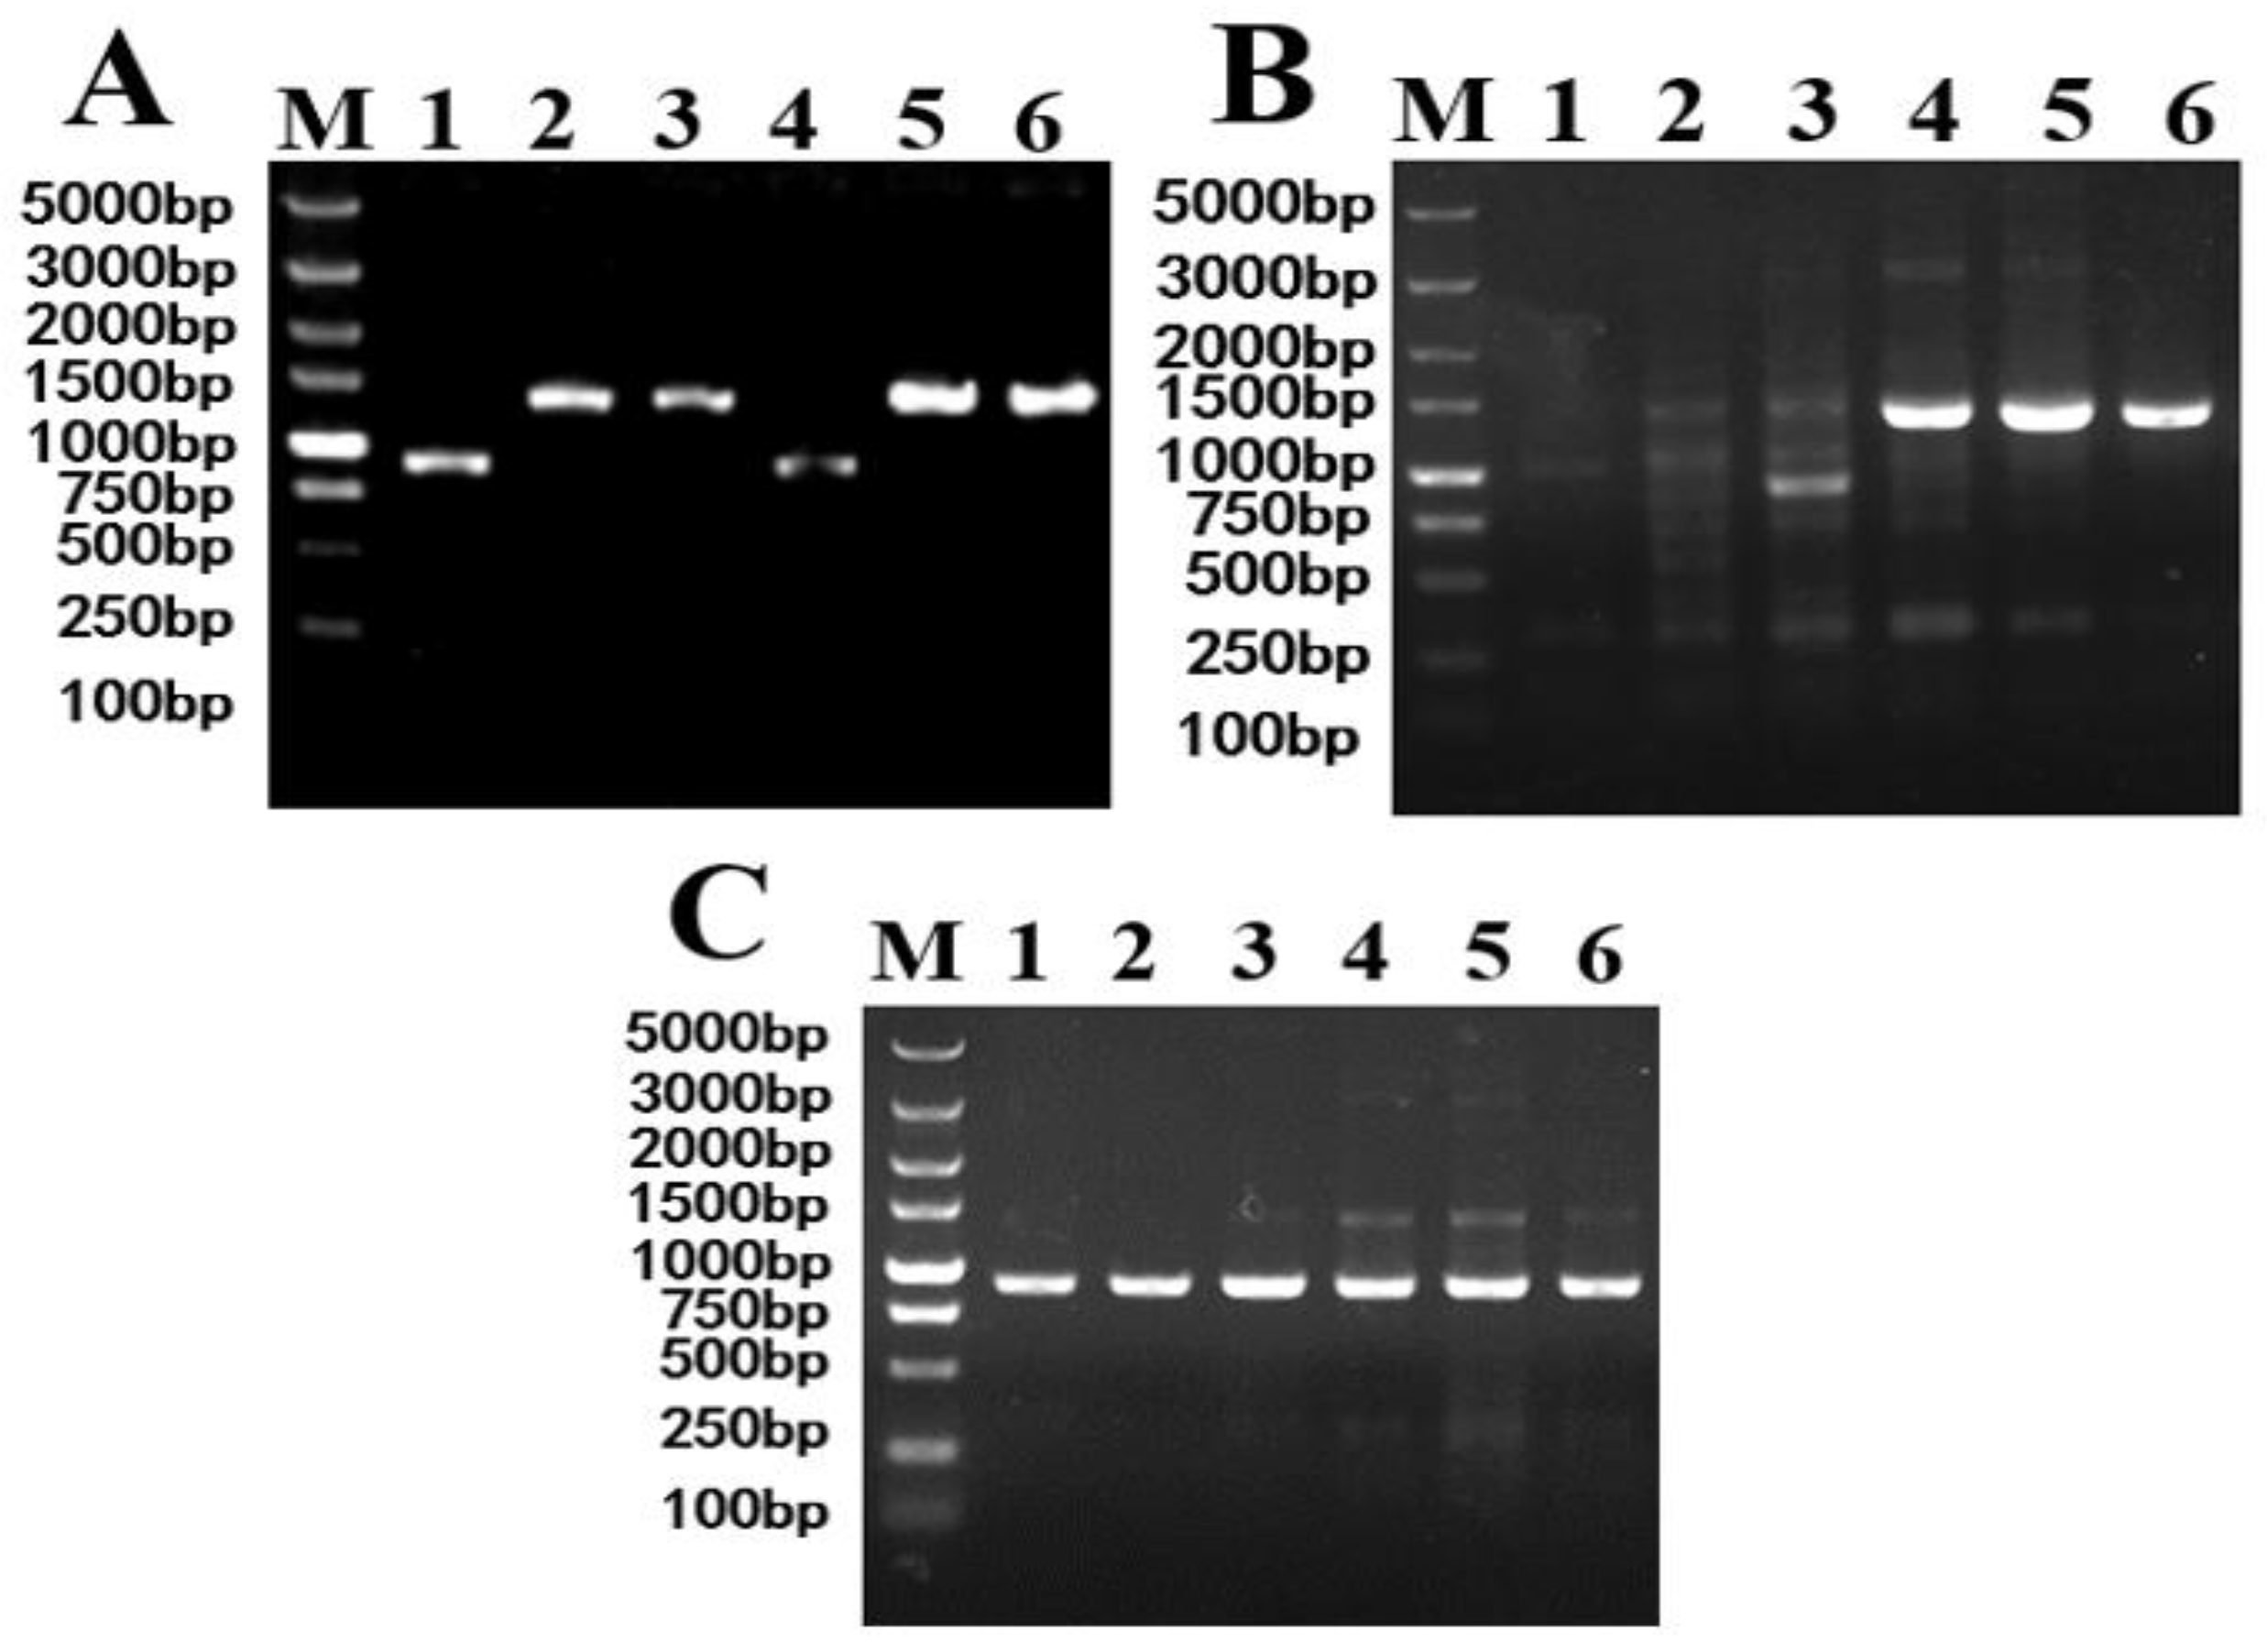
Figure 4.
Relative expression levels of the HOM2 gene in original strains and recombinant strains.
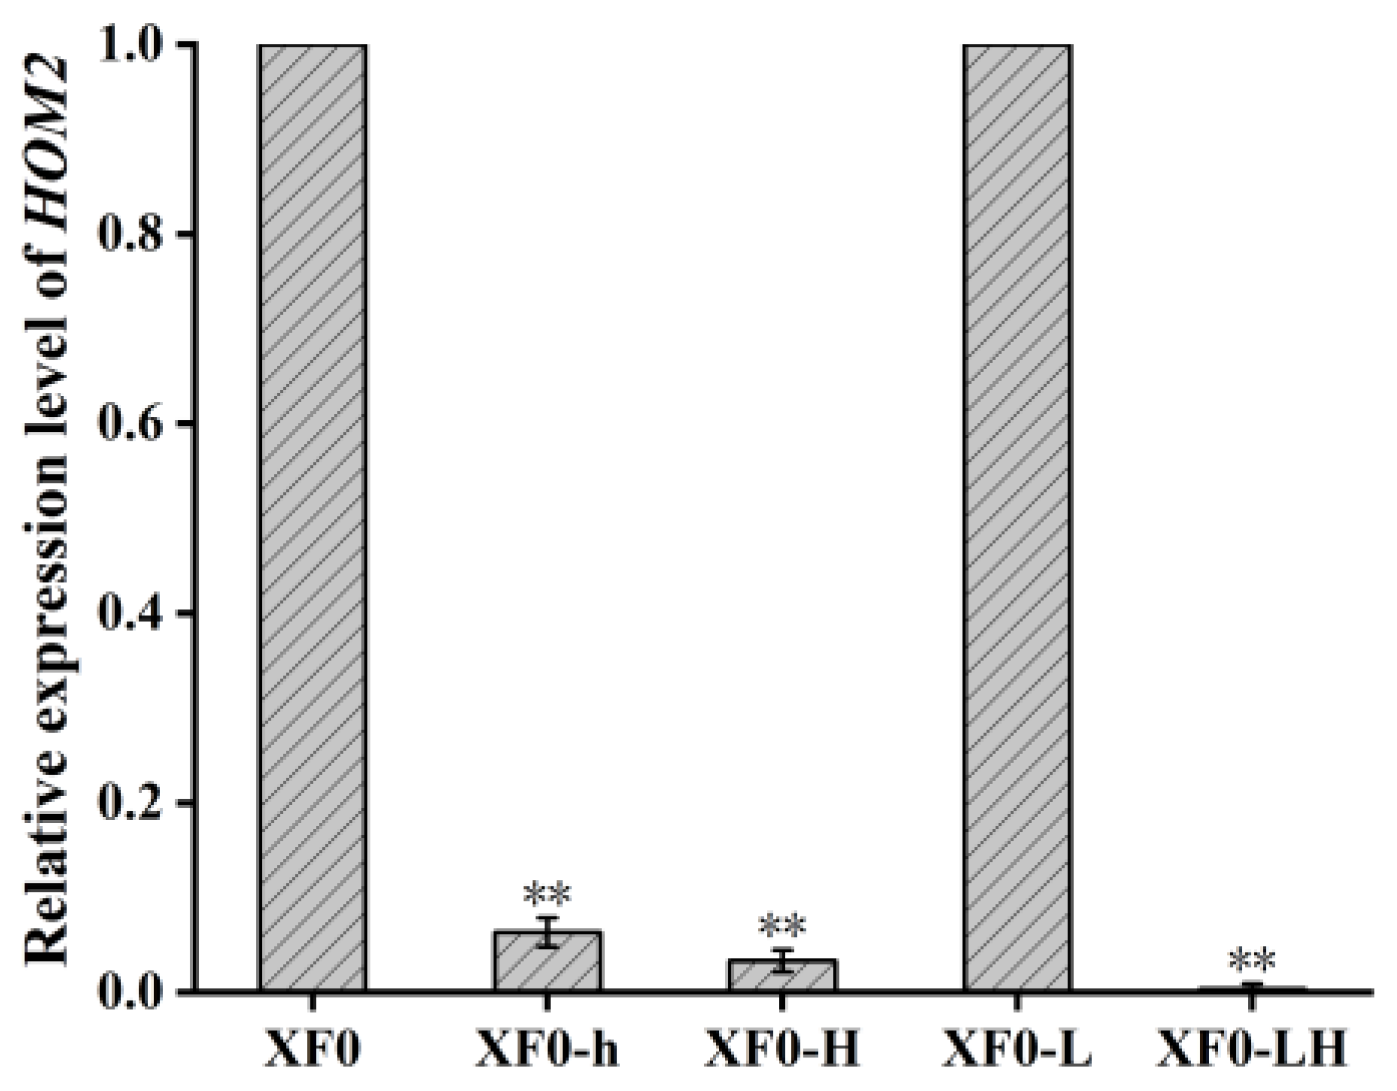
Figure 5.
Verification of lossing plasmid in recombinant strain.
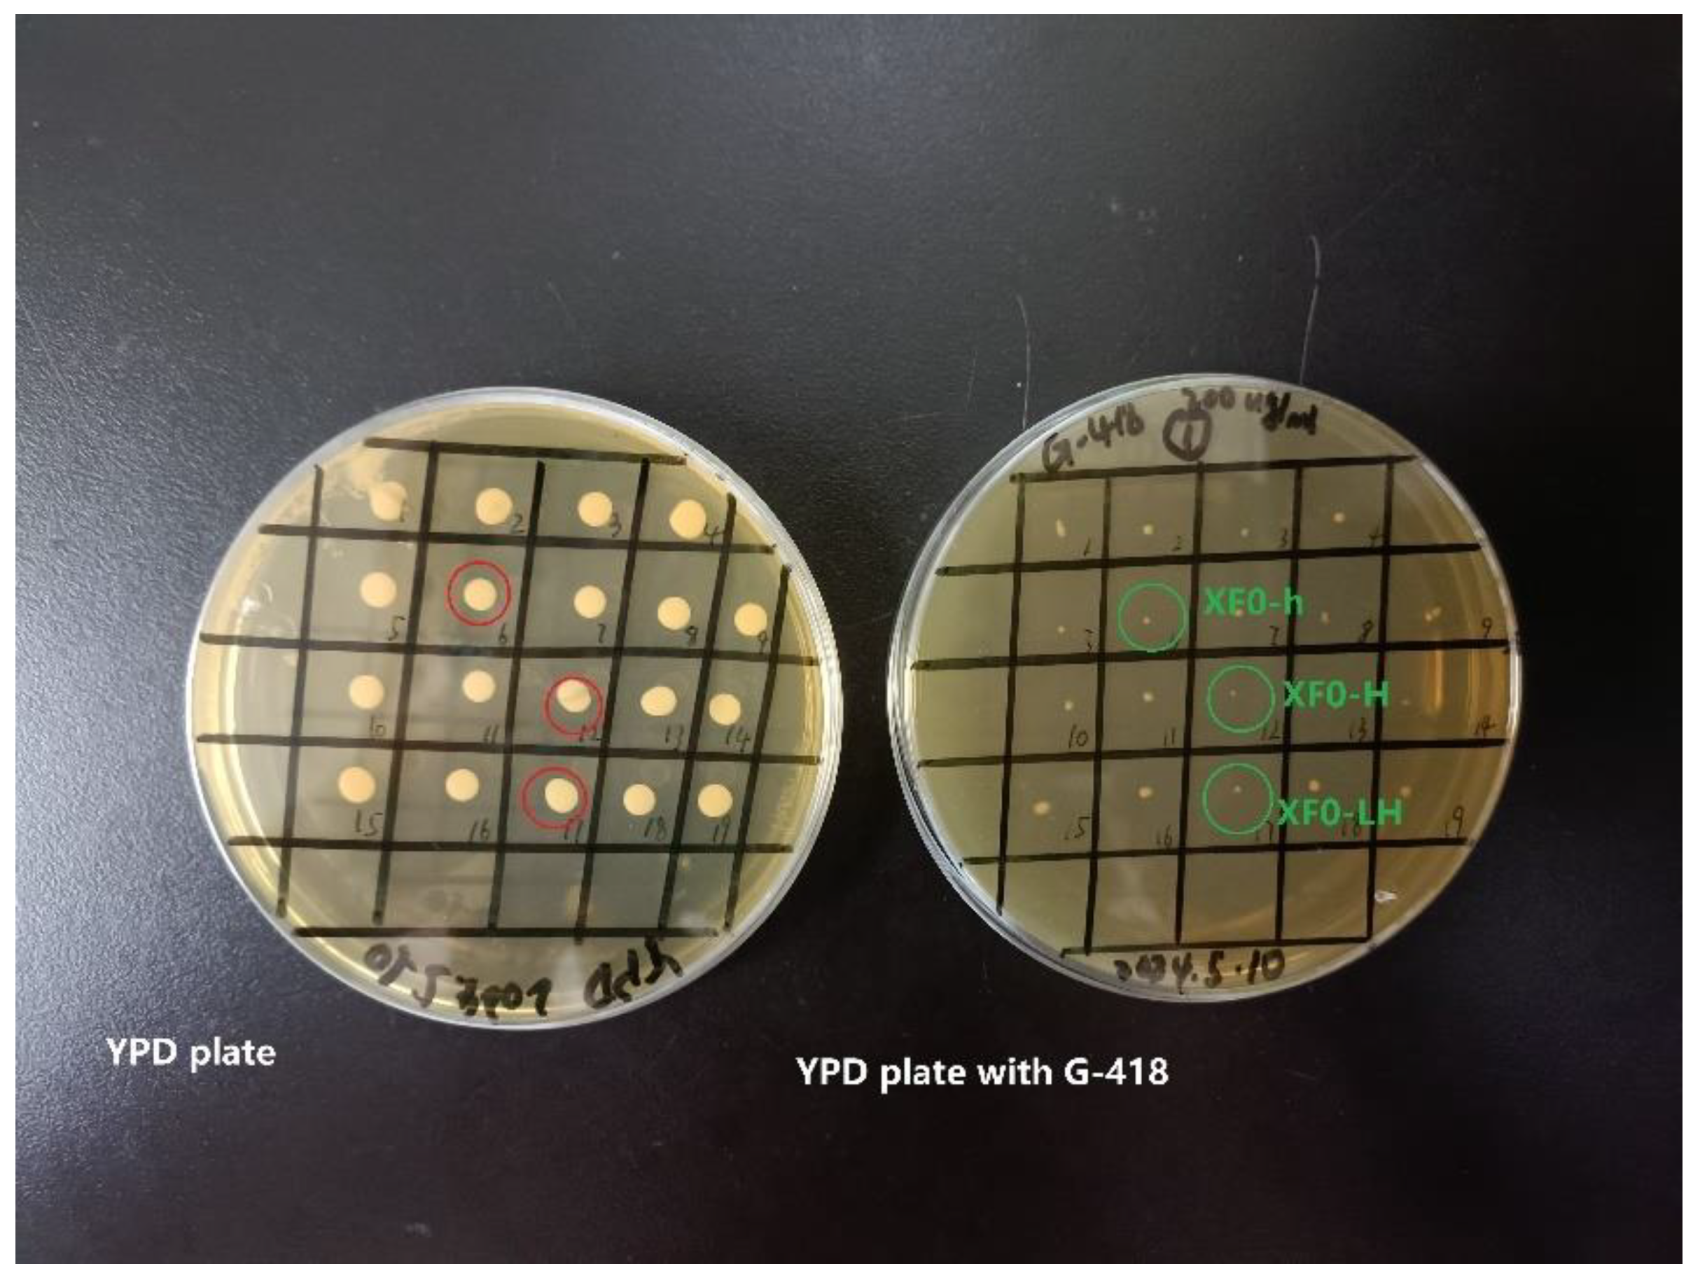
Figure 6.
Relative higher alcohols content in original strains and recombinant strains. (A) Higher alcohols production by the recombinant strains; (B) Isoamylol production by the recombinant strains; (C) N-propanol production by the recombinant strains.
Figure 6.
Relative higher alcohols content in original strains and recombinant strains. (A) Higher alcohols production by the recombinant strains; (B) Isoamylol production by the recombinant strains; (C) N-propanol production by the recombinant strains.
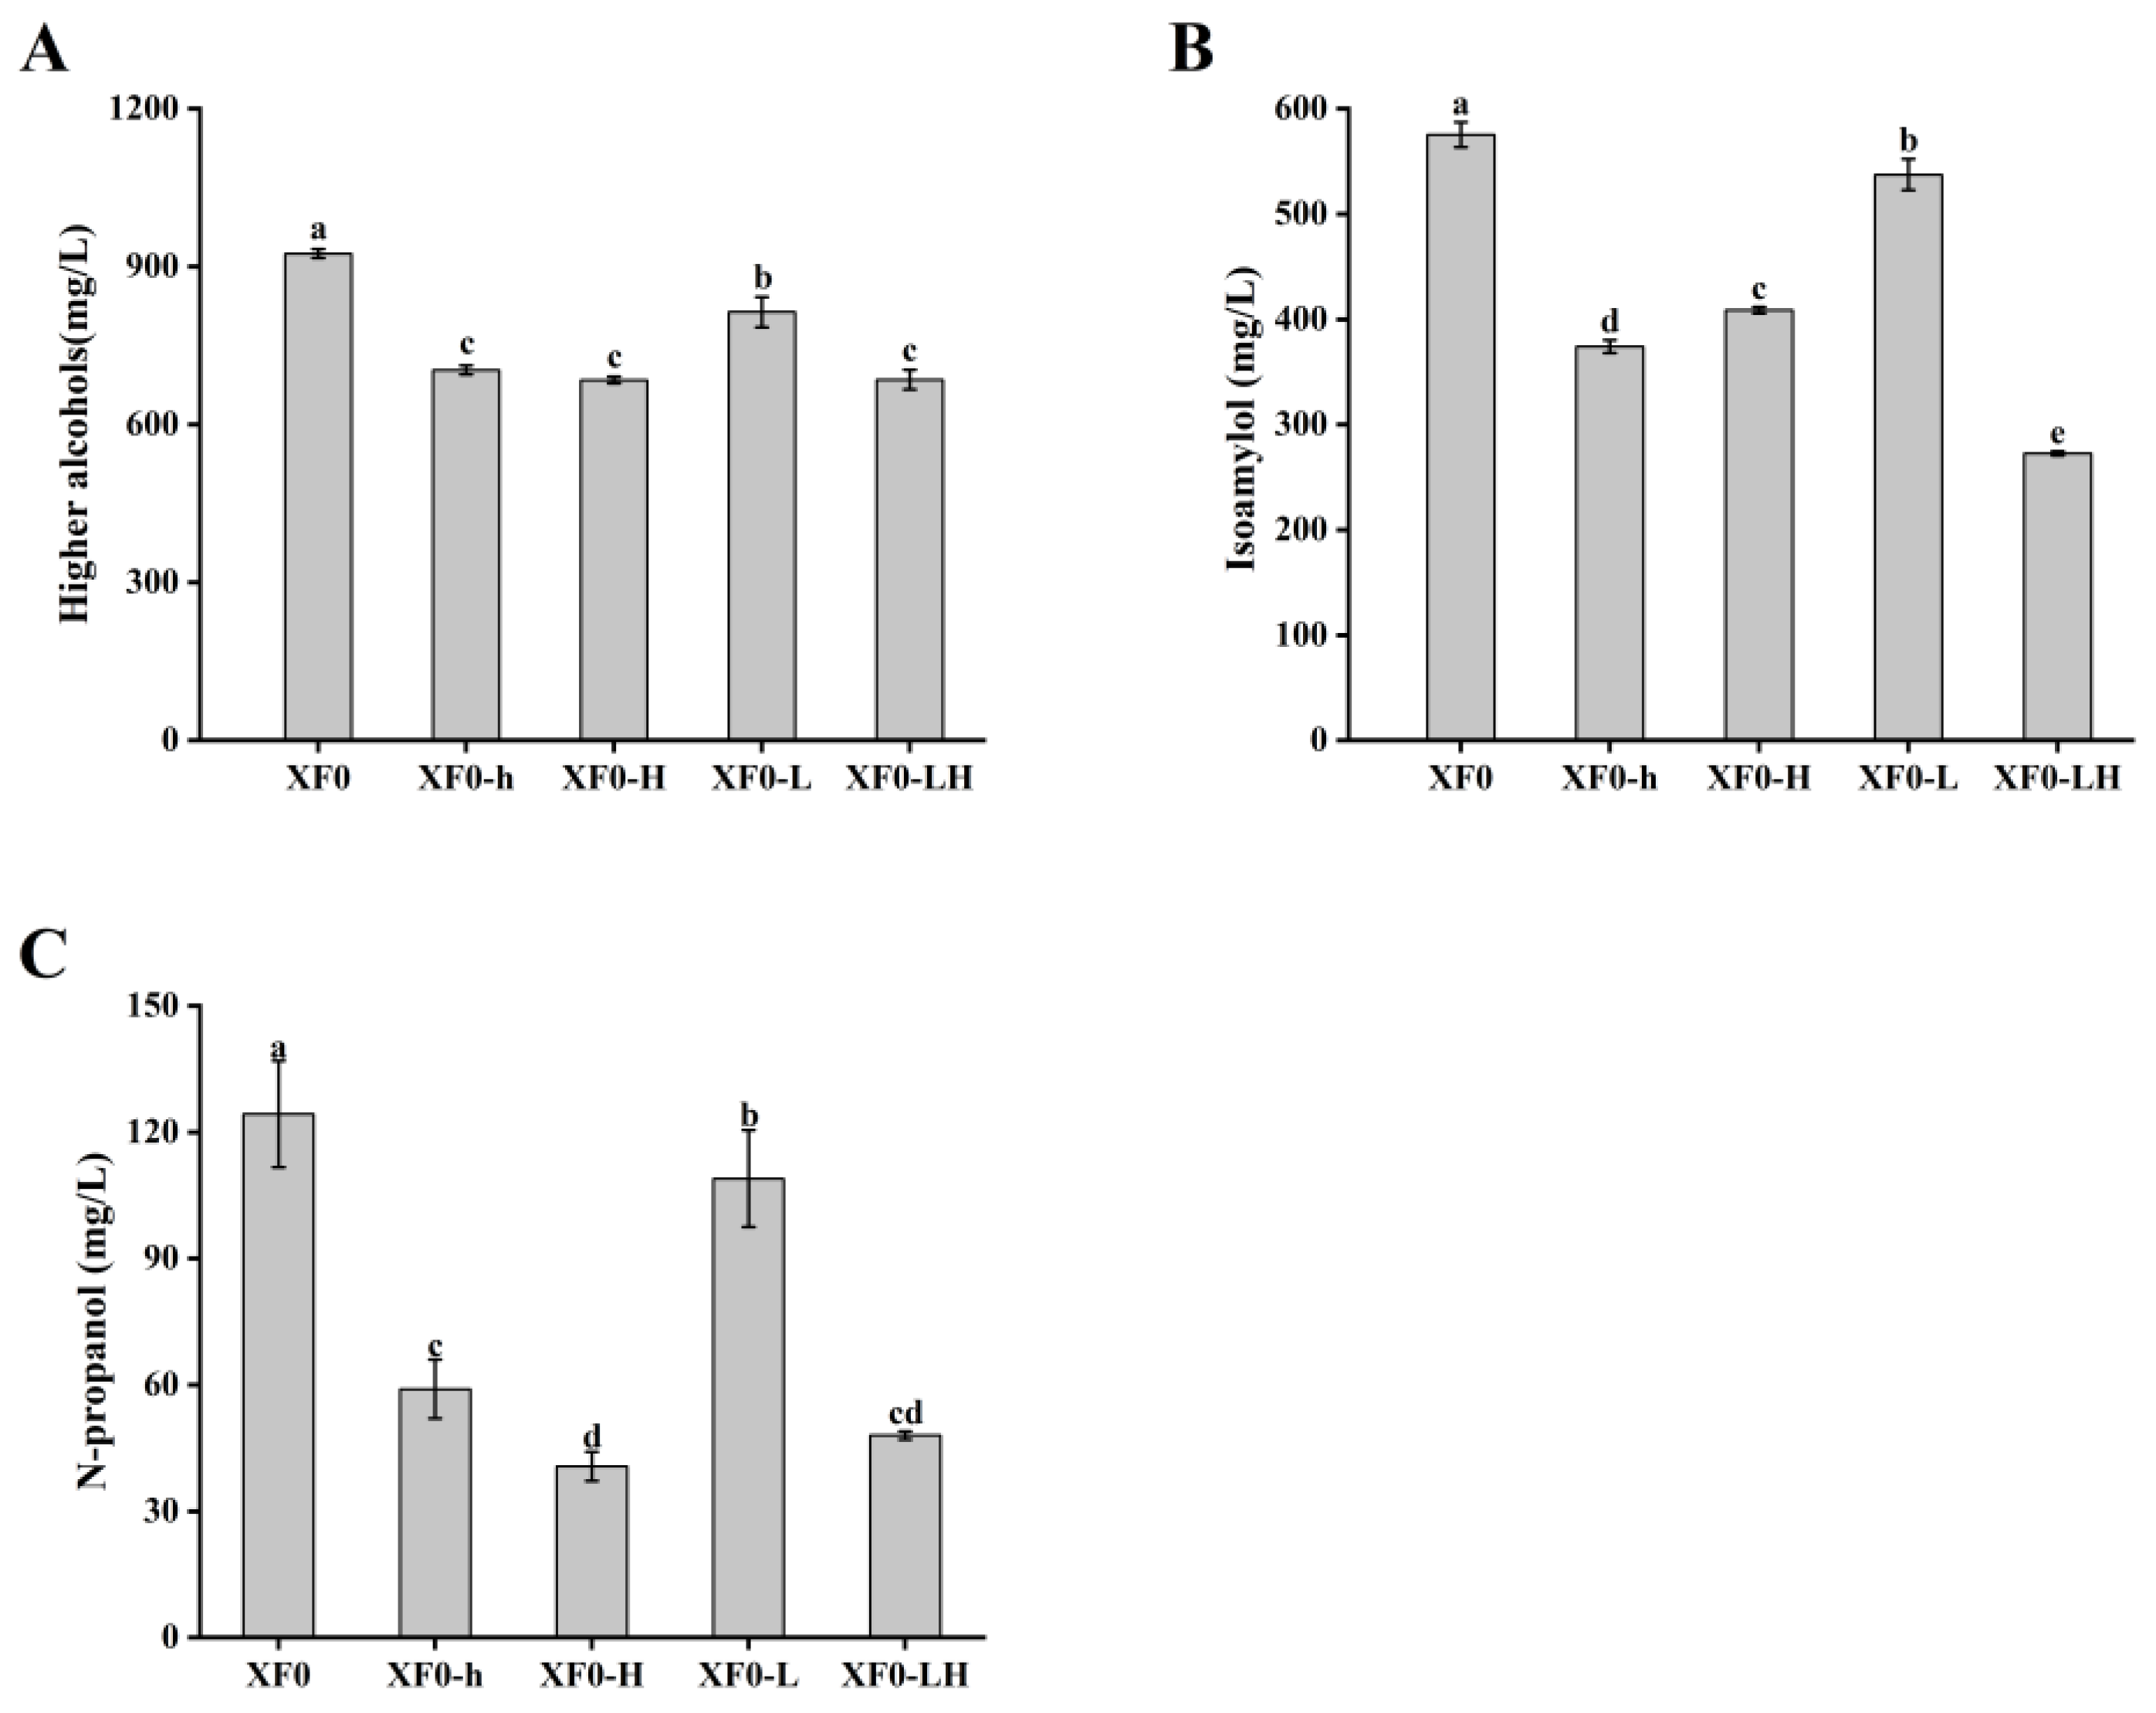
Figure 7.
Fermentation weight loss curves for original strains and recombinant strains.
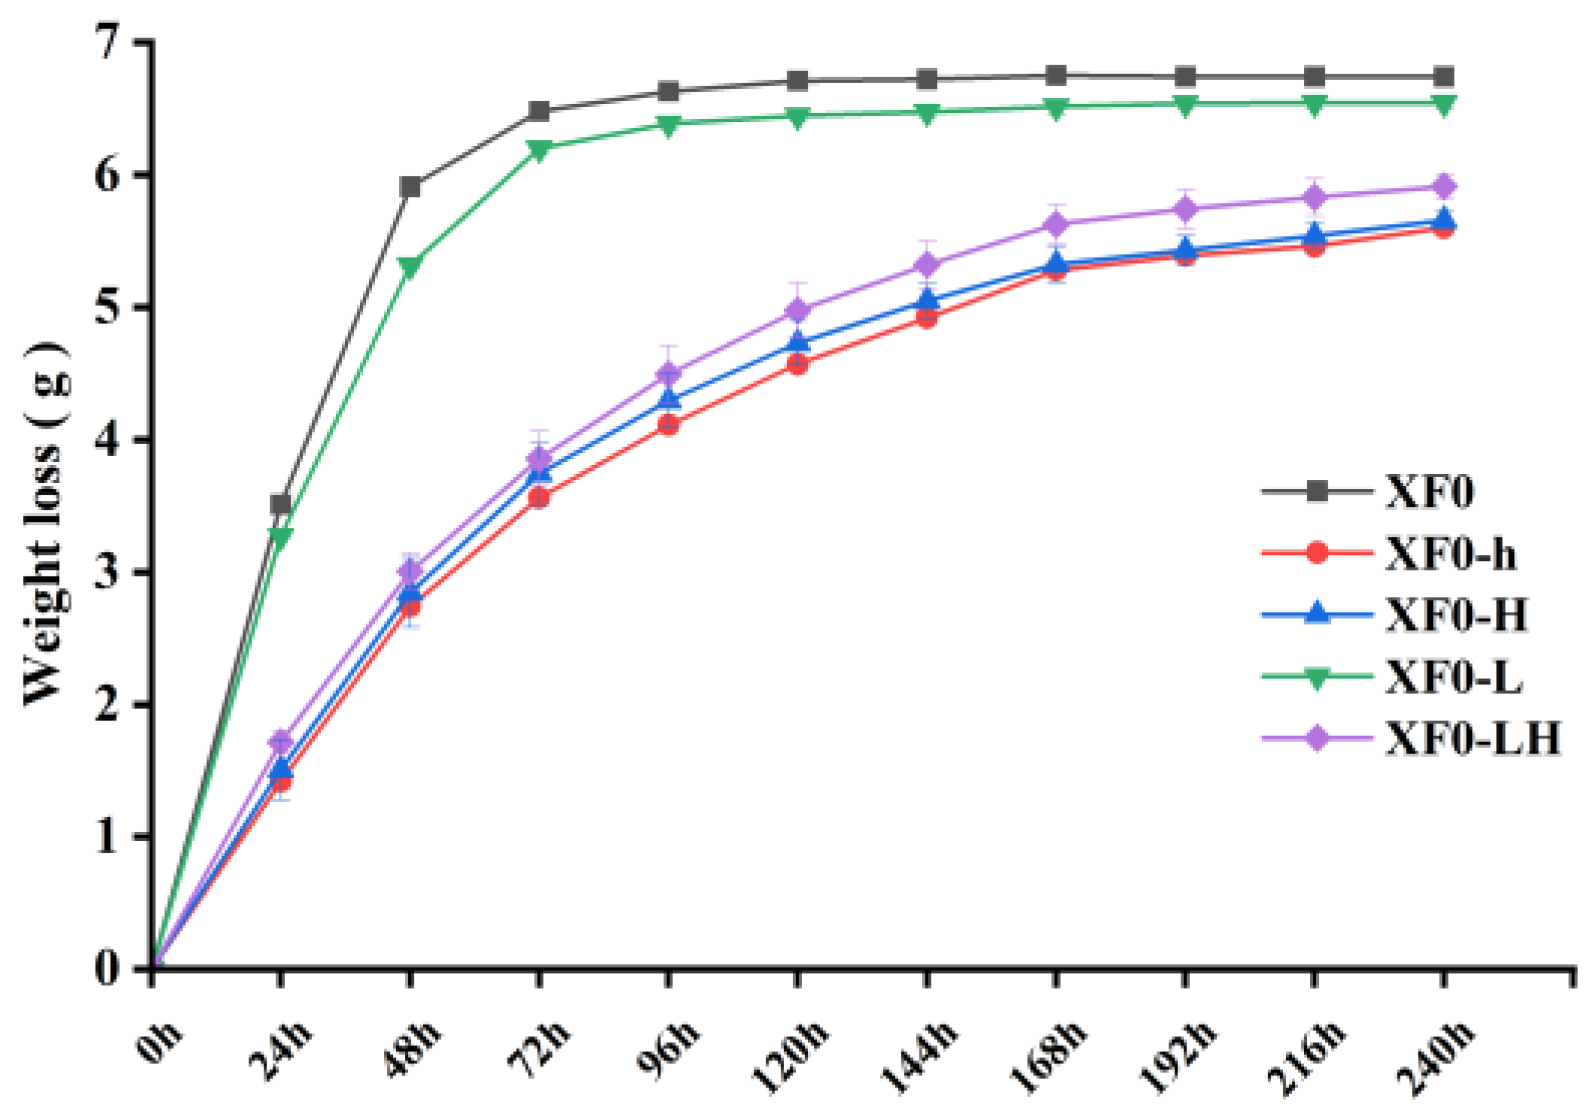
Figure 8.
Effect of wort concentration on Higher alcohols.
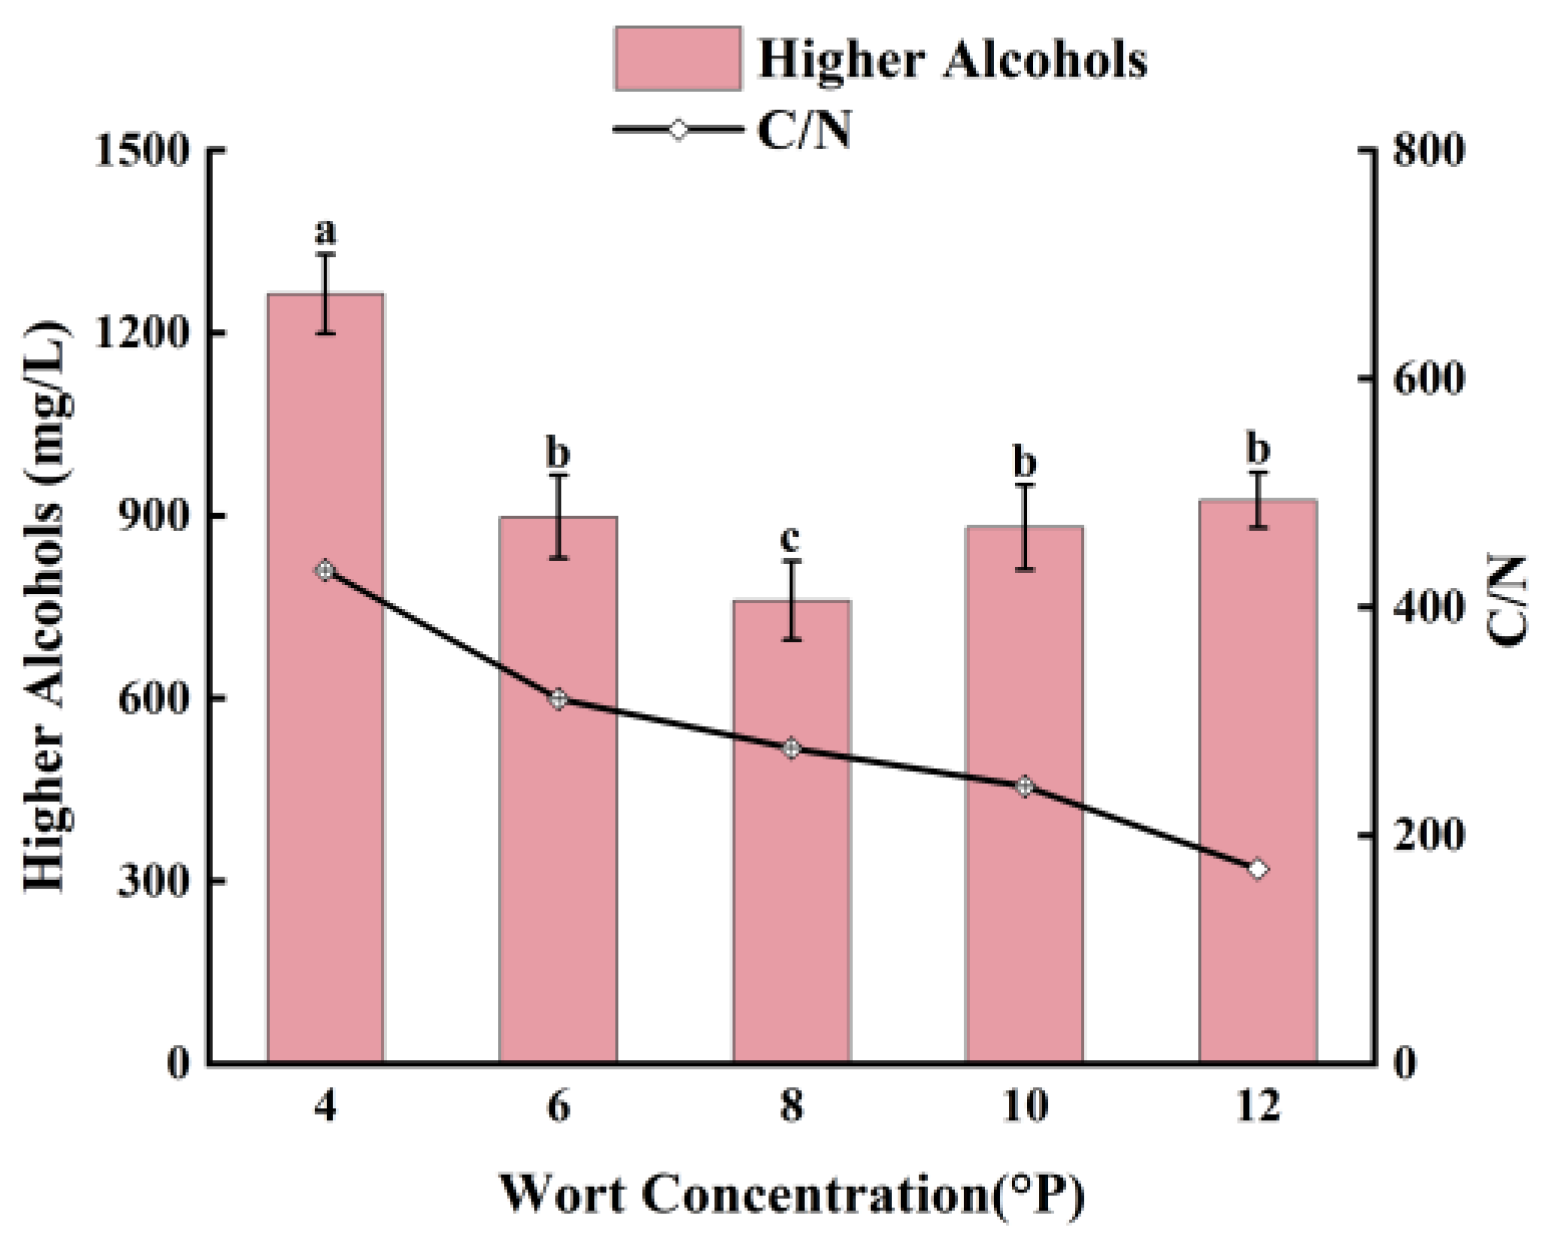
Figure 9.
Effect of yeast inoculum size on Higher alcohols.
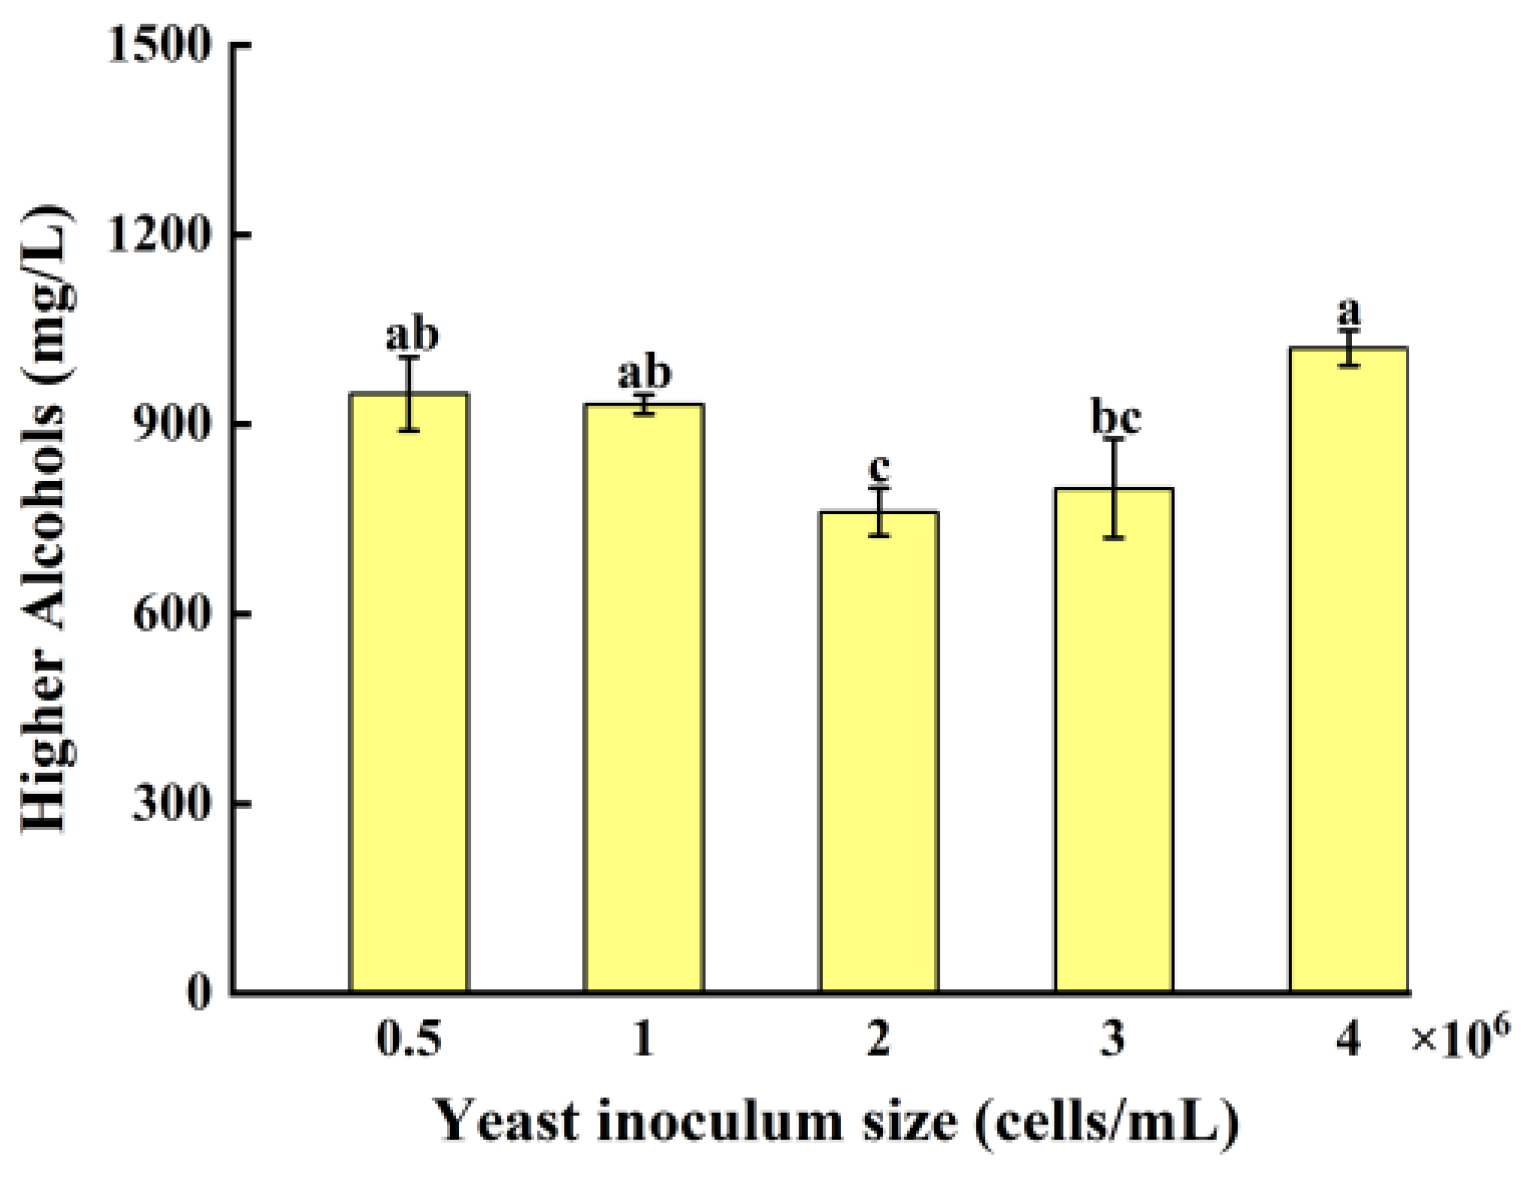
Figure 10.
Response surface and contour plots for the content of higher alcohols (mg/L). (A, a) Effect of wort concentration and hydrolyzed broken rice syrup addition; (B, b) Effect of wort concentration and yeast inoculum size; (C, c) Effect of hydrolyzed broken rice syrup addition and yeast inoculum size.
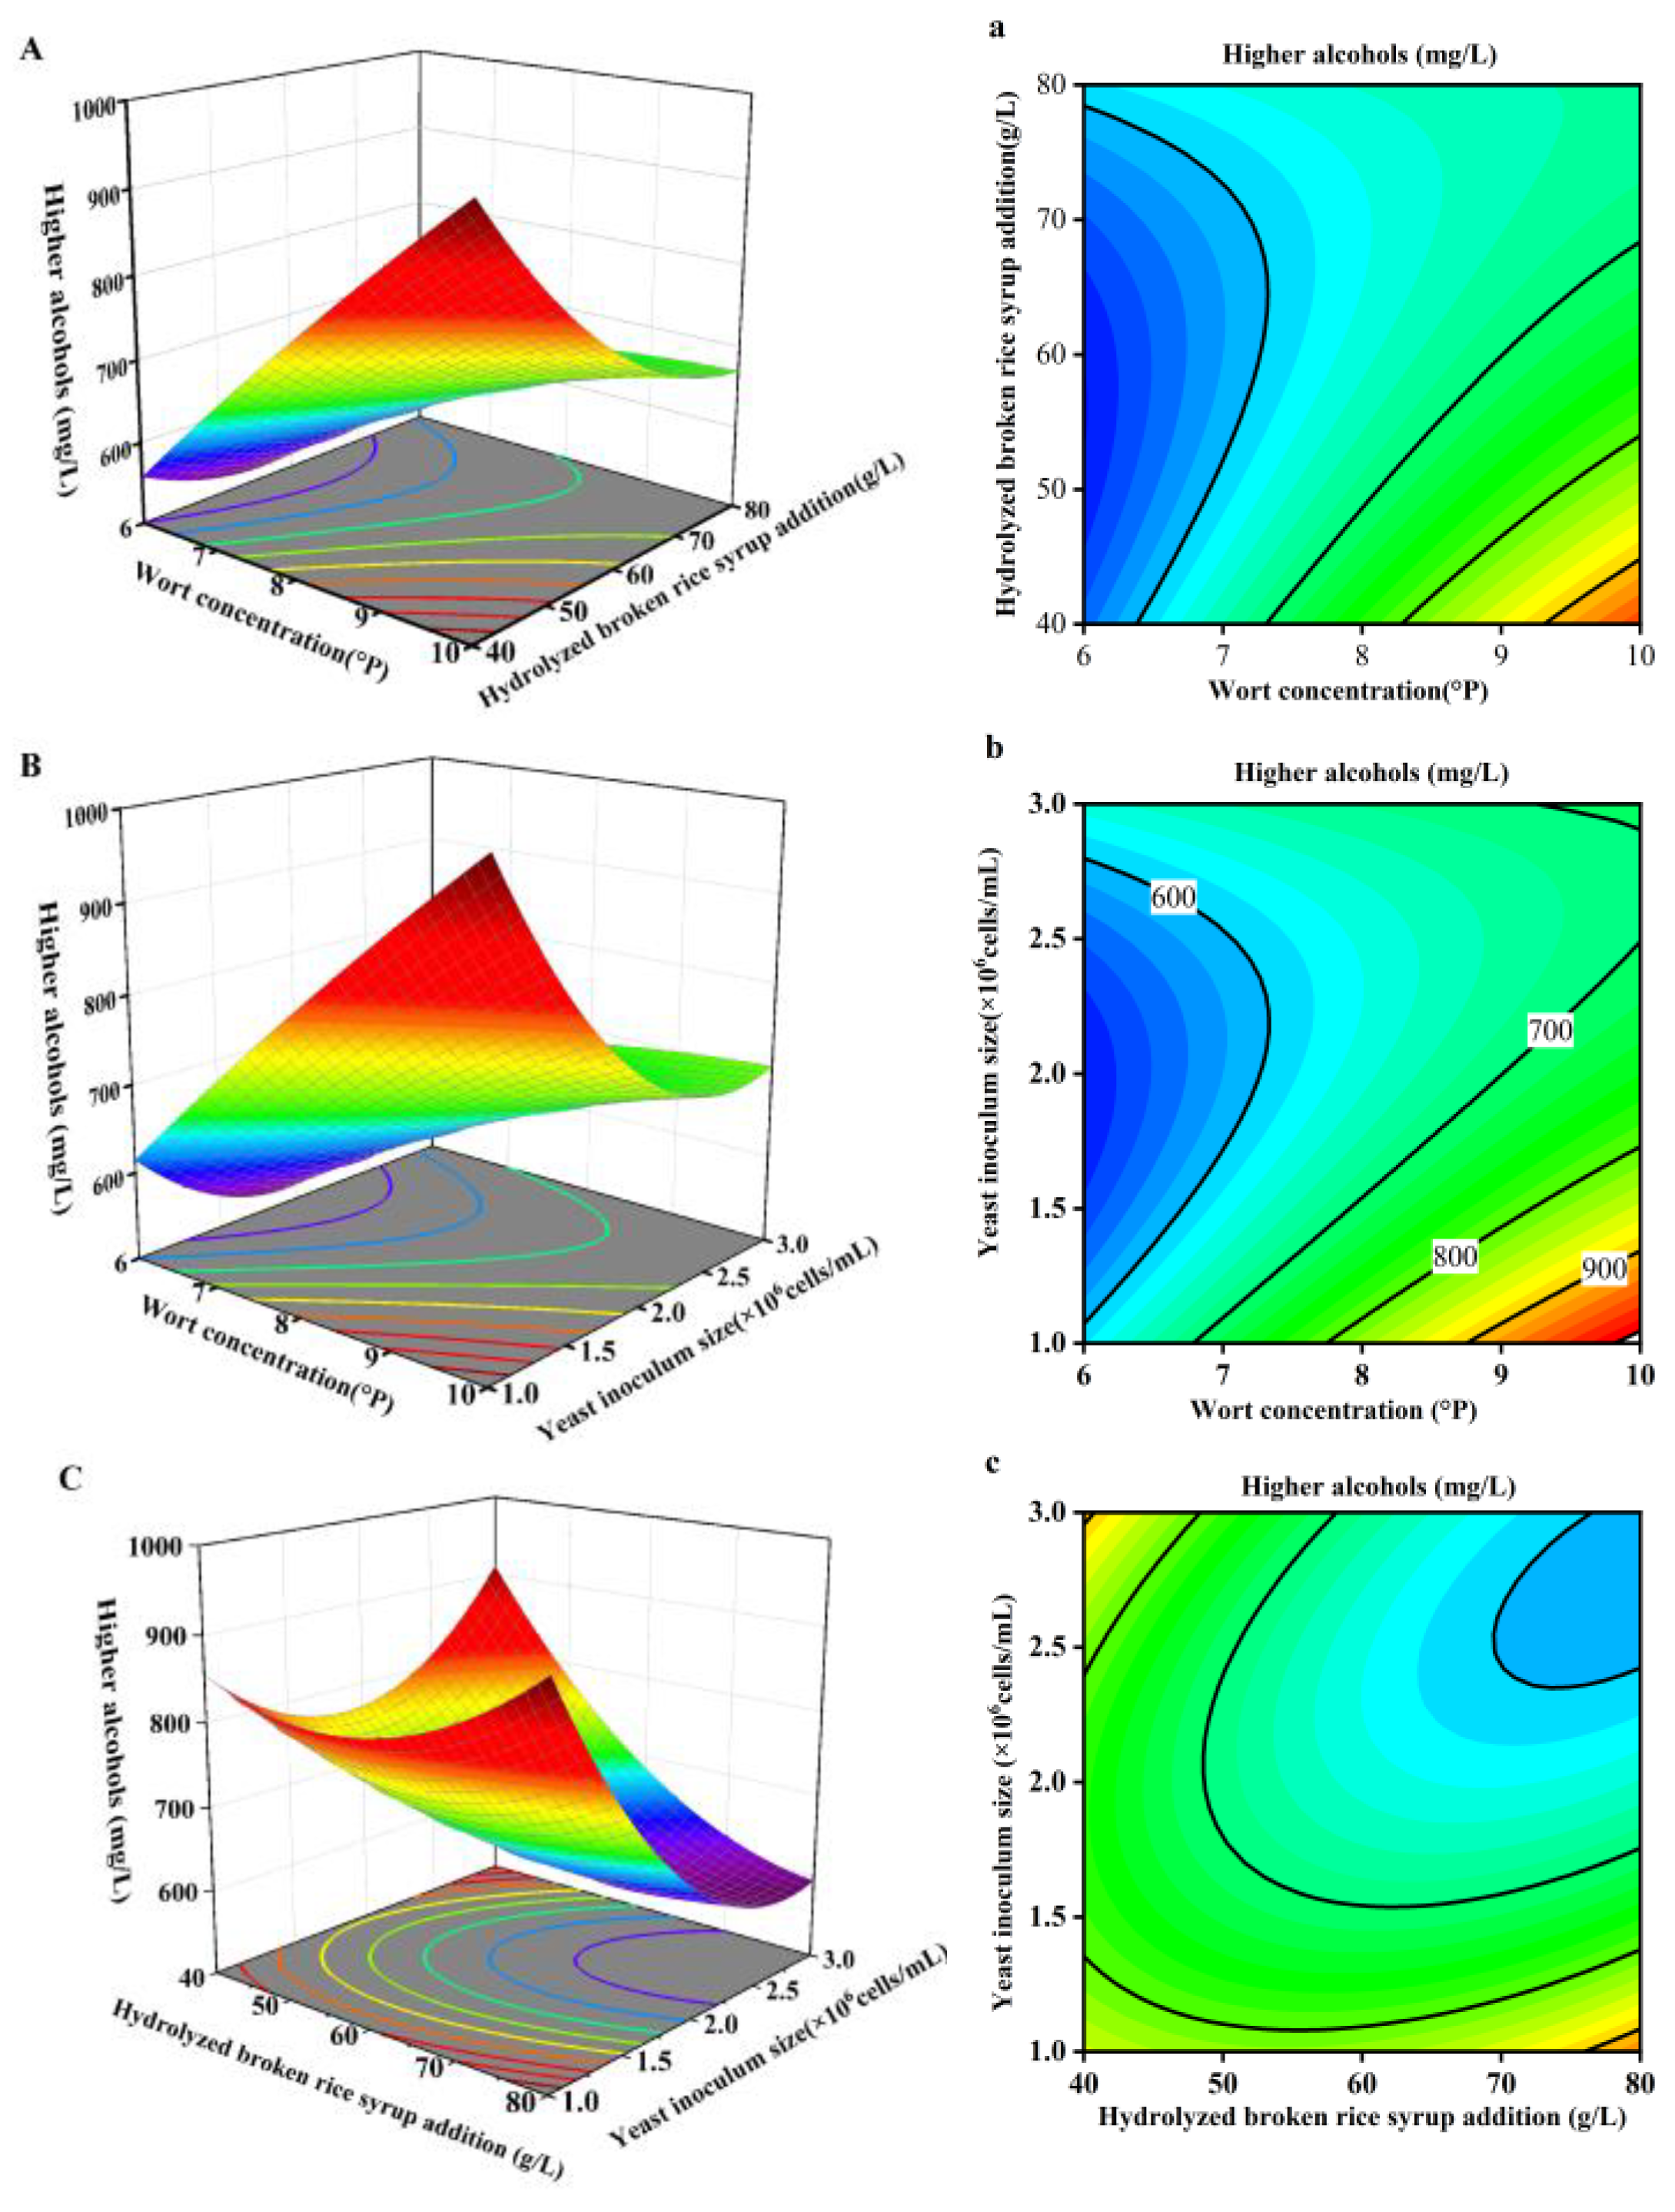
Figure 11.
Aspartate synthesis of higher alcohol metabolic pathways.
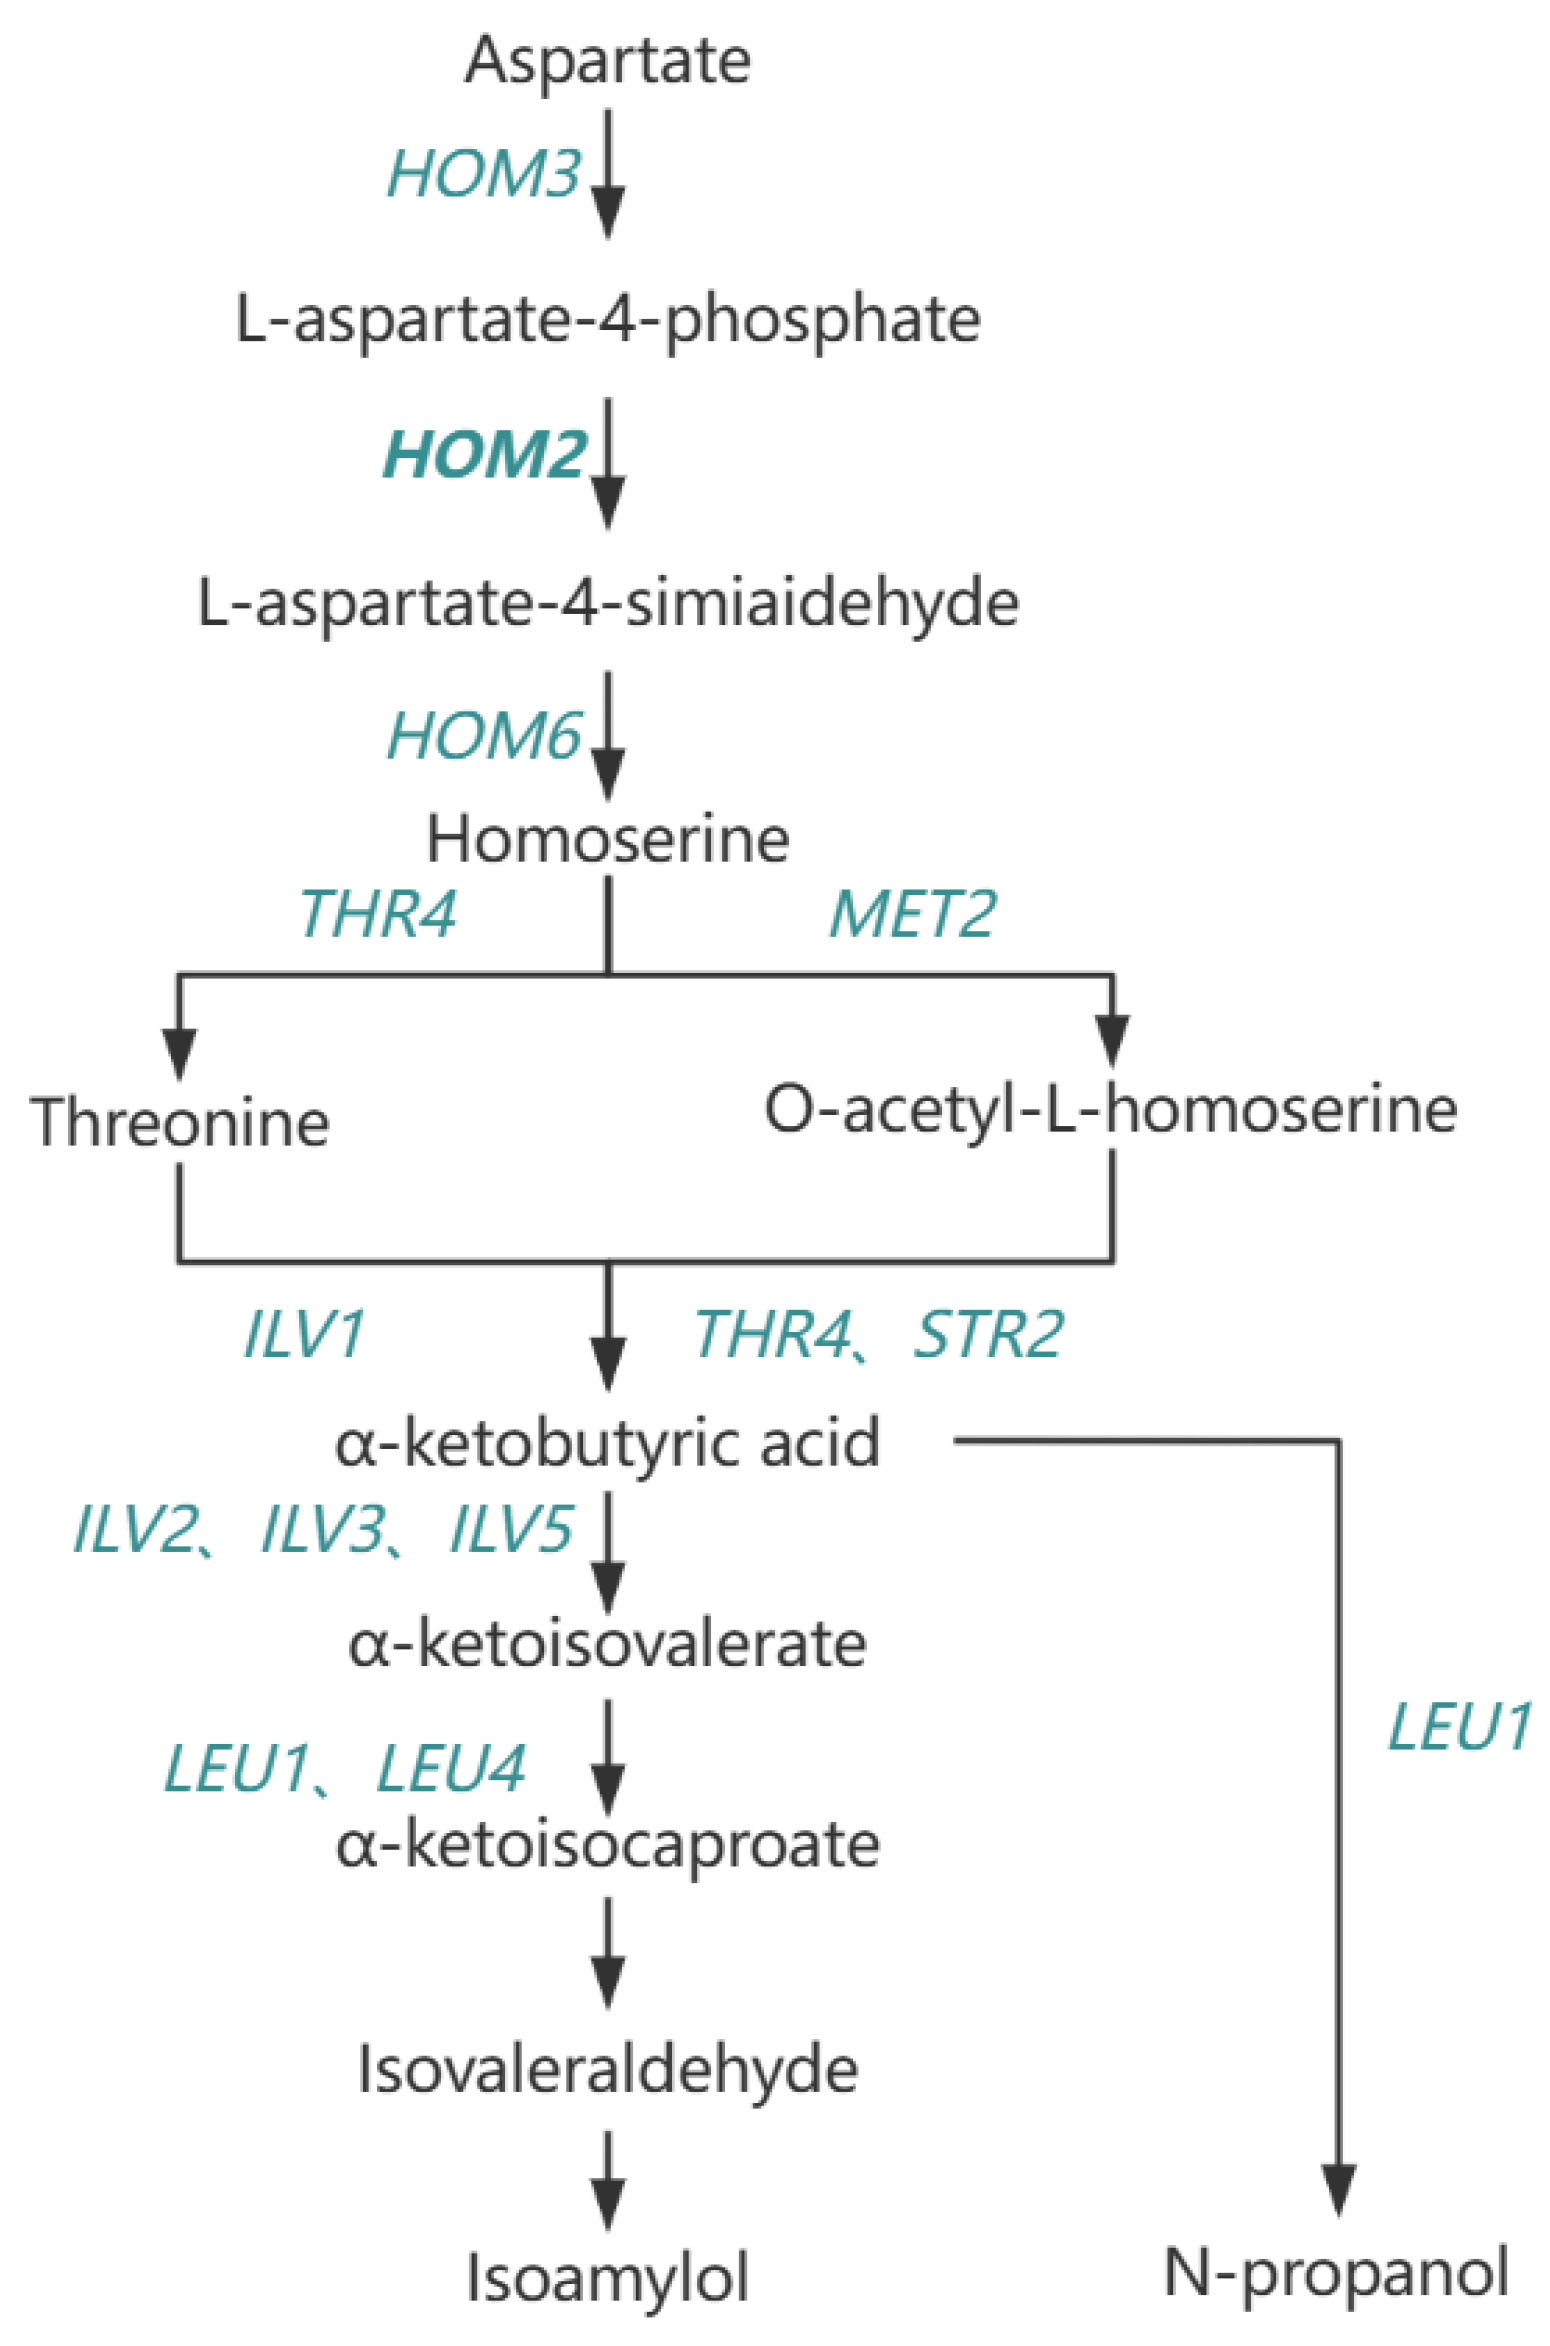
Table 2.
Response surface test design and results.
| RUN | Factors | Relative Higher Alcohols Content (g/L) | ||
|---|---|---|---|---|
| X1 | X2 | X3 | ||
| 1 | -1 | -1 | 0 | 569 |
| 2 | 1 | -1 | 0 | 934 |
| 3 | -1 | 1 | 0 | 643 |
| 4 | 1 | 1 | 0 | 660 |
| 5 | -1 | 0 | -1 | 605 |
| 6 | 1 | 0 | -1 | 1048 |
| 7 | -1 | 0 | 1 | 612 |
| 8 | 1 | 0 | 1 | 715 |
| 9 | 0 | -1 | -1 | 854 |
| 10 | 0 | 1 | -1 | 913 |
| 11 | 0 | -1 | 1 | 931 |
| 12 | 0 | 1 | 1 | 595 |
| 13 | 0 | 0 | 0 | 628 |
| 14 | 0 | 0 | 0 | 616 |
| 15 | 0 | 0 | 0 | 649 |
| 16 | 0 | 0 | 0 | 667 |
| 17 | 0 | 0 | 0 | 661 |
Table 3.
Response surface regression model analysis of variance.
| Source | Sum of Squares | Df | Mean Square | F-Value | p-Value | Significance |
|---|---|---|---|---|---|---|
| Model | 3.50×10⁵ | 9 | 3.89×10⁴ | 39.90 | < 0.0001 | ** |
| A | 1.08×10⁵ | 1 | 1.08×10⁵ | 110.70 | < 0.0001 | ** |
| B | 2.86×10⁴ | 1 | 2.86×10⁴ | 29.35 | 0.001 | ** |
| C | 4.00×10⁴ | 1 | 4.00×10⁴ | 41.08 | 0.0004 | ** |
| AB | 3.04×10⁴ | 1 | 3.04×10⁴ | 31.19 | 0.0008 | ** |
| AC | 2.90×10⁴ | 1 | 2.90×10⁴ | 29.78 | 0.0009 | ** |
| BC | 3.89×10⁴ | 1 | 3.89×10⁴ | 39.92 | 0.0004 | ** |
| A2 | 461.30 | 1 | 461.30 | 0.48 | 0.5134 | |
| B2 | 1.93×10⁴ | 1 | 1.93×10⁴ | 19.78 | 0.003 | ** |
| C2 | 5.23×10⁴ | 1 | 5.23×10⁴ | 53.69 | 0.0002 | ** |
| Lack of fit | 4.98×10³ | 3 | 1.66×10³ | 3.61 | 0.1235 | |
| Residual | 6.82×10³ | 7 | 973.76 | |||
| Pure error | 1.84×10³ | 4 | 459.67 | |||
| Cor total | 3.57×10⁵ | 16 |
Note. **: highly significant (p < 0.01); *: significant (p < 0.05).
Disclaimer/Publisher’s Note: The statements, opinions and data contained in all publications are solely those of the individual author(s) and contributor(s) and not of MDPI and/or the editor(s). MDPI and/or the editor(s) disclaim responsibility for any injury to people or property resulting from any ideas, methods, instructions or products referred to in the content. |
© 2024 by the authors. Licensee MDPI, Basel, Switzerland. This article is an open access article distributed under the terms and conditions of the Creative Commons Attribution (CC BY) license (http://creativecommons.org/licenses/by/4.0/).
Copyright: This open access article is published under a Creative Commons CC BY 4.0 license, which permit the free download, distribution, and reuse, provided that the author and preprint are cited in any reuse.


