
Submitted:
18 October 2024
Posted:
21 October 2024
You are already at the latest version
Abstract
The efficiency and the flame stabilization are two of the main parameters in the design of combustors according to the current policies imposed to the commercial aircraft industry. An alternative for flame stabilization and high efficiency in the combustion process in combustors is the concept of trapped vortex combustor (TVC). The objective of this study is to determine the optimal location and size of the injection holes for the airflow supplied to a TVC by means of a numerical simulation for non-reactive flow. The results showed a two vortex flow structures in the cavity that change their size and intensity according to the allocation and size of the injection holes. The total pressure lost, flow stability, velocity distribution, vortex size and intensity were the parameters for evaluating the different configurations. The optimal behavior was for a set of air injection holes at the top fore wall of the cavity in combination with a second set located at the bottom of the after wall.
Keywords:
Trapped-vortex combustors
; Flow structure
; Non-Reactive Flow
; Combustors
; Numerical Simulation
1. Introduction
The current policies in the care of the environment, specifically in relation to the emission of poluting and harmfull gases, have forced the commercial aircraft industry to develop technology free of pollutants or at least to tend to reduce nocive emissions.The challenge has been focused on increasing the efficiency of gas turbines, mainly opportunity niches have been identified in the combustion chambers, specifically in the combustion efficiency and in the flame stability over a wide range of operating conditions.
Both, the eficiency and the flame stabilization in combustors is improved by the implementation of recirculation zones providing not only continuos sources of ignition but also a mixing of hot products with fresh air and fuel that benefits the combustion process. In some cases, the introdution of conventional swirlers or a bluff body are commonly used to generate the recirculation zones for conducing the hot gases towards the injection zones, mixing the currents and providing the energy conditions for sustaining the combustion [1,2].
Different alternatives have been implemented to reduce polluting emissions without compromising the range of operation of the combustion chambers. For example, variable geometry combustion chamber, combustion in stages, rich- quench-lean (RQL), lean direct injection (LDI), lean premixed prevaporized (LPP), just for mention some of them [3]. A concise but exact description of the advantages and drawbacks of these technologies is showed by Yi and Xiaomin, et al. [3].
An alternative for flame stabilization and high efficiency in the combustion process in combustors is the concept of trapped vortex combustor (TVC). The TVC uses physical cavities in the wall to stabilize the flame meanwhile, the conventional designs utilize a toroidal reversal flow of the combustion gases that is recirculated and mixed to the incoming air and fuel to provide continuous ignition [4]. The concept was introduced in 1995 [5] and has been becoming an attractive topic in the scientific community having several publications related to it in recent times.
The TVC concept is simple, cavities are used for flame stabilization by shielding the flame from the mainstream, the TVC creates recirculation zones, in addition air and fuel can be supplied from both the fore wall and after wall to create a vortex that are trapped, enhancing the mass and energy transport between the cavity and the mainstream flow. The results are an enhancement in the combustion efficiency as well as stabilization in the flame [6,7,8].
Three are the major benefits of a TVC. First, the vortex formed in the combustion zone can be strengthened by suitable air and fuel injection. Also, higher combustion performance can be achieved by the mixing vortex produced. Finally, contaminant emissions might be reduced by controlling the temperature below 1850 K to limit NOx and smoke emissions [9,10]. Even more, some authors report that TVC can operate at high inlet velocities up to Ma=0.77 and have the potential of achieving about 10 to 40% reduction in NOx emissions [1,7].
Experimental and numerical studies for TVC performance are presented by Sighal and Ravinkrishna [4,11]. In a first publication they present a rig for a reacting and non-reacting flow experiments considering the influence of changing the L/D (length to depth ratio) in the cavity for methane as working substance. The conclusion is that for a high inlet velocity a low L/D ratio is recommendable for stable combustion. The experimental results are coincident with the numerical one presented in a second part [4,11].
In the last 30 years it has been generated an impressive amount of research related to TVC technology applied to combustors. Different, experimental and numerical investigations have been conducted to analyze the advantages and an important progress of this devices have been reached. A very detailed review of the evolution of TVC was presented by Zhao and coworkers [12] where they describe the four generations of TVC developed until now. Similarly, Yi Jin and collaborators [3] made an important description of several researchers conducted in the TVC combustors, as well as the work presented by Fei Xing et al [13] who made an important description of some important contributions in this area.
Zhao et al. [12] and L. Yu-ying [14] make a comparison of the performance for several combustors and different geometries and operative conditions. However, in the studies they reported that there are just a few dedicated to analyzing the effects for the location of the air injection holes and the effects of them in the vortex stability and those who present information does not consider realistic operative conditions. The location of the injection holes for airflow is an important parameter that needs the attention of researching as well as its influence in the flow stability and the impact in the size of the recirculation zones and vortexes in the TVC.
In this sense, the combustor chosen for the present work produces air at 1.4 MPa and 650K. Several studies have been conducted for this equipment basically focused on the size of the TVC and in the flame stability, as well as in different configurations for the swirlers in the main duct [2,9,13,17]. However, at knowledge of the authors, there is not studies for analyzing the angle of fuel and air injection in the cavity. Based on the published information [8,12,14,15,16] an in order to contribute to the TVC technology, in this paper four different configuratios for the location of the air flow injection are studied; denomined cases A, B, C, D. The purposoe is to obtain the best stability of the vortex in the TVC for these cases. In a second part of this study, the influence of the hole diameters in the flow stabilization is also studied considering four different diameters for the inyecion holes 3.5mm, 4.2mm, 7.8mm and 9.5 mm for the W, X, Y and Z study cases.
2. Materials and Methods
The combustor selected is an aeronautic turbofan with an 8:1 thrust/weight ratio. The compressor produces air at 1.4 MPa and 650K [17]. The TVC has an axisymmetric annular geometry based on the TVC proposed by Zhang RC, Fan W, et al. [2,17]. A 15° sector of the TVC is shown in Figure 1. The figure also shows the pipe flame and the casing.
The ratio between the length and the depth in the cavity is defined by:
The value is closed to 1.4, as presented in reference [18]. As mentioned in different publications, the ratio L/H=1.4 shows a better mixing because a higher portion of the main flow goes into the cavity and under some conditions a doble vortex is formed impacting positively in the stability of the combustion [16,17,18].
The air flow in the cavity of the TVC passes through 120 holes of 6mm diameter distributed in two rows. This configuration is the appropriate for the TVC working under a RQL regime. One row of holes is in the fore wall of the cavity while the other row is located at the rear wall of the cavity. This configuration was obtained after testing several combinations of number of holes and their diameter resulting from an mass conservation analysis for the air flow needed in the TVC cavity for an equivalence ratio for the best performance acording to previos studies. The operative conditions for the TVC are summarized in Table 1.
Figure 2 shows a two-dimensional section of the TVC with the different geometrical dimensions.
To avoid the variation on the equivalence ratio the total area for the airflow inlet will keep constant, then an increase in the hole diameters will require a decrease in the number of holes as it is shown in Table 2. A sector of the frontal view of the cavity for the study cases is shown in Figure 3.
Numerical Methodology
The software for the numerical analysis was OpenFOAM (Open Field Operaton and Manipulation) that is a free software based on the finite element analysis and a C++ programming language.
The geometrical domain consists in the TVC combustor including the cavity, the air admission holes, the injection holes and the dilution holes. The exterior core for the secondary air flow circulation is also considered as part of the geometrical domain. The grid generation was run by means of the ANSYS R20 for students. Some important details for the grid size are summarized in Table 3.
Additionally, the mesh has a local refinement and the boundary layer approximation as well as inflation layer are applied at the vicinity of the cavity. The grid size is about 5,863,447 hexahedral cells whit a minimal orthogonal quality of 0.15 and a maximum skewness of 0,849, in this sense, it can be said that the proposed grid has a good quality. A figure for the lateral view of the grid can be appreciated in Figure 4.
The numerical analysis is for air at constant specific heat. The flow behavior, in specific the vortex inside the cavity, are the main objective for determine the combustion efficiency and the flame stability for the TVC. OpenFOAM-rhoSimpleFoam solver, that is a solver for steady state turbulent flow, is used in addition to the SIMPLE algorithm for solving the pressure-velocity linkage in the steady state Navier-Stokes equations in the computational domain [19].
The convergence of the solution was stablished by means of the GCI (grid convergence index); proposed by Roache and Celik [20,21], that have been wide used for monitoring the error in the discretization process for TVCs and checking convergence [22,23].
For the grid independence study, five different grid size were tested. The finest grid was for 7,195,663 cells and the next one was with 10% less of cells and so on. A summary of the grid size tested, and the geometry features of each grid is presented in Table 4.
Figure 5 shows the axial velocity profile at x/L=0.5 for the different grid size proposed. L is the axial length of the cavity.
The CGI method reported that the error for the G4 is less than the values presented in the literature [21,23]. Then this grid size is chosen for the productive runs due to the computational time for convergence is considerably reduced and the results are qualitatively and quantitatively correct and do not change drastically from those obtained with finest grids.
3. Results and Discussion
The flow inside the TVC can be described by means of the total pressure, streamlines, and the intensity of turbulence [24]. Other different parameters considered for analysis in the present work are the velocity ratio in the cavity, the velocity gradient and the Q criterion for identifying the vortex in the cavity in planes aligned with the injection holes and in planes in the middle of holes.
In a first part the objective is to obtain the best stability of the vortex in the TVC for four different locations of the air flow injection; identified as cases A, B, C, D.
3.1. Results and Discussion for Cases A, B, C, D.
The first variable to consider is the pressure total loss in the TVC. As can be appreciated if Figure 6, for the study cases A, B, C and D, the total pressure loss is less than 0.25%. This mean that the total pressure loss in the non-reactive flow is much less than the pressure loss in the combustion chambers in a conventional gas turbine, such that under the same operating flow conditions they have pressure losses from 4-6% [25].
Due to for the cases A-D, the dimensions, positions, and operating conditions in the TVC are the same, changing the location for the air inlet in the cavity does not have considerable impact in the loss of pressure in the TVC.
The vortex inside the cavity is qualitatively compared for the studied cases by means of the streamlines as presented in Figure 7.
It can be observed in Figure 7, that for cases A and C there are two vortexes inside the cavity, the main and bigger one is counterclockwise and is located at the right and its extension goes from the superior to the bottom wall of the cavity and is caused by the main flow at the inlet. A secondary vortex clockwise located at the bottom left corner is also found. This secondary vortex improves the mixing between the combustion gases in the cavity and the fresh air coming from the compressor.
The case B shows a third vortex located at the upper left corner of the cavity, due to the main flow inlet has been displaced towards the inferior wall. The presence of the two vortexes mentioned for A and C is also presented for the case B. However, for the case D there is only one vortex presented that occupies almost all the space inside the cavity and its center is displaced to the superior right corner, due to the secondary airflow is entering through the holes in the fore wall displacing the vortex of the main flow, limiting not only its size but also the mixing.
Figure 8 shows the presence of vortex structures by means of the Q criterion. The white zone identifies a vortex zone, its mean that the second invariant of the velocity gradient has a positive value.
A comparison of the area occupied by the vortex for cases A, B, C, and D is presented in Figure 9. As can be appreciated the case C is the one that have a higher percentage of the cavity area occupied by the vortex. In this sense, more than half of the cavity area is fulfilled by a vortical zone.
Figure 10 shows the axial velocity profile at different stages in the axial direction. Cases A and C have a similar behavior, but not in stage x=0.9L, due to in this axial position the flow is affected by the secondary airflow that goes in by the holes at the rear wall. However, the influence of the secondary flow is lost in positions far away the rear wall, there the main vortex is able for properly recirculating the secondary flow, enhancing the mixing.
To quantify the flow stability in a cavity by means of the axial velocity the concept of the ratio of the maximum positive and maximum negative velocities along an axial position is presented in Figure 11. A ratio higher than 0.13 means an instable flow and a separation point if there is a vortex in the axial position [26,27]. The zones that have a high ratio of velocities generally are zones where the axial velocity gradients are high.
For the case A, stages x/L=0.1 and x/L=0.3 the velocity ratio is less than 0.13, this means that the flow is stable and the vortex in this zone doesn’t have separation. But for axial positions x/L= 0.4, 0.5 and 0.7, the value is lightly superior the instability criterion, however, in these zones are located the main vortex and the secondary vortex, and separation is not presented.
For the case B, at x/L=0.1, x/L =0.2 and x/L =0.3, the high value of the velocity’s ratio is due to the high velocity gradient associated to the velocity in the airflow inlet, there is also a presence of small vortex zones. In these cases, there is a flow separation in the main vortex.
For x/L=0.1, x/L=0.2, x/L=0.3 and x/L=0.4 for the case C, the behavior is similar to the case A. Due to the velocity ratio is smaller than the stability criterion, the shear layer and the secondary vortex are stable. Case D have the higher values for the velocity ratio; therefore, this case is associated with flow instabilities along the cavity.
The best stability for the flow in the analyzed cases was the case C. Although the case A has a similar behavior, the main advantage of the case C is that the size of the recirculation zone is the biggest and the adverse influence of the flow from the back wall is the minor. This is the main reason that this configuration is chosen for the following analysis for the TVC cavity combustor. In the next paragraphs, the influence of the hole diameters in the flow stabilization is presented considering four different diameters for the inyecion holes 3.5mm, 4.2mm, 7.8mm and 9.5 mm for the W, X, Y and Z study cases respectively.
3.2. Results and Discussion for Cases W, X, Y, Z.
Figure 12 shows the total pressure lost for the cases W, X, Y, and Z. As mentioned before, changing the configuration of the holes for the secondary flow in the cavity do not significantly impact the total pressure lost, due to the pressure depends on the airflow velocity at the inlet, that for these cases remains constant.
Figure 13 shows the presence of two vortex zones as Case C. Also, it is observed that the cases W and X have a more chaotic structure in the main vortex compared with case C. For Y and Z cases, there are not important differences in the secondary vortex.
Figure 14 shows the results of applying the Q criterion for identifying recirculation zones to the cases W, X, Y, and Z. In the four cases there is the presence of vortical zones, but the size of the recirculation zone is different for each case. Due to the location of the injection holes is invariant, the distribution of the vortex in the cavity is the same for the analyzed cases. Figure 14 confirms that the secondary vortex (smaller vortex) keeps its extension and structure, but the area for the main vortex is slightly modified due to the change in the diameter of the injection holes. As the diameter of the holes is increased, minor is the area occupied by the main vortex as can be understood by the Figure 15. Like the case C, the streamlines identify a bigger recirculation zone than the Q criterion.
Figure 16 shows the velocity ratio for different axial positions in the cavity. It is observed that for x/L<0.50 there are not notorious difference in the analyzed cases, however, for x/L>0.75 there are significant differences, being the case X the one that presents the higher value for the velocity ratio and then higher flow instabilities in this section. The case X presents an increase in the velocity ratio for x/L>0.7, but for 0.1<x/L<0.7 the velocity ratio is slightly different to the instability limit (0.13).
The premature increase for the velocity ratio for case C is because as the diameter of the injection holes is augment, so the velocity in the stream flow entering the cavity increases, therefore, a higher ratio for positive and negative velocities is presented, also the secondary airflow has a bigger momentum. This velocity influences positions far away from the rear wall of the cavity, increases the velocity ratio. This behavior is reinforced with the streamlines and the Q criterion that showed that the main vortex occupies a significant minor area than the cases W and X when compared with cases C, Y and Z. The before mentioned confirms that the positive and negative velocities ratio and the presence of vortex are related. Since the total area of the injection holes remains constant in the study cases, the change in the mainstream flow velocity produces different mass flow in the holes, then for each configuration there are different values for equivalence for non-reactive flow.
Table 5 shows the comparison for the air mass flow distribution in the TVC for different hole´s diameters in the cavity wall.
As the diameter in the holes is augmented a bigger amount of secondary flow is through the cavity by the holes in the wall. For a reactive flow conditions, this will reduce the fuel/air ratio (FAR) in the TVC, then the local equivalence ratio is also reduced.
When the TVC operates only with fuel injection it is considering a RQL scheme [22,26] where the cavity provides all the energy required for the combustion, working as a combustor´s primary zone. Under this condition, for liquid fuel [22] it have been found efficiencies higher than 99% with 1.2<fcav<3.8, even more it have been shown that for ϕ_cav≈1.6; as obtained for the case Y; the liquid fuel can be totally evaporated inside the cavity, resulting in a high intensity and efficient combustion.
According to the numerical results of non-reactive flow, the combination of the injection holes for the case D (0.0042m) and the Y configuration is the one that has the best behavior for flow stabilization, the biggest recirculation zone and the best airflow distribution for the TVC.
4. Conclusions
For the TVC studied it is needed that the air injection holes are located such that the vortex are improved, and the flow instabilities are suppressed. Different locations and diameters for the air injection holes were numerically simulated for non-reactive flow conditions, the analysis produce the following conclusions.
The location´s change for the air holes in the walls of the cavity, as well as the variation of the diameters do not have a significant influence for the total pressure lost for the TVC.
- When the air injection holes are located at the top of the fore wall of the TVC (Cases A and C) two recirculation zones are presented in the cavity. Even more, this location allows the biggest vortex in the cavity.
- The area occupied by the main vortex in the cavity diminishes if the diameter for the airflow holes increases. The Y configuration with diameter of 0.0042mm produces the largest vortex.
- Only changing the diameter in the airflow injection holes does not impact the position and size of the secondary vortex.
- Augmenting the diameter size of the airflow injection holes produces a higher portion of mass flow in the cavity.
- The flow distribution for the Y case is the most optimal for a RQL operation scheme.
- The recirculation zone does not remain annularly for higher diameter air flow injection holes, contrary, if many small holes are occupied the vortex conserve their flow structure in the cavity.
Author Contributions
Conceptualization, methodology, validation, writing original draft, Luis Alfonso Moreno Pacheco and Edgar Jeovany Jarquin Lopez, formal analysis, investigation, writing-original draft, Juan Gabriel Barbosa Saldaña, software, Edgar Jeovany Jarquin Lopez, investigation, validation, visualization, writing review paper, editing, José Martínez Trinidad, Ricardo Andrés García León, Miguel Toledo Velázquez. All authors have read and agreed to the published version manuscript.
Funding
This research was financially supported by the CONAHCYT in the form of scholarships and by the IPN in its SIP researching programs and BEIFI scholarships.
Conflicts of Interest
The authors declare no conflicts of interest.”
References
- Y. Jin, Y. Li, X. He, J. Zhang, B. Jiang, Z. Wu, Y. Song. Experimental investigations of flow field and combustion characteristics of a model trapped vortex combustor. Appl. Energy. 2014, 134, pp- 257-269. doi.org/10.1016/j.apenergy.2014.08.029.
- F. Xing, S. Zhang, P. Wang, W. Fan. Experimental investigation of a single trapped-vortex combustor with a slight temperature raise. Aerosp. Sci. Technol. 2010, 14 (7), pp. 520–525. [CrossRef]
- Y. Jin, X. He, J. Zhang, B. Jiang, Z. Wu. Experimental study on emission performance of an LPP/TVC. Chinese J. Aeronaut. 2012, 25, pp. 335–341. [CrossRef]
- Singhal and R.V. Ravikrishna. Single cavity trapped vortex combustor dynamics-Part 1: Experiments. Int. J. Spray and Combustions Dynamics. 2011, 3 (1), pp. 23-44. [CrossRef]
- 5 V.R. Katta, W.M. Roquemore. Numerical studies on trapped-vortex concepts for stable combustion, ASME-Turbo Asia Conference (1996).
- M. Li, X. He, Y. Zhao, Y. Jin, K. Yao, Z. Ge. Performance enhancement of a trapped-vortex combustor for gas turbine engines using a novel hybrid-atomizer. Appl. Energy. 2018, 216, pp. 286–295. [CrossRef]
- P.K. Ezhil Kumar, D.P. Mishra. Numerical simulation of cavity flow structure in an axisymmetric trapped vortex combustor. Aerospace Science and Technology. 2012, 21, pp. 16-23. [CrossRef]
- Y. Zhu, Y. Jin, X. He. Effects of location and angle of primary injection on the cavity flow structure of a trapped vortex combustor model. Optik. 2019, 180, pp. 699–712. [CrossRef]
- R. C. Zhang, F. Hao, W. J. Fan. Combustion and stability characteristics of ultra-compact combustor using cavity for gas turbines. Appl. Energy. 2018, 225, pp. 940–954. [CrossRef]
- R. Zhang, W. Fan. Experimental study of entrainment phenomenon in a trapped vortex combustor. Chinese J. Aeronaut. 2013, 26(1) pp. 63–73. [CrossRef]
- Singhal, R.V. Ravikrishna. Single cavity trapped vortex combustor dynamics-Part 2: Simulations. International Journal of Spray and Combustions Dynamics. 2011, 3(1) pp. 45-62. [CrossRef]
- D. Zhao, E. Gutmark, P. de Goey. A review of cavity-based trapped vortex, ultra-compact, high-g, inter-turbine combustors. Prog. Energy Combust. Sci. 2018, 66, pp. 42–82. [CrossRef]
- F. Xing, P. Wang, S. Zhang, J. Zou, Y. Zheng, R. Zhang, W. Fan. Experiment and simulation study on lean blow-out of trapped vortex combustor with various aspect ratios. Aerosp. Sci. Technol. 2012, 18, pp. 48–55. [CrossRef]
- L. Yu-ying, L. Rui-ming, L. He-xia, Y. Mao-lin. Effects of Fuelling Scheme on the Performance of a Trapped Combustor Rig, 45th AIAA/ASME/SAE/ASEE Joint Propulsion Conference (2009).
- D. L. Burrus, W. M. Roquemore, A. W. Johnson, D. T. Shouse. Performance Assesssment of a Prototype Trapped Vortex Combustor Concept for Gas Turbine Application, ASME-IGTI, (2001).
- W. M. Roquemore, D. Shouse, D. Burrus, et al. Trapped vortex combustor concept for gas turbine engines, 39th Aerospace Sciences Meeting and Exhibit, (2001). [CrossRef]
- R. Zhang, W. Fan, Q. Shi, W. Tan. Structural design and performance experiment of a single vortex combustor with single-cavity and air blast atomisers. Aerosp. Sci. Technol. 2014, 39 pp. 95–108. [CrossRef]
- D. P. Mishra, R. Sudharshan. Numerical analysis of fuel-air mixing in a two-dimensional trapped vortex combustor. Proc. Inst. Mech. Eng. Part G J. Aerosp. Eng. 2010, 224 (1), pp. 65–75. [CrossRef]
- J-N. Reddy, N.K. Anand, P. Roy. Finite Element and Finite Volume Methods for Heat Transfer and Fluid Dynamics. Cambridge University Press, UK, 2023; pp.
- P. J. Roache. Quantification of uncertainty in computational fluid dynamics. Annu. Rev. Fluid Mech. 1997, 29, pp. 123–160. [CrossRef]
- I. B. Celik, U. Ghia, P. J. Roache, C. J. Freitas, H. Coleman, P. E. Raad. Procedure for estimation and reporting of uncertainty due to discretization in CFD applications. J. Fluids Eng. Trans. ASME. 2008, 130(7), pp. 0780011–0780014. [CrossRef]
- Y. Jin, X. He, J. Zhang, B. Jiang, y Z. Wu. Numerical investigation on flow structures of a laboratory-scale trapped vortex combustor. Appl. Therm. Eng. 2014, 66(1-2), pp. 318–327. [CrossRef]
- M. Li, X. He, Y. Zhao, Y. Jin, Z. Ge, Y. Sun. Dome structure effects on combustion performance of a trapped vortex combustor. Appl. Energy, 2017, 208, pp. 72–82. [CrossRef]
- S. Vengadesan, C. Sony. Enhanced vortex stability in trapped vortex combustor. Aeronaut. J., 2010, 114 (1155) pp. 333–337. [CrossRef]
- A. H. Lefebvre, D. R. Ballal. Gas Turbine Combustions: Alternative Fuels and Emissions. CRC Press. USA, 2010.
- K. K. Agarwal, R. V. Ravikrishna. Experimental and numerical studies in a compact trapped vortex combustor: Stability assessment and augmentation. Combust. Sci. Technol. 2011, 183, pp. 1308–1327. [CrossRef]
- G. S. Elliott, M. Samimy. Compressibility effects in free shear layers. Phys. Fluids A. 1990, 2(7) pp. 1231–1240. [CrossRef]
Figure 1.
A 15° section of the tube flame for the TVC.
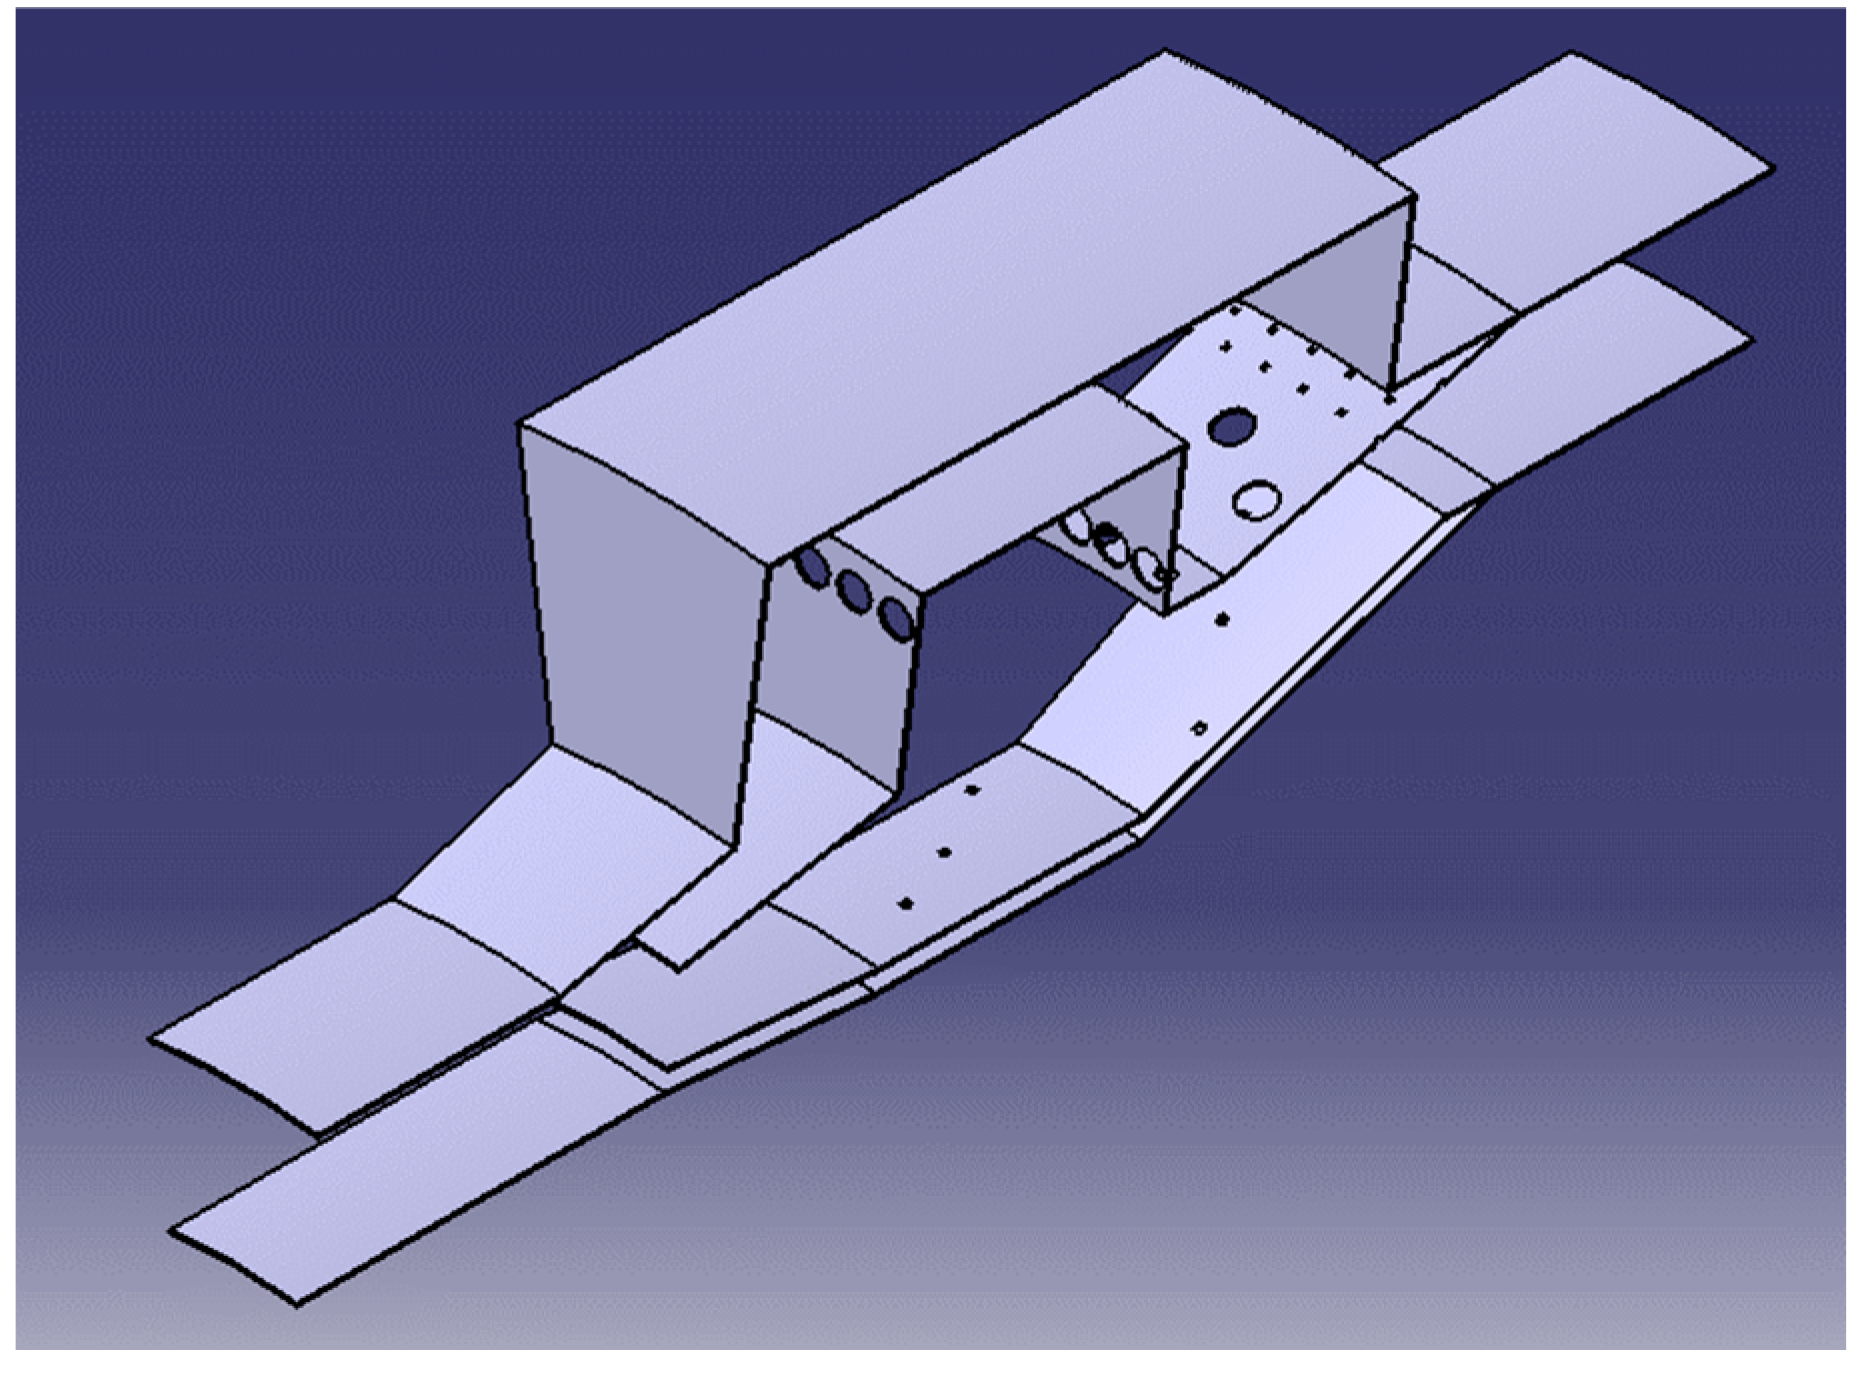
Figure 2.
Different positions for the locations for the air hole’s in the cavity showed from a cross-section view (a) Case A, (b) Case B, (c) Case C and (d) Case D.
Figure 2.
Different positions for the locations for the air hole’s in the cavity showed from a cross-section view (a) Case A, (b) Case B, (c) Case C and (d) Case D.
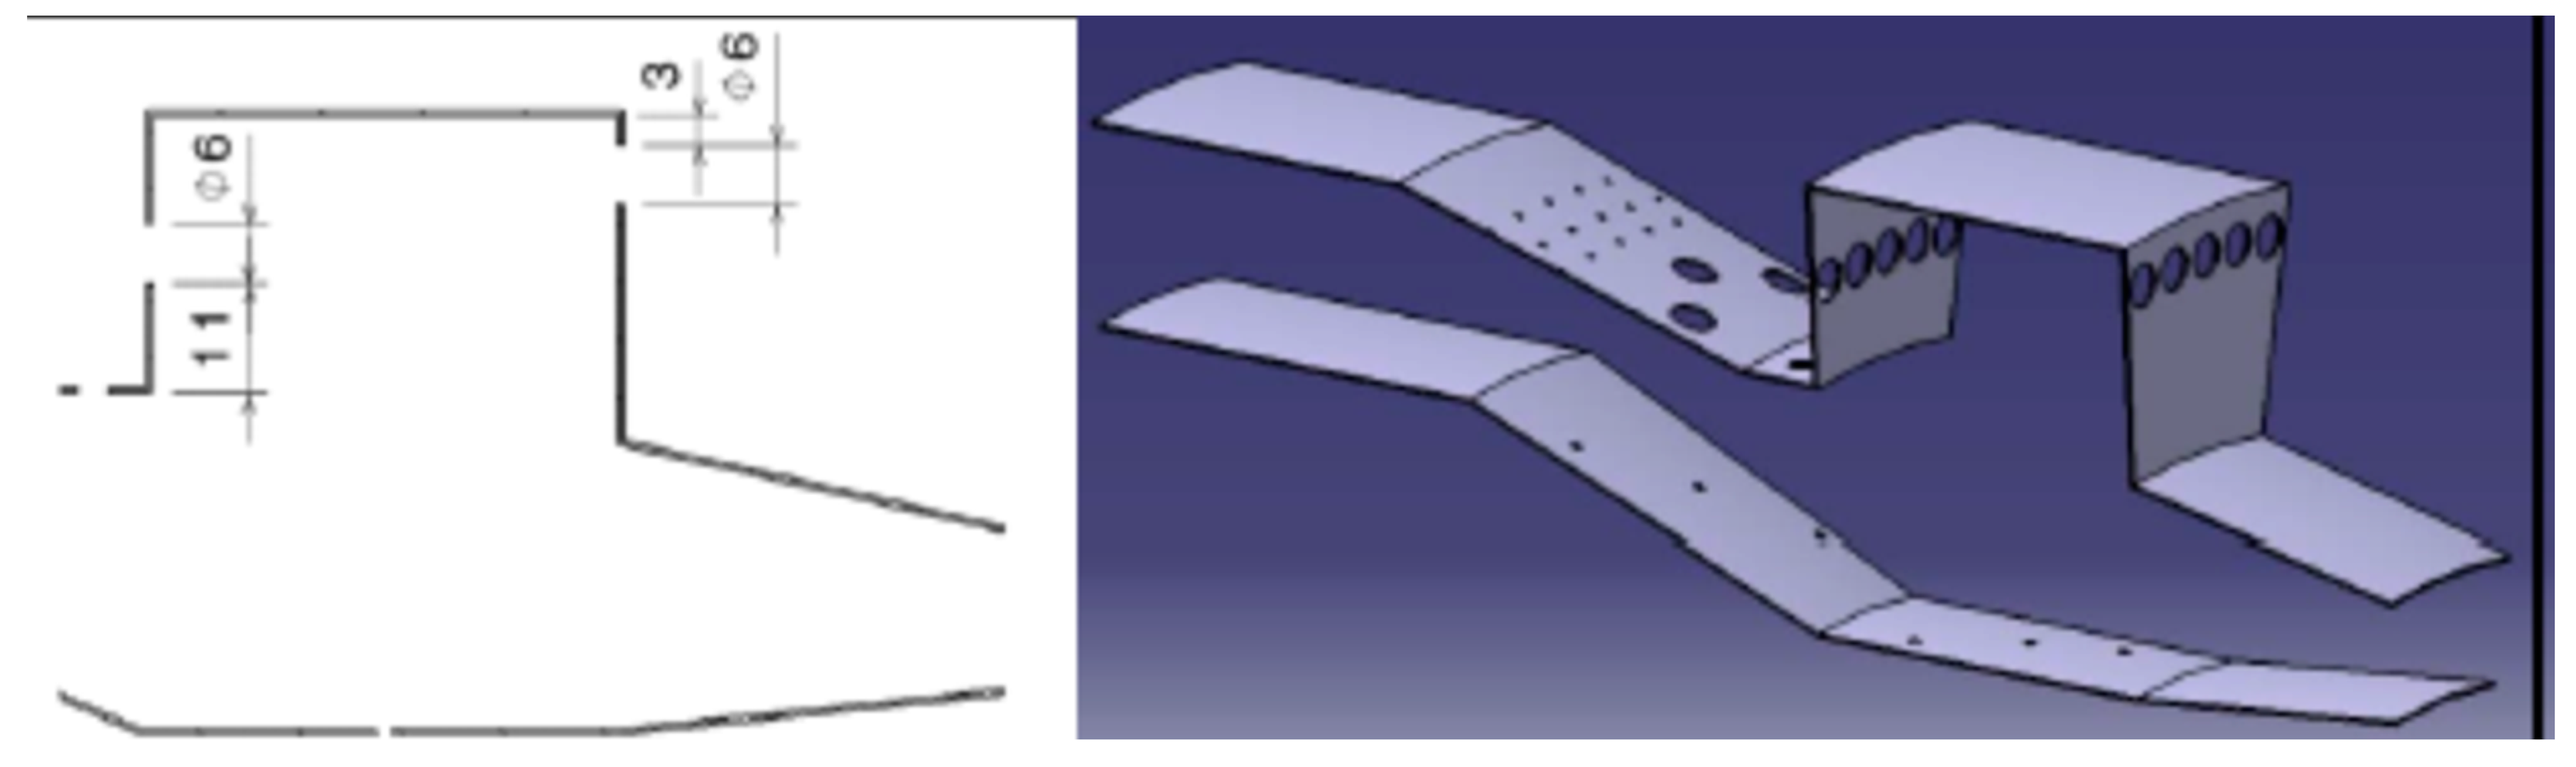
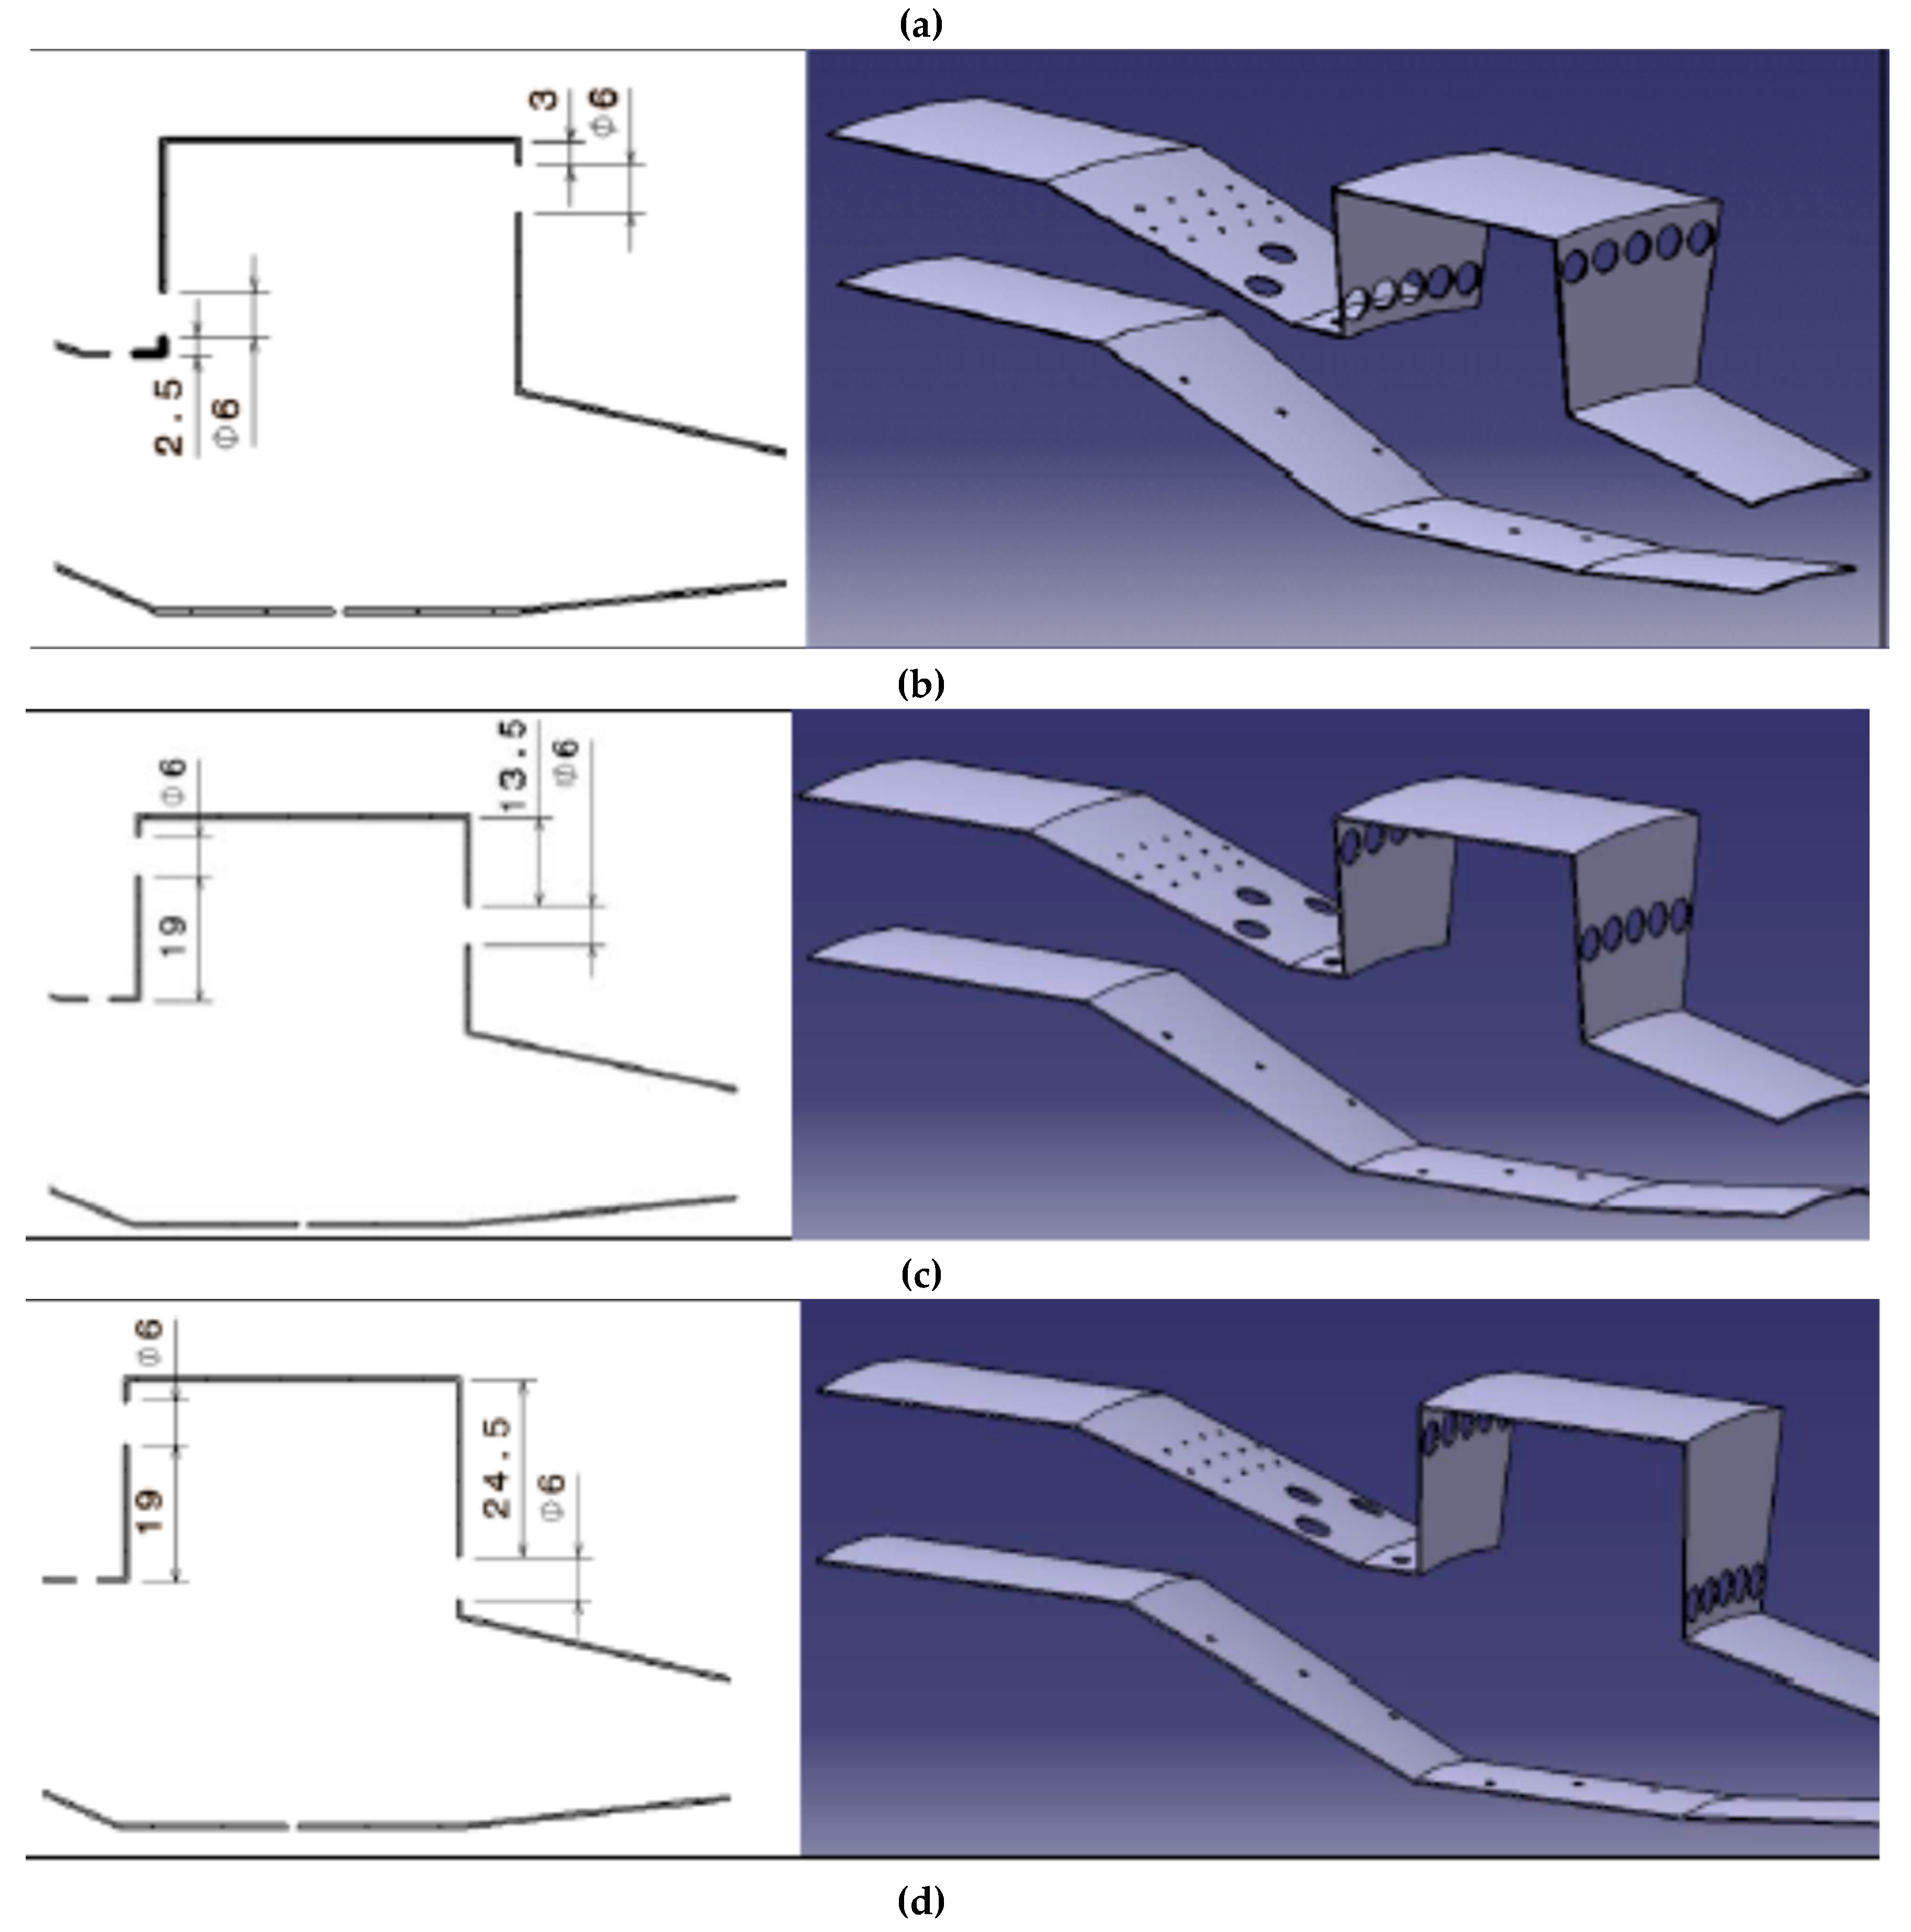
Figure 3.
Sector of the frontal view of the cavity. (a) Case W, (b) Case X, (c) Case Y, (d) Case Z.
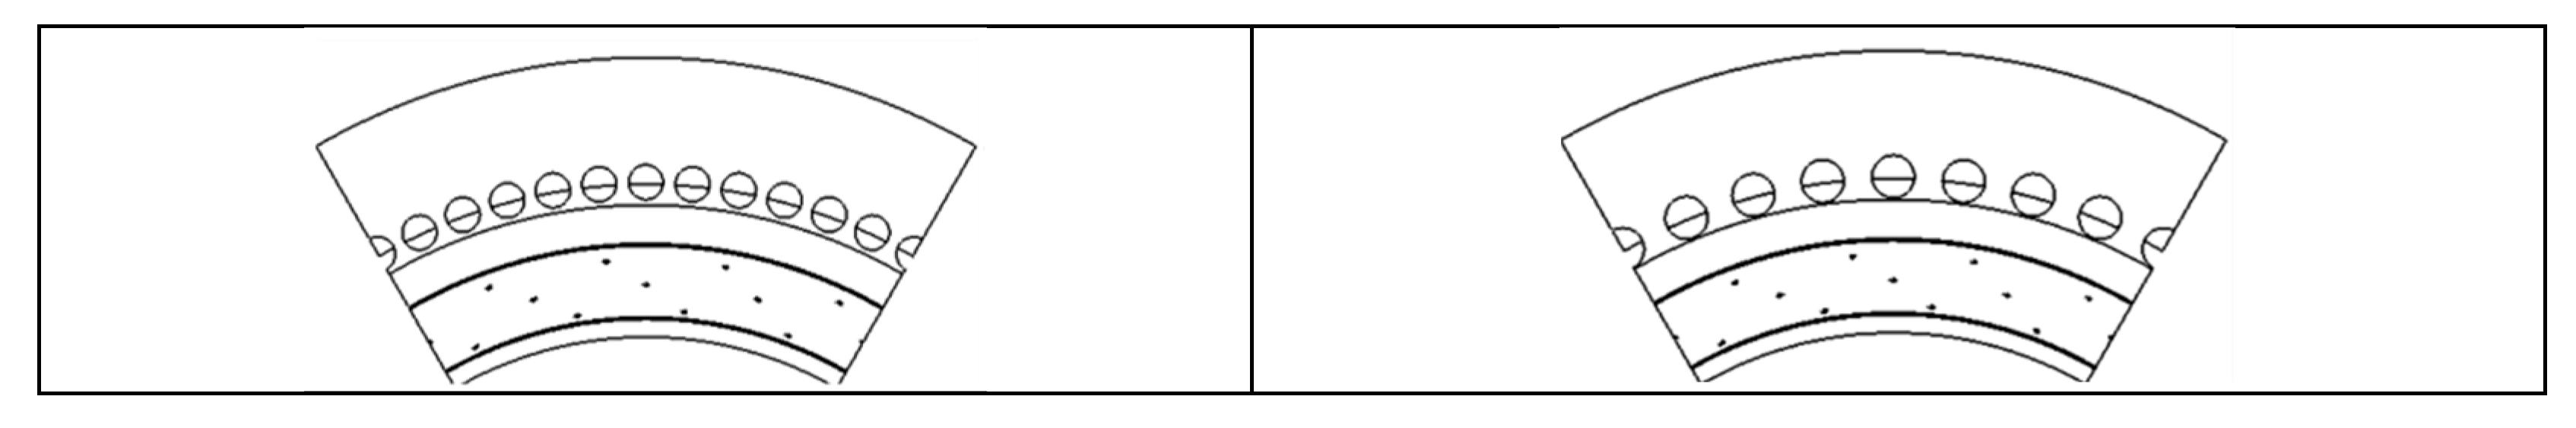
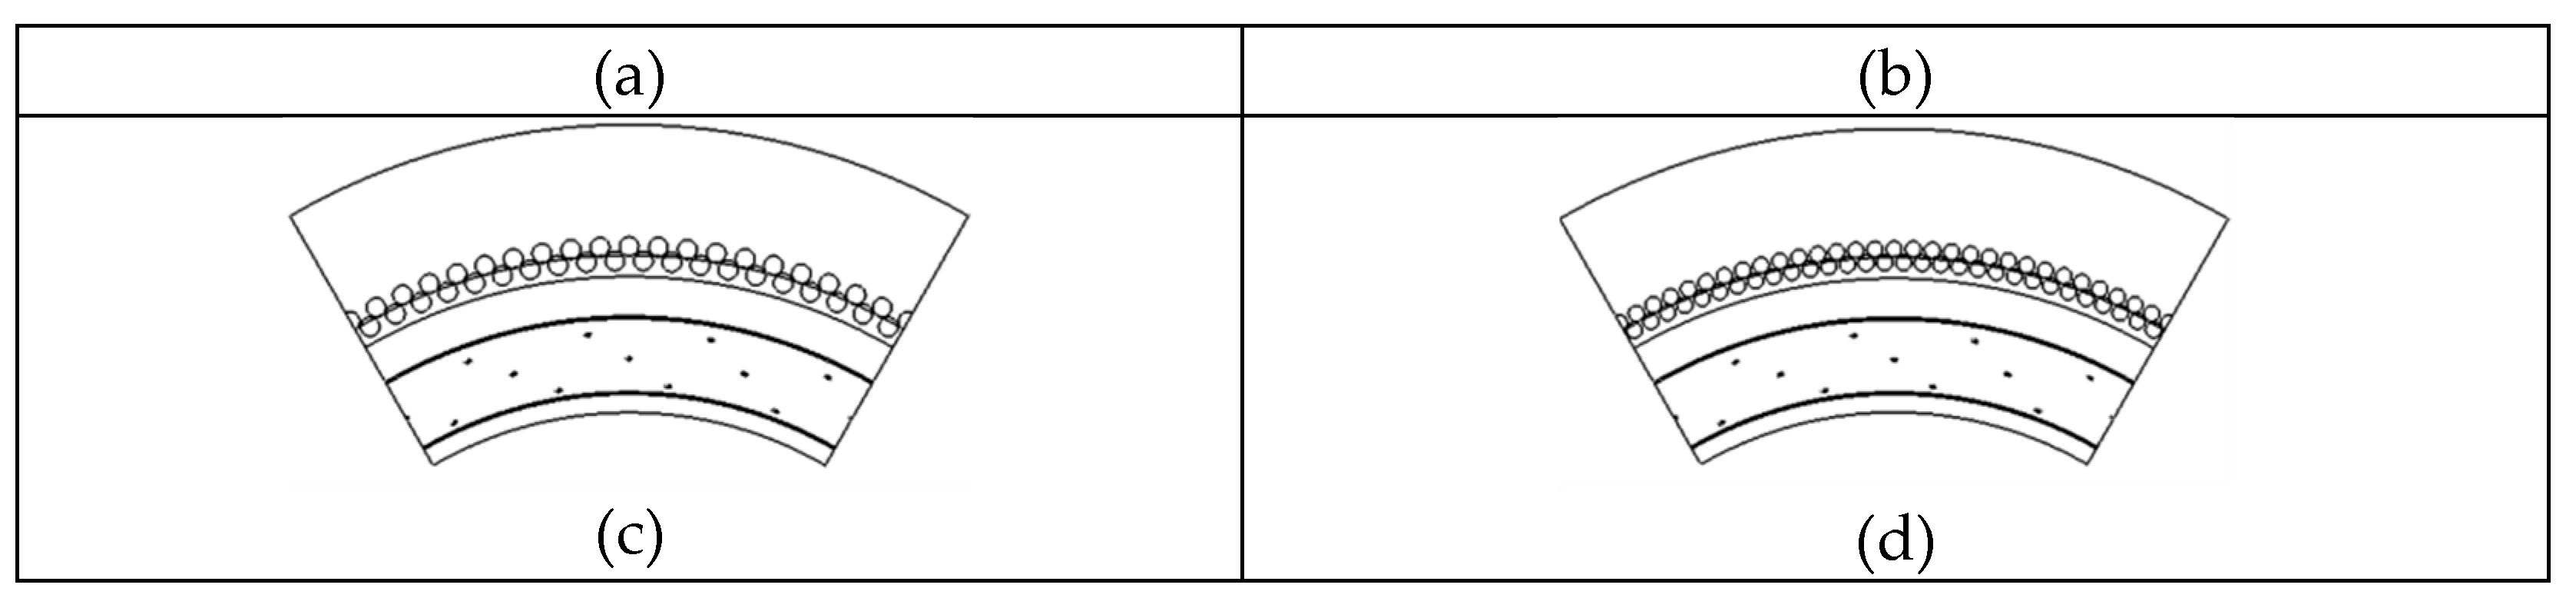
Figure 4.
Lateral view for the grid G4 5x10⁶ nodes.
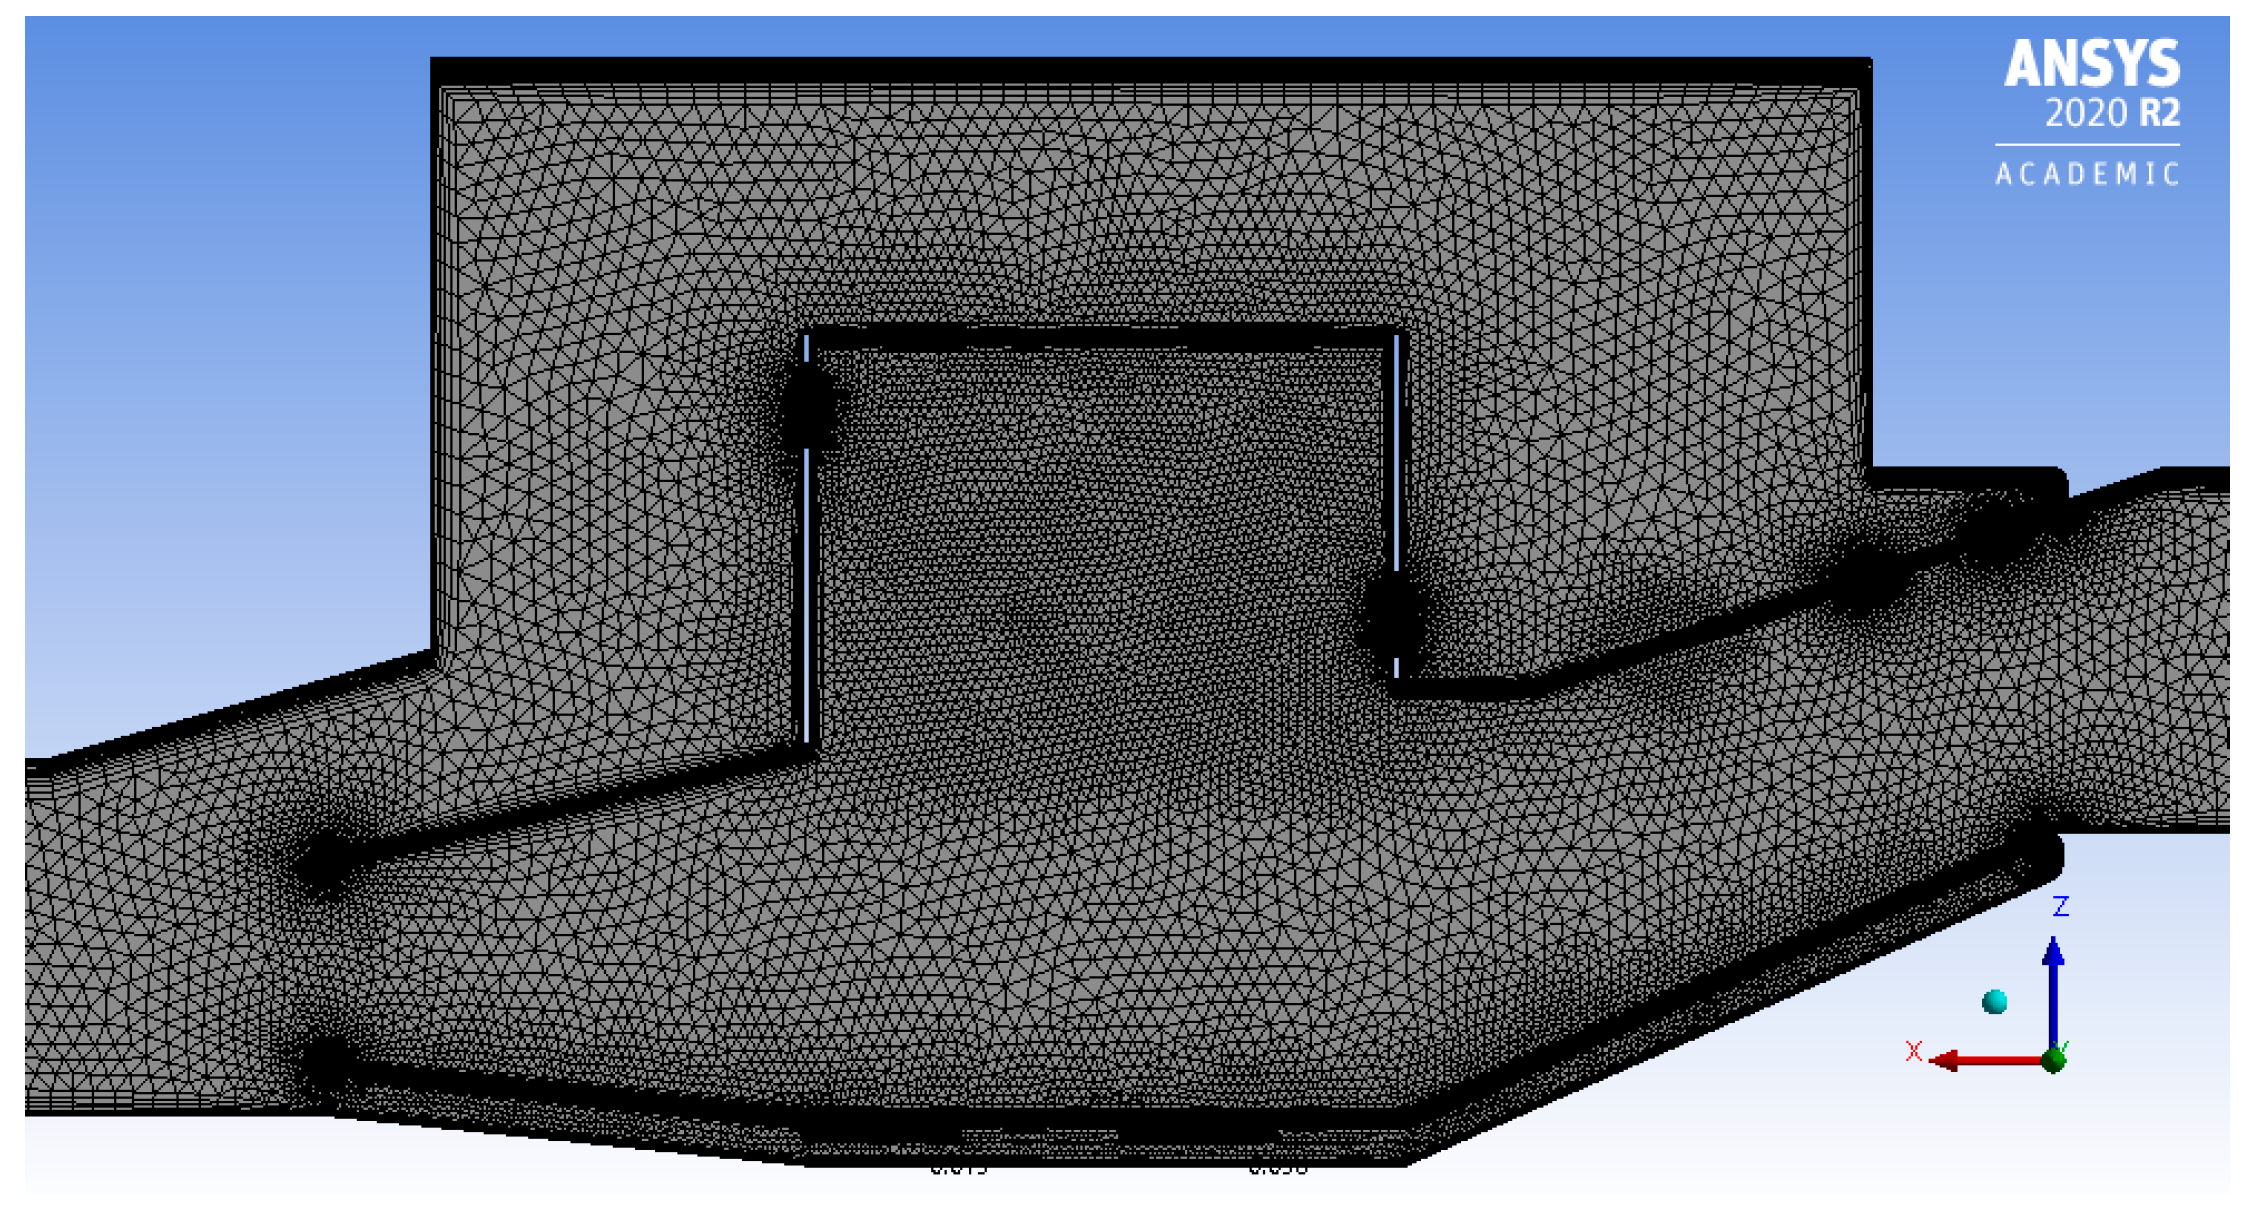
Figure 5.
Axial velocity profiles for different grid sizes.
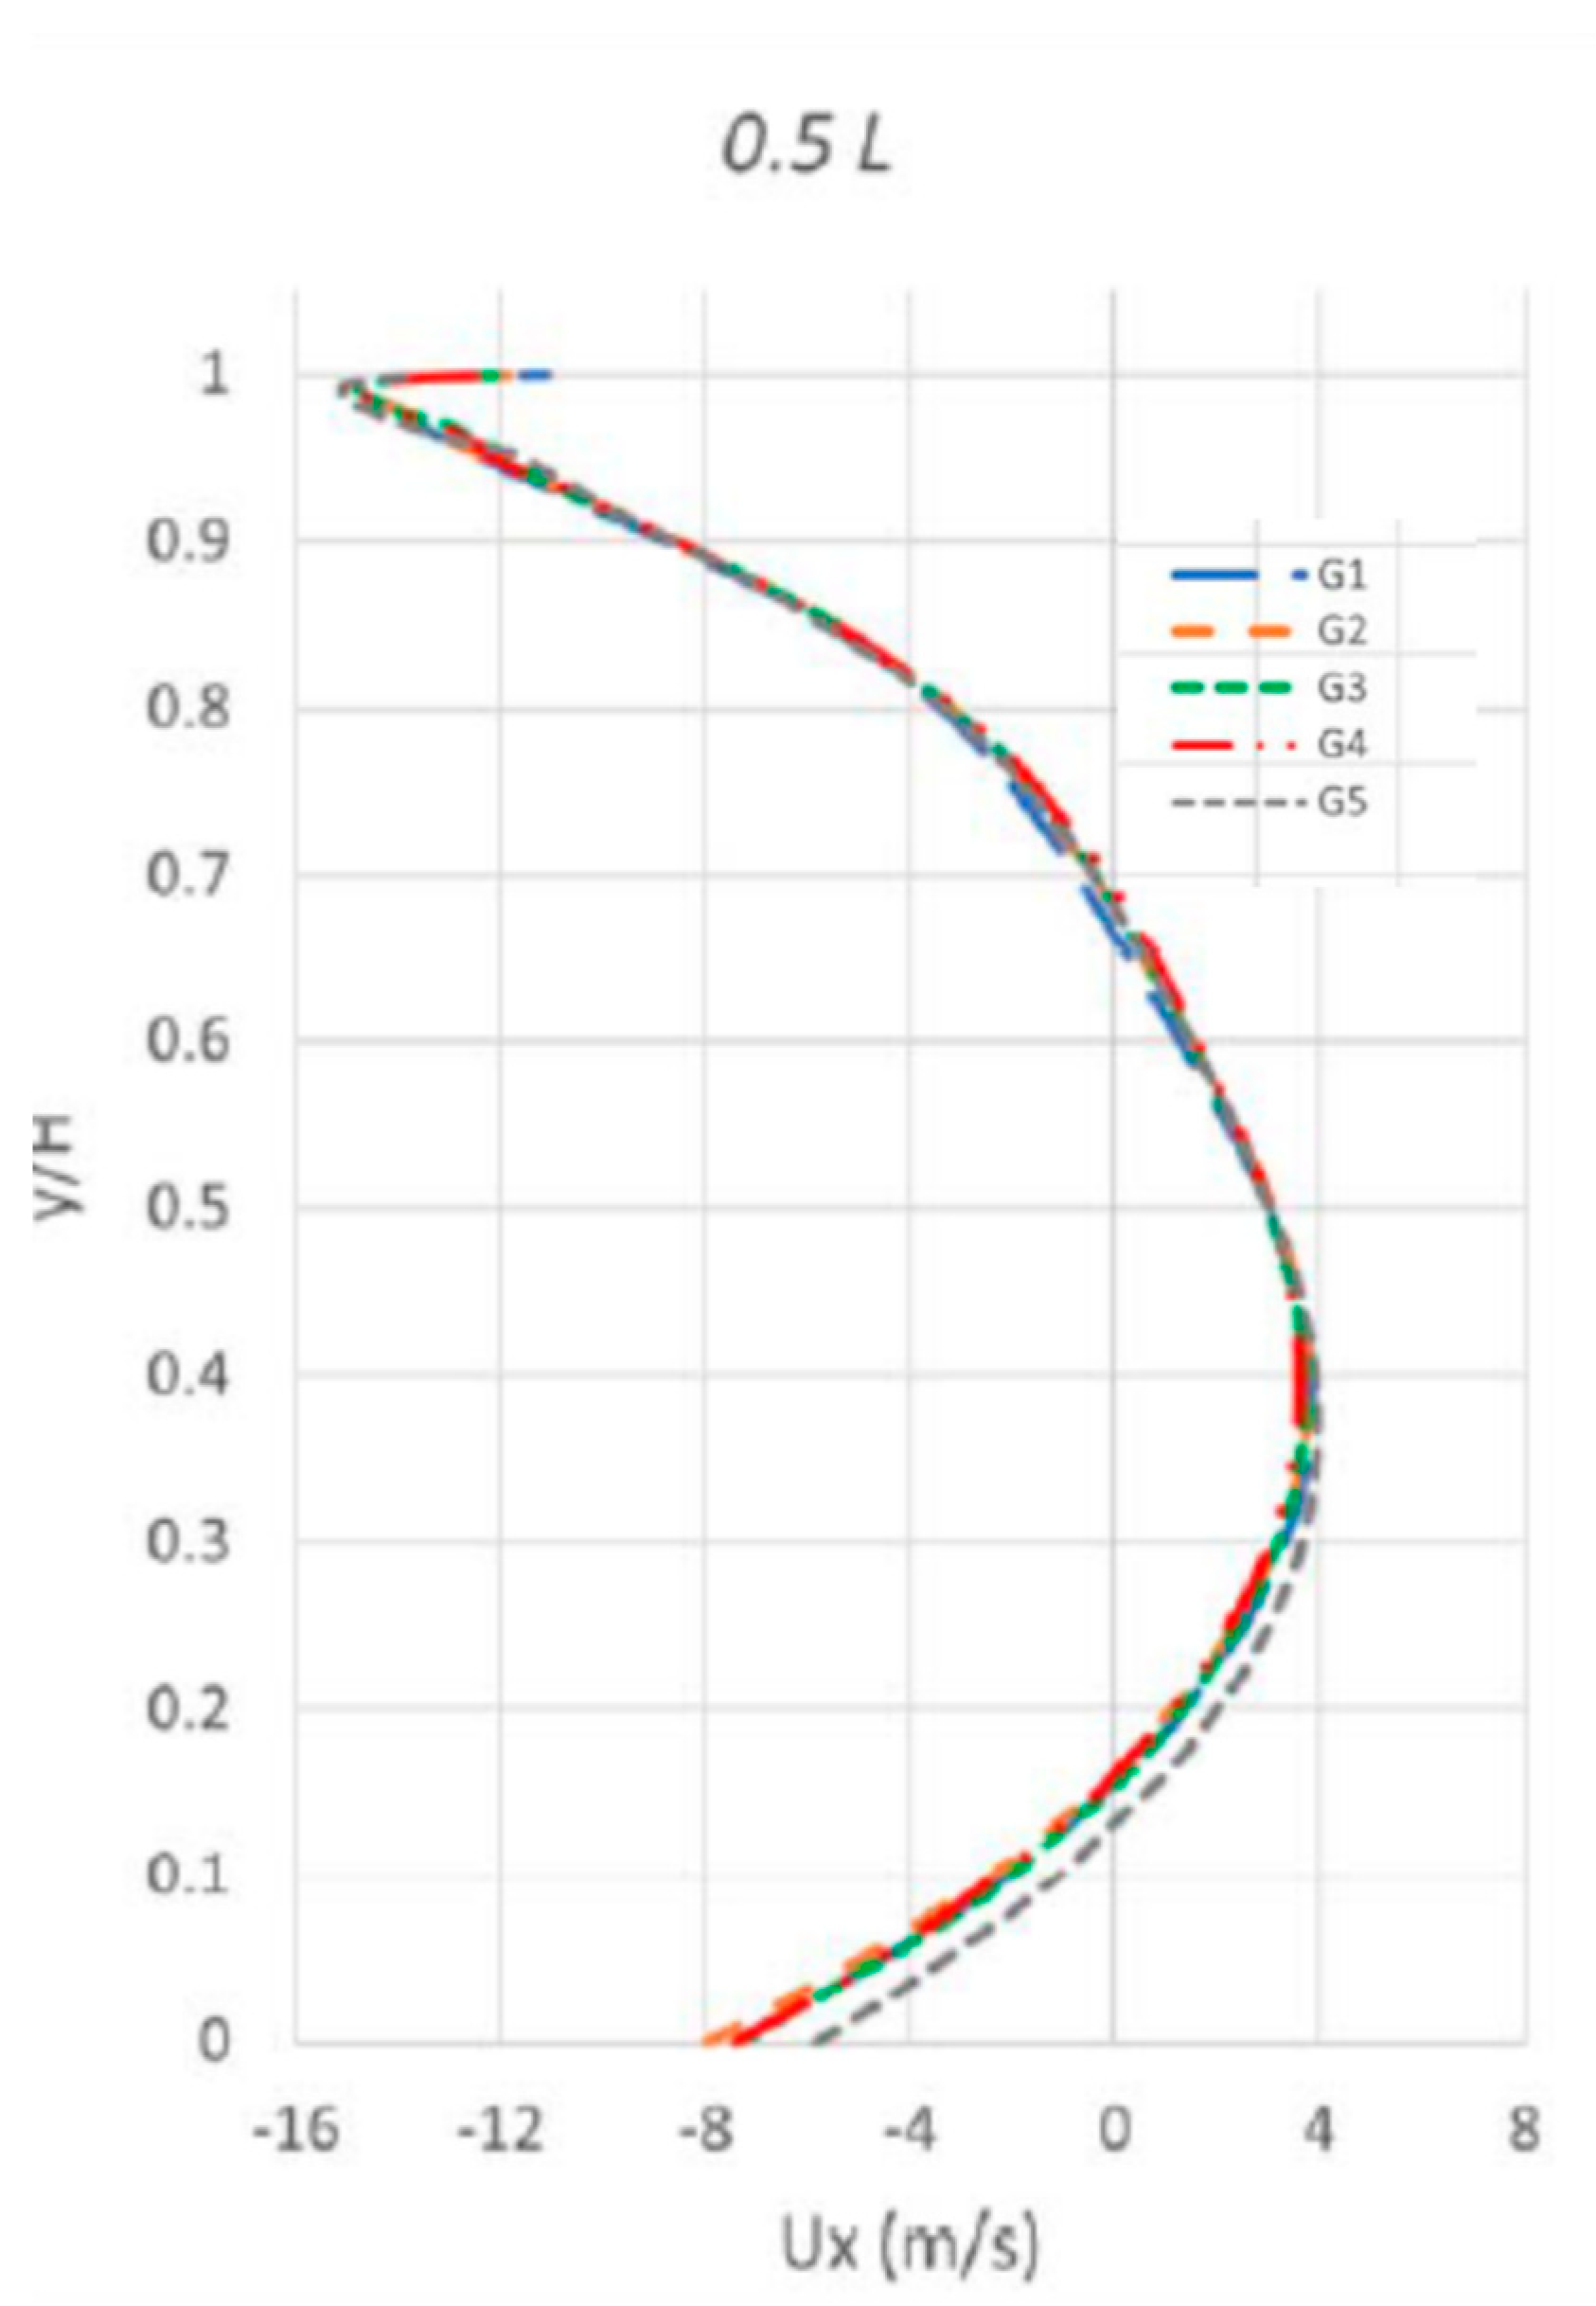
Figure 6.
Pressure drops in the combustor Cases A, B, C, D.
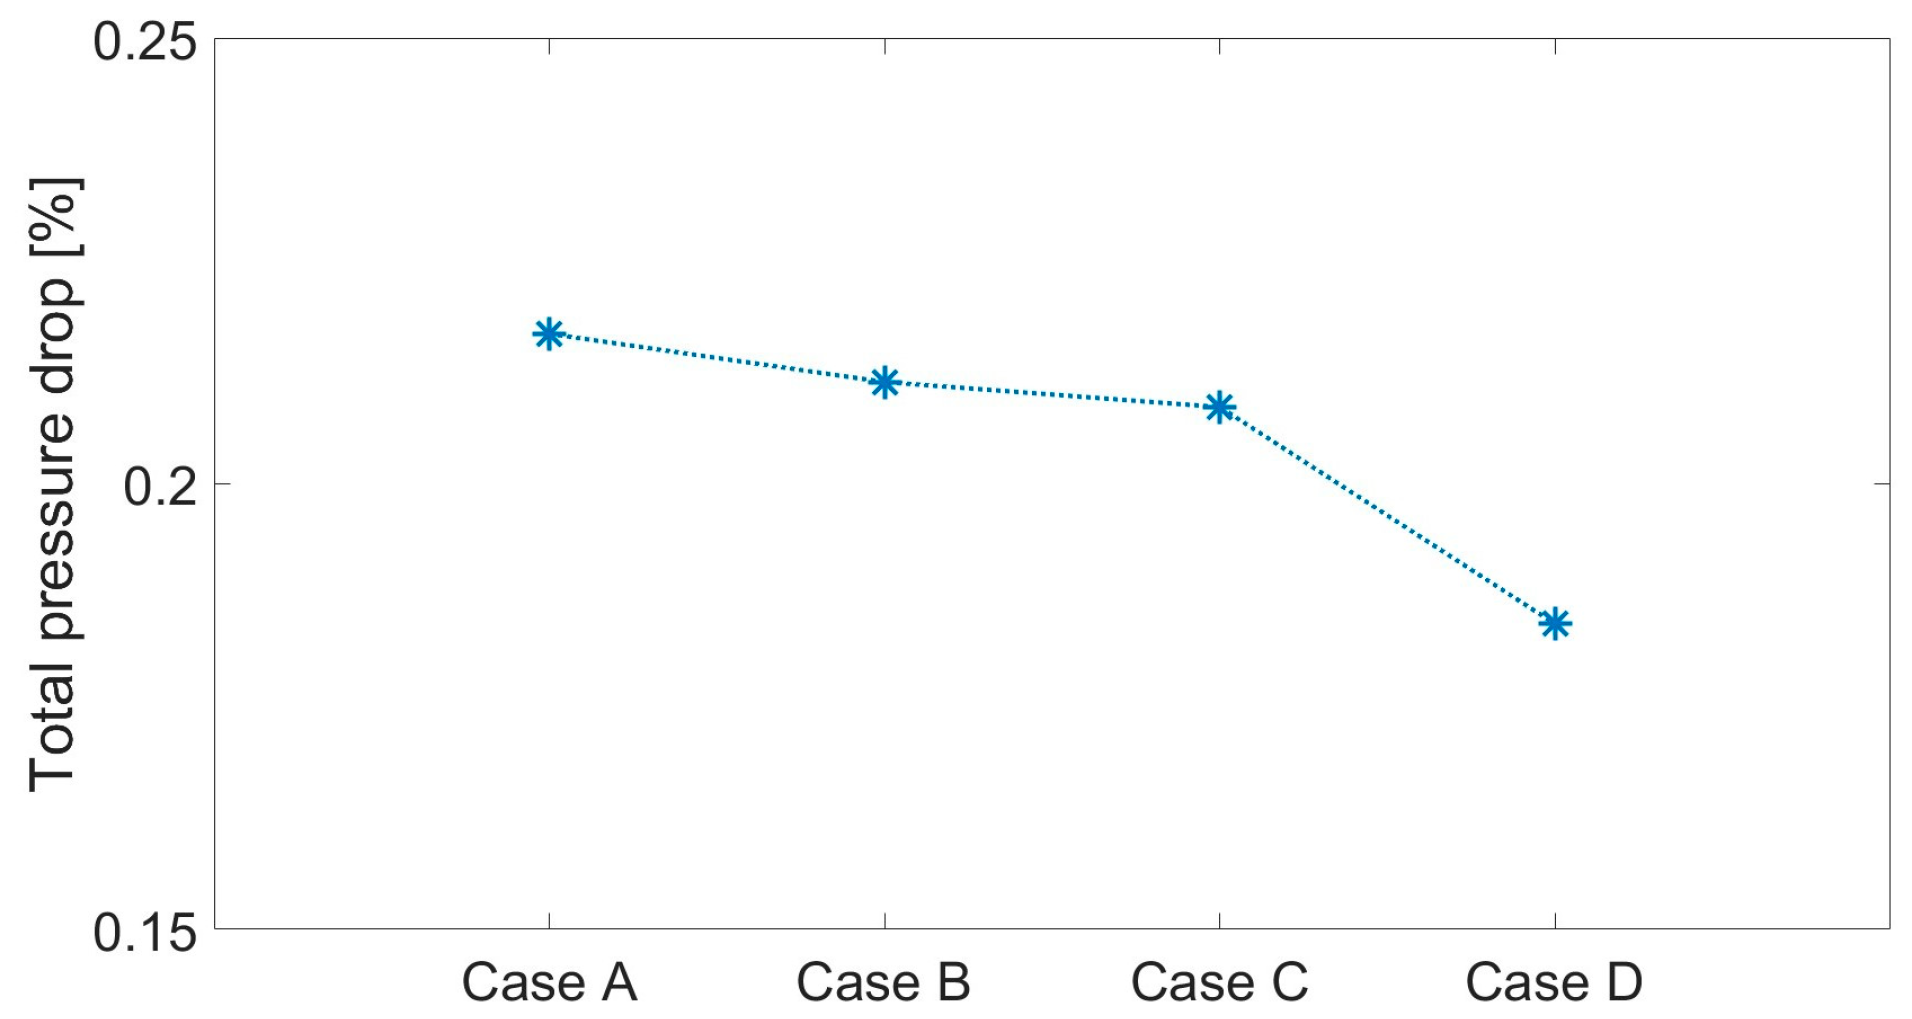
Figure 7.
Figure 7. Flow structures in the cavity. (a) Case A, (b) Case B, (c) Case C and (d) Case D.
Figure 7.
Figure 7. Flow structures in the cavity. (a) Case A, (b) Case B, (c) Case C and (d) Case D.
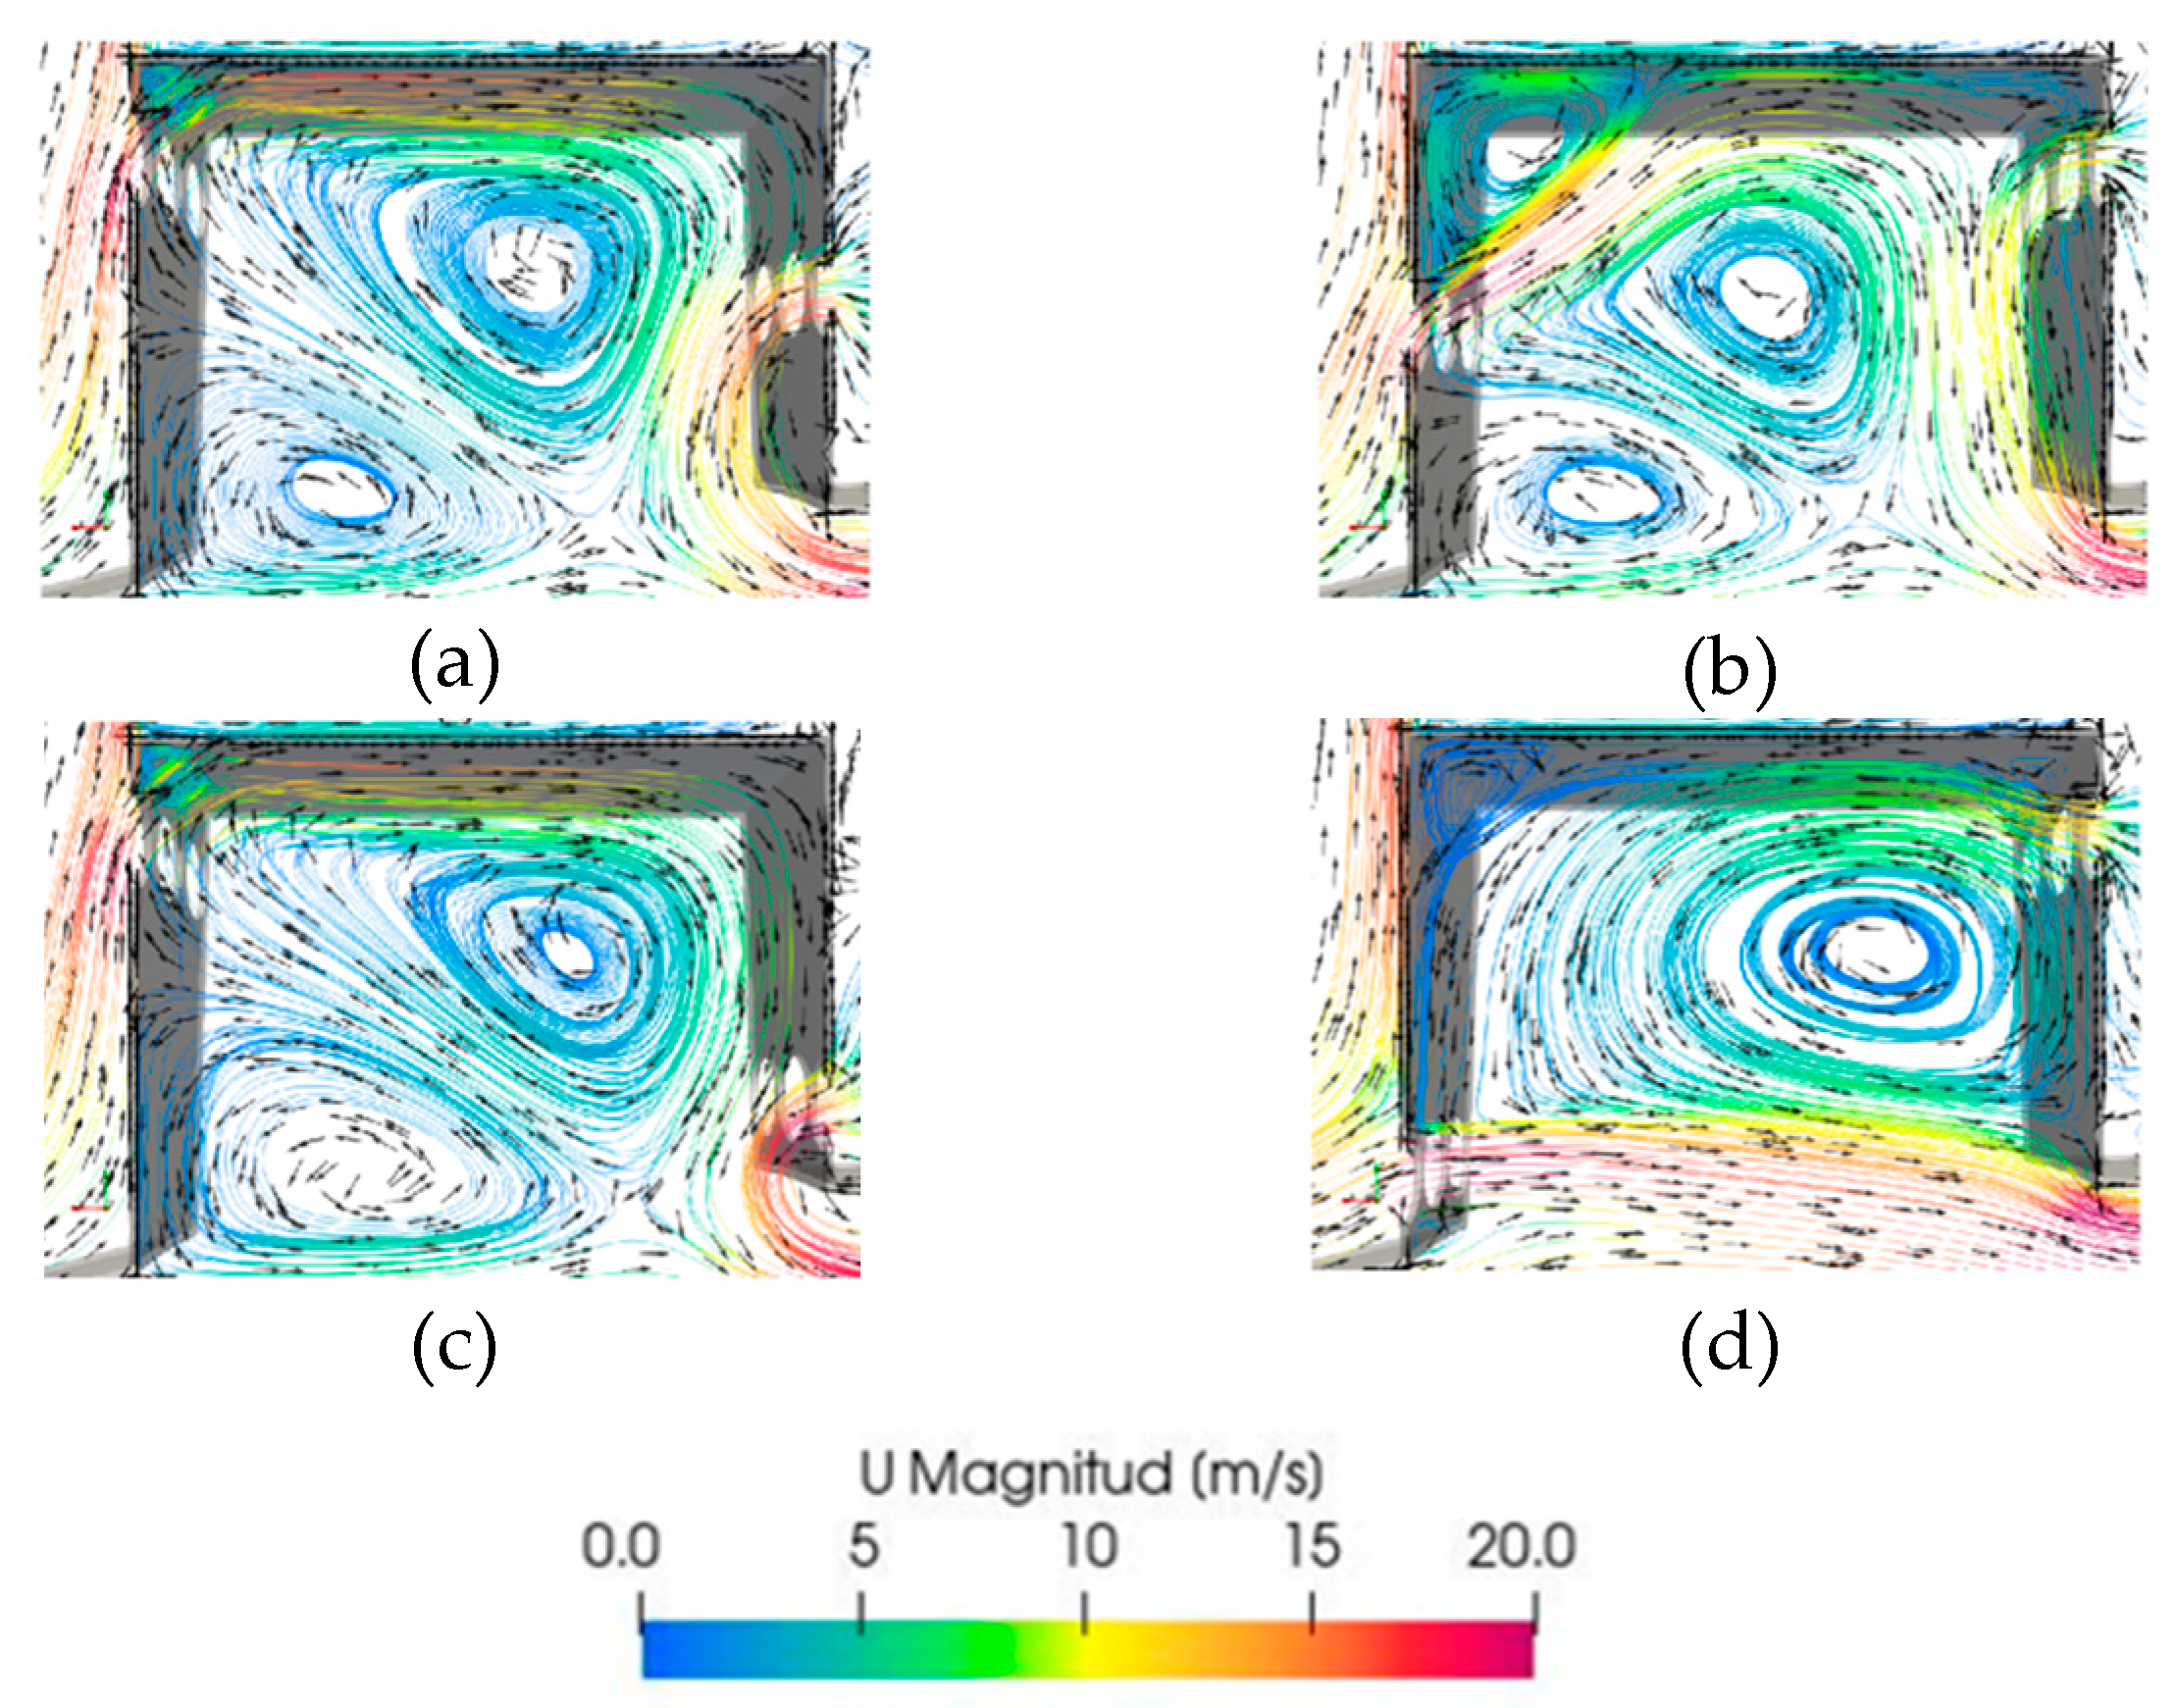
Figure 8.
Figure 8. Q criterion vortex identification results. (a) Case A, (b) Case B, (c) Case C and (d) Case D.
Figure 8.
Figure 8. Q criterion vortex identification results. (a) Case A, (b) Case B, (c) Case C and (d) Case D.
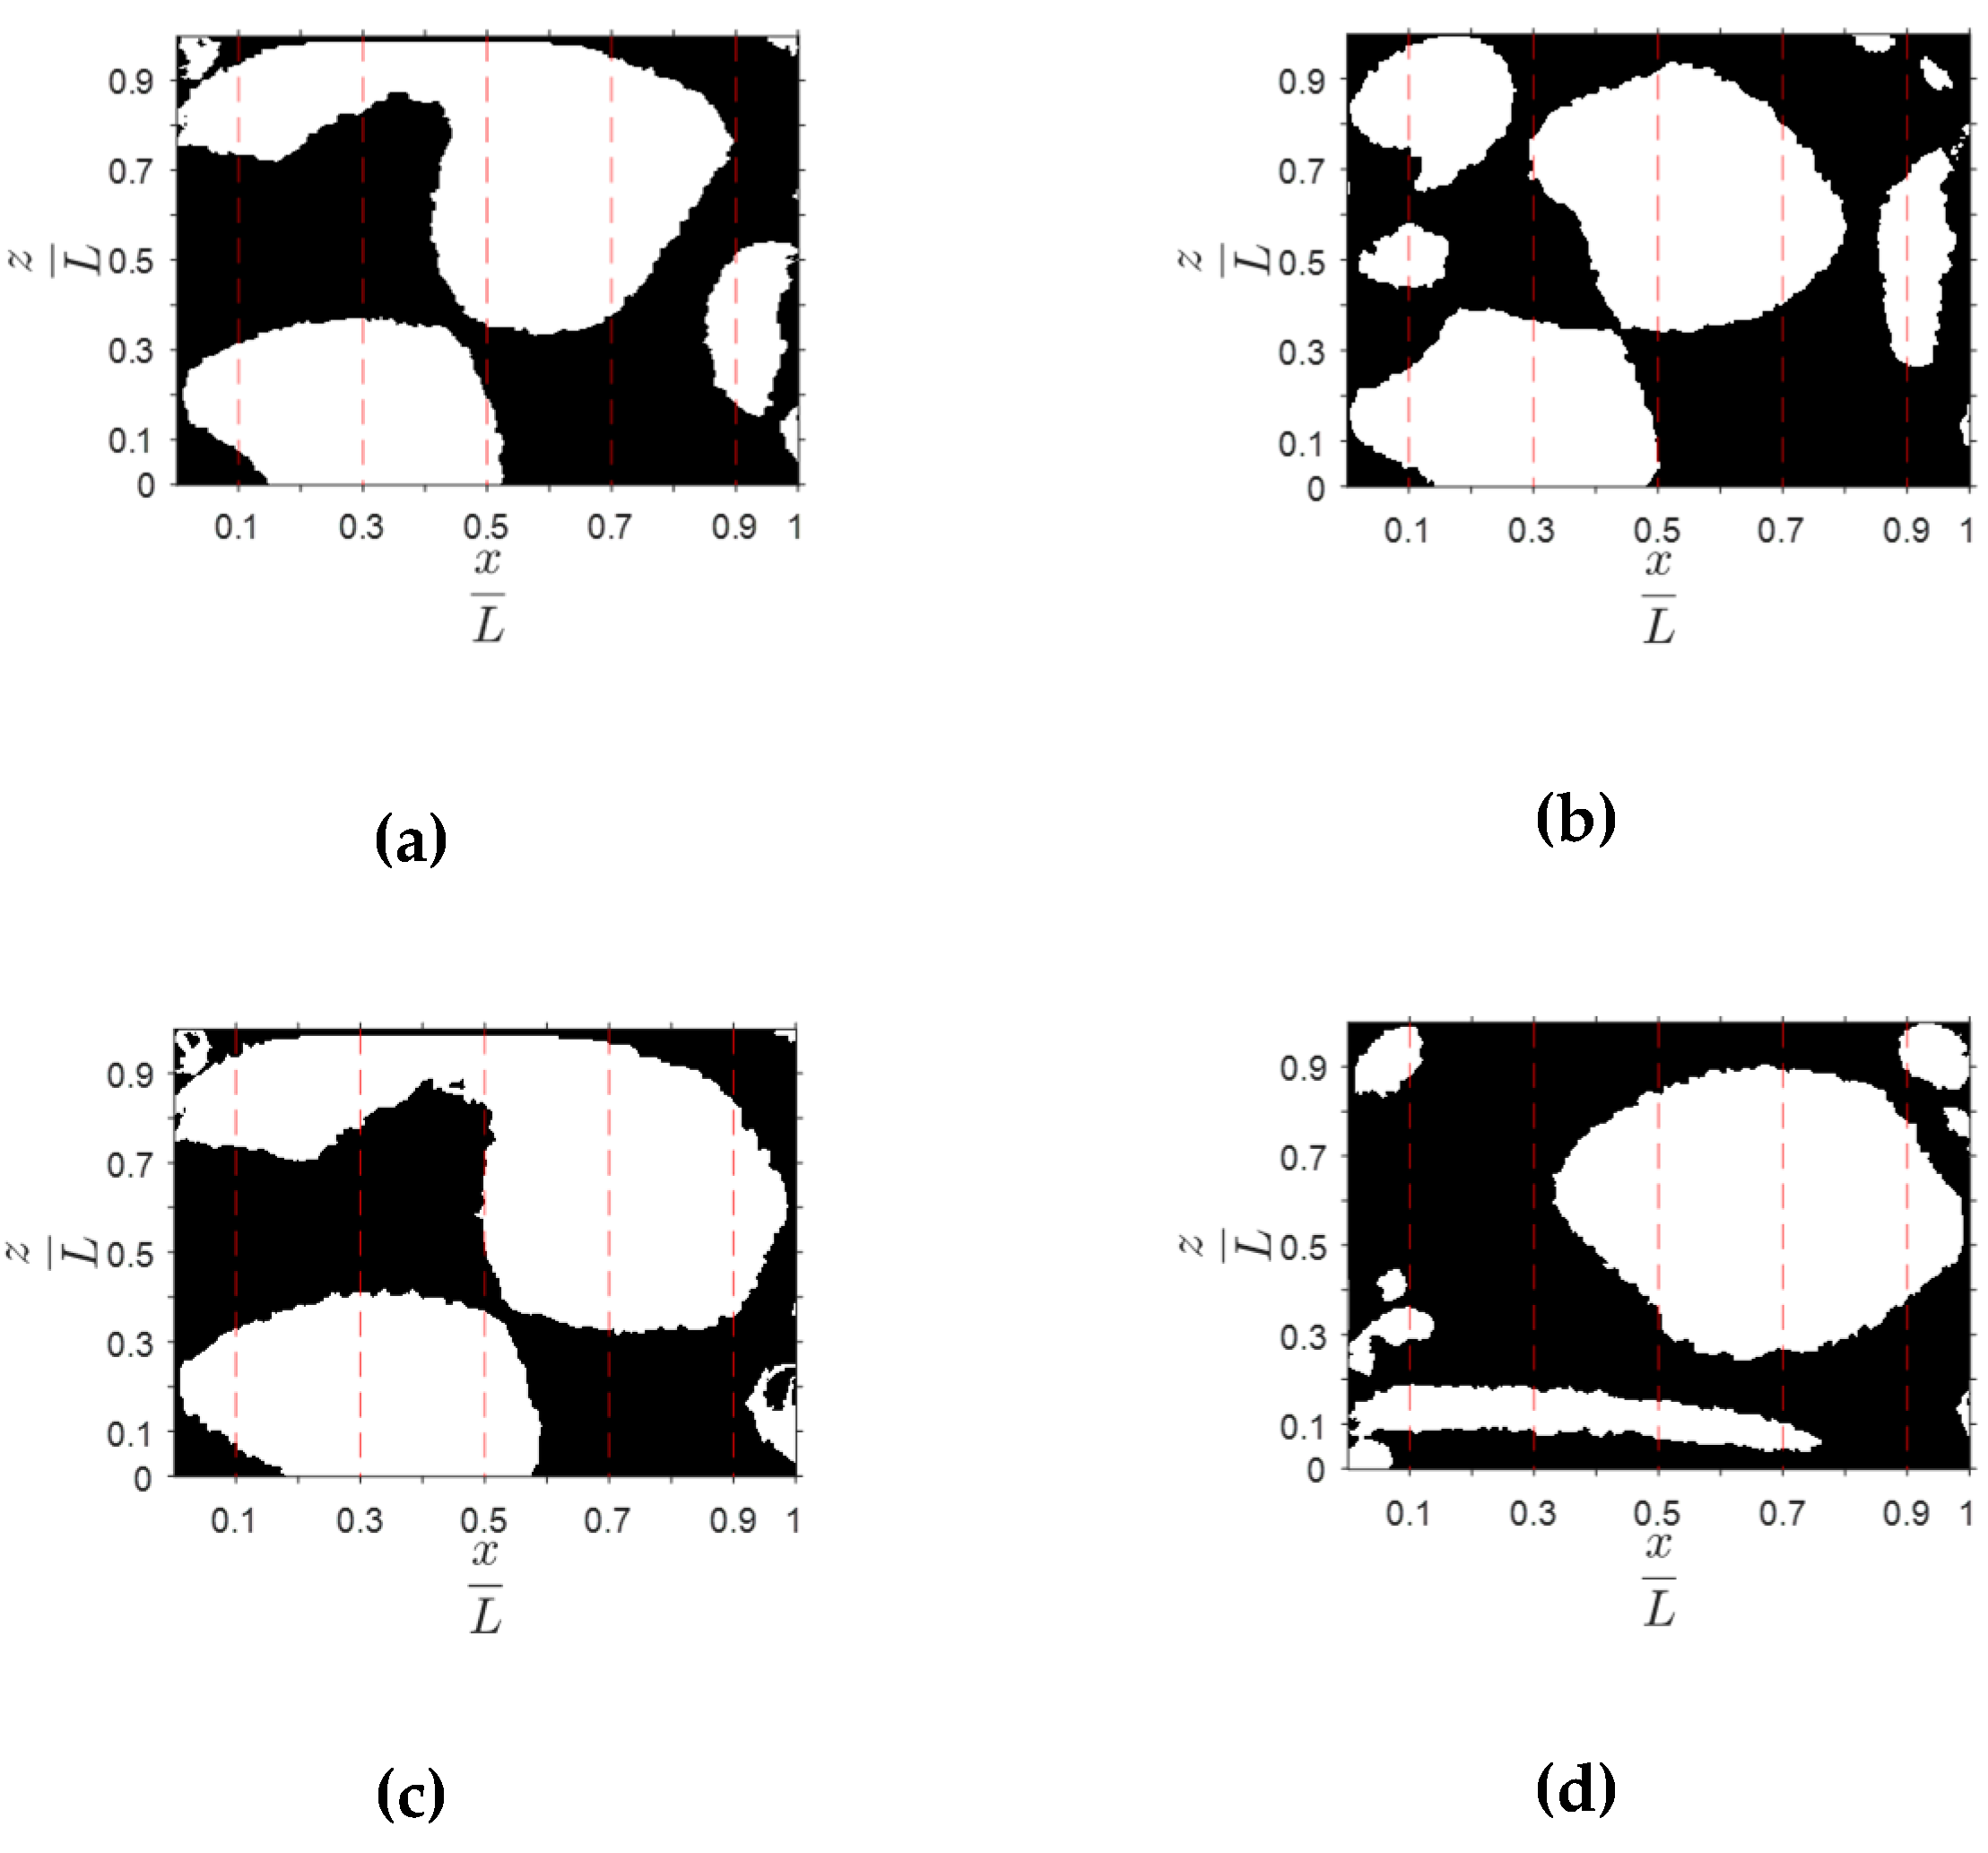
Figure 9.
Figure 9. Comparison for the vortex size for the cases A, B, C, D.
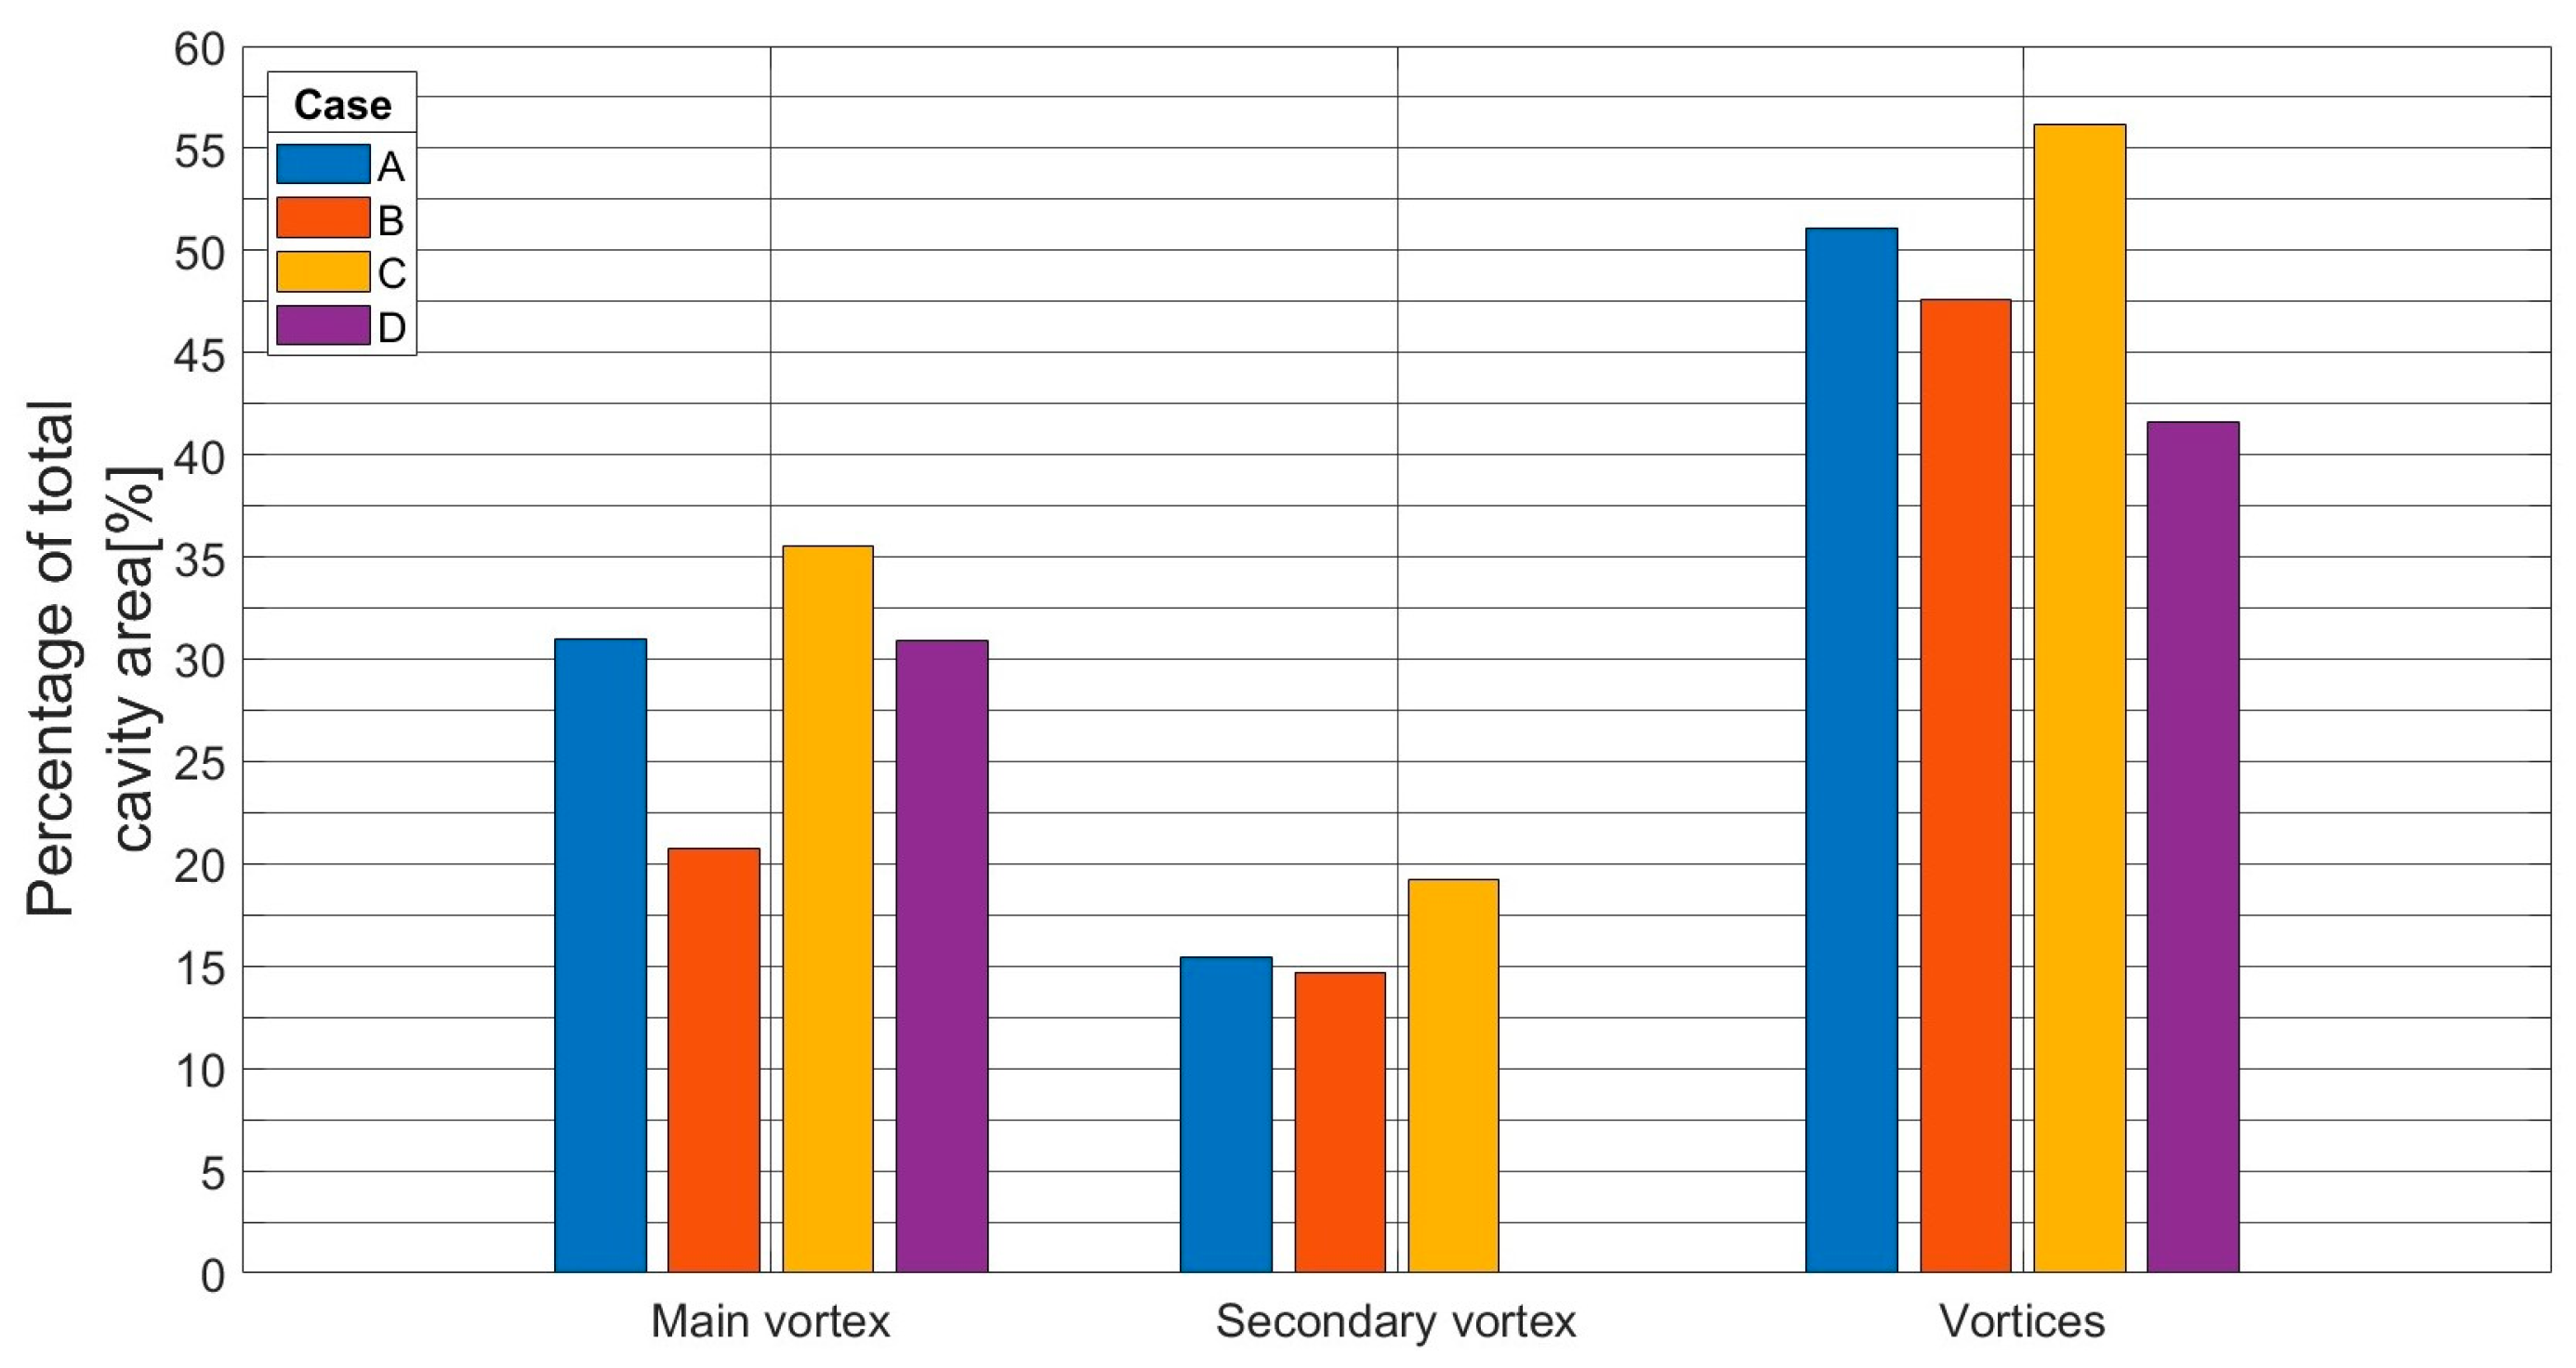
Figure 10.
Axial velocity profiles for the cavity. Cases A, B, C, D.
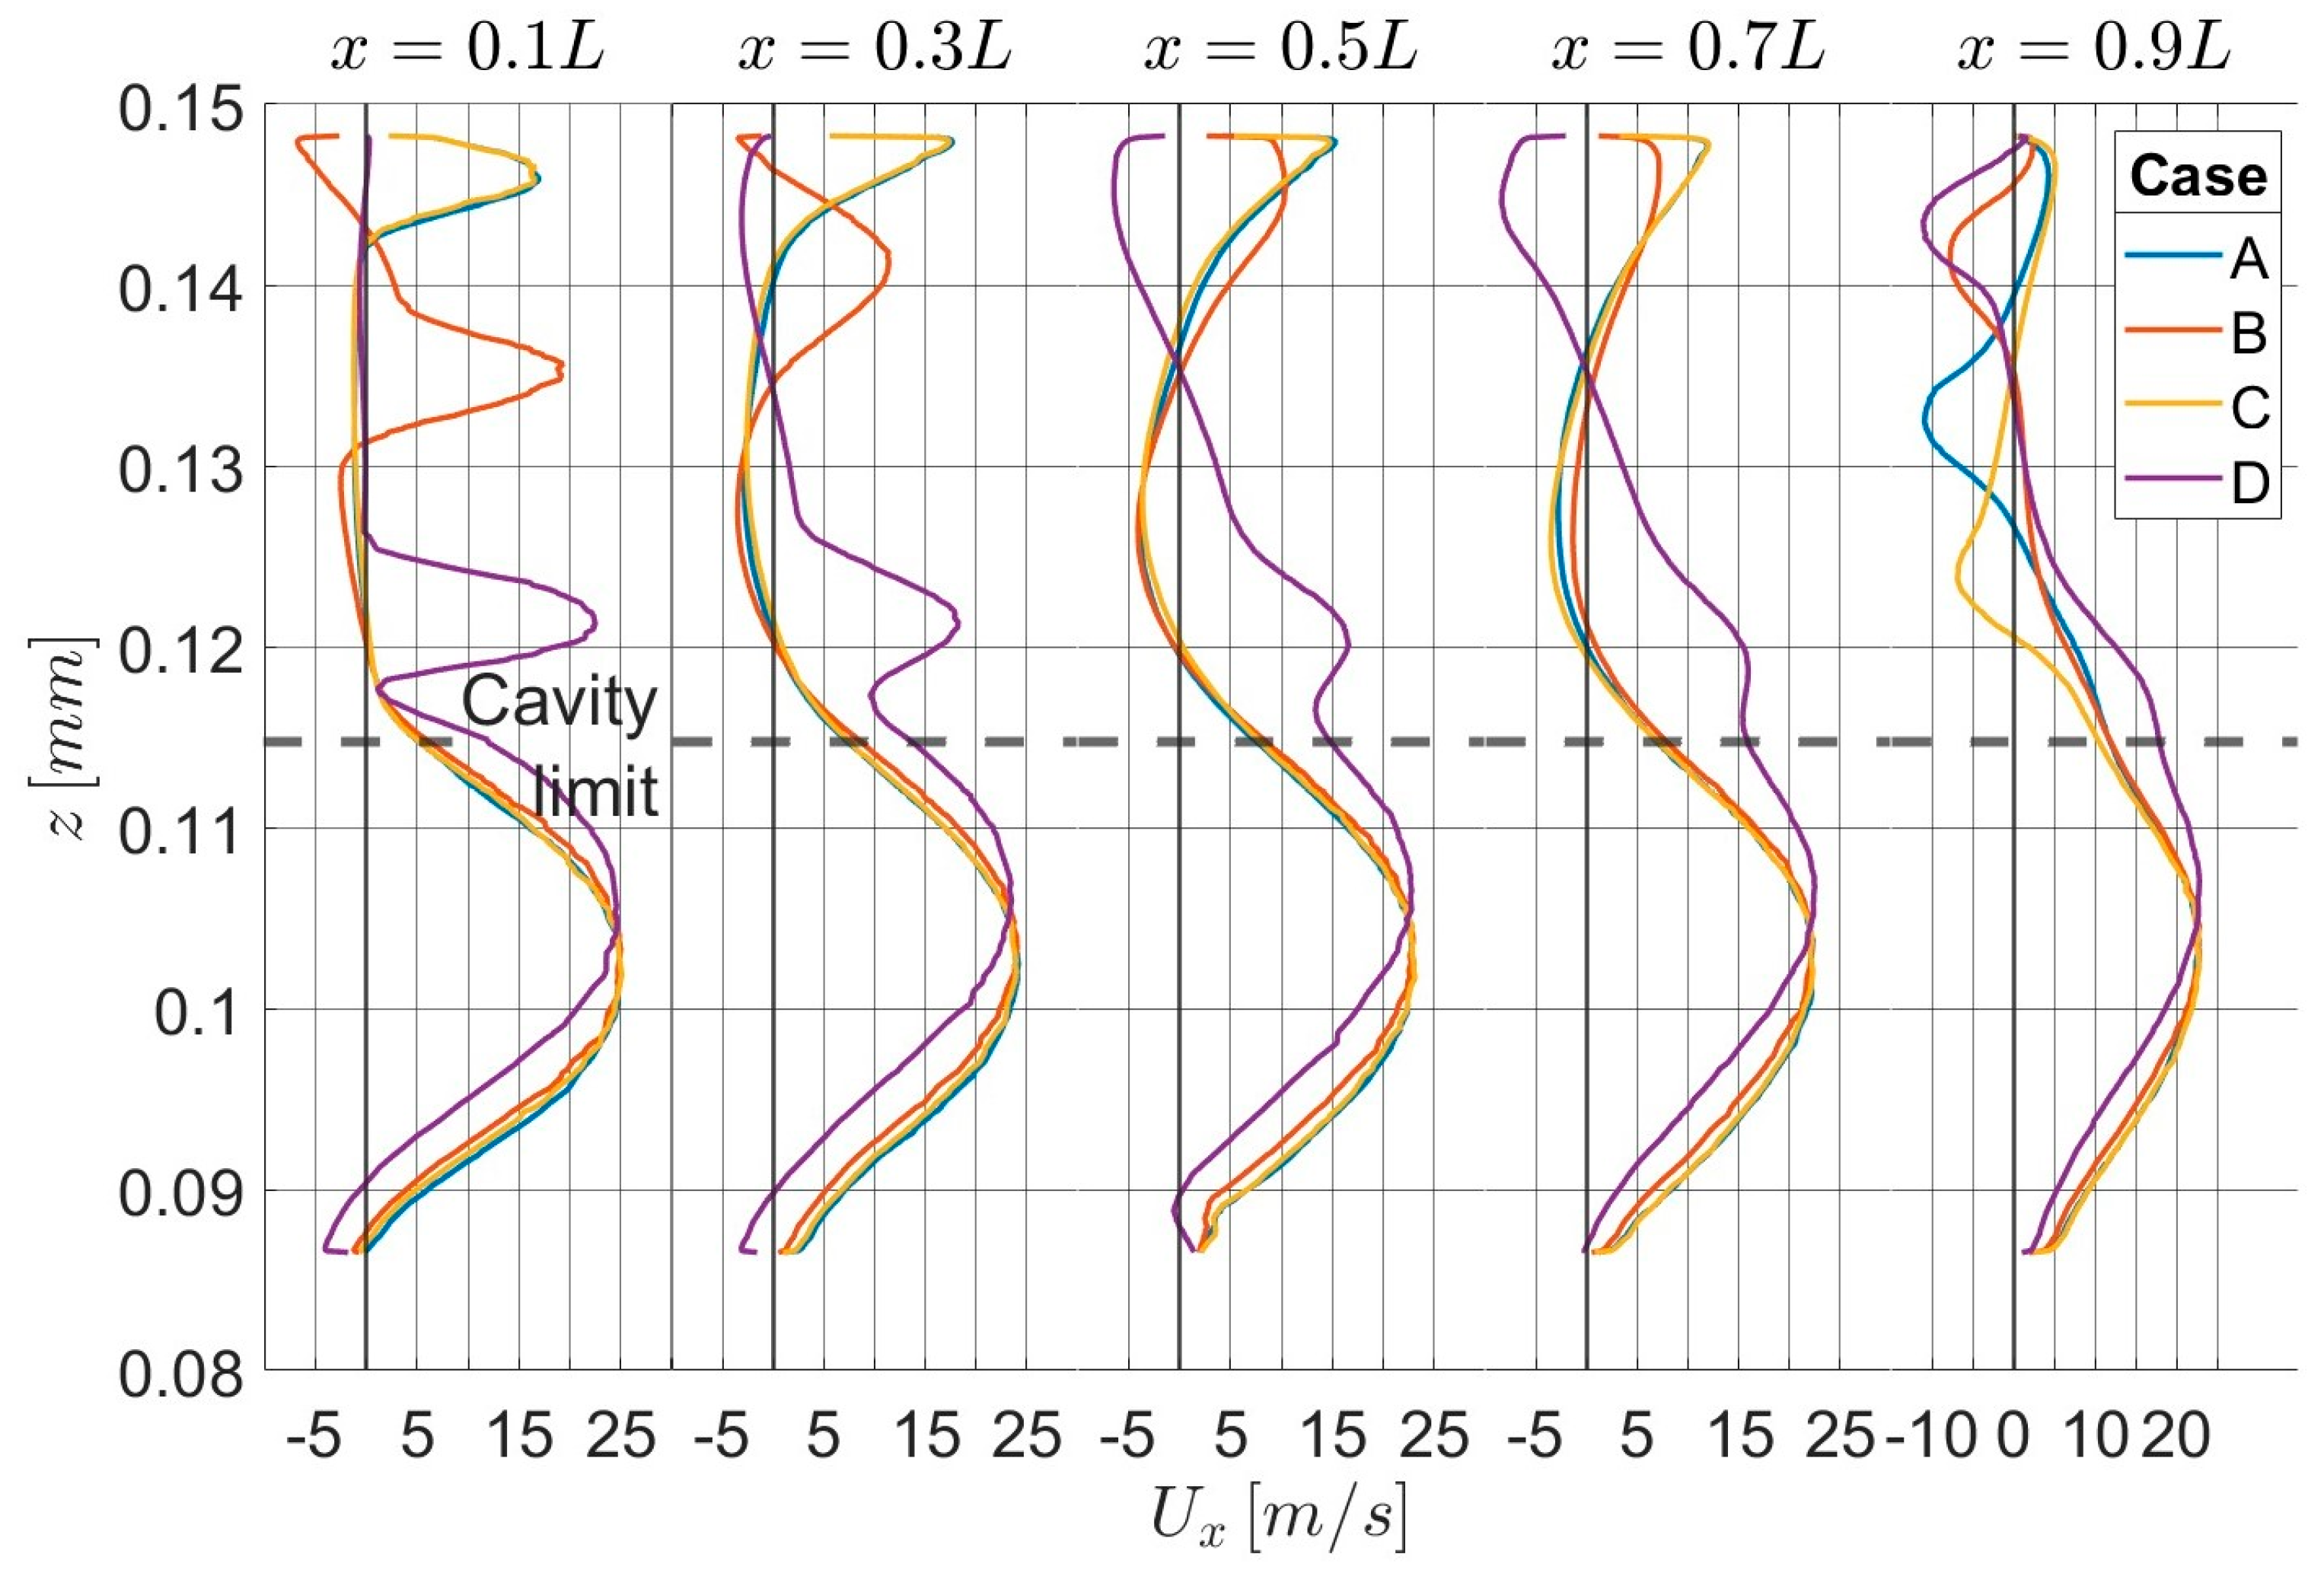
Figure 11.
Maximum and minimum axial velocities ratio for the cavity. Cases A, B, C, D.
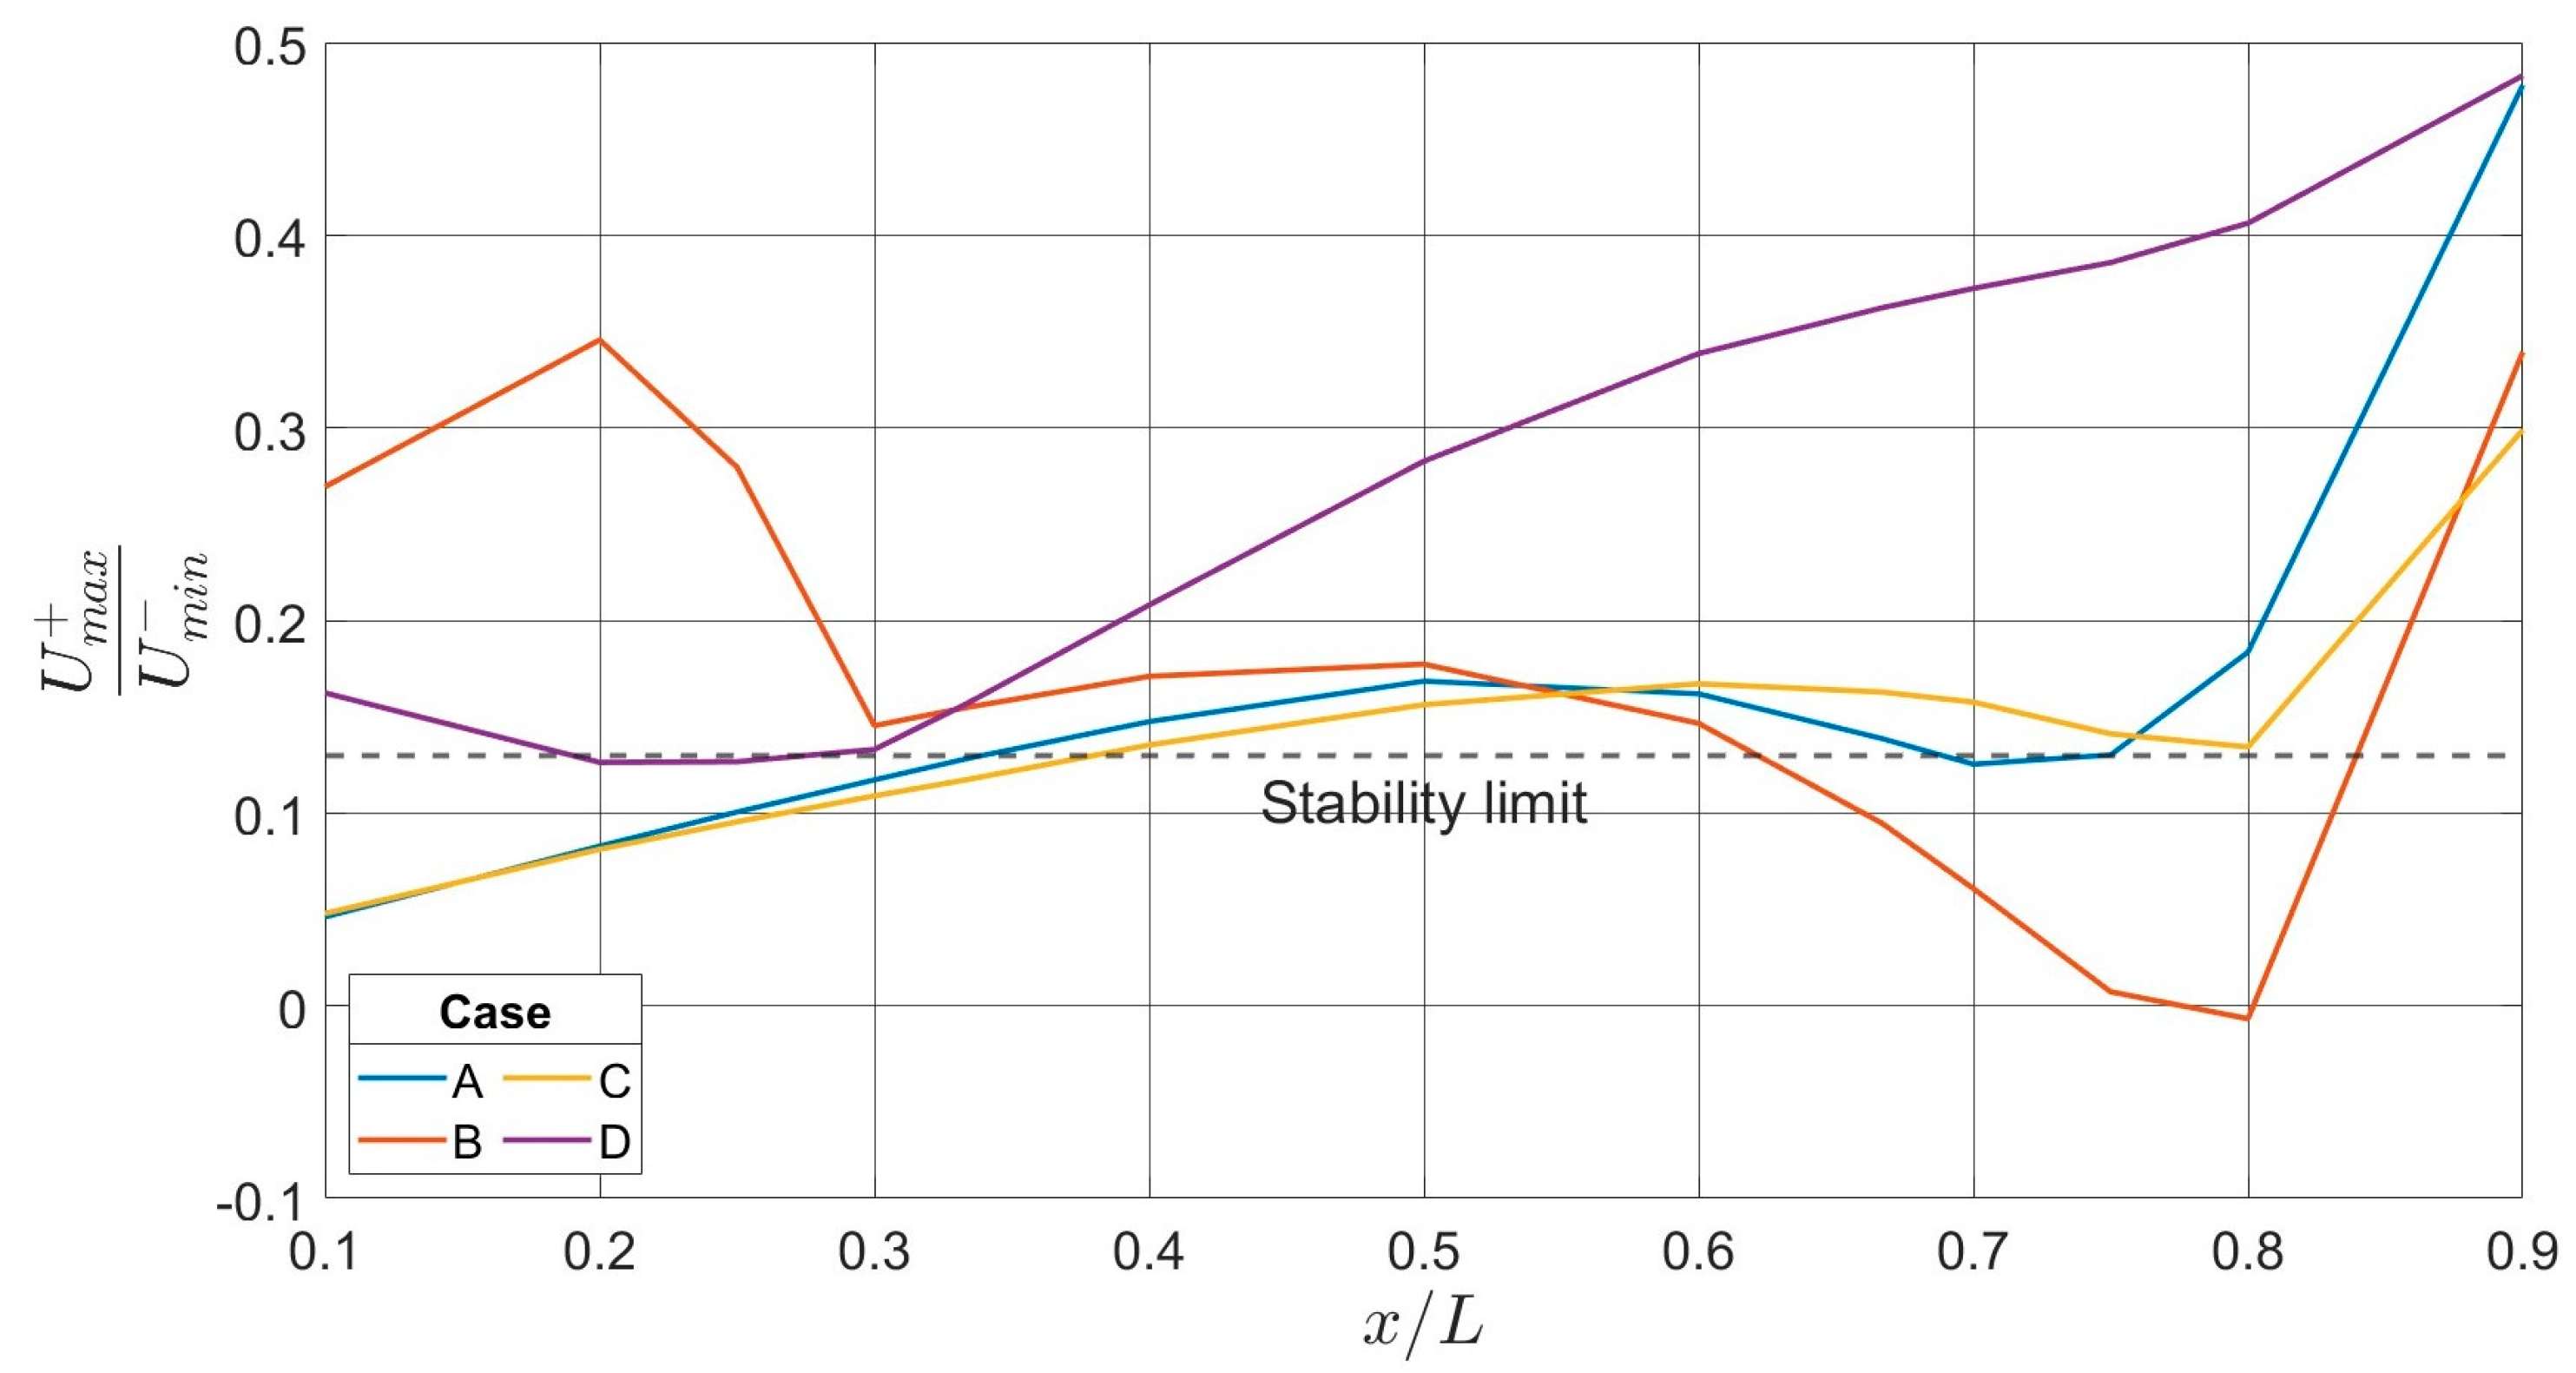
Figure 12.
Pressure drops in the combustor. Cases W, X, Y, Z.
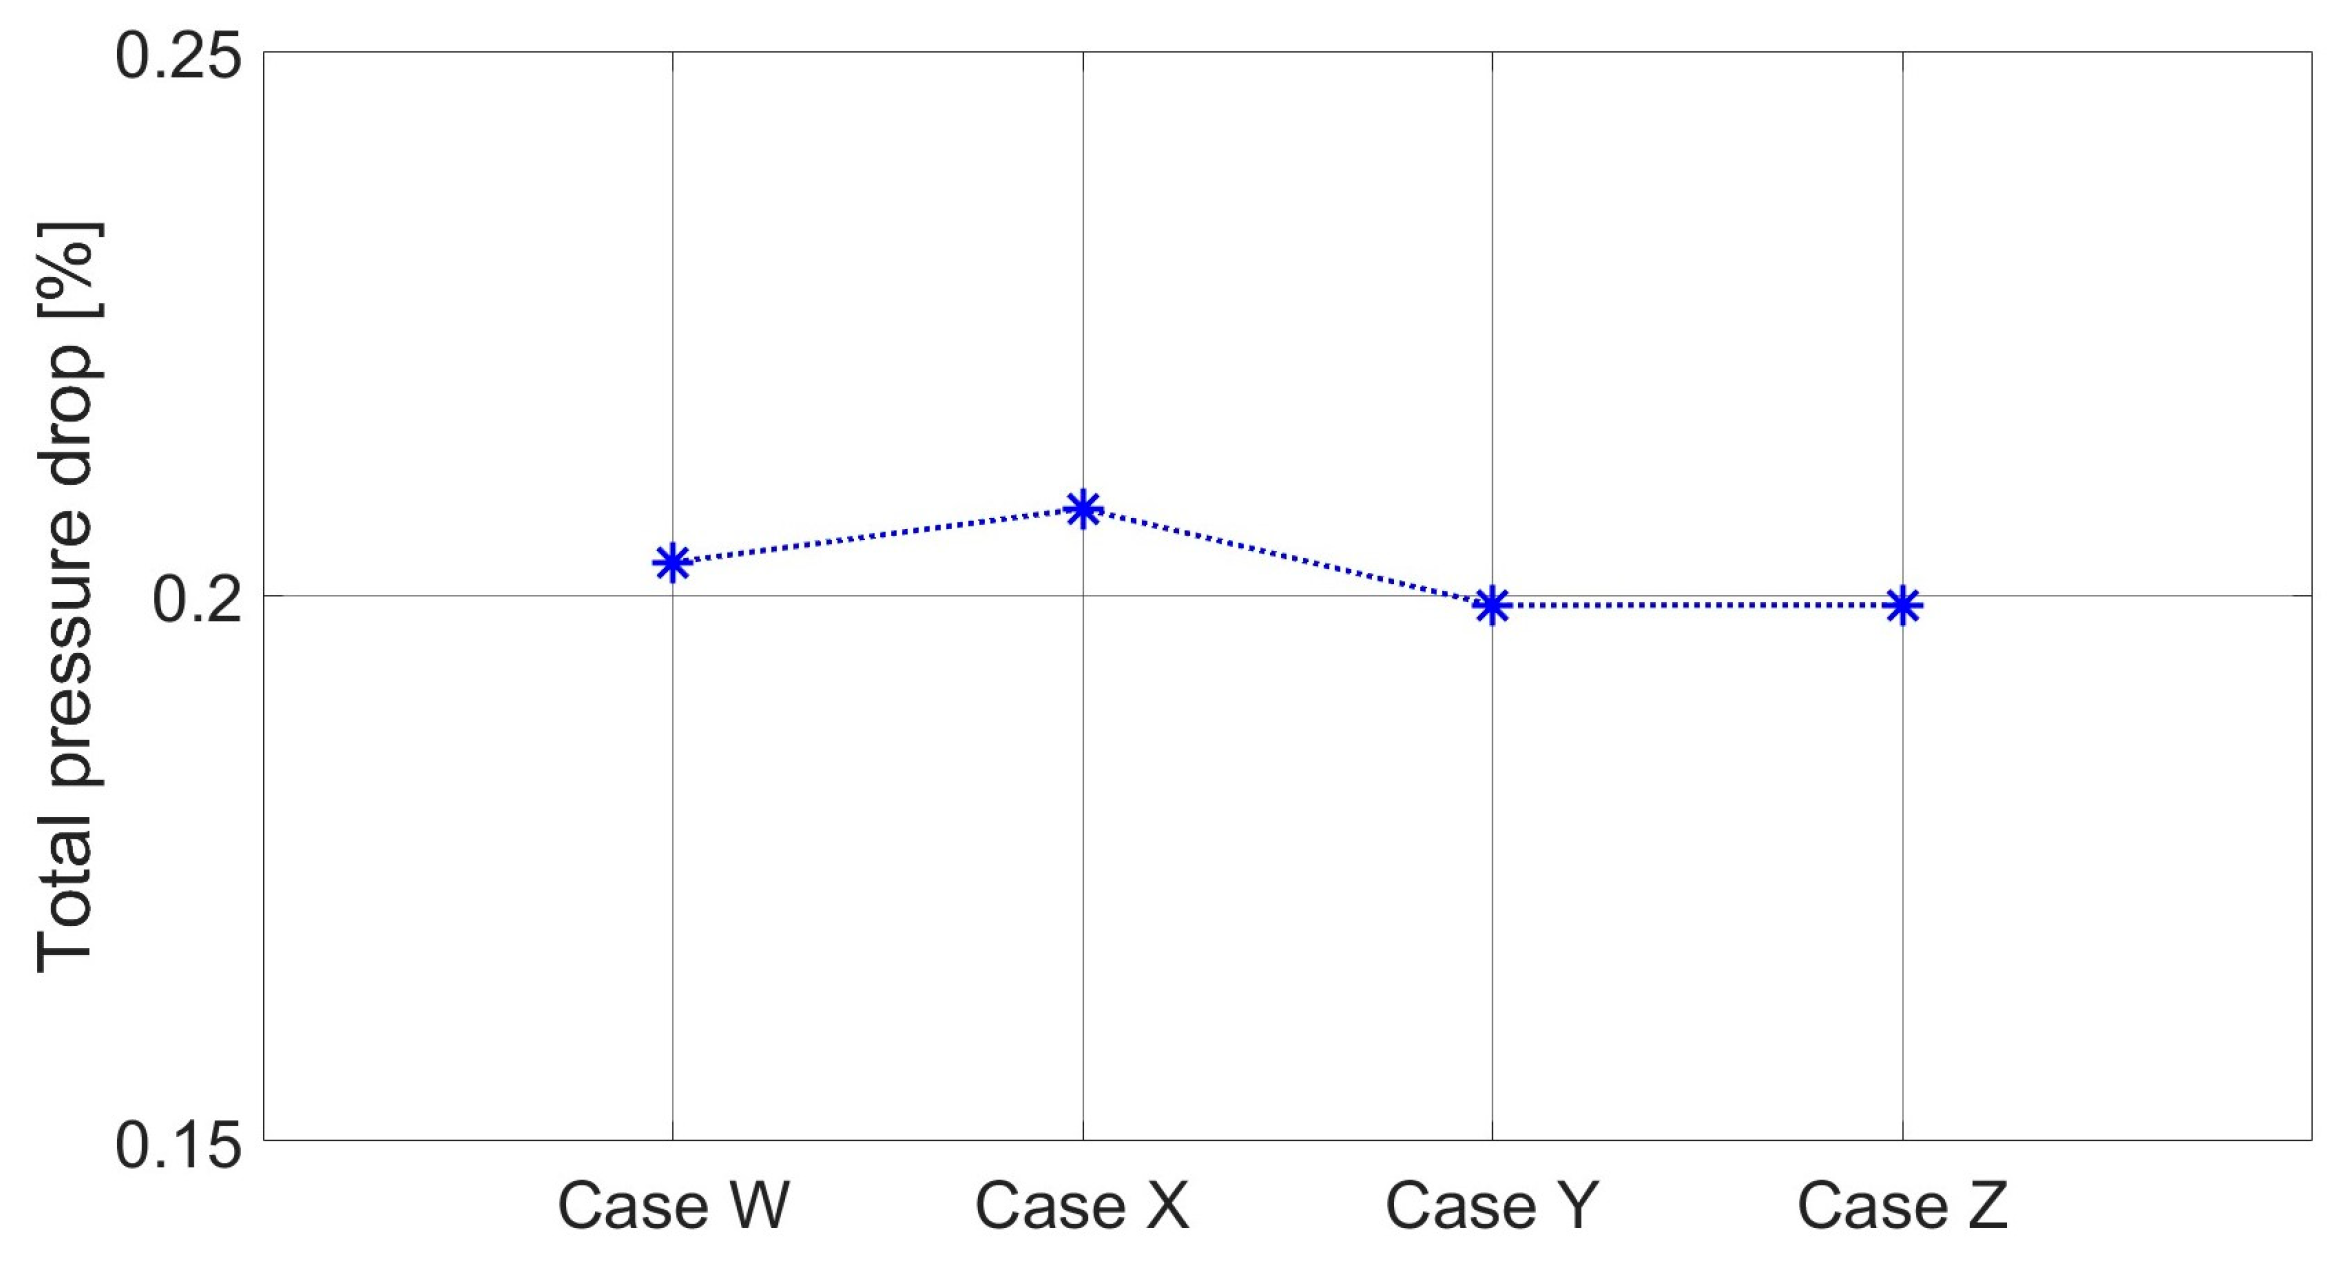
Figure 13.
Flow structures in the cavity. (a) Case W, (b) Case X, (c) Case Y and (d) Case Z.
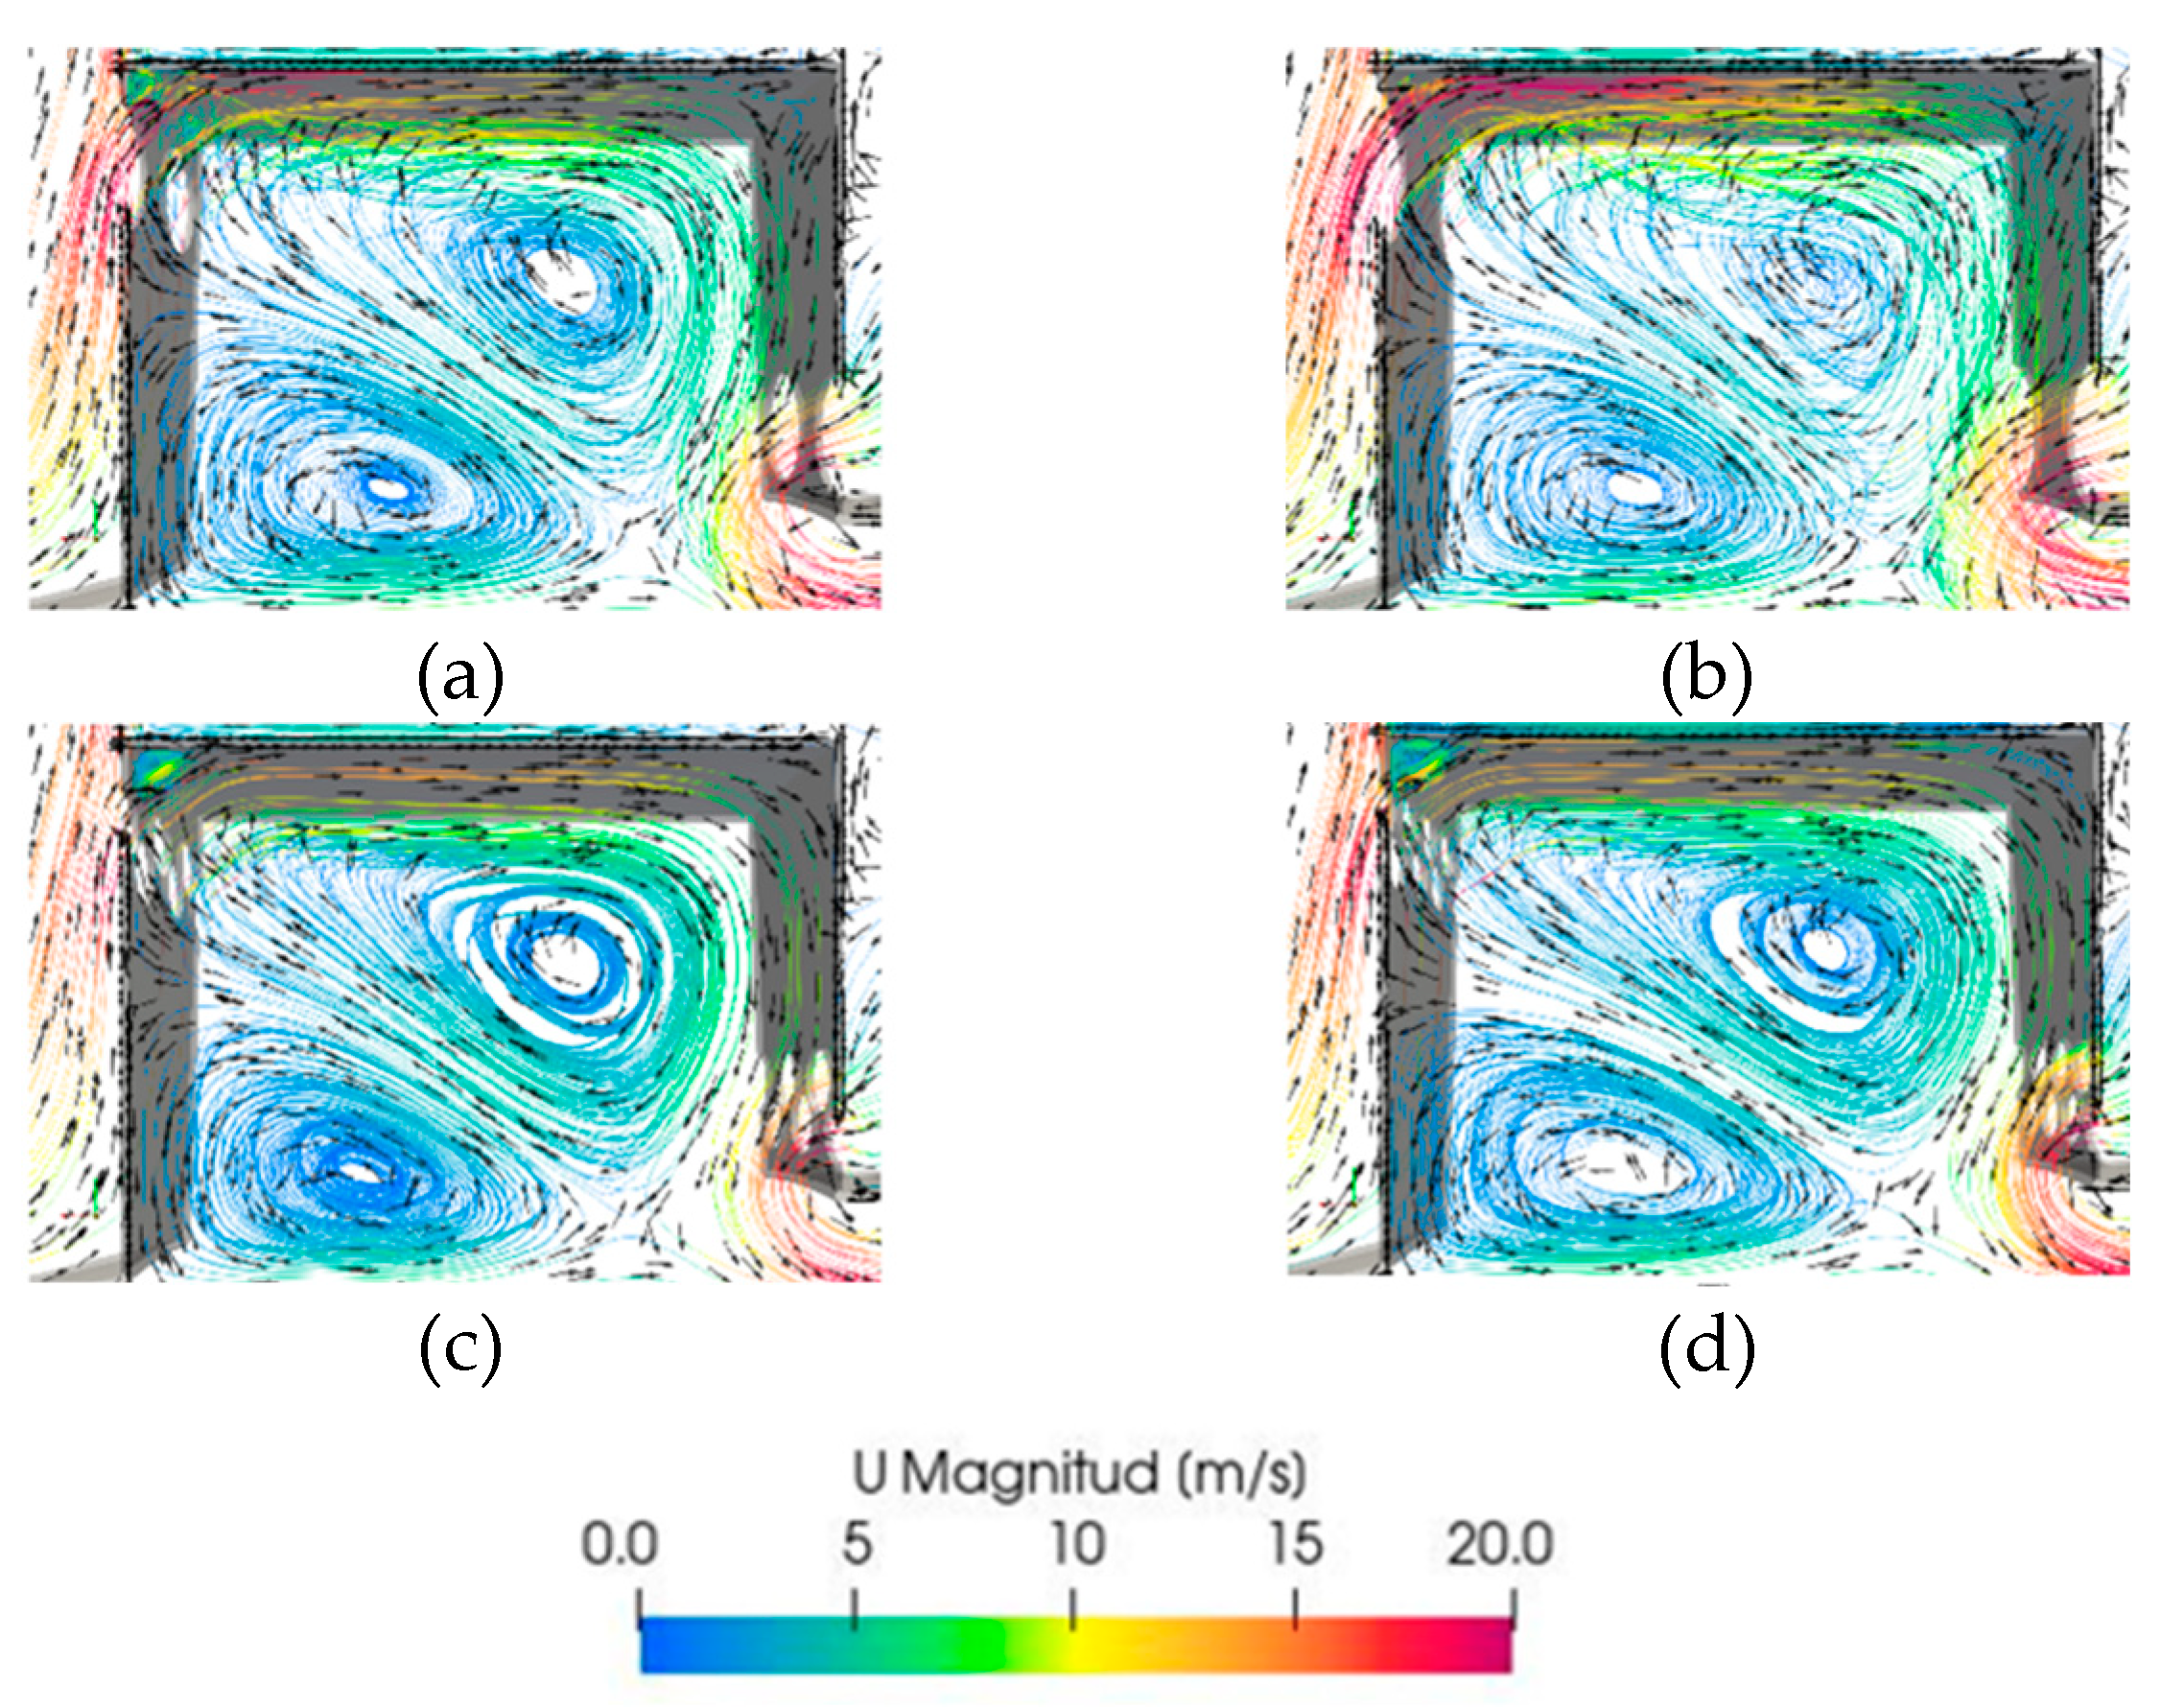
Figure 14.
Q criterion vortex identification results. (a) Case W, (b) Case X, (c) Case Y and (d) Case Z.
Figure 14.
Q criterion vortex identification results. (a) Case W, (b) Case X, (c) Case Y and (d) Case Z.
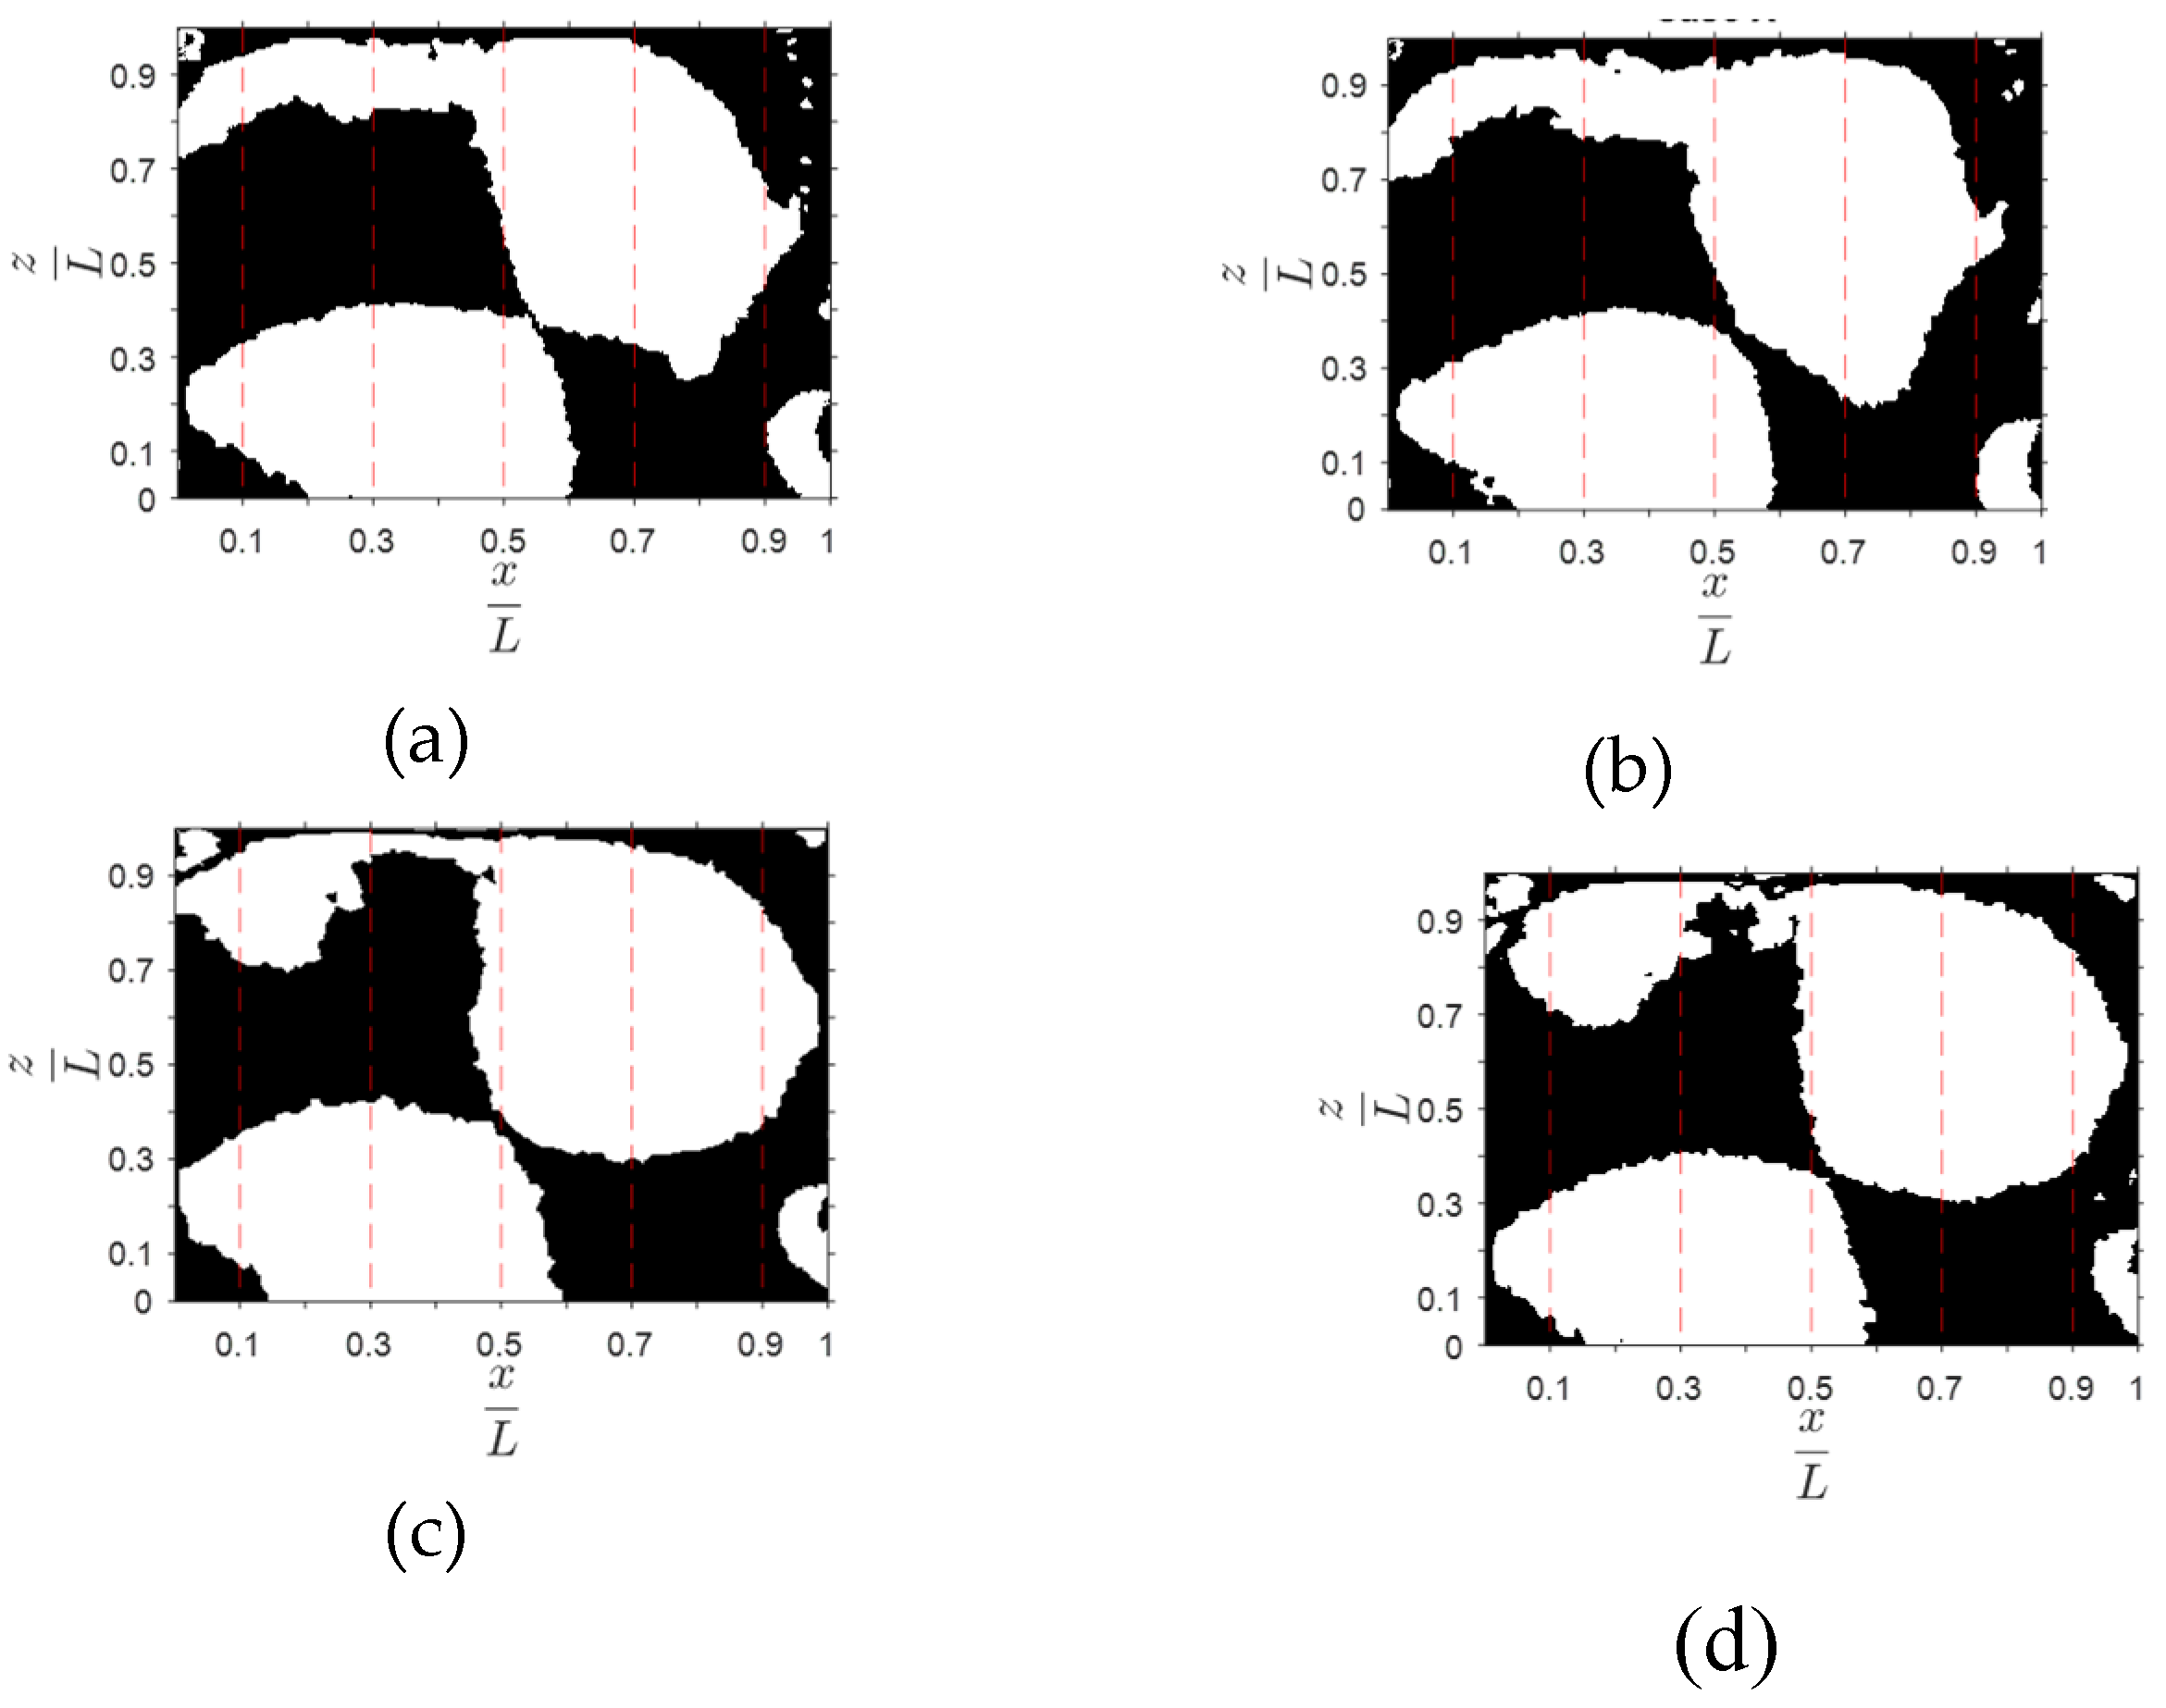
Figure 15.
Maximum and minimum axial velocities ratio for the cavity. Cases W, X, Y, Z.
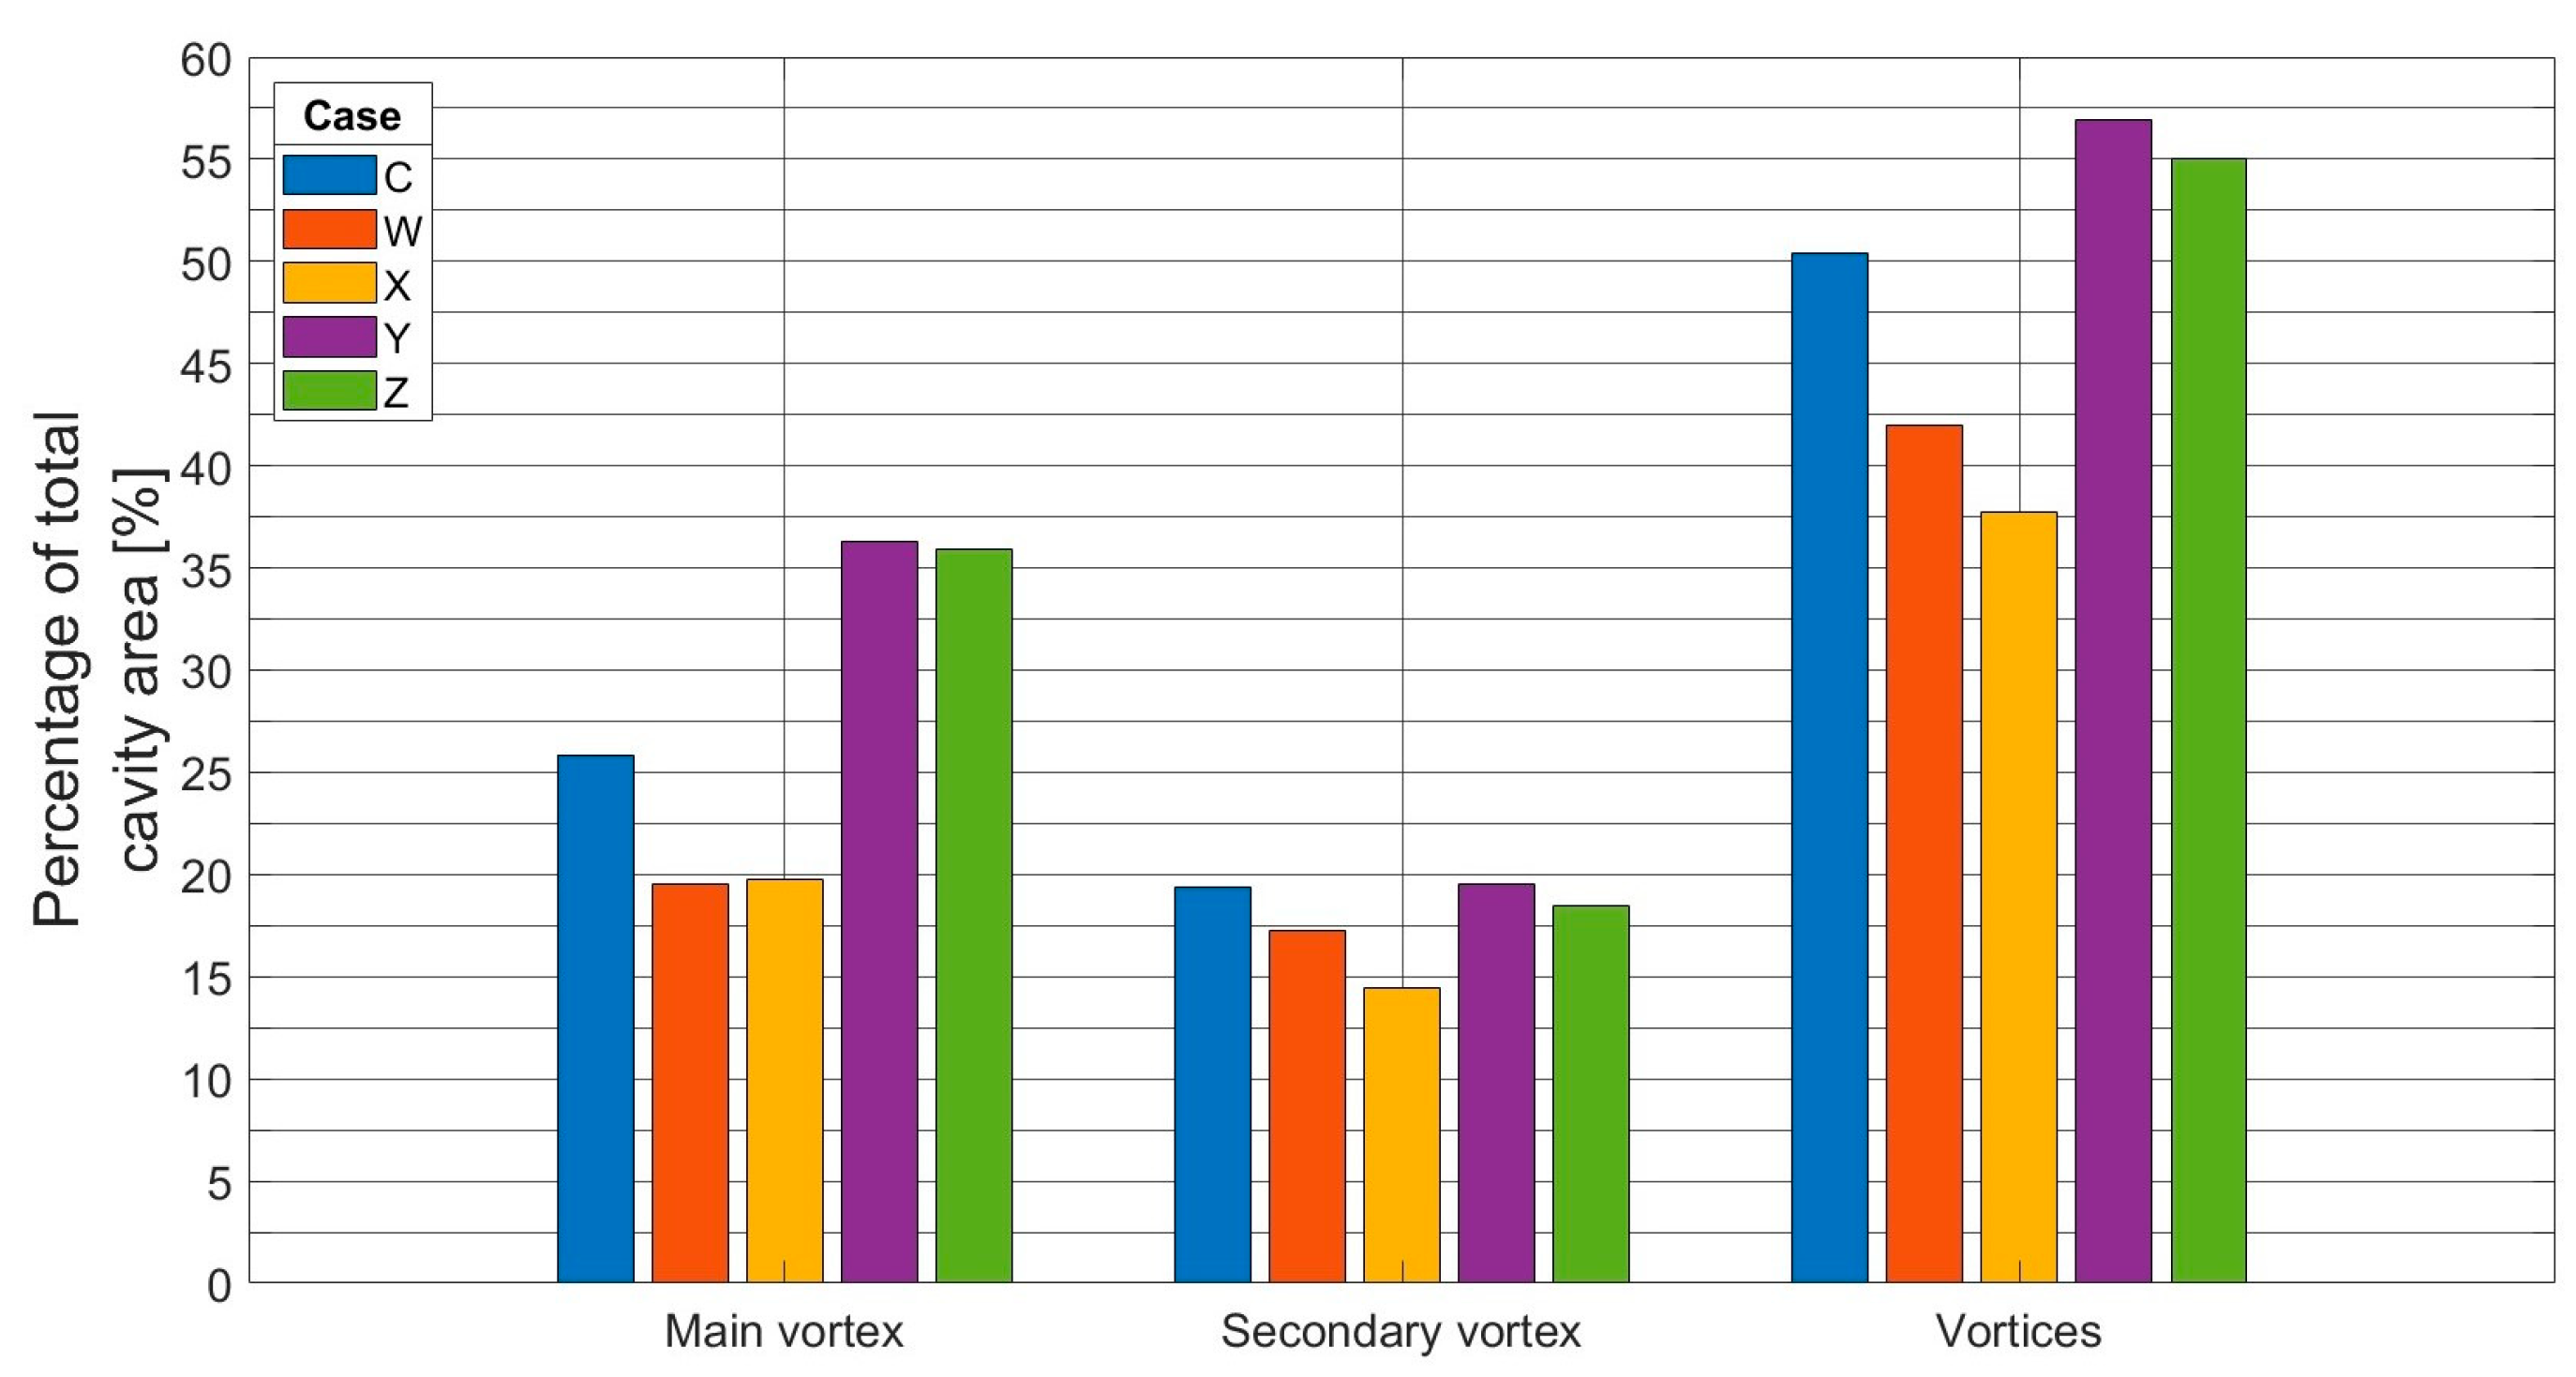
Figure 16.
Maximum and minimum axial velocities ratio for the cavity. Cases W, X, Y, Z.
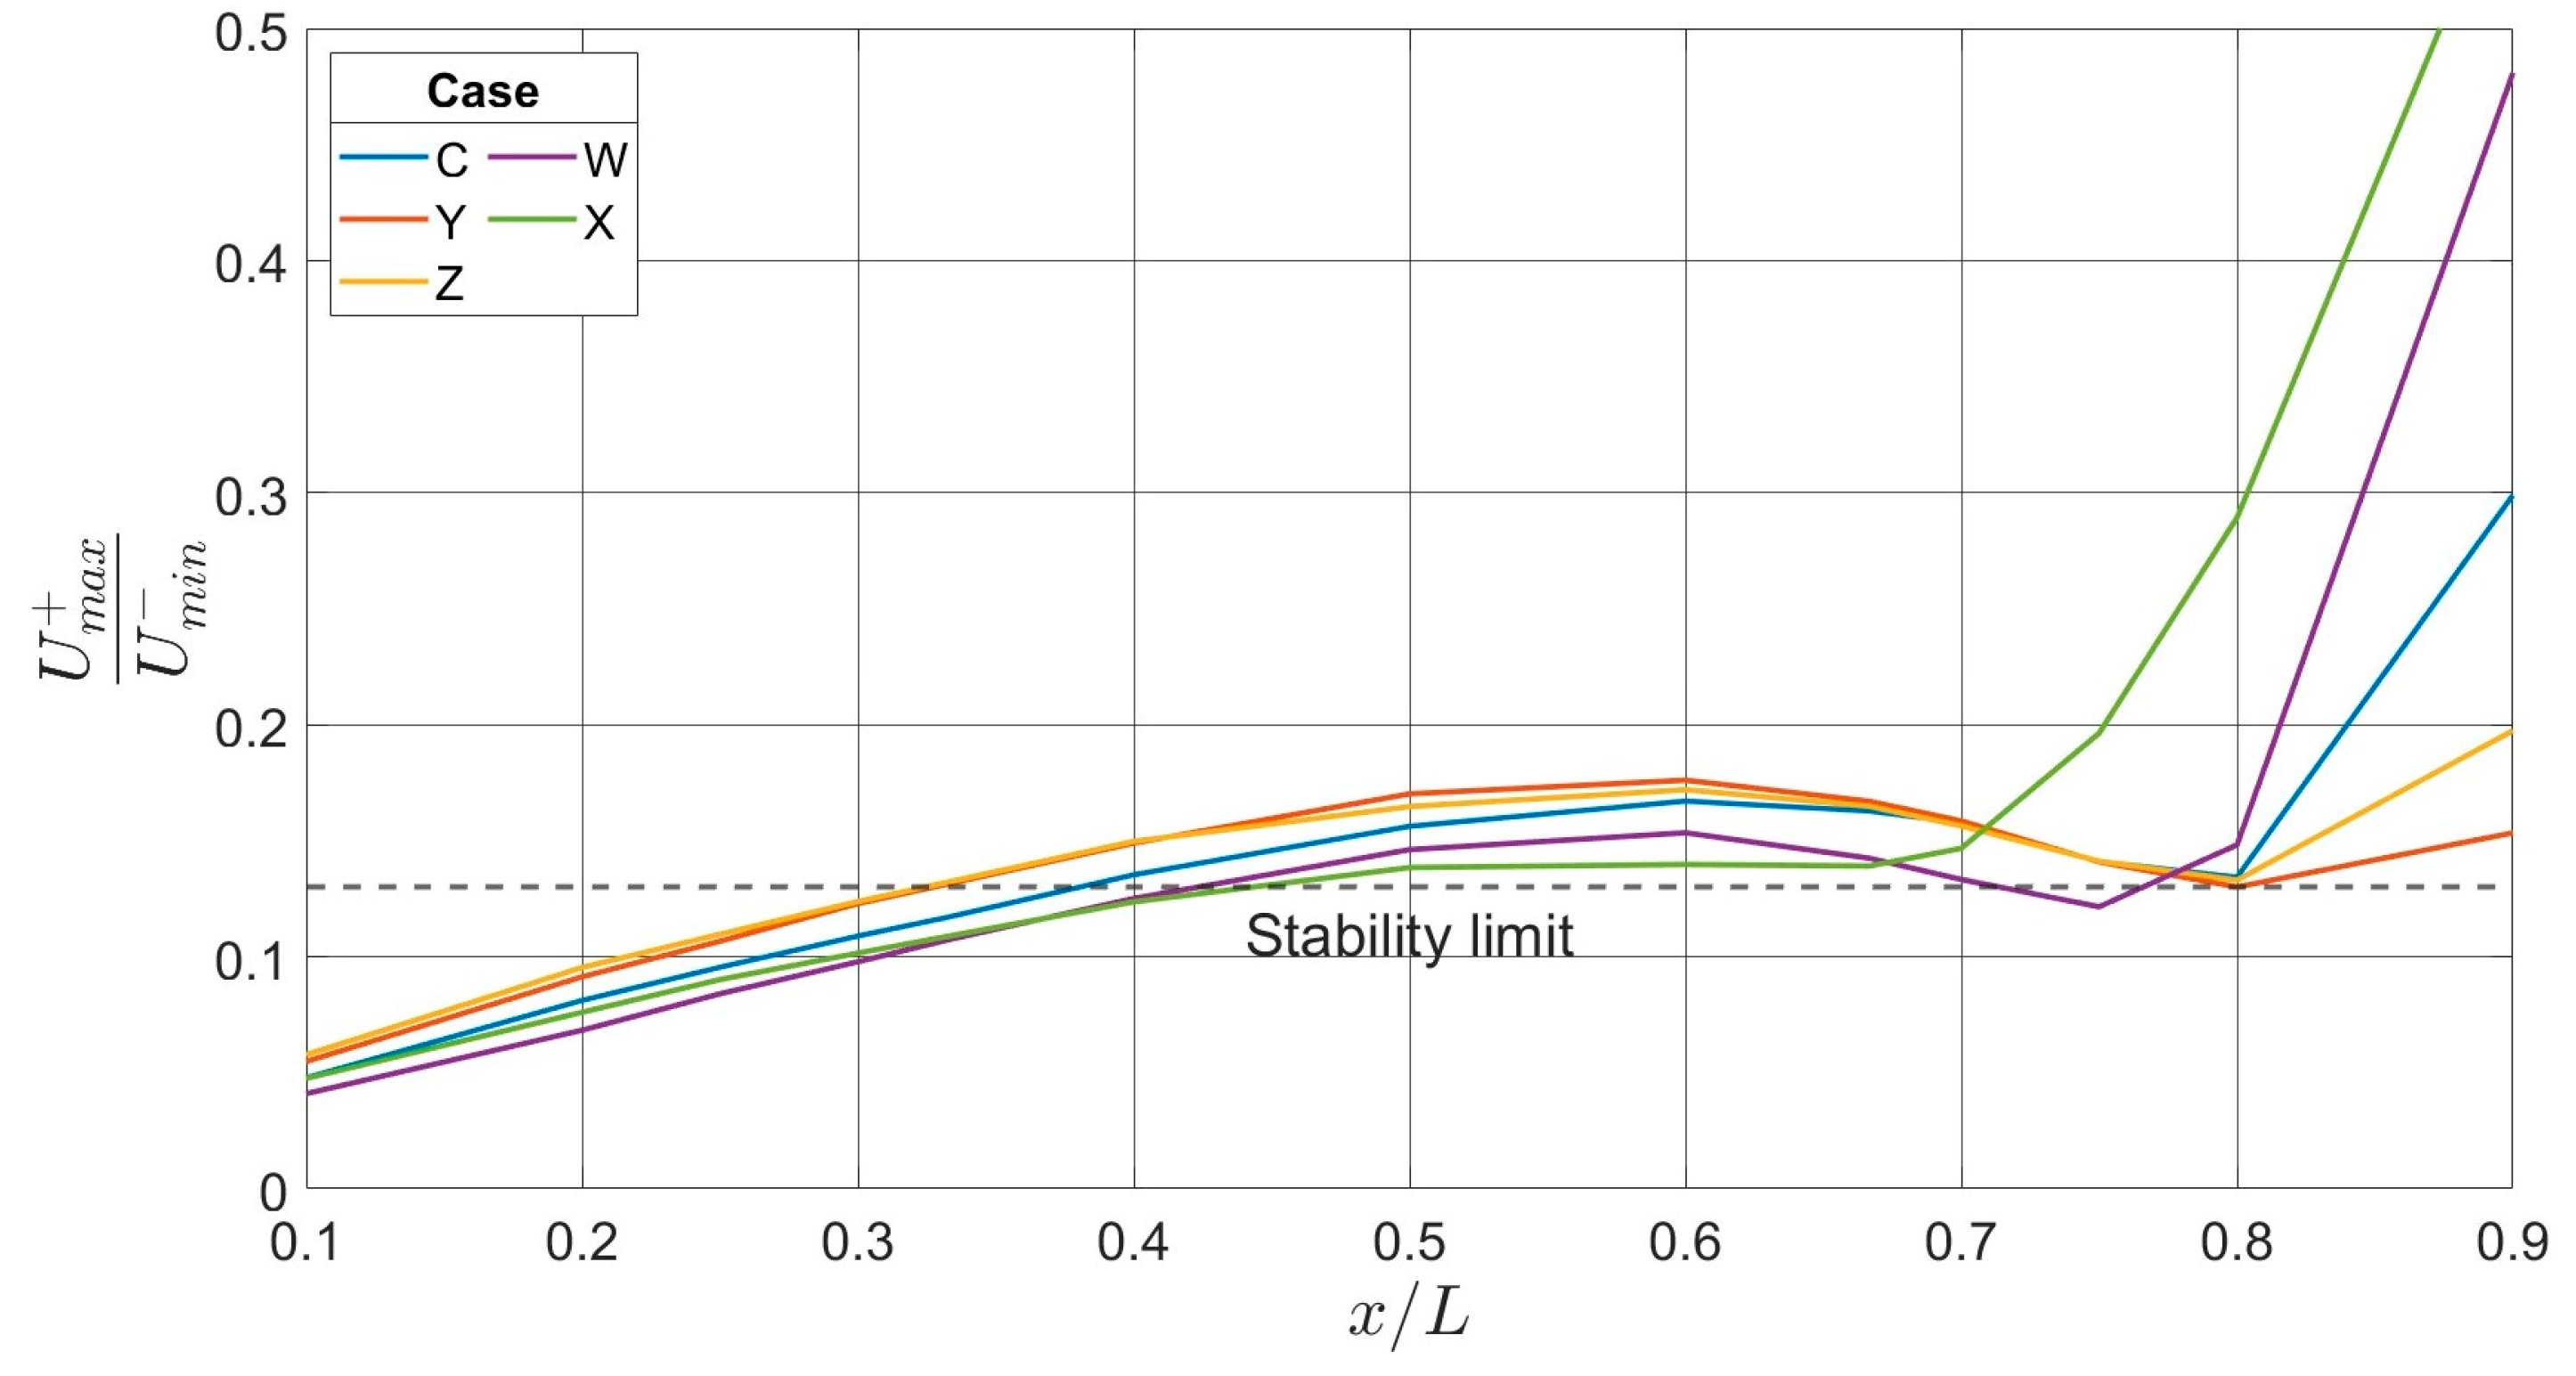

Table 1.
Operating parameters for the TVC.
| Parameter | Value |
|---|---|
Table 2.
Configurations for different hole diameter in the cavity.
| Configuration | Holes by row | |
|---|---|---|
| Original | ||
| W | ||
| X | ||
| Y | ||
| Z |
Table 3.
Grid size parameters.
| Parameter | Value |
|---|---|
| Element size | |
| Growing rate | |
| Minimum number of cells in the aperture | |
| Skewness | |
| Inflation methods | |
| Inflation layers |
Table 4.
Grid sizes tested for the grid independence study.
| G1 | G2 | G3 | CG4 | G5 | |
|---|---|---|---|---|---|
| Cells | 7,195,663 | 6,589,762 | 5,863,447 | 5,020,880 | 4,289,118 |
| Negative cells | 0 | 0 | 0 | 0 | 0 |
| Orthogonality | 0.152 | 0.15 | 0.153 | 0.15 | 0.158 |
| Maximum skewness | 0.839 | 0.841 | 0.85 | 0.847 | 0.849 |
| Computing time | 12.92 ℎrs | 11.46 ℎrs | 7.80 ℎrs | 7.4 ℎrs | 7.19 ℎrs |
Table 5.
Mass Flow distribution in the combustion chamber for different hole´s diameter.
| Holes diameter | |||||
| Number of holes in the cavity | |||||
| Primary mass flow | |||||
| Secondary mass flow | |||||
| Mass flow through the cavity by the holes | |||||
Disclaimer/Publisher’s Note: The statements, opinions and data contained in all publications are solely those of the individual author(s) and contributor(s) and not of MDPI and/or the editor(s). MDPI and/or the editor(s) disclaim responsibility for any injury to people or property resulting from any ideas, methods, instructions or products referred to in the content. |
© 2024 by the authors. Licensee MDPI, Basel, Switzerland. This article is an open access article distributed under the terms and conditions of the Creative Commons Attribution (CC BY) license (http://creativecommons.org/licenses/by/4.0/).
Copyright: This open access article is published under a Creative Commons CC BY 4.0 license, which permit the free download, distribution, and reuse, provided that the author and preprint are cited in any reuse.


