
Submitted:
20 October 2024
Posted:
21 October 2024
You are already at the latest version
Abstract
In this investigation, four distinct by-products of natural materials were used to compose a mix for rammed earth construction. The mix of these materials, which have various granulometry, affords many potential combinations, making the analysis of different combinations highly complex. The Taguchi method, a statistical approach renowned for significantly reducing the number of ex-periments in complex systems, was employed to address this challenge. Each of the four ma-terials was assessed across four different levels, with moisture content also factored in as a pa-rameter within the statistical analysis. Two separate studies were conducted to obtain two optimal com-binations of the materials to enhance the dry density and the Unconfined Compressive Strength (UCS). Taguchi method demonstrated its efficacy in predicting the optimal combination of mix-tures for enhancing both objective parameters. A natural by-product mix demonstrated its po-tential for use as a building material. The enhancement of the dry density due to a modification of the mix’s Particle Size Distribution (PSD) did not produce a direct improvement in the mix UCS. The factor to be prioritized should be the mechanical strength, rather than the dry density of the sample.
Keywords:
natural by-products
; granulometric optimization
; mechanical performance
; rammed earth con-struction
; Taguchi method
1. Introduction
Throughout history, human beings have harnessed the innate qualities of earth as a construction material, capitalizing on its wide availability, cost-effectiveness, versatility, low environmental footprint, low heat transfer, and high heat storage capacities [1,2,3]. Figure 1 shows the traditional earth-construction regions around the world, with the locations of the UNESCO World Heritage sites.
The most widely used earth construction method is Rammed Earth (RE) [5,6]. RE involves the systematic compaction, using a manual or pneumatic rammer, of a soil-water mixture into layers, typically 7.5 to 15 cm thick, within temporary formworks, resulting in walls with a thickness ranging from 30 to 60 cm [7,8,9,10]. The traditional form of RE, known as Unstabilized Rammed Earth (URE), employs only soil and water, with clay acting as a binder [11]. The essence of earth construction lies in its ability to harness by compaction locally sourced soil (i.e. earth) in its natural state. Thus, RE greatly reduces the manufacturing environmental impact compared to conventional building materials and techniques, which use large quantities of materials with a high carbon footprint. This study aims to develop a new material for the RE construction technique, formulated from by-products, that provides several environmental benefits. Firstly, the use of by-products reduces the extraction of natural aggregates. Furthermore, incorporating these residues in RE buildings enables the reutilization of by-products that are difficult to be valorized and would otherwise end up in landfills. Moreover, the use of local residues would reduce the environmental footprint associated with transportation, reducing emissions of fuel consumption among others environmental impacts.
Particle Size Distribution (PSD) and a minimum quantity of clay content are key factors in soil’s suitability for RE building [7]. Nevertheless, the lack of regulations regarding these factors has led authors to use widespread recommendations, such as Houben et al.´s [7] proposed PSD zone based on the granulometric distribution. This PSD zone is the most frequently considered in RE literature [11]. Despite this, this zone should not be treated as a restrictive rule, but as guidance on soil grading, as many soils that fail to comply with Houben et al.´s [7] requirements have been found satisfactory in practice [12,13,14].
Most authors only focus on the minimum quantity of clay needed to act as a binder, leaving aside the PSD. Nevertheless, the PSD of a soil affects the RE mechanical properties. Therefore, studying the PSD is key to improving the RE mechanical properties. The analysis of the influence of the PSD on the RE mechanical properties is a complex work because each PSD exhibits unique mechanical properties. When considering a complete factorial design, the sheer number of experiments becomes practically unfeasible. Most authors consequently define a PSD to work with, and do not search for the PSD that achieves the highest mechanical properties [15,16,17]. Nonetheless, some authors have studied the mechanical properties achieved by different PSDs from the same soil [18,19], but without the objective of searching for the most suitable PSD. Employing a multifactorial experimental design model enables the exploration of the combined effect of selected parameters and their influence on the soil mechanical strength, while minimizing the number of required experiments. Taguchi method introduced a parameter design technique using Orthogonal Arrays (OA), offering a straightforward and effective approach to optimize parameters in complex systems with a considerably reduced number of experiments [20]. This method has found application across diverse industrial fields and research areas, including its adoption in concrete design [21,22,23,24].
Nowadays, there is a lack of knowledge about the application of multifactorial experimental design models for studying PSD of soil in RE buildings. To the authors´ knowledge, no work has reported the use of the Taguchi method for RE buildings. Nevertheless, a first approach has been tried in the use of self-consolidating earth concrete [25]. Based on this, a method that would allow the definition of an optimized PSD to obtain the highest RE mechanical properties is required.
Thus, this study analyzes the convenience of optimizing a natural material mix PSD for earth construction. In RE buildings, Unconfined Compressive Strength (UCS) is the main parameter for characterizing the mechanical behavior [26], and the dry density usually is directly related to the UCS. The Taguchi experimental design model was applied in this work to study the effect of different PSDs in URE building to achieve the PSD that maximized the material mix dry density and (UCS). To that end, four different recycled granulometric by-product fractions were considered as constituents of the different material mixes, and two material mixes were obtained, with optimized dry density and UCS.
2. Materials and Methods
2.1. Materials
Four different natural by-products were considered for the material mix manufacturing: gravel, sandy gravel, sand, and fines. Gravel (<12 mm) and sandy gravel (<4 mm) were calcium carbonate by-products coming from the mining of magnesium carbonate rock for refractory material manufacturing. Sand (<1 mm) was a foundry-recycled sand. Fines (<0.063 mm) were sludges from the cleaning of the magnesium carbonate rock extracted for refractory material manufacturing. Figure 2 shows the PSD of each material measured by sieving. Table 1 shows the bulk density of each material.
2.2. Experimental Design
The primary goal of a parameter design experiment is to identify and design the settings of the process factors that optimize a chosen quality characteristic while being minimally affected by external, uncontrollable factors, also known as noise. When many factors must be taken into consideration, the Taguchi method is a well-known technique to optimize the number of experiments and identify the most influential parameters on the modeled properties. The reduction in the number of experiments is achieved by the use of OAs. Using the Taguchi approach, the individual effects and interactions of a specific number of factors can be studied with a considerably reduced number of experiments, thus making the conclusions drawn from small-scale experiments valid over the entire experimental region [20,27].
The factors selected to be investigated were the four different materials: (i) gravel, (ii) sandy gravel, (iii) sand and (iv) fines as well as the Moisture Content (MC) used to manufacture the RE samples. In RE buildings, UCS is the main parameter for characterizing the mechanical behavior [26]. Thus, a Taguchi study was carried out to optimize the UCS. In addition, as dry density usually is directly related to the UCS, another Taguchi study was carried out to optimize the dry density of the material mix. As Houben et al. [7] proposed PSD zone is frequently used as the reference in RE buildings, a theoretical PSD curve for the mix of the studied materials located in the middle of the proposed zone was target. This curve was fitted with 15% of gravel, 25% of sandy gravel, 30% of sand and 30% of fines in mass. This curve was considered as the reference to define the variation of each material´s proportion needed for the application of the Taguchi method. Table 2 shows the parameters and their variation levels (expressed in dry mass units) considered for the Taguchi method. The MC was expressed as percentage of the combination dry mass. The variation of the MC was based on optimum stated by the Standard Proctor test (UNE 103500:1994), carried out on the reference mix combination (15% of gravel, 25% of sandy gravel, 30% of sand and 30% of fines).
Figure 3 depicts Houben et al.´s [7] suggested PSD zone, the theoretical PSD curve used as reference, and the PSD zone of study as defined based on the parameters variation levels shown in Table 2.
A complete factorial design would require the execution of 1024 experiments (5 parameters, 4 levels per factor, experiments=nºlevelsnºfactors=45=1024). However, employing a L16 OA, based on the Taguchi method illustrated in Table 3, the number of experiments decreases to 16.
In this study, two different Taguchi studies were conducted one to optimize the mix dry density and the other one to optimize the UCS. Nevertheless, the same samples were used to determine both properties as dry density is a non-destructive measurement. Table 4 shows the levels of the parameters defined by the Taguchi method expressed in dry mass units and the mass percentage of each material.
The evaluation of performance characteristics involves identifying the most significant factors and their levels. The optimization criteria are centered around computing the signal-to-noise ratio (S/N), which represents the loss function indicating the variance between the actual experimental outcomes and the desired ones. The analysis of the S/N ratio is based on three performance characteristics categorized as; (i) larger-the-better, (ii) smaller-the-better, and (iii) nominal-the-better [28]. In this study, the objective was to optimize the dry density and the UCS under the condition of “larger-the-better” as defined by Equation (1).
where S/N is the performance statistic, n stands for the number of repetitions for each level of a factor and, Yi denotes the response value of the ith experiment. The S/N ratio values serve as a metric of robustness, contributing to the identification of control factors that mitigate variability in a process by minimizing the impact of noise factors.
The prediction values for the optimized parameter are obtained by Equation (2).
where ηopt is the predicted value, ηm is the overall mean of the parameter to be optimized, f is the number of factors and ηi is the mean of the parameter to be optimized at the optimal level of each factor i.
2.3. Samples Manufacturing
The samples were manufactured as follows: after mixing the dry materials, water was added and mixed thoroughly to guarantee the homogeneity of the mix. The material was then compacted in three layers with a 2.5 kg manual rammer in a 102 mm of diameter and 122 mm height mold, in accordance with the UNE 103500:1994 Standard [29]. Three specimens were manufactured for each combination. The dry density test was performed following UNE-EN ISO 17892-7:2019 Standard [30]. UCS samples testing was carried out after oven-drying the samples at 100ºC until constant weight (i.e. mass variation less than 0.1% for 24 hours), in accordance with the UNE-EN 13286-41:2022 Standard [31].
To validate the experimental design, three samples were manufactured from the combinations, obtained by the Taguchi method, that optimized the parameters to be maximized. The samples dry density was measured and then, they were tested to obtain the UCS values to compare the predictions made by the Taguchi method.
3. Results and Discussion
3.1. Dry Density
Table 5 shows the dry densities obtained by the corresponding combinations and specimens (S).
To reach the required performances, a higher value of dry density was desirable. Therefore, the higher-the-better S/N ratio (Equation (1)) was employed to determine the optimized combination. Table 6 and Figure 4 show the S/N values calculated to identify the effect of the controlling factor (dry density).
The effects and values of the main factors were assessed also with Equation (1). These results are presented in Table 7 and Figure 5.
As depicted in Figure 4 and Figure 5, the optimal values of the S/N ratio matched the optimal value of the means. While this is not always the case, it was convenient because it indicated that it was the most robust combination and would guarantee the highest results in increasing the dry density. Table 6 showed that the optimal levels of the modelled factors aimed to maximize the dry density were, in order of importance, MC Level 2, gravel Level 4, sand Level 3, sandy gravel Level 3 and fines Level 1. These levels expressed in mass unit were: 18 gravel, 32 sand, 26.6 sandy gravel, 24 fines and 8% MC of total mass. The natural by-product mix combination that maximized the dry density expressed in mass percentage was 17.9% gravel, 26.4% sandy gravel, 31.8% sand and 23.9% fines with 8% of MC.
MC was the parameter with the highest importance, as it is well known that dry density is highly dependent on the MC of the material. A direct relationship between the bulk density of the different granulometric fractions and their influence on the dry density was observed, where the gravel had the greatest effect. The other three parameters (sandy gravel, sand and fines) appeared to have comparatively lower effect on the dry density of the samples, but it could not be stated that they had no influence.
3.2. Unconfined Compressive Strength
Table 8 shows the UCS results obtained for the tested combinations.
As for dry density responses, a higher value was desirable for UCS. Therefore, the higher-the-better S/N ratio (Equation (1)) was employed. Table 9 and Figure 6 show the S/N values calculated to identify the effect of the controlling factor (UCS). Table 10 and Figure 7 present the main factors, effects and their values.
As depicted in Figure 6 and Figure 7, and in the same way as dry density, the optimal values of the S/N ratio matched with the optimal value of the means, proving the robustness of the results. Table 9 showed that the optimal levels of the modelled factors aimed to maximize the UCS were, in order of importance, MC Level 2, fines Level 4, sand Level 2, sandy gravel Level 2 and gravel Level 4. These levels expressed in mass units were: 36 fines, 28 sand, 23.3 sandy gravel, 18 gravel and 8% MC of total mass. The natural by-product mix combination that maximizes the UCS expressed in mass percentage was 17.1% gravel, 22.1% sandy gravel, 26.6% sand and 34.2% fines with 8% of MC.
As well as for dry density, the MC was the parameter that had the greatest impact on the development of the UCS. It was also observed that the fines were relevant to enhance the UCS, due to the cohesion provided to the samples.
3.3. Verification of the Results
The optimum combinations which enhanced the dry density and maximized UCS were manufactured. For each one of both combinations, the dry density and the UCS were obtained to verify the quality of each of the predictions made with Equation (2) by both of the Taguchi studies that were carried out. Table 11 shows the dry density and UCS measured on the samples manufactured according to the Taguchi proposed combination that enhanced the samples’ dry densities. The Taguchi’s method prediction values of dry density and UCS are also shown in that table. Table 12 shows the dry density and UCS values reached by the samples manufactured according to the Taguchi proposed combination that enhanced the samples UCS. Like in Table 11, the Taguchi’s prediction values of dry density and UCS are also shown.
The dry density was effectively predicted in both Taguchi experiments when dry density and UCS were the optimized parameters. In Table 11, a mean for the dry density of 2.262 g/cm3 was obtained, the predicted value being 2.256 g/cm3. Furthermore, this value of 2.262 g/cm3 for the dry density was higher than those shown in Table 5, which proved that the Taguchi method was effective in enhancing and predicting the dry density of a natural by-products mix used for RE building. Table 12 also shows that the Taguchi method correctly predicted the dry density value when the UCS was the parameter to be optimized, with a prediction of 2.203 g/cm3 for a real dry density of 2.195 g/cm3. In this case the dry density observed and estimated values were lower than the combination which optimized the dry density shown in Table 11.
Table 12 shows the Taguchi proposed combination which optimizes the UCS. The UCS mean value of the manufactured samples reached 1.91 MPa, higher than the prediction, as it was expected to achieve 1.73 MPa. A similar trend was observed in Table 11, where the samples of the combination that enhanced dry density reached a mean UCS value of 1.40 MPa, while the predicted value was 1.26 MPa. These underestimations in the predicted value were attributed to the poor mechanical properties obtained by some combinations shown in Table 8. Nevertheless, the deviation of the predicted value was lower than 10% and it was considered acceptable, as the aim of the investigation was to find a combination that optimizes the UCS. Thus, the combination that was predicted to optimize the UCS was shown to be the combination that achieved the highest UCS value compared to those of Table 8, confirming that the Taguchi method was effective in enhancing the UCS of a natural by-product mix used for building.
Table 11 and Table 12 demonstrated that enhancing the dry density due to a modification of the mix PSD did not directly improve the mix UCS, as the combination that achieved the highest dry density was not the same as the one that achieved the highest UCS. This was related to the materials’ proportions and roles. In the case where the dry density was optimized, a higher proportion of materials with higher bulk density was employed, as the main objective of this combination was to enhance its dry density and the principal role of the materials was as filler. However, in the combination that optimized the UCS, a higher proportion of fines was required. Fines not only have a filler effect, but they also provided cohesion to the samples. Therefore, despite not making a prediction as accurate as for the dry density, when using Taguchi to optimize a mix for use in RE, the factor to analyze should be the mechanical strength. It should be noted that the objective of this study was to obtain a combination that maximized a parameter and not to characterize that combination, so the prediction errors were considered as acceptable.
4. Conclusions
This study demonstrates the convenience of optimizing a natural by-product mix PSD for rammed earth construction. Taguchi method proved its ability to predict the combinations which optimized each factor. The Taguchi method was an easy method to execute and interpret, allowing the simplification of the combinations to be tested from 1024 experiments in a full factorial design to only 16. The optimization of the S/N ratio guaranteed the robustness of the method, as shown by the obtained predictions. The results demonstrate that different mix combinations were required to optimize the dry density and UCS. Authors usually work with an unique soil combination, considering that the improvement of the dry density is directly related to an improvement on the mechanical properties. This study demonstrated that enhancing the dry density by the modification of the mix PSD did not result in a direct improvement in mix UCS. The mix combination that maximized the UCS contained a higher proportion of fine particles, demonstrating the beneficial effects of cohesion in the mix mechanical properties. Therefore, when using the Taguchi method in RE building, the factor to be maximized should be the mechanical strength, despite the dry density of the sample.
Author Contributions
Conceptualization, M.A.M.A., B.G. and A.S.; data curation, B.G.; formal analysis, M.A.M.A. and B.G.; investigation, M.A.M.A.; methodology, E.P. and B.G.; project administration, E.P.; supervision, C.P. and A.S.; validation, C.P. and A.S.; visualization, M.A.M.A., C.P. and A.S.; writing – original draft, M.A.M.A.; writing – review & editing, CP. and A.S. All authors have read and agreed to the published version of the manuscript.
Funding
This research received no external funding.
Institutional Review Board Statement
Not applicable.
Informed Consent Statement
Not applicable.
Data Availability Statement
The original contributions presented in the study are included in the article; further inquiries can be directed to the corresponding author.
Acknowledgements
This research was supported by the Universidad Pública de Navarra via a doctoral grant to Miguel A. Martin-Antunes (1204/2022), in collaboration with Université de Pau et des Pays de l’Adour.
Conflicts of Interest
The authors declare no conflicts of interest.
References
- Morel, J.C.; Mesbah, A.; Oggero, M.; Walker, P. Building Houses with Local Materials: Means to Drastically Reduce the Environmental Impact of Construction. Build. Environ. 2001, 36, 1119–1126. [Google Scholar] [CrossRef]
- Soudani, L.; Fabbri, A.; Morel, J.-C.; Woloszyn, M.; Chabriac, P.-A.; Wong, H.; Grillet, A.-C. Assessment of the Validity of Some Common Assumptions in Hygrothermal Modeling of Earth Based Materials. Energy Build. 2016, 116, 498–511. [Google Scholar] [CrossRef]
- Taylor, P.; Fuller, R.J.; Luther, M.B. Energy Use and Thermal Comfort in a Rammed Earth Office Building. Energy Build. 2008, 40, 793–800. [Google Scholar] [CrossRef]
- CRAterre, 2021. CRAterre- Map of Historical Earth Construction. Around the World, 8.26.21. Http://Craterre.Org/Accueil:Galerie-Des-Images/Default/Gallery/38/Galle Ry_view/Gallery.
- Burroughs, S. Recommendations for the Selection, Stabilization, and Compaction of Soil for Rammed Earth Wall Construction. J. Green Build. 2010, 5, 101–114. [Google Scholar] [CrossRef]
- Arto, I.; Gallego, R.; Cifuentes, H.; Puertas, E.; Gutiérrez-Carrillo, M.L. Fracture Behavior of Rammed Earth in Historic Buildings. Constr. Build. Mater. 2021, 289, 123167. [Google Scholar] [CrossRef]
- Houben, H.; Guillaud, H. CRAterre, Intermediate Technology Publications, Earth Construction: A Comprehensive Guide; Intermediate Technology Publications: London, UK, 1994. [Google Scholar]
- Nowamooz, H.; Chazallon, C. Finite Element Modelling of a Rammed Earth Wall. Constr. Build. Mater. 2011, 25, 2112–2121. [Google Scholar] [CrossRef]
- El-Nabouch, R.; Bui, Q.-B.; Plé, O.; Perrotin, P. Assessing the In-Plane Seismic Performance of Rammed Earth Walls by Using Horizontal Loading Tests. Eng. Struct. 2017, 145, 153–161. [Google Scholar] [CrossRef]
- Alex, D. Recognition of a Heritage in Danger: Rammed-Earth Architecture in Lyon City, France. IOP Conf. Ser.: Earth Environ. Sci. 2018, 143, 012054. [Google Scholar] [CrossRef]
- Ávila, F.; Puertas, E.; Gallego, R. Characterization of the Mechanical and Physical Properties of Unstabilized Rammed Earth: A Review. Constr. Build. Mater. 2021, 270, 121435. [Google Scholar] [CrossRef]
- Ngo, T.; Phan, V.; Schwede, D.; Nguyen, D.; Bui, Q. Assessing Influences of Different Factors on the Compressive Strength of Geopolymer-Stabilised Compacted Earth. J. Aust. Ceram. Soc. 2022, 58, 379–395. [Google Scholar] [CrossRef]
- Zami, M.; Ewebajo, A.; Al-Amoudi, O.; Al-Osta, M.; Mustafa, Y. Compressive Strength and Wetting-Drying Cycles of Al-Hofuf “Hamrah” Soil Stabilized with Cement and Lime. Arab. J. Sci. Eng. 2022, 47, 13249–13264. [Google Scholar] [CrossRef]
- Vikas, K.; Ramana Murthy, V.; Ramana, G.V. Stabilized Soil as a Sustainable Construction Material Using the Rammed Earth Technique. Springer Science and Business Media Deutschland GmbH, 2023; Vol. 298, p. 281. ISBN 9789811967733. ISSN 23662557. [Google Scholar]
- Zhou, T.; Zhang, Z.; Su, Z.; Tian, P. Seismic Performance Test of Rammed Earth Wall with Different Structural Columns. Adv. Struct. Eng. 2021, 24, 107–118. [Google Scholar] [CrossRef]
- Shaaban, M. Sustainability of Excavation Soil and Red Brick Waste in Rammed Earth. Civil Engi. Arc. 2021, 9, 789–798. [Google Scholar] [CrossRef]
- Rathod, R.; Reddy, B. Strength and Stress-Strain Characteristics of Fibre Reinforced Cement Stabilised Rammed Earth. Mater. Struct. 2021, 54, 52. [Google Scholar] [CrossRef]
- Rosicki, L.; Narloch, P. Studies on the Ageing of Cement Stabilized Rammed Earth Material in Different Exposure Conditions. Materials 2022, 15, 1090. [Google Scholar] [CrossRef]
- Vivek, A.N.; Kumar, P.P.; Reddy, M.H. Experimental Study on Long-Term Strength and Performance of Rammed Earth Stabilized with Mineral Admixtures. El-Cezeri J. Sci. and Eng. 2022, 9, 1136–1148. [Google Scholar] [CrossRef]
- Ranjit, KR. A Primer on the Taguchi Method; Van Nostrand Reinhold: New York, NY, USA, 1990. [Google Scholar]
- Olivia, M.; Nikraz, H. Properties of Fly Ash Geopolymer Concrete Designed by Taguchi Method. Mater. Des. 2012, 36, 191–198. [Google Scholar] [CrossRef]
- Türkmen, İ.; Gül, R.; Çelik, C. A Taguchi Approach for Investigation of Some Physical Properties of Concrete Produced from Mineral Admixtures. Build. Environ. 2008, 43, 1127–1137. [Google Scholar] [CrossRef]
- Ozbay, E.; Oztas, A.; Baykasoglu, A.; Ozbebek, H. Investigating Mix Proportions of High Strength Self Compacting Concrete by Using Taguchi Method. Constr. Build. Mater. 2009, 23, 694–702. [Google Scholar] [CrossRef]
- Ayan, E.; Saatçioğlu, Ö.; Turanli, L. Parameter Optimization on Compressive Strength of Steel Fiber Reinforced High Strength Concrete. Constr. Build. Mater. 2011, 25, 2837–2844. [Google Scholar] [CrossRef]
- Kohandelnia, M.; Hosseinpoor, M.; Yahia, A.; Belarbi, R. A New Approach for Proportioning Self-Consolidating Earth Paste (SCEP) Using the Taguchi Method. Constr. Build. Mater. 2022, 347, 128579. [Google Scholar] [CrossRef]
- Ávila, F.; Puertas, E.; Gallego, R. Characterization of the Mechanical and Physical Properties of Stabilized Rammed Earth: A Review. Constr. Build. Mater. 2022, 325, 126693. [Google Scholar] [CrossRef]
- Peace, G.S. Taguchi Method; Corporate and Professional Publishing Group: 1993.
- Phadke, M.S. Quality Engineering Using Robust Design; Prentice Hall: New Jersey, 1989. [Google Scholar]
- UNE 103500:1994; Geotecnia - Ensayo de Compactación - Proctor Normal. UNE: Spain, 1994.
- UNE-EN ISO 17892-7:2019; Investigación y Ensayos Geotécnicos - Ensyos de Laboratorio de Suelos - Parte 7: Ensayo de Compresión No Confinada. UNE-EN ISO: Spain, 2019.
- UNE-EN 13286-41:2022; Mezclas de Áridos Sin Ligante y Con Conglomerante Hidráulico - Parte 41: Método de Ensayo Para La Determinación de La Resistencia a Compresión de Las Mezclas de Áridos Con Conglomerante Hidráulico. UNE-EN: Spain, 2022.
Figure 1.
Map of the traditional earth-construction regions around the world, with the locations of the UNESCO world heritage sites [4].
Figure 1.
Map of the traditional earth-construction regions around the world, with the locations of the UNESCO world heritage sites [4].
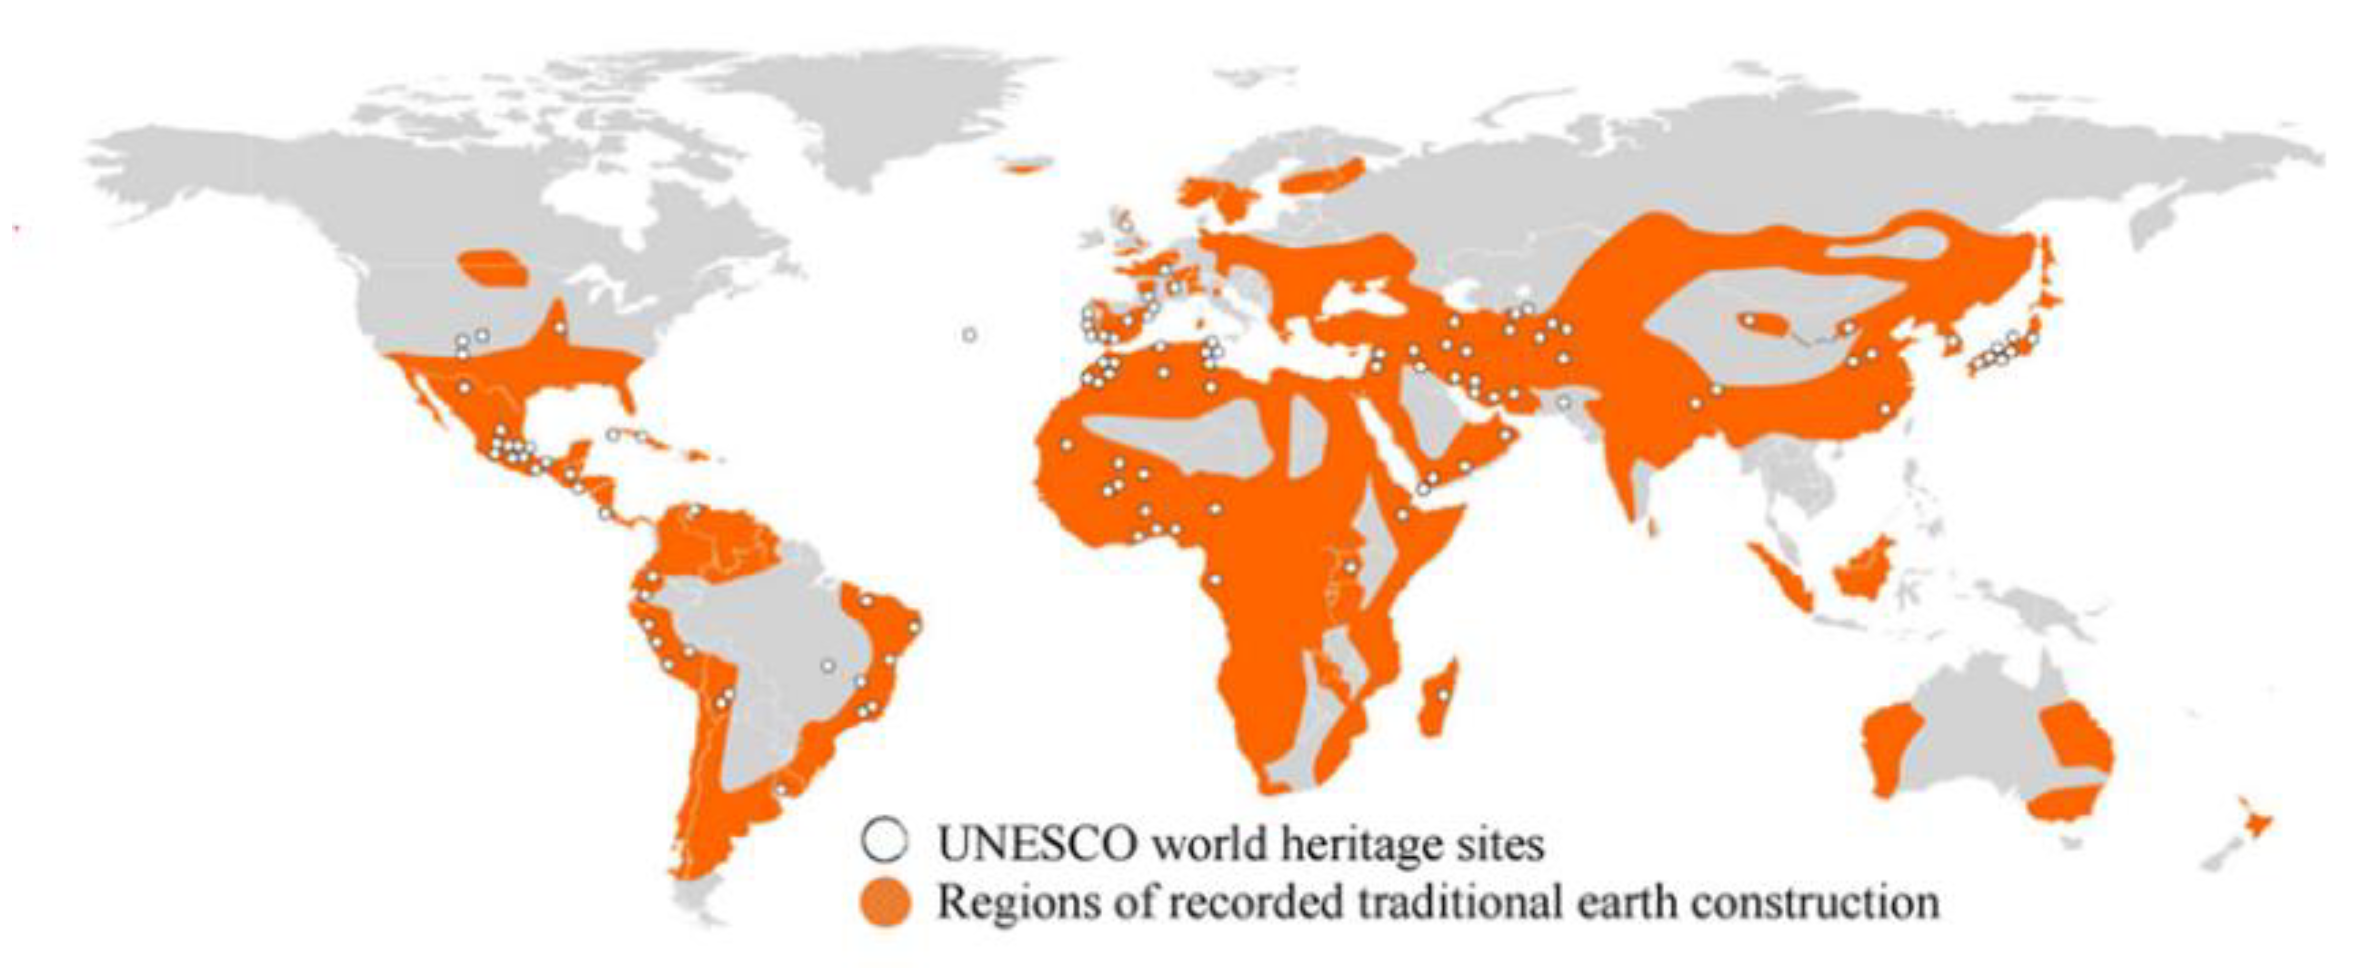
Figure 2.
PSD of the considered natural by-products.
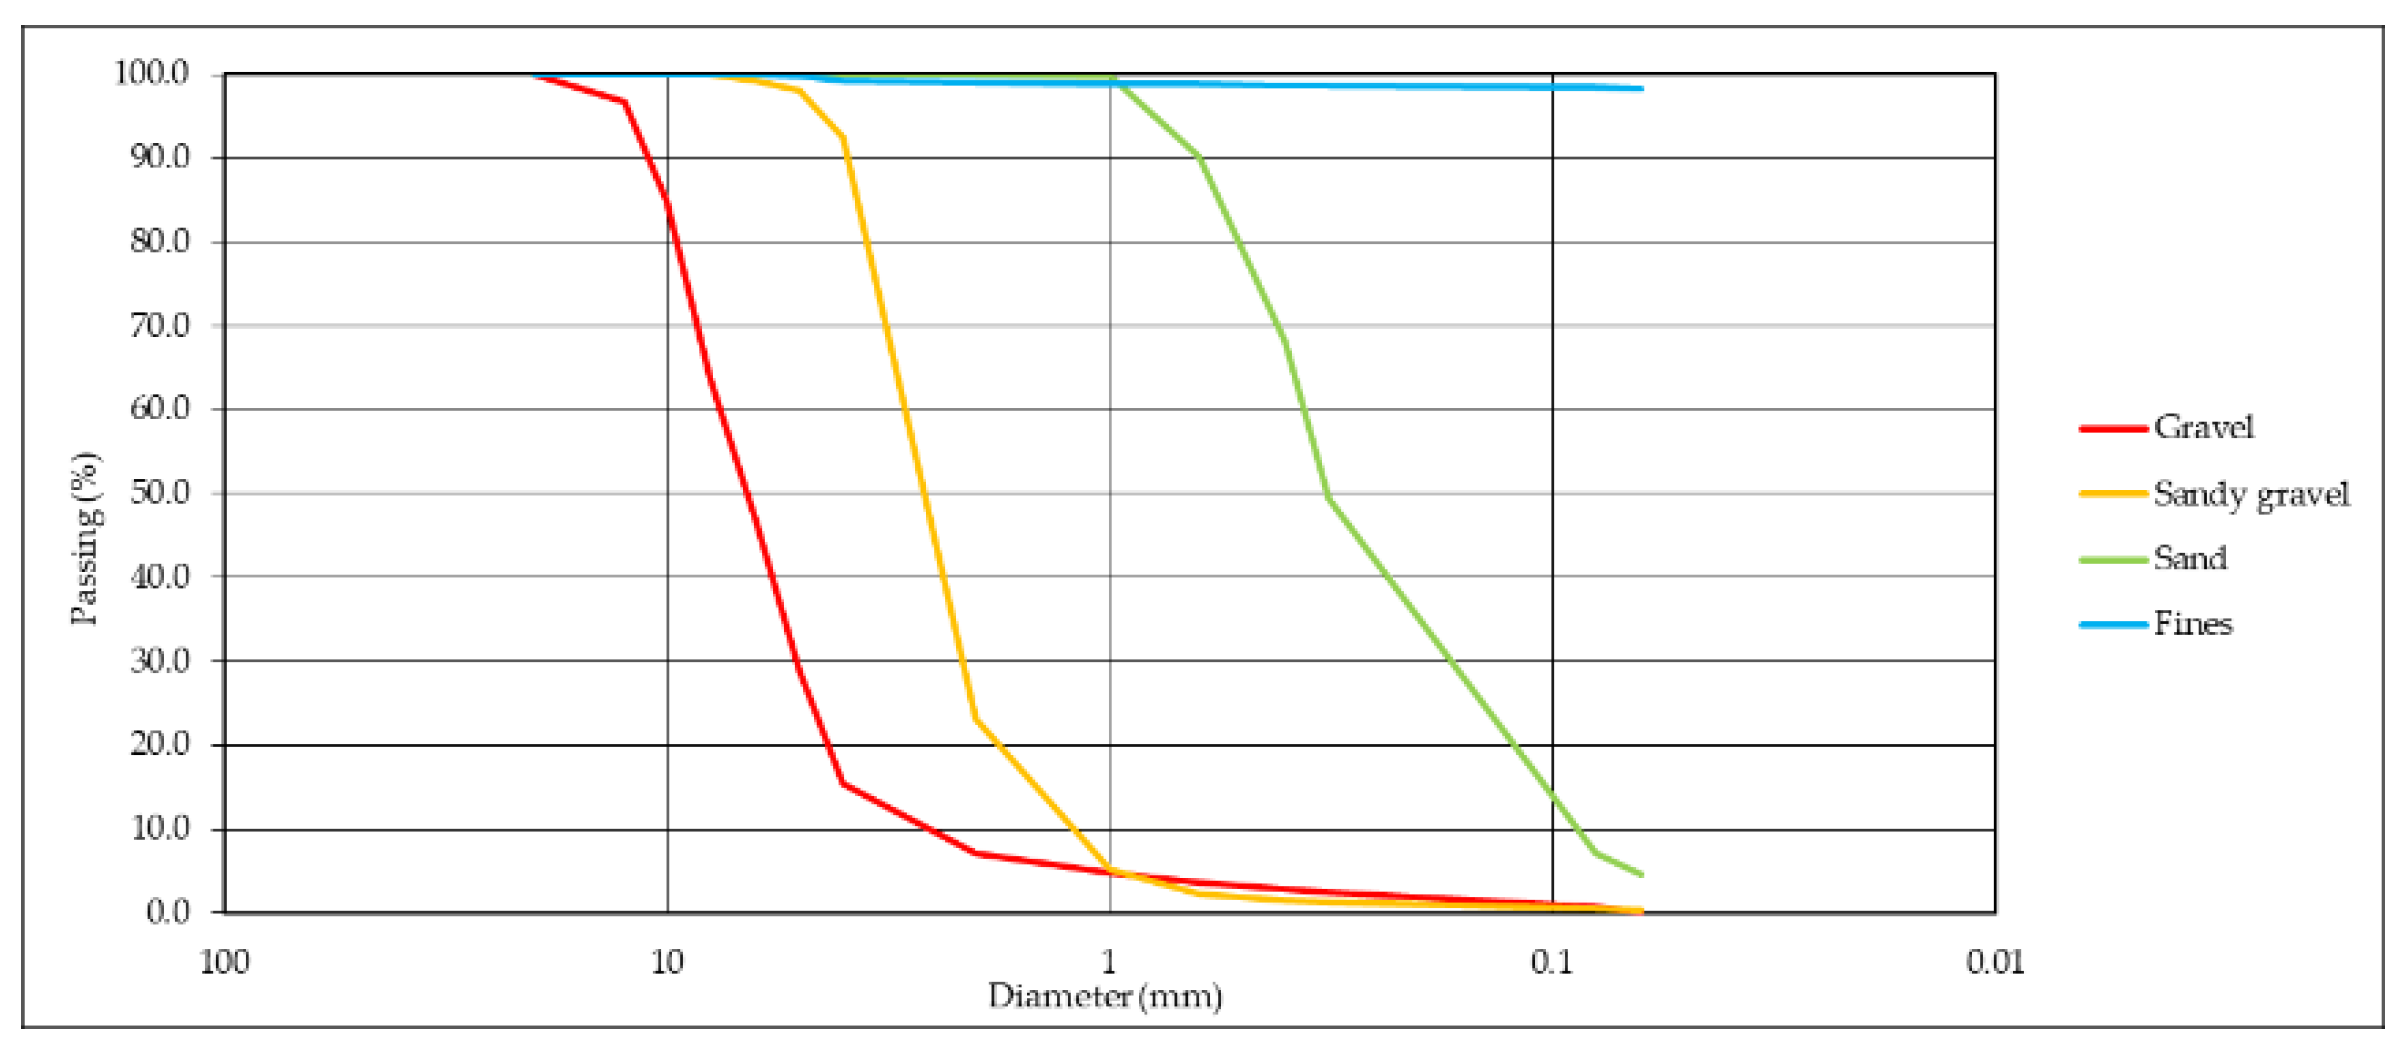
Figure 3.
PSD zone of study.
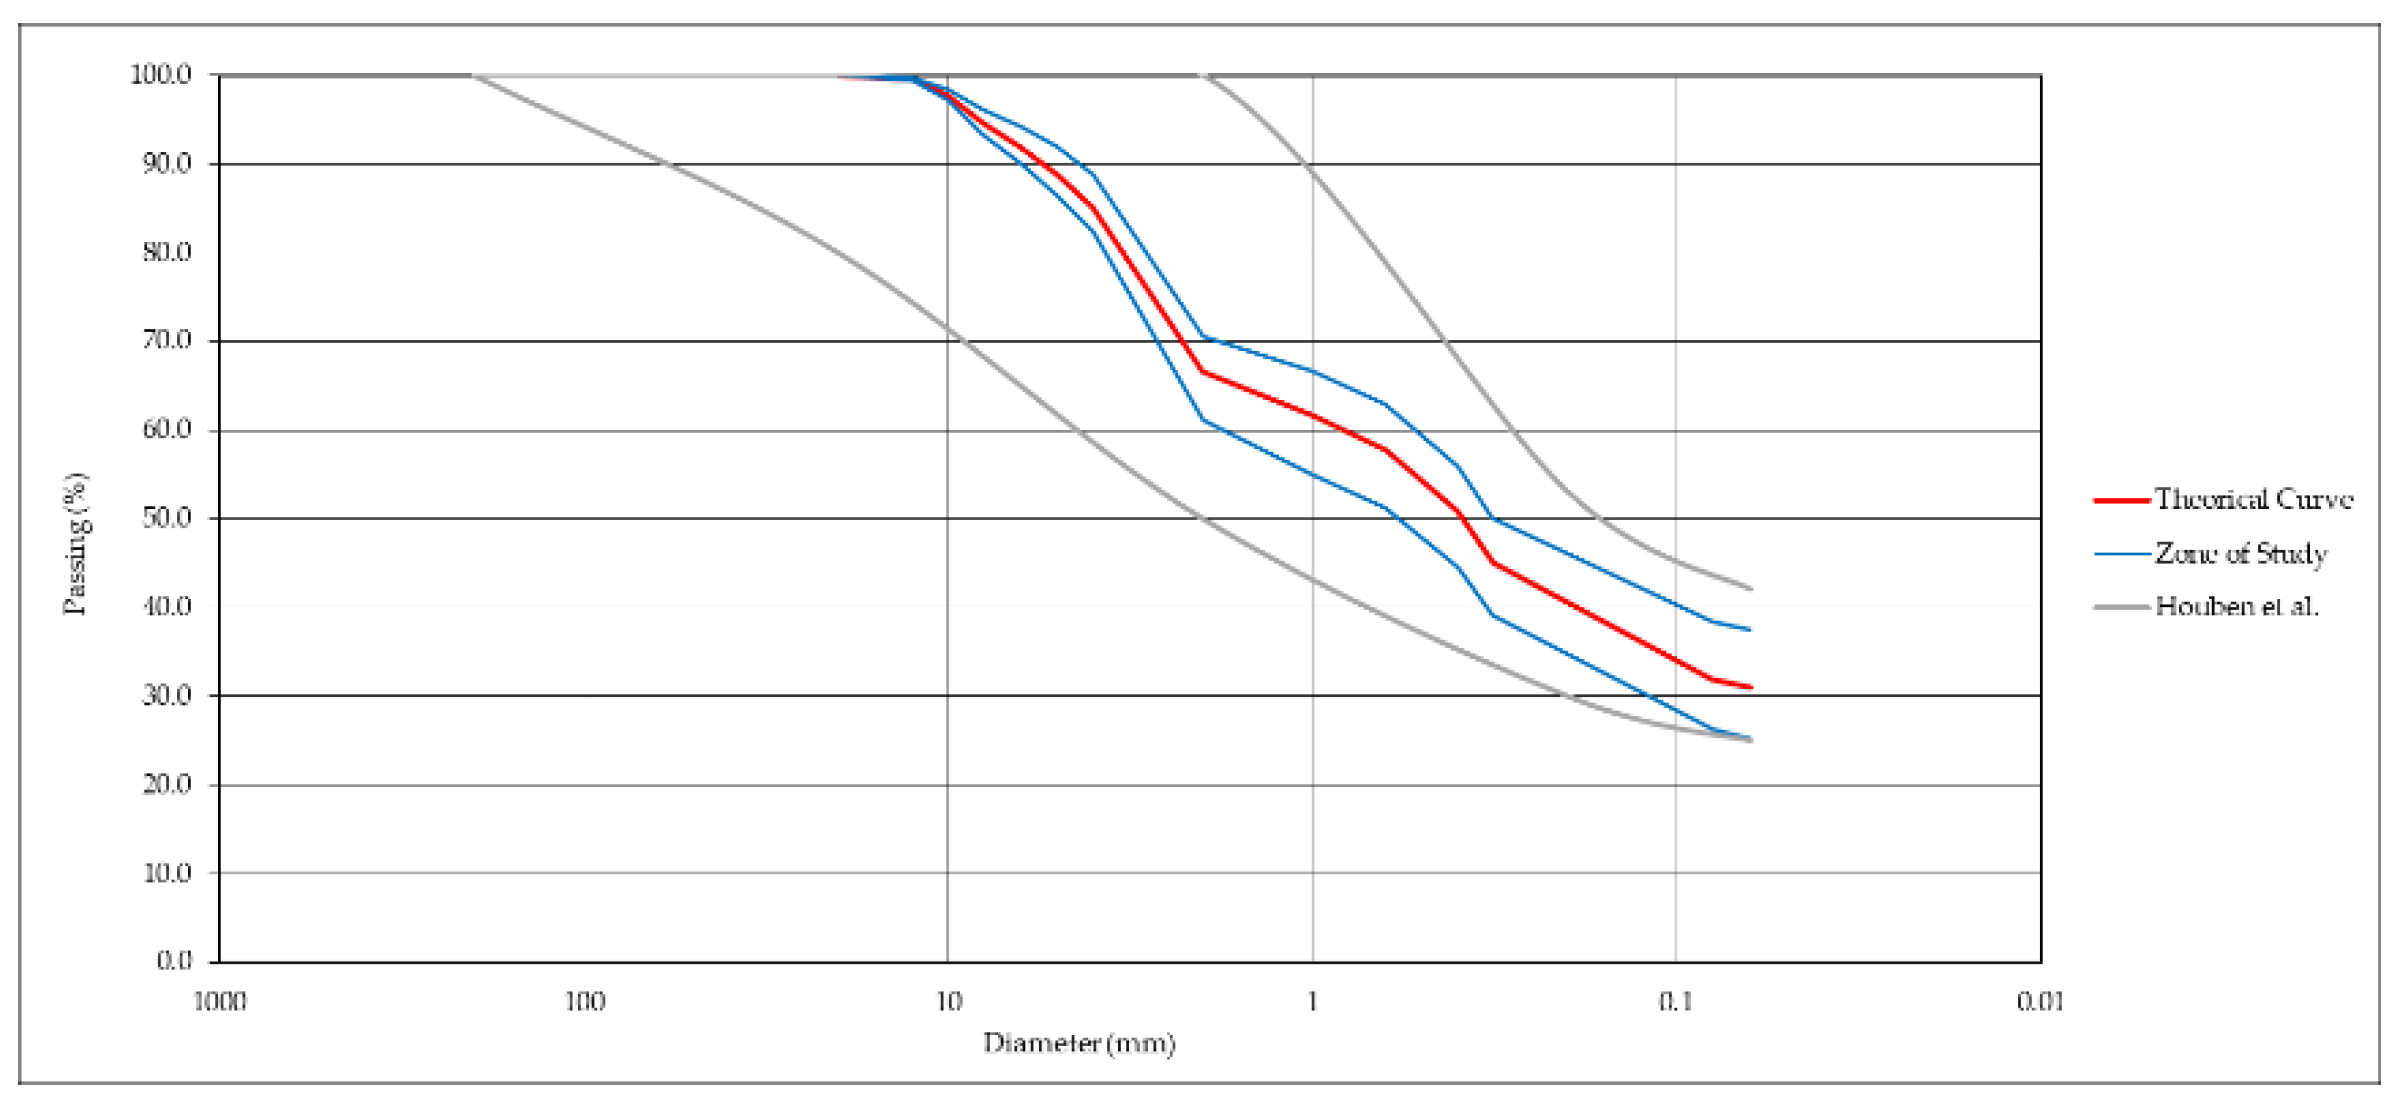
Figure 4.
Main effects for SN ratios of each factor: gravel, sandy gravel, sand, fines and MC.
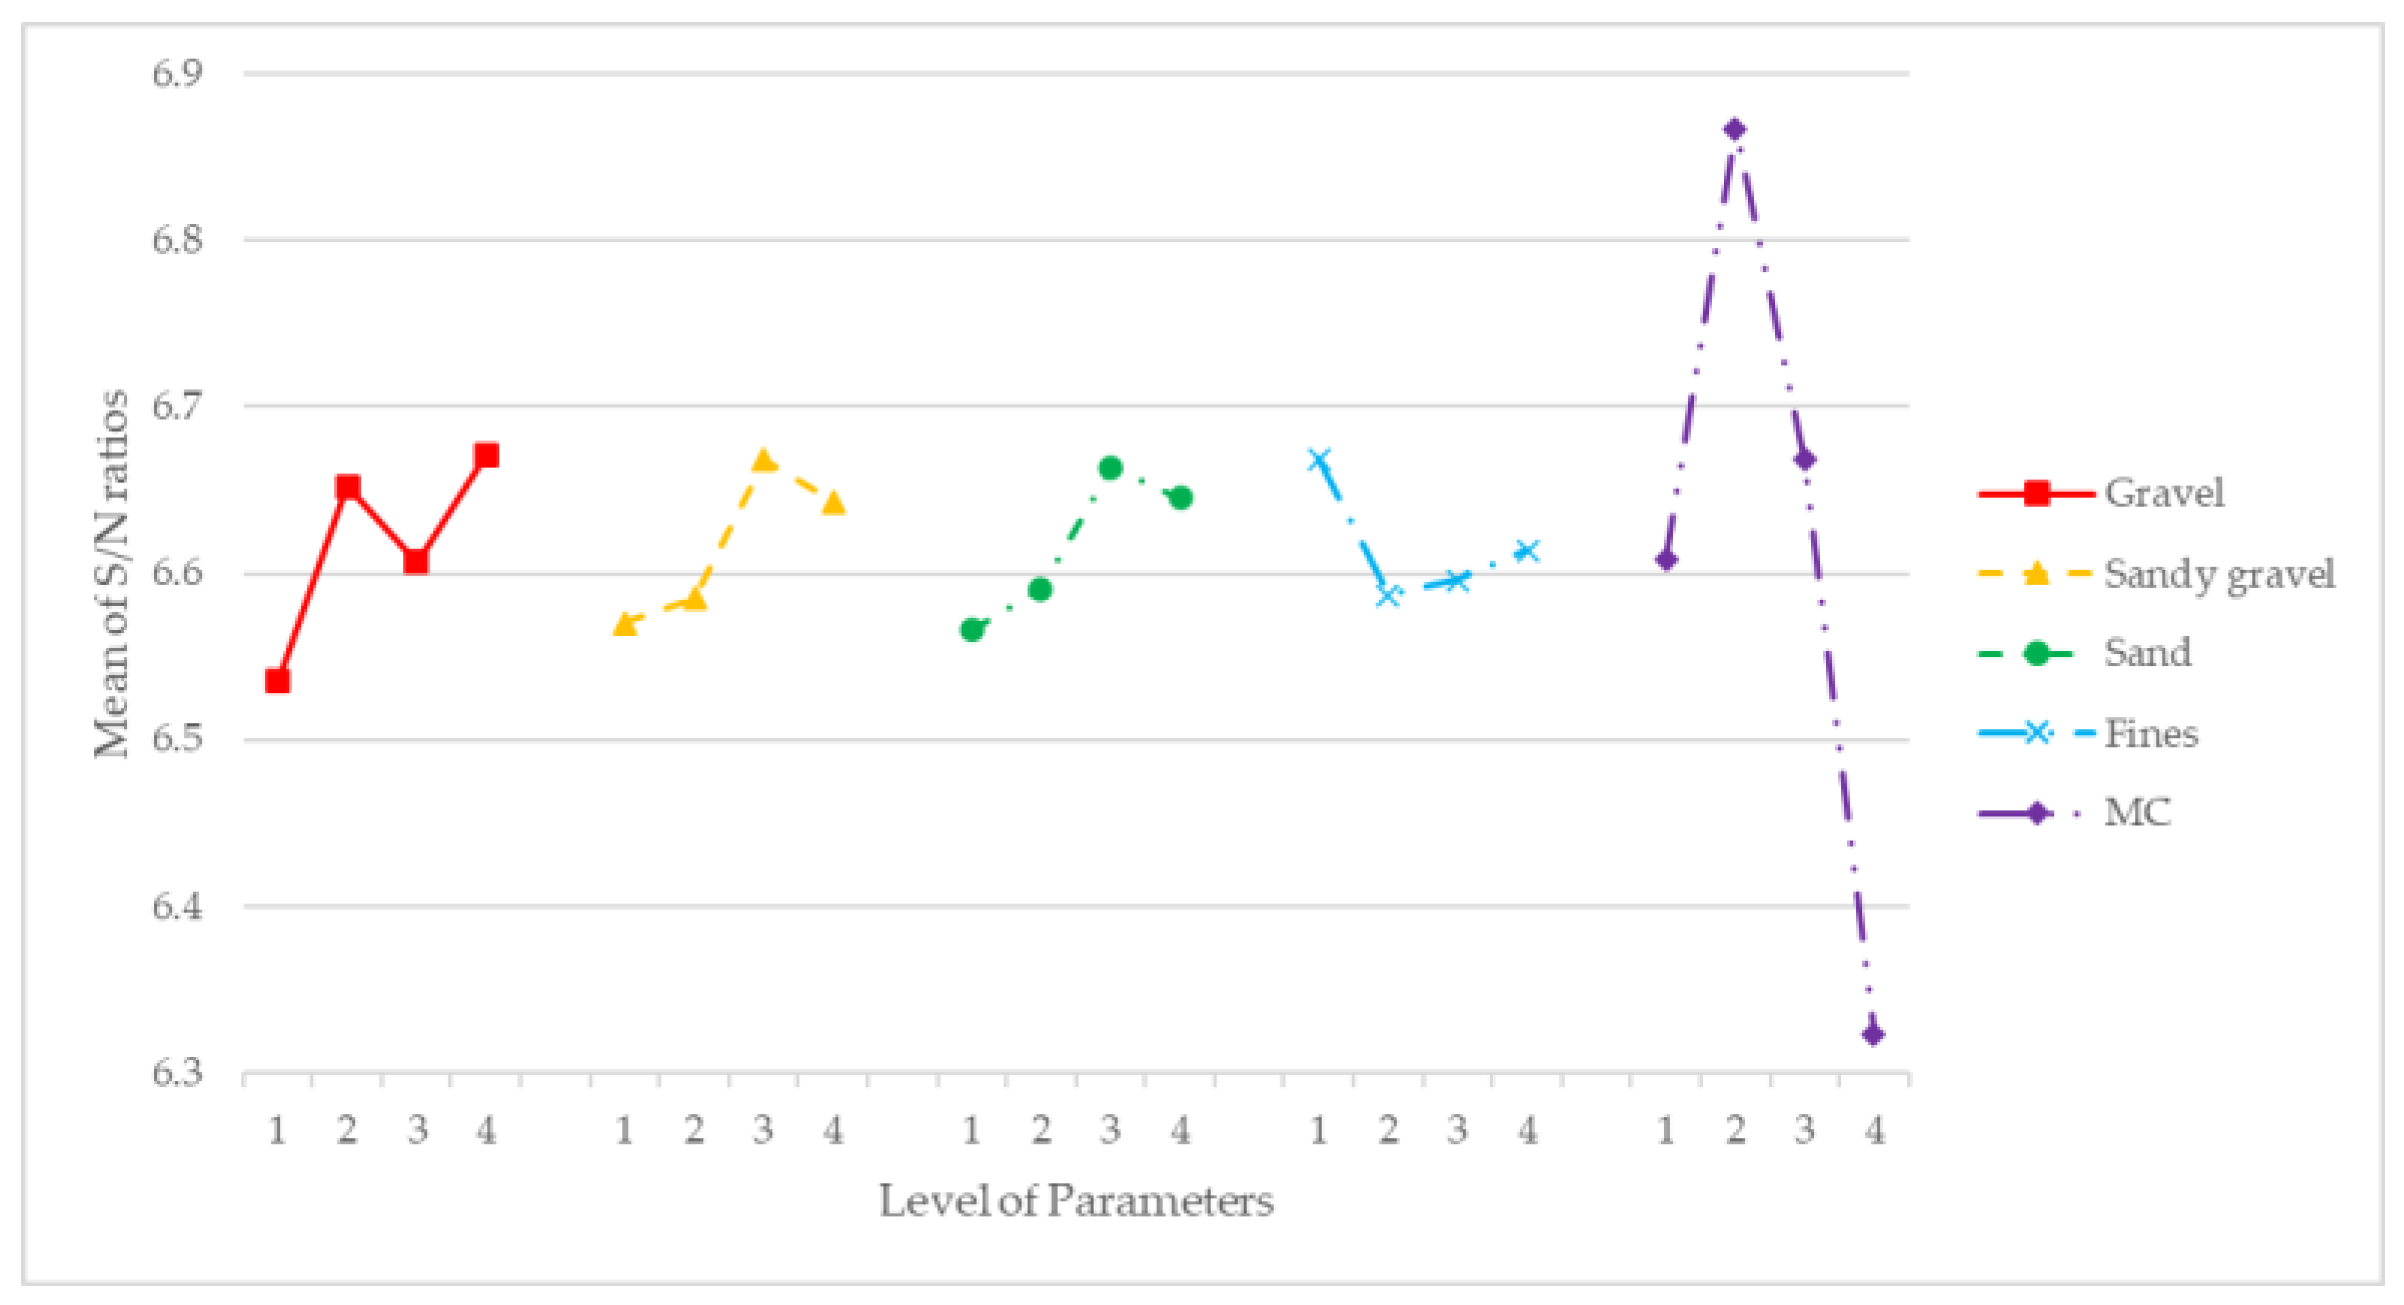
Figure 5.
The main effects for dry density mean of each factor: gravel, sandy gravel, sand, fines and MC.
Figure 5.
The main effects for dry density mean of each factor: gravel, sandy gravel, sand, fines and MC.
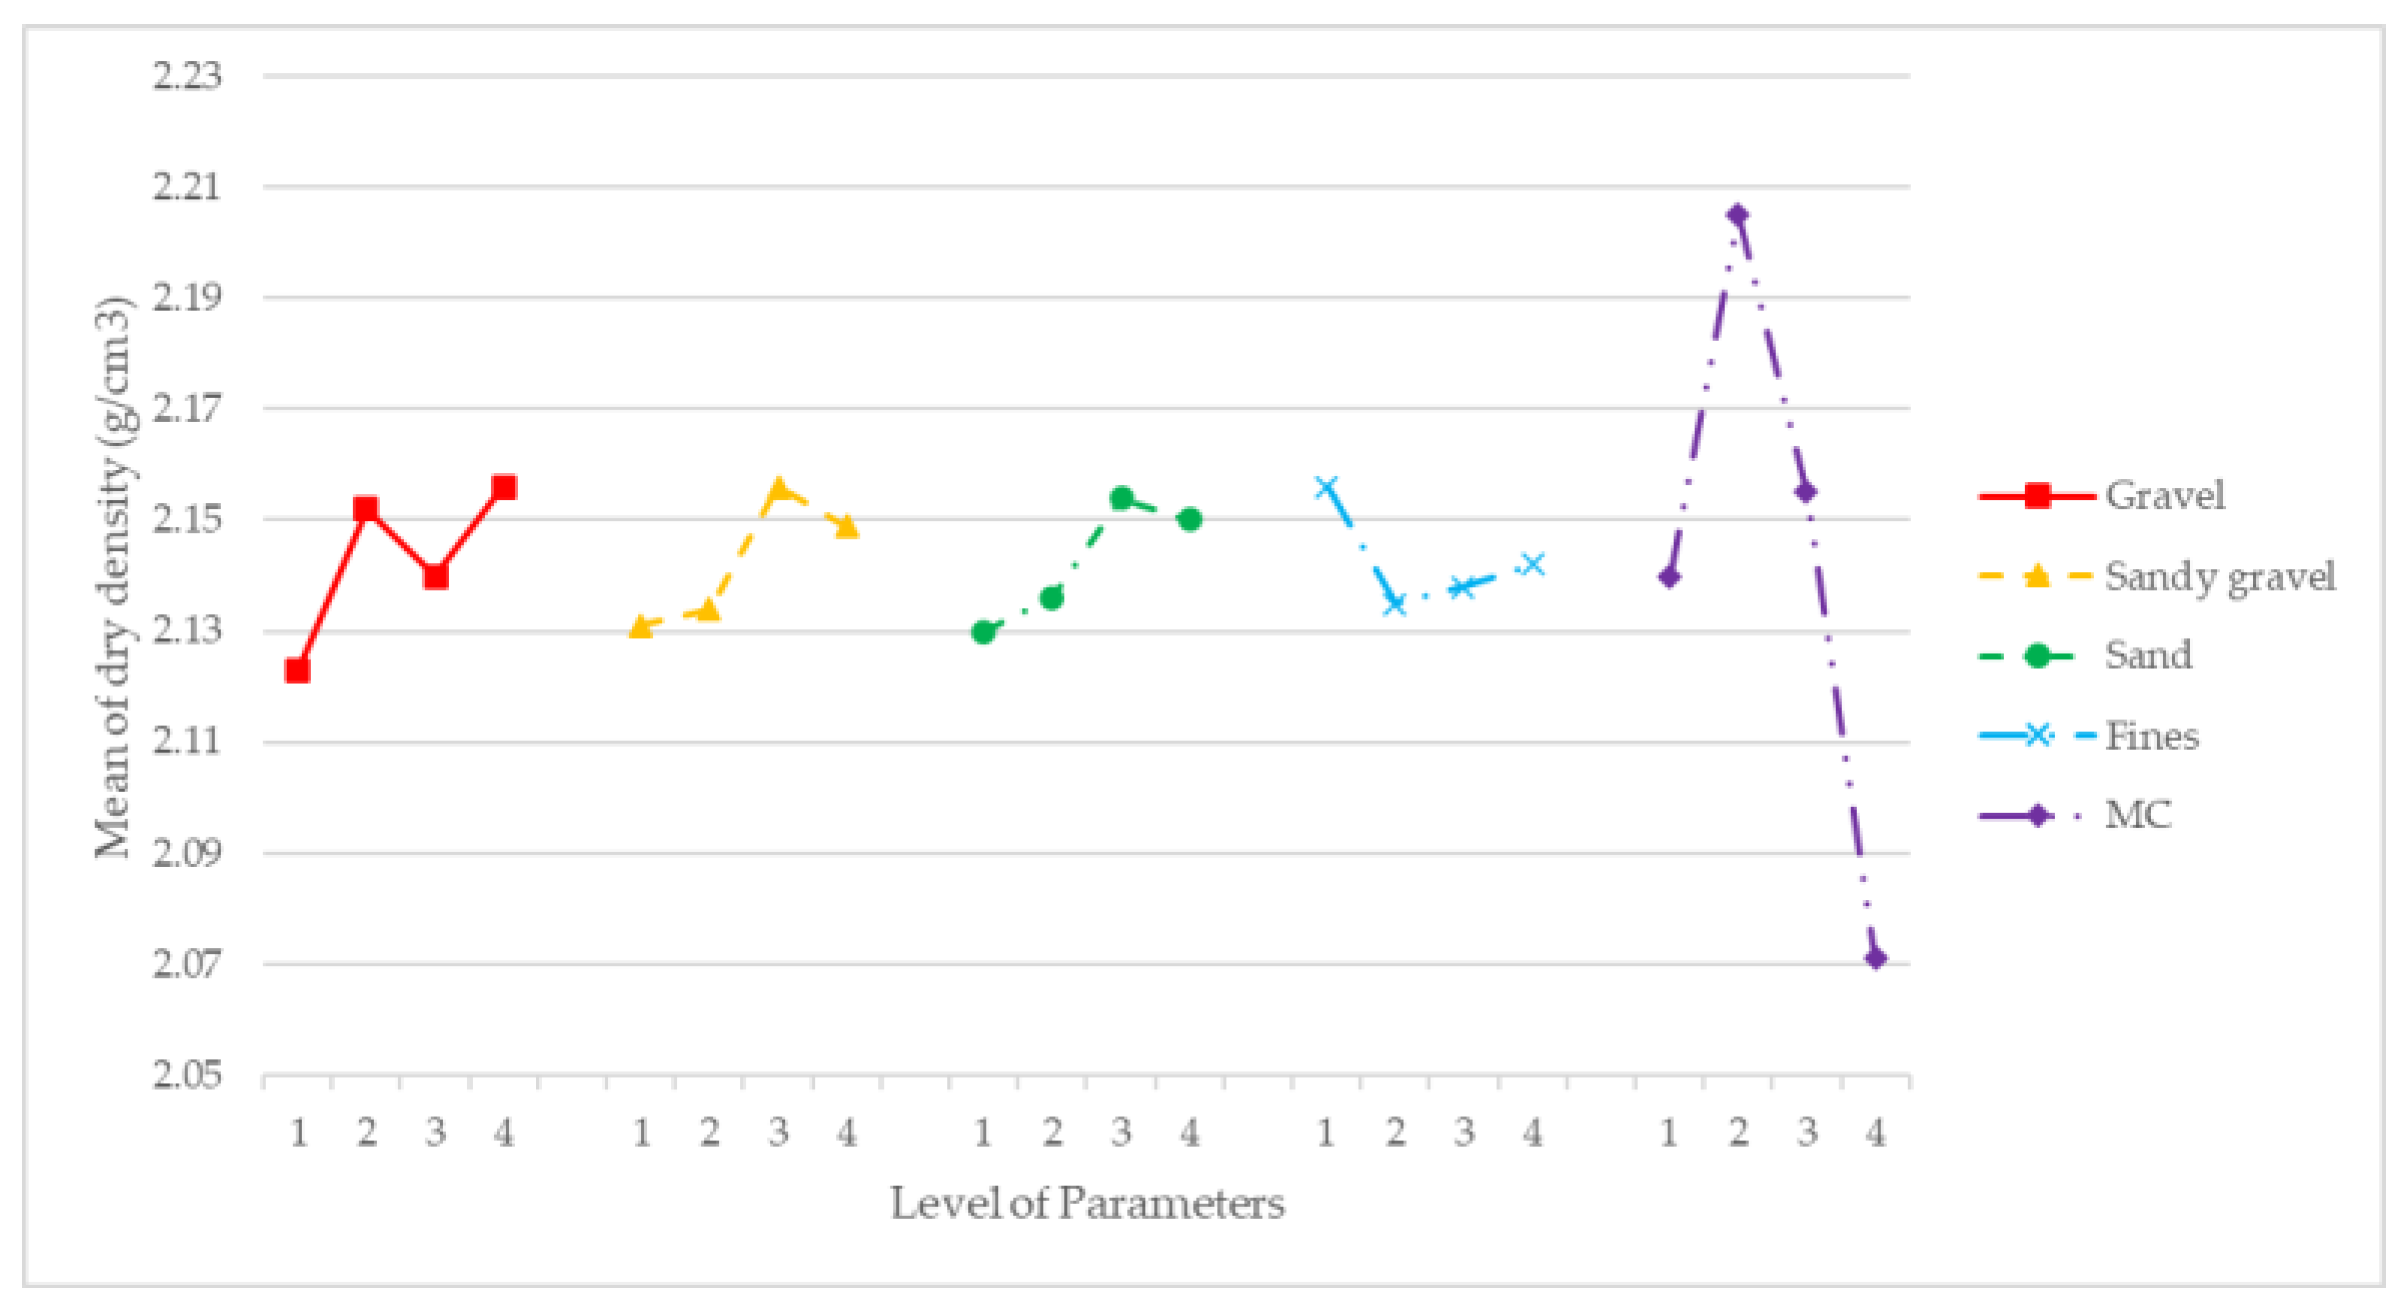
Figure 6.
Main effects of SN ratio for each factor: gravel, sandy gravel, sand, fines and MC.
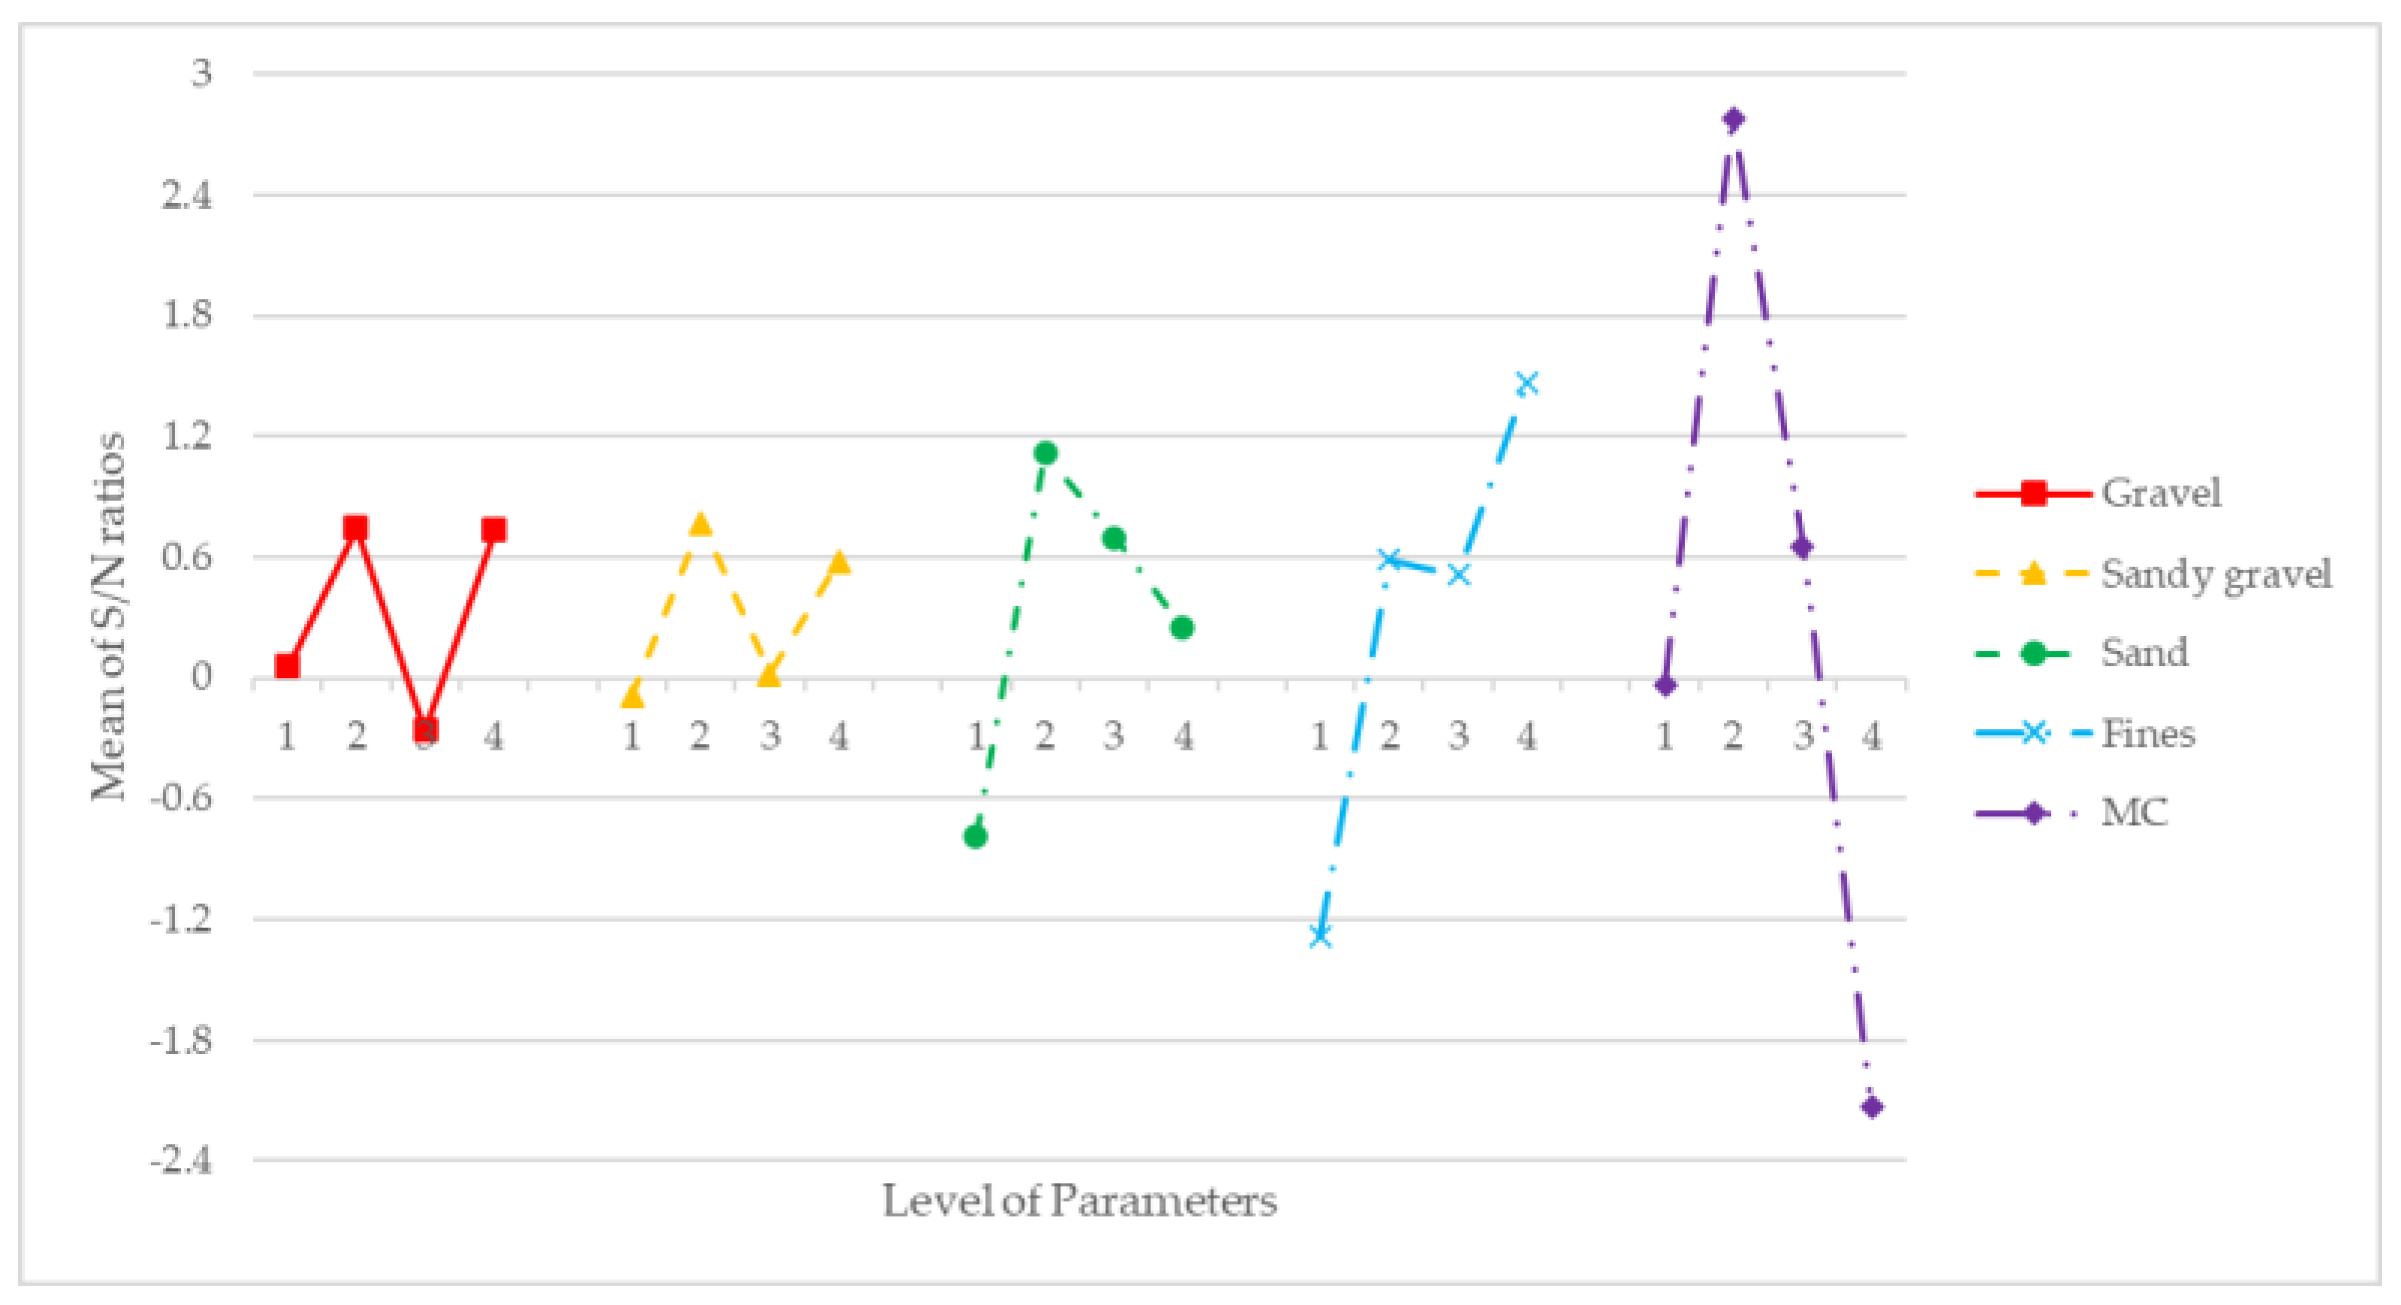
Figure 7.
Main effects for UCS mean of each factor: gravel, sandy gravel, sand, fines and MC.
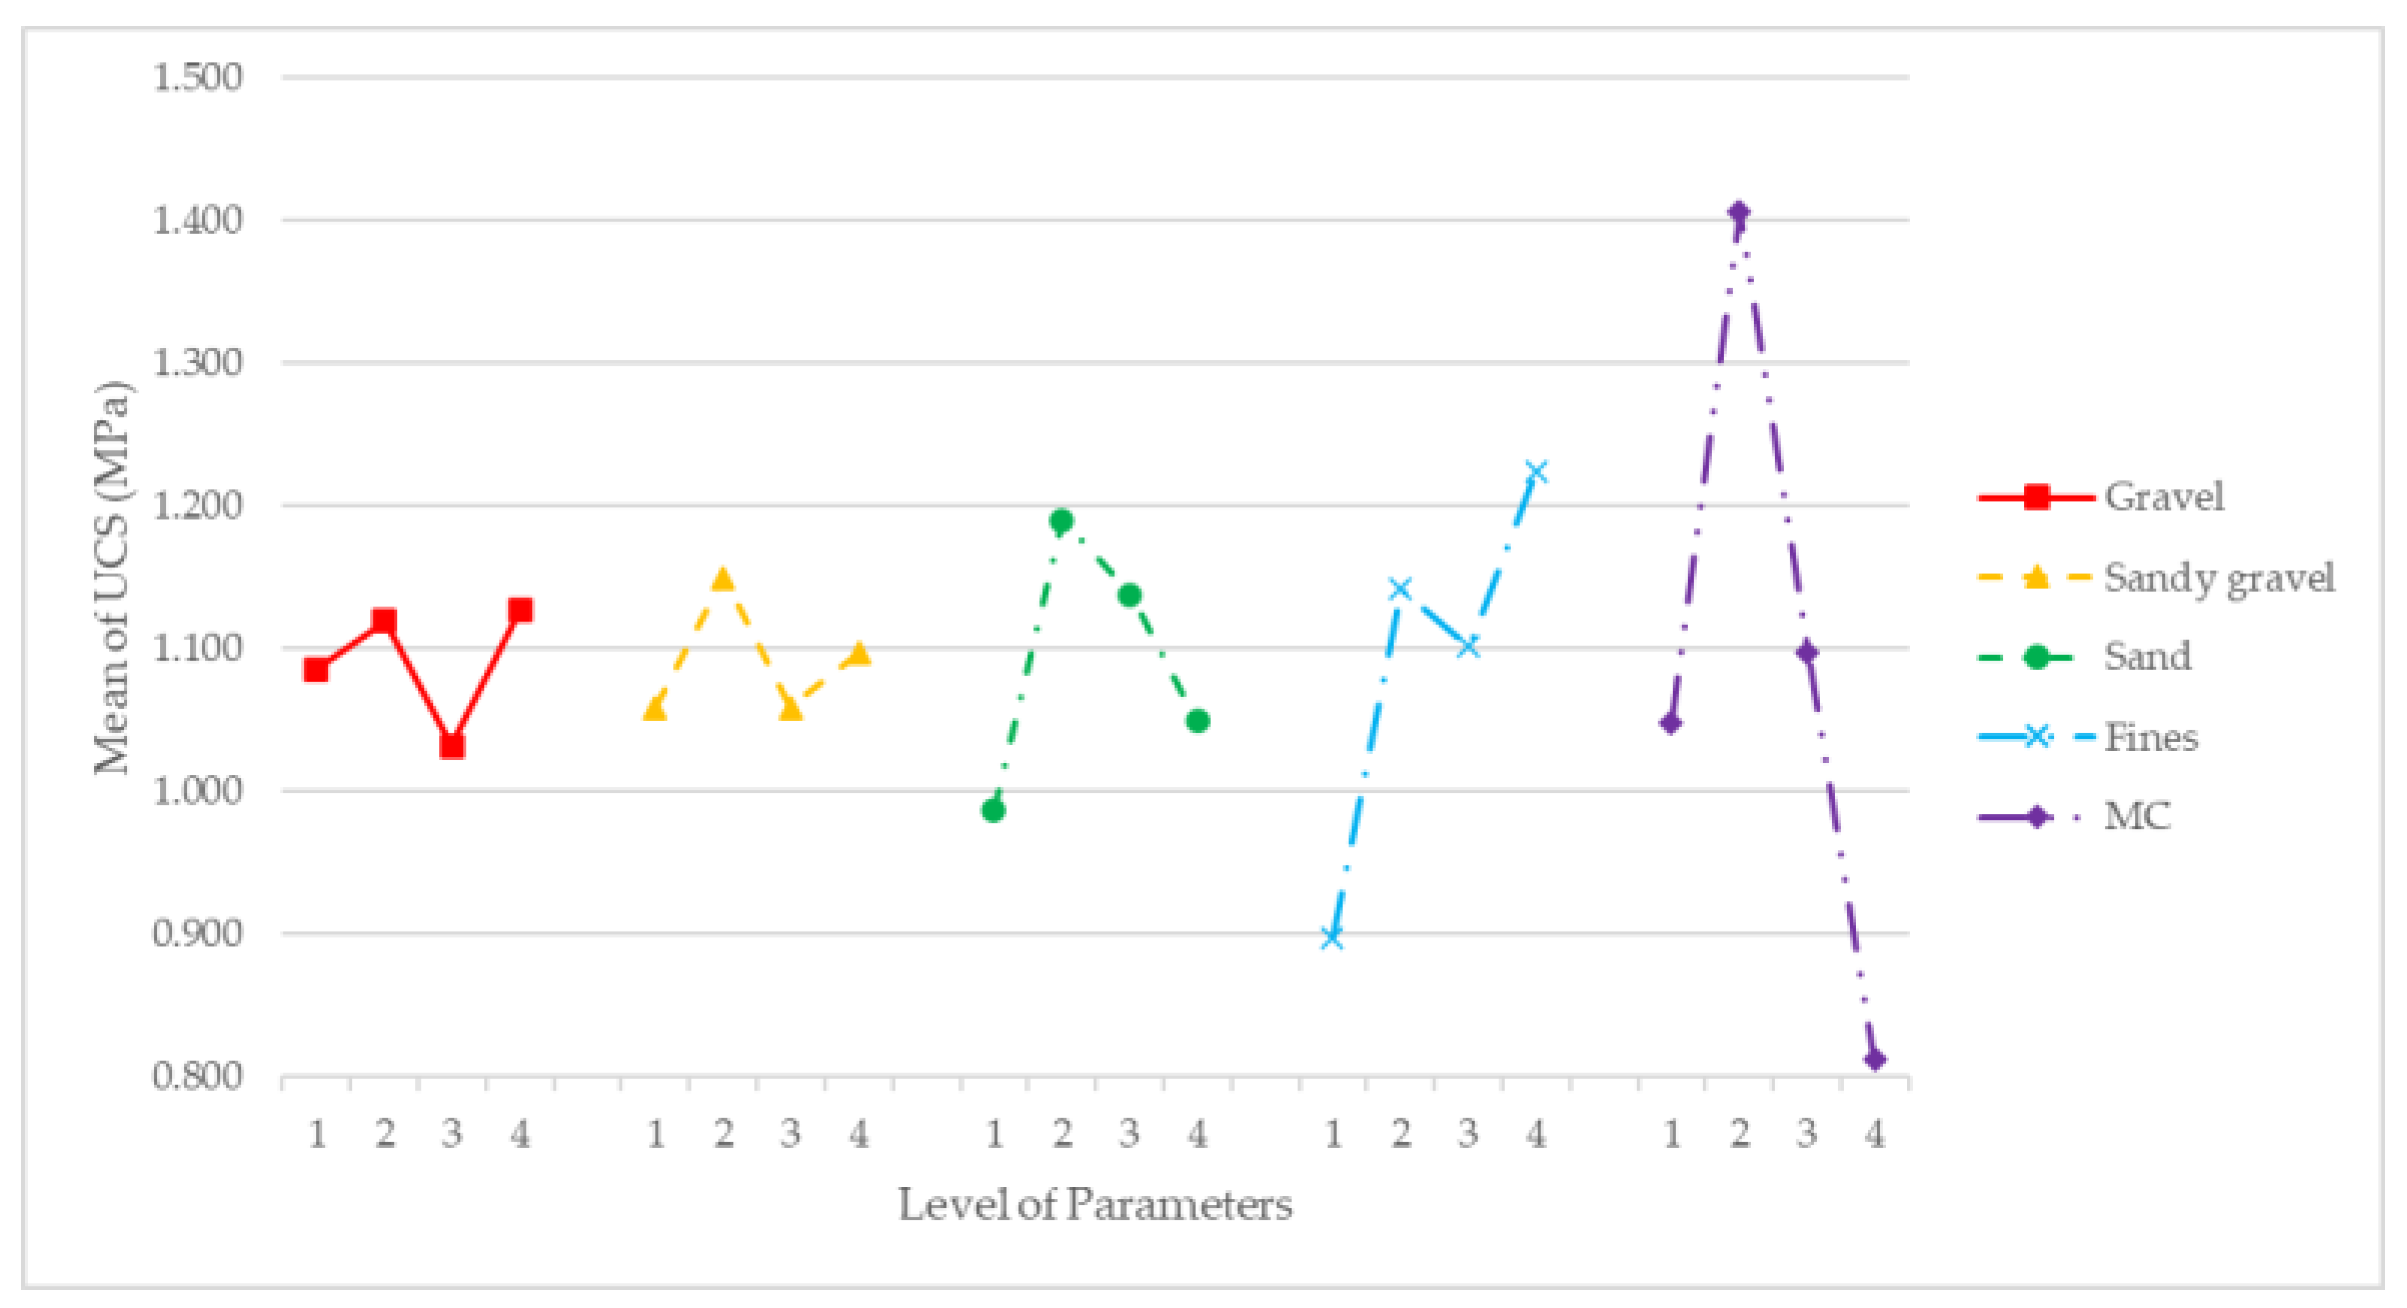

Table 1.
Bulk density of the considered materials.
| Material | Bulk Density (g/cm3) |
|---|---|
| Gravel | 1.62 |
| Sandy Gravel | 1.49 |
| Sand | 1.50 |
| Fines | 0.87 |
Table 2.
Parameters and their variation levels considered for the Taguchi method.
| Parameters | Level 1 | Level 2 | Level 3 | Level 4 |
|---|---|---|---|---|
| Gravel | 12.0 | 14.0 | 16.0 | 18.0 |
| Sandy gravel | 20.0 | 23.3 | 26.6 | 30.0 |
| Sand | 24.0 | 28.0 | 32.0 | 36.0 |
| Fine | 24.0 | 28.0 | 32.0 | 36.0 |
| MC | 6 | 8 | 10 | 12 |
Table 3.
L16 standard OA.
| Experiment nº | Gravel | Sandy gravel | Sand | Fines | MC |
|---|---|---|---|---|---|
| 1 2 3 |
1 | 1 | 1 | 1 | 1 |
| 1 | 2 | 2 | 2 | 2 | |
| 1 | 3 | 3 | 3 | 3 | |
| 4 5 |
1 | 4 | 4 | 4 | 4 |
| 2 | 1 | 2 | 3 | 4 | |
| 6 7 8 9 |
2 | 2 | 1 | 4 | 3 |
| 2 | 3 | 4 | 1 | 2 | |
| 2 | 4 | 3 | 2 | 1 | |
| 3 | 1 | 3 | 4 | 2 | |
| 10 11 |
3 | 2 | 4 | 3 | 1 |
| 3 | 3 | 1 | 2 | 4 | |
| 12 | 3 | 4 | 2 | 1 | 3 |
| 13 | 4 | 1 | 4 | 2 | 3 |
| 14 | 4 | 2 | 3 | 1 | 4 |
| 15 | 4 | 3 | 2 | 4 | 1 |
| 16 | 4 | 4 | 1 | 3 | 2 |
Table 4.
Composition of by-products mix of each combination.
| Combination | Gravel | Sandy Gravel | Sand | Fines | MC | Gravel | Sandy Gravel | Sand | Fines | MC |
|---|---|---|---|---|---|---|---|---|---|---|
| (dry mass unit) | % | (mass percentage) | % | |||||||
| L01 L02 L03 |
12.0 | 20.0 | 24.0 | 24.0 | 6 | 15.0 | 25.0 | 30.0 | 30.0 | 6 |
| 12.0 | 23.3 | 28.0 | 28.0 | 8 | 13.1 | 25.5 | 30.7 | 30.7 | 8 | |
| 12.0 | 26.6 | 32.0 | 32.0 | 10 | 11.7 | 25.9 | 31.2 | 31.2 | 10 | |
| L04 L05 |
12.0 | 30.0 | 36.0 | 36.0 | 12 | 10.5 | 26.3 | 31.6 | 31.6 | 12 |
| 14.0 | 20.0 | 28.0 | 32.0 | 12 | 14.9 | 21.3 | 29.8 | 34.0 | 12 | |
| L06 L07 L08 L09 |
14.0 | 23.3 | 24.0 | 36.0 | 10 | 14.4 | 23.9 | 24.7 | 37.0 | 10 |
| 14.0 | 26.6 | 36.0 | 24.0 | 8 | 13.9 | 26.4 | 35.8 | 23.9 | 8 | |
| 14.0 | 30.0 | 32.0 | 28.0 | 6 | 13.5 | 28.8 | 30.8 | 26.9 | 6 | |
| 16.0 | 20.0 | 32.0 | 36.0 | 8 | 15.4 | 19.2 | 30.8 | 34.6 | 8 | |
| L10 L11 |
16.0 | 23.3 | 36.0 | 32.0 | 6 | 14.9 | 21.7 | 33.6 | 29.8 | 6 |
| 16.0 | 26.6 | 24.0 | 28.0 | 12 | 16.9 | 28.1 | 25.4 | 29.6 | 12 | |
| L12 | 16.0 | 30.0 | 28.0 | 24.0 | 10 | 16.3 | 30.6 | 28.6 | 24.5 | 10 |
| L13 | 18.0 | 20.0 | 36.0 | 28.0 | 10 | 17.6 | 19.6 | 35.3 | 27.5 | 10 |
| L14 | 18.0 | 23.3 | 32.0 | 24.0 | 12 | 18.5 | 23.9 | 32.9 | 24.7 | 12 |
| L15 | 18.0 | 26.6 | 28.0 | 36.0 | 6 | 16.6 | 24.5 | 25.8 | 33.1 | 6 |
| L16 | 18.0 | 30.0 | 24.0 | 21.0 | 8 | 17.3 | 28.8 | 23.1 | 30.8 | 8 |
Table 5.
Dry Density of the tested combinations.
| Combination | Dry Density (g/cm3) | ||||
|---|---|---|---|---|---|
| S1 | S2 | S3 | Mean | Dev. (s) | |
| L01 | 2.105 | 2.098 | 2.125 | 2.109 | 0.014 |
| L02 | 2.160 | 2.161 | 2.167 | 2.163 | 0.004 |
| L03 | 2.150 | 2.161 | 2.153 | 2.155 | 0.006 |
| L04 | 2.054 | 2.070 | 2.069 | 2.064 | 0.009 |
| L05 L06 L07 L08 |
2.053 | 2.057 | 2.062 | 2.057 | 0.005 |
| 2.139 | 2.147 | 2.142 | 2.143 | 0.004 | |
| 2.258 | 2.244 | 2.241 | 2.248 | 0.009 | |
| 2.160 | 2.168 | 2.151 | 2.160 | 0.009 | |
| L09 L10 |
2.211 | 2.202 | 2.193 | 2.202 | 0.009 |
| 2.116 | 2.135 | 2.144 | 2.132 | 0.014 | |
| L11 | 2.072 | 2.058 | 2.055 | 2.062 | 0.009 |
| L12 | 2.176 | 2.157 | 2.164 | 2.166 | 0.010 |
| L13 | 2.162 | 2.165 | 2.144 | 2.157 | 0.011 |
| L14 | 2.110 | 2.099 | 2.092 | 2.100 | 0.009 |
| L15 | 2.160 | 2.150 | 2.168 | 2.159 | 0.009 |
| L16 | 2.215 | 2.201 | 2.206 | 2.207 | 0.007 |
Table 6.
Response for signal-to-noise ratios applied to dry density. Equation (1).
| Level | Gravel | Sandy gravel | Sand | Fine | MC |
|---|---|---|---|---|---|
| 1 | 6.536 | 6.57 | 6.566 | 6.669 | 6.608 |
| 2 | 6.652 | 6.585 | 6.591 | 6.587 | 6.867 |
| 3 | 6.607 | 6.668 | 6.664 | 6.596 | 6.669 |
| 4 | 6.671 | 6.643 | 6.645 | 6.614 | 6.323 |
| Delta | 0.135 | 0.098 | 0.098 | 0.081 | 0.544 |
| Influence | 2 | 4 | 3 | 5 | 1 |
Table 7.
Mean response of dry density.
| Level | Gravel | Sandy gravel | Sand | Fine | MC |
|---|---|---|---|---|---|
| 1 | 2.123 | 2.131 | 2.13 | 2.156 | 2.14 |
| 2 | 2.152 | 2.134 | 2.136 | 2.135 | 2.205 |
| 3 | 2.14 | 2.156 | 2.154 | 2.138 | 2.155 |
| 4 | 2.156 | 2.149 | 2.15 | 2.142 | 2.071 |
| Delta | 0.033 | 0.024 | 0.024 | 0.021 | 0.134 |
| Influence | 2 | 3 | 4 | 5 | 1 |
Table 8.
Unconfined Compressive Strength of the combinations tested.
| Combination | UCS (MPa) | ||||
|---|---|---|---|---|---|
| S1 | S2 | S3 | Mean | Dev. (s) | |
| L01 | 0.710 | 0.550 | 0.880 | 0.713 | 0.165 |
| L02 | 1.420 | 1.650 | 1.760 | 1.610 | 0.173 |
| L03 | 1.170 | 1.280 | 0.900 | 1.117 | 0.196 |
| L04 | 0.820 | 1.060 | 0.830 | 0.903 | 0.136 |
| L05 L06 L07 L08 |
1.100 | 0.920 | 0.730 | 0.917 | 0.185 |
| 1.190 | 1.360 | 1.090 | 1.213 | 0.137 | |
| 1.320 | 1.080 | 1.100 | 1.167 | 0.133 | |
| 1.360 | 1.100 | 1.080 | 1.180 | 0.156 | |
| L09 L10 |
1.280 | 1.670 | 1.530 | 1.493 | 0.198 |
| 0.860 | 1.140 | 1.050 | 1.017 | 0.143 | |
| L11 | 0.720 | 0.530 | 0.750 | 0.667 | 0.119 |
| L12 | 1.010 | 0.900 | 0.940 | 0.950 | 0.056 |
| L13 | 1.050 | 1.070 | 1.210 | 1.110 | 0.087 |
| L14 | 0.820 | 0.790 | 0.670 | 0.760 | 0.079 |
| L15 | 1.230 | 1.150 | 1.470 | 1.283 | 0.167 |
| L16 | 1.460 | 1.210 | 1.390 | 1.353 | 0.129 |
Table 9.
Response for signal-to-noise ratios applied to UCS. Equation (1).
| Level | Gravel | Sandy gravel | Sand | Fine | MC |
|---|---|---|---|---|---|
| 1 | 0.055 | -0.089 | -0.784 | -1.284 | -0.031 |
| 2 | 0.746 | 0.769 | 1.116 | 0.586 | 2.783 |
| 3 | -0.259 | 0.021 | 0.700 | 0.511 | 0.654 |
| 4 | 0.736 | 0.577 | 0.247 | 1.466 | -2.127 |
| Delta | 1.005 | 0.858 | 1.900 | 2.751 | 4.910 |
| Influence | 4 | 5 | 3 | 2 | 1 |
Table 10.
Mean response for UCS.
| Level | Gravel | Sandy gravel | Sand | Fine | MC |
|---|---|---|---|---|---|
| 1 | 1.086 | 1.058 | 0.987 | 0.898 | 1.048 |
| 2 | 1.119 | 1.150 | 1.190 | 1.142 | 1.406 |
| 3 | 1.032 | 1.058 | 1.138 | 1.101 | 1.098 |
| 4 | 1.127 | 1.097 | 1.049 | 1.223 | 0.812 |
| Delta | 0.095 | 0.092 | 0.203 | 0.326 | 0.594 |
| Influence | 4 | 5 | 3 | 2 | 1 |
Table 11.
Dry density and UCS predicted and obtained values for the combination that enhances the dry density.
Table 11.
Dry density and UCS predicted and obtained values for the combination that enhances the dry density.
| Combination | DRY DENSITY (g/cm3) | |||||
|---|---|---|---|---|---|---|
| Dry Density | S1 | S2 | S3 | Mean | Dev. (s) | Predicted |
| 2.243 | 2.280 | 2.264 | 2.262 | 0.019 | 2.256 | |
| UCS (MPa) | ||||||
| S1 | S2 | S3 | Mean | Dev. (s) | Predicted | |
| 1.31 | 1.50 | 1.38 | 1.40 | 0.10 | 1.26 | |
Table 12.
Dry density and UCS predicted and obtained values for the combination that enhances the dry density.
Table 12.
Dry density and UCS predicted and obtained values for the combination that enhances the dry density.
| Combination | DRY DENSITY (g/cm3) | |||||
|---|---|---|---|---|---|---|
| UCS | S1 | S2 | S3 | Mean | Dev. (s) | Predicted |
| 2.213 | 2.182 | 2.190 | 2.195 | 0.016 | 2.203 | |
| UCS (MPa) | ||||||
| S1 | S2 | S3 | Mean | Dev. (s) | Predicted | |
| 1.98 | 1.83 | 1.93 | 1.91 | 0.08 | 1.73 | |
Disclaimer/Publisher’s Note: The statements, opinions and data contained in all publications are solely those of the individual author(s) and contributor(s) and not of MDPI and/or the editor(s). MDPI and/or the editor(s) disclaim responsibility for any injury to people or property resulting from any ideas, methods, instructions or products referred to in the content. |
© 2024 by the authors. Licensee MDPI, Basel, Switzerland. This article is an open access article distributed under the terms and conditions of the Creative Commons Attribution (CC BY) license (http://creativecommons.org/licenses/by/4.0/).
Copyright: This open access article is published under a Creative Commons CC BY 4.0 license, which permit the free download, distribution, and reuse, provided that the author and preprint are cited in any reuse.


