
Submitted:
18 October 2024
Posted:
18 October 2024
You are already at the latest version
Abstract
Urban heat islands and rising global temperatures are increasing the need for passive cooling solutions in densely populated areas. This study examines the effectiveness of heat-reflective paint in reducing surface and indoor temperatures in a 33-year-old apartment complex in Gumi City, South Korea. Using mock structures to simulate real building conditions, the experiment measured surface and indoor temperatures in both treated and untreated groups. Data collected from thermal imaging cameras and data loggers demonstrated significant temperature reductions on the treated walls, with surface temperatures lowering by 2.2°C to 4.3°C on average, and peak reductions of up to 15.3°C. Internally, the treated structures showed temperature reductions between 2.1°C and 4.1°C, with the largest difference observed during peak heat hours at 4.14°C. The results highlight the effectiveness of heat-reflective paint in mitigating heat stress and improving indoor thermal comfort, particularly in regions with high solar exposure. Importantly, this study aims to benefit vulnerable populations, such as the elderly and economically disadvantaged residents, by providing a cost-effective, sustainable solution to reduce heat exposure in aging urban buildings, thereby enhancing their quality of life.
Keywords:
Heat-Reflective Paint
; Thermal Comfort
; Climate Change
; Energy Efficiency
1. Introduction
1.1. Background and Objectives
The impacts of climate change are felt worldwide, with phenomena such as rising average temperatures, increased extreme weather events, water shortages, and poverty manifesting differently across regions, all of which threaten the sustainability of urban environments [1]. In response, countries like the United States and Japan have implemented strategies since the early 2000s to mitigate urban heat island (UHI) effects and extreme heat waves by applying heat-mitigation technologies to artificial structures and paved surfaces [2]. These strategies are supported by empirical research and continuously evolving performance standards.
In South Korea, the Ministry of Environment has recently prioritized the application of heat-mitigation technologies, such as heat-reflective materials and coatings, to facilities and communities vulnerable to extreme heat, expanding business models in this sector. The effectiveness of these technologies is continually reviewed to enhance implementation [3]. Heat-reflective paints, in particular, have been applied to residential and public facilities, offering significant potential to improve the thermal environments of aging apartment buildings [4].
Gumi, a city facing rising temperatures and frequent heat waves, was selected as the focus of this study due to its unique climatic challenges. The chosen apartment complex is over 33 years old, with poor insulation, and houses a vulnerable population, including economically disadvantaged and elderly residents. As of August 2024, approximately half of the residents remain in the building during remodeling. Data recorded on August 21 show a minimal difference between external and internal temperatures (only 2°C), underscoring the need for effective thermal management solutions.
This study focuses on analyzing and evaluating the impact of heat-reflective paint on the indoor thermal environment of apartment buildings. Specifically, the objective is to scientifically quantify the cooling effect of heat-reflective coatings using simulated measurement equipment near the project site. The goal is to measure how reflective coatings improve the indoor thermal environment.
1.2. Previous Research
Reflective coatings play a critical role in mitigating temperature increases on building surfaces by reflecting most solar radiation, thereby reducing the indoor thermal load and lowering energy consumption [5]. Numerous studies have examined how reflective coatings and high-reflectance materials can contribute to reducing cooling demands and energy use in buildings [6].
For example, Sarah et al. (1997) [7] analyzed the long-term energy-saving effects of high-reflectance coatings on building roofs. Pisello et al. (2015) [8] investigated the chemical composition of high-reflectance coatings and proposed ways to improve building energy efficiency through their application. Haider et al. (1992) [9] explored how high-reflectance materials could help reduce energy consumption for cooling. More recently, Kim et al. (2024) [10] demonstrated methods to enhance the performance of bifacial photovoltaic systems using high-reflectance materials. Wu et al. (2023) [11] studied the effects of cooling textiles on human comfort under various climatic conditions.
Kwon et al. (2022) [3] found that in areas with combined cool roofs and cool walls, the average temperature difference between treated and untreated rooftops was between 3.0°C and 4.0°C, with rooftop air temperature differences averaging 1.7°C. Additionally, the ceiling temperature differences between treated and untreated cool walls were 1.1°C, while indoor temperature differences averaged 2.3°C, indicating a significant cooling effect in treated buildings.
Other studies have expanded on the cooling performance of reflective paints. Zinzi & Fasano (2009) [12] evaluated advanced reflective paints and their ability to reduce cooling loads and mitigate the heat island effect in urban areas. Similarly, Rawat & Singh (2022) [13] conducted a comparative review of cool roof thermal performance across various regions, further supporting the benefits of high-reflectance materials in mitigating urban heat. Monge-Barrio & Gutiérrez (2018) [14] examined passive energy strategies, emphasizing the importance of such cooling technologies for vulnerable populations.
These previous studies highlight the effectiveness of high-reflectance materials and technologies in improving both indoor and outdoor thermal environments, thereby enhancing human comfort. Furthermore, these technologies offer vital strategies for sustainable building and urban development.
2. Materials and Methods
2.1. Study Area
This study aims to evaluate the effects of applying heat-reflective paint on the external surfaces of the walls and roofs of an aging apartment complex in Gumi City. The project is funded by the Ministry of Environment and focuses on mitigating extreme heat events, which are particularly significant in Gumi, an industrial city with high energy use and greenhouse gas emissions. Located in the southeastern part of the Korean Peninsula, Gumi is vulnerable to extreme heat waves.
The selected experimental site is a 33-year-old apartment complex, currently undergoing remodeling. The complex is home to a population highly vulnerable to extreme heat due to economic and age-related factors. As of August 2024, 73.4% of the remaining 534 residents receive basic living subsidies, and 46% of the population is over 65 years old. The building’s age, poor insulation, and vulnerable residents make it an ideal site for testing heat-mitigation solutions. The Ministry of Environment’s project aims to apply heat-reflective paint to the building’s external walls and roofs, thereby reducing indoor temperatures and creating a more comfortable environment for residents. Figure 1 shows the apartment building in Gumi City prior to the application of heat-reflective paint.
2.2. Methods and Scope
Collecting long-term temperature data directly from occupied apartments posed significant challenges due to the potential disruption to residents’ daily routines and privacy concerns. As a result, a simulated approach was adopted using mock structures that were designed to replicate the environmental conditions of the apartment complex. Heat-reflective paint was applied to one mock structure placed on a nearby rooftop, allowing for controlled measurements of external surface temperature, internal surface temperature, and indoor temperature, without disturbing occupants. A second mock structure, serving as the control, was left untreated to accurately assess the impact of the heat-reflective paint on thermal comfort. This controlled experiment provided reliable data while overcoming the limitations of conducting such tests in inhabited spaces.
Other studies have employed similar mock setups to measure the effectiveness of passive cooling solutions. For example, Cotrim Pezzuto et al. (2022) [15] explored urban cooling technologies in high and low-density buildings using mock experiments to simulate real environmental conditions. Similarly, Kwon et al. (2022) [16] developed simulation equipment to measure the effects of urban shading technologies, providing valuable insights into passive cooling strategies.
Figure 2.
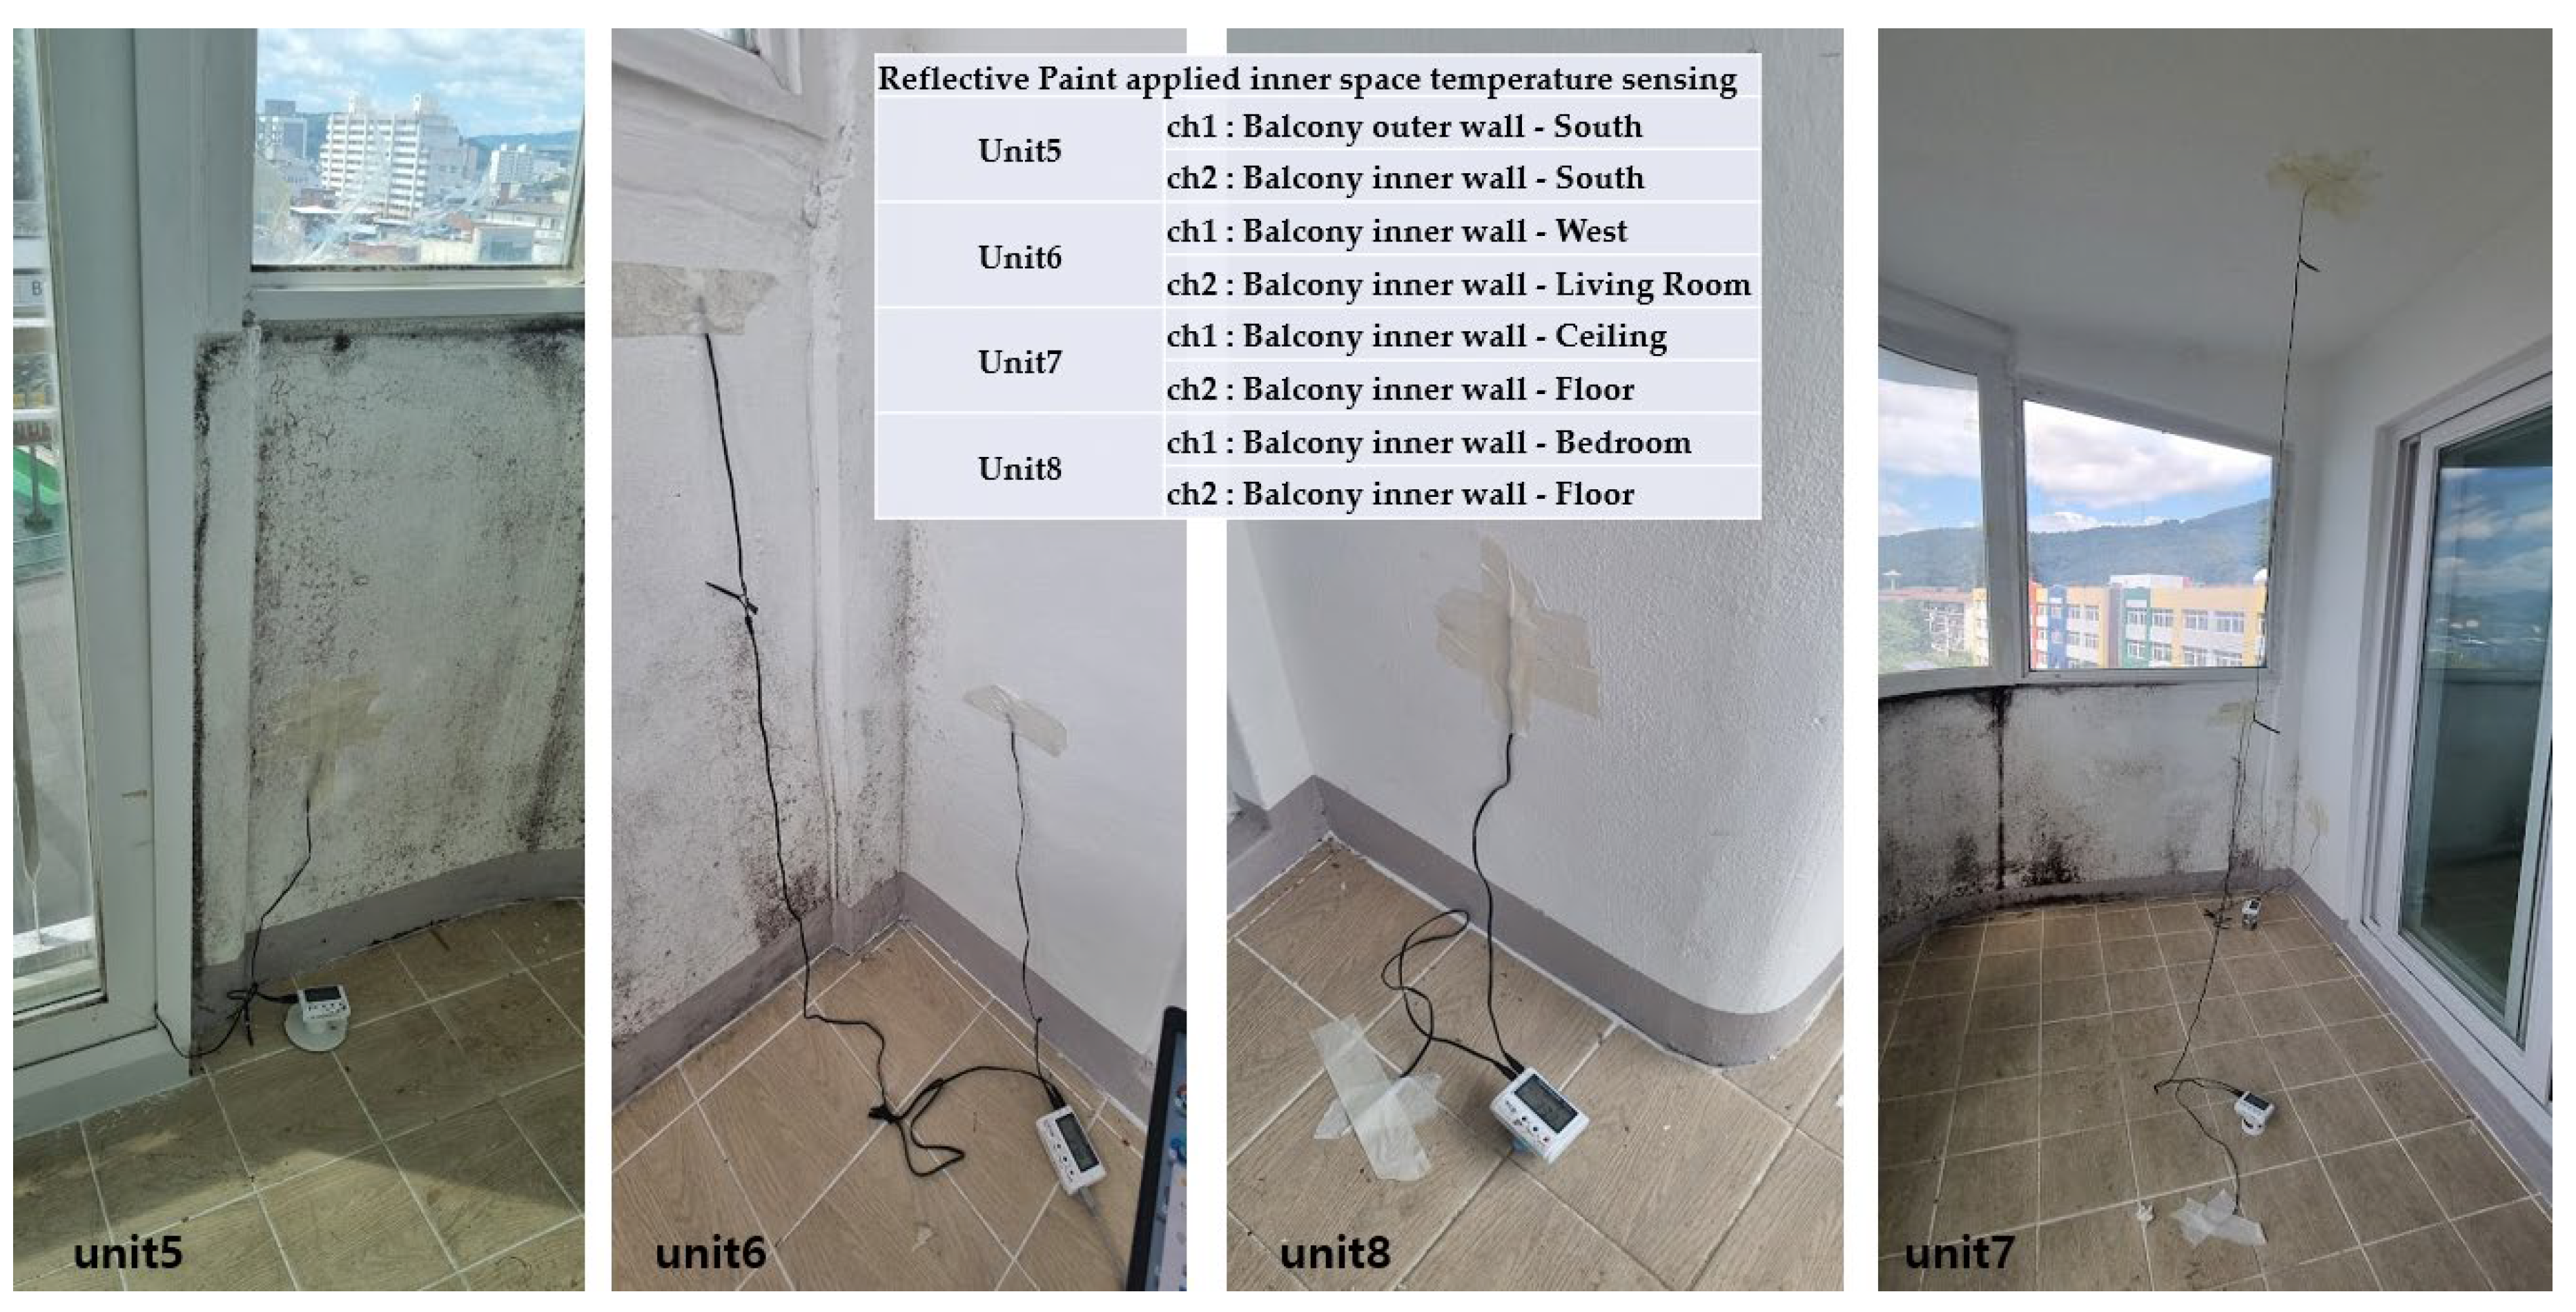
Preliminary indoor temperature measurement setup in the apartment. The measurements were challenging to conduct due to potential disturbances to the residents’ daily lives..
Figure 2.
Preliminary indoor temperature measurement setup in the apartment. The measurements were challenging to conduct due to potential disturbances to the residents’ daily lives..
2.2.1. Heat-Reflective Paint Properties
The heat-reflective(cool) paint used in this study is a water-based, eco-friendly coating with high infrared reflectance and low thermal conductivity. It contains ceramic-based insulating materials, which provide excellent thermal resistance and help reduce both external and internal surface temperatures. Specifically, the paint has a thermal conductivity of less than 0.05 W/m.K and an infrared reflectance of over 91%. The dry film thickness was maintained at 300 ± 50 µm to ensure optimal performance. These properties are crucial for reducing heat transfer into the building, thereby improving indoor thermal comfort and reducing energy consumption for cooling.
2.2.2. Mock Structure
The mock structures were designed to replicate the concrete blocks, reflective coatings, and insulation materials used in the actual apartment buildings in Gumi City. The experimental group was treated with heat-reflective paint exhibiting superior solar reflectance and low thermal conductivity. This paint was applied to both the exterior walls and roof, simulating the planned real-world application. Both mock structures were equipped with data loggers and sensors connected to a cloud server, which measured external surface temperature, internal surface temperature, indoor temperature, and real-time meteorological data. This setup allowed continuous monitoring of the effects of the heat-reflective paint on surface temperatures and indoor temperature variations during the summer.
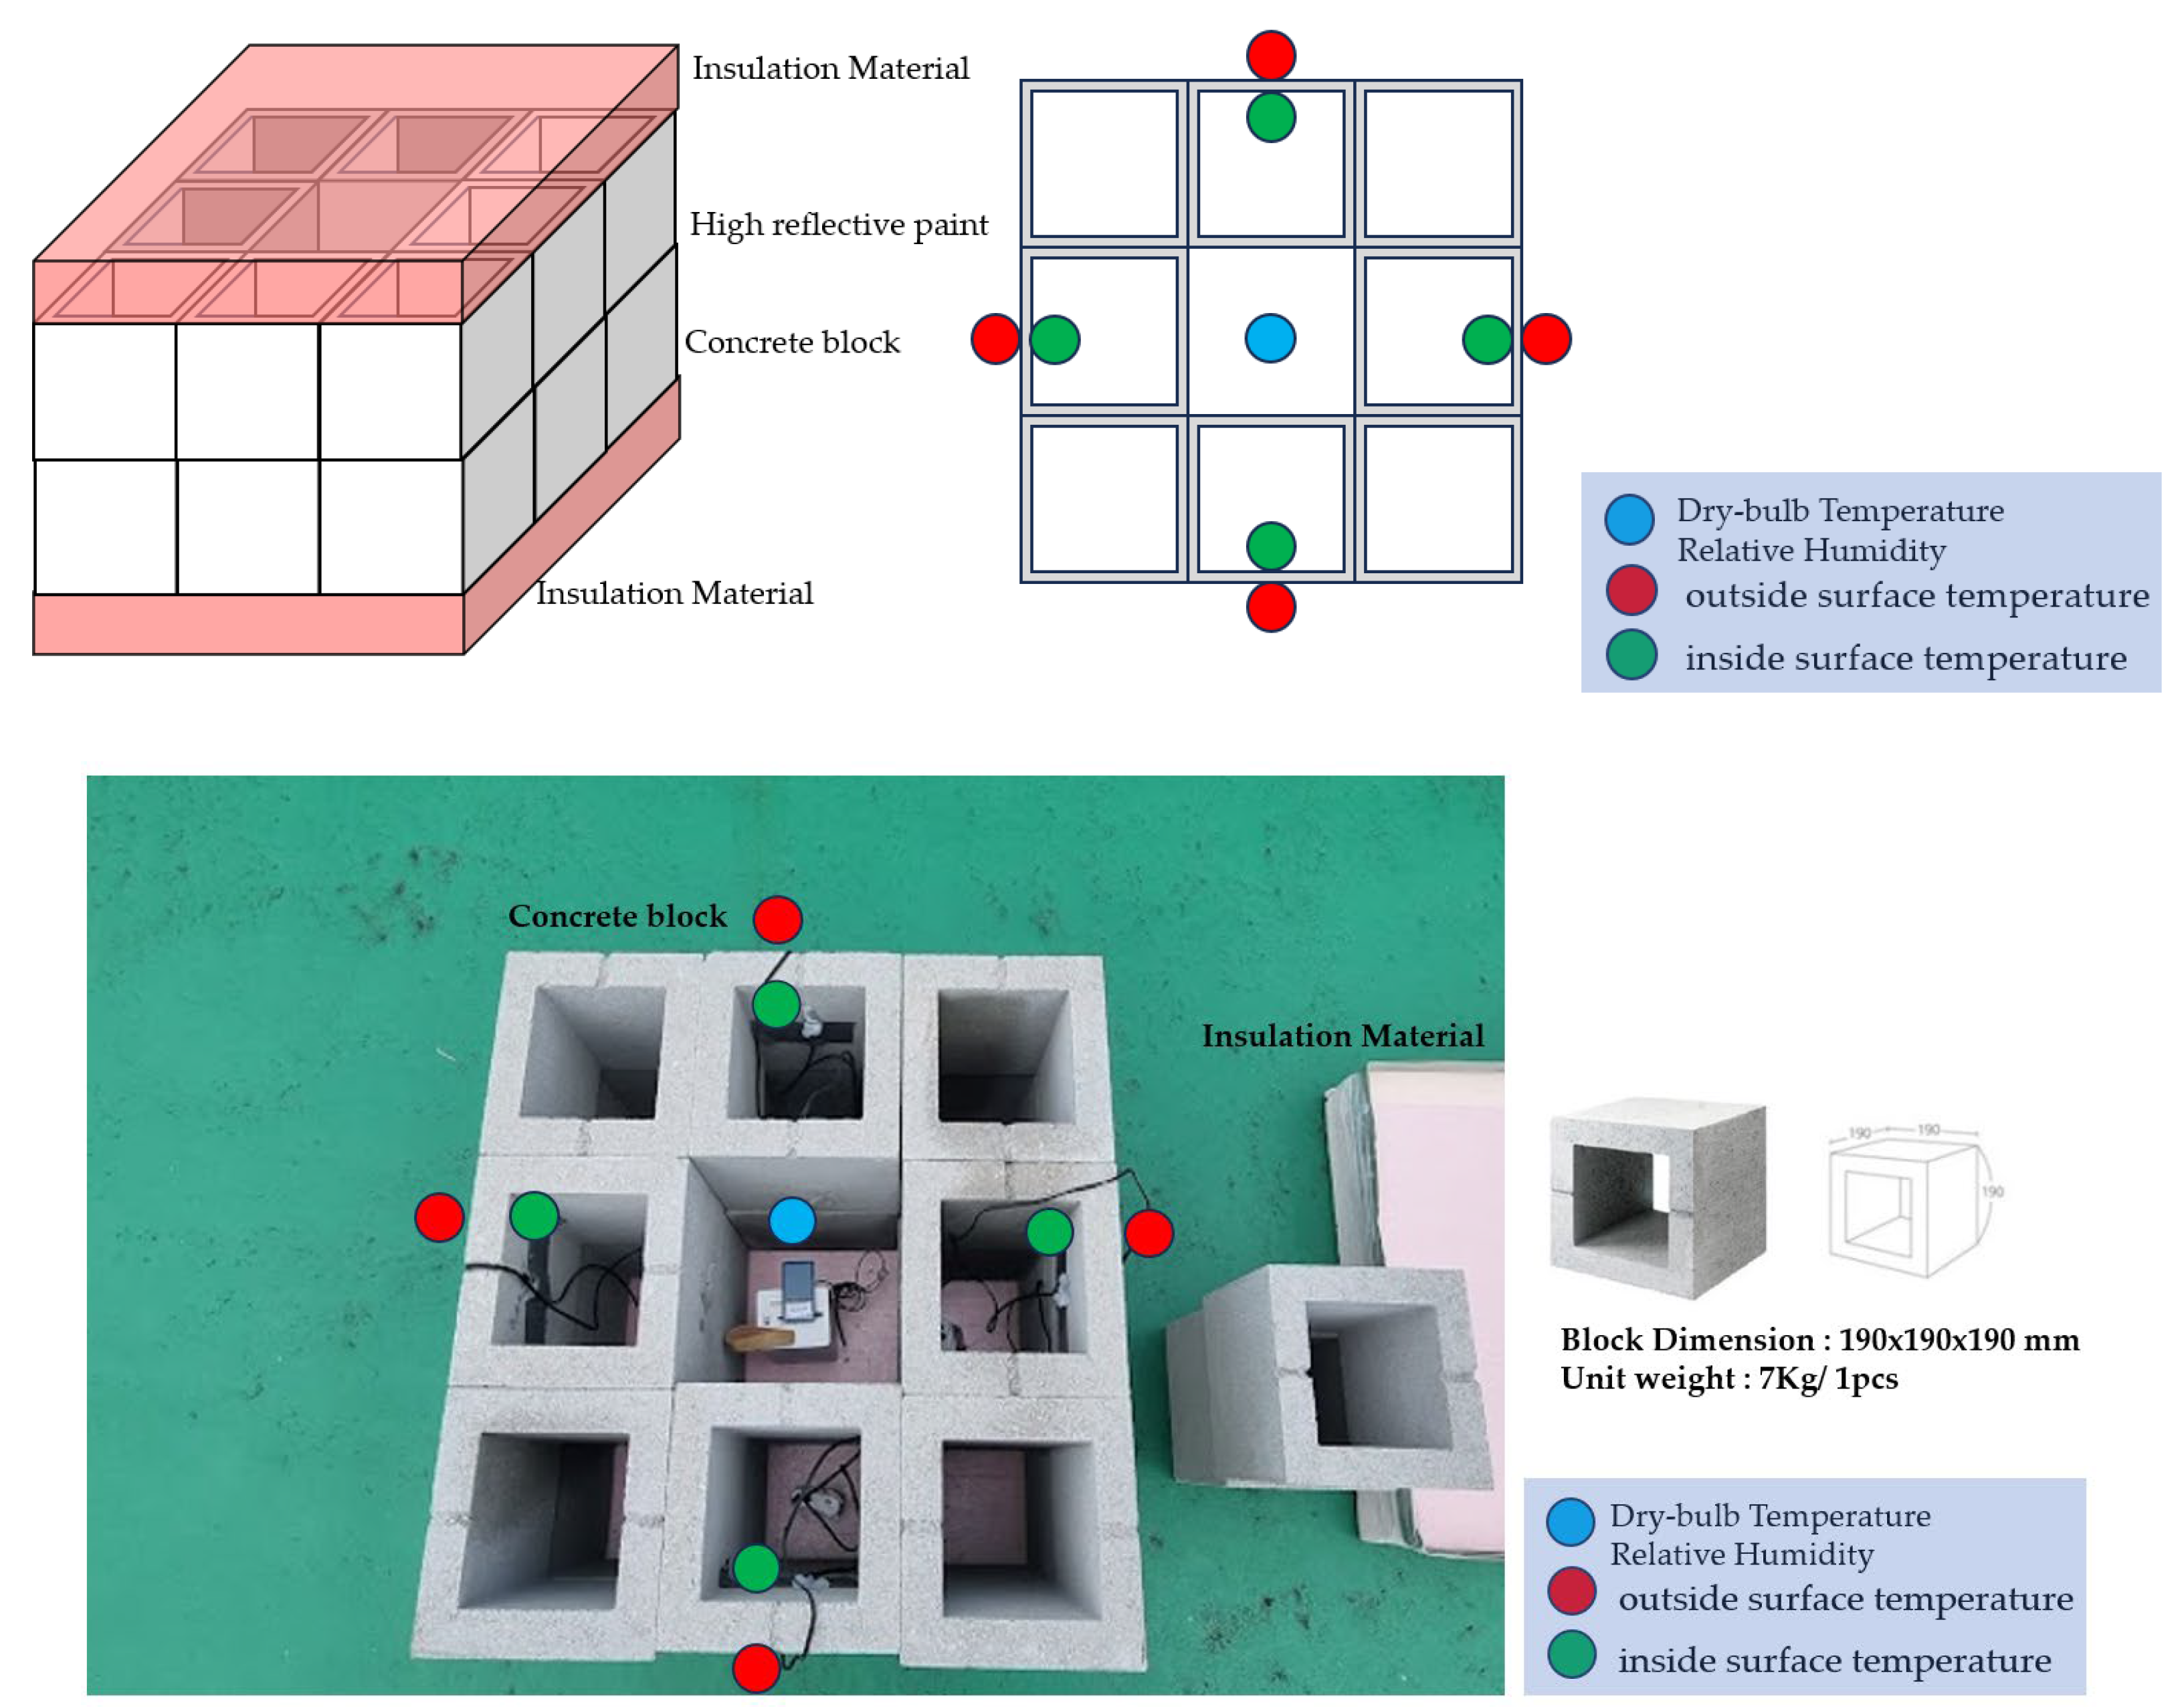
Each mock structure is built with two layers of concrete blocks. Each concrete block is cubic, with dimensions of 190 mm x 190 mm x 190 mm, and 16 blocks are used in total (8 per layer). The blocks are arranged to form one empty inner space to monitor indoor temperature and humidity. Both the control and experimental mock structures have the same design. Insulation material, 100mm thick and of dimensions 600 mm x 60 mm x 100 mm, was placed on the top and bottom sides of the mock structure to prevent heat movement through those surfaces. This setup closely replicates the external conditions of the apartment complex under study. Figure 3, Figure 5 shows the installation of mock measurement devices and detailed structure.
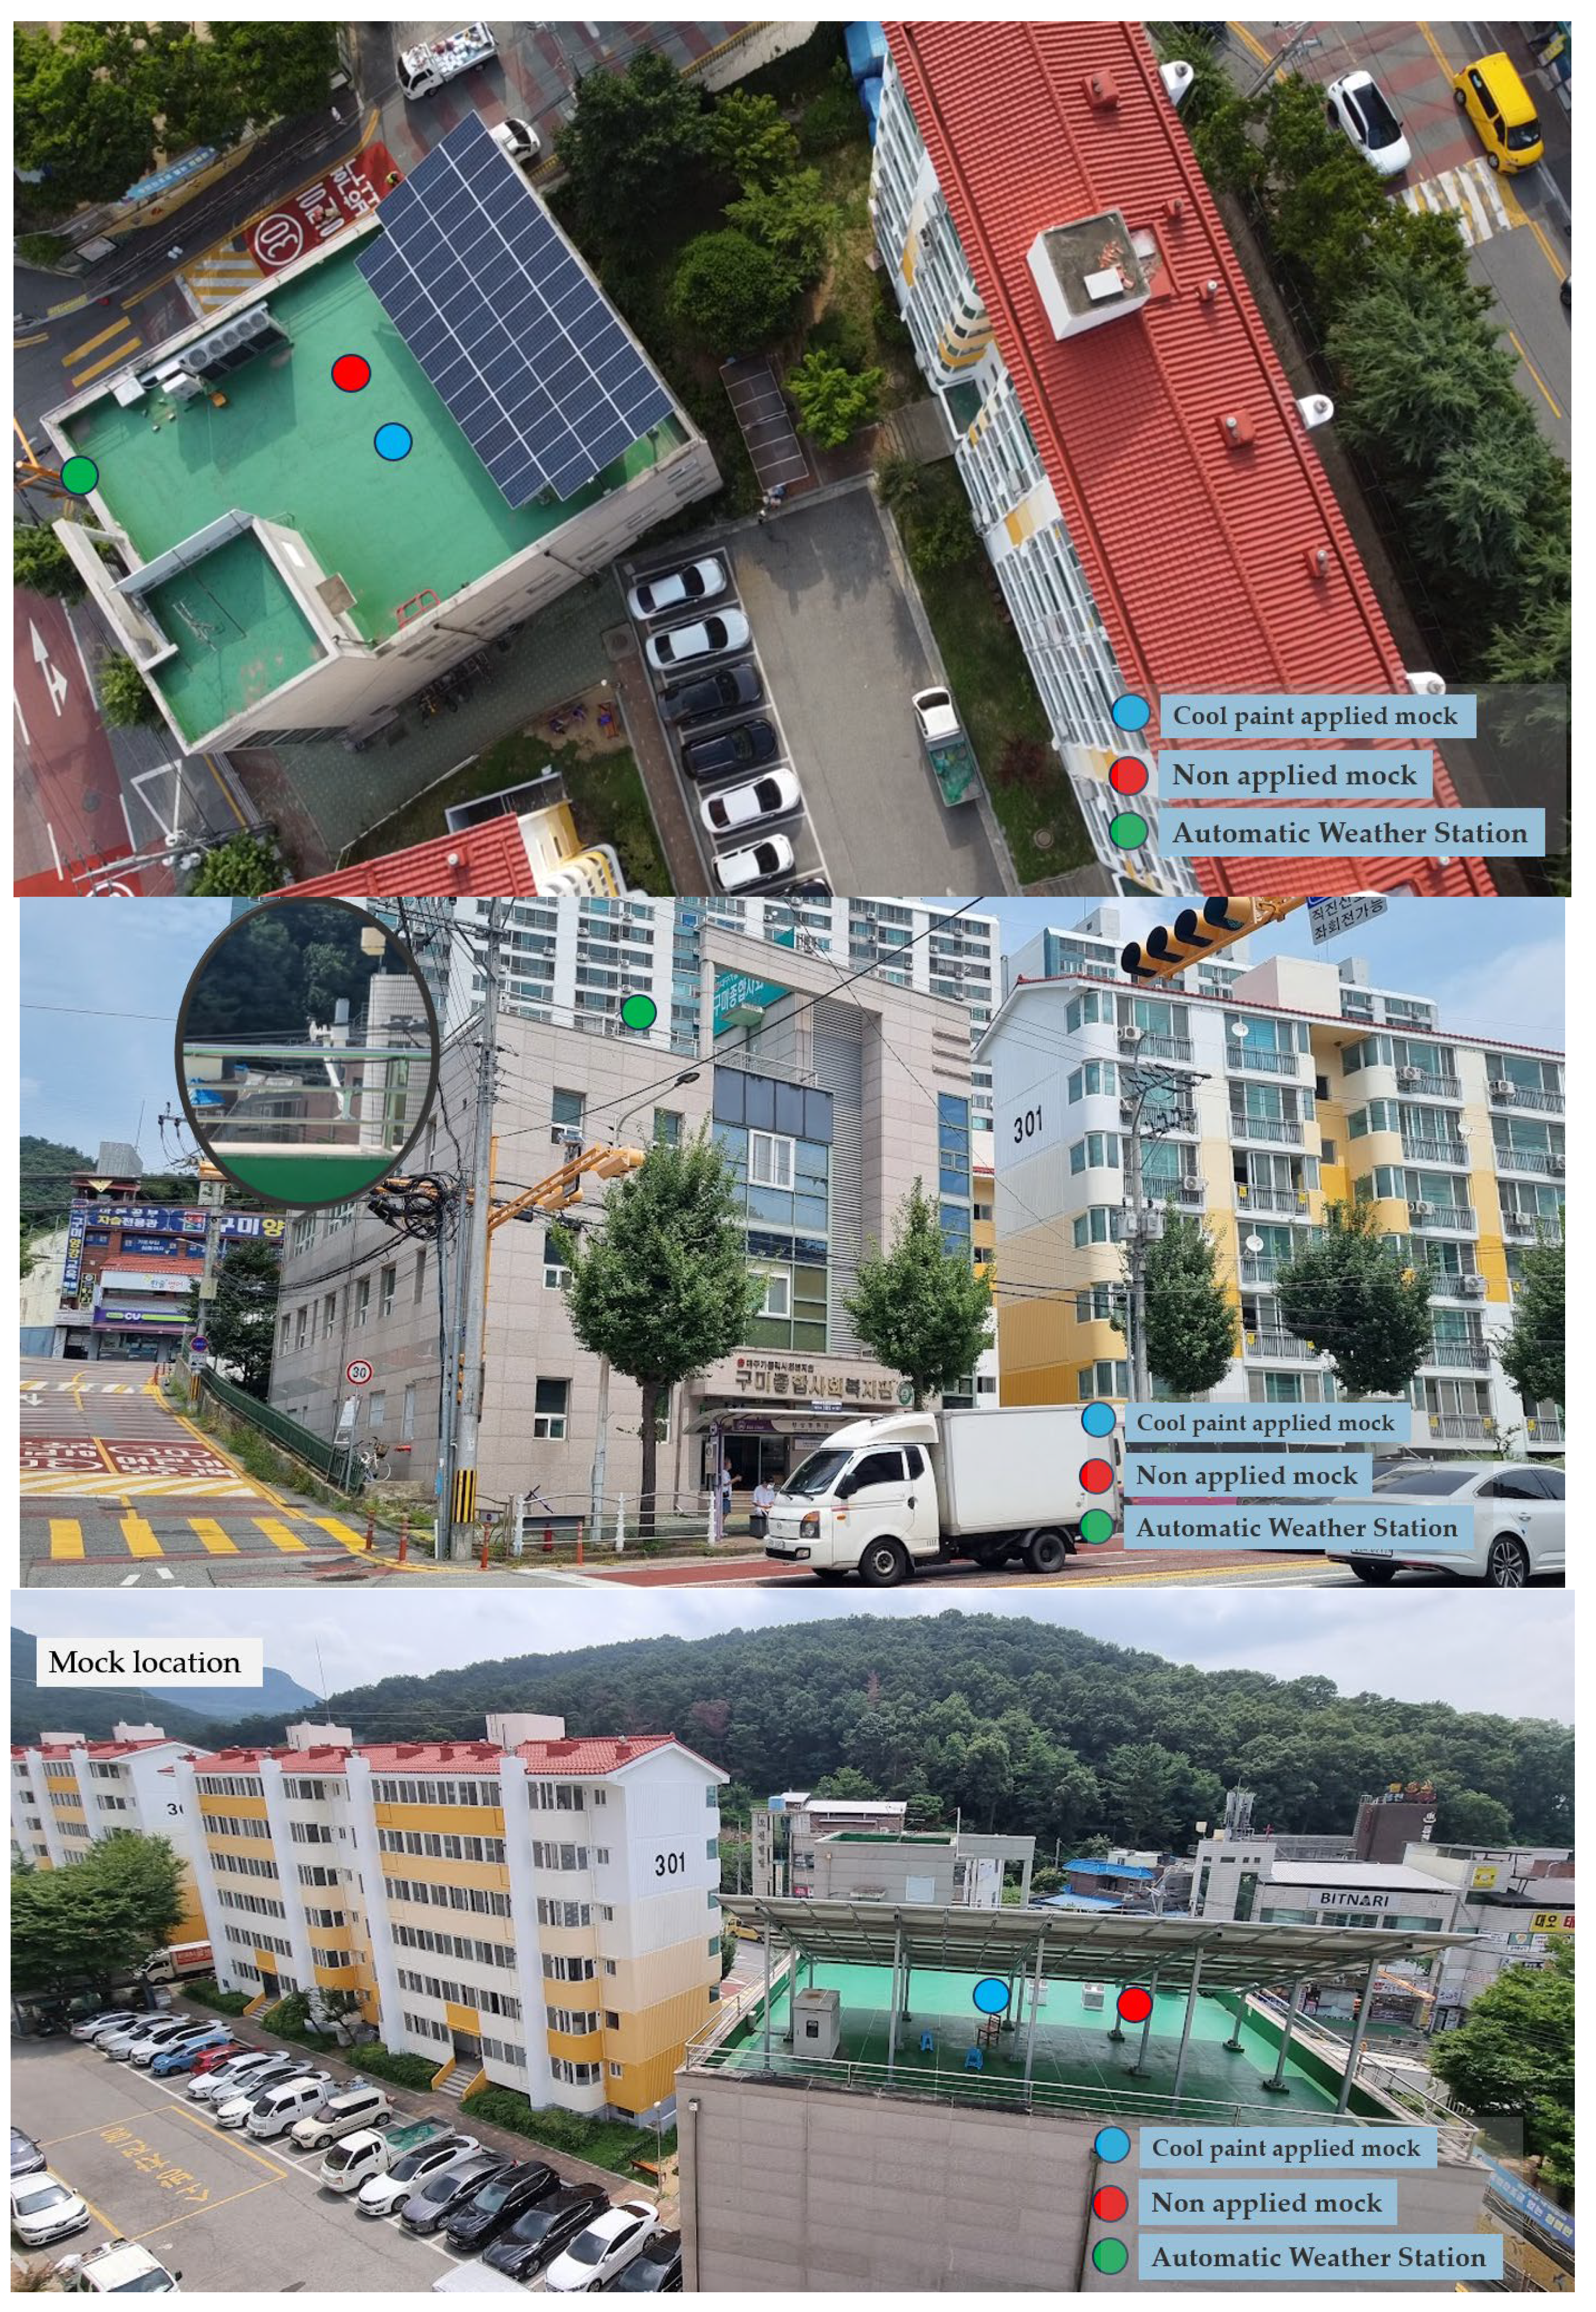
Additionally, as depicted in Figure 4, both mock structures were placed on the rooftop of a nearby building to ensure they received similar amounts of solar radiation as the apartment complex. A location free from shading and other obstructions was selected to maximize solar exposure, accurately simulating the environmental conditions around the apartment complex.
2.2.3. Data Collection Setup
Data was collected using sensors placed both on the external and internal surfaces of the mock structures. Temperatures were logged at five-minute intervals, and data was transmitted to a cloud server for real-time monitoring. Specific equipment used includes T&D TR-71wf data loggers and Ecowitt WS69 automatic weather station sensors, which measured factors such as external surface temperature, internal surface temperature, and indoor temperature.
2.2.4. UTCI and MRT Calculation Methods
In this study, the Mean Radiant Temperature (MRT) was calculated by averaging the external surface temperature of the south-facing walls and the indoor air temperature (ambient temperature). MRT is a crucial parameter for assessing the thermal environment since it takes into account the radiant heat exchange between the body and surrounding surfaces. The formula used for MRT is [17]:
where:
MRT = (Tsurface + Tindoor) / 2
- Tsurface is the surface temperature measured by the sensors on the south-facing wall.
- Tindoor is the indoor air temperature (ambient temperature).
After calculating the MRT, the Universal Thermal Climate Index (UTCI) was computed using the following formula [18,19]:
UTCI = Tair + v × (MRT - Tair) × (1 - 0.005 × RH),
Figure 4.
Location of mock measurement devices (Gumi City Community Center rooftop).
Where:
- Tair is the indoor air temperature.
- MRT is the Mean Radiant Temperature.
- RH is the relative humidity inside the room.
- v is the wind velocity in meters per second (m/s).
The wind speed recorded by the Ecowitt WS69 AWS sensor is in kilometers per hour (km/h), so we convert it to meters per second (m/s) by dividing the recorded wind speed by 3.6:
v = Wind Speed (km/h) / 3.6
In this study, we used python programming, the Pythermalcomfort package was utilized to calculate the UTCI based on the values of Tair, MRT, RH, and v by following the equations from UTCI.org. The calculated UTCI results for each timestamp were plotted to visualize the thermal comfort differences between the structures with and without heat-reflective paint. The following code snippet was employed for this analysis:
This method enables an accurate analysis of the thermal comfort index by using reliable climatic factors such as wind speed, humidity, and temperatures (both surface and ambient). The UTCI results demonstrated that the heat-reflective paint significantly lowered the thermal stress experienced indoors, especially during peak heat hours.
3. Design and Measurement of Mock Structures
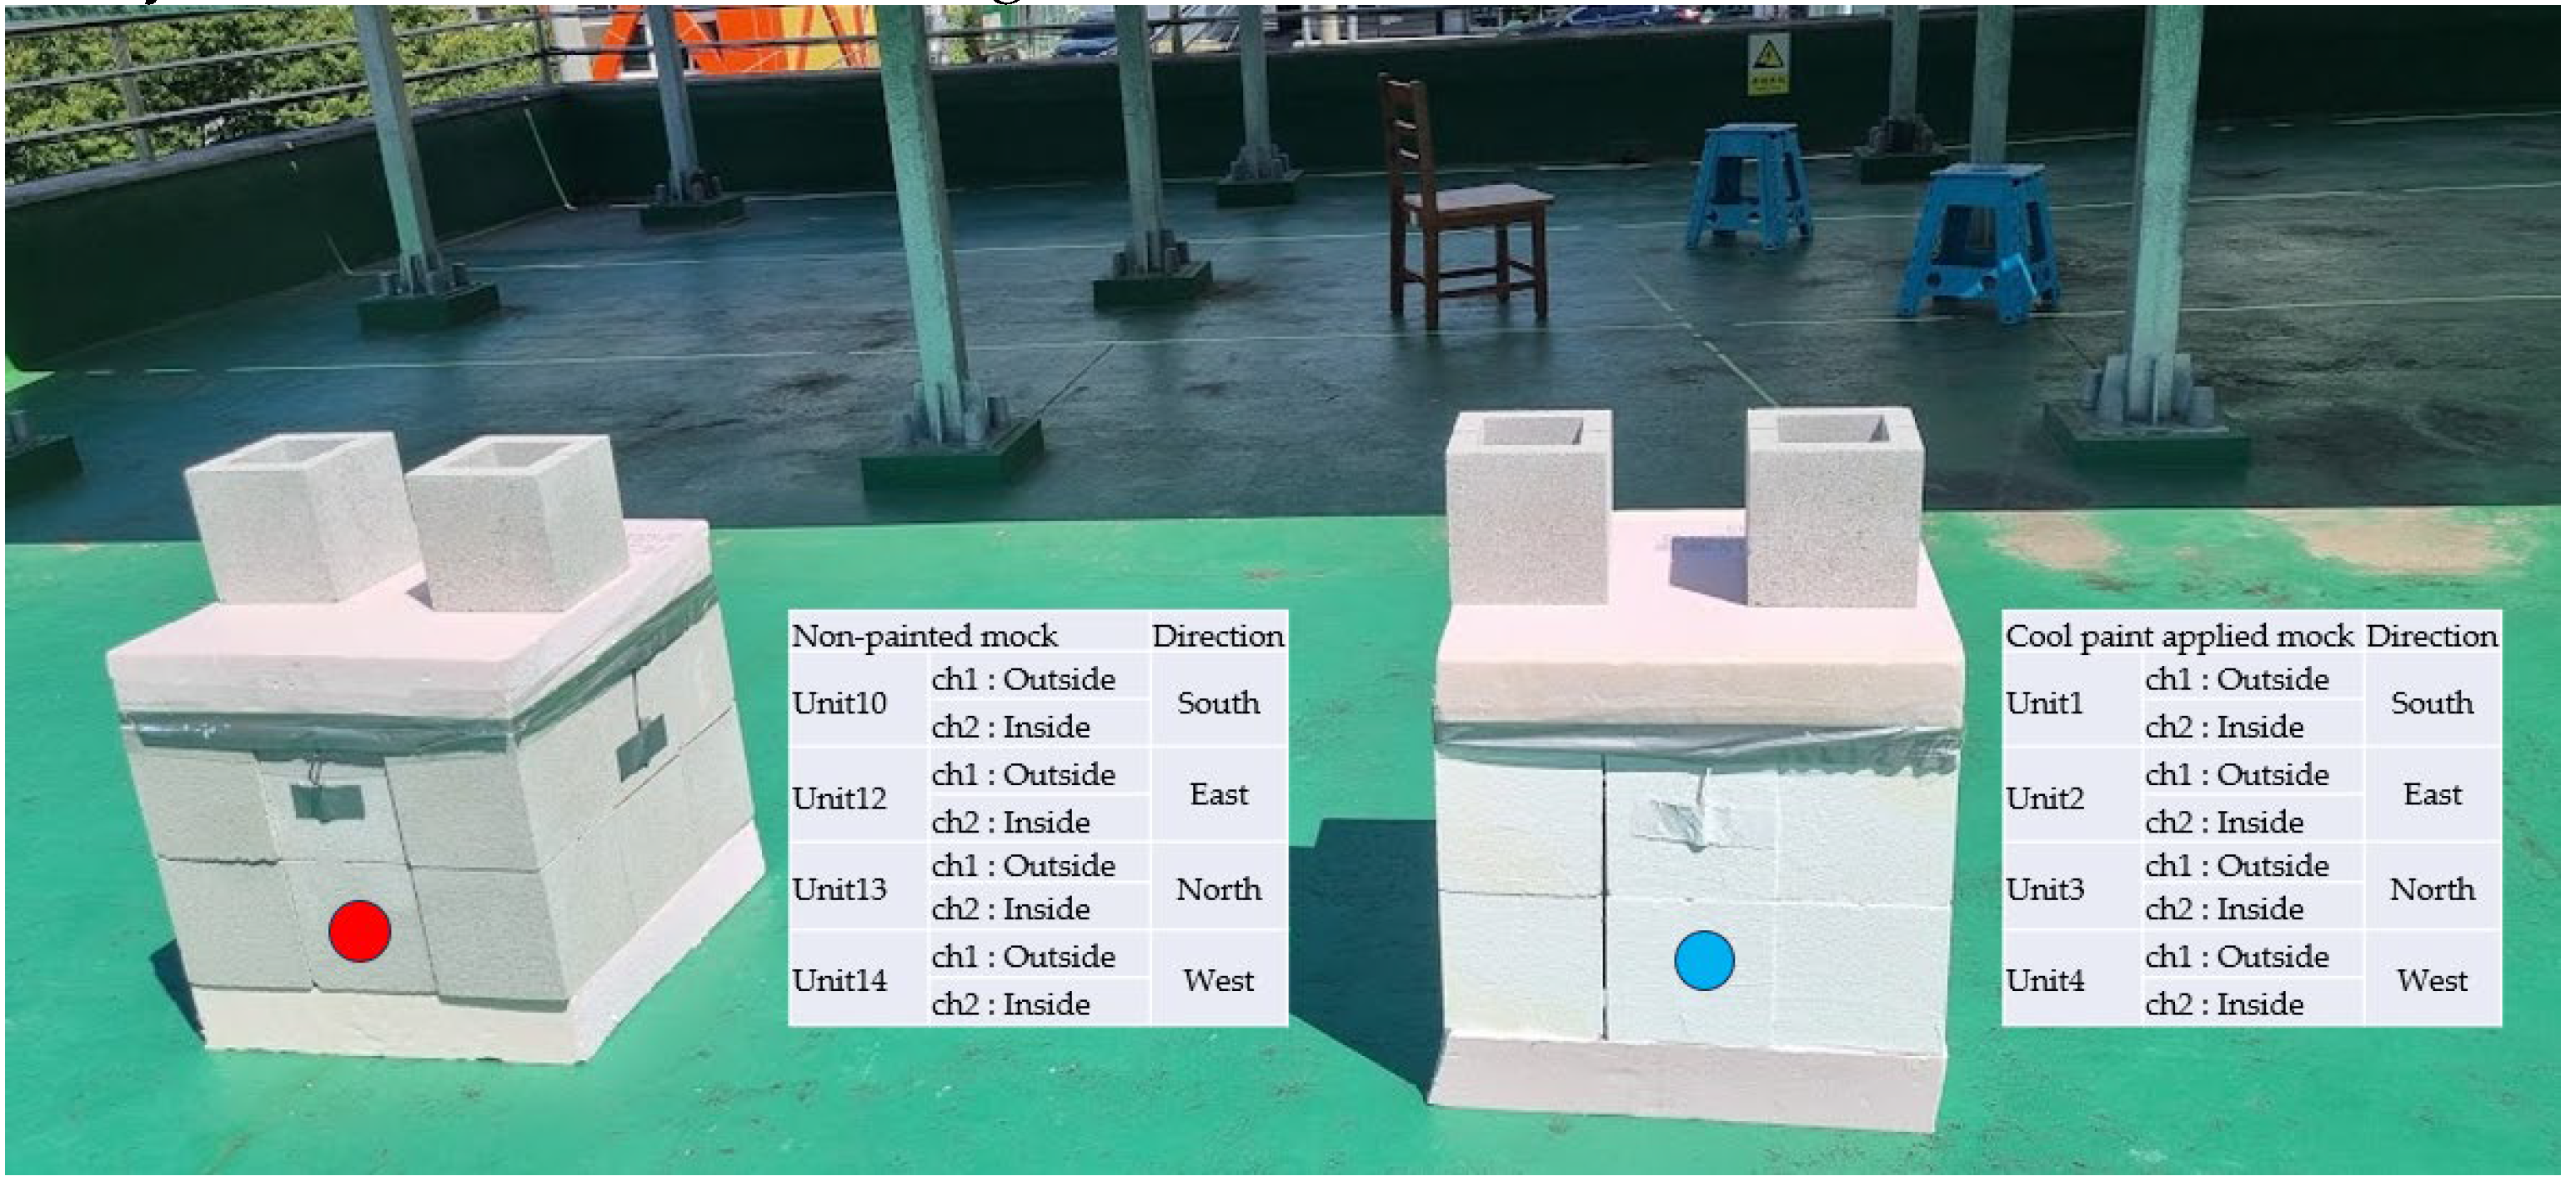
To study the thermal impacts of applying heat-reflective paint, two mock structures were designed—one with heat-reflective paint applied and one without (control). Data loggers were installed at eight different points, both inside and outside the structures, as shown in Figure 5. In addition, real-time weather sensors were placed in the center of the mock structures to monitor indoor room and external weather conditions. These sensors allowed us to measure external surface temperature, internal surface temperature, and indoor temperature variations for the experimental and control groups.
Figure 5.
Data logger and sensor installation locations.
Similar mock experiments have been used in other studies to test the effectiveness of cooling technologies. For instance, Monge-Barrio and Gutiérrez (2018) [14] employed passive energy strategies in mock structures to analyze the impact on residential buildings. These studies serve as valuable models for examining the effect of heat-reflective technologies in controlled environments.
However, the merit and differentiation of this study lie in the specific construction and materials used in the mock structures. Unlike previous studies that may focus solely on exterior reflective coatings, this experiment integrates detailed insulation mechanisms, such as 100mm-thick insulation panels placed on both the top and bottom surfaces of the mock structures. This design ensures that heat transfer is predominantly measured through the treated and untreated side walls, offering a more accurate reflection of real-world apartment settings where roofing and floor insulation are common practices. Additionally, the cubic concrete blocks (190mm x 190mm x 190mm) used in this study more closely replicate the material and structure of actual apartment building walls, offering a more precise simulation of urban residential conditions.
3.1. Data Collection Methods
To accurately measure surface and ambient air temperatures, along with other climatic factors like humidity, wind speed, and solar radiation, IoT-based sensors and dataloggers were utilized. The devices employed for this study included T&D TR-71wf Data Loggers and Ecowitt WS69 IoT Weather Station Sensors. These devices were strategically positioned both indoors and outdoors to monitor changes in thermal comfort caused by the application of cooling technologies.
The accuracy and reliability of such sensors are well documented in previous studies. For example, Malz et al. (2020) [20] used similar IoT-based methods to measure the energy-saving potentials of reflective wall paints and their effect on thermal comfort.
- Dataloggers: The T&D TR-71wf loggers were placed at key locations to record temperature changes on surfaces treated with heat-reflective paint as well as non-painted external and internal surfaces. These loggers captured temperature data every five minutes, providing real-time insights into temperature variations between the experimental and control groups.
- Ecowitt WS69 IoT Sensors: These sensors measured environmental conditions, including wind speed, humidity, and solar radiation, which were critical for understanding the broader climatic impact of the cooling interventions. Data from the sensors were wirelessly transmitted to a cloud-based server for continuous monitoring and analysis. These sensors were specifically used to monitor indoor temperature and humidity, as well as external factors like wind speed, humidity, and solar radiation through the external AWS sensor unit.
Figure 6.
Sensor installation for the experimental and control structures.
For indoor temperature measurement, real-time sensors were installed at the center of the mock structures. These sensors recorded data on temperature, humidity, atmospheric pressure, and solar radiation at five-minute intervals. Table 1 provides the specific measurement items and technical details of the weather sensors used.
Data collection took place from mid-July to early August, with the most complete and continuous data recorded between July 30 and August 1. These three days were selected for detailed analysis.
3.2. Field Measurements
Before conducting detailed experiments, aerial photographs (Figure 7) were taken using a drone to confirm that the conditions of the experimental site were similar to those of the project site, and to check the overall solar altitude and position. Additionally, thermal imaging cameras were used (Figure 8) to capture surface temperature differences between the experimental and control groups during the hottest hours of the afternoon.
Thermal imaging has proven to be an effective tool in similar studies to highlight temperature differences in treated versus untreated structures. Zinzi and Fasano (2009) [12] used thermal imaging to demonstrate how advanced reflective paints reduce surface temperatures, thereby mitigating the heat island effect.
As shown in Figure 8, the surface temperature of the control building, which did not have heat-reflective paint, reached approximately 40.6°C, whereas the surface temperature of the building with heat-reflective paint applied was significantly lower at 36.7°C. This 3.9°C difference highlights the effectiveness of the heat-reflective paint in reducing surface temperature, thereby mitigating heat absorption and enhancing indoor thermal comfort.
4. Results
4.1. Surface Temperature Changes (Thermal Imaging Camera)
In this study, the surface temperatures of the experimental group (with heat-reflective paint) and the control group (without heat-reflective paint) were measured using a thermal imaging camera. As shown in Figure 9, the surface temperature of the structure treated with heat-reflective paint was consistently lower than that of the untreated structure.
On August 8th at 12:20 PM, the surface temperature of the structure with heat-reflective paint was observed to be 40.0°C, whereas the temperature of the untreated structure reached 49.2°C. This shows a significant reduction in surface temperature due to the application of the heat-reflective paint. Additionally, the shadowed area between the two mock structures recorded a temperature of 41.1°C, further highlighting the efficiency of the heat-reflective paint in lowering surface temperatures. The lower temperature of the treated block demonstrates the paint’s effectiveness in reducing solar heat absorption and maintaining a cooler surface, which can contribute to improved thermal comfort in buildings.
This aligns with previous studies by Bretz and Akbari (1997) [7] and Malz et al. (2020) [20], which also highlighted the cooling effects of high-albedo coatings and reflective materials in reducing surface temperatures. These reductions in surface temperatures directly translate to improved energy efficiency and indoor comfort by minimizing heat transfer into the building’s interior.
4.2. Surface Temperature Changes (Data Logger)
The data logger results clearly highlight the effectiveness of heat-reflective paint in reducing surface temperatures across all orientations of the mock structure. Measurements taken between July 30 and August 1 indicate that, on average, external surface temperatures of the treated walls were 2.2°C to 4.3°C lower than untreated walls, while internal surface temperatures were 2.1°C to 4.1°C lower (Table 2).
Figure 10 shows the temperature fluctuations over time, with notable differences observed particularly on the south- and west-facing walls, which receive the most solar exposure during the day. For example, the maximum temperature difference for the external surface on the west-facing wall was 15.3°C, and the internal temperature difference reached 11.1°C during peak sunlight exposure.
One challenge encountered during the data collection was the delayed activation of the north-facing wall’s data logger due to a power supply issue. The data from the north-facing wall was available starting July 31, and despite receiving less direct sunlight compared to the southern and western walls, there was still a notable temperature difference, with 6.3°C externally and 4.6°C internally.
This analysis provides clear evidence that heat-reflective paint reduces the heat absorbed by external surfaces, which subsequently lowers the internal surface temperatures and improves indoor thermal comfort. The paint’s effectiveness is especially pronounced in areas exposed to direct solar radiation, making it a valuable passive cooling solution for buildings in hot climates. This is consistent with studies conducted by Zinzi and Fasano (2009) [12], which showed that advanced reflective paints significantly reduce cooling loads in buildings.
4.3. Indoor Temperature Changes
The indoor temperature measurements taken from July 30 to August 1 are summarized in Table 3 and Figure 11. Over the three days of measurement, the average difference in indoor temperature between the experimental group (with heat-reflective paint applied) and the control group (without heat-reflective paint) ranged from 2.5°C to 3.8°C. The largest temperature difference observed was between 3.8°C and 4.5°C, typically occurring during the hottest hours of the day.
As shown in Figure 11, the control group consistently recorded higher indoor temperatures, peaking at around 40°C, while the experimental group with the heat-reflective paint showed a maximum temperature closer to 36°C. The heat-reflective paint not only reduced the peak indoor temperature but also delayed the rise and fall of temperatures throughout the day, providing a more stable indoor thermal environment.
The cooling effect of the heat-reflective paint is most noticeable during the afternoon hours (12:00 to 18:00), where the difference between the two groups is the largest. Additionally, during the early morning (00:00 to 06:00), the experimental group’s indoor temperatures remained lower than those in the control group by approximately 2°C to 3°C, indicating a sustained benefit of heat reduction even during non-peak sunlight hours.
This is consistent with the findings of Bretz and Akbari (1997) [7], who also demonstrated that reflective roof coatings contribute to lower indoor temperatures by reducing solar heat gains. Moreover, Levinson and Akbari (2010) [20] also showed that reflective materials provide consistent cooling benefits during both peak and non-peak periods by mitigating heat absorption.
The continuous fluctuations observed in the control group’s indoor temperature suggest that the lack of reflective paint allows for greater heat absorption and re-radiation into the indoor space. On the other hand, the experimental group’s more gradual temperature increase and decrease points to improved insulation and heat mitigation properties of the reflective paint.
Table 3 presents the measured indoor temperatures with and without the application of heat-reflective paint over three days: July 30, 31, and August 1, 2024. The table includes data for average, maximum, and minimum temperatures recorded during this period for both the experimental group (with heat-reflective paint applied) and the control group (without heat-reflective paint).
Key observations from the table include:
- Average Temperature: Across all three days, the experimental group consistently showed lower average indoor temperatures compared to the control group. For instance, on July 30, the average temperature for the experimental group was 34.2°C, while the control group recorded an average of 38°C, indicating a temperature reduction of 3.8°C due to the application of heat-reflective paint.
- Maximum Temperature: The maximum indoor temperature in the control group reached as high as 40.5°C on July 30, while the experimental group with the heat-reflective paint had a lower maximum temperature of 36°C, showing a 4.5°C reduction. Similar reductions were observed on the other two days, with a maximum difference of 4.2°C on July 31 and 3.8°C on August 1.
- Minimum Temperature: Even during the cooler periods, such as the early mornings, the experimental group maintained lower indoor temperatures. For example, the minimum temperature on July 31 was 29.3°C for the experimental group, while the control group recorded 30.3°C, highlighting a 1°C reduction. A similar trend was observed on other days.
- Temperature Differences: The overall temperature differences between the experimental and control groups ranged from 2.5°C to 4.5°C across the three days. The largest differences were observed during the afternoon when the impact of solar radiation was highest, with a 4.5°C difference on July 30.
This data clearly demonstrates the effectiveness of heat-reflective paint in reducing indoor temperatures, particularly during peak heating hours, resulting in improved thermal comfort for the occupants of the experimental group.
4.4. Time-Based Temperature and Humidity Changes
The time-based changes in temperature and humidity, measured over the course of three days (July 30 - August 1), are presented in Figure 12. As the figure shows, the difference in indoor temperature between the experimental and control groups widened as the day progressed, particularly during the late morning and early afternoon when solar radiation intensity was highest.
In the top panel of Figure 12, the indoor temperature in the control group (without heat-reflective paint) increased rapidly after 9:00 AM, reaching a peak of around 38°C to 40°C by 2:00 PM to 3:00 PM. In contrast, the experimental group (with heat-reflective paint) maintained a lower and more stable temperature profile, with a peak temperature of approximately 34°C to 36°C during the same period.
The time-based differences in temperature demonstrate the cooling effect of the heat-reflective paint, which helps mitigate indoor heat buildup during peak solar radiation hours. Similar trends were observed in studies by Zinzi and Fasano (2009) [12] and Malz et al. (2020) [20], which also demonstrated the long-term cooling effects of reflective coatings.
The bottom panel of Figure 12 shows the indoor humidity levels for both groups. The experimental group consistently exhibited higher humidity levels, which can be attributed to the reduction in indoor heat caused by the reflective paint. This stabilizing effect on temperature helped maintain indoor moisture content, while the control group experienced greater fluctuations in both temperature and humidity. Notably, the difference in humidity levels became most pronounced during the peak afternoon hours, with the experimental group showing an average humidity of 72–74%, compared to 62–66% in the control group.
4.5. Statistical Analysis of Temperature and Humidity Differences
To further verify the significance of the observed temperature and humidity differences between the experimental and control groups, an independent t-test was conducted using SPSS software. The test was based on data collected at 5-minute intervals and analyzed across two key time periods: the entire day (24-hour period) and the peak heat period (2:00 PM - 5:00 PM).
The results of the independent t-test, shown in Table 4 and Table 5, provide statistical confirmation that the differences in both temperature and humidity between the experimental and control groups were statistically significant. The application of heat-reflective paint led to lower indoor temperatures and higher humidity levels, particularly during the hottest parts of the day.
For the overall 24-hour period, the average temperature in the experimental group was 2.72°C lower than in the control group (33.01°C vs. 35.73°C), with a variance of 5.13°C and 10.34°C, respectively. During the peak heat period, the temperature difference became even more pronounced, with the experimental group maintaining a 4.14°C lower temperature (34.27°C vs. 38.41°C).
Similarly, significant differences were found in humidity levels. Over the entire day, the experimental group recorded an average humidity of 73.06%, which was 7.9% higher than the control group’s 65.16%. During the peak heat period, this difference remained substantial, with the experimental group maintaining an average humidity of 70.72%, which was 7.1% higher than the control group’s 63.62%.
These results are consistent with findings from Bretz and Akbari (1997) [7], who highlighted the long-term energy-saving benefits of reflective coatings, as well as Malz et al. (2020) [20], who noted the thermal comfort improvements from infrared reflective wall paints.
These results indicate that the application of heat-reflective paint significantly reduced indoor temperatures while maintaining higher humidity levels. The paint’s cooling effect not only minimized heat buildup during peak solar radiation but also helped preserve indoor moisture, contributing to improved thermal comfort for the building’s occupants.
Table 4 and Table 5 summarize the t-test results for temperature and humidity, with the corresponding p-values confirming the significance of the observed differences. The experimental group’s temperature and humidity levels during the entire day, as well as during the peak heat period, were consistently lower and higher, respectively, than those in the control group.
4.6. UTCI and MRT Measurement and Analysis
The The Universal Thermal Climate Index (UTCI) and Mean Radiant Temperature (MRT) values were calculated for both the experimental and control groups, based on the surface temperature of the south-facing wall and indoor ambient temperature. Figure 13 and Figure 14 present the trends of MRT and UTCI from July 30 to August 1.
Figure 13 shows that the buildings treated with heat-reflective paint exhibited lower MRT values compared to untreated buildings, with a significant difference during peak solar hours. The application of heat-reflective paint effectively reduced the radiant heat gain from external sources, contributing to improved indoor thermal comfort.
Similarly, Figure 14 illustrates the UTCI trends, where the treated buildings consistently displayed lower UTCI values, indicating reduced thermal stress. During peak heat hours, the UTCI remained below 45°C in the experimental group, compared to over 50°C in the control group, demonstrating the heat-reflective paint’s effectiveness in mitigating heat stress.
These results align with previous studies by Zinzi and Fasano (2009) [12], who emphasized the role of reflective paints in reducing building cooling loads, as well as the work of Levinson and Akbari (2010) [21], who highlighted the potential energy savings from reflective roof technologies.
Key observations from Figure 14 are as follows:
- Heat Reflective Paint Applied (Blue Line): The UTCI values are consistently lower, demonstrating that the heat-reflective paint effectively mitigates heat gain from external sources. During peak heat hours, the UTCI remains below 45°C, indicating more comfortable indoor thermal conditions. The reflective paint helps reduce thermal stress indoors, making the environment more tolerable even during the hottest parts of the day.
- Heat Reflective Paint Not Applied (Red Dashed Line): The UTCI values rise significantly, exceeding 50°C during midday, which indicates higher thermal stress and discomfort. The absence of heat-reflective paint allows for increased radiative heat transfer from the uncoated surfaces, leading to greater heat exposure indoors and less favorable thermal conditions.
The Mean Radiant Temperature (MRT), as shown in Figure 13, plays a crucial role in influencing the UTCI values. The lower MRT in buildings with heat reflective paint applied directly translates into reduced UTCI values, thereby improving indoor thermal comfort.
4.6.1. Analysis of Results
The application of heat-reflective paint leads to better thermal regulation, reducing both the MRT and UTCI. The following key conclusions can be drawn from the UTCI results:
- Heat Stress Reduction: The heat-reflective paint reduced the UTCI by approximately 5–7°C during the hottest parts of the day, effectively lowering thermal discomfort and stress.
- Impact on Indoor Comfort: With the reflective paint applied, indoor conditions remained within a more moderate thermal stress range, significantly improving overall comfort for the building’s occupants.
- Environmental Control: The reflective paint significantly reduced the amount of heat gained from solar radiation, particularly on surfaces exposed to direct sunlight. This demonstrates the paint’s ability to control indoor temperature passively, even during peak solar radiation hours.
These findings align with the objectives of the study, demonstrating that using heat-reflective paint can be an effective passive strategy for improving indoor thermal comfort in hot climates.
5. Discussion
The results of this study demonstrate the significant cooling effect of heat-reflective paint on both external and internal temperatures in simulated mock structures. The analysis showed consistent reductions in surface and indoor temperatures when compared to untreated surfaces, confirming that heat-reflective paint is an effective passive cooling strategy for mitigating heat gain in buildings.
Comparison with Previous Studies
The reductions in surface temperatures observed in this study (ranging from 2.2°C to 4.3°C for external surfaces and 2.1°C to 4.1°C for internal surfaces) align with findings from Kwon et al. (2022) [3], who reported similar temperature reductions with cool roof and cool wall applications. Additionally, studies like those by Bretz and Akbari (1997) [7] and Pisello et al. (2015) [8] have demonstrated the energy-saving effects of reflective coatings in reducing the solar heat load on building surfaces. However, the present study’s approach using mock structures adds a unique dimension to this body of research by simulating real-world apartment conditions with controlled variables, providing a more granular analysis of the cooling effect under similar environmental conditions to those found in occupied residential buildings.
Moreover, the study builds on findings from Malz et al. (2020) [20], who examined the benefits of infrared reflective wall paints in improving thermal comfort. In contrast to existing studies, this study used a simulated approach that enabled continuous monitoring without disturbing actual residents, offering both practical and scientific insights.
Impact of Environmental Factors
The mock structure experiments revealed that temperature reductions were more pronounced on the south and west-facing walls, which were exposed to more direct solar radiation. This is consistent with findings from Zinzi and Fasano (2009) [12], who found that reflective paints are especially effective in reducing heat loads on sun-exposed surfaces. By reflecting this radiation, heat-reflective paint can mitigate the heat load on exterior surfaces, particularly in climates like that of Gumi City, which experiences high solar radiation during summer months.
Environmental factors, such as wind speed and humidity, measured by the meteorological sensors, notably influenced the overall thermal environment. Higher wind speeds likely contributed to the cooling effect by enhancing heat dissipation from surfaces, while relative humidity impacted perceived thermal comfort, as shown in the UTCI results. Additionally, these environmental factors, recorded by the Ecowitt WS69 AWS sensors, played a crucial role in influencing both thermal comfort and energy efficiency, as also highlighted by Levinson and Akbari (2010) [21].
Limitations of the Study
While the results are promising, there are several limitations to this study that must be addressed. First, the mock structures, while simulating real-world conditions, cannot fully replicate the thermal dynamics of occupied apartment buildings. The lack of human occupants, variations in room use, and heat-generating appliances may influence the actual temperature reductions in a residential setting. Therefore, caution must be exercised when generalizing these results to fully inhabited apartment complexes.
Moreover, this study only considered the effect of heat-reflective paint in the short term, over a period of three days. Longer-term studies are needed to assess how the performance of reflective coatings holds up over time, particularly under varying weather conditions and over multiple seasons as highlighted by Rawat and Singh (2022) [13].
Finally, the UTCI and MRT measurements, while providing insights into thermal comfort, may not fully capture the complex interactions between radiant heat, humidity, and air movement in real indoor environments. Future studies should consider more detailed comfort analysis and possibly integrate additional factors, such as air conditioning usage patterns.
Broader Implications for Urban Heat Island Mitigation
The findings of this study have broader implications for urban heat island mitigation strategies in high-density urban environments. As cities like Gumi continue to experience rising temperatures due to climate change, passive cooling technologies like heat-reflective coatings could play a crucial role in reducing indoor heat stress, particularly for vulnerable populations, such as the elderly and low-income residents. These technologies not only improve indoor comfort but also have the potential to lower cooling energy demand, contributing to overall energy savings and reducing greenhouse gas emissions.
6. Recommendation
Based on the findings of this study, several recommendations are proposed to enhance the understanding and application of heat-reflective paint as an effective passive cooling strategy in urban environments.
6.1. Future Research Directions
REAL-World Application in Occupied Buildings
Future studies should aim to implement and measure the effects of heat-reflective paint in actual residential buildings with occupants, rather than relying solely on simulated mock structures. This would provide valuable data on how human activity and indoor appliances influence the performance of reflective paints over time. Studies by Monge-Barrio and Gutiérrez (2018) [14] have emphasized the importance of considering the interaction between passive cooling strategies and occupant behavior in real-world scenarios.
Combining with Other Passive Cooling Technologies
While heat-reflective paint alone provides significant cooling benefits, combining it with other passive cooling strategies such as green roofs, reflective windows, or cool pavements could yield even greater results. Zinzi and Fasano (2009) [12] and Cotrim Pezzuto et al. (2022) [15] both pointed out that multi-faceted approaches to cooling urban buildings can amplify energy savings and thermal comfort.
Thermal Comfort Analysis with Broader Metrics
The current study employed UTCI and MRT as key metrics for assessing thermal comfort. Future research could incorporate additional indices, such as Predicted Mean Vote (PMV) or Standard Effective Temperature (SET), to provide a more nuanced understanding of how residents perceive indoor comfort under different climatic conditions. Furthermore, integrating air conditioning use and behavioral adaptation (e.g., clothing or window use) would provide a more holistic view of thermal comfort in residential buildings.
6.2. Practical Applications for Building Management
Incorporating Heat-Reflective Paint into Building Standards
Given the demonstrated cooling effects of heat-reflective paint, policymakers and building authorities should consider incorporating this technology into national or local building standards, particularly for new constructions and retrofitting of older buildings. This is particularly relevant for vulnerable urban populations, such as the elderly and economically disadvantaged, who are more susceptible to heat-related health issues.
Prioritizing High Heat Exposure Areas
The results indicated that the south- and west-facing walls experienced the most significant temperature reductions. Therefore, building managers and city planners should prioritize the application of heat-reflective coatings on these surfaces, particularly in areas prone to high solar exposure. This approach will optimize cooling effects and reduce heat stress in indoor environments.
Cost-Benefit Analysis for Broader Adoption
While the benefits of heat-reflective paint in reducing indoor temperatures are evident, a cost-benefit analysis should be conducted to evaluate its financial viability, especially for large-scale urban projects. By comparing installation costs against energy savings from reduced air conditioning use, stakeholders can make informed decisions about broader adoption in urban areas.
6.3. Policy Implications
Government Subsidies for Vulnerable Populations
Vulnerable populations, such as low-income families and elderly residents, stand to benefit the most from heat-reflective technologies. Governments should consider offering subsidies or financial incentives to encourage the adoption of heat-reflective coatings in areas with high heat stress. This would not only improve public health outcomes but also reduce energy consumption and contribute to climate change mitigation efforts.
Incorporating Heat-Reflective Coatings into Urban Heat Island Mitigation Plans
Urban heat island (UHI) mitigation strategies should incorporate heat-reflective coatings as part of broader urban resilience initiatives. City planners could collaborate with local governments to target high-density, high-heat exposure neighborhoods, integrating reflective technologies with other climate adaptation strategies, such as urban green spaces and permeable pavements, for a multifaceted approach to heat mitigation.
Policy Recommendations
Government agencies and building authorities should consider incorporating heat-reflective paint into building codes and standards, particularly for older residential buildings that are more susceptible to heat stress. Offering subsidies or financial incentives to low-income and vulnerable populations, as suggested by Santamouris et al. (2020) [22], could help promote wider adoption of reflective coatings in regions prone to extreme heat.
7. Conclusions
This study evaluated the effects of heat-reflective paint on indoor thermal environments in a 33-year-old apartment complex located in Gumi City. Using simulated measurement equipment, surface and indoor temperatures were monitored in both experimental (painted) and control (non-painted) mock structures to assess the cooling potential of heat-reflective coatings. The results demonstrate that heat-reflective paint can significantly reduce both external surface and indoor temperatures, improving overall thermal comfort.
Key Findings
The application of heat-reflective paint resulted in an average reduction of external surface temperatures between 2.2°C and 4.3°C, with peak reductions reaching as high as 15.3°C on the west-facing walls.
Indoor temperatures in the experimental group were consistently lower than the control, with reductions ranging from 2.1°C to 4.1°C. The largest difference observed during the peak heat period was 4.14°C, demonstrating the potential of heat-reflective paint in reducing heat stress indoors.
Thermal imaging captured distinct differences in surface temperatures between the experimental and control groups, further highlighting the cooling effect of reflective coatings.
The use of the Universal Thermal Climate Index (UTCI) and Mean Radiant Temperature (MRT) as key metrics demonstrated that the painted surfaces provided more favorable thermal comfort levels, especially during the hottest hours of the day.
Implications
These findings provide strong evidence supporting the effectiveness of heat-reflective paint as a passive cooling strategy for urban buildings, particularly in regions experiencing extreme heat. This technology offers a cost-effective means of improving indoor comfort while also contributing to energy savings by reducing the reliance on air conditioning during hot periods. Importantly, this study aims to help vulnerable populations, such as the elderly and economically disadvantaged residents, by providing a sustainable solution that reduces heat exposure and enhances their quality of life in aging urban buildings.
Conclusions
Overall, the study confirms that heat-reflective coatings can significantly reduce surface and indoor temperatures, particularly on walls exposed to direct solar radiation. This passive cooling solution holds promise for mitigating the effects of heat waves and urban heat islands, especially in aging apartment complexes with poor insulation. By improving thermal comfort and reducing energy demand, heat-reflective paint is an eco-friendly option to combat the challenges of rising global temperatures.
Recommendations for Future Research and Practice
Future studies should focus on long-term monitoring in occupied residential buildings to validate the effectiveness of heat-reflective paint under real-world conditions.
Integrating heat-reflective coatings with other passive cooling strategies, such as green roofs or cool pavements, could further enhance their effectiveness in reducing urban heat stress.
Building standards and government incentives should be explored to encourage the adoption of heat-reflective coatings, particularly in vulnerable urban areas where populations are most susceptible to heat-related illnesses.
In conclusion, heat-reflective paint represents a viable, eco-friendly technology that can enhance thermal comfort, reduce energy consumption, and contribute to urban resilience in the face of increasing global temperatures.
Author Contributions
Conceptualization, H.D. and T.K.; methodology, H.D. and T.K..; software, S.H.; validation, W.J.; formal analysis, T.K.; investigation, H.D.; resources, T.H.; data curation, T.K..; writing—original draft preparation, T.K.; writing—review and editing, H.D. and T.K.; visualization, W.J and S.H.; supervision, T.K. and T.H. All authors have read and agreed to the published version of the manuscript.
Funding
This research was funded by the supporting project for climate-vulnerable groups and regions conducted by Korea Environment Institute (2024-001-03) and by by Korea Environmental Institute’s Climate Crisis Vulnerable.
Data Availability Statement
Not applicable.
Acknowledgments
This paper is modified based on the findings of the supporting project for climate-vulnerable groups and regions conducted by Korea Environment Institute (2024-001-03).
Conflicts of Interest
The authors declare there are no conflicts of interest.
References
- Yun, S. The risks and peace of climate crisis and carbon neutrality. Humans and Peace 2022, 3(2), 107–154. [Google Scholar]
- Lee, S.H.; Kim, J.G. Urban Planning Strategy and Technique for Climate Change Adaptation. LHI Journal 2015, 6(4), 153–164. [Google Scholar] [CrossRef]
- Kwon, T.K.; Kim, L.K.; Park, Y.J.; You, D.Y.; Zoh, H.D.; Lim, Y.S. Analyzing the effectiveness of cooling projects for climate-vulnerable groups through IoT-based monitoring system. Journal of Climate Change Research 2022, 13(3), 383–398. [Google Scholar] [CrossRef]
- Lee, J.H.; Ryu, S.Y. A Case Study on the Remodeling of Low-end Detached House. Proceedings of the Korean Institute of Architecture 2022, 42(1), 164–167. [Google Scholar]
- Jang, C.Y. High-efficiency advanced windows with improved insulation. The Magazine of the Society of Air-Conditioning and Refrigerating Engineers of Korea 2007, 36(8), 19–25. [Google Scholar]
- Kim, D.W.; Bahng, K.H.; Lee, D.S.; Kim, H.D. Experimental investigation of reducing the heat island effects using newly developed insulation-heat paint and heat-exchanging paint. In Proceedings of the SAREK Conference, Seoul, South Korea; 2009; pp. 87–96. [Google Scholar]
- Bretz, S.E.; Akbari, H. Long-term performance of high-albedo roof coatings. Energy and Buildings 1997, 25(2), 159–167. [Google Scholar] [CrossRef]
- Pisello, A.L. High-albedo roof coatings for reducing building cooling needs. In Eco-efficient Materials for Mitigating Building Cooling Needs; Woodhead Publishing: Cambridge, UK, 2015; pp. 243–268. [Google Scholar]
- Taha, H.; Sailor, D.J.; Akbari, H. High-albedo materials for reducing building cooling energy use. Energy and Buildings 1992. Available online: https://escholarship.org/uc/item/09b669b8.
- Kim, H.; Gao, Y.; Moran, E.; Howle, A.; McSherry, S.; Cira, S.; Lenert, A. High albedo daytime radiative cooling for enhanced bifacial PV performance. Nanophotonics 2024, 13(5), 621–627. [Google Scholar] [CrossRef]
- Wu, X.; Li, J.; Jiang, Q.; Zhang, W.; Wang, B.; Li, R.; Zhang, R. An all-weather radiative human body cooling textile. Nature Sustainability 2023, 6(11), 1446–1454. [Google Scholar] [CrossRef]
- Zinzi, M.; Fasano, G. Properties and Performance of Advanced Reflective Paints to Reduce the Cooling Loads in Buildings and Mitigate the Heat Island Effect in Urban Areas. International Journal of Sustainable Energy 2009, 28(1–3). [Google Scholar] [CrossRef]
- Rawat, M.; Singh, R.N. A Study on the Comparative Review of Cool Roof Thermal Performance in Various Regions. Energy and Built Environment 2022, 3(3), 327–347. [Google Scholar] [CrossRef]
- Monge-Barrio, A.; Gutiérrez, A.S.-O. Passive Energy Strategies for Mediterranean Residential Buildings: Facing the Challenges of Climate Change and Vulnerable Populations; Springer: Cham, Switzerland, 2018. [Google Scholar]
- Cotrim Pezzuto, C.; Alchapar, N.L.; Correa Cantaloube, E.N. Urban Cooling Technologies Potential in High and Low Building Densities. Sustainability 2022, 14(5), 2301. [Google Scholar] [CrossRef]
- Kwon, T.; Zoh, H.; Lim, Y. A Study to Develop Simulation Equipment for Measuring the Effect of Urban Shading. Journal of Environmental Technology 2022, 23(3), 169–176. [Google Scholar] [CrossRef]
- International Organization for Standardization. Ergonomics of the thermal environment—Instruments for measuring physical quantities. ISO 7726 1998.
- Fanger, P.O. Thermal Comfort: Analysis and Applications in Environmental Engineering; McGraw-Hill Book Company: New York, NY, USA, 1970. [Google Scholar]
- Bröde, P.; Fiala, D.; Błażejczyk, K.; Holmér, I.; Jendritzky, G.; Kampmann, B.; Havenith, G. Deriving the operational procedure for the Universal Thermal Climate Index (UTCI). International Journal of Biometeorology 2012, 56, 481–494. [Google Scholar] [CrossRef] [PubMed]
- Malz, S.; Krenkel, W.; Steffens, O. Infrared reflective wall paint in buildings: Energy saving potentials and thermal comfort. Energy and Buildings 2020, 224, 110212. [Google Scholar] [CrossRef]
- Levinson, R.; Akbari, H. Potential Benefits of Cool Roofs on Commercial Buildings: Conserving Energy, Saving Money, and Reducing Emissions of Greenhouse Gases and Air Pollutants. Energy Efficiency 2010, 3(1), 53–61. [Google Scholar] [CrossRef]
- Santamouris, M. Recent Progress on Urban Overheating and Heat Island Research: Integrated Assessment of the Energy, Environmental, Vulnerability, and Health Impact. Synergies with the Global Climate Change. Energy and Buildings 2020, 207, 109482. [Google Scholar] [CrossRef]
Figure 1.
Apartment building in Gumi City before applying heat-reflective paint (Source: Gumi City).
Figure 1.
Apartment building in Gumi City before applying heat-reflective paint (Source: Gumi City).
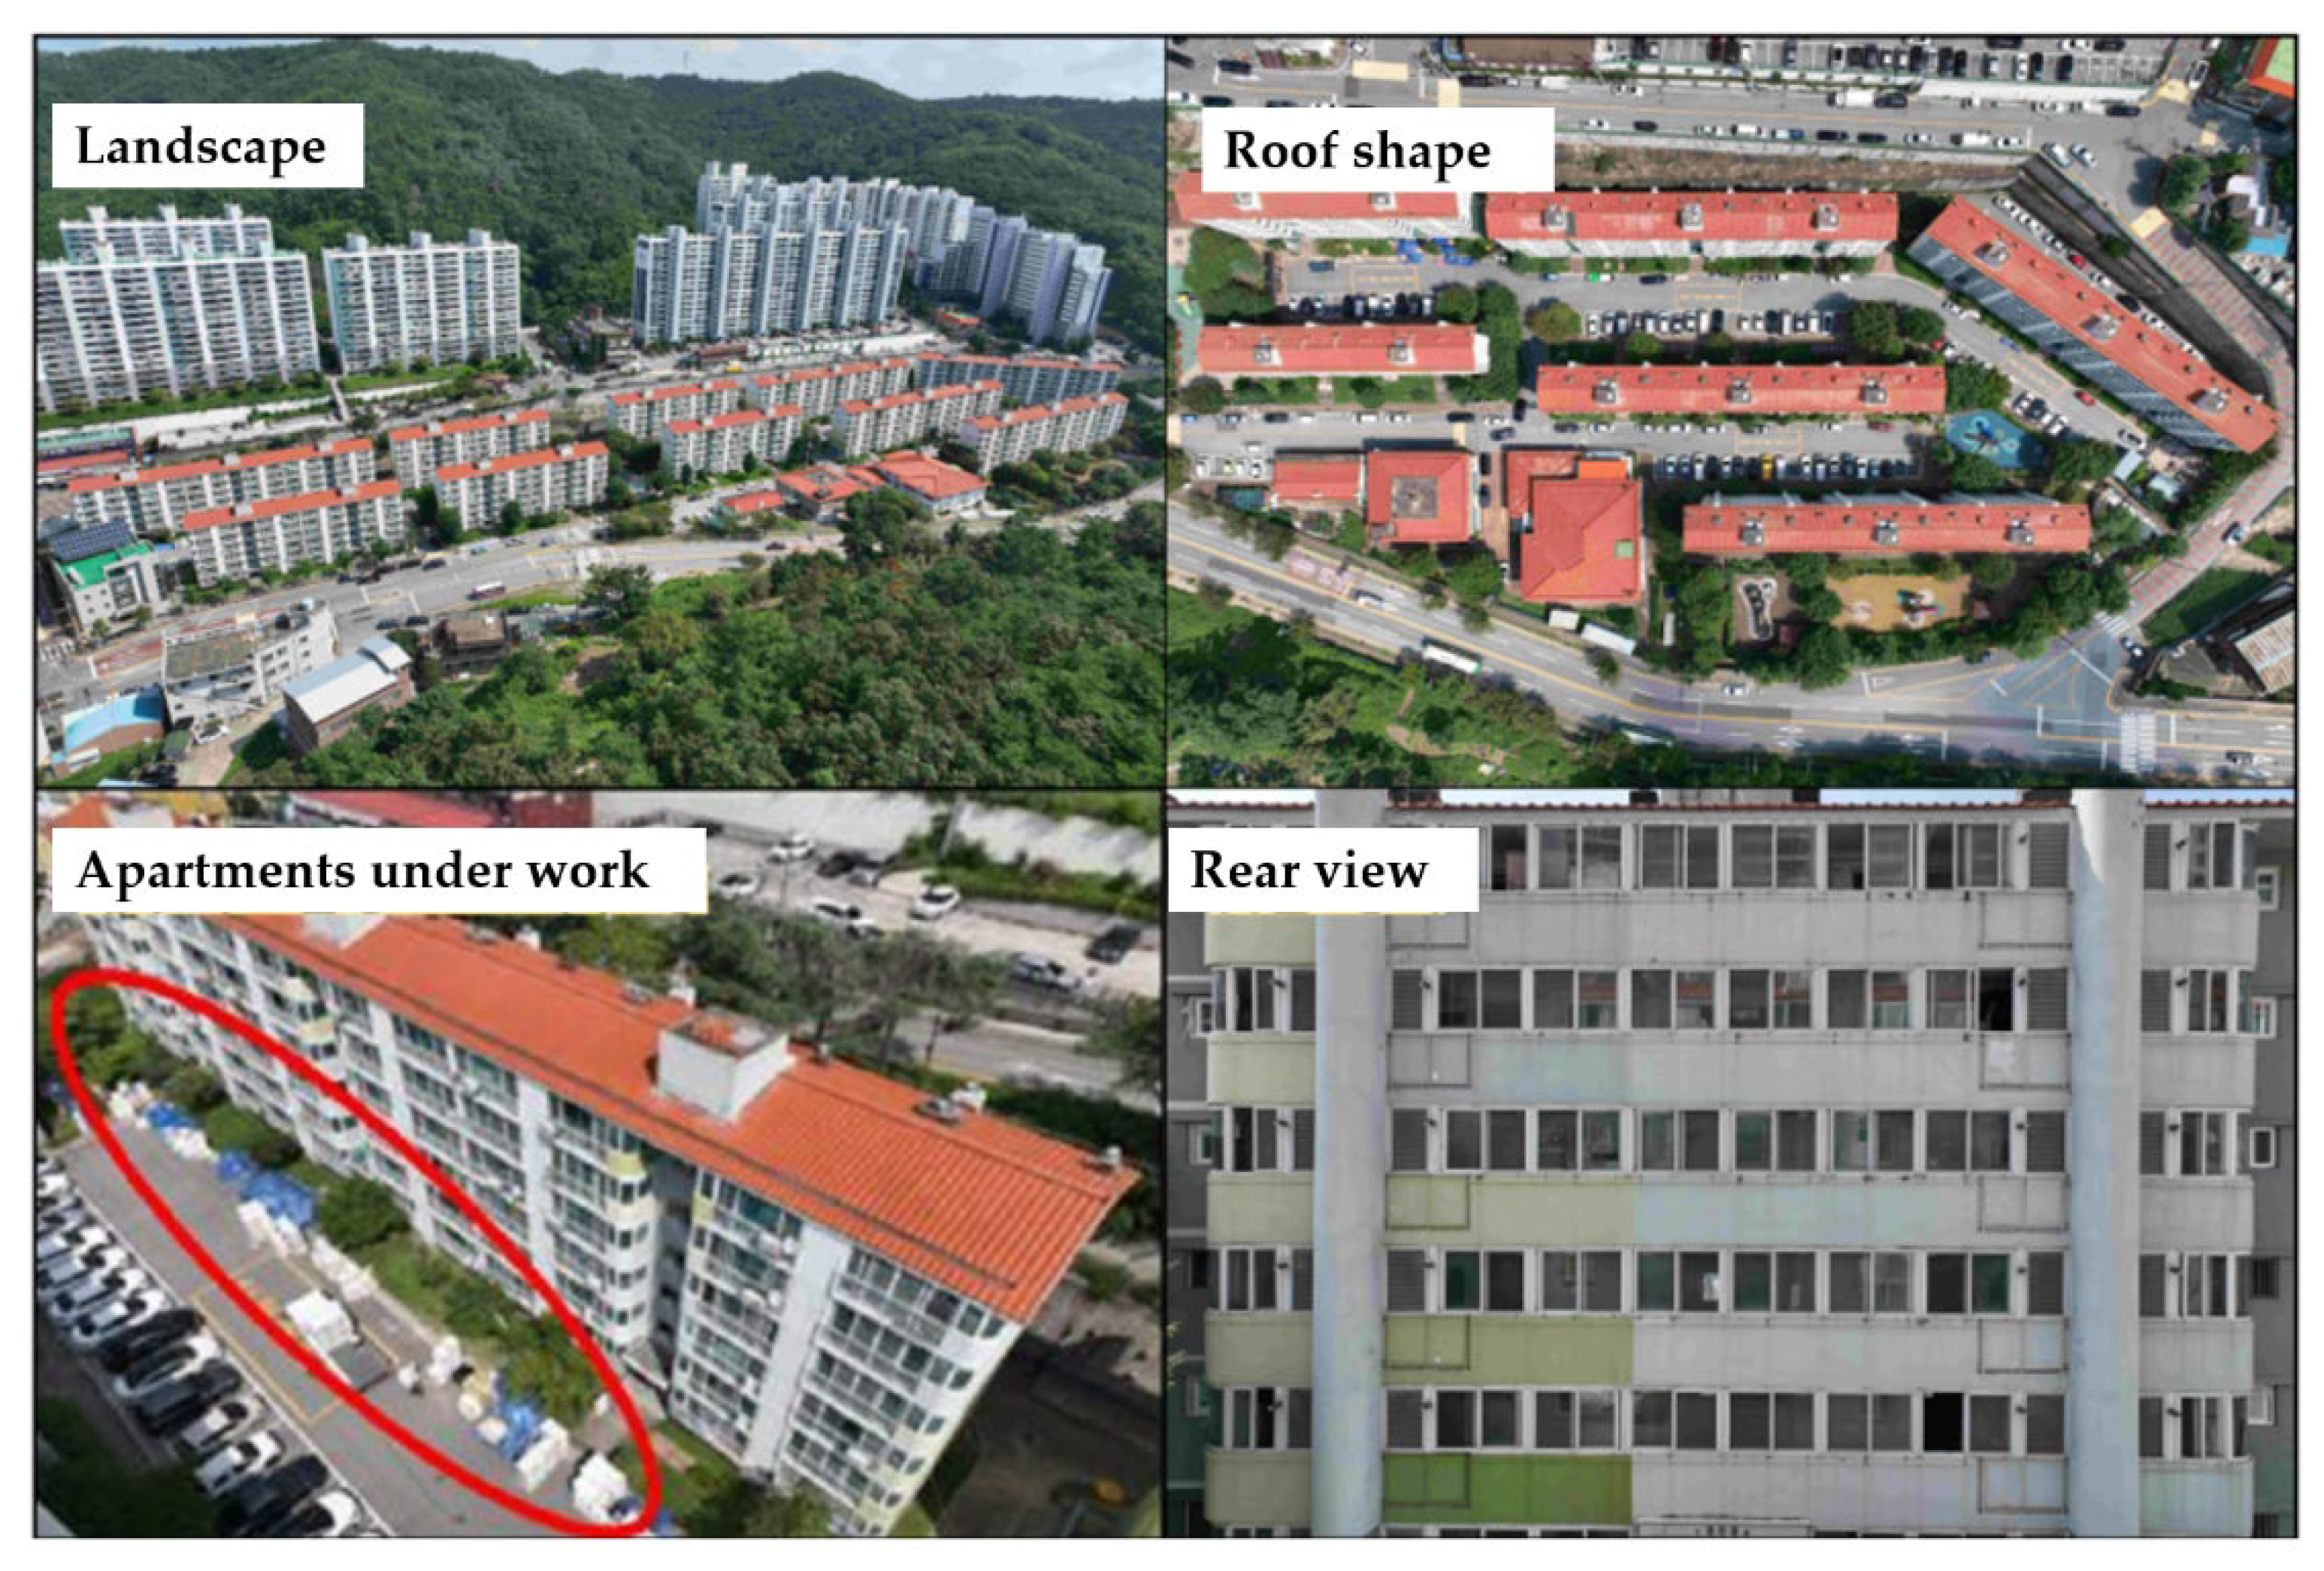
Figure 3.
Installation of mock measurement devices.
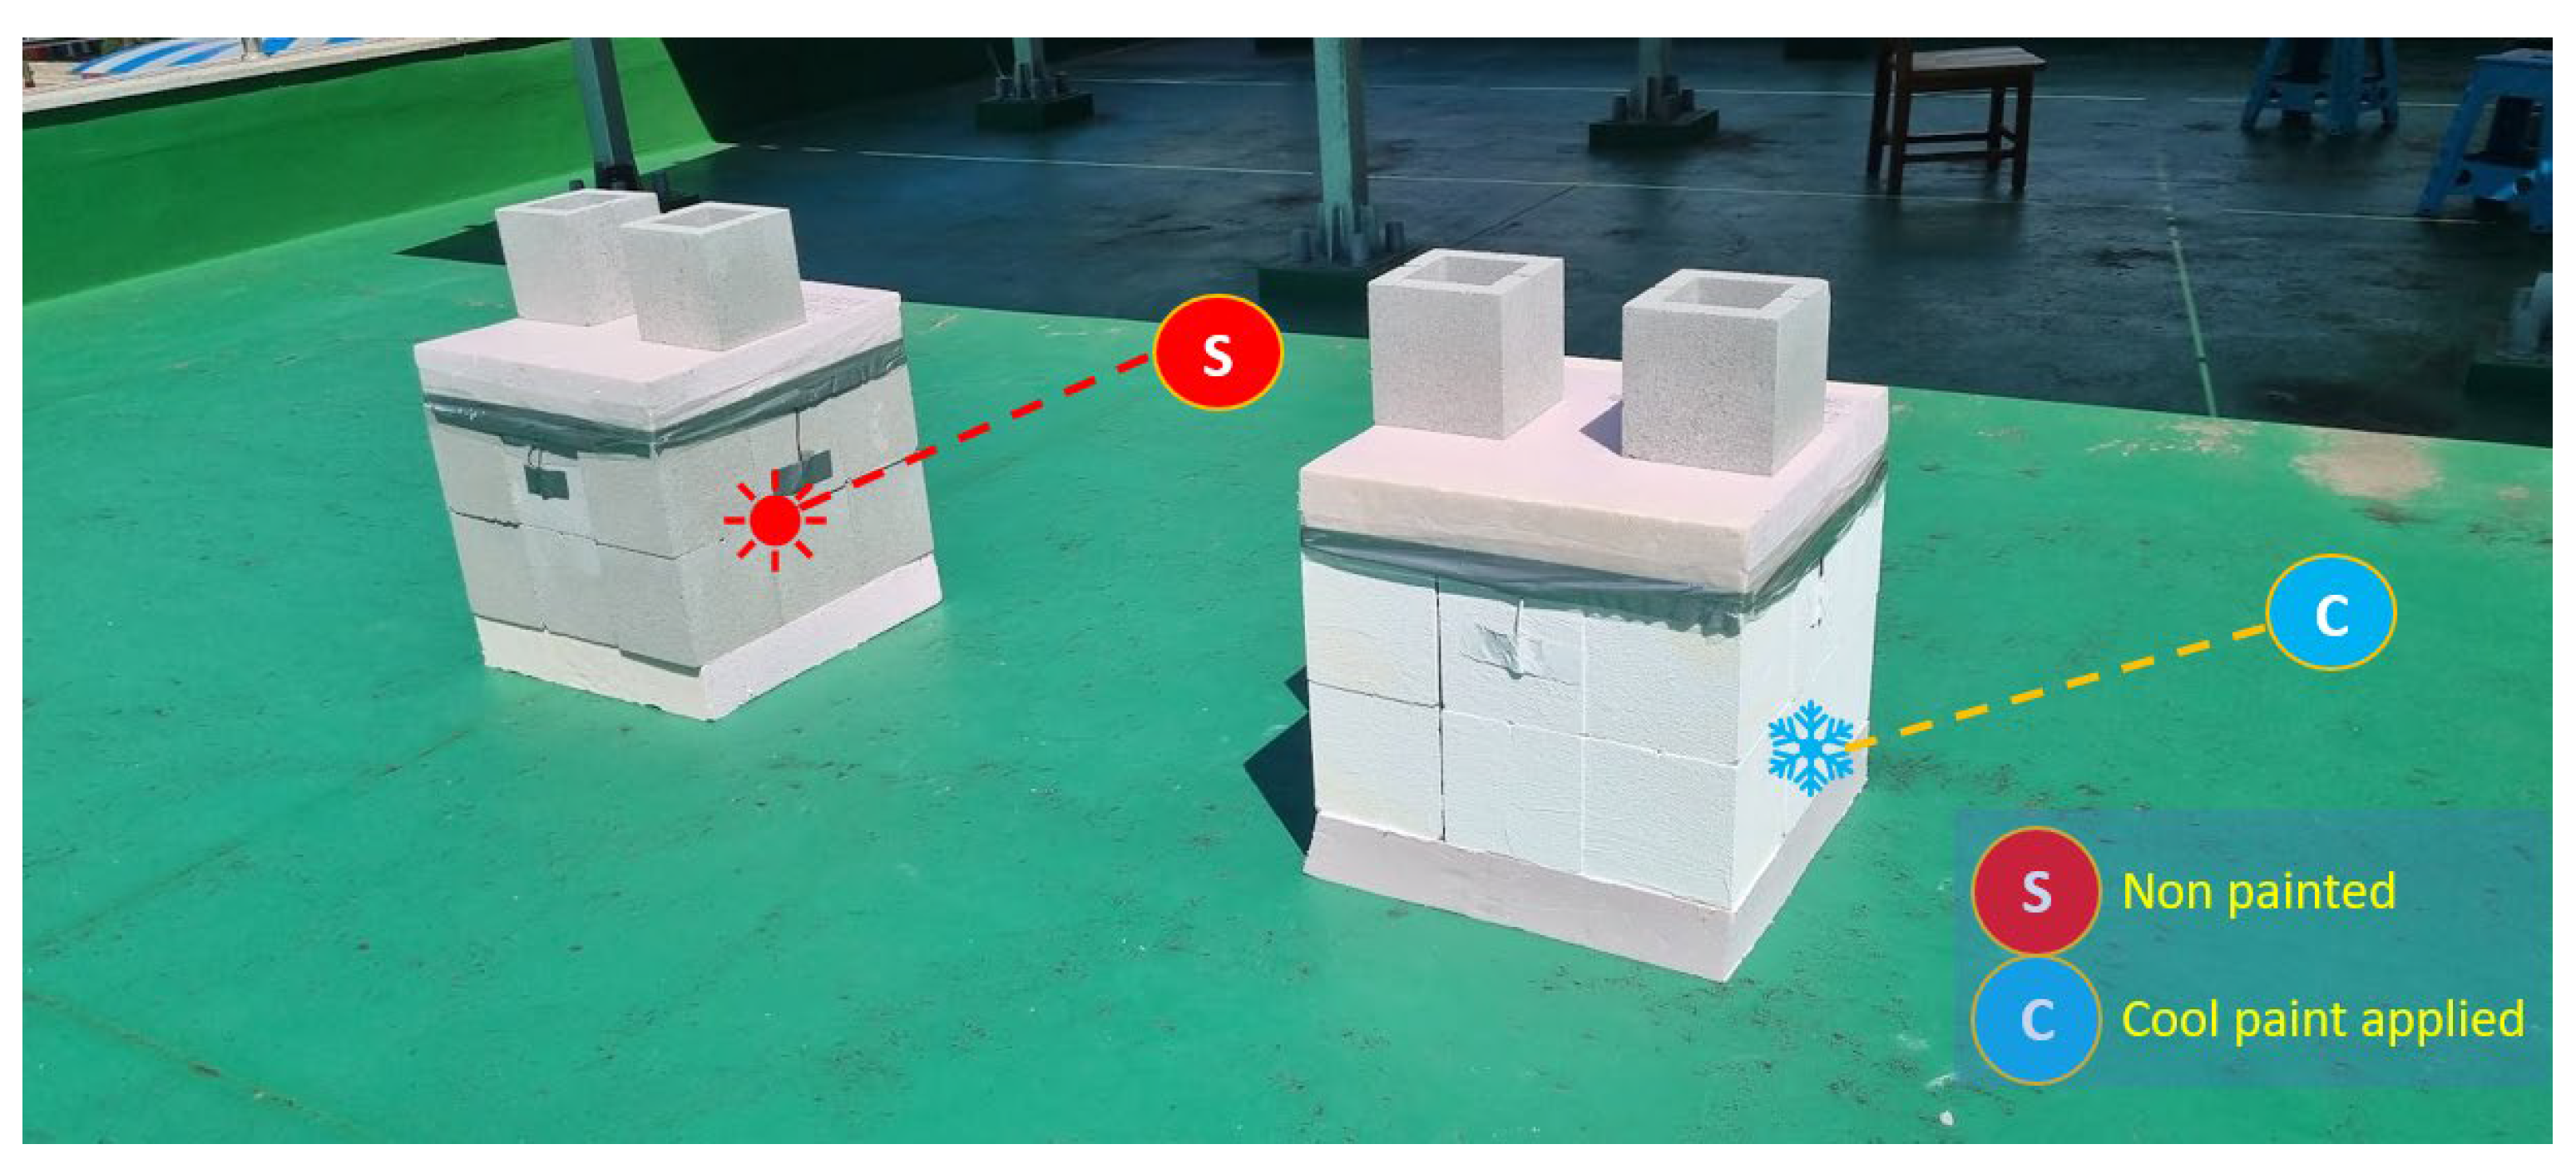
Figure 7.
Aerial photographs of the project and experiment sites using a drone.
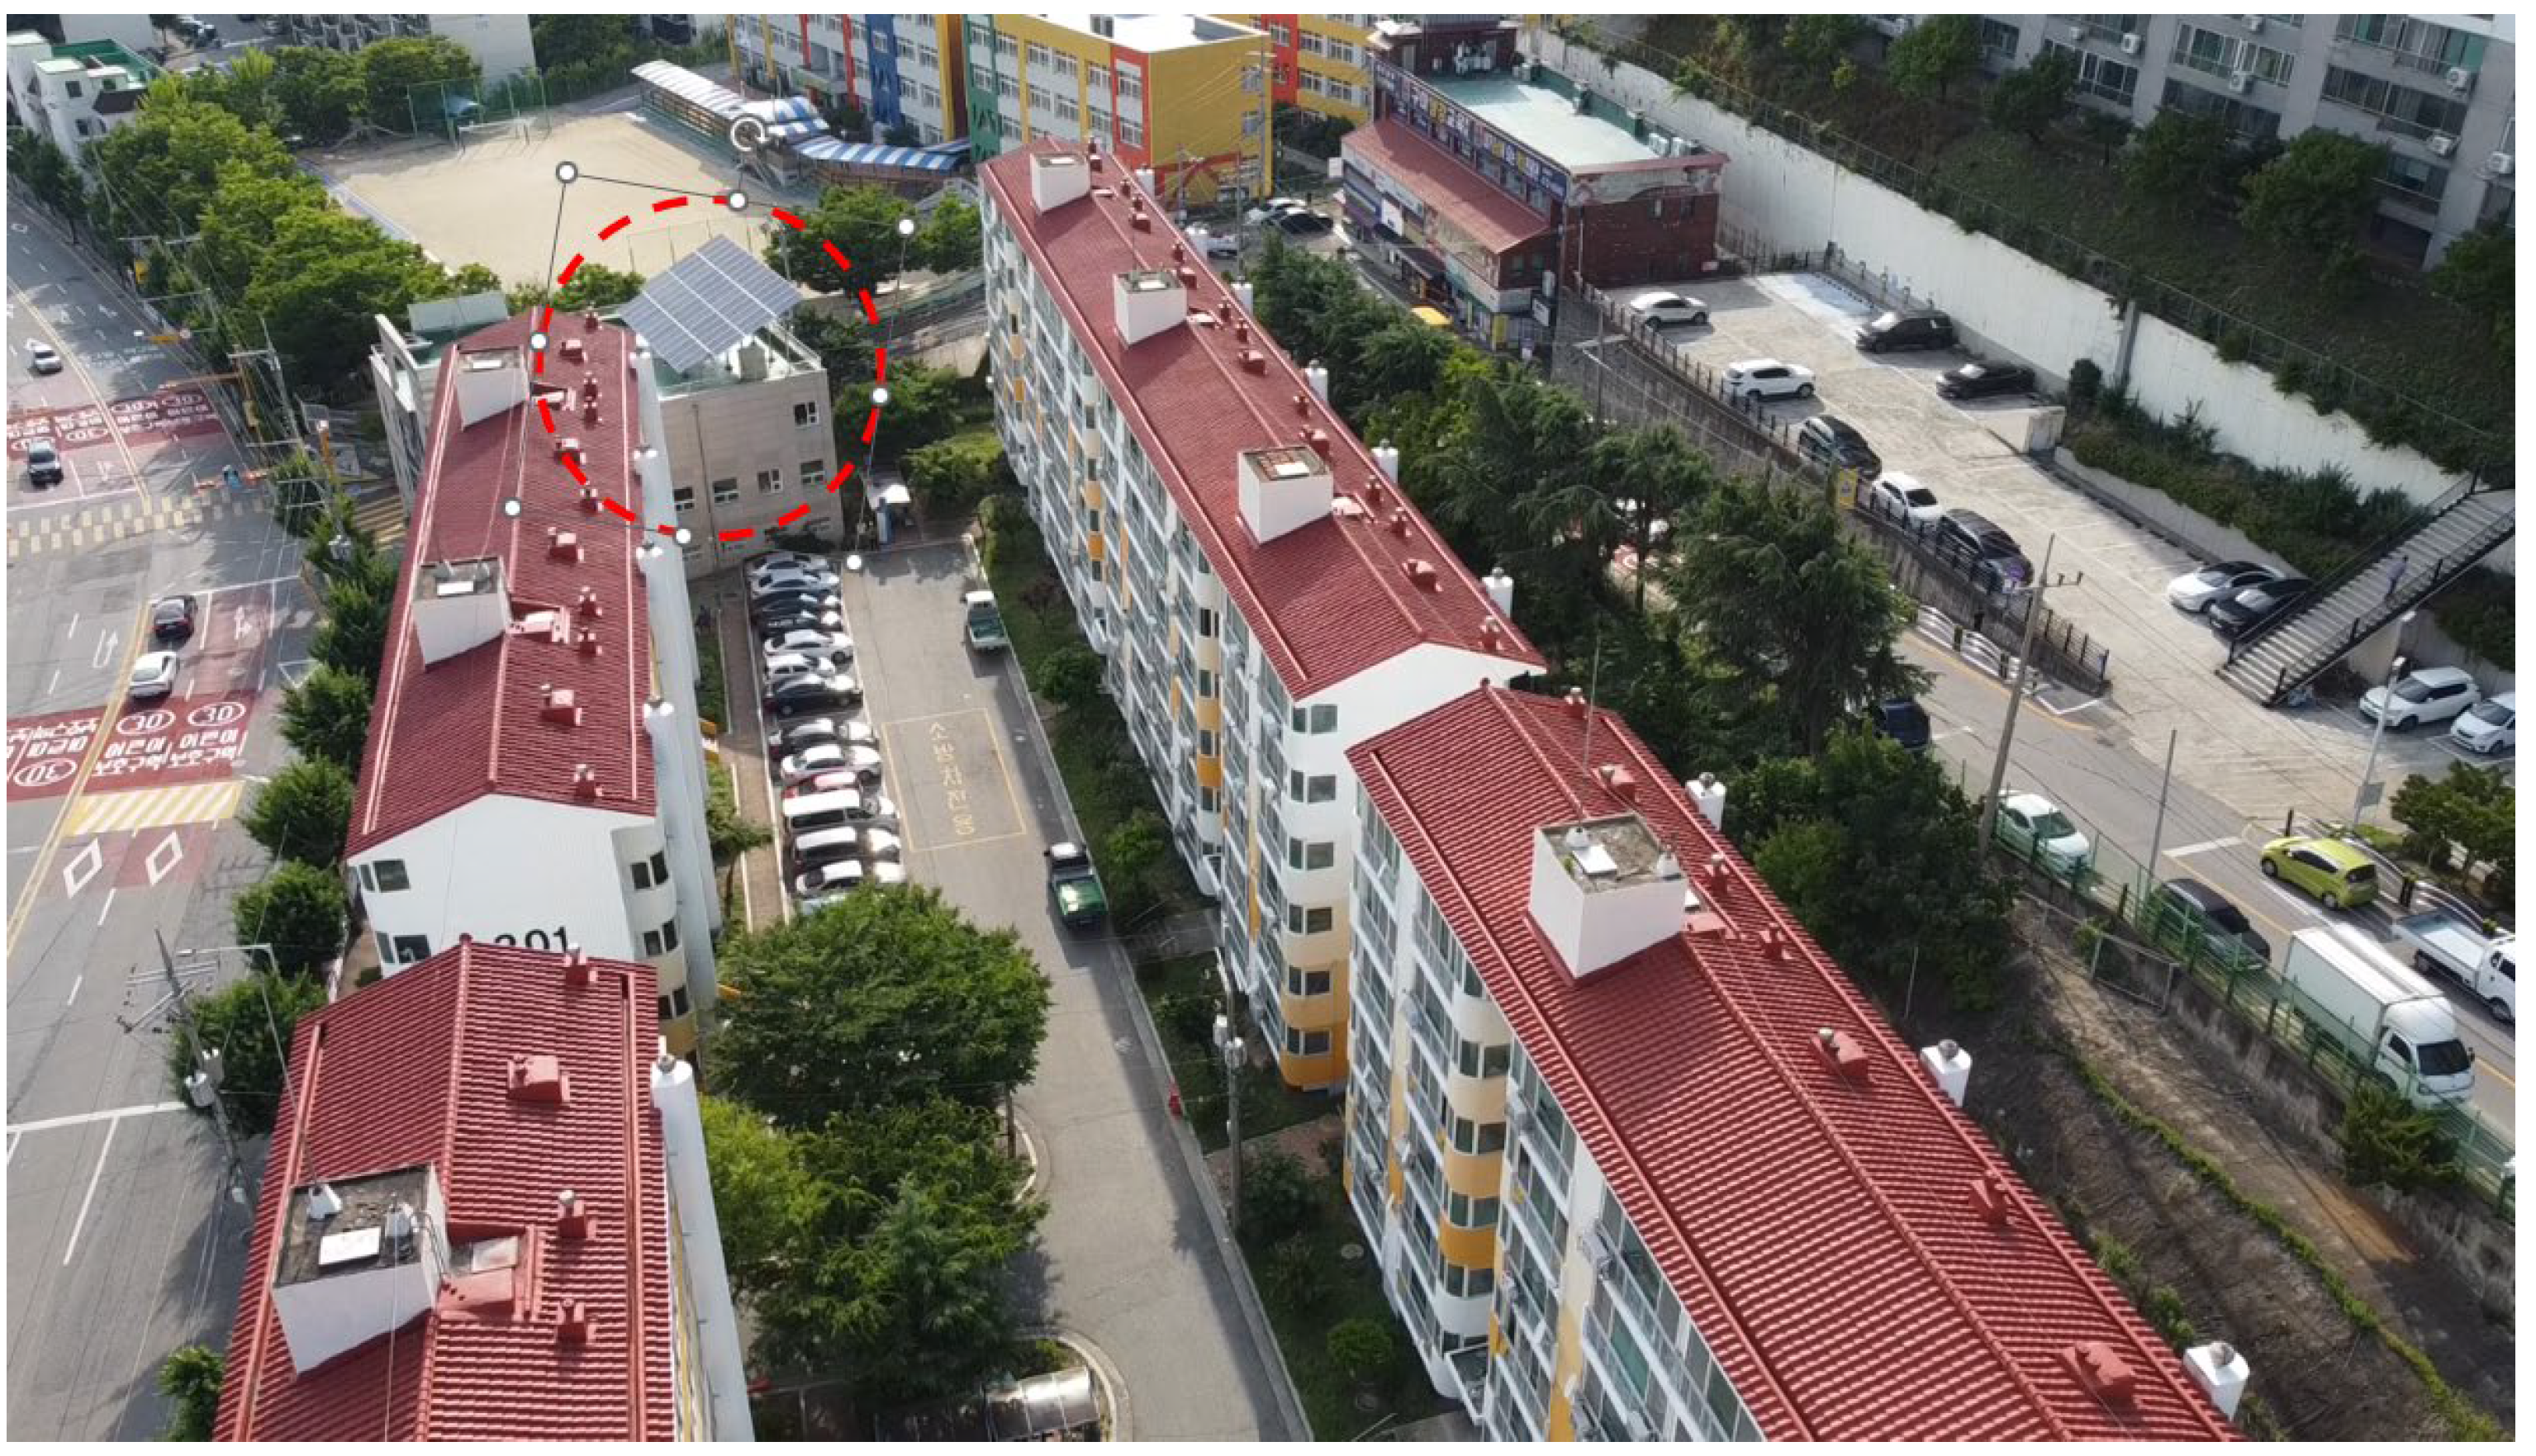
Figure 8.
Surface temperature comparison between buildings with and without heat-reflective paint using thermal imaging.
Figure 8.
Surface temperature comparison between buildings with and without heat-reflective paint using thermal imaging.
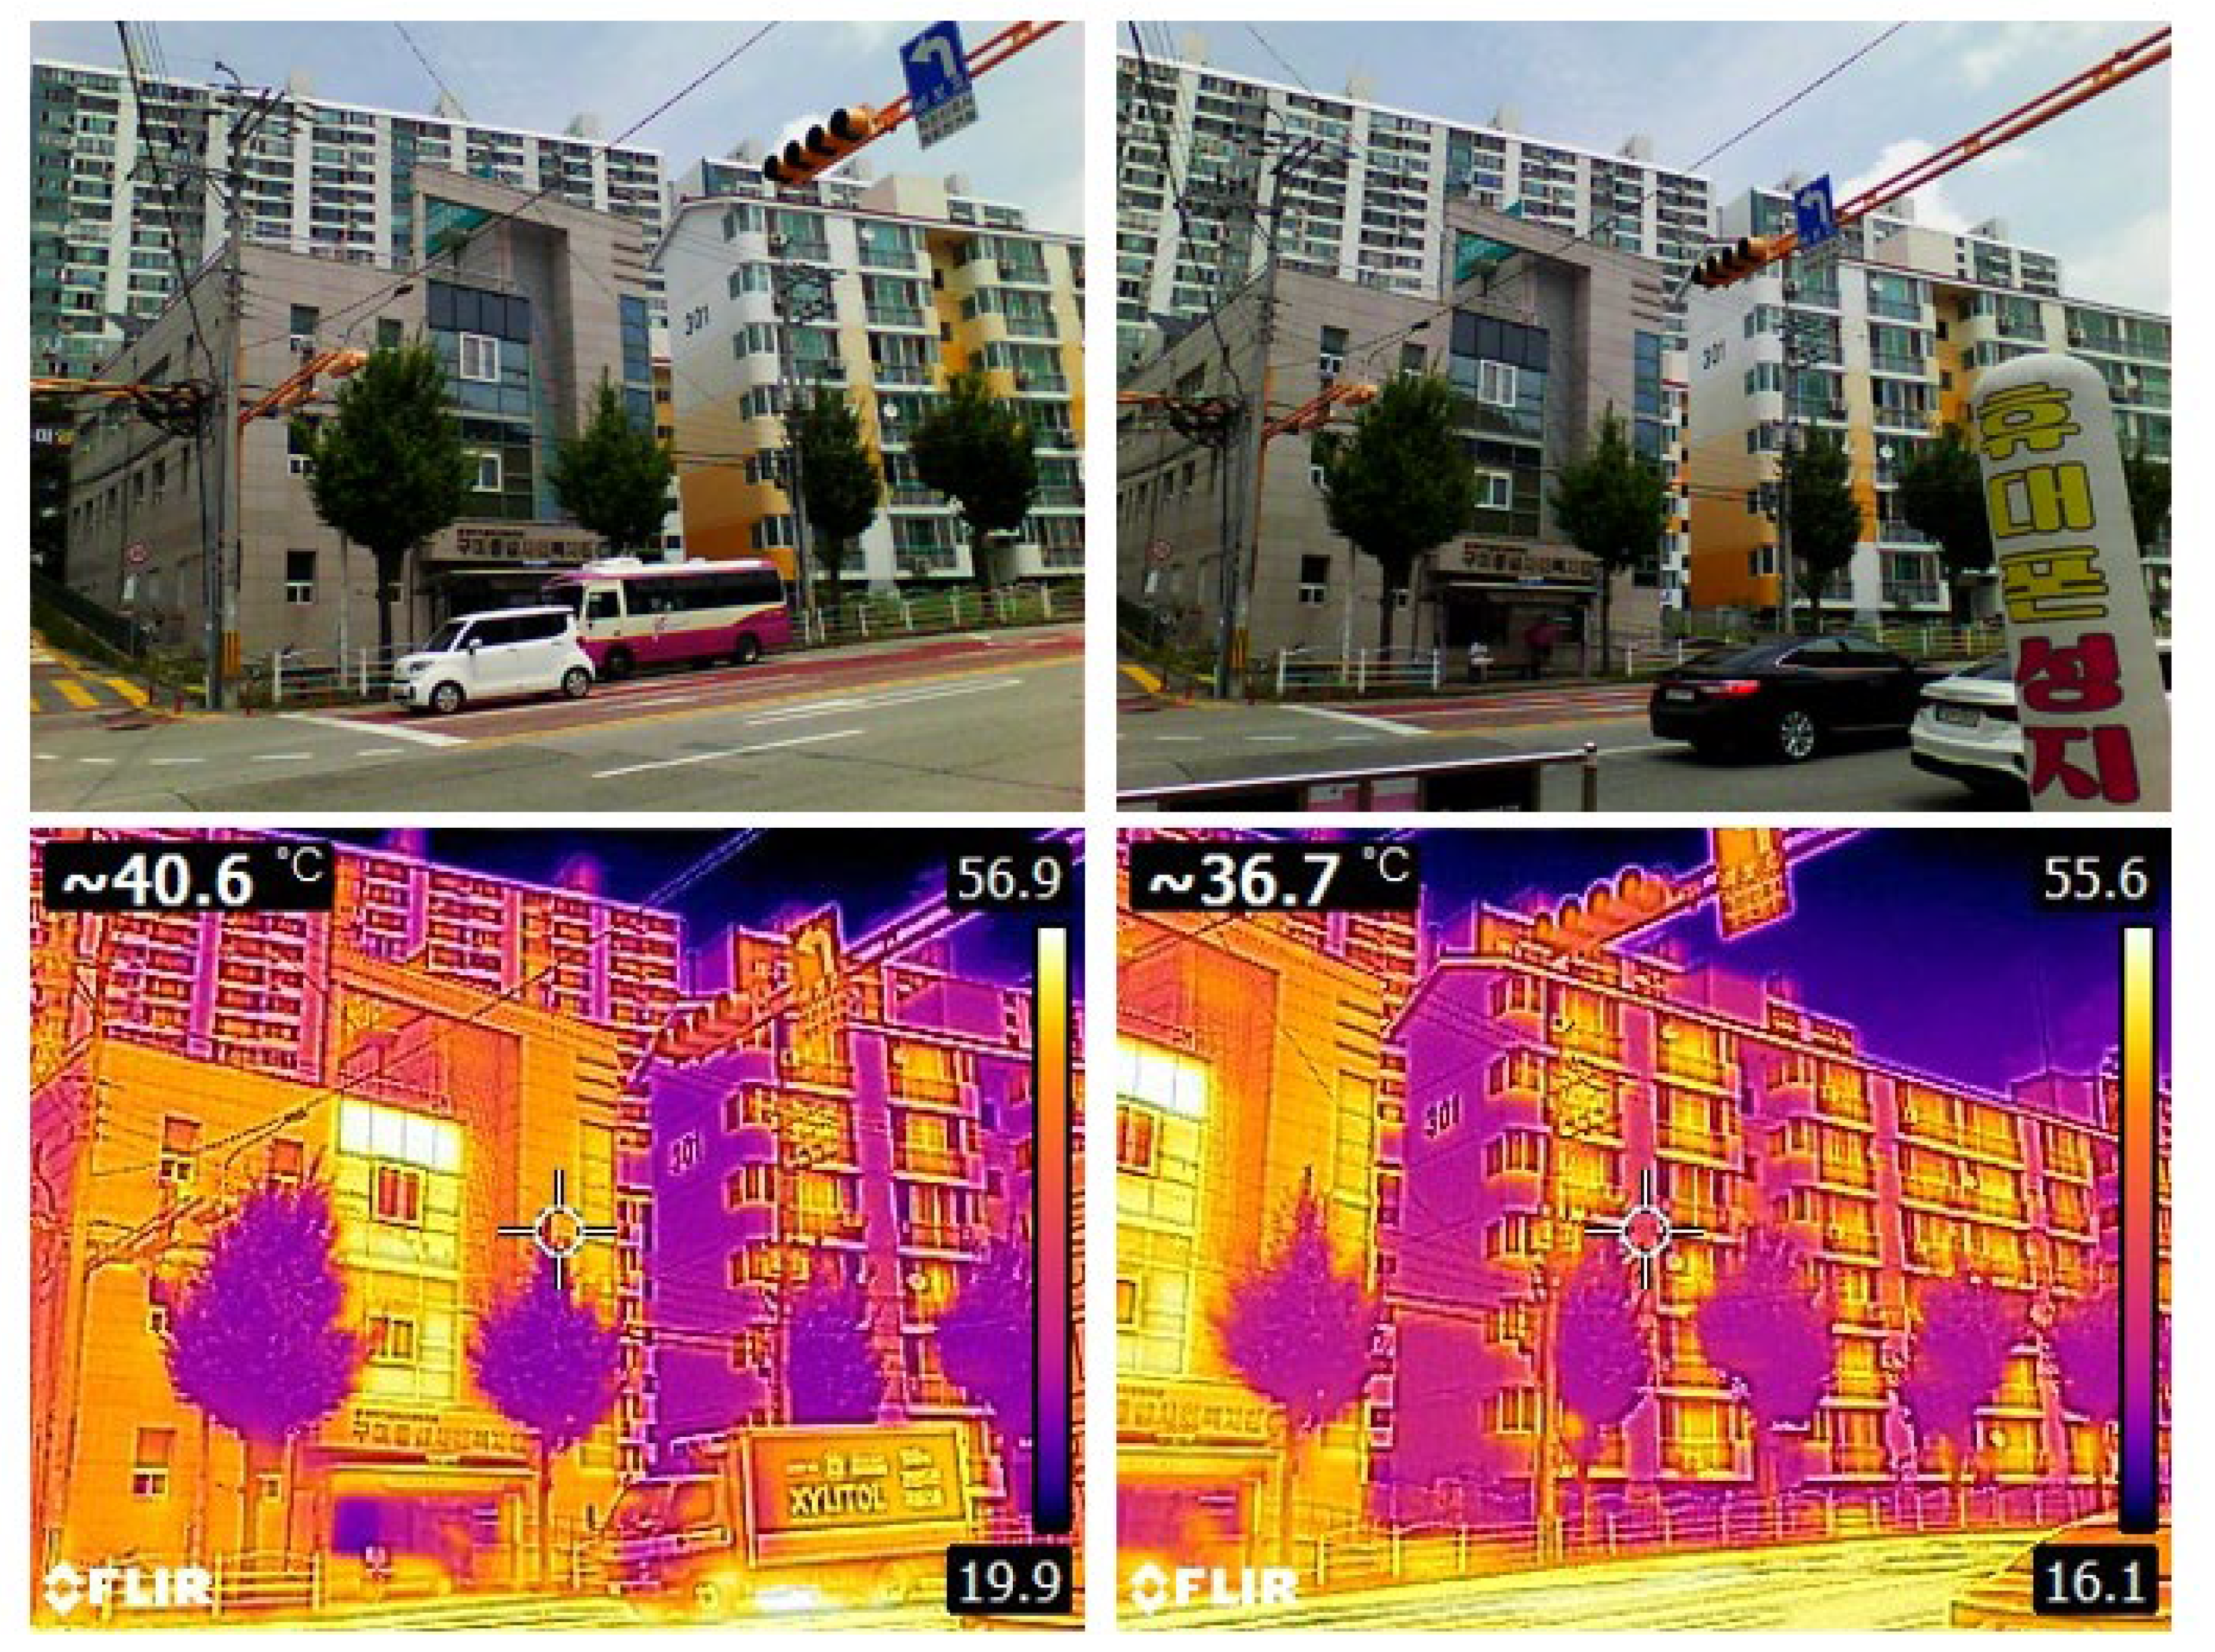
Figure 9.
Surface temperature comparison between the experimental and control groups using thermal imaging (August 8th, 12:20 PM).
Figure 9.
Surface temperature comparison between the experimental and control groups using thermal imaging (August 8th, 12:20 PM).
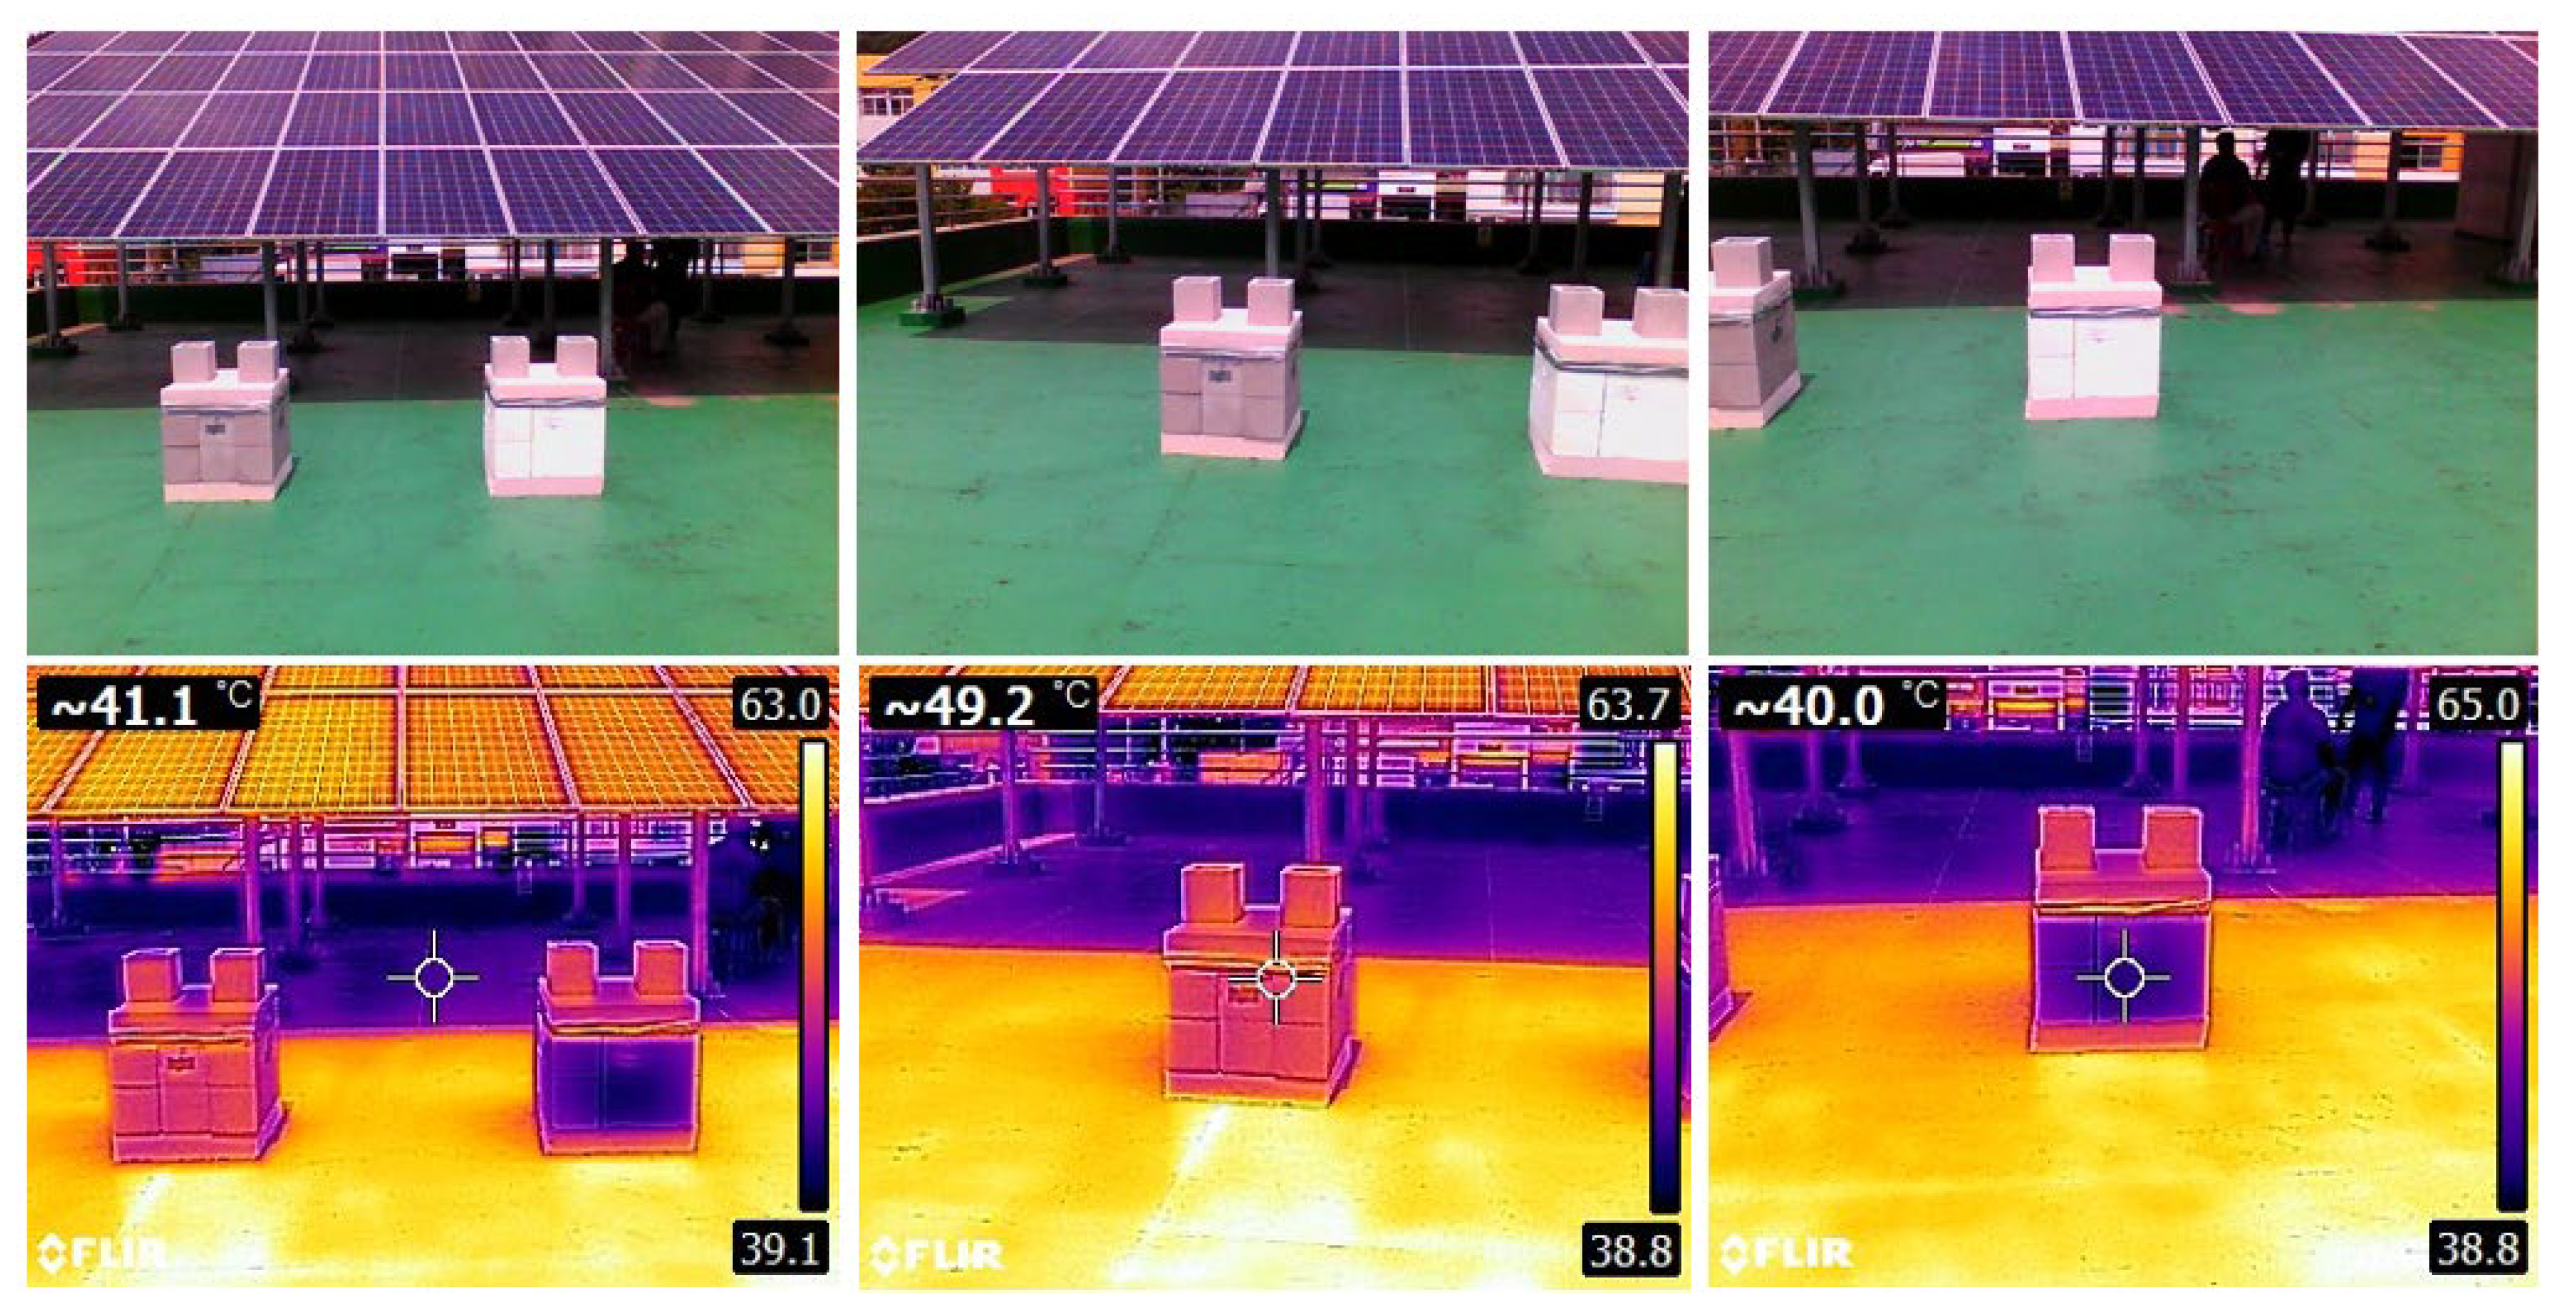
Figure 10.
Temperature comparisons for north, south, east, and west-facing walls, demonstrating the cooling effects of heat-reflective paint between July 30 and August 1.
Figure 10.
Temperature comparisons for north, south, east, and west-facing walls, demonstrating the cooling effects of heat-reflective paint between July 30 and August 1.
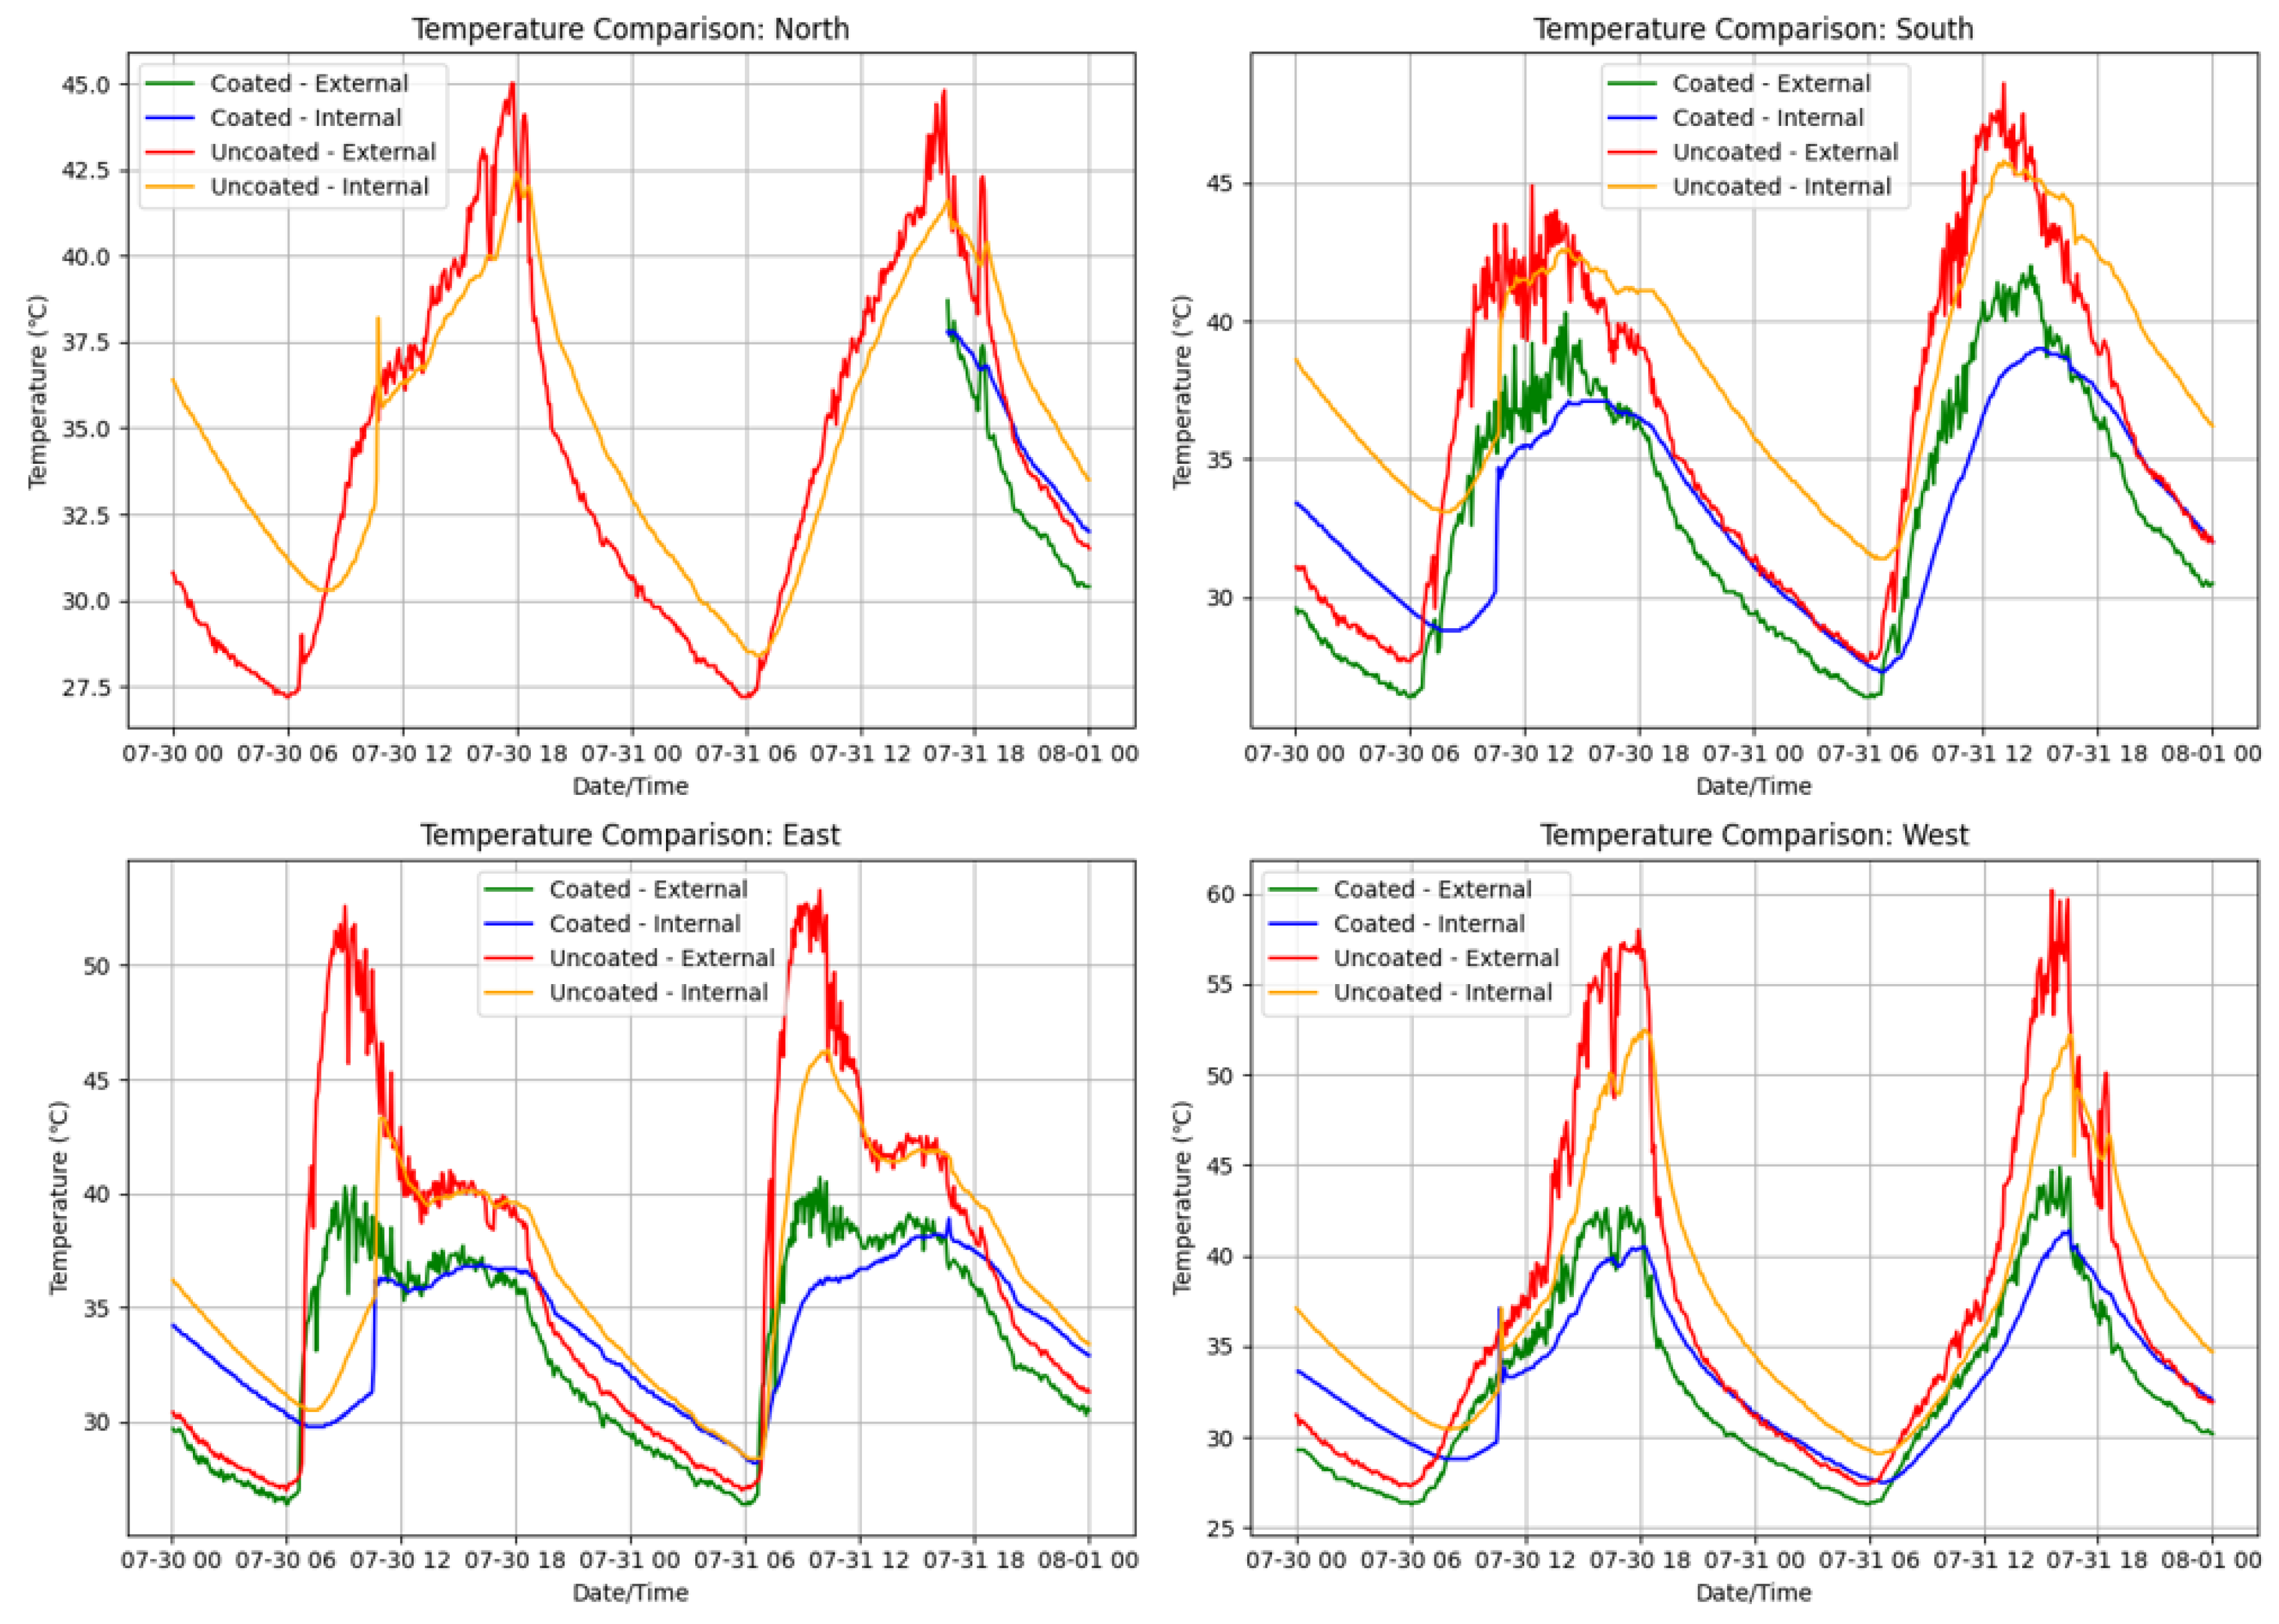
Figure 11.
Indoor temperature changes from July 30 to August 1.
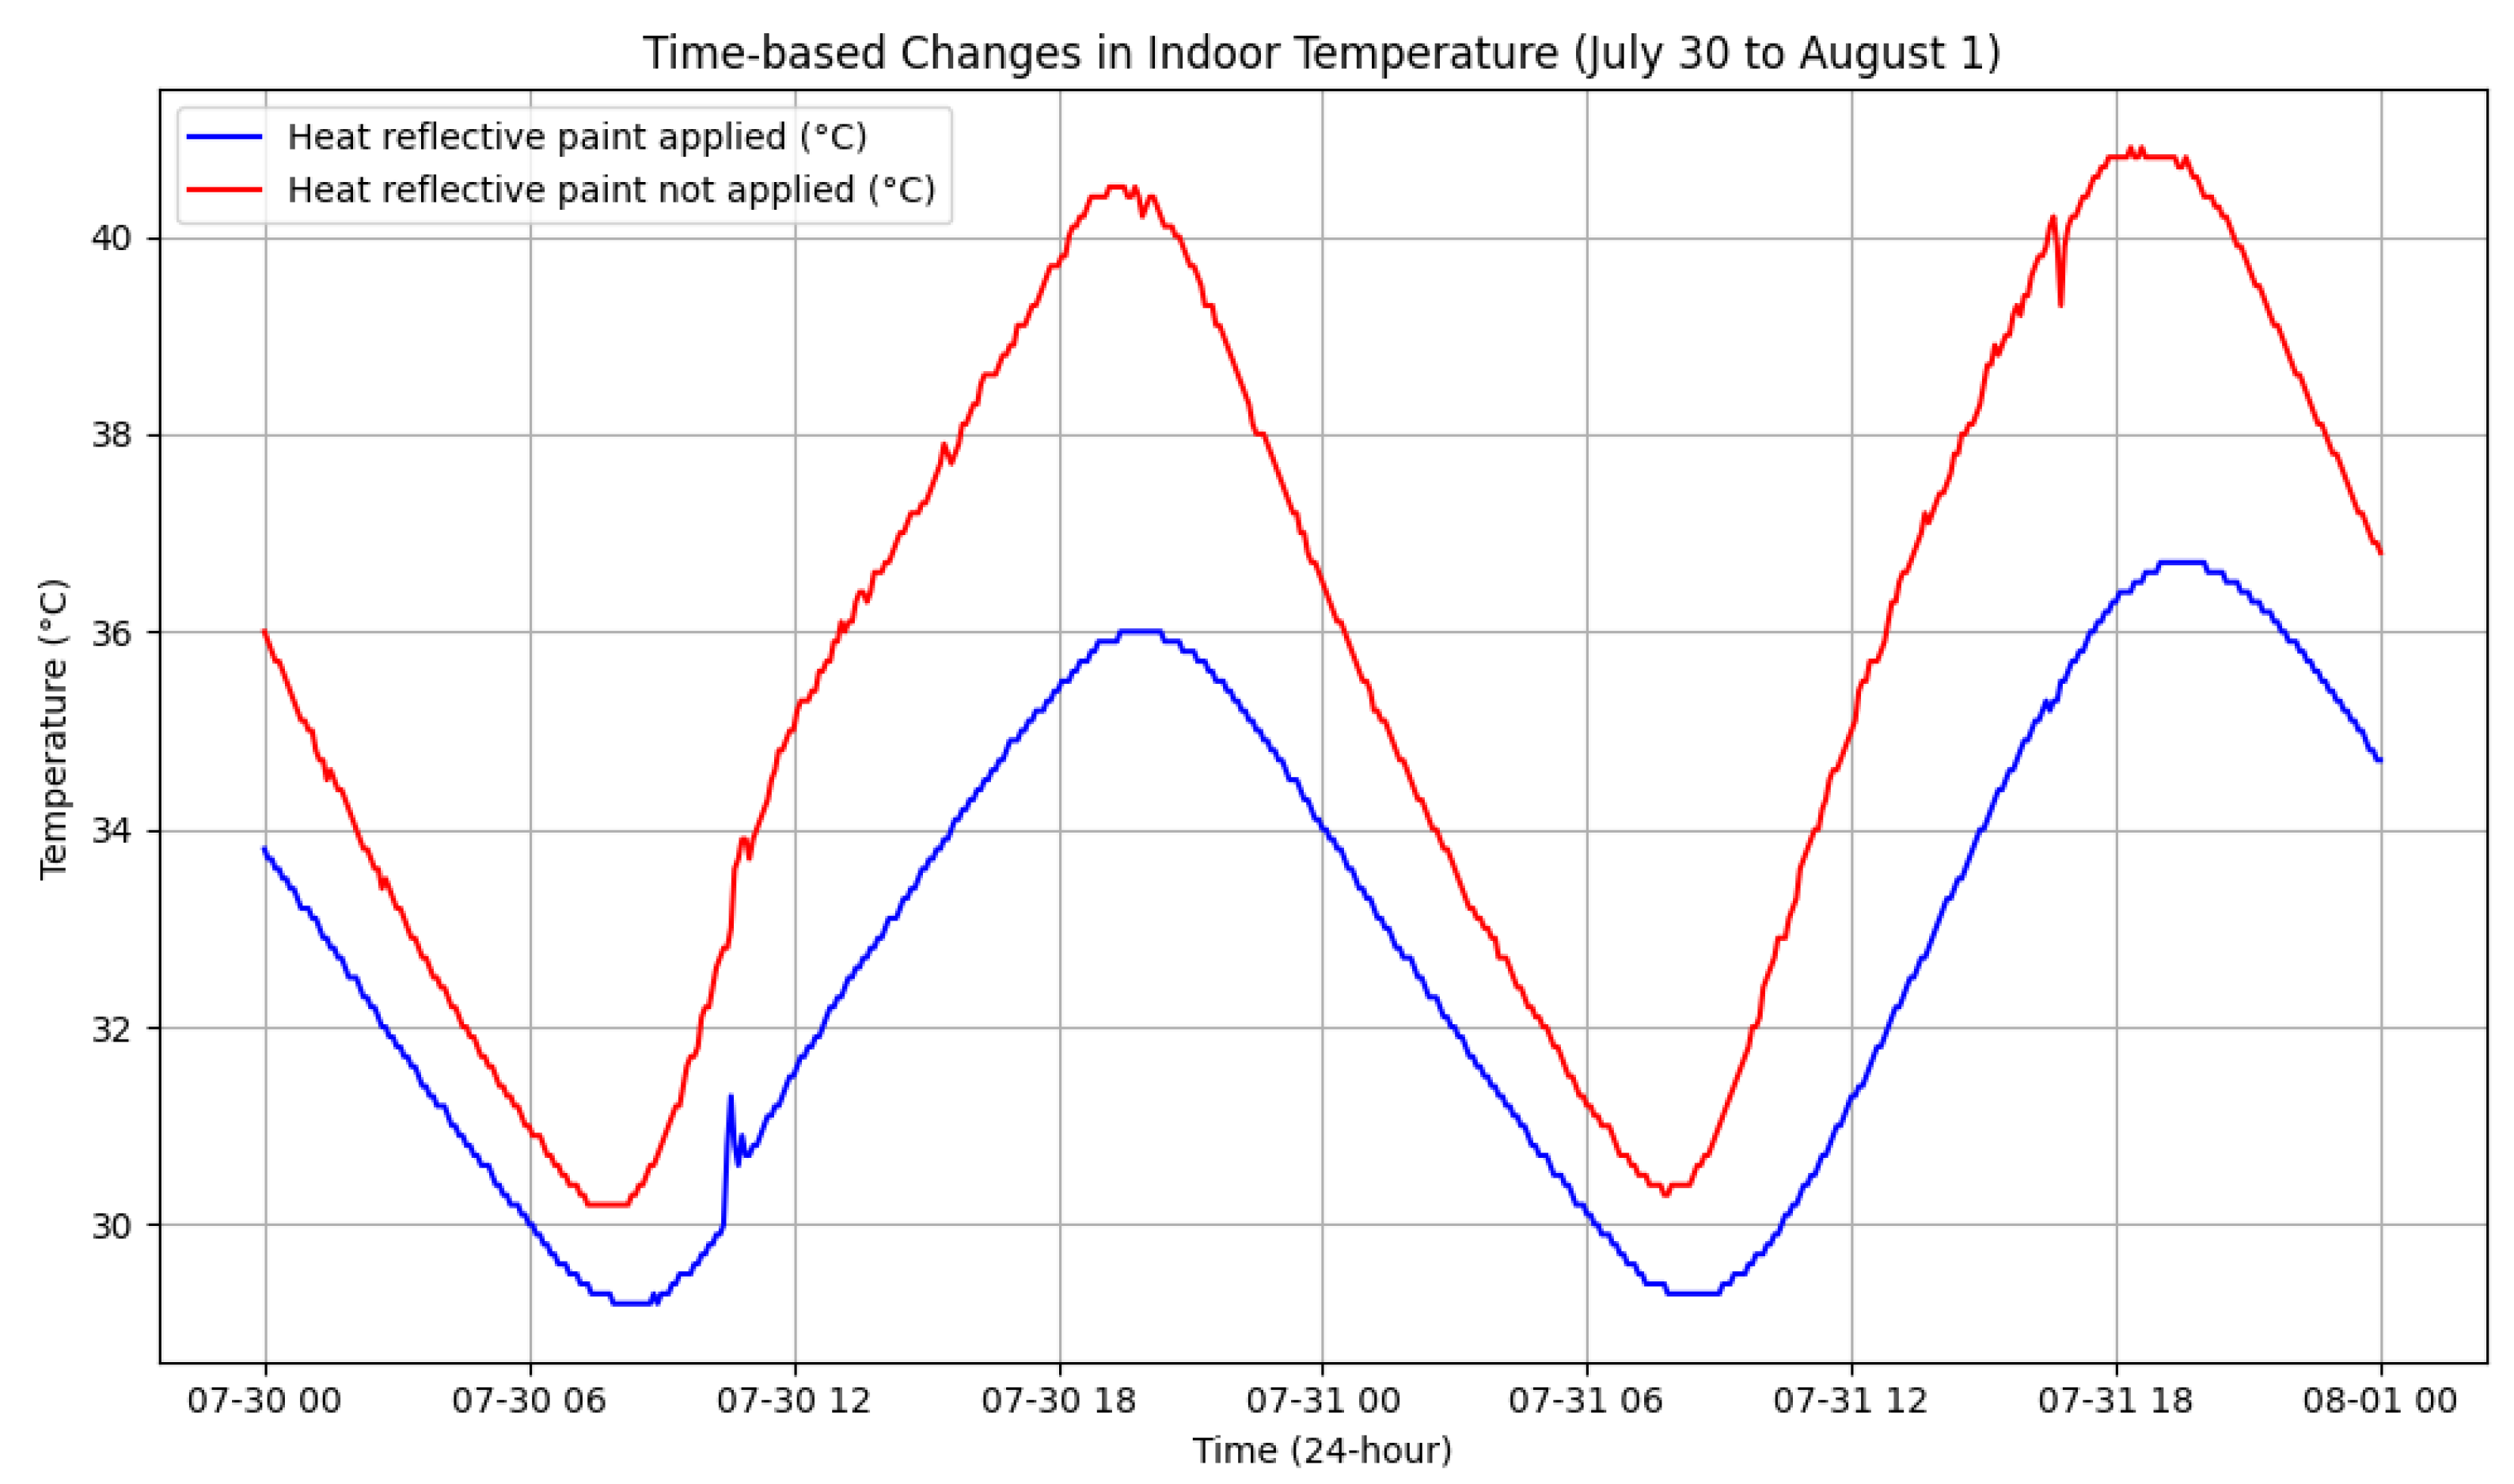
Figure 12.
Time-based changes in temperature and humidity (top: temperature, bottom: humidity).
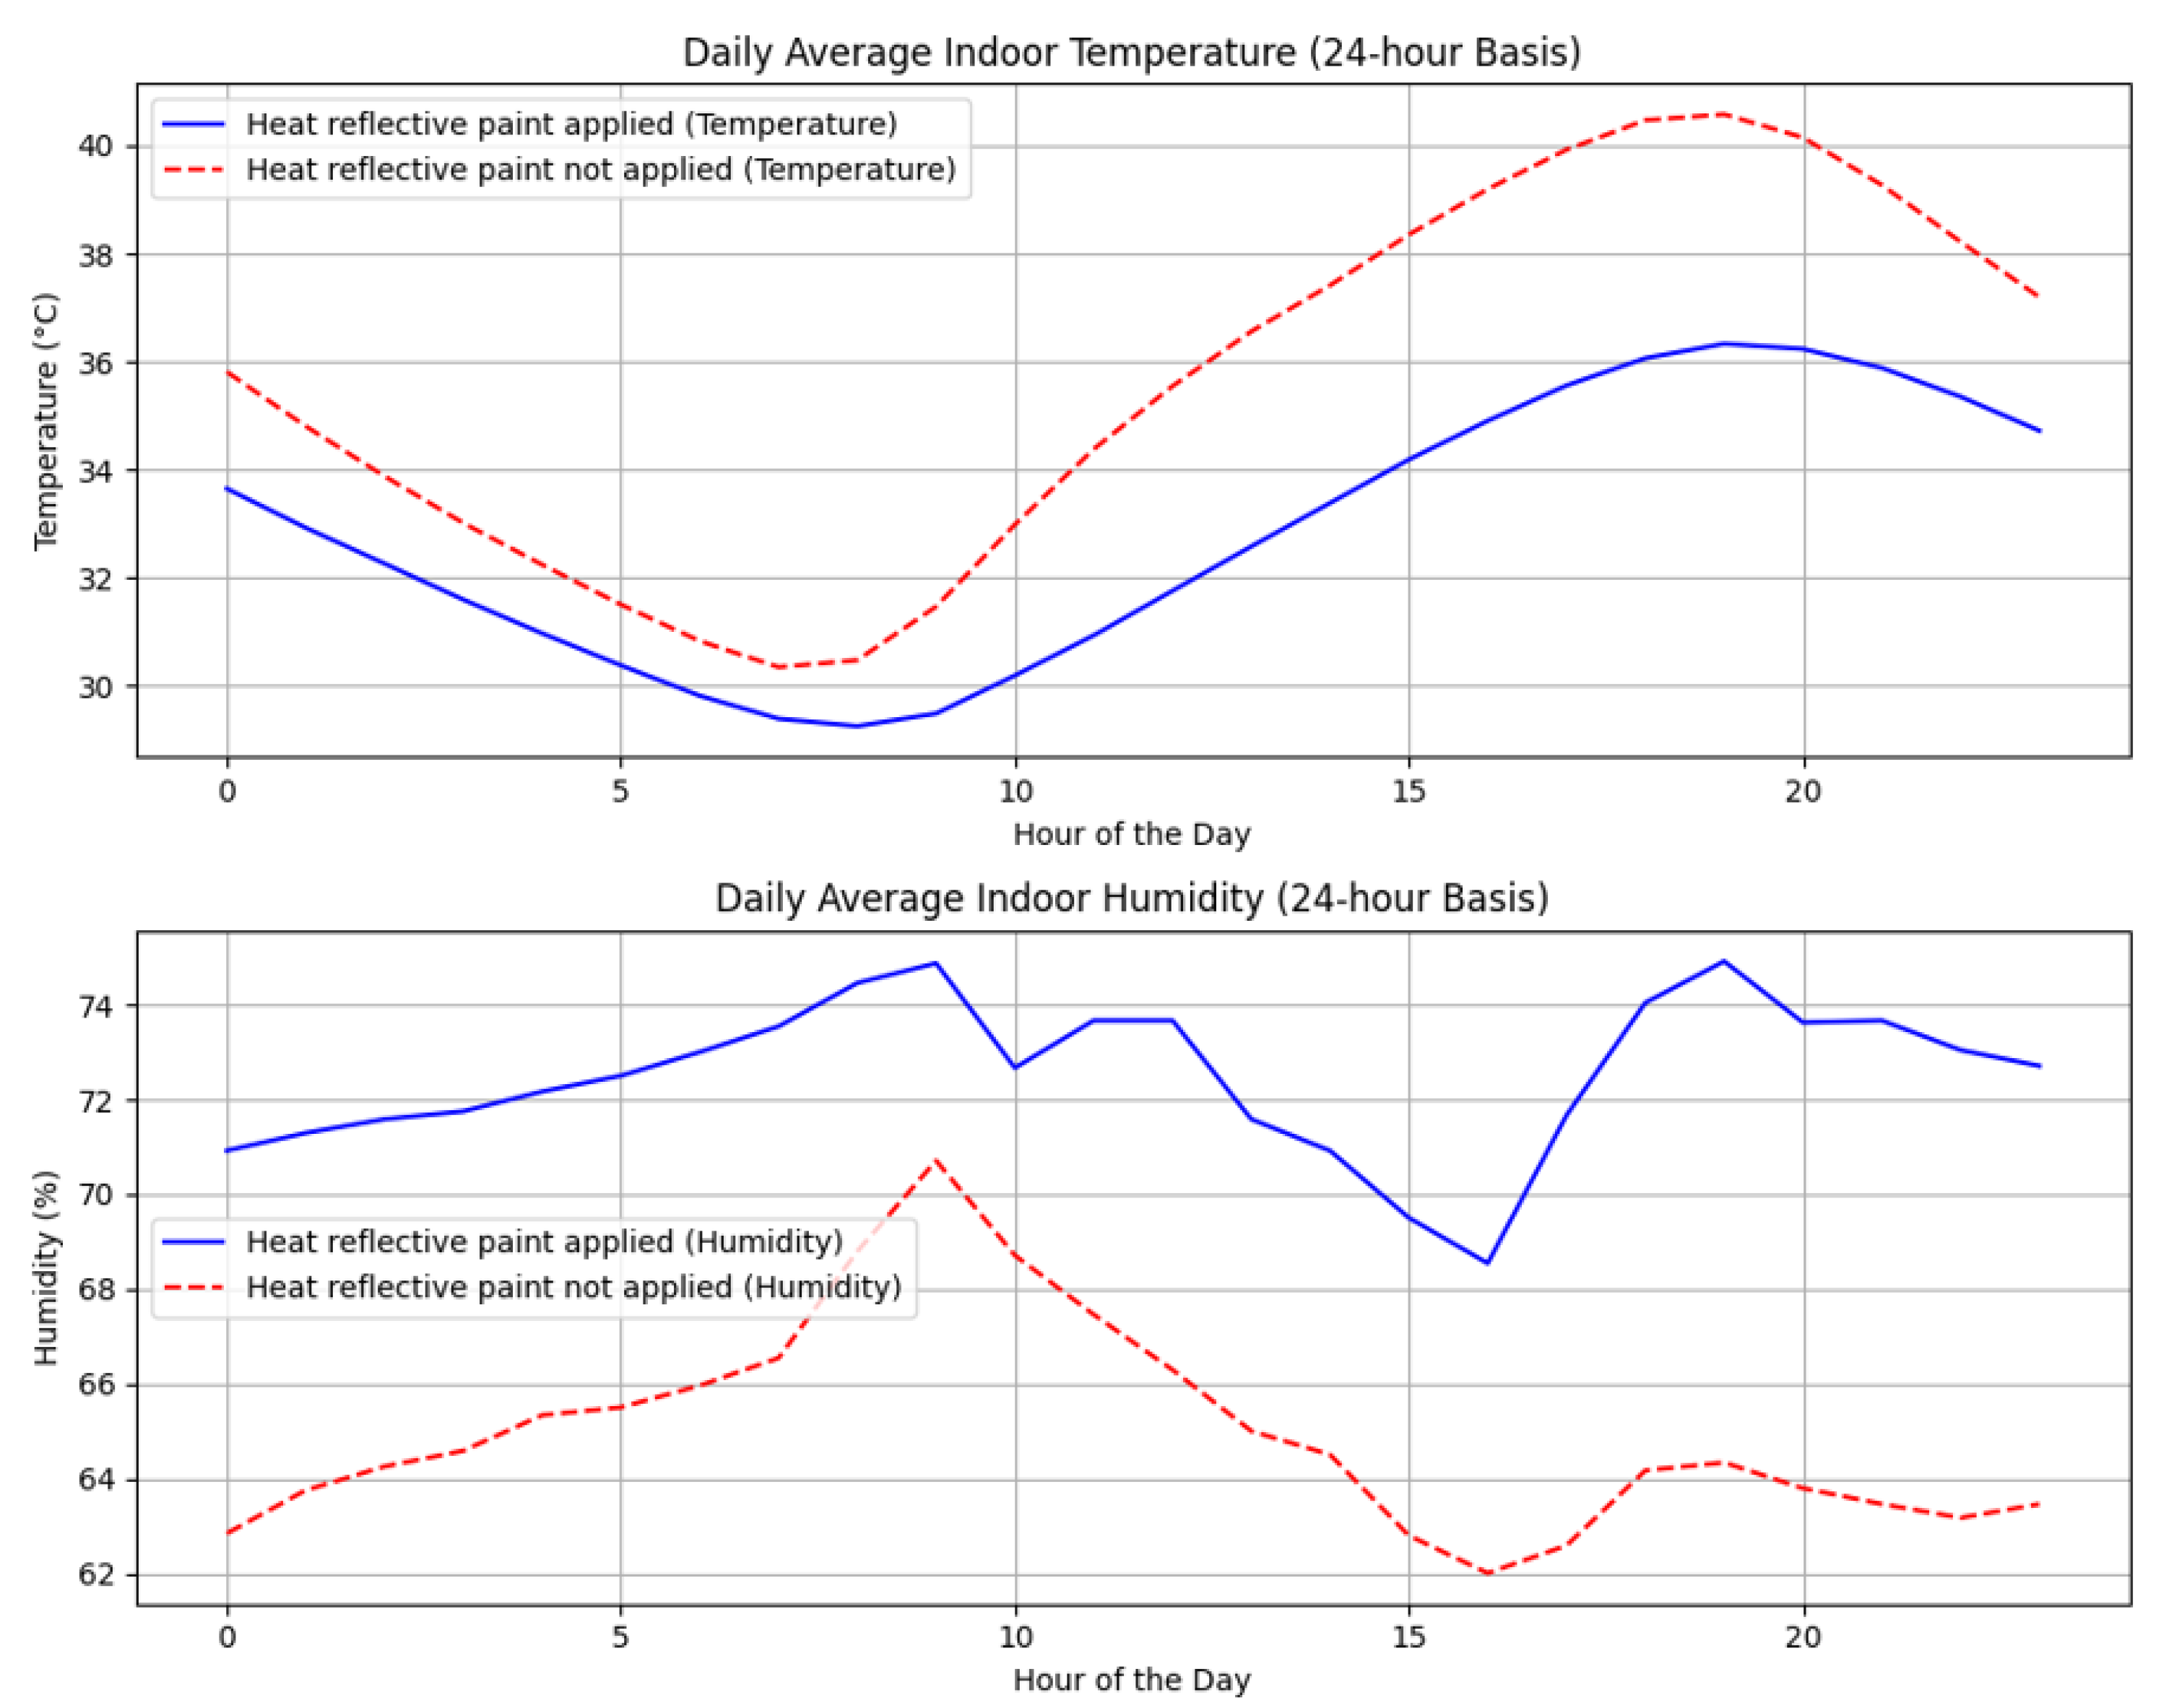
Figure 13.
MRT comparison between buildings with heat reflective paint applied and heat reflective paint not applied.
Figure 13.
MRT comparison between buildings with heat reflective paint applied and heat reflective paint not applied.
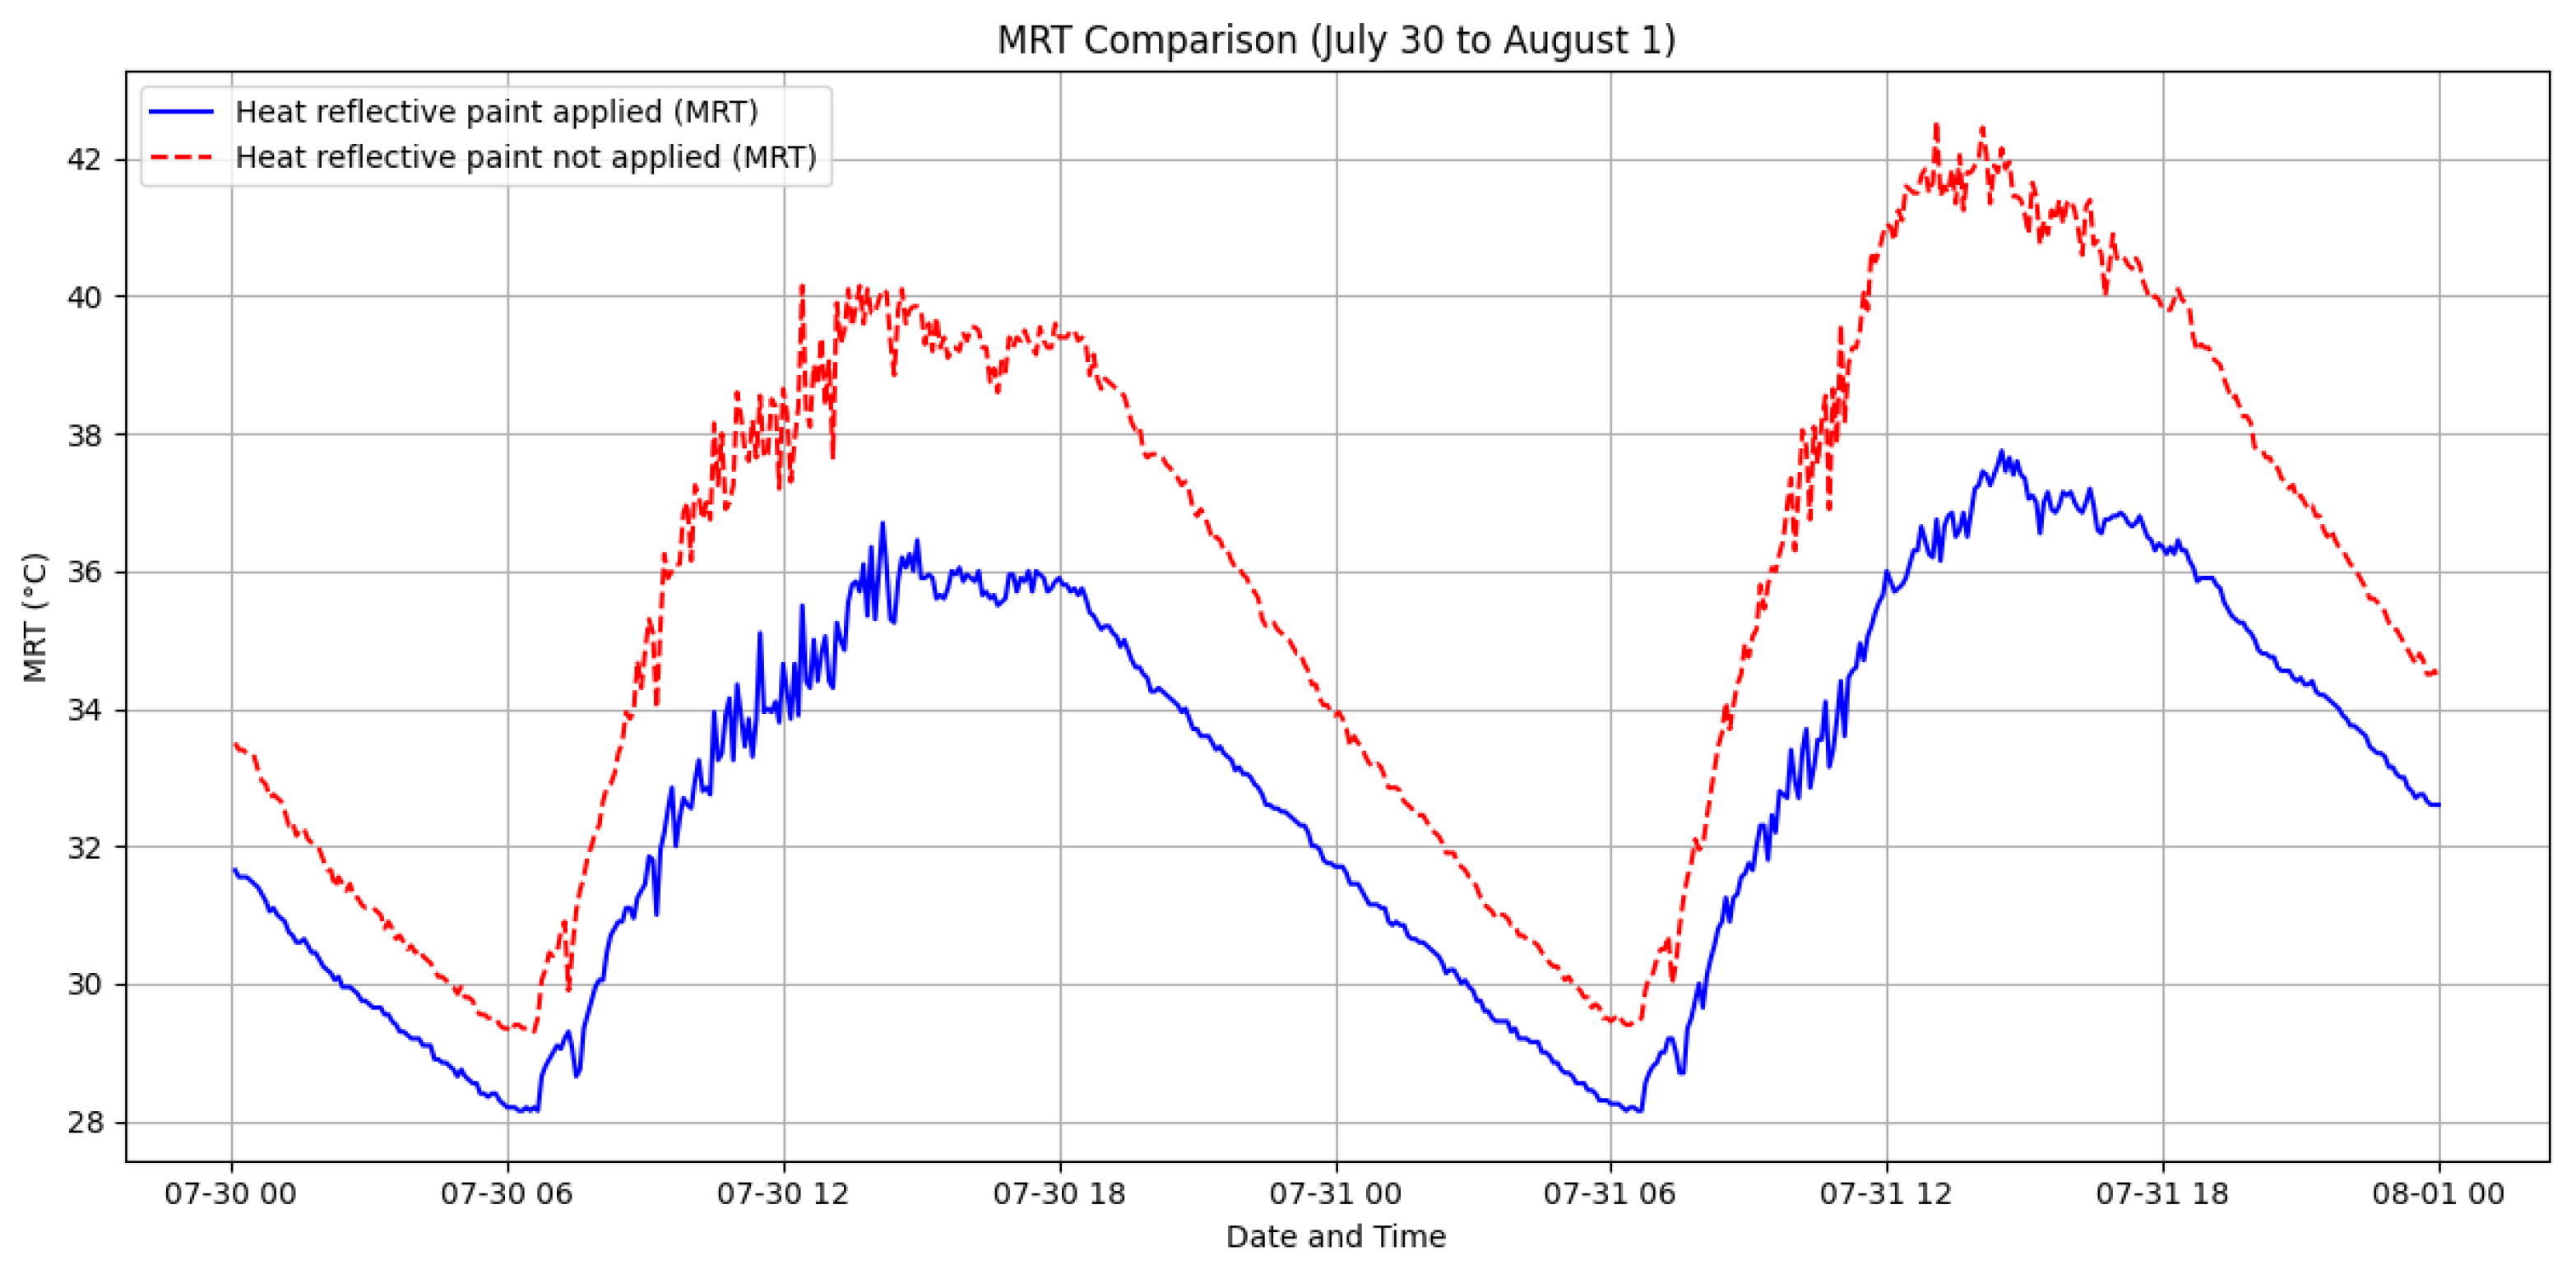
Figure 14.
UTCI comparison between buildings with heat reflective paint applied and heat reflective paint not applied.
Figure 14.
UTCI comparison between buildings with heat reflective paint applied and heat reflective paint not applied.
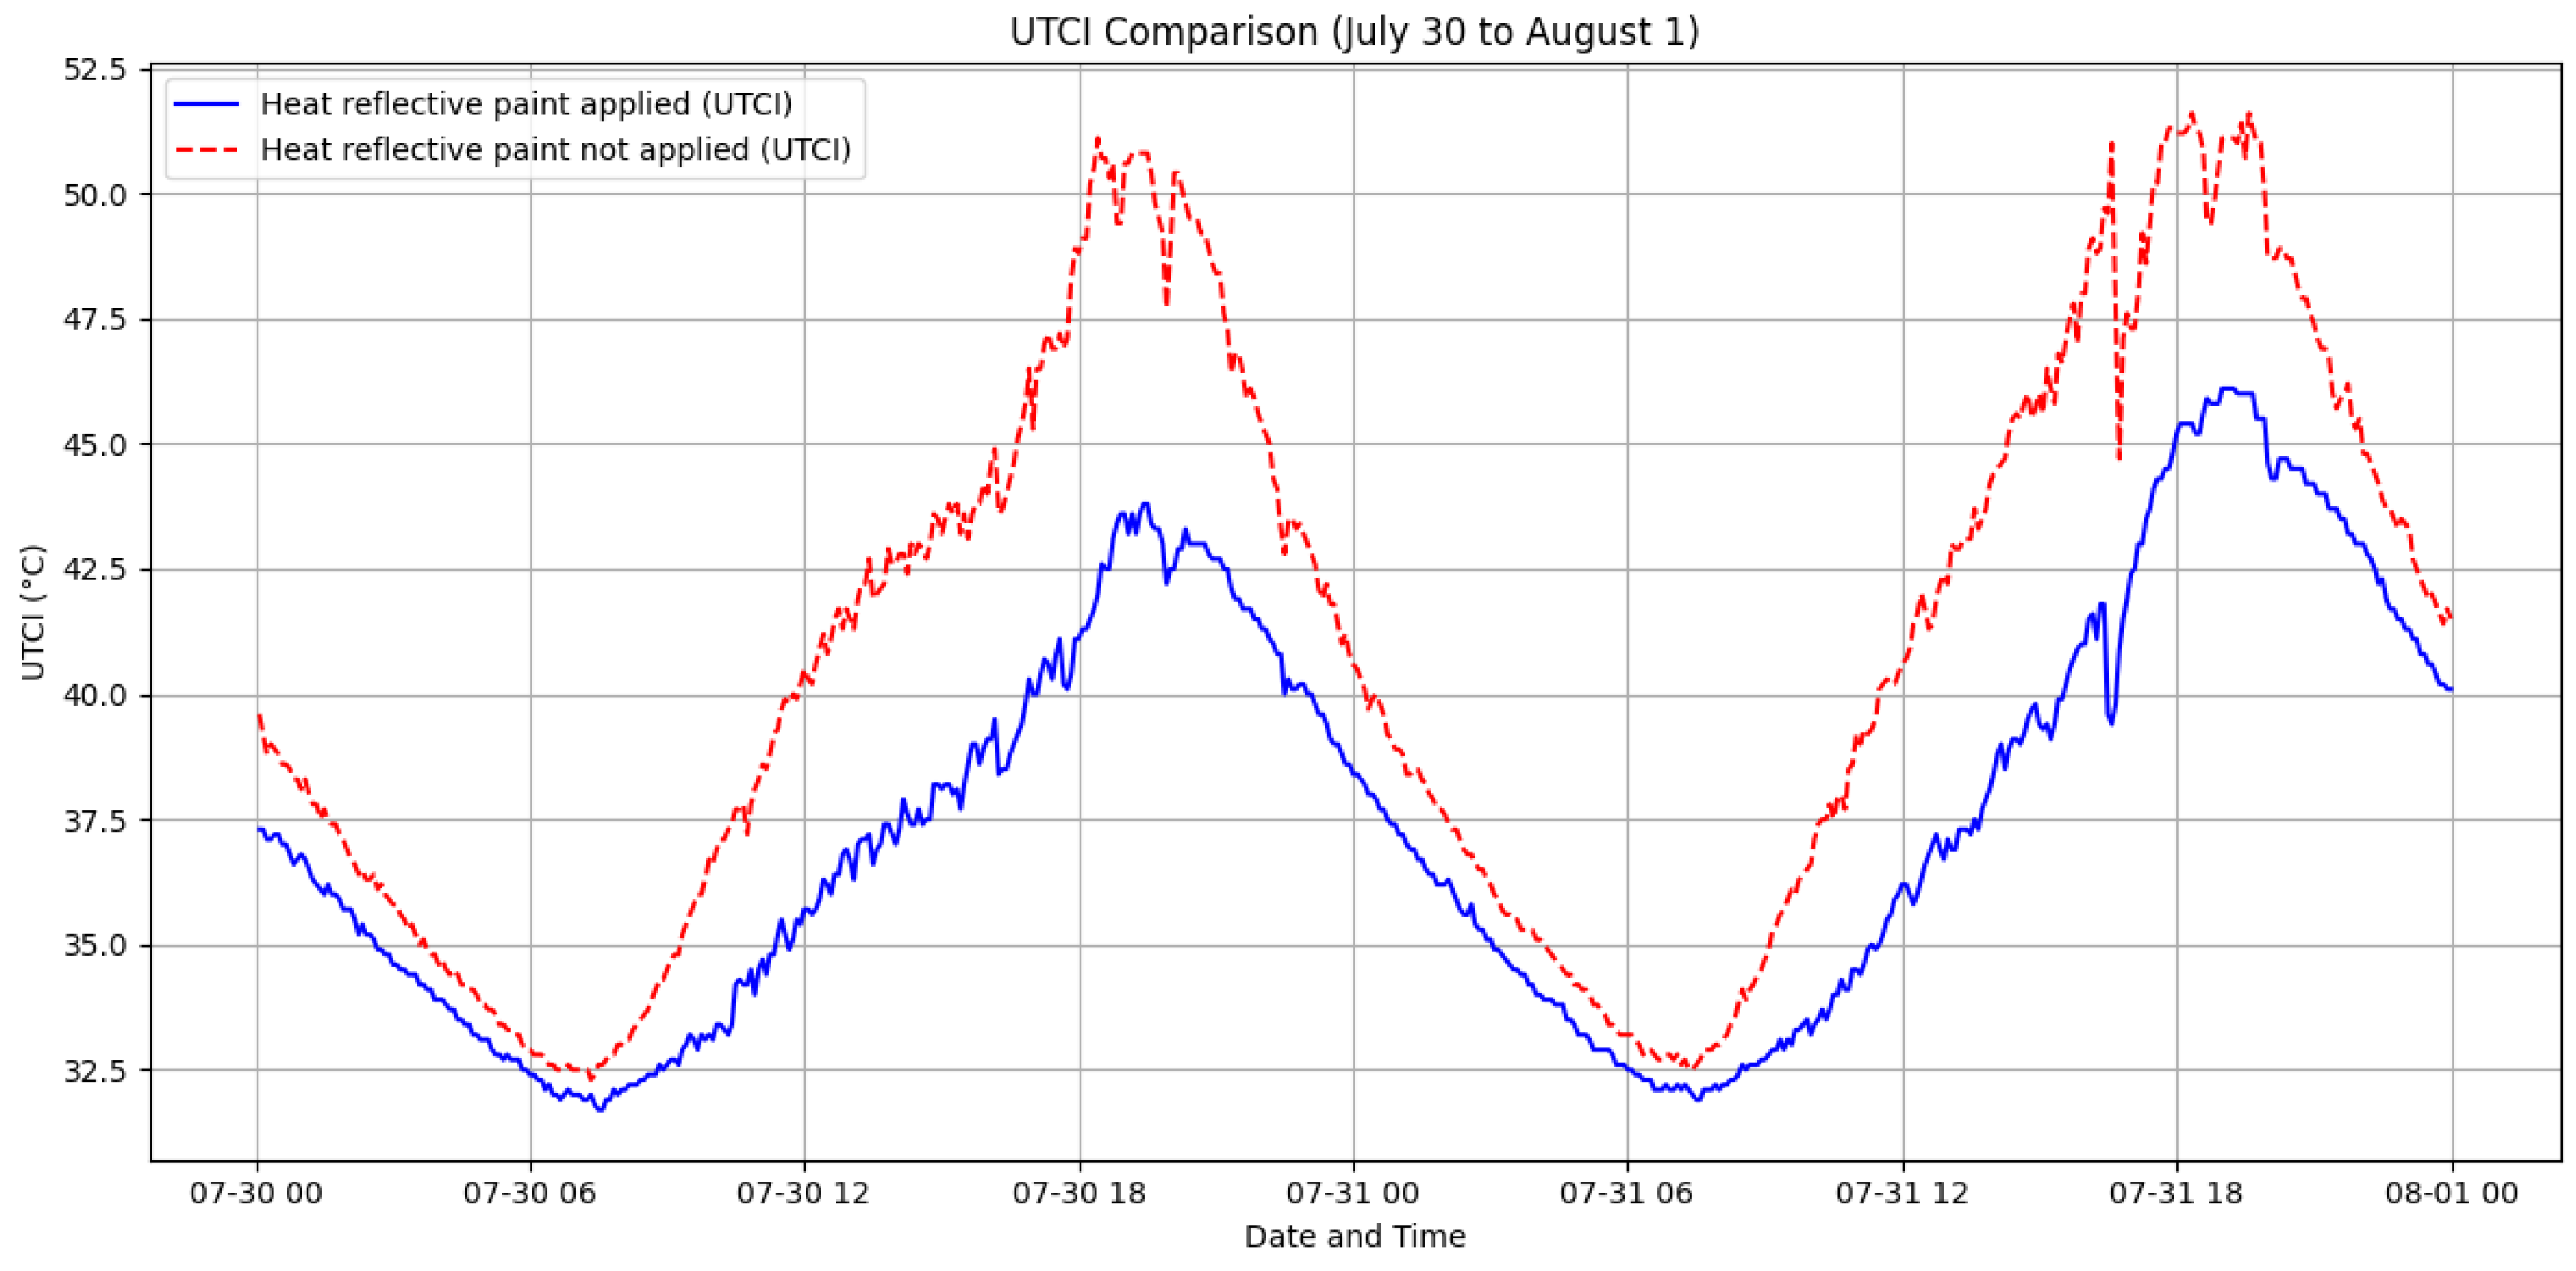

Table 1.
Measurement items of meteorological sensors. (Source: Ecowitt).
| Device | Measurement Item | Range | Accuracy | Resolution | |
|---|---|---|---|---|---|
| Sensor | Total Solar Radiation | 0 ~ 2000 W | ±10 W | 0.1 W | |
| Dry Bulb Temperature | -40°C ~ 60°C | ±0.5°C | 0.1°C | ||
| Relative Humidity | 1% ~ 99% | ±5% | 1% | ||
| Black Globe Temperature | -40°C ~ 150°C | ±0.1°C | 0.1°C | ||
| Surface Temperature | -40°C ~ 100°C | ±0.1°C | 0.05°C | ||
| Atmospheric Pressure | 300 ~ 1100 hPa | ±5 hPa | 0.1 hPa | ||
| Network | Device Status Check | ||||
| Power | Continuous Power Supply | ||||
Table 2.
Measured temperatures of walls with and without heat-reflective paint (external and internal surfaces).
Table 2.
Measured temperatures of walls with and without heat-reflective paint (external and internal surfaces).
| Device Measurement Item |
Heat-Reflective Paint Applied | Heat-Reflective Paint Not Applied |
Temperature Difference (°C) | ||||
|---|---|---|---|---|---|---|---|
| Exterior | Interior | Exterior | Interior | Exterior | Interior | ||
| East | Average (°C) | 34 | 34.4 | 37.3 | 37.3 | 3.4 | 2.9 |
| Maximum (°C) | 41.4 | 38.9 | 53.3 | 46.3 | 11.9 | 7.4 | |
| Minimum (°C) | 26.4 | 28,2 | 27 | 28.4 | 0.6 | 0.2 | |
| West | Average (°C) | 33.5 | 33.6 | 37.8 | 37.7 | 4.3 | 4.1 |
| Maximum (°C) | 44.9 | 41,4 | 60.2 | 52.5 | 15.3 | 11.1 | |
| Minimum (°C) | 26.3 | 27.5 | 27.4 | 28,1 | 1.1 | 1.6 | |
| South | Average (°C) | 32.7 | 33.6 | 36.9 | 37.7 | 3.1 | 5.1 |
| Maximum (°C) | 38.7 | 39 | 48.6 | 52.5 | 6.6 | 6.8 | |
| Minimum (°C) | 26.6 | 27.3 | 27.2 | 2.11 | 1.3 | 4.1 | |
| North | Average (°C) | 33.8 | 33.1 | 34.9 | 37.7 | 2.2 | 2.1 |
| Maximum (°C) | 42 | 27.8 | 45 | 52.5 | 6.3 | 4.6 | |
| Minimum (°C) | 26.4 | 28.8 | 27.2 | 29.1 | 0.5 | 0.4 | |
Table 3.
Measured indoor temperatures with and without heat-reflective paint..
| Measurement Date | Heat-Reflective Paint Applied | Heat-Reflective Paint Not Applied | Temperature Difference (°C) | |
|---|---|---|---|---|
| 2024-07-30 | Average (°C) | 34.2 | 38 | 3.8 |
| Maximum (°C) | 36 | 40.5 | 4.5 | |
| Minimum (°C) | 30.7 | 33.7 | 3 | |
| 2024-07-31 | Average (°C) | 33 | 35.8 | 2.8 |
| Maximum (°C) | 36.7 | 40.9 | 4.2 | |
| Minimum (°C) | 29.3 | 30.3 | 1 | |
| 2024-08-01 | Average (°C) | 32.7 | 35.2 | 2.5 |
| Maximum (°C) | 36 | 39.8 | 3.8 | |
| Minimum (°C) | 30,5 | 31.5 | 1 | |
Table 4.
Independent t-test results (Overall temperature and 2:00 PM - 5:00 PM temperatures)..
| Measurement Item | Temperature | t(p)_ | ||||
|---|---|---|---|---|---|---|
| N | Average(°C) | Variance | ||||
| Temperature | Temperature (All times) | Applied | 863 | 33.01 | 5.13 | 1.64 |
| Not Applied | 35.73 | 10.34 | 0 | |||
| Temperature (2:00 PM - 5:00 PM) | Applied | 111 | 34.27 | 0.51 | 1.65 | |
| Not Applied | 38.41 | 0.82 | 0 | |||
Table 5.
Independent t-test results (Overall humidity and 2:00 PM - 5:00 PM humidity).
| Measurement Item | Humidity | t(p)_ | ||||
|---|---|---|---|---|---|---|
| N | Average(°C) | Variance | ||||
| Humidity | Humidity (All times) | Applied | 863 | 73.06 | 4.32 | 1.64 |
| Not Applied | 65.16 | 4.79 | 0 | |||
| Humidity (2:00 PM - 5:00 PM)) | Applied | 111 | 70.72 | 8.49 | 1.65 | |
| Not Applied | 63.62 | 3.73 | 0 | |||
Disclaimer/Publisher’s Note: The statements, opinions and data contained in all publications are solely those of the individual author(s) and contributor(s) and not of MDPI and/or the editor(s). MDPI and/or the editor(s) disclaim responsibility for any injury to people or property resulting from any ideas, methods, instructions or products referred to in the content. |
© 2024 by the authors. Licensee MDPI, Basel, Switzerland. This article is an open access article distributed under the terms and conditions of the Creative Commons Attribution (CC BY) license (https://creativecommons.org/licenses/by/4.0/).
Copyright: This open access article is published under a Creative Commons CC BY 4.0 license, which permit the free download, distribution, and reuse, provided that the author and preprint are cited in any reuse.


