Submitted:
18 October 2024
Posted:
18 October 2024
You are already at the latest version
Abstract
The basal division of posterior pallial amygdala (PoAb) was one important part of the amygdala in birds. PoAb mainly mediated turning behavior. However, the regulating neuromechanisms of PoAb in motor behavior was not clear yet. In this study, we selected septalis lateralis (SL) as the stimulated nucleus because it was closely associated with PoAb and had clear neuroregulatory functions, and the unrelated nuclei (entopallium) and unstimulated blank treatment (CK) selected as controls. A total of 622 differentially expressed genes (DEGs) were obtained from PoAb after comparing the SL stimulating group with the CK control group. GO functional annotation and KEGG pathway enrichment analysis showed that the upregulated 608 DEGs mainly involved energy supply and fluid balance. A total of 345 DEGs were obtained when comparing SL stimulation group and entopallium stimulation group. The upregulated 187 DEGs were mainly involved in cell communication and signal transductions. The study indicated that PoAb may modulate motor behaviour mainly by increasing ATP production and facilitating synaptic transmission, in which genes such as SMAD3, TMED3, GRIA2, HTR1B and SNCG play an important role. We revealed the neuromechanisms of brain regulation behaviour from gene level, and provided the theoretical foundation for understanding the avian brain.
Keywords:
Pigeons
; Basal division of posterior pallial amygdala
; Transcriptome
; Motor regulation neuromechnisms
1. Introduction
The basal division of posterior pallial amygdala (PoAb) was one of the important components of the amygdala, it was located on the ventrolateral part of the posterior telencephalon, and PoAb mainly mediated the turning movement in birds [1-4]. The regulating neuromechanisms of mammalian amygdala was relatively clear, it can initiate predatory behavior and regulate the expression of appetitive behavior [5-6]. However, there were few studies on the neuromechanisms of bird’s amygdala regulate on behavior regulation.
In birds, septalis lateralis (SL) was located in the middle and lower part of the rostral telencephalon near the raphe, and its function was similar to that of mammals. SL was mainly involved in the regulation of emotion, motivation, metabolism and feeding behavior, and it may regulate the interaction between hippocampus and other regions that mediate goal-directed behavior [7-10]. Entopallium (E) was located in the middle of the rostral telencephalon of birds, it was an important part of the visual system of birds. E received neural projections from the thalamus, and its function was similar to that of the IV visual cortex in the neocortex of the mammalian striatum [3, 11-14]. Existing studies have shown that PoAb had a bidirectional association with SL, and their responsive behavior were the same after electrical stimulation [4, 15]. However entopallium has no fiber connection with PoAb and SL [4, 14-15].
Transcriptome sequencing can qualitatively and quantitatively analyze the transcripted mRNA of all genes from tissues or cells at a specific state or a specific period of time [16-18]. At present, the position boundary, the distribution of different neurotransmitter receptors, the fiber connections and the neuroregulation function of avian’s PoAb were relatively clear, but the regulation neuromechnisms of PoAb on motor behavior in pigeons was not clear from the transcriptomic angle [1-4, 19].
In this study, we utilized pigeons (Columba livia) as the research object. Pigeons with implanted electrodes in the right SL were categorized as the SL group, those with electrodes in the right E were categorized as the E group, and those without any implants were categorized as the CK group. By conducting a comparative transcriptome analysis of PoAb on the above three different treatments, we investigated the neuromechanisms of PoAb in mediating motor behavior at the gene level.
2. Materials and Methods
2.1. Animals
The adult pigeons (Columba livia) of unknown sexes (350-450 g) were conducted in the experiment. They were all purchased from the breeder. All subjects were housed in individual wire cages (95 × 80 × 65 cm3) with food and water ad libitum. They were fed with a mixture of wheat, corn, sorghum, and soybean at the ratio of 1:1:1:1, and the cages were cleaned twice a week. The study was conducted in accordance with the Guide of Laboratory Animal Management Ordinance of China. All experimental procedures and animal housing and manipulations were approved by and carried out under the guidelines of the Zhengzhou University Animal Care and Use Committee.
2.2. The Efects of Electrical Stimulation on Motor Behaviors
2.2.1. Microstimulation Electrodes Implantation
The subjects were anesthetized by intraperitoneal microinjection of 3% Pelltobarbitalum Natricum (0.12 ml/100g body mass) and then fixed on a stereotaxic apparatus holder customized for the pigeons after they entered anesthesia. After removing the scalp, skull, dura mater and arachnoid mater above the surgical area, microelectrodes (diameter = 120 μm; stainless steel wire, Teflon insulation, California Fine Wire Company, USA) were implanted into the right SL and E respectively (N = 5) and fixed with dental cement. The specific implantation sites were shown in Table 1. The pigeons were placed individually in a rearing cage after completion of the surgery and recovered for approximately one week before behavioral experiments begin. The details of the microelectrode implants procedure were described previously [4].
2.2.2. Behavioral Testing
Behavioral tests were performed in an arena made of polymathic methacrylate (diameter × height, 80 × 80 cm2) after the pigeons recovered. After resting in the test environment for five minutes, electrical stimulation generated by a YC-2-S bipolar programmed stimulator (Chengdu Instrument Factory, Chengdu, China) was applied via the stainless steel electrodes that have been implanted in the pigeon brains (impedance range <0.5 MΩ). And we record the behavioral changes of the pigeon before and after electrical stimulation using a SONY HDR-CX220 camcorder (Sony Corporation, Tokyo, Japan). The stimulation intensity was 0.3-0.8 mA, and the frequency was 20 Hz. The interval between different stimulation intensities was 3-5 minutes. We mainly counted the number of steps and the response rates that can induce ipsilateral lateral behavior of the subjects. The details of the behavioral tests and the different motor behaviors elicited in the arena were all following a standard described previously [4].
2.3. Sampling, RNA Extraction, cDNA Library Construction and RNA Sequencing
The transcriptome sampling can be start immediately after electrical stimulation. Before sampling, the three different groups were all treated according to the same process, that after the end of electrical stimulation they were quickly killed by excessive anesthesia. After the pigeon's whole brain was taken out, the PoAb on the right side of the pigeon were taken out with a disposable scalpel. They were labeled and placed in liquid nitrogen for quick freezing, and then transferred to the refrigerator at -80℃ for use after sampling was completed. The CK group was directly anesthetized and the PoAb on the right side of the pigeon was removed. Total RNA was extracted from the PoAb brain samples using TRIzol reagent (Zhengzhou Beibei Biotechnology Co. Ltd, Zhengzhou, China). The RNA samples were then subject to strict quality control, including detection of RNA concentration and purity using a Nanodrop spectrophotometer (OD 260/280 and OD 260/230), and accurate detection of RNA integrity using an Agilent 2100 Bioanalyzer system (Agilent Technologies, CA, USA), analysis of RNA integrity by 1% agarose gel electrophoresis.
The construction and sequencing of the cDNA library was completed by Biomarker Technologies Co., Ltd. (Beijing, China). Briefly, mRNAs with poly (A) tails were enriched with magnetic Oligo (dT) beads and broken into short fragments of 250-300 bp. The fragmented RNAs were then used as templates to synthesize cDNA double strands. Subsequently, the purified cDNA double strands (around 200 bp) were screened using AMPure XP beads and PCR. After the cDNA library was constructed and qualified, Illumina PE150 (pair end 150 bp) sequencing was performed.
2.4. Differentially Expressed Genes (DEGs) Screening and Identification
The genome of rock pigeon (GCA_001887795.1) was selected as the reference genome [20]. The transcriptome reads of the three different groups were compared to the reference genome through the comparison software Hisat2 (v 2.2.1) [21], and the transcriptome data were quantified using StringTie software (v 2.2.1) [22]. After that, gene differential expression analysis was performed using R package Deseq2 (v 1.34.0) [23] and divided into two comparative groups (SL group vs CK group, SL group vs E group). The screening conditions for SL group vs CK group were set to | log2 (fold change) | >3, and adjusted P <0.01; while SL group vs E group was | log2 (fold change) | = 0, adjusted P <0.05. After the screening of DEGs was completed, the volcano map of DEGs was drawn using R package ggplot2. Finally, the String (https://string-db.org/) database and Cytoscape 3.7.2 [24] were used to analyze the protein interactions of the DEGs.
2.5. Enrichment Analysis of DEGs
The study utilized annotation information corresponding to DEGs in the reference genome of the rock pigeon as a gene list for enrichment analysis, and the annotation information of all the genes in the rock pigeon reference genome was used as the background gene set. Annotation and functional analysis of DEGs were carried out through KOBAS 3.0 (http://kobas.cbi.pku.edu.cn/) [25], so as to determine the main metabolic pathways and signaling pathways involved in DEGs, and determine its biological functions. The R software package clusterProfiler (v 3.10.1) was used for GO function annotation and KEGG path enrichment analysis. The enrichment analysis used hypergeometric test to calculate P-value significance, and the enrichment results were corrected by Benjamilli & Hochberg multiple hypothesis test method. The enriched DEGs with a number greater than five and adjusted P < 0.05 were defined as significantly enriched.
2.6. RT-qPCR Analysis and Validation
In order to verify the reliability of transcriptome analysis results, RT-qPCR experiments were conducted with the same batch of sample RNA sequenced with transcriptome. The primers for RT-qPCR were designed using Oligo7 software and tested for specificity by querying in Primer- BLAST (https://www.ncbi.nlm.nih.gov/tools/primer-blast/), and the template of primer design selected the DEGs in transcriptome analysis. β-actin was used as the internal reference gene, and the designed primer could not be used until it was certified [26]. The RT-qPCR procedure was performed in a 10 μL reaction mixture (1 μl of cDNA, 0.5 μl of forward primer, 0.5 μl of reverse primer, 5 μL of UltraSYBR mixture and 3 μl of ddH2O) using a LightCycler 480 (Roche Diagnostics, Germany). To reduce experimental error, three technical replicates were designed for each gene sample in the 96-well plate and each individual was subjected to three replicates simultaneously. RT-qPCR reaction was performed in Roche LightCycler 480. After obtaining gene amplification results, the relative gene expression was measured by 2-ΔΔCT method. SPSS Version 24.0 software (Chicago, USA) was used to compare the correlation between RT-qPCR results and differential expression analysis results.
3. Results
3.1. The Efects of Electrical Stimulation on Motor Behaviors
Our experiments showed that pigeons responded with stable ipsilateral lateral behavior after electrical stimulation of SL. And as the intensity of electrical stimulation increased, the number of steps and response rates gradually stabilized (Figure 1d). As for electrical stimulation of entopallium, the pigeons mainly responded with turning and raising their heads. As there were few ipsilateral lateral behavior after stimulation, we did not conduct subsequent behavioral analysis on entopallium.
3.2. RNA-Seq Results and Comparison with Reference Genomes
After testing, all 15 samples met the sequencing requirements, with OD 260/280 values ranging from 1.9-2.1, OD 260/230 values ranging from 1.6-2.2, RIN values >8, and 28S/18S values >1.9. A total of 403.18 M reads were obtained from 15 samples through Fast QC (v 0.11.4) software extraction and statistical analysis, resulting in a total of 120.24 Gb clean data. The clean data of each sample reached 6.28 Gb, with the percentage of Q30 bases ≥93.32%. This indicated that the sequencing and data filtering results can be used for further analysis in this study.
The comparison rates between the 15 samples and the reference genome ranged from 77.83%-88.32% (except for SL 05) (Supplementary Table S1). To ensure the accuracy and reliability of subsequent data analysis, principal component analysis (PCA) was conducted on three different treatment groups (SL group, CK group, E group) (Supplementary Figure S1). Finally, for SL group vs CK group, the study selected eight samples numbered SL 01, SL 02, SL 03, SL 04, CK 02, CK 03, CK 04, and CK 05. For SL group vs E group, the study selected six samples numbered SL 02, SL 03, SL 04, E 01, E 04, and E 05.
3.3. DEGs Identification
Comparative transcriptome analysis was performed between SL group vs CK group, a total of 622 DEGs were identified, including 608 upregulated and 14 downregulated genes (Supplementary Figure S2a). Likewise, a total of 345 DEGs including 187 upregulated and 158 downregulated genes were identified for SL group vs E group (Supplementary Figure S2B).
3.4. Enrichment Analysis of DEGs for SL Group vs CK Group
GO functional annotation of the 622 DEGs was conducted for SL group vs CK group and adjusted P <0.05 was selected as the threshold. Consequently, the upregulated 608 DEGs were significantly enriched in 13 GO terms, including six biological process terms, one cellular component terms, and six molecular function terms; however, there was no significant enrichment of GO terms in downregulated DEGs (Figure 2a; Supplementary Table S2). These enriched terms were mainly related to transmembrane transporter activity (GO: 0015291; GO: 1901682; GO: 0005342; GO: 0046943; GO: 0005310), oligopeptide transport (GO: 0006857; GO: 0035672), and aorta morphogenesis (GO: 0048844; GO: 0035909). The results showed that the PoAb may promote behavior and eliminate the effects of electrical stimulation by increasing the transport and activating of oligopeptides and proteins, promoting energy absorption and aortic formation, and other physiological and biochemical processes.
The KEGG pathway enrichment results of the 622 DEGs for SL group vs CK group showed that eight pathways of upregulated 608 DEGs were significantly enriched (adjusted P <0.05), while only two pathways of downregulated 14 DEGs were significantly enriched (adjusted P <0.05) (Figure 2b; Supplementary Table S3). In upregulated DEGs, the eight pathways were related to organismal systems (protein digestion and absorption, circadian rhythm and renin-angiotensin system), metabolism (retinol metabolism and starch and sucrose metabolism), human diseases (Amoebiasis and AGE-RAGE signaling pathway in diabetic complications) and environmental information processing (ECM- receptor interaction). Therefore, PoAb may reduce energy metabolism by inhibiting the development and regeneration of synapses, axons and other nerve tissues, so as to maintain the normal physiological function of the body as a whole. As for downregulated DEGs, the two pathways were related to genetic information processing (proteasome) and environmental information processing (Wnt signaling pathway). We speculated that the body may maintain homeostasis balance by reducing protein damage and cell apoptosis, so as to deal with the possible damage caused by external stimulation.
Additionally, in the protein-protein interaction (PPI) network (Figure 2c), the highly connected genes (red solid dots) in upregulated 608 DEGs mainly included: ubiquitin peculiar peptidase 48 (USP48), splicing factor 3b subunit 1 (SF3B1), cyclin B1 (CCNB1), ubiquitin conjugating enzyme E2 D1 (UBE2D1), checkpoint kinase 2 (CHEK2), and transformer 2 beta homolog (TRA2B).
3.5. Enrichment Analysis of DEGs for SL Group vs E Group
As for SL group vs E group, the upregulated 187 DEGs were significantly enriched in eight GO terms (adjusted P <0.01), and these terms were all biological process terms (Figure 3a; Supplementary Table S4), including protein kinase B signaling (GO: 0043491), regulation of protein kinase B signaling (GO: 0051896), angiogenesis involved in wound healing (GO: 0060055), cellular chemical homeostasis (GO: 0055082), programmed cell death (GO: 0012501), apoptotic process (GO: 0006915), regulation of biological quality (GO: 0065008), negative regulation of intracellular signal transduction (GO: 1902532). By comparison, the downregulated 158 DEGs were significantly enriched in 81 GO terms, including 47 biological process terms, 34 cellular component terms (adjusted P < 0.001). The results of the top ten were shown in Figure 3b; Supplementary Table S4. Most enriched GO terms were related to synapse organization (GO: 0050808), neuron development (GO: 0048666), cell-cell signaling (GO: 0007267), synapse (GO: 0045202), axon (GO: 0030424), axon part (GO: 0033267). The results indicated that PoAb may respond to the occurrence of turning movement and maintain homeostasis by increasing different signal transduction and regulation, and promoting angiogenesis and apoptosis.
The KEGG pathway enrichment results of the 345 DEGs for SL group vs E group showed that 13 pathways of upregulated 187 DEGs were significantly enriched (adjusted P <0.05), while five pathways of downregulated 158 DEGs were significantly enriched (adjusted P <0.001) (Figure 3c; Supplementary Table S5). In upregulated DEGs, the 13 enriched pathways were related to cellular processes (gap junction, lysosome and tight junction), organismal systems (thyroid hormone synthesis, synaptic vesicle cycle and aldosterone-regulated sodium reabsorption), human diseases (Huntington disease, amyotrophic lateral sclerosis and Alzheimer disease), environmental information processing (cAMP signaling pathway and Apelin signaling pathway), metabolism (glutathione metabolism), genetic information processing (protein processing in endoplasmic reticulum). These results suggested that the PoAb may ensure the completion of behavior by increasing energy supply, angiogenesis and enhancing fluid balance, and producing a series of stress reactions to reduce the possible damage caused by electrical stimulation. Furthermore, the upregulated DEGs may focus on coping with rapid response behavior and maintaining body fluid balance. In downregulated DEGs, the five enriched pathways were related to organismal systems (glutamatergic synapse, circadian entrainment and salivary secretion), environmental information processing (cAMP signaling pathway), and human diseases (nicotine addiction). This indicated that PoAb may reduce energy consumption by inhibiting part of neural development.
Similarly, in the PPI network (Figure 3d), the genes with high connectivity (red solid dots) in the upregulated DEGS mainly included: heat shock protein 90 alpha family class A member 1 (HSP90AA1), protein tyrosine kinase 2 beta (PTK2B), clathrin heavy chain like 1 (CLTCL1), tubulin beta 3 class III (TUBB3), heat shock protein family A (Hsp70) member 5 (HSPA5), amyloid beta precursor protein (APP).
3.6. Transcriptome Analysis of PoAb Peculiar DEGs after Electrical Stimulation of SL
3.6.1. Wayne Analysis of Three Different Groups of DEGs
Wayne analysis was used to further study the different DEGs after electrical stimulation of the SL group and E group. The results showed that there were 177 DEGs peculiar to PoAb after electrical stimulation of SL, of which 167 were upregulated and ten were downregulated (Supplementary Figure S3). To further analyze the molecular mechanisms underlying the regulatory behavior of PoAb, functional annotation and pathway enrichment analysis were performed on the 177 DEGs.
3.6.2. Enrichment Analysis of PoAb Peculiar DEGs after Electrical Stimulation of SL
GO functional annotation was conducted for PoAb peculiar DEGs after electrical stimulation of SL and adjusted P <0.05 was selected as the threshold. Consequently, the upregulated DEGs were significantly enriched in 63 GO terms, and all of them were biological process terms. The top ten GO terms were shown in Figure 4a; Supplementary Table S6. However we found that the downregulated DEGs did not significantly enrich the relevant items. The enriched 63 terms were mainly focused on regulation of neurotransmitter uptake (GO: 0051580), visceral motor neuron differentiation (GO: 0021524), lateral mesoderm morphogenesis (GO: 0048369), lateral mesoderm formation (GO: 0048370), peptide hormone processing (GO: 0016486), sinoatrial node cell development (GO: 0060931), cellular response to chemical stimulus (GO: 0070887) and neurotransmitter reuptake (GO: 0098810). The results indicated that the PoAb mainly responded to the effects of electrical stimulation by regulating neurotransmitters and cellular stress response, and promoting the differentiation of visceral motor neurons.
The KEGG pathway enrichment results of PoAb peculiar DEGs showed that both upregulated (adjusted P <0.05) and downregulated (adjusted P <0.05) DEGs were significantly enriched in five pathways (Figure 4b; Supplementary Table S7). In upregulated DEGs, the enriched pathways were related to organismal systems (protein digestion and absorption and renin-angiotensin system), metabolism (glutathione metabolism) and environmental information processing (ECM-receptor interaction). This suggested that PoAb regulated the generation of behavior mainly by increasing energy metabolism, regulating endocrine system and strengthening signal transduction. The five pathways enriched by downregulated DEGs were all regulated by LOC102090210 gene.
The PPI of PoAb peculiar DEGs after electrical stimulation of SL was constructed using Cytoscape v 3.7.2 software (Figure 4c). Among the upregulated genes, the genes with high connectivity (red solid dots) mainly included: ubiquitin peculiar peptidase 48 (USP48), integrin subunit beta 8 (ITGB8), PDZ and LIM domain 7 (PDLIM7), filamin-C (LOC102090285), DCC netrin 1 receptor (DCC), ras homolog family member T2 (RHOT2), Rho guanine nucleotide exchange factor 5 (ARHGEF5), albumin (ALB), fatty acid desaturase 1 (FADS1), and acyl-coenzyme A synthetase ACSM4, mitochondrial (ACSM4).
3.7. Validation of DEGs by RT-qPCR Analysis
The expression levels of ten DEGs (COL1A1, GANC, LOC102087515, STAR, STAT4, TAC1, ADD3, LOC102087577, TMEM41B, and PSB) randomly selected from the SL group vs CK group and ten DEGs (ABCA2, CLTCL1, CPLX3, CTSZ, GPX3, HTR1B, IDH1, LOC102093141, DLGAP1, LOC102083625) randomly selected from the SL group vs E group were validated using RT-qPCR. All 20 primers produced a single peak on the dissociation curve, with an amplification efficiency of approximately 1.0. The relative expression levels of each gene were also analyzed. The results showed that, the gene expression trends between the RNA-seq and RT-qPCR results were consistent (SL group vs CK group: R2 = 0.9750, P <0.0001; SL group vs E group: R2 = 0.7599, P = 0.001; Figure 5), which further confirmed the reliability of the transcriptome analysis.
4. Discussion
Animal behavior regulation was one of the important applications in neuroscience area. The neuromechanisms of brain regulate on motor behavior can lay an important theoretical foundation for precise control of animal behavior. Due to the limited understanding of avian brain regulatory neuromechanisms on behavior at the genetic level, we set up three different treatment groups (SL group, CK group and E group) and conducted comparative transcriptomic analysis.
The results of electrical stimulation showed that SL could stably modulate the ipsilateral lateral behavior of pigeons, which was consistent with the previous results [15]. Since entopallium cannot mediate the generation of motor behaviors, we used E group and CK group as controls to eliminate the effect of electrode implantation and electrical stimulation on PoAb, and increase the reliability of the experimental results.
As for SL group vs CK group, when the screening difference condition was set to | log2 (fold change) | to 2, 2.5, or 3, the number of upregulated DEGs varied significantly, and the number of downregulated DEGs remained stable in the range of 10-20. When | log2 (fold change) | was 3.5, the number of upregulated DEGs decreased to dozens. Therefore, the final setting for screening differences was | log2 (fold change) | >3, adjusted P <0.01. When analyzing SL group vs E group, four individuals except for SL 05 were selected for comparative analysis with four or five individuals in E group at the beginning of the study. The number of upregulated and downregulated genes was all within ten. Finally, the study determined to select six individuals for comparative analysis.
The results of pathway enrichment showed that the total number of DEGs in SL group vs CK group was much higher than that in SL group vs E group. The number of upregulated and downregulated genes of the SL group vs E group was relatively balanced, 187 and 158, respectively. By comparison, 608 genes were upregulated and only 14 genes were downregulated in the SL group vs CK group. Compared with the SL group vs CK group, the SL group vs E group excluded a part of the results caused by implanted electrodes and electrical stimulation, thus SL group vs E group enriched fewer total DEGs, but it further narrowed the scope. The enriched pathways of upregulated DEGes in SL group vs E group were further concentrated in neural signaling transduction and cell communication. This indicated that the DEGs enriched in the SL group vs E group were closer to the truth in terms of function.
The results of Wayne analysis showed that there was no intersection of DEGs between SL group vs E group, SL group vs CK group, and E group vs CK group, while 445 coexpression genes were found in the DEGs between SL group vs CK group and E group vs CK group. Whether the SL or E was electrically stimulated, it would cause the expression of many upregulated and downregulated genes. KEGG pathway enrichment results showed that there were overlapped pathways in the up and down regulation pathways in SL vs CK group and E vs CK group, which indicated that electrical stimulation would cause the expression of many genes unrelated to behavioral regulation and emotional expression. Therefore, two control groups were set up in this study, namely CK group and E group.
Comparing with the CK group, we found that in the SL group, the upregulated DEGs in the PoAb nucleus mainly completed motor behavior through energy supply and regulation of synaptic transmission (Figure 6). During ATP production, the main function of G6PC2 was to produce glucose through glycogenolysis and gluconeogenesis, or through hydrolyzing glucose-6-phosphate into glucose in the endoplasmic reticulum. DRD4 may enhance the activity of HIF1A and thus promote glycolysis under normoxic conditions [27-28]. Futhermore, ALB increased ATP generation in cells by catalyzing the alpha-ketoglutarate [29]. After getting adequate energy supply, CMYA5 enhanced intercellular signal transmission by regulating synaptic vesicular trafficking and neurotransmitter release [30]. While MPP4 and MXRA8 further led to behavior generation by rapidly regulating excitatory synaptic transmission [31-33]. During this process, GABPA and FA2H may contribute to the behaviour generation by participating in secretory vesicle trafficking and cholinergic stability, respectively [34]. Comparing with the E group, we found that in the SL group, the upregulated DEGs in the PoAb nucleus further narrowed the scope, in other words, it was closer to the facts. After getting the ATP, SNCG activated the synaptic through regulation of synaptic vesicle trafficking and subsequent neurotransmitter release. At the same time, GRIA2 promoted the fast excitatory synaptic transmission [33]. In this process, TMED3 and SMAD3 involved in vesicular protein trafficking [35]. And SNCG regulated the dopamine neurotransmission by associating with the dopamine transporter (DAT1). HTR1B regulated the release of 5-hydroxytryptamine, dopamine and acetylcholine, and thereby affected neural activity and behavior [36-47]. Besides, in the upregulated DEGs of SL group vs CK group, CMYA5 and SLC13A3 played an important role in cellular calcium ion homeostasis [48-50].
5. Conclusion
We set up three different treatment groups, and analyzed brain transcriptome in PoAb. The results showed that electrical stimulation of SL could lead to upregulation of energy supply and signal transduction, and promotion of intercellular communication. PoAb may regulate the pigeon motor behavior through regulating the genes of SMAD3, TMED3, GRIA2, HTR1B and SNCG, but the specific functions of these key genes need to be further confirmed by gene knockout or gene silencing experiments.
Supplementary Materials
The following supporting information can be downloaded at the website of this paper posted on Preprints.org.
Authors’ contributions: Conceptualization: FJ and ZLW; Experimental design: CCJ and XJL; Data collection and analysis: CZY, ZSW and YHS; Manuscript preparing: XMT (first Draft), FJ and ZLW (editing). All authors have read and agreed to the published version of the manuscript.
Funding
This work was supported by the National Natural Science Foundation of China, Grant No. 32470501.
Data Availability Statement
The datasets generated in this study are available upon reasonable request from the authors.
Acknowledgement
The authors acknowledge the assistance of Laboratory Center of Zhengzhou Research Institute, Harbin Institute of Technology.
Conflicts of Interest
The authors declare no conflicts of interest.
Ethics approval
All animal handlings and experimental setups were approved by and performed under the supervision of the Life Science Ethical Review Committee of Zhengzhou University (Henan, China).
References
- Atoji, Y.; Saito, S.; Wild, J.M. Fiber connections of the compact division of the posterior pallial amygdala and lateral part of the bed nucleus of the stria terminalis in the pigeon (Columba livia). J COMP NEUROL 2006, 499, 161–182. [Google Scholar] [CrossRef] [PubMed]
- Herold, C.; Paulitschek, C.; Palomero-Gallagher, N.; Gunturkun, O.; Zilles, K. Transmitter receptors reveal segregation of the arcopallium/amygdala complex in pigeons (Columba livia). J COMP NEUROL 2018, 526, 439–466. [Google Scholar] [CrossRef] [PubMed]
- Reiner, A.; Perkel, D. J.; Bruce, L. L.; Butler, A. B.; Csillag, A.; Kuenzel, W.; Medina, L.; Paxinos, G.; Shimizu, T.; Striedter, G.; Wild, M.; Ball, G.F.; Durand, S.; Gütürkün, O.; Lee, D.W.; Mello, C.V.; Powers, A.; White, S.A.; Hough, G.; Kubikova, L.; Smulders, T.V.; Wada, K.; Dugas-Ford, J.; Husband, S.; Yamamoto, K.; Yu, J.; Siang, C.; Jarvis, E.D. Revised nomenclature for avian telencephalon and some related brainstem nuclei. J COMP NEUROL 2004, 473, 377–414. [Google Scholar] [CrossRef] [PubMed]
- Tian, X.M.; Shi, Y.H.; Zhang, Y.F.; Wang, Y.J.; Li, M.K.; Cheng, H.; Wang, Z. L. The role of posterior pallial amygdala in mediating motor behaviors in pigeons. SCI REP-UK 2022, 12, 367. [Google Scholar] [CrossRef]
- Han, W.F.; Tellez, L.A.; Jr Rangel, M.J.; Motta, S.C.; Zhang, X.B.; Perez, I.O.; Canteras, N.S.; Shammah-Lagnado, S.J.; van den Pol, A.N.; de Araujo, I.E. Integrated Control of Predatory Hunting by the Central Nucleus of the Amygdala. CELL 2017, 168, 311–324. [Google Scholar] [CrossRef]
- Kim, J.; Zhang, X.Y.; Muralidhar, S.; LeBlanc, S.A.; Tonegawa, S. Basolateral to Central Amygdala Neural Circuits for Appetitive Behaviors. NEURON 2017, 93, 1464–1479. [Google Scholar] [CrossRef]
- Coppola, V.J.; Nardi, D.; Bingman, V.P. Age-associated decline in septum neuronal activation during spatial learning in homing pigeons (Columba livia). BEHAV BRAIN RES 2021, 397, 112948. [Google Scholar] [CrossRef]
- Montagnese, C.M.; Székely, A.D.; Ádám, Á.; Csillag, A. Efferent connections of septal nuclei of the domestic chick (Gallus domesticus): An anterograde pathway tracing study with a bearing on functional circuits. J COMP NEUROL 2004, 469, 437–456. [Google Scholar] [CrossRef]
- Wirtshafter, H.S.; Wilson, M.A. Differences in reward biased spatial representations in the lateral septum and hippocampus. ELIFE 2020, 9, 1–20. [Google Scholar] [CrossRef]
- Wirtshafter, H.S.; Wilson, M.A. Lateral septum as a nexus for mood, motivation, and movement. NEUROSCI BIOBEHAV R 2021, 126, 544–559. [Google Scholar] [CrossRef]
- Anderson, C.; Parra, R.S.; Chapman, H.; Steinemer, A.; Porter, B.; Colombo, M. Pigeon nidopallium caudolaterale, entopallium, and mesopallium ventrolaterale neural responses during categorisation of Monet and Picasso paintings. SCI REP-UK 2020, 10, 1–12. [Google Scholar] [CrossRef] [PubMed]
- Clark, W.; Chilcott, M.; Azizi, A.; Pusch, R.; Perry, K.; Colombo, M. Neurons in the pigeon visual network discriminate between faces, scrambled faces, and sine grating image. SCI REP-UK 2022, 12, 589. [Google Scholar] [CrossRef] [PubMed]
- Hsiao, Y.T.; Chen, T.C.; Yu, P.H.; Huang, D.S.; Hu, F.R.; Chuong, C.M.; Chang, F.C. onnectivity between nidopallium caudolateral and visual pathways in color perception of zebra finches. SCI REP-UK 2020, 10, 1–13. [Google Scholar]
- Krutzfeldt, N.O.E.; Wild, J.M. Definition and novel connections of the entopallium in the pigeon (Columba livia). J COMP NEUROL 2005, 490, 40–56. [Google Scholar] [CrossRef] [PubMed]
- Jia, C.C.; Tian, X.M.; Cao, S.M.; Yang, L.; Ye, F.; Cheng, H.; Wang, Z.L. Studies on the role of nucleus septalis lateralis in the regulation of lateral movement behavior in pigeons. Journal of Zhengzhou University (Natural Science Edition) 2023, 55, 73–79. [Google Scholar]
- Costa, V.; Angelini, C.; De Feis, I.; Ciccodicola, A. Uncovering the Complexity of Transcriptomes with RNA-Seq. J BIOMED BIOTECHNOL 2010, 2010, 1–19. [Google Scholar] [CrossRef]
- Delatte, B.; Wang, F.; Ngoc, L.V.; Collignon, E.; Bonvin, E.; Deplus, R.; Calonne, E.; Hassabi, B.; Putmans, P.; Awe, S.; Wetzel, C.; Kreher, J.; Soin, R.; Creppe, C.; Limbach, P.A.; Gueydan, C.; Kruys, V.; Brehm, A.; Minakhina, S.; Defrance, M.; Steward, R.; Fuks, F. Transcriptome-wide distribution and function of RNA hydroxymethylcytosine. SCIENCE 2016, 351, 282–285. [Google Scholar] [CrossRef]
- Wang, Z.; Gerstein, M.; Snyder, M. RNA-Seq: a revolutionary tool for transcriptomics. NAT REV GENET 2009, 10, 57–63. [Google Scholar] [CrossRef]
- Kroner, S.; Gunturkun, O. Afferent and efferent connections of the caudolateral neostriatum in the pigeon (Columba livia): a retro- and anterograde pathway tracing study. J COMP NEUROL 1999, 407, 228–260. [Google Scholar] [CrossRef]
- Shapiro, M.D.; Kronenberg, Z.; Li, C.; Domyan, E.T.; Pan, H.; Campbell, M.; Tan, H.; Huff, C.D.; Hu, H.; Vickrey, A.I.; Nielsen, S.C.A.; Stringham, S.A.; Hu, H.; Willerslev, E.; Gilbert, M.T.P.; Yandell, M.; Zhang, G.; Wang, J. Genomic Diversity and Evolution of the Head Crest in the Rock Pigeon. SCIENCE 2013, 339, 1063–1067. [Google Scholar] [CrossRef]
- Pertea, M.; Kim, D.; Pertea, G.M.; Leek, J.T.; Salzberg, S.L. Transcript-level expression analysis of RNA-seq experiments with HISAT, StringTie and Ballgown. NAT PROTOC 2016, 11, 1650–1667. [Google Scholar] [CrossRef] [PubMed]
- Pertea, M.; Pertea, G.M.; Antonescu, C.M.; Chang, T.C.; Mendell, J.T.; Salzberg, S.L. StringTie enables improved reconstruction of a transcriptome from RNA-seq reads. NAT BIOTECHNOL 2015, 33, 290–295. [Google Scholar] [CrossRef] [PubMed]
- Love, M.I.; Huber, W.; Anders, S. Moderated estimation of fold change and dispersion for RNA-seq data with DESeq2. GENOME BIOL 2014, 15, 550. [Google Scholar] [CrossRef]
- Shannon, P.; Markiel, A.; Ozier, O.; Baliga, N.S.; Wang, J.T.; Ramage, D.; Amin, N.; Schwikowski, B.; Ideker, T. Cytoscape: a software environment for integrated models of biomolecular interaction networks. GENOME RES 2003, 13, 2498–2504. [Google Scholar] [CrossRef] [PubMed]
- Xie, C.; Mao, X.Z.; Huang, J.J.; Ding, Y.; Wu, J.M.; Dong, S.; Kong, L.; Gao, G.; Li, C.Y.; Wei, L.P. KOBAS 2.0: a web server for annotation and identification of enriched pathways and diseases. NUCLEIC ACIDS RES 2011, 39, 316–322. [Google Scholar] [CrossRef] [PubMed]
- Vickrey, A.I.; Bruders, R.; Kronenberg, Z.; Mackey, E.; Bohlender, R.J.; Maclary, E.T.; Maynez, R.; Osborne, E.J.; Johnson, K.P.; Huff, C.D.; Yandell, M.; Shapiro, M.D. Introgression of regulatory alleles and a missense coding mutation drive plumage pattern diversity in the rock pigeon. Elife 2018, 7, e34803. [Google Scholar] [CrossRef] [PubMed]
- Lee, D.S.; Tomita, S.; Kirino, Y.; Suzuki, T. Regulation of X11L-dependent amyloid precursor protein metabolism by XB51, a novel X11L-binding protein. J BIOL CHEM 2000, 275, 23134–23138. [Google Scholar] [CrossRef]
- Nakaoka, H.; Hara, T.; Yoshino, S.; Kanamori, A.; Matsui, Y.; Shimamura, T.; Sato, H.; Murakami, Y.; Seiki, M.; Sakamoto, T. NECAB3 Promotes Activation of Hypoxia-inducible factor-1 during Normoxia and Enhances Tumourigenicity of Cancer Cells. SCI REP-UK 2016, 6, 22784. [Google Scholar] [CrossRef]
- Hu, W.; Zhang, C.; Wu, R.; Sun, Y.; Levine, A.; Feng, Z. Glutaminase 2, a novel p53 target gene regulating energy metabolism and antioxidant function. PANS 2010, 107, 7455–7460. [Google Scholar] [CrossRef]
- Iizuka, Y.; Sei, Y.; Weinberger, D.R.; Straub, R. E. Evidence that the BLOC-1 protein dysbindin modulates dopamine D2 receptor internalization and signaling but not D1 internalization. J NEUROSC 2007, 27, 12390–12395. [Google Scholar] [CrossRef]
- Cingolani, L.A.; Thalhammer, A.; Yu, L.M.; Catalano, M.; Ramos, T.; Colicos, M.A.; Goda, Y. Activity-dependent regulation of synaptic AMPA receptor composition and abundance by β-3 integrins. NEURON 2008, 58, 749–762. [Google Scholar] [CrossRef] [PubMed]
- Dohn, M.R.; Kooker, C.G.; Bastarache, L.; Jessen, T.; Rinaldi, C.; Varney, S.; Mazalouskas, M.D.; Pan, H.; Oliver, K.H.; Velez Edwards, D.R.; Sutcliffe, J.S.; Denny, J.C.; Carneiro, A.M.D. The Gain-of-Function Integrin β3 Pro33 Variant Alters the Serotonin System in the Mouse Brain. J NEUROSC 2017, 37, 11271–11284. [Google Scholar] [CrossRef] [PubMed]
- Kolleker, A.; Zhu, J.J.; Schupp, B.J.; Qin, Y.; Mack, V.; Borchardt, T.; Kohr, G.; Malinow, R.; Seeburg, P.H.; Osten, P. Glutamatergic plasticity by synaptic delivery of GluR-B(long)-containing AMPA receptors. NEURON 2003, 40, 1199–1212. [Google Scholar] [CrossRef] [PubMed]
- Berson, A.E.; Young, C.; Morrison, S.L.; Fujii, G.H.; Sheung, J.; Wu, B.; Bolen, J.B.; Burkhardt, A.L. Identification and characterization of a myristylated and palmitylated serine/threonine protein kinase. BIOCHEM BIOPH RES CO 1999, 259, 533–538. [Google Scholar] [CrossRef] [PubMed]
- Goldberg, J. Decoding of sorting signals by coatomer through a GTPase switch in the COPI coat complex. CELL 2000, 100, 671–679. [Google Scholar] [CrossRef]
- Demchyshyn, L.; Sunahara, R.K.; Miller, K.; Teitler, M.; Hoffman, B.J.; Kennedy, J.L.; Seeman, P.; Van Tol, H.H.; Niznik, H.B. A human serotonin 1D receptor variant (5HT1D beta) encoded by an intronless gene on chromosome 6. PNAS 1992, 89, 5522–5526. [Google Scholar] [CrossRef]
- Edvinsson, L.; Uddman, E.; Wackenfors, A.; Davenport, A.; Longmore, J.; Malmsjo, M. Triptan-induced contractile (5-HT1B receptor) responses in human cerebral and coronary arteries: relationship to clinical effect. CLIN SCI 2005, 109, 335–342. [Google Scholar] [CrossRef]
- Fassio, A.; Esposito, A.; Kato, M.; Saitsu, H.; Mei, D.; Marini, C.; Conti, V.; Nakashima, M.; Okamoto, N.; Olmez Turker, A.; Albuz, B.; Semerci Günduz, C.N.; Yanagihara, K.; Belmonte, E.; Maragliano, L.; Ramsey, K.; Balak, C.; Siniard, A.; Narayanan, V.; C4RCD Research Group. ; Ohba, C.; Shiina, M.; Ogata, K.; Matsumoto, N.; Benfenati, F.; Guerrini, R. De novo mutations of the ATP6V1A gene cause developmental encephalopathy with epilepsy. BRAIN 2018, 141, 1703–1718. [Google Scholar] [CrossRef]
- Jin, H.; Oksenberg, D.; Ashkenazi, A.; Peroutka, S.J.; Duncan, A.M.; Rozmahel, R.; Yang, Y.; Mengod, G.; Palacios, J.M.; O'Dowd, B. F. Characterization of the human 5-hydroxytryptamine1B receptor. J BIOL CHEM 1992, 267, 5735–5738. [Google Scholar] [CrossRef]
- Levy, F.O.; Gudermann, T.; Perez-Reyes, E.; Birnbaumer, M.; Kaumann, A.J.; Birnbaumer, L. Molecular cloning of a human serotonin receptor (S12) with a pharmacological profile resembling that of the 5-HT1D subtype. J BIOL CHEM 1992, 267, 7553–7362. [Google Scholar] [CrossRef]
- Mochizuki, D.; Yuyama, Y.; Tsujita, R.; Komaki, H.; Sagai, H. Cloning and expression of the human 5-HT1B-type receptor gene. BIOCHEM BIOPH RES CO 1992, 185, 517–523. [Google Scholar] [CrossRef] [PubMed]
- Ng, G.Y.; George, S.R.; Zastawny, R.L.; Caron, M.; Bouvier, M.; Dennis, M.; O'Dowd, B.F. Human serotonin1B receptor expression in Sf9 cells: phosphorylation, palmitoylation, and adenylyl cyclase inhibition. BIOCHEMISTRY 1993, 32, 11727–11733. [Google Scholar] [CrossRef] [PubMed]
- Veldman, S.A.; Bienkowski, M.J. Cloning and pharmacological characterization of a novel human 5-hydroxytryptamine1D receptor subtype. MOL PHARMACOL 1992, 42, 439–444. [Google Scholar] [PubMed]
- Wacker, D.; Wang, C.; Katritch, V.; Han, G.W.; Huang, X.P.; Vardy, E.; McCorvy, J.D.; Jiang, Y.; Chu, M.; Siu, F.Y.; Liu, W.; Xu, H.E.; Cherezov, V.; Roth, B.L.; Stevens, R.C. Structural features for functional selectivity at serotonin receptors. SCIENCE 2013, 340, 615–619. [Google Scholar] [CrossRef] [PubMed]
- Wang, C.; Jiang, Y.; Ma, J.; Wu, H.; Wacker, D.; Katritch, V.; Han, G.W.; Liu, W.; Huang, X.P.; Vardy, E.; McCorvy, J.D.; Gao, X.; Zhou, X.E.; Melcher, K.; Zhang, C.; Bai. F.; Yang, H.; Yang, L.; Jiang, H.; Roth, B.L.; Cherezov, V.; Stevens, R.C.; Xu, H.E. Structural basis for molecular recognition at serotonin receptors. SCIENCE 2013, 340, 610–614. [Google Scholar] [CrossRef]
- Weinshank, R.L.; Zgombick, J.M.; Macchi, M.J.; Branchek, T.A.; Hartig, P.R. Human serotonin 1D receptor is encoded by a subfamily of two distinct genes: 5-HT1Dα and 5-HT1Dβ. PNAS 1992, 89, 3630–3634. [Google Scholar] [CrossRef]
- Xie, Z.; Lee, S.P.; O'Dowd, B.F.; George, S.R. Serotonin 5-HT1B and 5-HT1D receptors form homodimers when expressed alone and heterodimers when co-expressed. FEBS LETT 1999, 456, 63–67. [Google Scholar] [CrossRef]
- De Vos, K.J.; Morotz, G.M.; Stoica, R.; Tudor, E.L.; Lau, K.F.; Ackerley, S.; Warley, A.; Shaw, C.E.; Miller, C.C. VAPB interacts with the mitochondrial protein PTPIP51 to regulate calcium homeostasis. HUM MOL GENET 2012, 21, 1299–1311. [Google Scholar] [CrossRef]
- Lv, B.F.; Yu, C.F.; Chen, Y.Y.; Lu, Y.; Guo, J.H.; Song, Q.S.; Ma, D.L.; Shi, T.P.; Wang, L. Protein tyrosine phosphatase interacting protein 51 (PTPIP51) is a novel mitochondria protein with an N-terminal mitochondrial targeting sequence and induces apoptosis. APOPTOSIS 2006, 11, 1489–1501. [Google Scholar] [CrossRef]
- Xiao, Z.; Guo, W.; Sun, B.; Hunt, D.J.; Wei, J.; Liu, Y.; Wang, Y.; Wang, R.; Jones, P.P.; Back, T.G.; Chen, S.R.W. Enhanced Cytosolic Ca2+ Activation Underlies a Common Defect of Central Domain Cardiac Ryanodine Receptor Mutations Linked to Arrhythmias. J BIOL CHEM 2016, 291, 24528–24537. [Google Scholar] [CrossRef]
Figure 1.
Effects of electrical stimulation SL and E on behaviors. (a): Ipsilateral lateral movement were successfully induced in the pigeons using brain stimulation. Pictures from left to right in the first two line indicate successive time during the wired test. Schematic coronal view of the brain of electrical stimulation of SL (b) and E (c). (d): The number of steps and response rates of ipsilateral movement behavior under different electrical stimulation intensities.
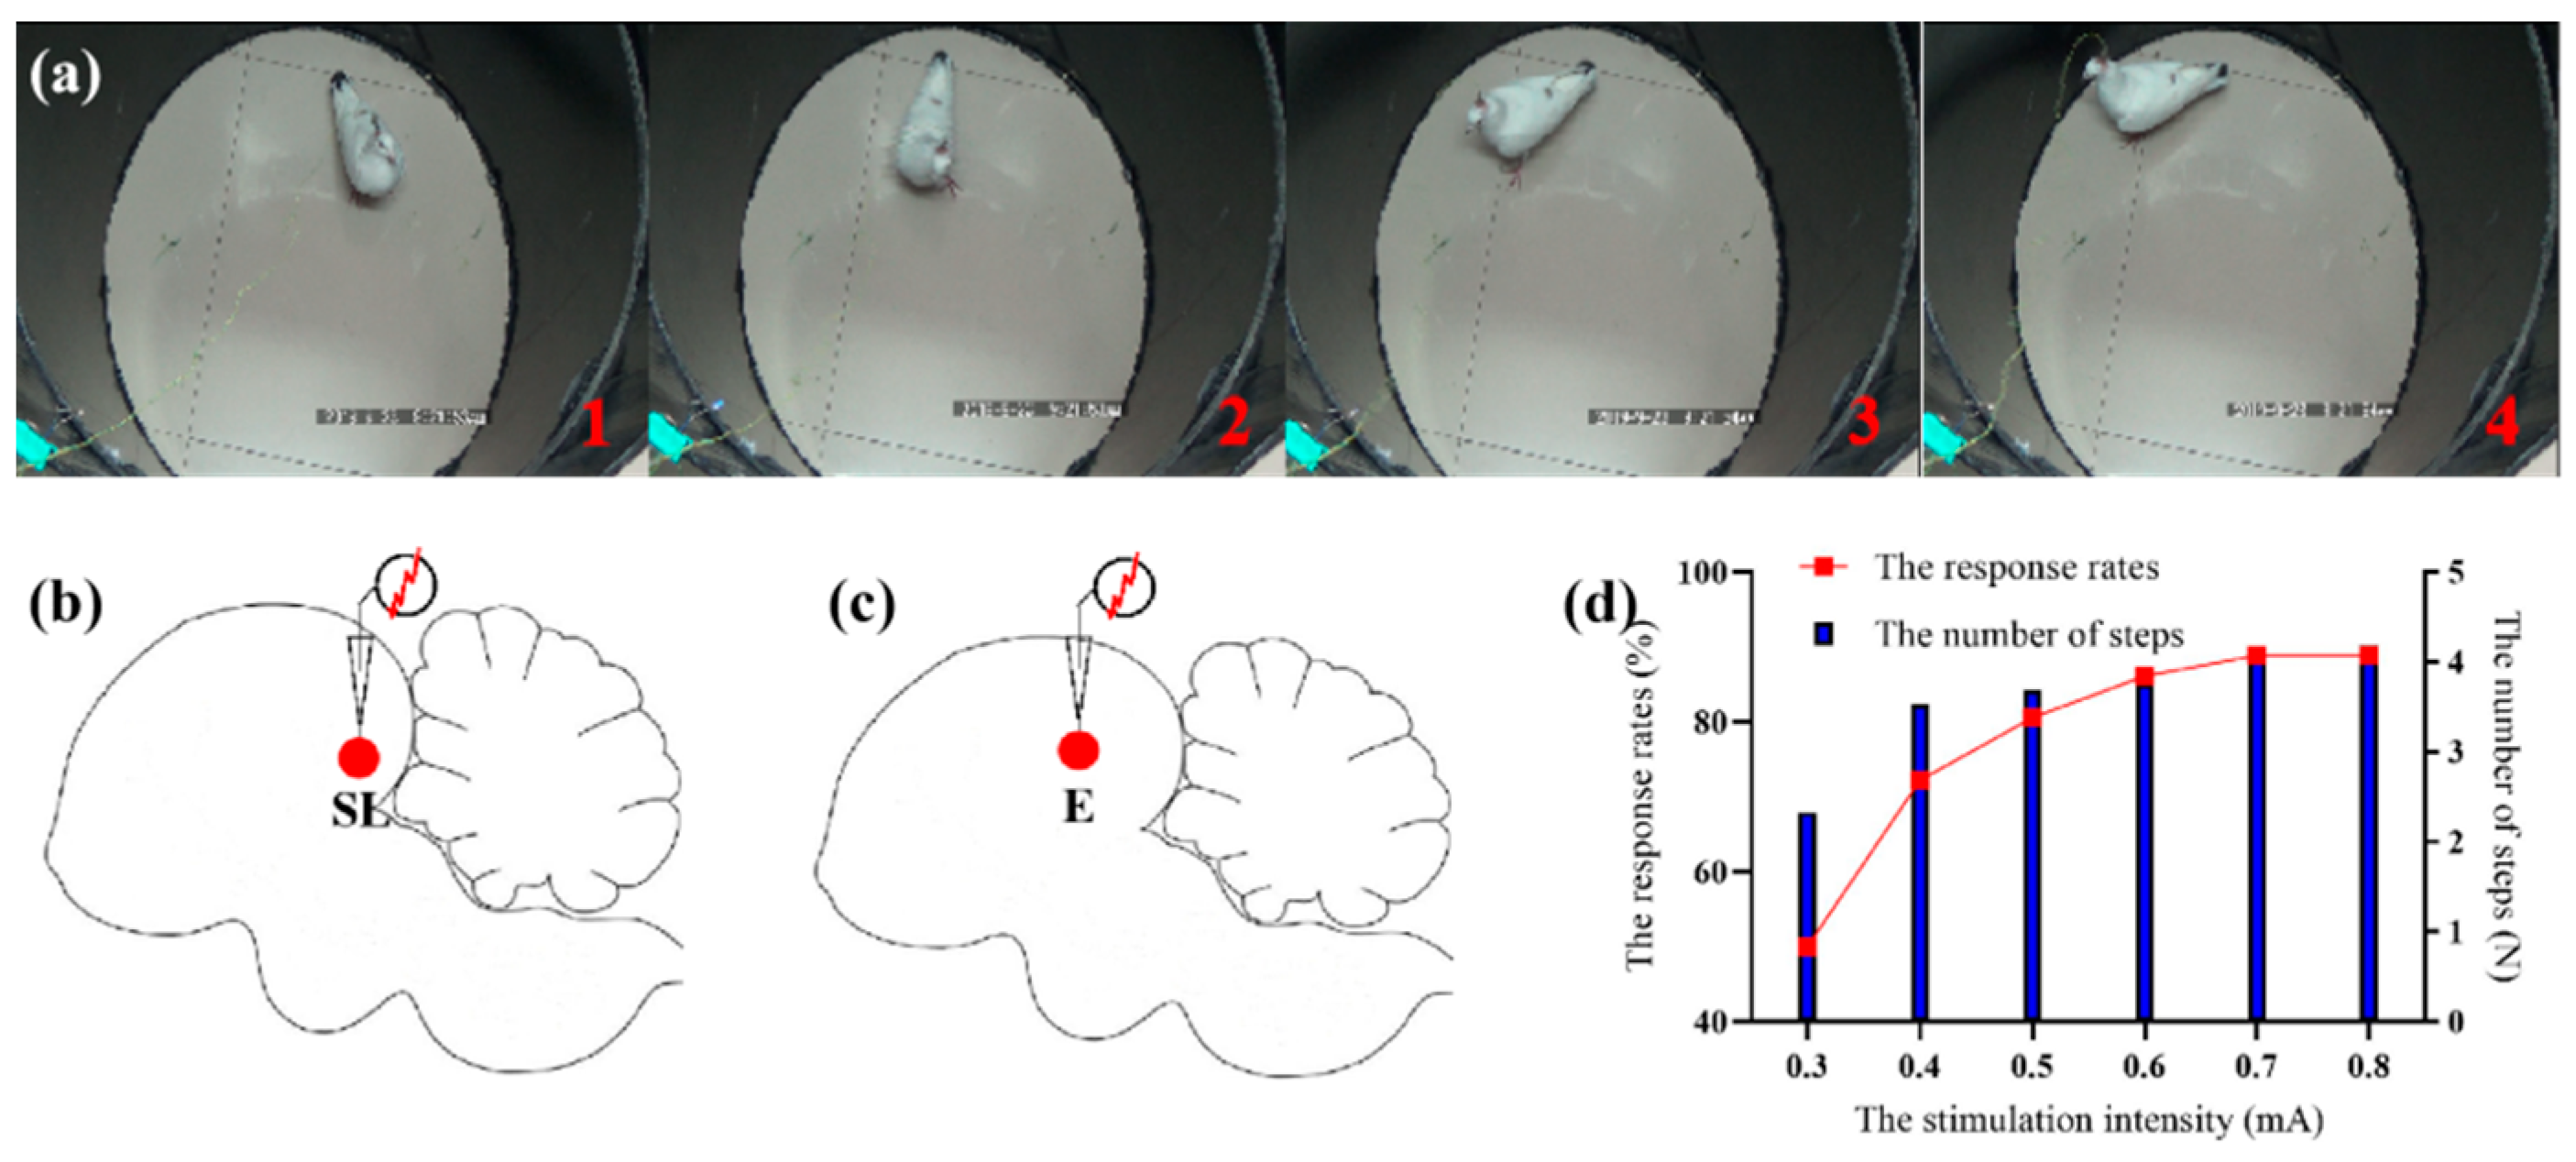
Figure 2.
GO enrichment, KEGG enrichment, and PPI results for upregulated and downregulated DEGs in SL group vs CK group. (a): Different colors represent number of genes significantly enriched in GO terms (see color key) and font size represents adjusted P value significance level (larger font indicates smaller adjusted P). All significantly enriched GO terms in upregulated DEGs were shown in Figure (a), and the significantly enriched GO terms were presented in Supplementary Table S1. (b): Different colored circles represent different biological classifications (see color key) and numbers in circles represent number of genes significantly enriched in KEGG pathways. (c): The red and blue circles represent upregulated and downregulated genes, respectively. The size of the circle represents the number of other proteins interacting with that protein in the network: the larger the circle, the more proteins interacting with the relevant protein. The thickness of the line connecting the circle indicates the strength of the interaction between two proteins: the wider the line, the stronger the interaction. The same below.
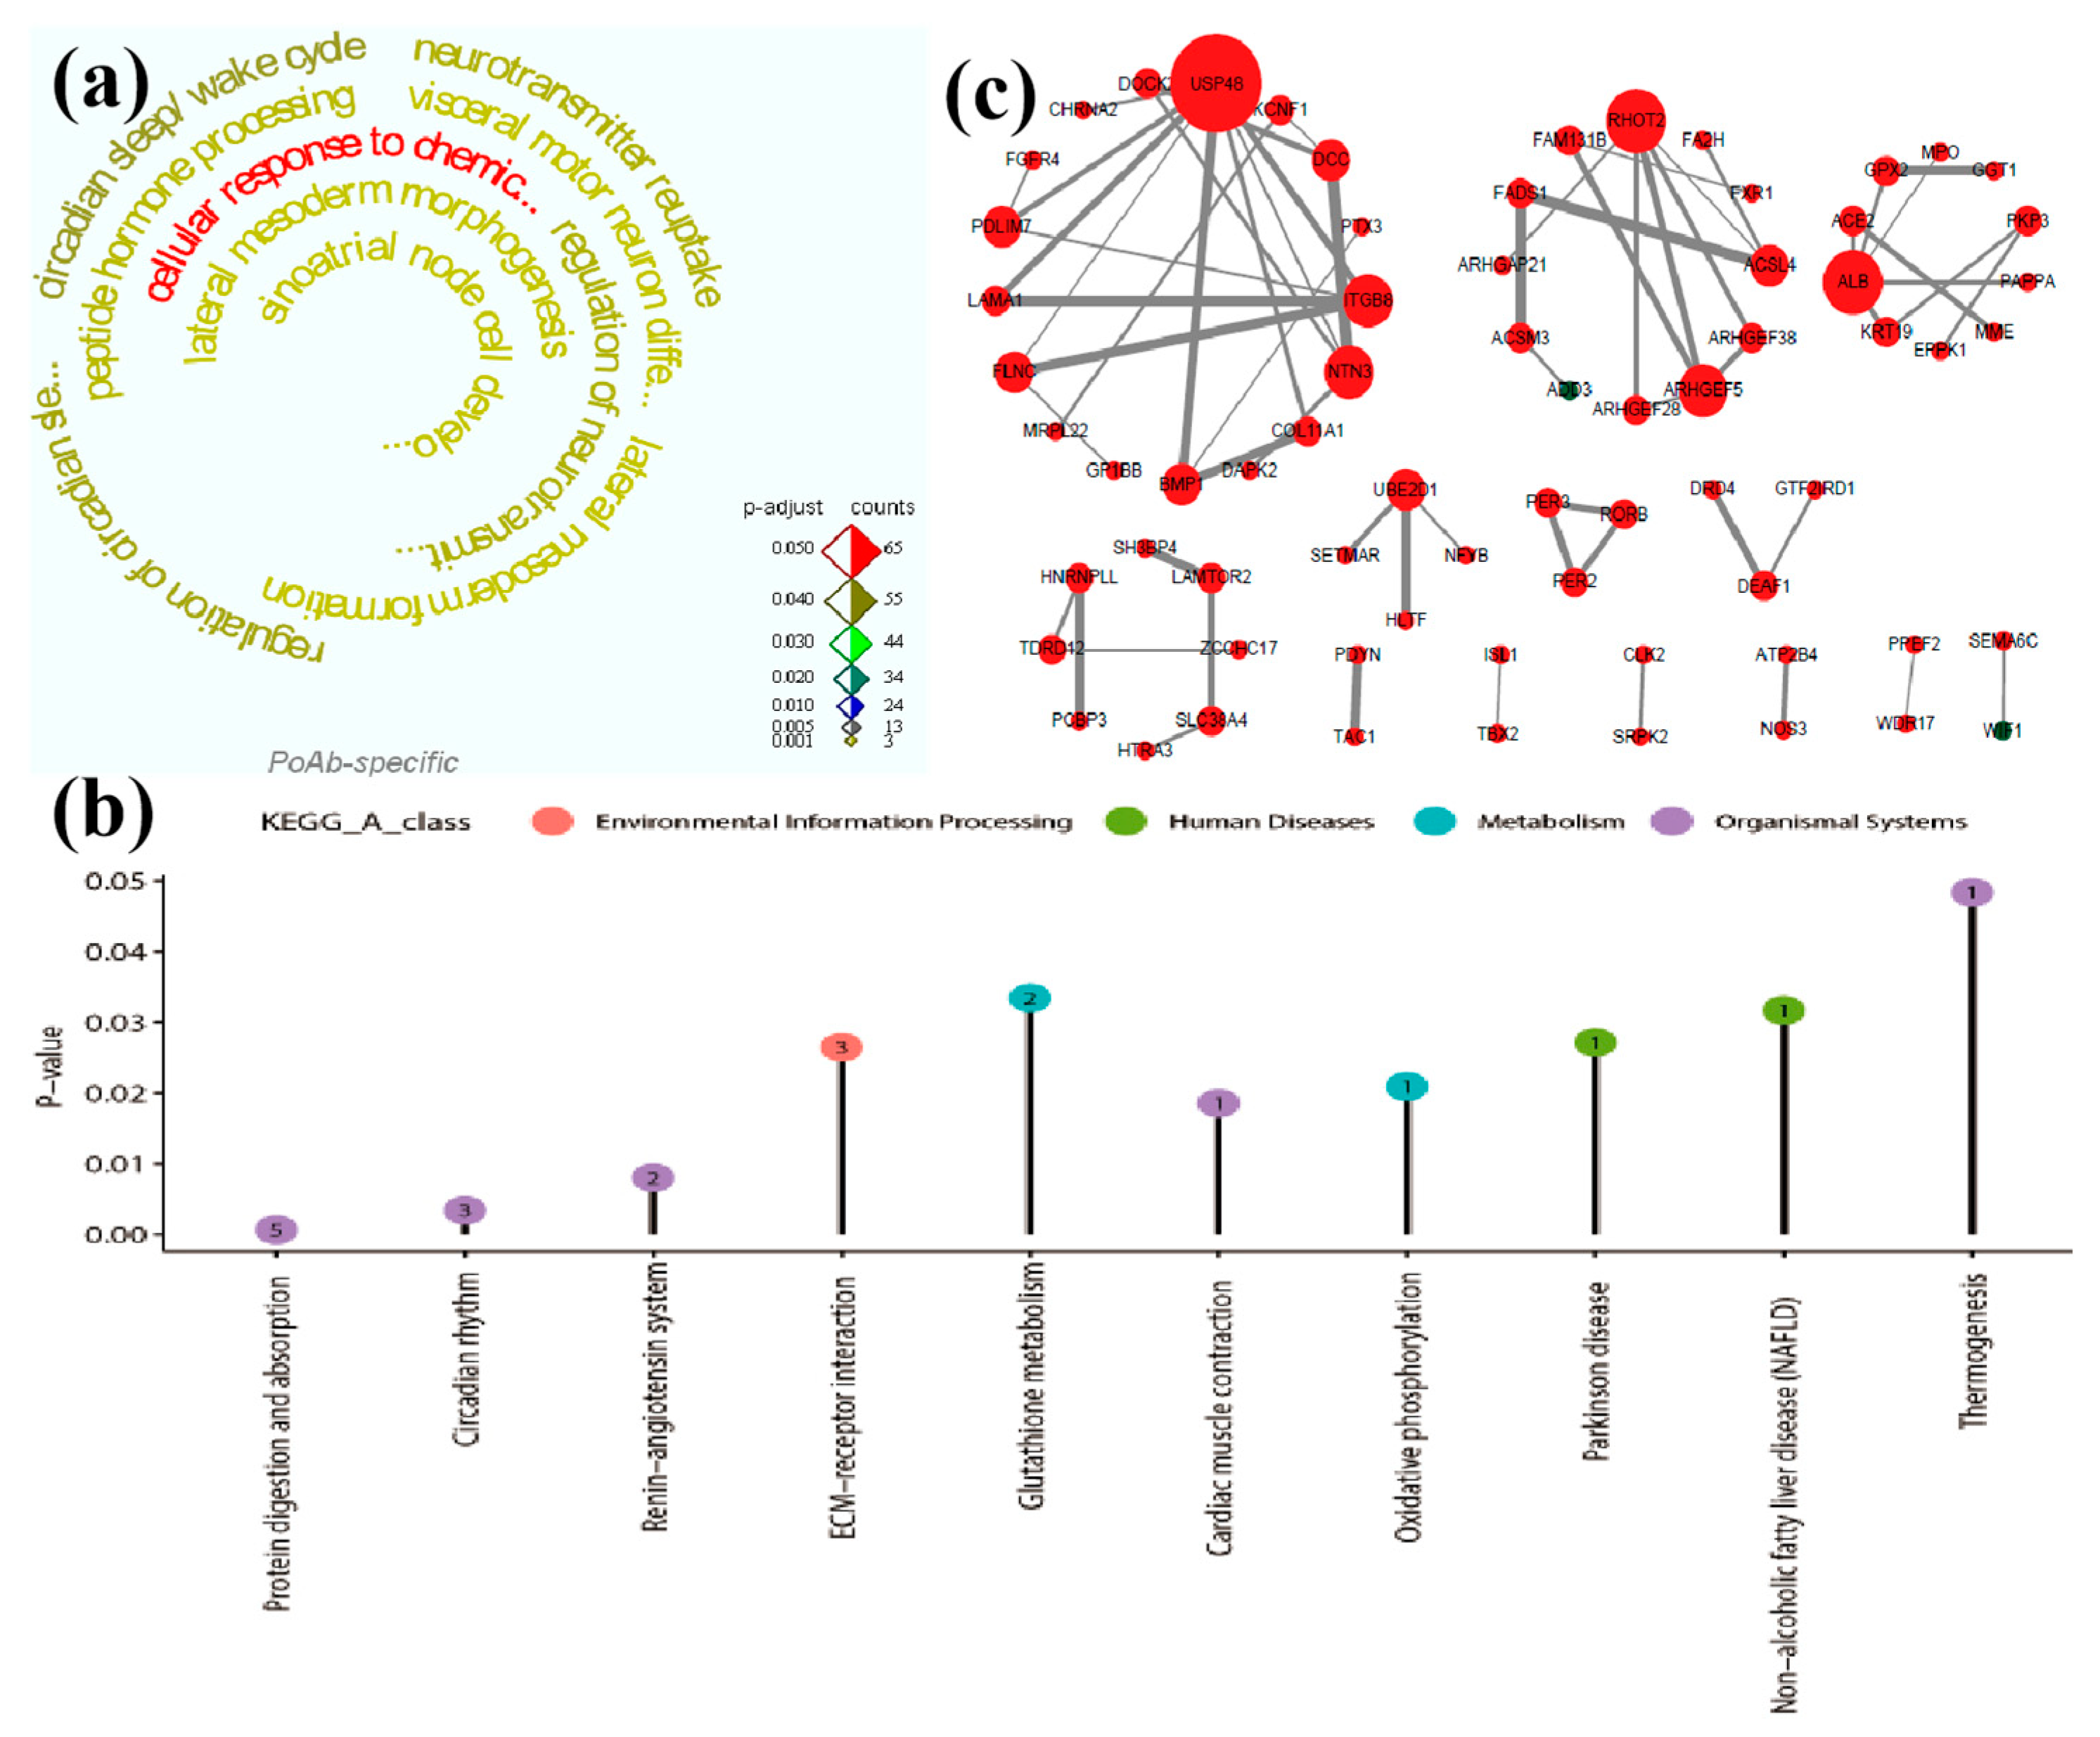
Figure 3.
GO enrichment, KEGG enrichment, and PPI results for upregulated and downregulated DEGs in SL group vs E group. (a), (b): Different colors represent number of genes significantly enriched in GO terms (see color key) and font size represents adjusted P value significance level (larger font indicates smaller adjusted P). All significantly enriched GO terms in upregulated DEGs were shown in Figure (a), top ten significantly enriched GO terms in downregulated DEGs were shown in Figure (b), and all significantly enriched GO terms were presented in Supplementary Table S3. (c): Different colored circles represent different biological classifications (see color key) and numbers in circles represent number of genes significantly enriched in KEGG pathways. (d): The red and blue circles represent upregulated and downregulated genes, respectively.
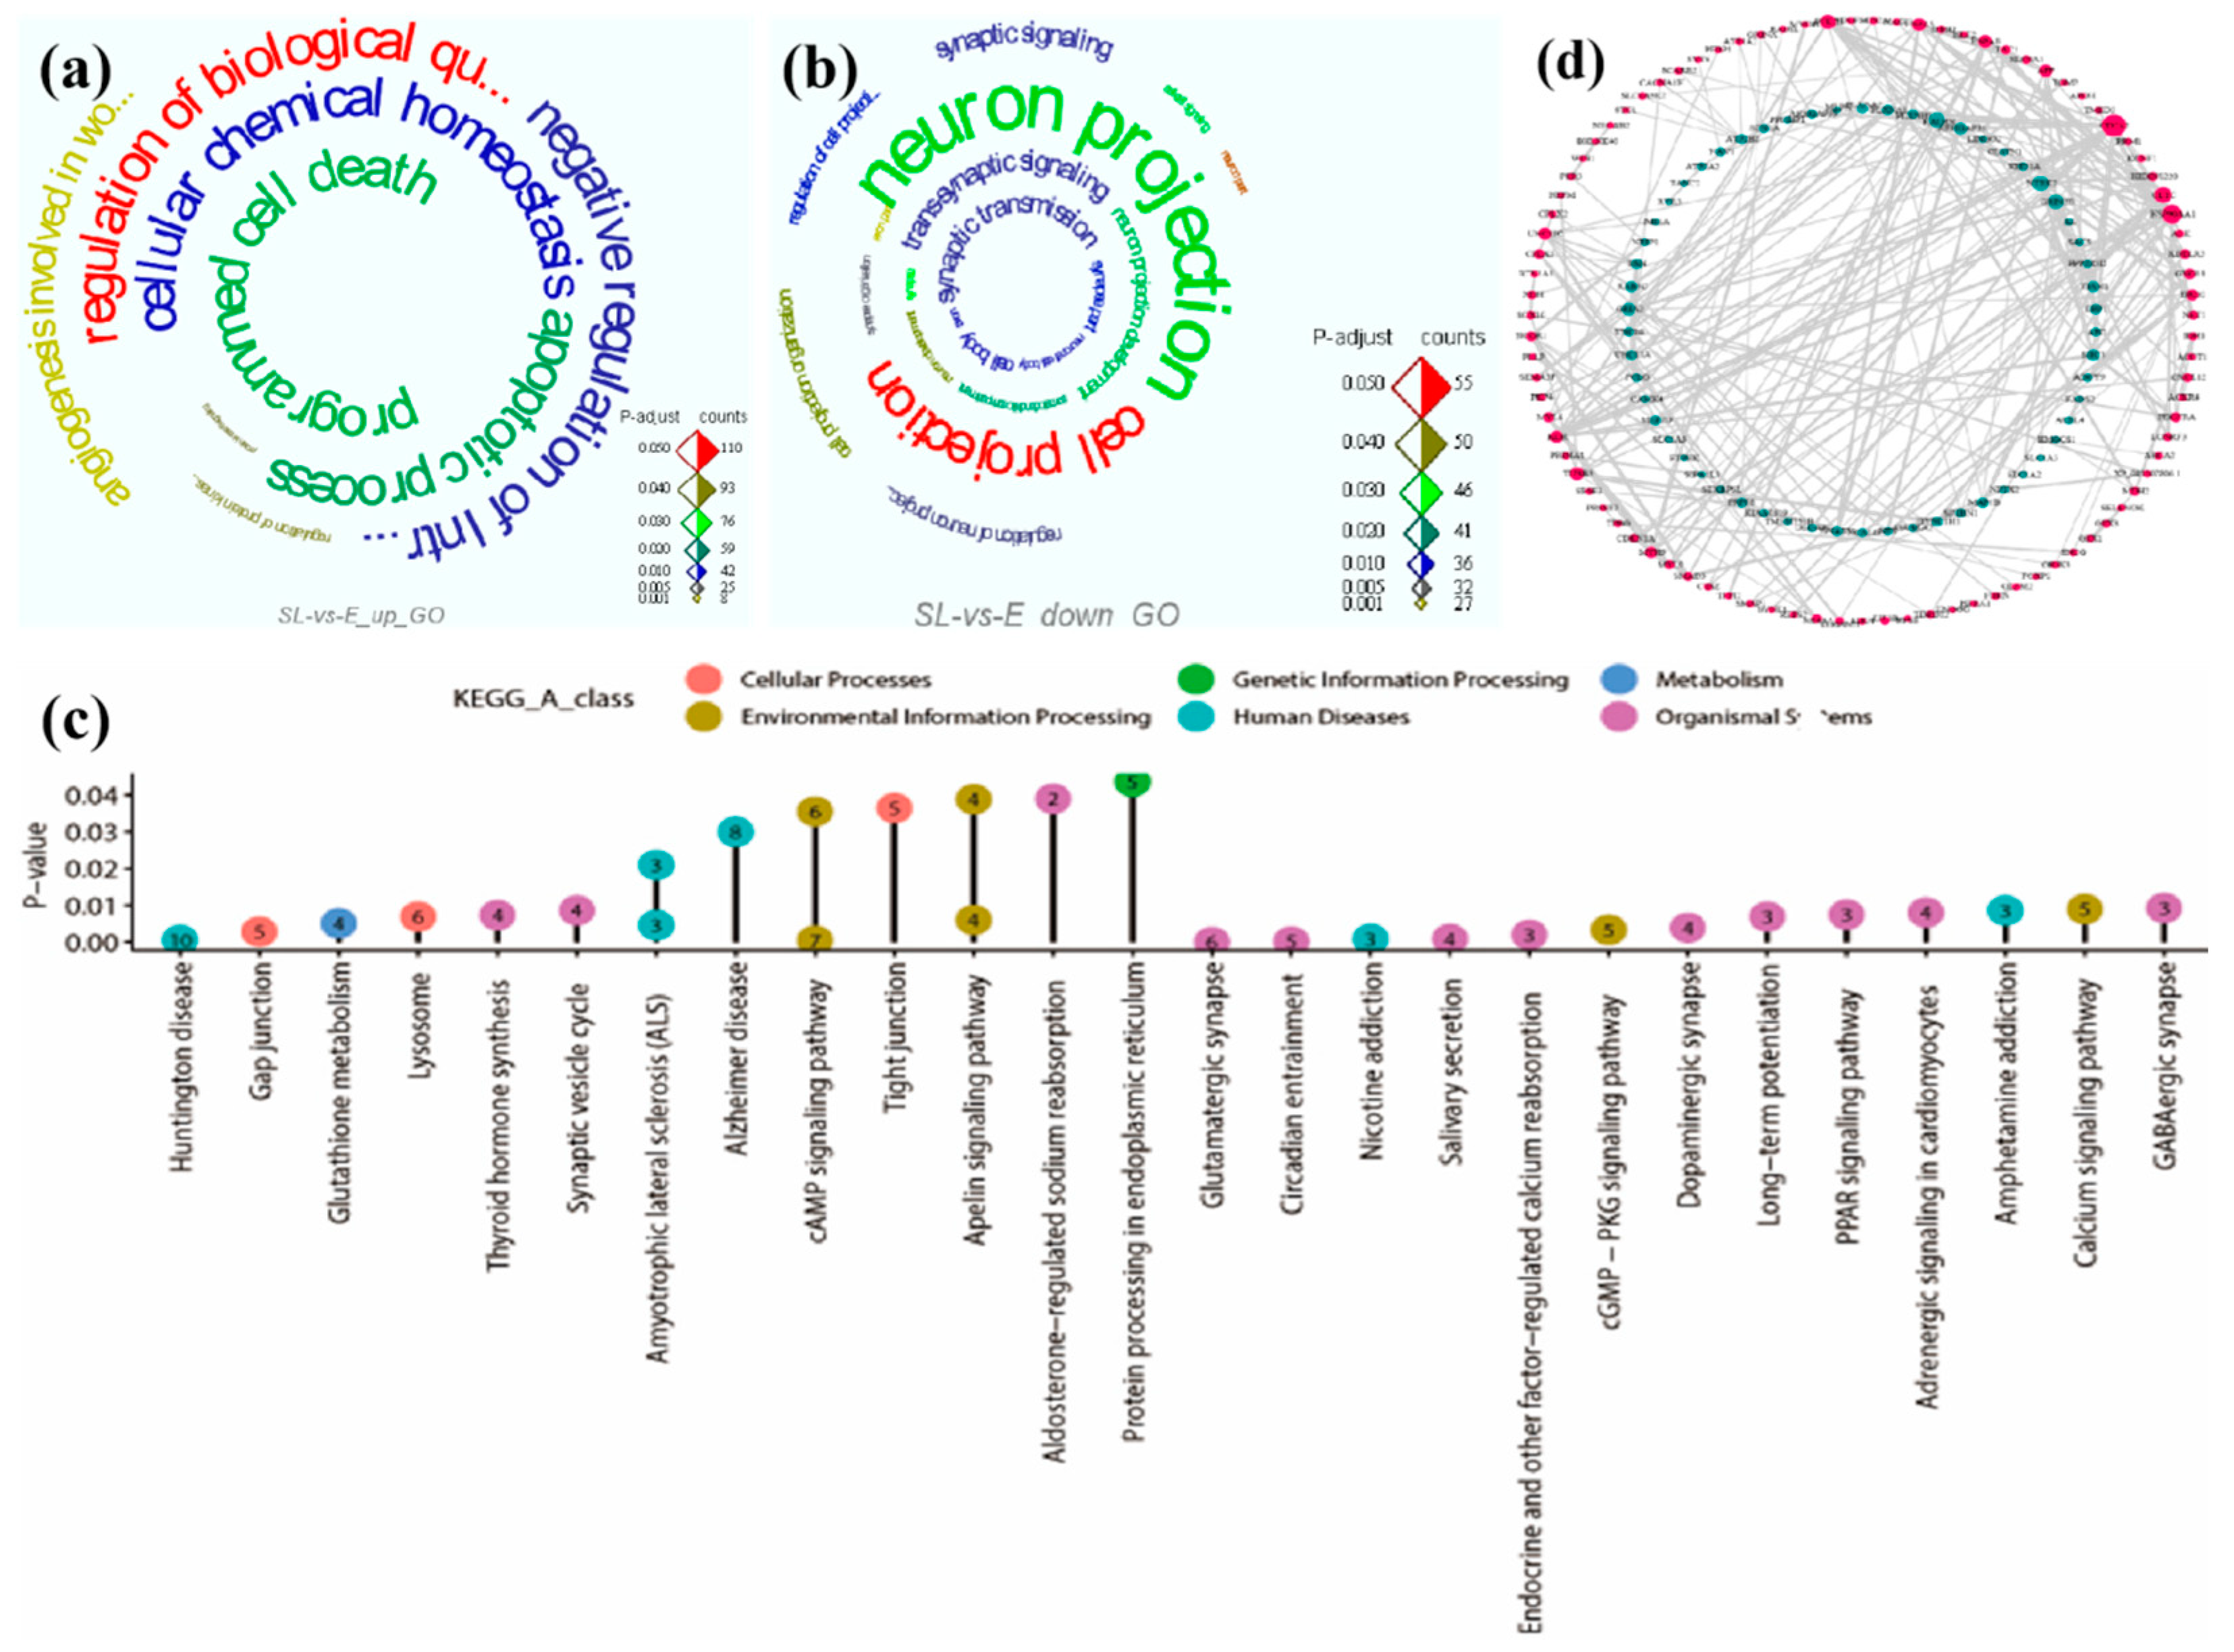
Figure 4.
GO enrichment, KEGG enrichment, and PPI results for upregulated and downregulated DEGs in PoAb peculiar DEGs. (a): Different colors represent number of genes significantly enriched in GO terms (see color key) and font size represents adjusted P value significance level (larger font indicates smaller adjusted P). Top ten significantly enriched GO terms in upregulated DEGs were shown in Figure (a), and all significantly enriched GO terms were presented in Supplementary Table S5. (b): Different colored circles represent different biological classifications (see color key) and numbers in circles represent number of genes significantly enriched in KEGG pathways. (c): The red and blue circles represent upregulated and downregulated genes, respectively.
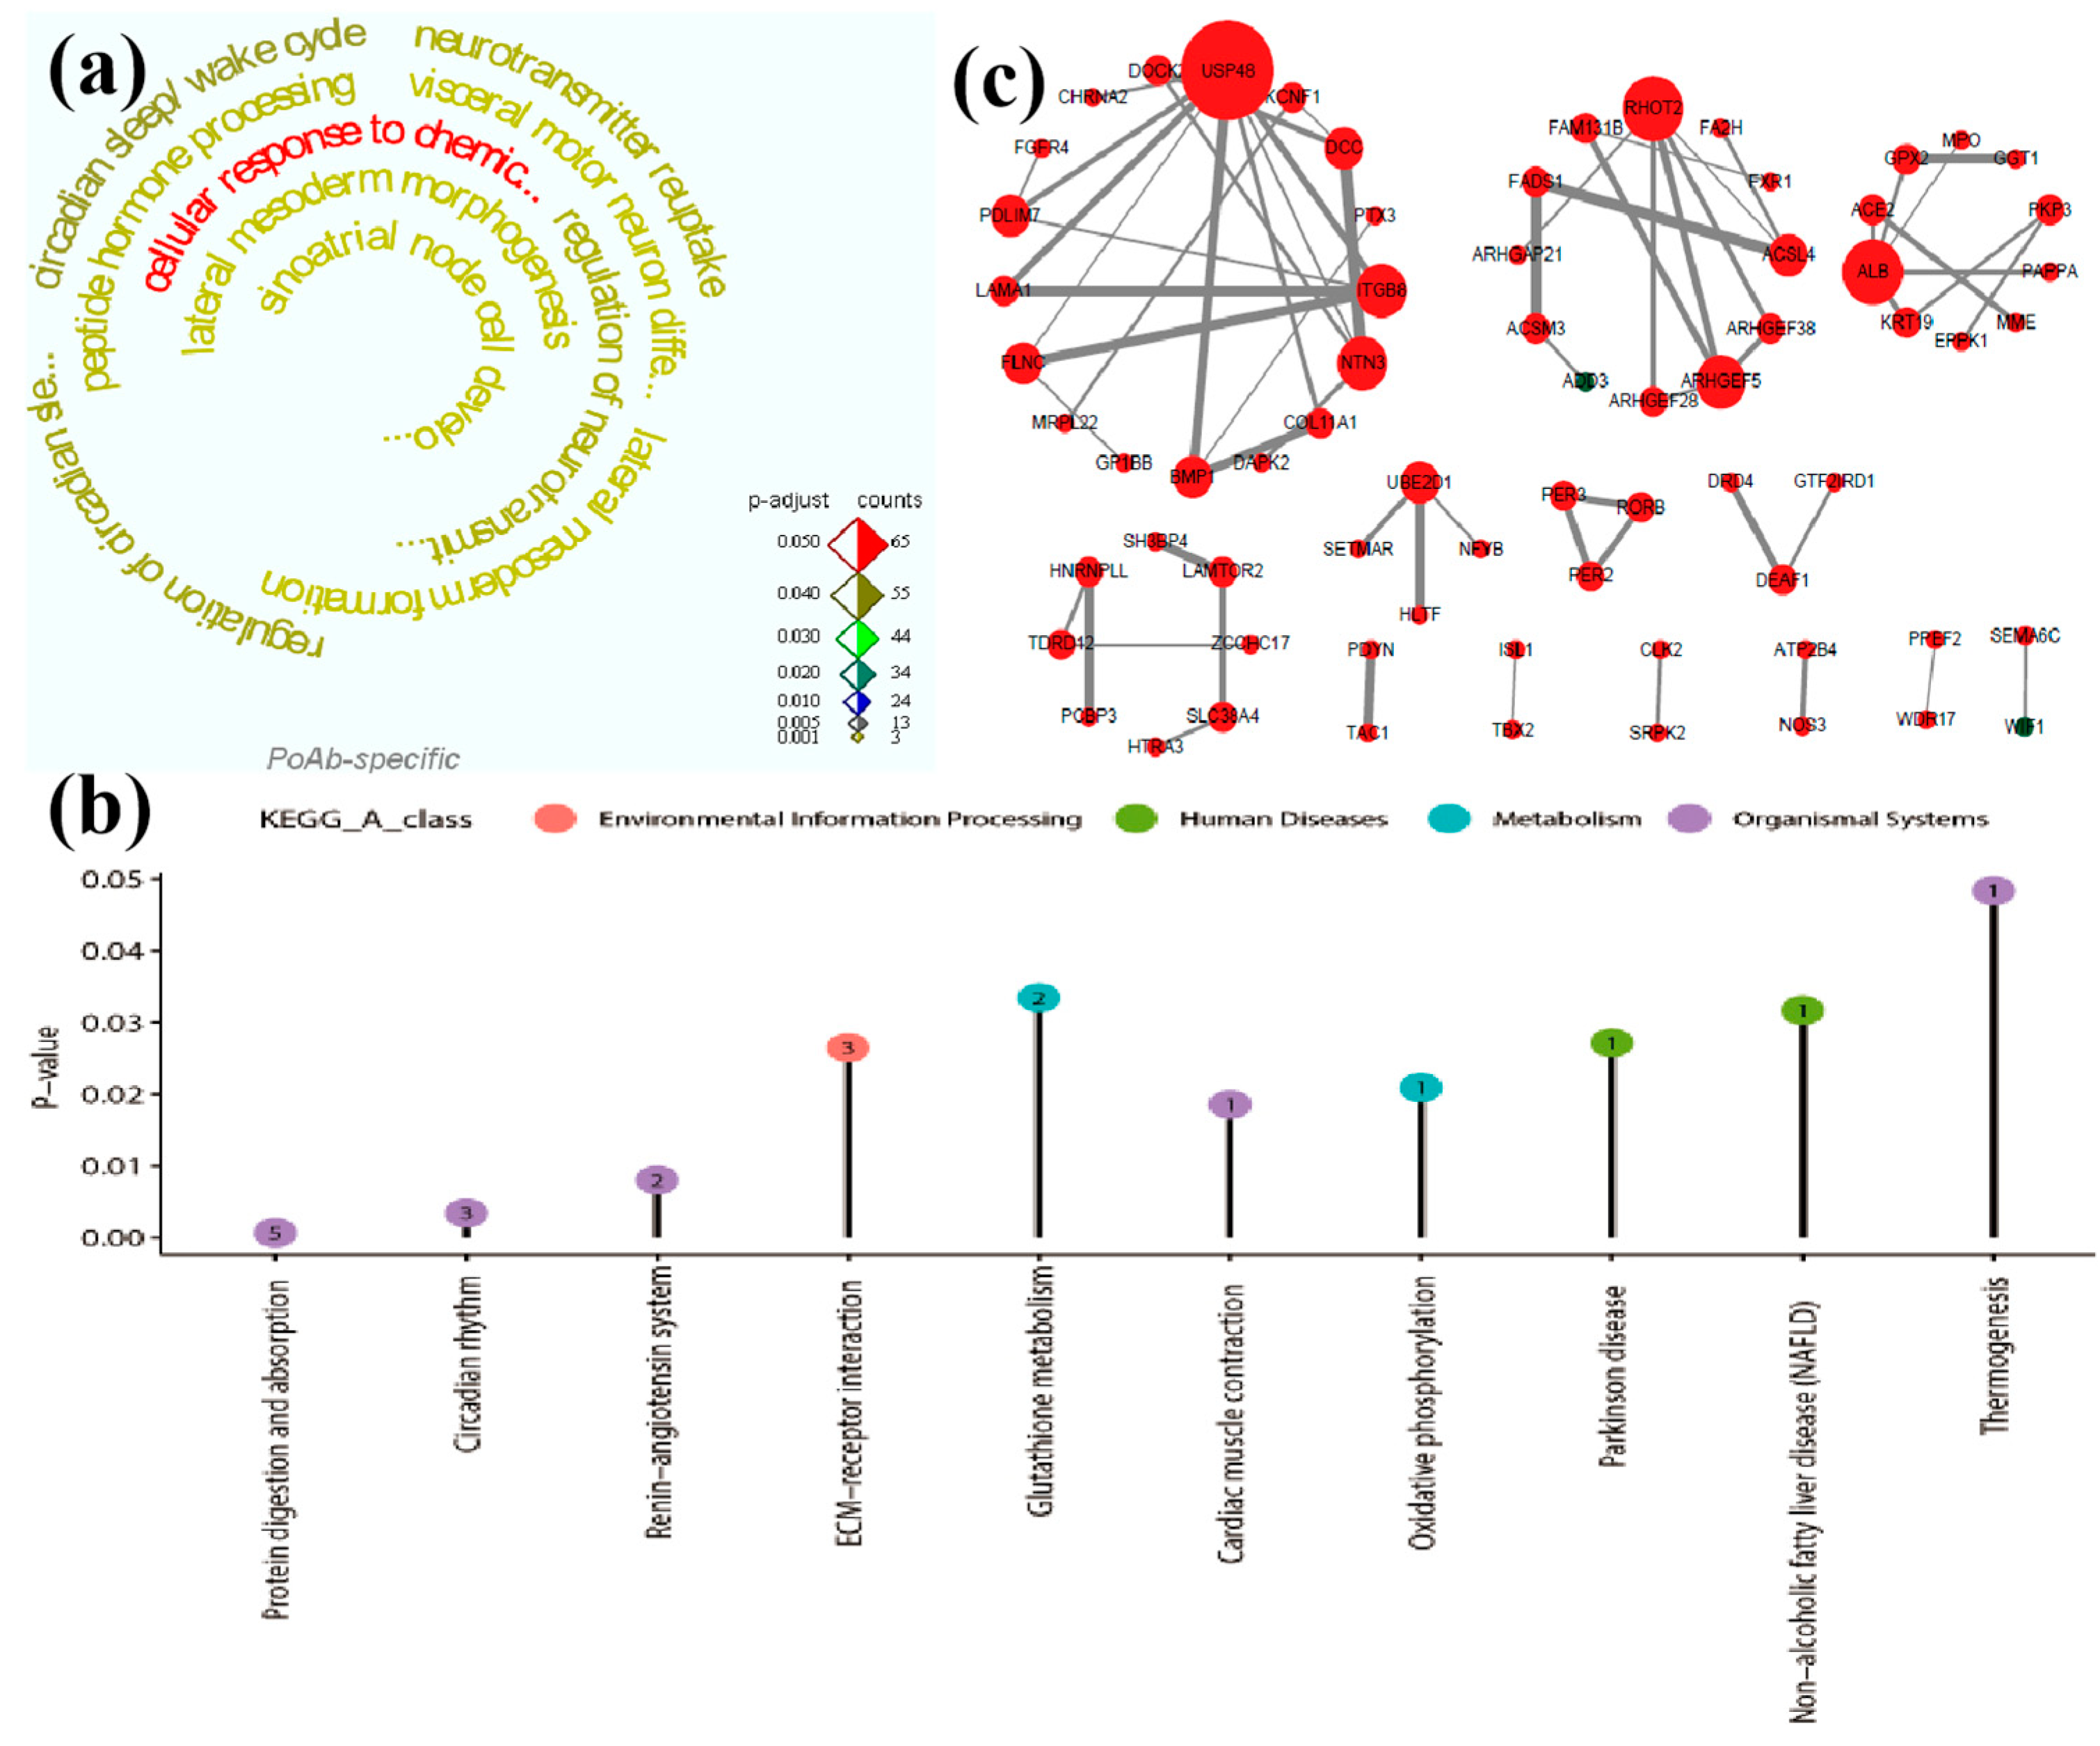
Figure 5.
Correlation analysis between RT-qPCR data and RNA-seq data, the histogram and scatter diagrams compare the expression levels (a, c) and correlations (b, d) of ten genes in RT-qPCR and RNA-seq data for SL group vs CK group and SL group vs E group respectively.
Figure 5.
Correlation analysis between RT-qPCR data and RNA-seq data, the histogram and scatter diagrams compare the expression levels (a, c) and correlations (b, d) of ten genes in RT-qPCR and RNA-seq data for SL group vs CK group and SL group vs E group respectively.
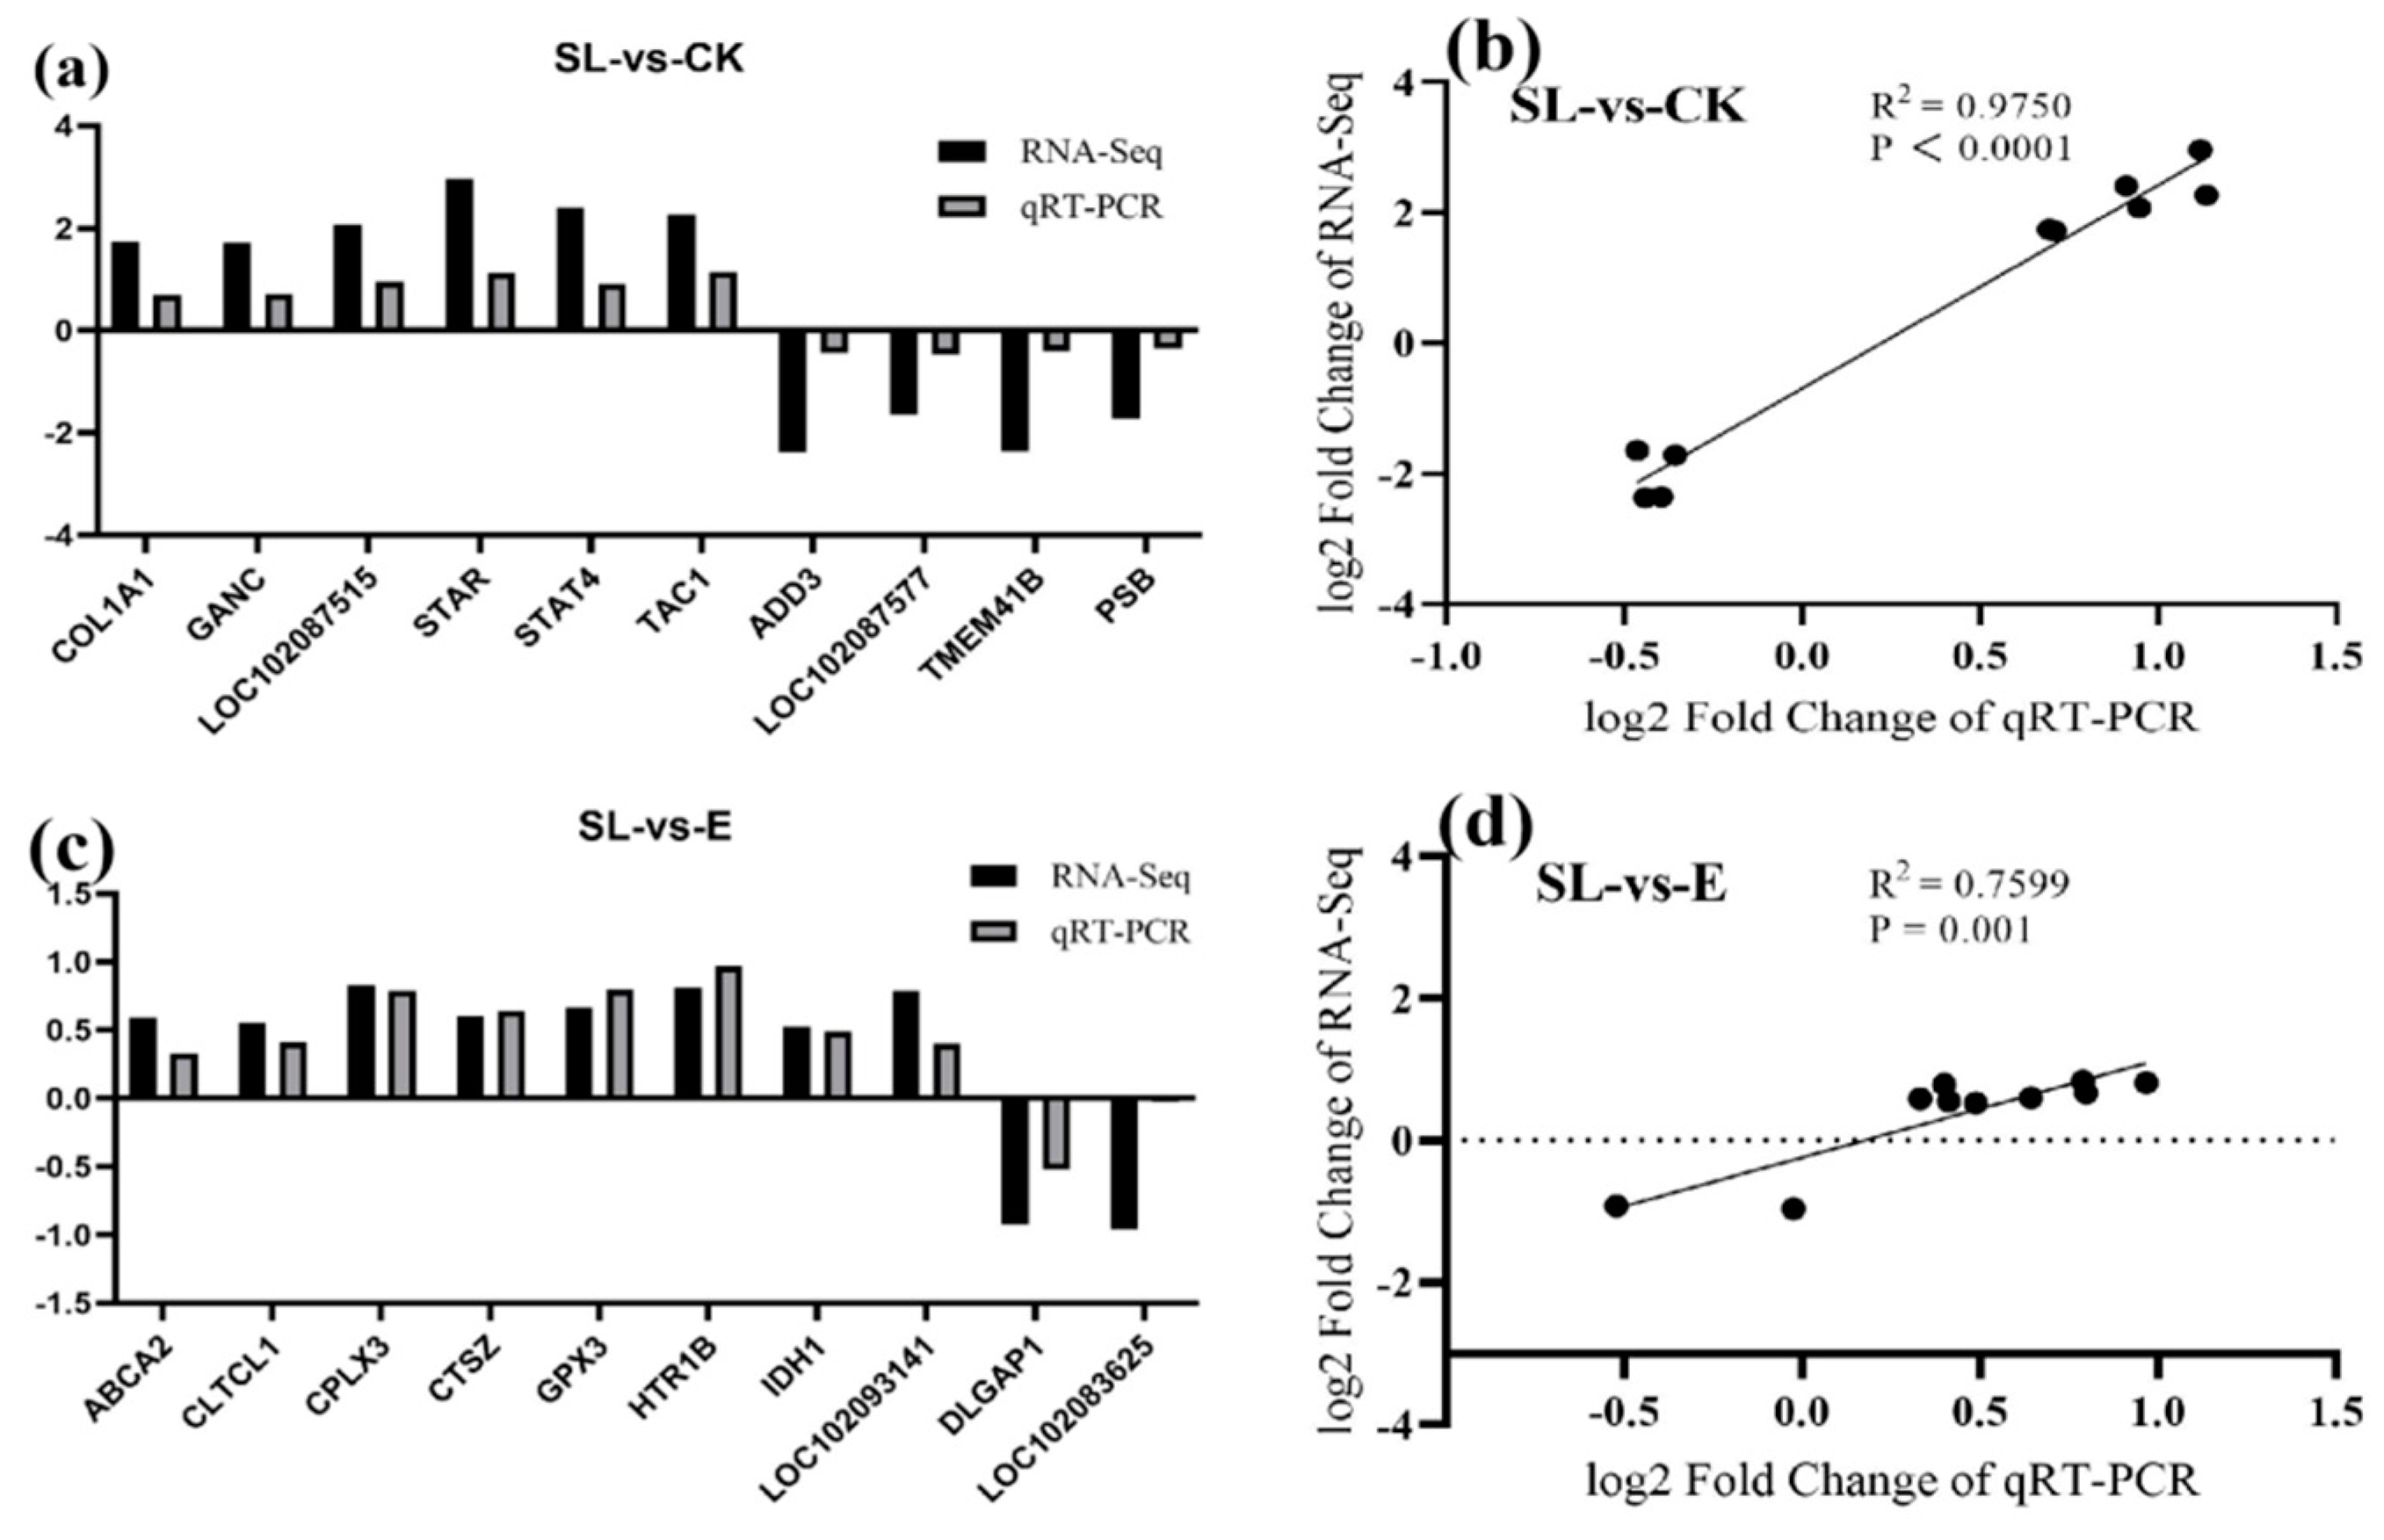
Figure 6.
Schematic representation of energy production and neural activity activated within the PoAb after electrical stimulation. Gene names in red and blue italics represent upregulated differentially expressed genes in SL group vs CK group and SL group vs E group, respectively.
Figure 6.
Schematic representation of energy production and neural activity activated within the PoAb after electrical stimulation. Gene names in red and blue italics represent upregulated differentially expressed genes in SL group vs CK group and SL group vs E group, respectively.
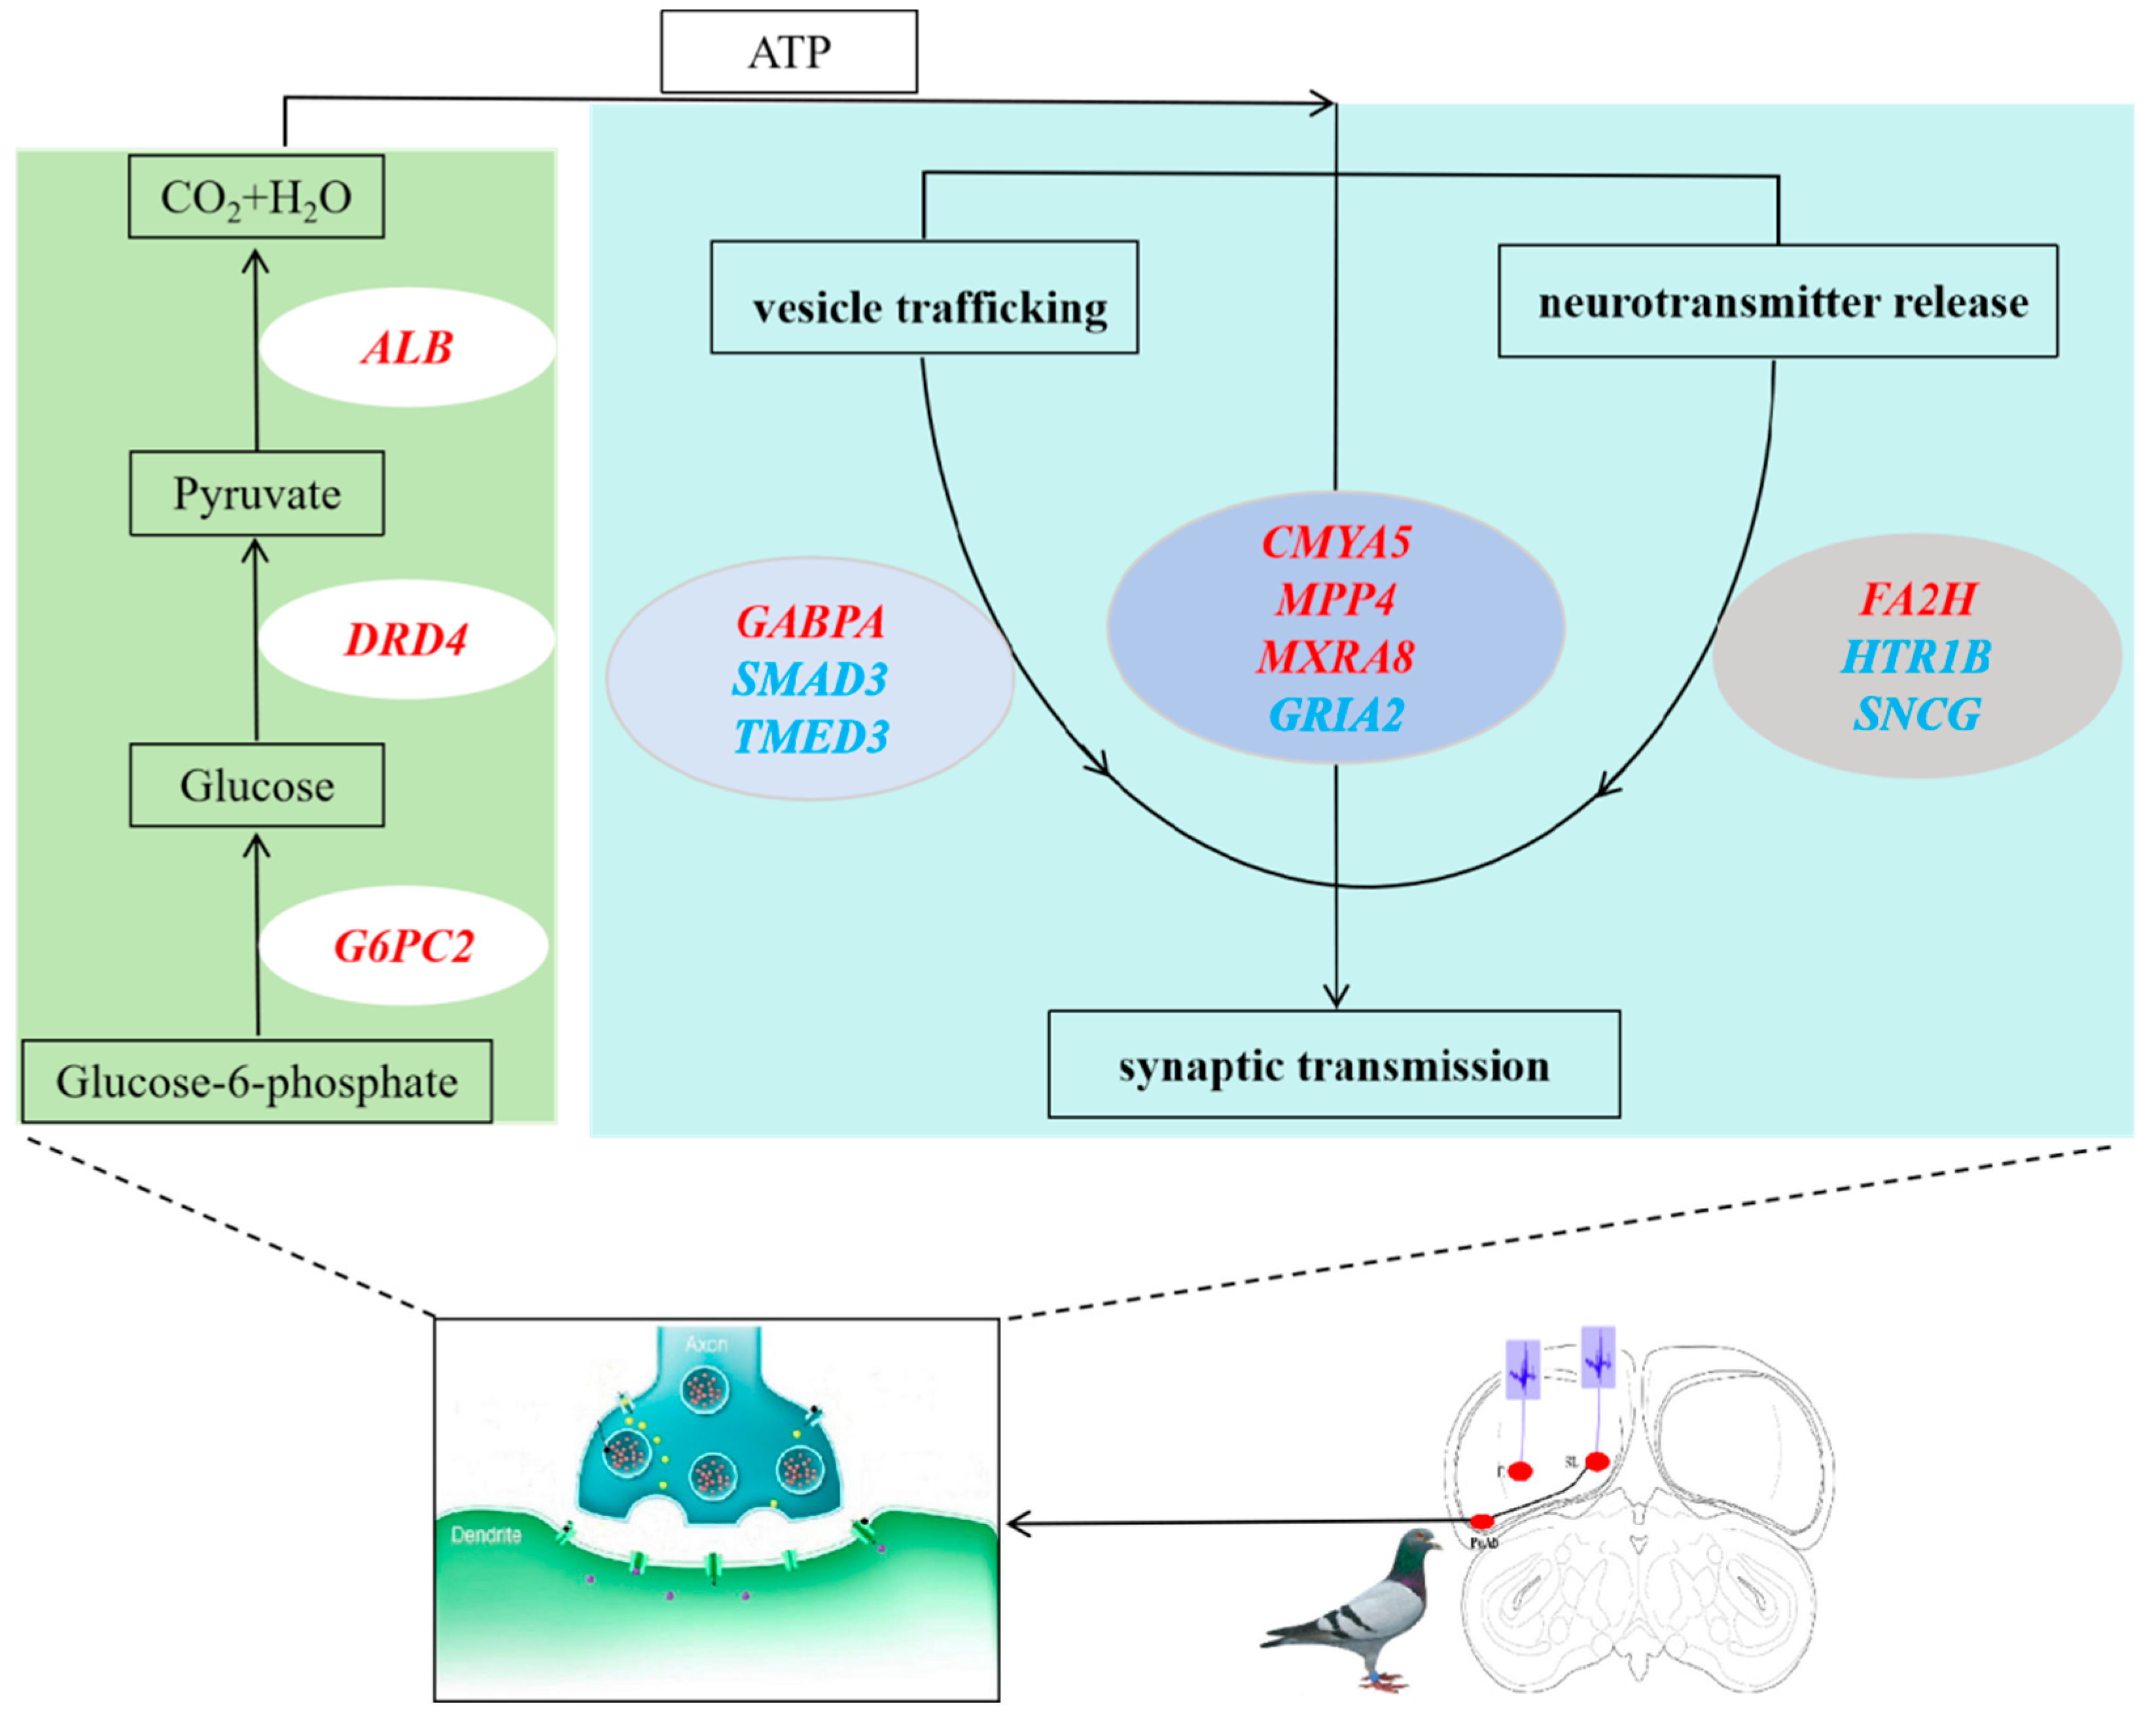

Table 1.
Electrode implantation site.
| Group | AP (mm) | ML (mm) | D (mm) |
| SL 01 | 7.50 | 1.0 | 5.8 |
| SL 02 | 8.00 | 1.0 | 5.4 |
| SL 03 | 8.50 | 0.9 | 5.3 |
| SL 04 | 9.00 | 0.5 | 5.3 |
| SL 05 | 9.50 | 0.5 | 5.6 |
| E 01 | 8.50 | 4.7 | 4.2 |
| E 02 | 9.00 | 5.0 | 5.3 |
| E 03 | 9.50 | 6.0 | 4.0 |
| E 04 | 10.00 | 6.0 | 5.0 |
| E 05 | 11.00 | 5.5 | 4.5 |
| CK 01 | / | / | / |
| CK 02 | / | / | / |
| CK 03 | / | / | / |
| CK 04 | / | / | / |
| CK 05 | / | / | / |
Table 2.
Target DEGs and reference genes of RT-qPCR primers.
| Gene | Primer-Forward | Primer-Reverse |
| β-actin | CCCAAAGCCAACAGAGAGAA | ACCAGAGGCATACAGGGACA |
| COL1A1 | CCAGGCCACCATCGCCCAG | AGCCCTCACCACCGTACTCG |
| GANC | TAAAGGAACCTGTCACCCGAA | GGTGCTCAAAATATAACAACCC |
| LOC102087515 | CAGAGACCCCACTATTGACCA | TTCAGGCCCAATCTTAGGGAA |
| STAR | AAGCCCTCCAGAAATCGCTCA | GTTGTCCACCAGCTCCCCGTA |
| STAT4 | CGCAATTCATTTGTGGTCGAA | TCCGGCAATTTAATCAGCAAC |
| TAC1 | GATGTACAGTCTAGTGCCTCA | AAACTTTACCCATCCCCTT |
| ADD3 | CAGCCATGGAATGATTACACC | GTCGGCCAACCTATACAAGC |
| LOC102087577 | CCATACAATTTCAGTCCGGGCAT | ATCAGAAAGGTCTCCTCCGTCT |
| TMEM41B | CAATTAGCTGGAAAGGTCACA | TGAATCATAGCTGGTTGCCTA |
| PSB | CGCTACGGGGACGAACCAC | CGTTCCATCGCCGTTTATTGC |
| ABCA2 | ACTTTCTCTTTGTCATCGAGCA | TGATGAACCACGCTACCCAA |
| CLTCL1 | GTACATCTGACTCTACCCCAT | CCCCAACAGCATTATTGTCCA |
| CPLX3 | CCCCACTGATGTTGTCACCCT | ACATGCTGGCTCTTTGCTCT |
| CTSZ | CAAAACTAGCCCAGATAGCAA | ATGATTTAGGTACTGTGCAAC |
| GPX3 | ACCAATTCGGAAAGCAGGAACCC | CACATCCCCTTTCTGGAAGAGC |
| HTR1B | GTGGCTTGGATATCTCAACTCCC | AATTTTCAGCTTGTGCATCGG |
| IDH1 | TCTATCAAGGATTTTGCCCAT | ATCTTCTTGGCTTCAAACTGG |
| LOC102093141 | CTCCTACTACCAAGAAGCCAA | ATCTGGATCTTCTCGCCCTC |
| DLGAP1 | GCGTCAAATATTGGAACTGACA | TACGGCTGCTAGATAATCCCT |
| LOC102083625 | AAAACGCATAGTGACCGAGA | CCATGTTTGCCATTAGTCACC |
Disclaimer/Publisher’s Note: The statements, opinions and data contained in all publications are solely those of the individual author(s) and contributor(s) and not of MDPI and/or the editor(s). MDPI and/or the editor(s) disclaim responsibility for any injury to people or property resulting from any ideas, methods, instructions or products referred to in the content. |
© 2024 by the authors. Licensee MDPI, Basel, Switzerland. This article is an open access article distributed under the terms and conditions of the Creative Commons Attribution (CC BY) license (http://creativecommons.org/licenses/by/4.0/).
Copyright: This open access article is published under a Creative Commons CC BY 4.0 license, which permit the free download, distribution, and reuse, provided that the author and preprint are cited in any reuse.


