
Submitted:
11 October 2024
Posted:
14 October 2024
You are already at the latest version
Abstract
The concept of clean energy was introduced by the Mexican authorities as part of the wholesale electricity market with the objectives of both measuring the progress in decarbonization and fostering emission-free and low-emission technologies. In the present work, the evolution of clean energy production for the period 2017-2023, corresponding to seven full years of operation of the electricity market, was analyzed and compared to official targets. Emission of greenhouse gases (GHG) was calculated from fuel consumption statistics. The consistency between electricity generation and fuel consumption data has been assessed. The projected short-term evolution of electricity generation and GHG emissions through 2026, locked in by decisions in the recent past, is modeled and discussed. The extent to which official clean energy figures can be considered a predictor for emissions from the power sector is discussed as well. The results are believed to be a relevant contribution for the assessment of Mexico’s progress with its national and international climate change mitigation goals.
Keywords:
Energy transition
; renewable energy
; non-renewable clean energy
; carbon emissions
1. Introduction
The effects of anthropogenic climate change on planetary health are unfolding before our eyes, much in line with predictions obtained from climate modeling scenarios developed over the past decades [1]. While in theory most nations have acknowledged the need for climate action in the form of “common but differentiated responsibilities” [2], in practice the emission pathways of nations differ quite substantially, even if fair-share considerations are factored in. While climate change mitigation policies of nearly all countries have been found to be insufficient to keep future emissions within the boundaries required to keep the global temperature increase below +1.5°C [1], the policies of a few countries stand out as “critically insufficient”. In their December 2022 assessment, the watchdog site Climate Action Tracker concluded for the case of Mexico that (1) both policies and actions, and conditional NDC (i.e., Nationally Determined Contributions) targets were “highly insufficient”, (2) unconditional targets evaluated against the fair share of emissions of the country were “critically insufficient”, meaning that Mexico’s targets are consistent with a > +4°C world, and (3) that no net zero target year has been established [3]. According to Climate Action Tracker, policies and actions have Mexico headed towards over 800 MtCO2eq/year in 2030 (up from about 680 MtCO2eq/year in 2020), to be compared with 1.5°C compatible “fair share” emissions for 2030 of only about 400 MtCO2eq/year. Decarbonization pathways for the Mexican economy have been outlined by Buira et al. [4], calling for the full replacement of fossil energy by renewables in the electricity sector before 2040.
In the current article, I am taking a closer look at Mexico’s emissions pathway, focusing exclusively on the electricity sector. The reasons for this somewhat narrower focus are the following: (1) Traditionally, Mexico’s decarbonization policy has put a strong emphasis on the electricity sector as the main contributor of their NDC targets [5], (2) a clean electric power sector is at the heart of decarbonization strategies worldwide [6], powering, among others, the decarbonization of the transport sector [7], the heating and cooling sector, and a number of major industrial operations [8], and (3) driven by the exponential growth of the digital services sectors [9] and the increased use of consumer electronics the consumption of electricity is expected to grow strongly, even in the absence of a switch to electric vehicles and the electrification of industrial processes. The results are intended to be a useful input for fact-based policy discussions in the near future. After finishing this manuscript, the author became aware of the recent work of Cruz Ake et. al [10], who addressed the problem of the Mexican transition to clean(er) energy by least cost-modeling. As opposed to the work cited, the current manuscript is entirely based on observed (electricity and fuel consumption) data and therefore represents a complementary, data-driven, perspective of a similar problem.
2. Research questions
In this work, I will be addressing the following questions:
- (1)
- How have Mexico’s electricity generation mix and the share of “clean” energy evolved? How consistent has the methodology for determining clean energy been over the years?
- (2)
- What has been the progress on the installed capacity of large-scale wind and solar power plants, as well as distributed solar?
- (3)
- Based on reported fuel consumption data available for the 2017-2022 period, how have the emissions of electricity-related greenhouse gases (GHG) changed over time?
- (4)
- How are the GHG emissions projected to evolve in the near future, based on the observed progress of both state-owned and privately funded generation projects?
- (5)
- Is Mexico on track to meeting its clean energy targets for 2024 and beyond? And, to what extent is the reported clean energy fraction a good predictor of GHG emissions?
3. The clean energy concept in Mexico
The concept of clean (electrical) energy is somewhat unique in Mexico, given that it includes a number of not intrinsically emissions-free technologies which can count as clean energy, subject to certain performance criteria, and even generate clean energy certificates (CEL, for its Spanish acronym) convertible to an additional source of income, as long as they correspond to a new or enlarged facility, as opposed to legacy facilities. Clean energy fractions are calculated by the authorities to measure the progress in the emissions-free portion of the overall amount of electricity generated in the sector. These fractions include both legacy and new facilities. Clean energy certificates, or CEL, are only granted to those plants or plant extensions that have been built after the CEL mechanism was established, i.e., with the advent of the electricity sector reform in 2014.
Clean (electrical) energy was introduced as a concept in 2011 [11] by the Energy Regulatory Commission (CRE, for its Spanish acronym) with a focus on cogeneration, introducing the concept of “efficient” cogeneration. The recognition as efficient cogeneration allowed qualifying generators to participate in a simplified scheme for the calculation of transmission and distribution charges. Detailed instructions as to how to calculate the performance of a cogeneration system were issued in 2012 [12], followed by an update of the 2011 methodology in 2014 [13]. An additional step was taken in 2016 when the CRE extended the concept of the fuel-free portion of electric energy [14], previously defined in the exclusive context of efficient cogeneration, to other processes, attending to a mandate included in the Electricity Industry Law (LIE, for its Spanish acronym) of 2014 [15]. Following the general definitions established by the LIE, renewable energy technologies are either of the following: wind, solar, hydro, geothermal, oceanic energy, and bioenergy. All existing hydroelectric plants prior to the LIE are considered renewable energy technologies, whereas new plants can qualify as such if they meet the criterion of either having an installed capacity of 30 MW or less or having an energy density in excess of 10 W/m2. All renewable energy technologies are considered clean. Nuclear energy is also considered a clean technology. Additional technologies can be considered partially clean, as quantified by their fuel-free portion of electric energy, subject to certain restrictions. Fully fossil-fuel based technologies are eligible as clean technologies, as long as their specific emissions are lower than 100 kg CO2e/MWh, in which case 100% of all generation is considered clean. In practice, as the regulation acknowledges, such emission densities can be obtained only with carbon-sequestering technologies, which were still absent in the Mexican electricity sector in 2016 and continue to be so as of 2023. The final case is hydrogen, which counts as a clean fuel even if produced from fossil fuels, if the conversion efficiency is in excess of 70%.
The special (and by far most important) case of non-fossil fuel clean electricity generation, i.e., efficient cogeneration, was discussed in detail by [16]. The main conclusions were: (1) The expected contribution of efficient cogeneration to Mexico’s clean energy goals was relatively marginal, with a peak clean energy fraction of nearly 3% predicted to occur in 2023, after which the curve was predicted to taper off. (2) There is a significant risk of over-reporting clean energy fractions, both due to simple data handling and interpretation issues, as well as to potentially intentional manipulation. To mitigate that risk, the authors proposed to make a continuous monitoring system mandatory, as opposed to annual certification tests under standard conditions.
A recent change in the definition of fuel-free (electric) energy was introduced in May of 2023 [17], with the following implications: (1) The reference efficiency values used to calculate the clean energy fraction for cogeneration were reduced, effectively lowering the bar for cogeneration plants to be considered “clean” and increasing the apparent amount of clean energy contributed to the system. (2) The electricity generated in the second stage of a power plant with “sequential cycles”, as it was phrased in the regulation, was now considered as clean, subject to certain performance criteria and conditions. (3) Power plants using pre-cooled air can accredit the increase in energy output over standard air admission conditions as clean energy. The May 2023 methodology was applied retroactively to the reported clean energy figures of 2022 in the National Energy Balance of 2022 [18] and other official documents.
4. Data sources and methodology
4.1. Clean energy figures
The main source for clean energy figure are generation summaries by technology published by the system operator CENACE in the public section of the Wholesale Electricity Market (MEM, for its Spanish acronym). These summaries provide time series with hourly resolution for major technology blocks. The fuel type or types for each technology and amounts of fuel used are not reported. Based on this classification, all renewable energy generation plus nuclear can be identified; (efficient) cogeneration and Distributed Generation (DG), are not accounted for in the MEM generation summaries and were determined separately. Official clean energy figures were obtained from the most recent clean energy progress report [19] and the National Energy Balance for 2022 [18].
4.2. Greenhouse gas emissions
Mexico maintains an official inventory of greenhouse gas, with the latest report corresponding to 2021 [20], which is a good starting point. However, some limitations exist, including the fact that emissions resulting from the combustion of fuels in the electricity sector are confounded with those used for heating purposes. No plant-level, technology-specific, or time-resolved data are published either. The national emission registry, with its latest report corresponding to the period of 2015-2018 [21], does provide (annual) plant-level emission data for GHG and pollutants for some plants in its supporting information, but no information about the electric power generation or fuel amounts is provided, precluding cross-validations of heat rates and emission factors. To conduct an independent assessment of power sector emissions and construct a more detailed view, I have therefore recurred to a number of different data sources for the energy sector, including the following:
- (a)
- The annual National Energy Balance reports [22] (SENER) contain detailed annual numbers for hydrocarbon production, particularly natural gas, fuel oil, coal and Diesel and their utilization in the power sector. In recent reports clean energy figures are also reported.
- (b)
- The governmental portal SIE (Information Energy System) offers access to data from different data sources. The SIE was used for queries of the following items:
- a.
- Annual data for hydrocarbon fuel consumption for electricity generation, as reported by the Energy Regulatory Commission (CRE, for its Spanish acronym). This data source is referred to as SIE/CRE in Table 4.
- b.
- Monthly values for natural gas consumption for electricity generation, as compiled by the Mexican Institute of Petroleum (IMP, for its Spanish acronym). This data source is referred to as SIE/IMP in Table 4.
- c.
- Annual values for coal consumption for electricity generation, as reported by the National Coal Balance (BNC, for its Spanish acronym), referred to as SIE/BNC.
- (c)
- Data from The Statistical World Review of Energy [23], through the web portal Our World in Data was used to query electricity data by fuel for the case of Mexico for comparisons.
Life-cycle emission factors were obtained from the most recent update of a meta study by the National Renewable Energy Laboratory (NREL), which summarizes harmonized results over about 3,000 published life-cycle assessments [24]. Similar values have been used or recommended by other authors, e.g. Gordon et al. [25] and Gibon et al. [26].

Table 1.
Life-cycle emission factors for all generation technologies / fuels represented in the Mexican power system. Emission factors for fossil fuels have been converted to a fuel basis, since a given fuel can be used in different generating technologies. Source: (NREL, 2021).
Table 1.
Life-cycle emission factors for all generation technologies / fuels represented in the Mexican power system. Emission factors for fossil fuels have been converted to a fuel basis, since a given fuel can be used in different generating technologies. Source: (NREL, 2021).
| Fuel type/technology | Life-cycle emissions [gCO2eq/kWhe] |
Life-cycle emissions [ktCO2eq/ PJfuel] |
| Biomass | 52 | - |
| Solar photovoltaic | 43 | - |
| Geothermal energy | 37 | - |
| Hydropower | 21 | - |
| Wind power | 13 | - |
| Nuclear power | 13 | - |
| Natural gas | - | 69 |
| (Fuel) oil | - | 72 |
| Coal | - | 112 |
| Diesel | - | 73 |
4.3. Short-term outlook (2024-2026)
The short-term generation figures were estimated under the following assumptions:
- (a)
- (b)
- (c)
- Research into the progress of pending fossil fuel generation projects by private investors, based on a generator database developed in the work of Miranda et al. [31] was conducted.
- (d)
- The new capacities were assumed to generate with net capacity factors (NCF) corresponding figures for the 2017-2023 period.
- (e)
- Generation figures were calculated for three hydroelectric scenarios: (i) low hydro generation (taken as the generation for 2023), (ii) high generation (2022), and (iii) typical generation (average of the period 2017-2023).
- (f)
- Re-dispatch was conducted based on the following principles: (i) Existing coal, conventional steam, internal combustion, and single-cycle gas turbine plants were reduced down to their minimum generation levels observed during the 2017-2023 period, (ii) required additional reductions in generator output were achieved by reducing the output of existing combined-cycle plants and curtailing the existing renewable energy fleet in equal parts, (iii) missing energy, where required, was provided by (slightly) increasing the output of the existing combined-cycle fleet.
- (g)
- Predicted fuel consumption values for 2023-2026 were estimated using the technology-fuel matrix method described in Appendix A, using reported and projected electricity generation data for 2023 and 2024-2026, respectively.
5. Results and discussion
5.1. Observed and official clean energy production figures for the 2017-2023 period
Annual summaries for generation figures, excluding distributed generation, are shown in Figure 1 and Table 2. The total volume of electricity production from renewables can be seen to grow strongly from 2017 to 2021 and taper off afterwards, with a strong decline in 2023. It can also be seen that this decline in 2023 arises from the combination of a strong decrease in hydroelectric production and the saturation of both the wind and the solar production, which stayed at similar levels during the 2021-2023 period. Production from geothermal and nuclear energy stayed nearly flat and only contributed a few percent points to the total production of renewable electricity. Regarding fossil energy, it can be seen that the overall production grew from about 244 TWh/a in 2017 to 269 TWh/a in 2023, corresponding to an increase of about 10%. Generation from combined cycle plants grew from 154 TWh/a in 2017 to nearly 203 TWh/a in 2023, corresponding to a 25% increase. Generation from coal and by conventional steam plants decreased during the 2019-2022 period but rose again in 2023, with an increase of nearly 50% from 2022 to 2023 in the case of conventional steam plants, whereas production from coal-fired plants increased by 63% from 2021 to 2022 and then stayed at the same level.
From Table 2 it can be seen that the clean energy fraction obtained from the CENACE data peaked at 27.4% in 2021 and has since declined, to the current (2023) value of 21.9%. This value has to be compared with the target number of 35% established for 2024 in the Energy Transition Law. Other sources of clean energy can be found in the National Energy Balance (BNE), as shown in Table 3. The figures for all technology-aggregated generation classes reported by CENACE are almost identical in the BNE report. The most important additional items reported by the BNE are the following: (1) Efficient cogeneration, contributing an additional 15.1 PJ of clean energy in 2022 (comparable to the generation from geothermal energy), (2) distributed generation from solar photovoltaic systems (14.6 PJ), (3) total bioenergy (7.7 PJ), (4) fuel-free electricity derived from fossil fuels (at a staggering 27 PJ), and (5) additional energy from auxiliary cooling of intake air in gas turbines (3.3 PJ). The values reported by the BNE for efficient cogeneration (item 1) and distributed solar (item 2) appear to be theoretically possible. The values for distributed solar are roughly consistent with the installed capacity values reported by ASOLMEX for the 2017-2023 period if a plausible average net capacity factor (NCF) of 17.5% is assumed. Total bioenergy, according to the BNE, includes distributed generation and isolated supply from biomass.
It is worth noting that items (4) and (5) contributed 0 PJ in previous years and jumped to a combined value of about 30 PJ only in 2022. A footnote in the table in the BNE report for 2022 explains that these numbers have been created with the methodology described in the regulatory document A/018/2023 and therefore correspond to a retroactive application of the new regulation.
Table 2.
Electricity generation by technology classes, as defined by CENACE, for the 2017-2023 period. Clean energy includes renewables and nuclear. All values are reported in MWh. Additional clean energy contributions, such as those from distributed solar and efficient cogeneration, are not included in these aggregated summaries and are discussed below; see Table 3 and Figure 2.
| Technology \ Year | 2017 | 2018 | 2019 | 2020 | 2021 | 2022 | 2023 |
| Wind | 10,454,444 | 12,432,826 | 16,520,991 | 19,684,175 | 21,049,271 | 20,304,826 | 20,695,412 |
| Solar PV | 346,947 | 2,174,394 | 7,980,058 | 13,517,173 | 17,070,210 | 16,287,206 | 18,209,982 |
| Biomass | 2,886 | 75,399 | 105,861 | 89,394 | 98,872 | 95,362 | 96,693 |
| Coal | 28,663,360 | 27,345,012 | 22,034,690 | 12,510,530 | 8,704,632 | 14,192,507 | 14,247,160 |
| Combined cycle | 154,289,170 | 160,670,910 | 171,877,440 | 183,672,570 | 184,356,620 | 194,013,140 | 203,586,556 |
| Internal combustion | 2,333,057 | 2,564,187 | 3,170,767 | 2,873,152 | 2,057,782 | 1,843,928 | 3,634,595 |
| Geothermal | 5,706,169 | 5,023,157 | 5,056,714 | 4,508,830 | 4,198,437 | 4,368,535 | 4,113,117 |
| Hydro | 31,660,120 | 32,203,712 | 23,879,279 | 26,804,751 | 34,697,076 | 35,556,117 | 20,548,855 |
| Nuclear | 10,571,136 | 13,198,780 | 10,971,859 | 10,864,278 | 11,605,475 | 10,539,513 | 12,043,370 |
| Conventional steam | 43,993,068 | 40,408,219 | 39,260,648 | 23,378,736 | 23,200,245 | 21,118,786 | 31,182,527 |
| Single-cycle gas turbines | 14,687,034 | 14,379,489 | 16,401,278 | 14,133,336 | 16,276,667 | 15,487,650 | 17,855,481 |
| Total renewables | 48,170,567 | 51,909,488 | 53,542,904 | 64,604,323 | 77,113,866 | 76,612,046 | 63,664,059 |
| Total clean energy | 58,741,703 | 65,108,268 | 64,514,763 | 75,468,601 | 88,719,341 | 87,151,559 | 75,707,430 |
| Total fossil energy | 243,965,689 | 245,367,817 | 252,744,823 | 236,568,324 | 234,595,947 | 246,656,011 | 270,506,319 |
| Clean energy fraction | 19.4% | 21.0% | 20.3% | 24.2% | 27.4% | 26.1% | 21.9% |
Table 3.
Electricity generation by technology classes: Comparison of CENACE figures against BNE (National Energy Balance). All values are reported in PJ. Note that the BNE reports several categories not included in the CENACE data set, including total bioenergy and fossil fuel-free energy. The FIRCO program corresponds to rural electrification.
| Electricity generation [PJ] | ||||||
| Technology | Source | 2018 | 2019 | 2020 | 2021 | 2022 |
| Hydroelectricity | CENACE | 115.9 | 86.0 | 96.4 | 124.9 | 128.0 |
| Hydroelectricity | BNE | 116.0 | 85.0 | 96.5 | 125.0 | 128.0 |
| Geothermal | CENACE | 18.1 | 18.2 | 16.2 | 15.1 | 15.7 |
| Geothermal | BNE | 18.2 | 18.2 | 16.5 | 15.3 | 15.9 |
| Wind | CENACE | 44.8 | 59.5 | 70.8 | 75.8 | 73.1 |
| Wind | BNE | 44.8 | 60.2 | 70.9 | 75.9 | 73.9 |
| Solar photovoltaic | CENACE | 7.8 | 28.7 | 48.6 | 61.5 | 58.6 |
| Solar photovoltaic (large scale) | BNE | 7.8 | 30.2 | 48.7 | 61.4 | 58.6 |
| Solar photovoltaic (dist. generation) | BNE | 3.7 | 5.6 | 8.3 | 11.2 | 14.6 |
| Solar photovoltaic (isolated supply) | BNE | 0.0 | 0.0 | 0.0 | 0.1 | 0.1 |
| Solar photovoltaic (FIRCO program) | BNE | 0.1 | 0.0 | 0.0 | 0.0 | 0.0 |
| Biomass | CENACE | 0.3 | 0.4 | 0.3 | 0.4 | 0.3 |
| Bioenergy (total) | BNE | 7.2 | 6.7 | 7.9 | 5.7 | 7.7 |
| Nuclear | CENACE | 47.5 | 39.5 | 39.0 | 41.8 | 37.9 |
| Nuclear | BNE | 47.5 | 39.2 | 39.1 | 41.8 | 37.9 |
| Regenerative brakes | BNE | 0.0 | 0.0 | 0.0 | 0.0 | 0.0 |
| Efficient cogeneration | BNE | 8.7 | 12.2 | 15.5 | 12.3 | 15.1 |
| Fossil fuel-free energy | BNE | 0.0 | 0.0 | 0.0 | 0.0 | 27.0 |
| Auxiliary cooling | BNE | 0.0 | 0.0 | 0.0 | 0.0 | 3.3 |
| Batteries | BNE | 0.0 | 0.0 | 0.0 | 0.0 | 0.0 |
5.2. Fuel consumption for electricity generation
As described in section 4.2, a number of data sources were consulted in order to construct a consistent picture of the fuel consumption in the Mexican power sector. Data reported by the annual National Energy Balance reports (BNE) are in Petajoules (PJ), whereas data obtained from the Energy Information System (SIE) are originally reported in fuel-specific units; all values were converted to Petajoules for consistency, as shown in Table 4. In the following, a brief discussion of the fuel consumption data will be provided.
Coal: Data from the National Coal Balance (BNC) and the National Energy Balance (BNE) are consistent for all years, except for 2019. Values reported by the CRE are of the same order of magnitude, but are consistently lower for all years, with the discrepancy being some 9% for the 2014-2018 period; for 2019-2022 the discrepancy jumped to some 22-30%. Values from Our World in Data (OWD), originally reported in TWh/a of electricity, were converted into corresponding fuel consumption values (in Petajoules) by assuming an average heat rate of HR = 12 GJ/MWh, based on values reported by the Secretary of Energy in its 2018 version of the Indicative Plan of Installations and Retirement of Generation Units [32] (PIIRCE, for its Spanish Acronym). However, even if a hypothetical average heat of 10.5 GJ/MWh were to be considered in the conversion the consumption values reported by OWD for 2021 and 2022 would still be about 40% higher than the values reported by BNE and BNC.
Natural gas: The dominating role of natural gas for electricity production in Mexico has been discussed in detail by Santillán-Vera et al. [33]. CRE values are consistently much lower than data from the other sources; one value (for 2022) seems to be a data handling error and was considered an outlier. The other three sources have roughly consistent information among each other, with a somewhat increased dispersion in recent years. Data recompiled by the Mexican Institute of Petroleum (IMP, for its Spanish acronym) are available on a monthly basis but only through September of 2022; missing months (February of 2020 and October through December of 2022) were reconstructed by bi-dimensional interpolation; the annual averages (2020 and 2022) reflecting this reconstruction have been marked in blue in Table 4.
Fuel oil: In this case, data by CRE and BNE are similar, with differences between 1 and 10%, with the exception of the most recent years when the discrepancy jumped to some 30%. The values reported by OWD, after the conversion from electricity to fuel consumption assuming a heat rate of 18.5 GJ/MWh1, are twice as high as the BNE data, even jumping to four times as high in 2020 and 2022. It should be noted, however, that OWD data refer to “oil” in a generic fashion (instead of referring specifically to “fuel” oil) and that other fossil fuel categories are reported by OWD. CRE and BNE also report Diesel fuel, and BNE also includes numbers on pet coke, liquefied gas, and “others”. This last category is explained in a BNE footnote as “diesel fuel used in self-generation”. Given the large amount reported for 2021 (404 PJ), compared to essentially zero for other years), the conservative decision was made to treat this number as an outlier and not to include it in the emissions calculations.
To build a unique set of fuel consumption curves, the following decisions were made: (1) For coal, the average of the three sources SIE/CRE, SIE/BNC, and BNE was used; upper and lower bounds were taken as the highest and lowest reported value for each year. (2) For natural gas, only SIE/IMP and BNE was used, as the SIE/CRE consumption data were implausibly low; see the comments on consistency below. (3) For fuel oil and Diesel fuel, the average of SIE/CRE and BNE was used. The SIE/CRE value for Diesel consumption in 2017 was discarded as an obvious reporting error. (4) OWD information was not used since fuel consumption values are not reported directly. (5) Pet coke consumption values were used as reported. (6) Consumption values for the category “others” were neglected. (7) Consumption values for liquefied (petroleum) gas were neglected as well.
Table 4.
Fuel consumption for electricity generation in the Mexican electric power system from different sources; all data are in Petajoules (PJ). (1) Energy Information System (with data from CRE): Fuel for electricity. (2) Energy Information System/National Coal Balance. (3) Energy Information System (with analysis from IMP): Gas use by sector. (4) National Energy Balance: annual reports 2014-2022. (5) Our World in Data (OWD), with information from data from Ember’s electricity data and Statistical Review of World Energy Data. OWD data are reported in TWh/a and were converted to Petajoules assuming fuel type-averaged heat rate values. Data considered reporting errors by the original source are marked in red. The two values marked in blue have been estimated by reconstructing a few missing months by bi-dimensional interpolation. Pcoke = pet coke, Lgas = liquified petroleum gas.
| Coal | Natural gas / dry gas | Fuel oil / oil | Diesel | Pcoke | Other | Lgas | |||||||||||
|---|---|---|---|---|---|---|---|---|---|---|---|---|---|---|---|---|---|
| Year | SIE / CRE(1) | SIE / BNC(2) | BNE | OWD (12) | SIE /CRE | SIE / IMP(3) | BNE(4) | OWD (8.5) | SIE / CRE | BNE | OWD (18.5) | OWD (9.3) | SIE / CRE(1) | BNE | BNE | BNE | BNE |
| 2014 | 326 | 357 | 358 | 377 | 513 | 1371 | 1342 | 1375 | 255 | 258 | 558 | 279 | 12 | 18 | 39 | 7 | 5 |
| 2015 | 329 | 362 | 363 | 378 | 588 | 1502 | 1285 | 1476 | 246 | 248 | 537 | 269 | 14 | 21 | 39 | 6 | 5 |
| 2016 | 341 | 373 | 373 | 381 | 610 | 1527 | 1735 | 1505 | 269 | 273 | 571 | 285 | 18 | 29 | 35 | 6 | 4 |
| 2017 | 289 | 317 | 317 | 342 | 474 | 1518 | 1705 | 1515 | 298 | 312 | 663 | 332 | 1537 | 31 | 39 | 4 | 2 |
| 2018 | 290 | 317 | 317 | 342 | 586 | 1718 | 1813 | 1670 | 257 | 270 | 646 | 323 | 26 | 40 | 38 | 0 | 4 |
| 2019 | 219 | 284 | 350 | 350 | 635 | 1782 | 1759 | 1598 | 233 | 258 | 573 | 286 | 33 | 50 | 34 | 2 | 0 |
| 2020 | 117 | 164 | 164 | 222 | 409 | 1749 | 1439 | 1660 | 135 | 138 | 585 | 292 | 18 | 24 | 38 | 2 | 0 |
| 2021 | 61 | 79 | 79 | 159 | 1030 | 1692 | 2181 | 1695 | 164 | 238 | 594 | 297 | 24 | 33 | 35 | 404 | 0 |
| 2022 | 86 | N/A | 111 | 251 | 3883 | 1558 | 2216 | 1622 | 160 | 229 | 873 | 436 | 41 | 60 | 38 | 34 | 0 |
The consolidated fuel consumption timelines are shown in Figure 3. It can be seen that the natural gas (NG) consumption has increased strongly in the 2014-2022 period, by some 40% compared to the 2014 level, reflecting both the load growth and the ever-increasing role of natural gas fired combined-cycle plants in the Mexican system, with the only exception being the year of the pandemic, 2020, where a sharp drop can be observed. The large uncertainties for the period 2020-2022 should be noted. Diesel (D) consumption is also reported to have grown strongly in the period, albeit on a much lower level, with the pandemic years 2020 and 2021 showing lower values. Fuel oil (FO) consumption can be seen to follow a downward trend starting in 2018, presumably reflecting a much larger participation of wind and solar (see Figure 5). After the pandemic dip in 2020 the overall trend appears to continue, although the large uncertainties for 2021 and 2022 also allow for the interpretation that fuel oil consumption has actually stabilized in these years, instead of continuing to fall. Coal (C) consumption is reported to have fallen continuously since 2017, with a recent increase in 2022.
5.3. Evolution of installed capacity for wind and solar generation
Most of the progress in clean energy production in Mexico depends on the development of wind and solar energy, since the further development of hydro, geothermal, and nuclear is rather limited. To analyze Mexico’s progress in clean energy we will first discuss the installed capacity of the following three technologies: (1) Large-scale wind, (2) large-scale solar PV, and (3) distributed solar PV generation.
The evolution of the installed capacity of large-scale wind power is shown in Figure 4, exhibiting both the cumulative installed capacity (left graph) and annual additions (right graph). It can be seen that the cumulative capacity is well described by a logistic growth function; the ultimate limit of the model is 8341 MW. This number corresponds to less than 10% of the installed capacity of the national electricity system (SEN, for its Spanish acronym) and is therefore well below penetration values observed in other countries. As shown by Figure 4, the amount of annually installed capacity peaked in 2019 at over 1,100 MW/a after showing a more or less continuous ascent. Subsequently, new installations fell precipitously, with only 200 MW of new wind power capacity coming on-line in 2022. As of October 2023, 909 MW worth of fully built wind power plants have been awaiting green light from the authorities to reach commercial operation, 198 MW of which received pre-approval by the Energy Regulatory Commission (CRE, for its Spanish acronym) in 2023 and were assumed to come on-line by the end of 2023. The rest was assumed to find its way into the grid during 2024 and 2025, for a total of little over 8,000 MW at the end of 2025.
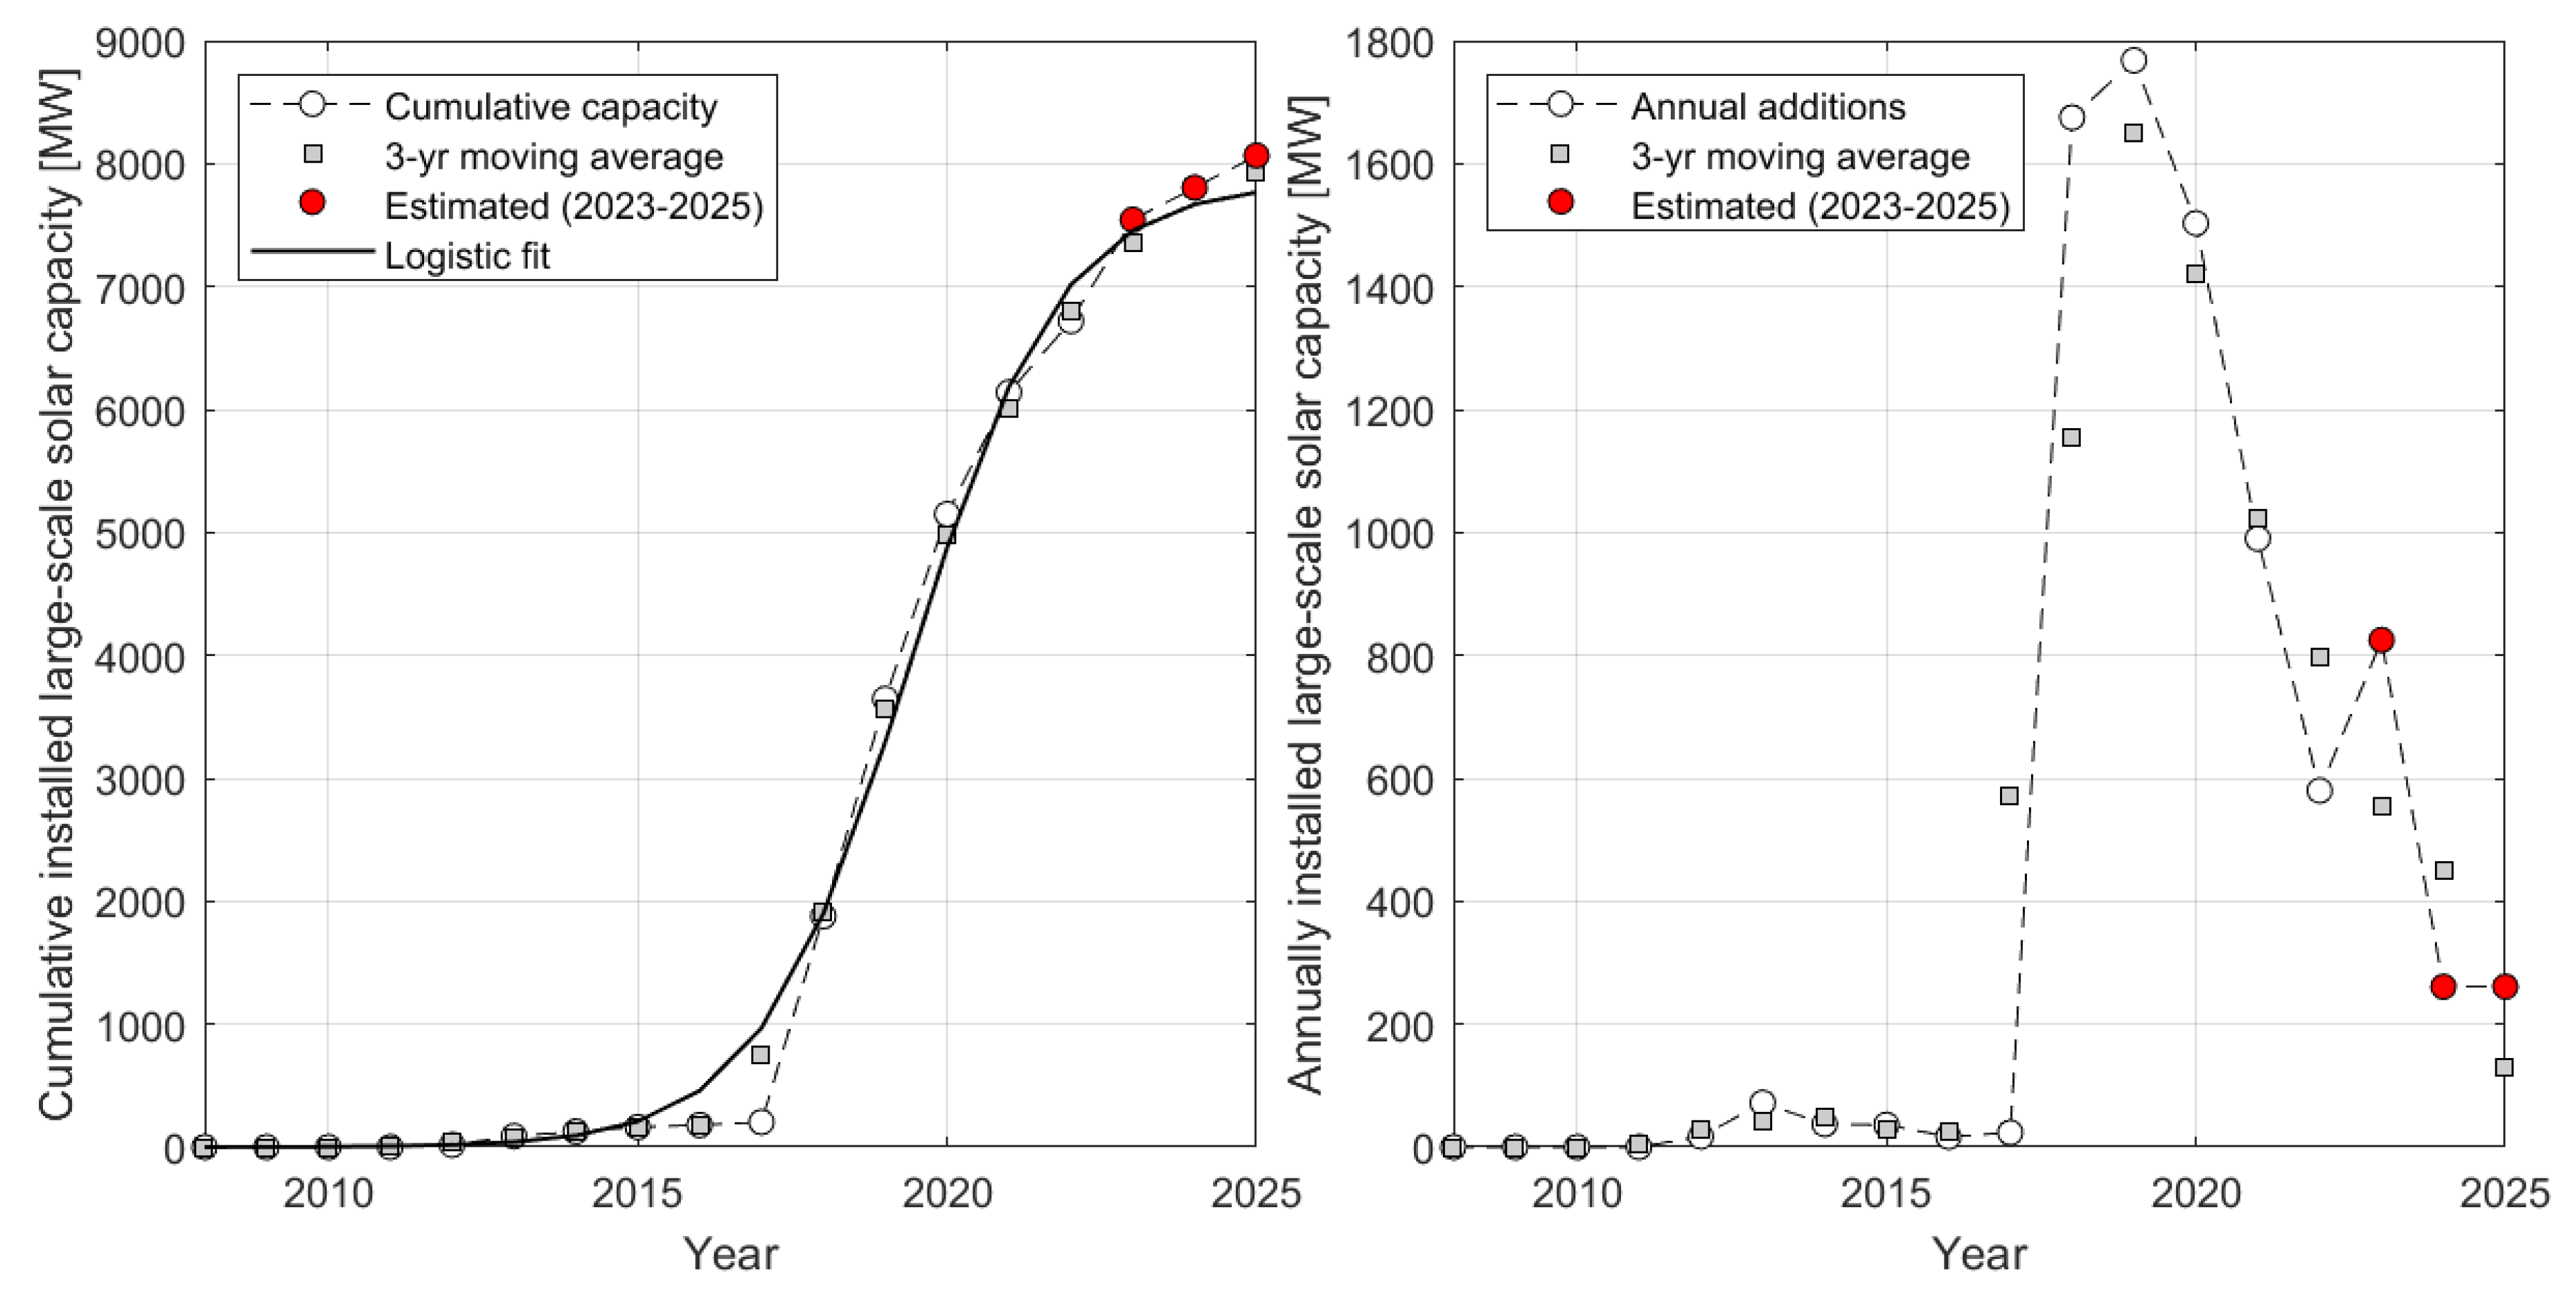
In the case of large-scale solar PV, shown in Figure 5, this technology can be seen to be completely marginal until 2017 when the first results of the long-term auctions for clean energy, conducted in 2015, 2016, and 2017, materialized, leading to the first major appearance of solar photovoltaic projects in Mexico. As in the case of large-scale wind, a strong peak of installations is observed in 2019, when nearly 1,800 MW of new solar came on-line, followed by a steep fall of new installations to less than 600 MW in 2022. As of October 2023, fully built solar power plants with a total capacity of 522 MW are awaiting permission to enter commercial operation. This capacity is assumed to eventually come on-line during 2024 or 2025. In a way similar to large-scale wind, the cumulative amount of installed capacity can be seen to follow a logistic growth curve, with the fit model converging to 7,846 MW.
The case of distributed generation, defined as generation capacity connected to the distribution grid with a maximum capacity of 500 kW, is somewhat different, as illustrated by Figure 6. The growth curve does not exhibit a peak of new installations; however, as can be seen from the graph of the cumulative installations the evolution cannot be characterized as an unrestricted or exponential growth but rather fits very well to a logistic model, with an ultimate limit of 4506 MW. This logistic model has been used to predict the capacity additions in distributed generation through 2026; see section 4.3.
Figure 5.
Left: Cumulative installed large-scale solar PV power capacity in Mexico for the period 2008-2025; values for 2023-2025 have been estimated; see text for details. A logistic fit has been added, based on 3-year moving averages. Right: Annual additions of large-scale solar PV power capacity and their 3-year moving averages. Based on data from the Mexican Solar Energy Association [30].
5.4. Carbon emissions from the power sector for the 2017-2022 period
Figure 7 (left graph) shows the CO2 emissions associated with the combustions of the main four fuel types. The reductions in 2020, due to the effects of the pandemic, can be clearly distinguished. Apart from this anomaly, the following trends can be observed: (1) Emissions from natural gas combustion continue to increase, (2) emissions from coal burning started to decline strongly in 2020 and 2021 but have slightly recovered since, (3) emissions from fuel oil have a slight downward trend, (4) emissions from Diesel fuel are marginal, but have been increasing in recent years. In the case of life-cycle emissions from renewable energy technologies, shown in Figure 7 (right graph), emissions account for only about 1% of the total life-cycle GHG emissions, confirming the argument that decarbonization of the electricity sector occurs mainly through migration to renewables.
The effect of these trends on the effective average emission factor for the Mexican electricity system can be seen in , showing a downward trend for the 2017 – 2022 period in consistency with the official figures published annually by the Secretary of the Environment (SEMARNAT). The figures calculated in this work, both by using the reported fuel consumption values directly and by calculating the natural gas consumption from the sum rule , are roughly consistent with the SEMARNAT figures, although generally somewhat higher. It should be noted that most of this reduction comes from the increase in generation from wind and solar. However, as evidenced by Figure 7 (left graph), GHG emissions from fossil fuels have also slightly decreased since the pandemic, with the 2020-2022 average being some 12% lower than the 2017-2019 average. This can be attributed mainly to the strong reduction in generation from coal.
5.5. Projected clean energy production and GHG emissions through 2026
The expected additional generation capacities available at the beginning of each year during the 2024-2026 period have been determined with the methodology described in section 4.3. The results are shown in Table 5. It can be seen that the new plants developed by the state utility CFE are mostly based on fossil fuel technology, with 95% (= 7699/(7699 + 693)) of all new capacity, with combined-cycle gas turbine (CCGT) plants accounting for the bulk (85%) of all new fossil fuel projects. Renewable projects are limited to one large PV project in Puerto Peñasco in the state of Sonora and the repowering of geothermal and hydroelectric facilities. Private projects all correspond to renewable energy, with additions in large-scale and distributed solar projects accounting for some 38% each, and large-scale wind accounting for the rest. The rationale for determining these additions has been explained in some detail in section 5.3.
The expected generation from this new capacity was determined with the historical net capacity factors (NCF) calculated from the generation and installed capacity values for each technology segment and each year of the 2017-2023 period. Table 6 shows the projected generation values (in GWh/a) for each year. It can be seen that the bulk of the new generation by 2026 (some 78%) will come from combined-cycle gas turbine (CCGT) plants, thereby continuing with, and deepening the long-lasting trend of the Mexican power sector to rely mostly on CCGT for its expansion. Renewables will only account for some 18% of all new generation, which is below the already low bar of the 2023 generation level, where renewables (large-scale & distributed generation) accounted for some 24% of all generation; see Figure 2.
Evidently, power plants are not dispatched based on fixed NCF values, so adjustments have to be made to match the available new generation with the projected demand growth and also accounting for interannual variations of hydro generation. These re-dispatch rules were described in section 4.3 (f) above. The balance for the three hydro scenarios is shown in Table 7. The low hydro scenario is based on the minimum value of the 7-year period (2017-2023) which occurred in 2023 (see Figure 1); the highest scenario uses the hydro production for 2022, whereas the last scenario is based on the average hydro production of the period. It can be seen that a significant amount of surplus generation exists in all but one of the study cases (low hydro scenario for 2024).
After setting conventional steam (CS), coal generation, single-cycle gas turbines (SCGT), and internal combustion engines (ICE) to the minimum levels of the 2017-2023 period, the remaining required adjustments for CCGT and variable renewable energy (VRE) generation, i.e., wind & solar, are relatively small. However, even in this scenario and assuming the 50/50 curtailment sharing strategy between CCGT and VRE described in section 4.3 (f), the equivalent of about a fourth of the additional generation provided by the new VRE plants would have to be curtailed in 2025. In the high and medium hydro scenarios, respectively, the required VRE curtailment would be about 150% and 100% of the additional available VRE generation, respectively, for 2025.
The results of the modeling can be seen in Figure 9, where the historical and projected generation from fossil fuels (left graph) and renewables and nuclear (right graph) have been shown. The generation from fossil fuels can be seen to increase to some 290 TWh/a for the average hydro case and to nearly 300 TWh/a for the case of low hydroelectric generation, up from the recent minimum of about 235 TWh/a in 2021. This amounts to an increase of some 28% in five years. Generation from renewables, on the other hand, can be seen to remained stalled around 75 TWh/a, corresponding to some 25.8% of all electricity generation. If the contribution from nuclear is added, the clean energy fraction increases to 26.6%. This number includes distributed solar, but excludes the additional items of distributed biomass, fuel-free fossil energy, and efficiency gains from cooling incoming air in gas turbines, reported by the BNE and shown in Table 3.
Figure 10 shows how the projected generation figures translate into GHG emissions in the near future. From the left graph it is conspicuous that total GHG emissions from the power sector have been steadily on the rise since the pandemic-induced minimum around 2020/2021, climbing from around 145 Mton/a of CO2 equivalents for 2020/2021 to about 190 Mton/a of CO2, eq in 2026, corresponding to an increase of about 31%. It should be noted that the uncertainty associated with generation from hydro only adds a relatively small margin of error to this projected emission figure. This increase in absolute emission figures is also reflected in the per-unit emissions of the power system as a whole, which are predicted to increase from their 2020/2021 minimum of about 0.45 kg CO2, eq per kWhe of electricity to some 0.51 kg CO2, eq per kWhe, corresponding to an increase of about 10% in GHG emission intensity.
These emission numbers have to be contrasted with the projected evolution of clean energy fractions. If only large-scale renewables and nuclear are considered, the clean energy fraction for the 2024-2026 period will hover around 23%, down from some 27.5% in 2021; see Figure 2. The inclusion of distributed solar brings the clean energy fraction to about 25%. If the non-conventional items mentioned in the National Energy Balance (BNE) are included, i.e., distributed biomass, cogeneration, fuel-free fossil energy, and clean energy associated with auxiliary cooling of intake air in fossil fuel power plants, then the clean energy fraction increases to about 27-28%, which is still a far cry from the 35% official target for 2024.
Regarding the role of the clean energy fraction as a predictor of GHG emissions, it is conspicuous from Figure 10 that for the 2017-2020/2021 period GHG emissions fall when the clean energy fraction rises, making the clean energy fraction a good predictor of GHG emissions. This anti-correlation is, however, lost during the 2024-2026, particularly after the introduction of additional clean energy items in 2023 with the publication of disposition A/018/2023. Even this change in accounting practices, however, does not allow aligning the evolution of the clean energy figures with the official goals derived from the Energy Transition Law.
5. Summary and conclusions
The Mexican power system had become cleaner in recent years, mostly because of the large-scale integration of wind and solar. The displacement of coal by natural gas also contributed to this reduction, though to a much smaller degree. However, this general trend has now been reversed, with greenhouse gas (GHG) emissions predicted to rise some 30% from their minimum value of about 145 Mton CO2,eq/a in 2020/2021 to about 190 Mton CO2,eq/a in 2026. This is also reflected in the emission factor for the Mexican power system, which is predicted to rise from some 0.45 kg CO2,eq/kWhe to about 0.5 kg CO2,eq/kWhe.
This trend can be readily explained by the following observations: (1) The large-scale development of wind and solar power plants has been curbed significantly, with the cumulative capacity curves following logistic curves converging towards about 8 GW of capacity for both wind and solar (for a combined installation of about 16 GW). Therefore, large-scale wind and solar combined will not be able to account for more than about 18% of the total installed capacity of roughly 90 GW of the Mexican power system. This necessarily confines large-scale wind and solar to a niche existence, rather than being the main driver of new capacity additions, like in the U.S. [34], Europe [35], or China [36], where 90% or more of all new capacity now corresponds to wind and solar. (2) Distributed solar has seen less limitations up to recently; however, the cumulative installation curve can now be seen to have passed its inflection point, with the cumulative installation curve trending towards an ultimately achievable capacity of about 4500 MW. Though this number is not negligible, a trend similar to some regions in the world, such as California [37] and Southern Australia [38], where distributed solar is the main driving force for the energy transition, can be excluded at this point. (3) New generation projects by the state utility CFE are almost entirely focused on fossil fuel-based projects, accounting for about 95% of all new generation capacity. (4) While most of CFE’s projects are based on natural gas as a fuel, their potential climate benefits, stemming almost exclusively from their ability to displace coal-fired generation, are rather limited, since coal generation is already at a very low level in Mexico, making further reductions unlikely.
As far as clean energy figures and the compliance with official government targets are concerned, it is now clear that the 35% target for 2024 and the targets for the following years will not be met in spite of changes in the calculation methodology for clean energy introduced in May of 2023 by disposition A/018/2023. Regarding the role of clean energy fractions as a predictor, it can be seen that the forecast GHG emissions for the 2024-2026 and the clean energy fractions for the same period are largely decoupled, limiting the usefulness of the concept of clean energy as a metric for keeping track of the energy transition.
Mexico is currently not on track to meeting its national and international commitments for decarbonization of the electricity sector. This appears to be the result of policies curbing private investment in the energy sector and the reluctance to invest in renewable energy on the public side. The renewed focus on natural gas fired combined cycle plants as the main driver of the expansion of the power sector deepens Mexico’s dependence on imported natural gas, fails to take advantage of the low cost of large-scale wind and solar to reduce electricity tariffs and public subsidies, and exposes Mexico’s manufacturing industry to customs barriers, e.g., through the Carbon Border Adjustment Mechanism (CBAM) of the European Union [39].
To get Mexico back on a track towards deep decarbonization of its electricity sector, a number of measures are recommended: (1) A new mechanism for the large-scale integration of wind and solar energy has to be devised. While the Electricity Industry Law (LIE) of 2014 relied heavily on competitive processes2 for the procurement of wholesale electricity for the public electricity services, this mechanism has remained suspended since 2018. In order to address the concerns of the state utility CFE that competitive processes may be unfair to the incumbent, an extensive dialogue between incoming federal government, CFE, and the private energy sector should be established to establish terms of reference which preserve an important role for CFE in (clean) generation, while providing sufficient incentives and long-term guarantees to investors. (2) The transmission sector, which has seen very few upgrades over the past 5-10 years, has to be modernized and expanded urgently. Whenever possible, large-scale transmission corridors should ensure that cheap renewable electricity can be transmitted to the large concentrations of load. Where new transmission lines are difficult to build, smart measures to increase the effective transmission capacity should be implemented, including high-performance transmission conductors which can be installed on existing lines at a fraction of the time and the cost of a new line [40], and grid-enhancing technologies, allowing to dynamically modify the flow patterns on the grid and increase the capacities of transmission corridors limited by voltage and stability considerations. Since the public funds which the state utility is willing to commit to such an endeavor are likely to be limited, a clear regulatory path to private (co-) investment should be laid out and promoted by the incoming federal government. (3) Investments in storage facilities, such as battery energy storage systems (BESS) should be facilitated by defining the corresponding regulatory framework as well as remuneration schemes which recognize the benefit of storage services and enable viable business propositions.
Funding
This research received no external funding.
Data Availability Statement
All data used in the work are contained in the tables included in the main manuscript. The underlying raw datasets are available on request from the author.
Acknowledgments
The author gratefully acknowledges support from the School of Engineering and Sciences at Tecnológico de Monterrey, as well as information provided by AMDEE and ASOLMEX.
Conflicts of Interest
The author declares no conflicts of interest.
Appendix A. Estimation of future fuel consumption data
In this work, greenhouse gas (GHG) emissions were calculated from reported fuel consumption data reported for electricity generation for the 2017-2022 period3. However, no fuel consumption data are available for 2023 and beyond. Therefore, a method had to be devised which allows for an estimation of future fuel consumption, using only reported (2023) and projected (2024-2026) electricity generation data for each technology class as an input. This is done based on technology-fuel matrix method described below.
A.1 Technology-fuel matrix
Writing for electric energy produced with technology and for the fuel equivalent of electricity , assuming a constant thermal efficiency for all fuel types used by technology , we can first relate electricity and fuels by:
where is the amount of fuel of type , is the technology-fuel matrix and is the number of fuels used in the power sector; is the dimensionless heat rate of technology class . Note that the are normalized:
with being the number of technology classes, and . The general structure of the technology-fuel matrix for the Mexican power system, shown in .
Table 1.
Technology-fuel matrix.
| Fuels | ||||
| Technology | Natural gas (NG) | Diesel (D) | Fuel oil (FO) | Coal (C) |
| Combined cycle (CC) plants | 0 | 0 | ||
| Single cycle (SC) gas turbines | 0 | 0 | ||
| Conventional steam (CS) plants | 0 | 0 | ||
| Coal power plants (CCP) | 0 | 0 | ||
| Internal combustion (IC) plants | 0 | |||
contains 11 unknowns. Equations include (a) 5 equations relating electricity productions with fuel consumption and (b) 4 normalization equations for factors , leaving us with an underdetermined system of equations. The missing equations can be made up for by providing a special treatment to the contributions from internal combustion (IC) plants, which accounted for only 1.0% of all generation in 2023 and 1.3% of all fossil-fuel generation. We first simplify the nomenclature by using the equivalences given in .
Table 2.
Simplified notation for the non-zero elements of the technology-fuel matrix.
One can now state expressions for fuel factor elements pertaining to internal combustion (IC) plants by:
where , , and the fractions of electricity generated with IC plants from Diesel (D), fuel oil (FO), and natural gas (NG), respectively. While the values of the fractions are not in the public domain, they can be estimated by the relatively capacities corresponding to each fuel type, making the simplifying assumption of constant net capacity factors, which is justified in the light of the small overall contribution of IC plants. Using the database developed in work of Miranda et al. [31] we have obtained the following estimates: , .
With , , and having been determined we observe that , since coal is only burned in coal power plants (CPP), leaving us with seven unknowns and seven equations (four technology-fuel equations and three balance equations). Three equations can be resolved explicitly and are shown below:
The two variables and are coupled through the following matrix equation:
The matrix on the left-hand side can be seen to be of rank 1, leading to the following consistency condition for the elements of the vector on the right-hand side:
which is simply the (energy conservation) requirement that the sum of all fuels burned must equal the weighted sum of electricity generated, with the weights being the inverse efficiencies. Note that (A.10) is not automatically satisfied, since the ’s and ’s are from independent data sources; see below for discussion.
As it turns out, a first estimate of can be obtained without knowing , which can be seen readily by using the second of the two equations (A.9):
Note that , , , and are constrained by equation (A.10); however, the following conclusions are largely independent of this constraint. We note that ; e.g., for 2022 , depending on the source, whereas . The summand between brackets is slightly negative ( for 2022), but of the order of 1. Given that all values are constrained by 0 and 1, and the high slope of the linear relationship in equation (A.9), is necessarily confined to a very small interval, i.e.,
Given that the interval is very small, we can choose to use the central value as our predictor:
By the same reasoning, cannot be determined from the set of equations above, and additional information is required. In order to determine an estimator we observe that Diesel fuel use in combined-cycle plants in Mexico is mostly confined to the Yucatán peninsula, where natural gas is not available in sufficient quantities, due to the limitations of the Mayakan natural gas pipeline4. Assuming all gas is used in the three combined-cycle plants fed by the pipeline, with a combined firm capacity of about , and the plants are operated at a net capacity factor , then can be estimated as
where the minimum function accounts for Diesel fuel consumed in internal combustion plants and is the annual flow of natural gas over the Mayakan pipeline. I have assumed NCF to be close to the national average of combined-cycle plants by setting .
The remaining unknown and , can be calculated from the following balance equations:
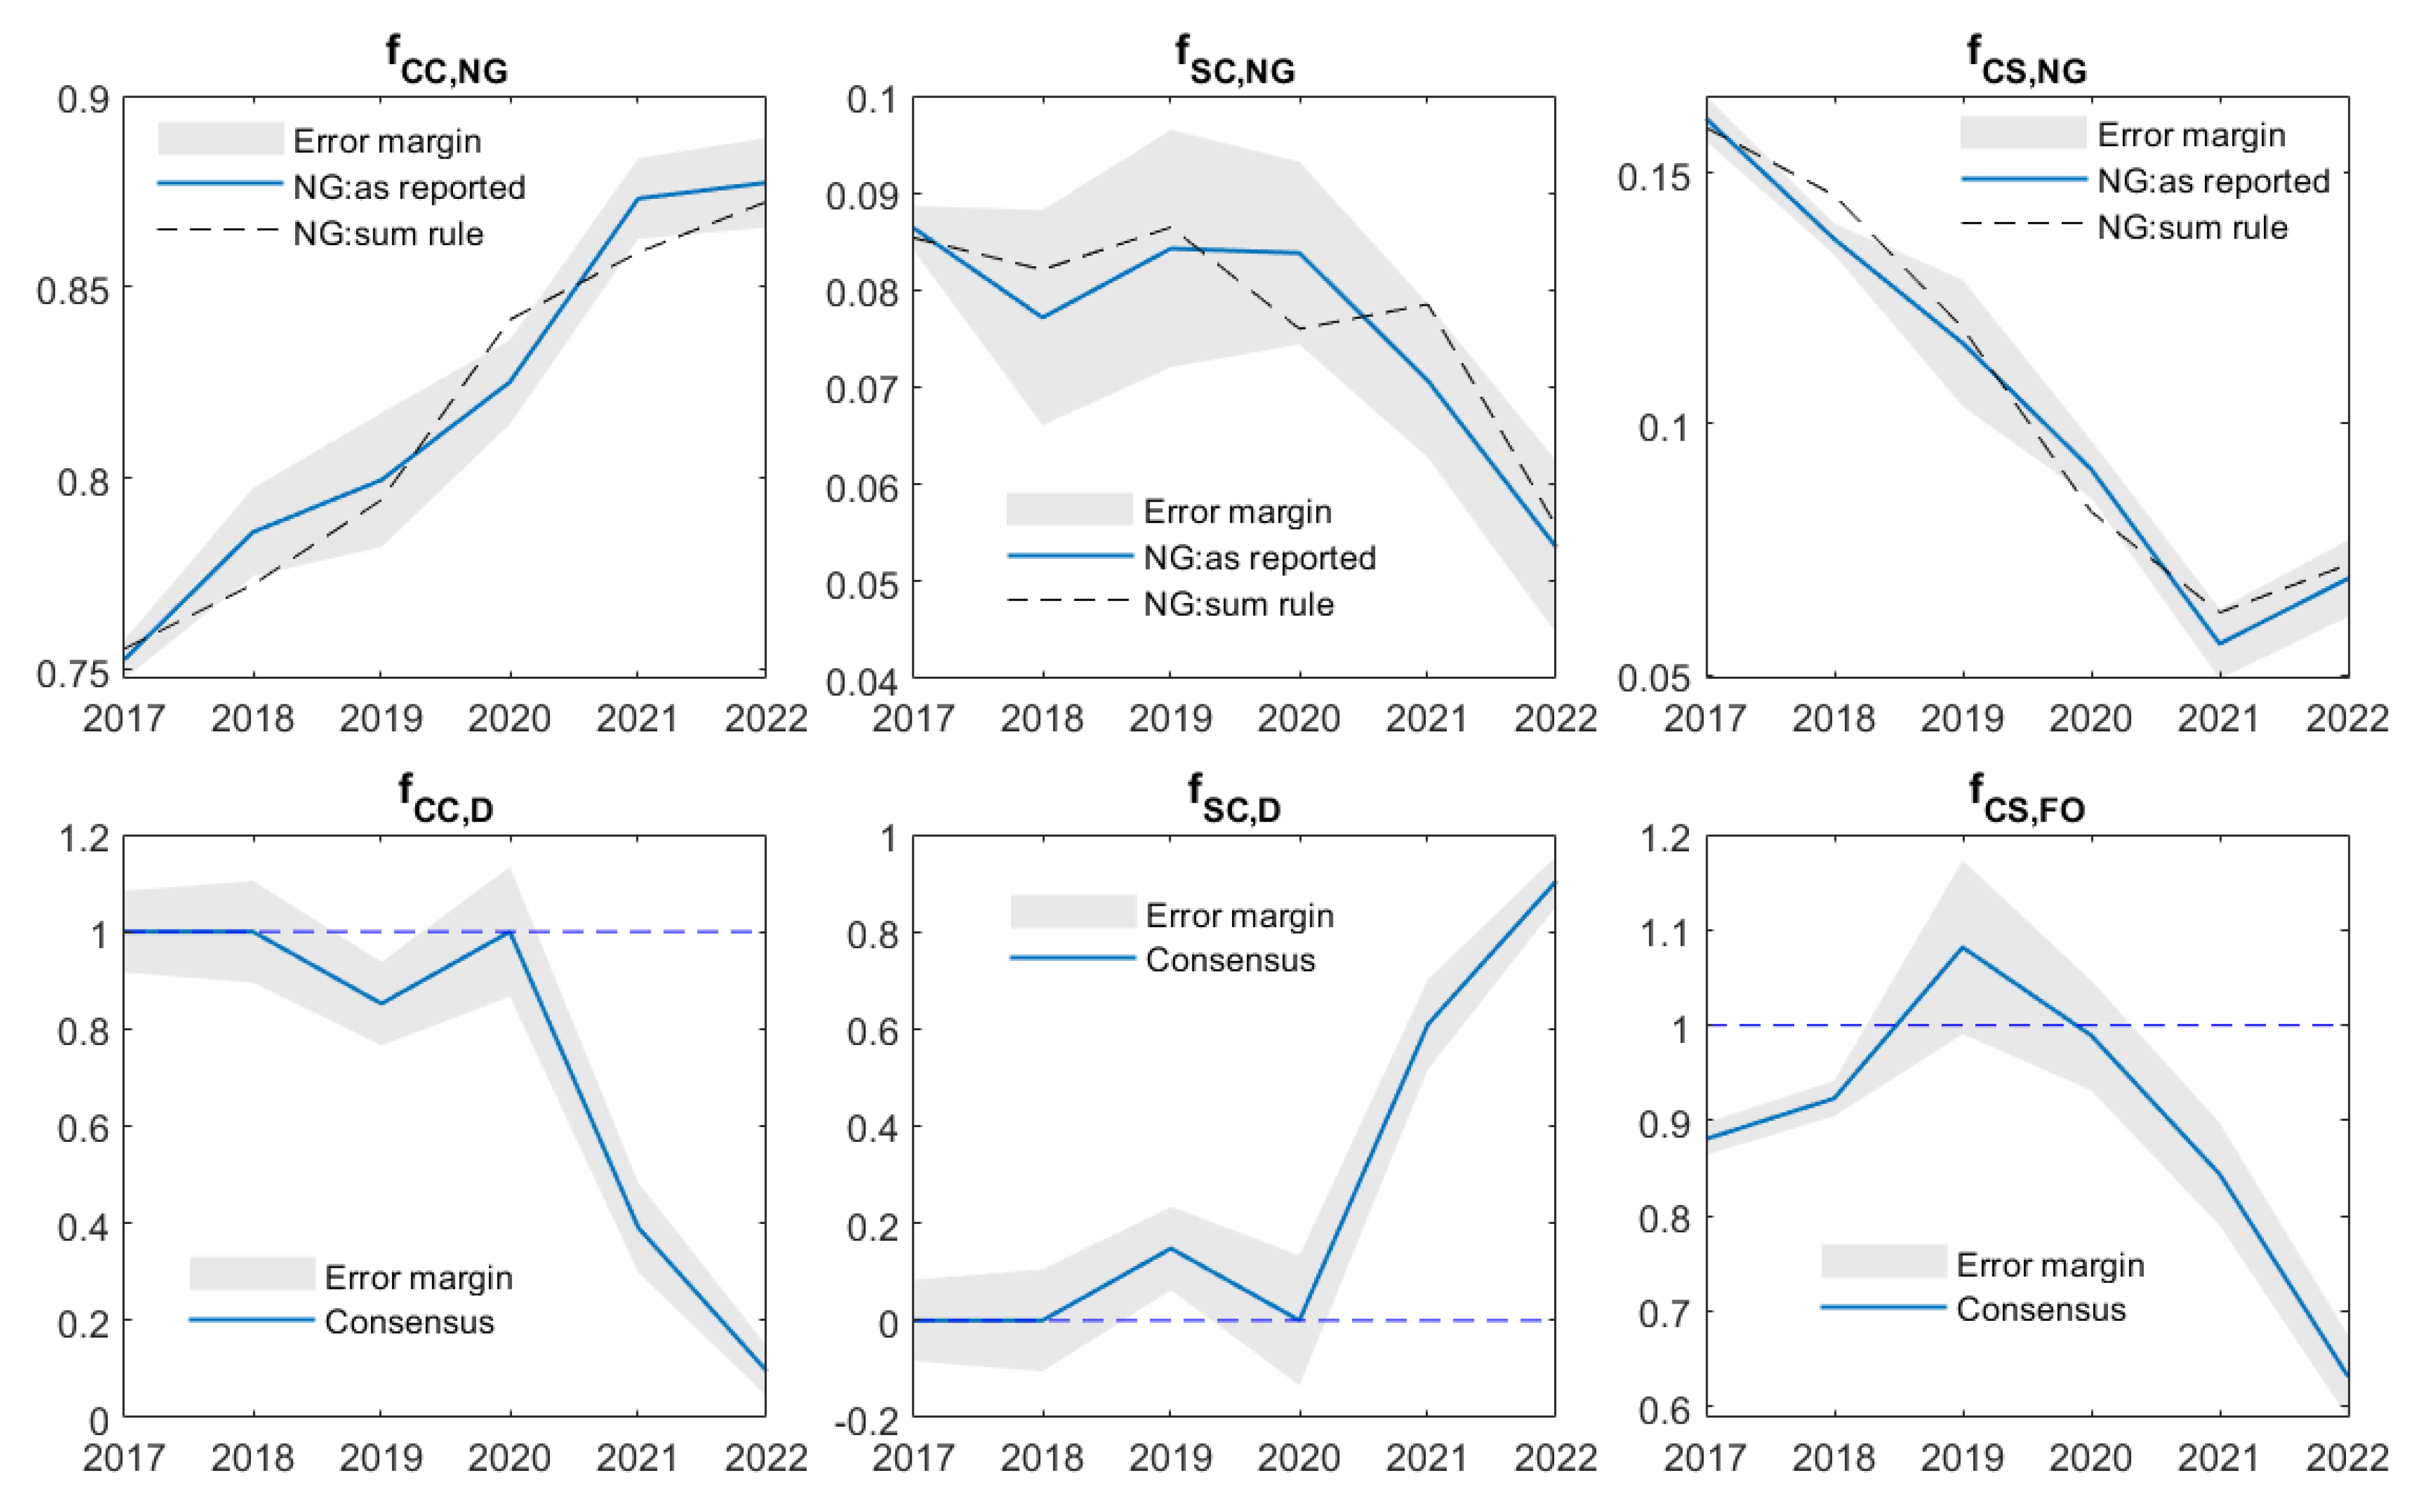
The results of the calculations described above are exhibited for six selected variables are shown in Figure A.1, illustrating how different fuel types are used among the technology classes over time. The error bounds shown were calculated with the methodology described in section A.2. The fraction of natural gas (NG) used in combined-cycle (CC) plants can be seen to rise steadily over the years, accounting for about 87% of all natural gas burned in the power sector in 2022, with a corresponding decline in natural gas used in conventional steam (CS) plants. The fraction of natural gas used in single-cycle (SC) gas turbines remains below ten percent for all years and also declined in recent years. In interesting case is the case of fuel oil in coal power plants (CPP), first reported anecdotally by (Barnés de Castro, 2021) , the consumption of which rose from a value consistent with zero in 2019 to nearly 40% in 2022, with a corresponding decline in conventional steam5 (CS) plants, the other outlet for fuel oil in the Mexican power sector.
Figure A1.
Main elements of the fuel-technology matrix for the period 2017-2022 determined with the methodology described in the annex. The error margin corresponds to ± one standard deviation. = fraction of total natural gas (NG) consumption burned in combined-cycle (CC) plants. = fraction of total natural gas (NG) consumption burned in single-cycle (SC) gas turbines. = fraction of total natural gas (NG) consumption burned in conventional steam (CS) gas turbines. = fraction of total Diesel (D) consumption burned in combined-cycle (CC) plants. = fraction of total fuel oil (FO) consumption burned in conventional steam (CS) plants. = fraction of total fuel oil (FO) consumption burned in coal power plants (CPP) plants. Sum-rule values were calculated from and average efficiency values for each technology class . See section A.3 for further explanations. Horizontal dotted lines delimit the range of the fuel-fraction factors (). Note that all predicted values fall within the range limits within the margins of error.
A.2 Uncertainty measures
Uncertainties associated with fuel quantities have been discussed in section 4 and are mostly associated with not fully consistent information among different sources. In order to account for the relatively small number of sources the following heuristic approach has been implemented: (1) Maximum and minimum fuel consumption values have been interpreted as P99 and P01 values, respectively, of the underlying distribution. (2) The distribution of the reported values around the true value is assumed to be normal. (3) Consequently, the following approximate relationship holds: , where is the standard deviation of the distribution. (4) Variables describing different fuel types are assumed to be fully uncorrelated. Based on these assumptions, the error in variables , with the exception of , can be calculated from:
with being the number of fuels contributing to . Errors associated to the reported technology-aggregated electricity generation values were assumed to be zero. Emission factors were also considered to be fully accurate. In the case of , the uncertainty associated with the net capacity factor (NCF) was also considered:
The errors in the and the values propagate into the error measures for using a similar reasoning.
A.3 Estimation of fuel consumptions
As stated in equation (A.10), the formalism laid out in this annex relies on the consistency condition that the sum of all fuel equivalents of electricity should equal the sum of all fuels used. This condition is only approximately fulfilled by the reported fuel consumption values. Given the importance of natural gas (NG) for the Mexican power sector and the large uncertainties in the officially reported consumptions data for natural gas, particularly for the 2020-2022 period, it was decided to use a sum-rule value for alongside with the reported value. This sum rule value for each year is obtained directly from equation (A.10):
Given that this expression still depends on the technology-average efficiencies , it is important to specify how their values should be determined. In this work, the pragmatic approach was chosen to select the set of efficiencies that would minimize the global quadratic error between the reported (consensus) consumption values for and the sum rule values, i.e.:
where the sum runs over all years in the 2017-2022 period. This procedure yields a time series for the sum rule consumption values of natural gas which emulates the reported data and with even a smaller error margin than the one of the reported time series.
A.4 Estimation of fuel consumptions
After these preparations the consumption of the four major fuels consumed in the generation of electricity can be determined as follows. First, the total consumption of a given fuel is stated as the sum of consumption values from each technology class. In the case of natural gas (NG) we have the following relationship:
where , , and are the amounts of natural gas consumed in combined-cycle (CC), single-cycle (SC) gas turbine, and conventional steam (CS) plants, and , , and are the fuel equivalents of the electricity production from CC, SC, and CS plants, respectively. These fuel equivalents are either known (2023) or can be predicted with reasonable accuracy (2024-2026). Note that the structure of equation (A.19) is a direct consequence of the structure of the technology-fuel matrix (Table A.1). Continuing with the case of natural gas we can now write:
where the first part of equation is the first line of the technology-fuel equation (A.1), and is the fraction of the fuel equivalent of the CC-generated electricity which was produced with natural gas. From equation (A.20) we can immediately determine the unknown :
The remaining unknowns and can be determined in a similar way; this is left as an exercise to the reader. It is important to note that the use of equation (A.21) requires the consistency or sum-rule value for the natural gas consumption to be used, rather than the reported consumption for a given year.
Evidently, and the other free parameters require fuel consumption, fuel equivalents of electricity and technology-fuel matrix elements as inputs, which is why the last values which can be determined this way correspond to the year 2022. In order to project fuel consumption data into the future some assumptions have to be made. In this work, I am assuming that and the other parameters stay at their 2022 values6, i.e.
which is generally called the persistency hypothesis in forecasting applications. In the case of natural gas and combined-cycle plants this seems to be a very reasonable assumption, based on the reasoning used to derive (see section A.1), i.e., the fact that burning Diesel fuel in combined-cycle plants on the Yucatán peninsula is becoming increasingly unnecessary due to the increased transmission capacity of the Mayakan gas pipeline. In the case of the other parameters, other forecast approaches may be proposed, but their influence on the projected results is believed to be minor.
| 1 | This heat rate value was calculated from an energy-weighted average of plant-specific data from the PIIRCE data base mentioned above (PIIRCE, 2018) |
| 2 | Generally referred to as (reverse) auctions |
| 3 | Additionally, the consumption of natural gas was also determined through the consistency requirement ; see below for more explanations. |
| 4 | The rated capacity of the Mayakan pipeline is 250 MMcfd (or 7.1 Mm3/day), out of which 240 MMcfd (0.86 Mm3/day) are tagged for power generation. Actual injection levels are much lower; the annual averages for 2019 to 2022 were = 71, 102, 142, and 160 MMcfd |
| 5 | Note that the predicted fuel consumption fraction for fuel oil (FO) in conventional steam (CS) for the year 2019 is slightly higher than 100%; however, this value is consistent with 100% within the margins of error indicated in the figure. |
| 6 | Note that one cannot argue that the technology-fuel matrix elements remain at their 2022 values. (The proof is left to the reader). |
References
- IPCC. (2023). Climate Change 2023. Retrieved from AR6 Synthesis Report: https://www.ipcc.ch/report/ar6/syr.
- Cullet, P. (2010). Chapter 8: Common but Differentiated Responsibilities. En M. Fitzmaurice, D. M. Ong, & P. Merkouris, Research Handbook on Environmental Law. Cheltenham, UK: Edward Elgar Publishing. [CrossRef]
- Climate Action Tracker. (2022, December). Country profile Mexico. Retrieved March 30, 2024, from https://climateactiontracker.org/countries/mexico/.
- Buira, D. , Tovilla, J., Farbes, J., Jones, R., Haley, B., & Gastelum, D. A whole-economy Deep Decarbonization Pathway for Mexico. Energy Strategy Reviews 2021, 33, 100578. [Google Scholar] [CrossRef]
- SENER. (2016). Reporte de avance de energías limpias. Retrieved March 30, 2024, from https://www.gob.mx/cms/uploads/attachment/file/118995/Informe_Renovables_2015_2.pdf.
- Cole, W. , Antonysamy, A., Brown, P., Sergi, B., Mai, T., & Denholm, P. How much might it cost to decarbonize the power sector? It depends on the metric. Energy 2023, 276, 127608. [Google Scholar] [CrossRef]
- Kim, Y.-G. , Lim, H., & Lee, J. Decarbonizing road transport in Korea: Role of electric vehicle transition policies. Transportation Research Part D: Transport and Environment 2024, 128, 104084. [Google Scholar] [CrossRef]
- Masuku, C. M., Caulkins, R. S., & Siirola, J. J. Process decarbonization through electrification. Current Opinion in Chemical Engineering 2024, 44, 101011. [CrossRef]
- Farfan, J. , & Lohrmann, A. Gone with the clouds: Estimating the electricity and water footprint of digital data services in Europe. Energy Conversion and Management 2023, 290, 117225. [Google Scholar] [CrossRef]
- Cruz Ake, S. , Ortiz Arango, F., & García Ruiz, R. Possible paths for Mexico's electricity system in the clean energy transition. Utility Policies 2024, 87, 101716. [Google Scholar]
- CRE. (22 de February de 2011). Methodología cogeneración eficiente RES/003/2011. Resolución por la que la Comisión Reguladora de Energía expide la metodología para el cálculo de la eficiencia de los sistemas de Cogeneración Eficiente. Mexico City, Mexico: Diario Oficial de la Federación.
- CRE. (26 de September de 2012). Metodología acreditación sistemas de cogeneración eficiente RES/291/2012. Resolución por la que la Comisión Reguladora de Energía expide las disposiciones generales para acreditar sistemas de cogeneración eficiente. Mexico City, Mexico: Diario Oficial de la Federación.
- CRE. (12 de June de 2014). Actualización metodología cogeneración eficiente RES/206/2014. RESOLUCIÓN por la que se modifica la diversa por el que se emitió la metodología para el cálculo de la eficiencia de los sistemas de cogeneración eficiente. Mexico City, Mexico: Diario Oficial de la Federación.
- CRE. (22 de December de 2016). Metodología porcentaje de energía libre RES/1838/2016. RESOLUCIÓN de la Comisión Reguladora de Energía por la que se expiden las Disposiciones administrativas de carácter general que contienen los criterios de eficiencia y establecen la metodología de cálculo para determinar el porcentaje de energía libre de. Mexico City, Mexico: Diario Oficial de la Federación.
- Presidencia. (11 de August de 2014). Ley de la Industria Eléctrica. DECRETO por el que se expiden la Ley de la Industria Eléctrica, la Ley de Energía Geotérmica y se adicionan y reforman diversas disposiciones de la Ley de Aguas Nacionales. Mexico City, Mexico: Diario Oficial de la Federación.
- Llamas, A. , & Probst, O. On the role of efficient cogeneration for meeting Mexico's clean energy goals. Energy Policy 2018, 112, 173–183. [Google Scholar] [CrossRef]
- CRE. (26 de May de 2023). Acuerdo A/018/2023 Energía libre de combustible. ACUERDO Núm. A/018/2023 de la Comisión Reguladora de Energía por el que se actualizan los valores de referencia de las metodologías para el cálculo de la eficiencia de los sistemas de cogeneración de energía eléctrica y los criterios para determinar la CE. Mexico City, Mexico: Diario Oficial de la Federación.
- SENER. (2022). Balance National de Energía 2022. Retrieved from https://base.energia.gob.mx/BNE/BalanceNacionalDeEnerg%C3%ADa2022.pdf.
- SENER. (29 de May de 2023). Programa de Desarrollo del Sector Eléctrico 2023-2037. Reporte de avance de energías limpias. Mexico City. Obtenido de https://base.energia.gob.mx/PRODESEN2023/Anexo3.pdf.
- INECC. (2022). Inventario nacional de emisiones y compuestos de efecto invernadero 2020-2021. Retrieved from https://www.gob.mx/cms/uploads/attachment/file/853373/10-2023_INEGyCEI_2020_2021.xlsx.
- SEMARNAT. (2020). Registro nacional de emisiones 2015-2018. Retrieved from https://www.gob.mx/cms/uploads/attachment/file/776803/informe_rene_emisiones_2015-2018.pdf.
- SENER. (n.d.). Balance Nacional de Energía. Retrieved from https://www.gob.mx/sener/es/articulos/balance-nacional-de-energia-296106.
- Energy Institute. (2023). Statistical Review of World Energy - with major processing by Our World in Data. “Share of primary energy consumption that comes from oil – Using the substitution method” [dataset]. Energy Institute, “Statistical Review of World Energy [original data].
- NREL. (2021). Life Cycle Greenhouse Gas Emissions from Electricity Generation: Update. Retrieved from https://www.nrel.gov/docs/fy21osti/80580.pdf.
- Gordon, D. , Reuland, F., Worden, J. R., Jacob, D. J., Shindell, D., & Dyson, M. Evaluating net life-cycle greenhouse gas emissions intensities. Environ. Res. Lett. 2023, 084008. [Google Scholar]
- Gibon, T. , Hahn Menacho, Á., & Guiton, M. (2022). Carbon Neutrality in the UNECE Region: Integrated Life-cycle Assessment of Electricity Sources. Geneva: UNECE.
- CFE. (2021). Plan de negocios 2021-2025. Versión pública. Retrieved from https://www.cfe.mx/finanzas/Documents/Plan%20de%20Negocios%20CFE%202021.pdf.
- CFE. (2022). Plan de negocios 2022-2026. Versión pública. Retrieved from https://www.cfe.mx/finanzas/documents/plan%20de%20negocios%202022.pdf.
- AMDEE. (2023). Status of wind projects in Mexico . Status of wind projects in Mexico . Mexico City, Mexico: Personal communication.
- ASOLMEX. (August de 2023). Inventario solar. Inventario solar. Mexico City, Mexico.
- Miranda, K. , Tarín-Santiso, A., Llamas, A., & Probst, O. The Electricity Generation Dispatch in Mexico: An Uncertain Road towards Sustainability. Energies 2022, 8831. [Google Scholar] [CrossRef]
- PIIRCE. (2018). Programa Indicativo para la Instalación y el Retiro de Centrales Eléctricas v2018. Programa Indicativo para la Instalación y el Retiro de Centrales Eléctricas v2018. Mexico City: Secretaría de Energía (SENER).
- Santillán Vera, M., García Manrique, L., Rodríguez Peña, I., & de la Vega Navarro, A. Drivers of electricity GHG emissions and the role of natural gas in mexican energy transition. 2023, 173, 113316. [Google Scholar] [CrossRef]
- Lenoir, T. (2023, August 28). US Interconnection Queues Analysis 2023. S&P Global Market Intelligence. Retrieved from https://www.spglobal.com/marketintelligence/en/news-insights/research/us-interconnection-queues-analysis-2023.
- Brown , S., & Jones, D. (2024). European Electricity Review 2024. Ember. Obtenido de https://ember-climate.org/insights/research/european-electricity-review-2024/#supporting-material.
- IRENA. (n.d.). Renewable capacity statistics 2023. Retrieved from https://www.irena.org/Publications/2023/Mar/Renewable-capacity-statistics-2023.
- California Distributed Generation Statistics. (2024, January 31). Retrieved March 31, 2024, from https://www.californiadgstats.ca.gov/.
- SA Power Network. (s.f.). Distributed Energy Transition Road Map 2020-2025. Retrieved from https://www.sapowernetworks.com.au/public/download.jsp?id=319084.
- The European Comission. (2024). Carbon Border Adjustment Mechanism. Recuperado el 31 de March de 2024, de https://taxation-customs.ec.europa.eu/carbon-border-adjustment-mechanism_en.
- Chojkiewicz, E., Paliwal, U., Abhyankar, N., Baker, C., O'Connell, R., Callaway, D., & Phadke, A. (2024, February). Accelerating Transmission Expansion by Using Advanced Conductors in Existing Right-of-Way. Retrieved from https://haas.berkeley.edu/wp-content/uploads/WP343.pdf.
Figure 1.
Generation from renewables and nuclear (left graph) and fossil fuels (right graph), based on technology-aggregated hourly data reported by CENACE for the Mexican power system (SEN) and the 2017-2023 period. These numbers do not include distributed generation from solar and biomass; see Table 3 for that information.
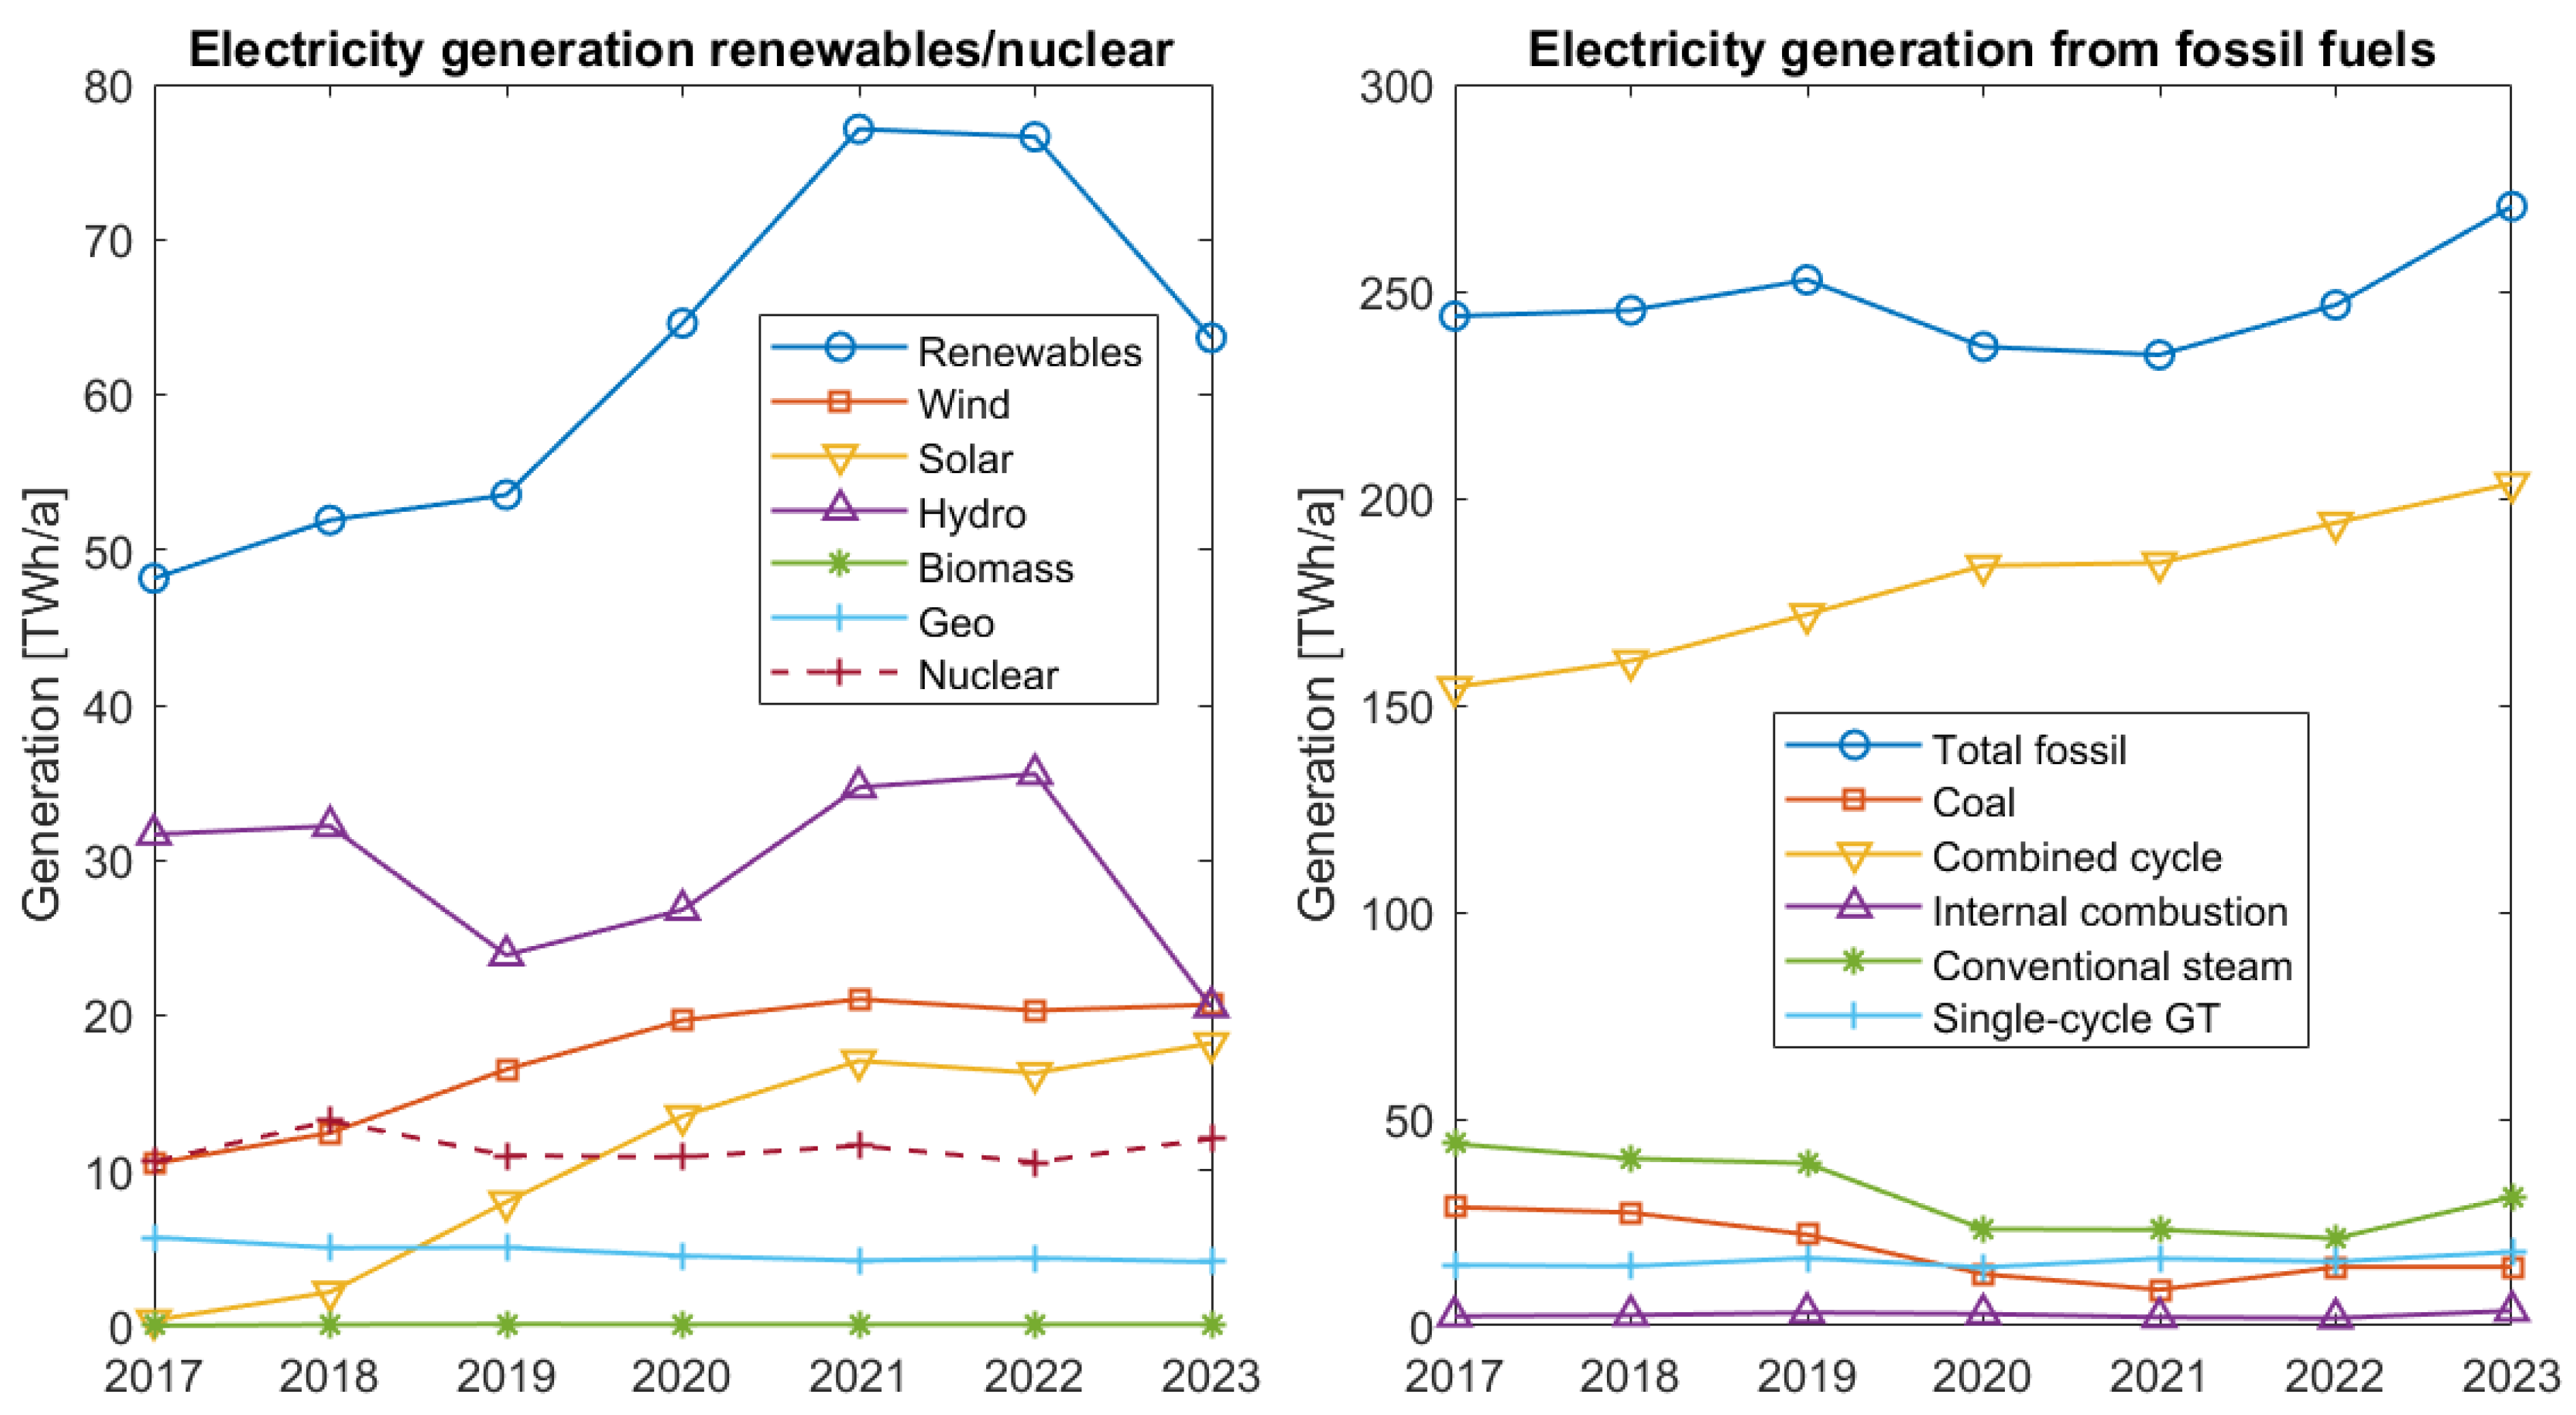
Figure 2.
Left) Clean electricity generation in Mexico for the 2018-2022 period as reported by the authorities and regrouped into broad categories. Large-scale renewables and nuclear are reported on an hourly basis by CENACE; the other categories are only reported as annual figures (through the National Energy Balance (BNE)). (b) Fossil and clean energy fractions. Clean fossil energy is defined in the regulatory document A/018/2023, which also defined new criteria for efficient cogeneration.
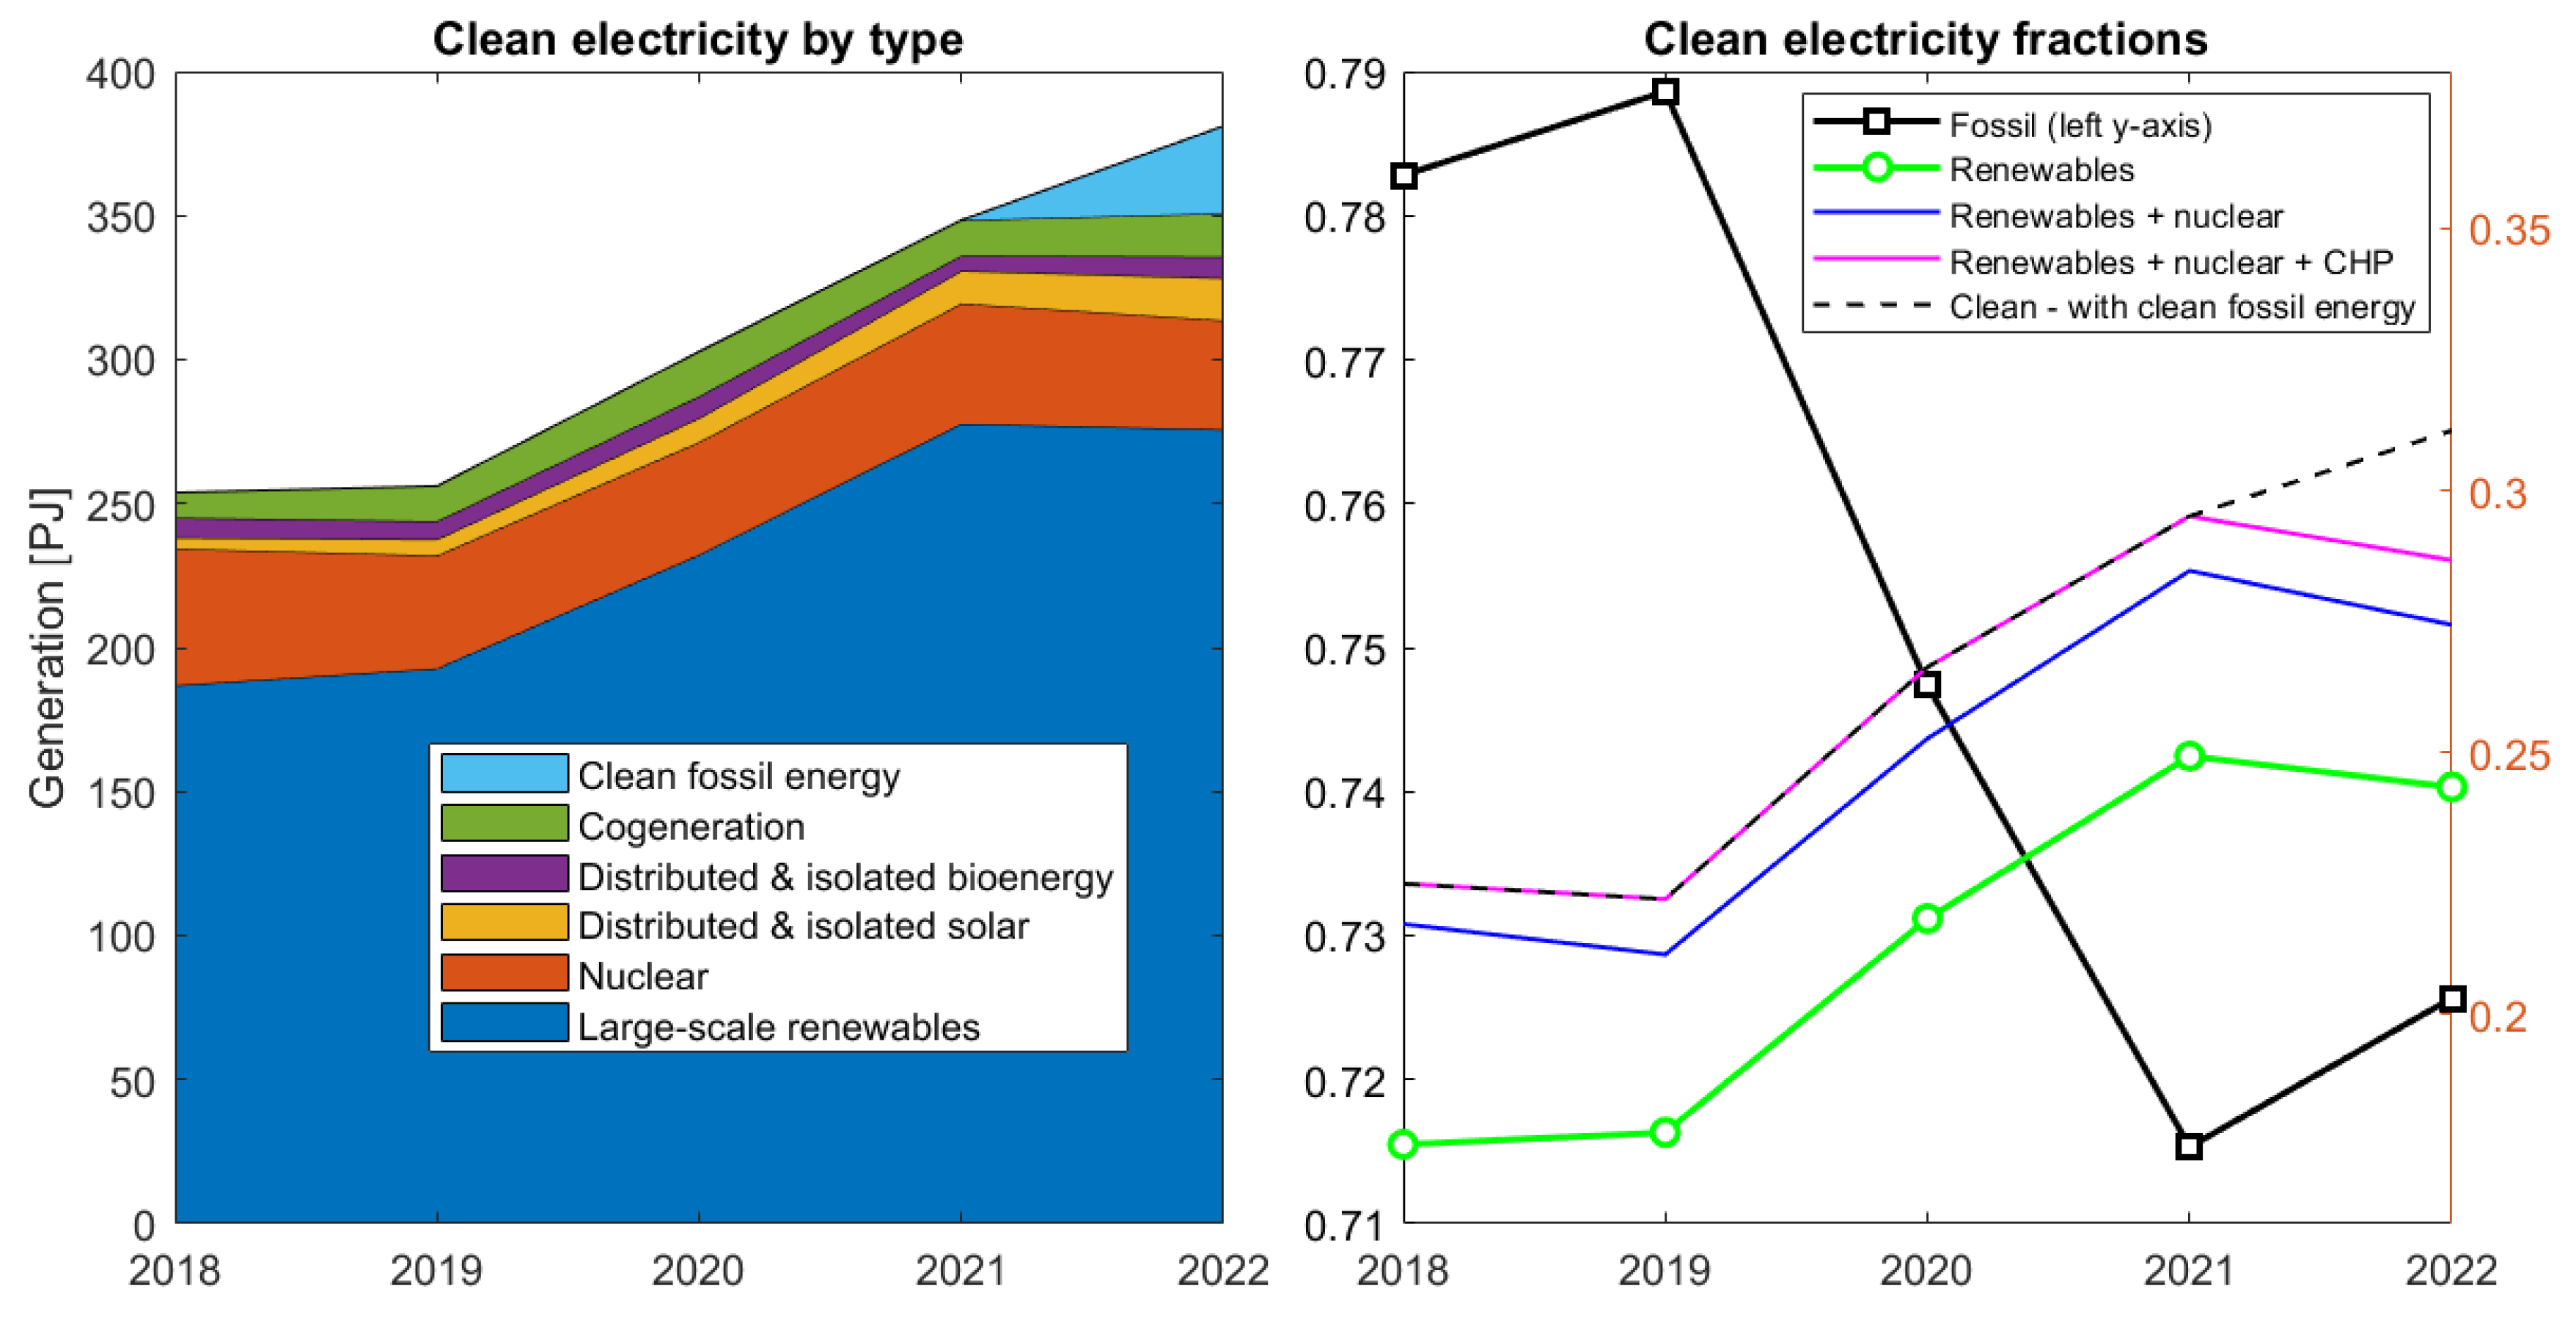
Figure 3.
Consolidated fuel consumption time series for the 2014-2022 for the four main fuels used in electricity generation in the Mexican power system. Continuous lines indicate the proposed consensus values, whereas the grey areas indicate the max/min error range. In the case of natural gas an additional fuel consumption curve was included based on the sum rule and average efficiency values for each technology class . See section A.3 in Appendix A for further explanations.
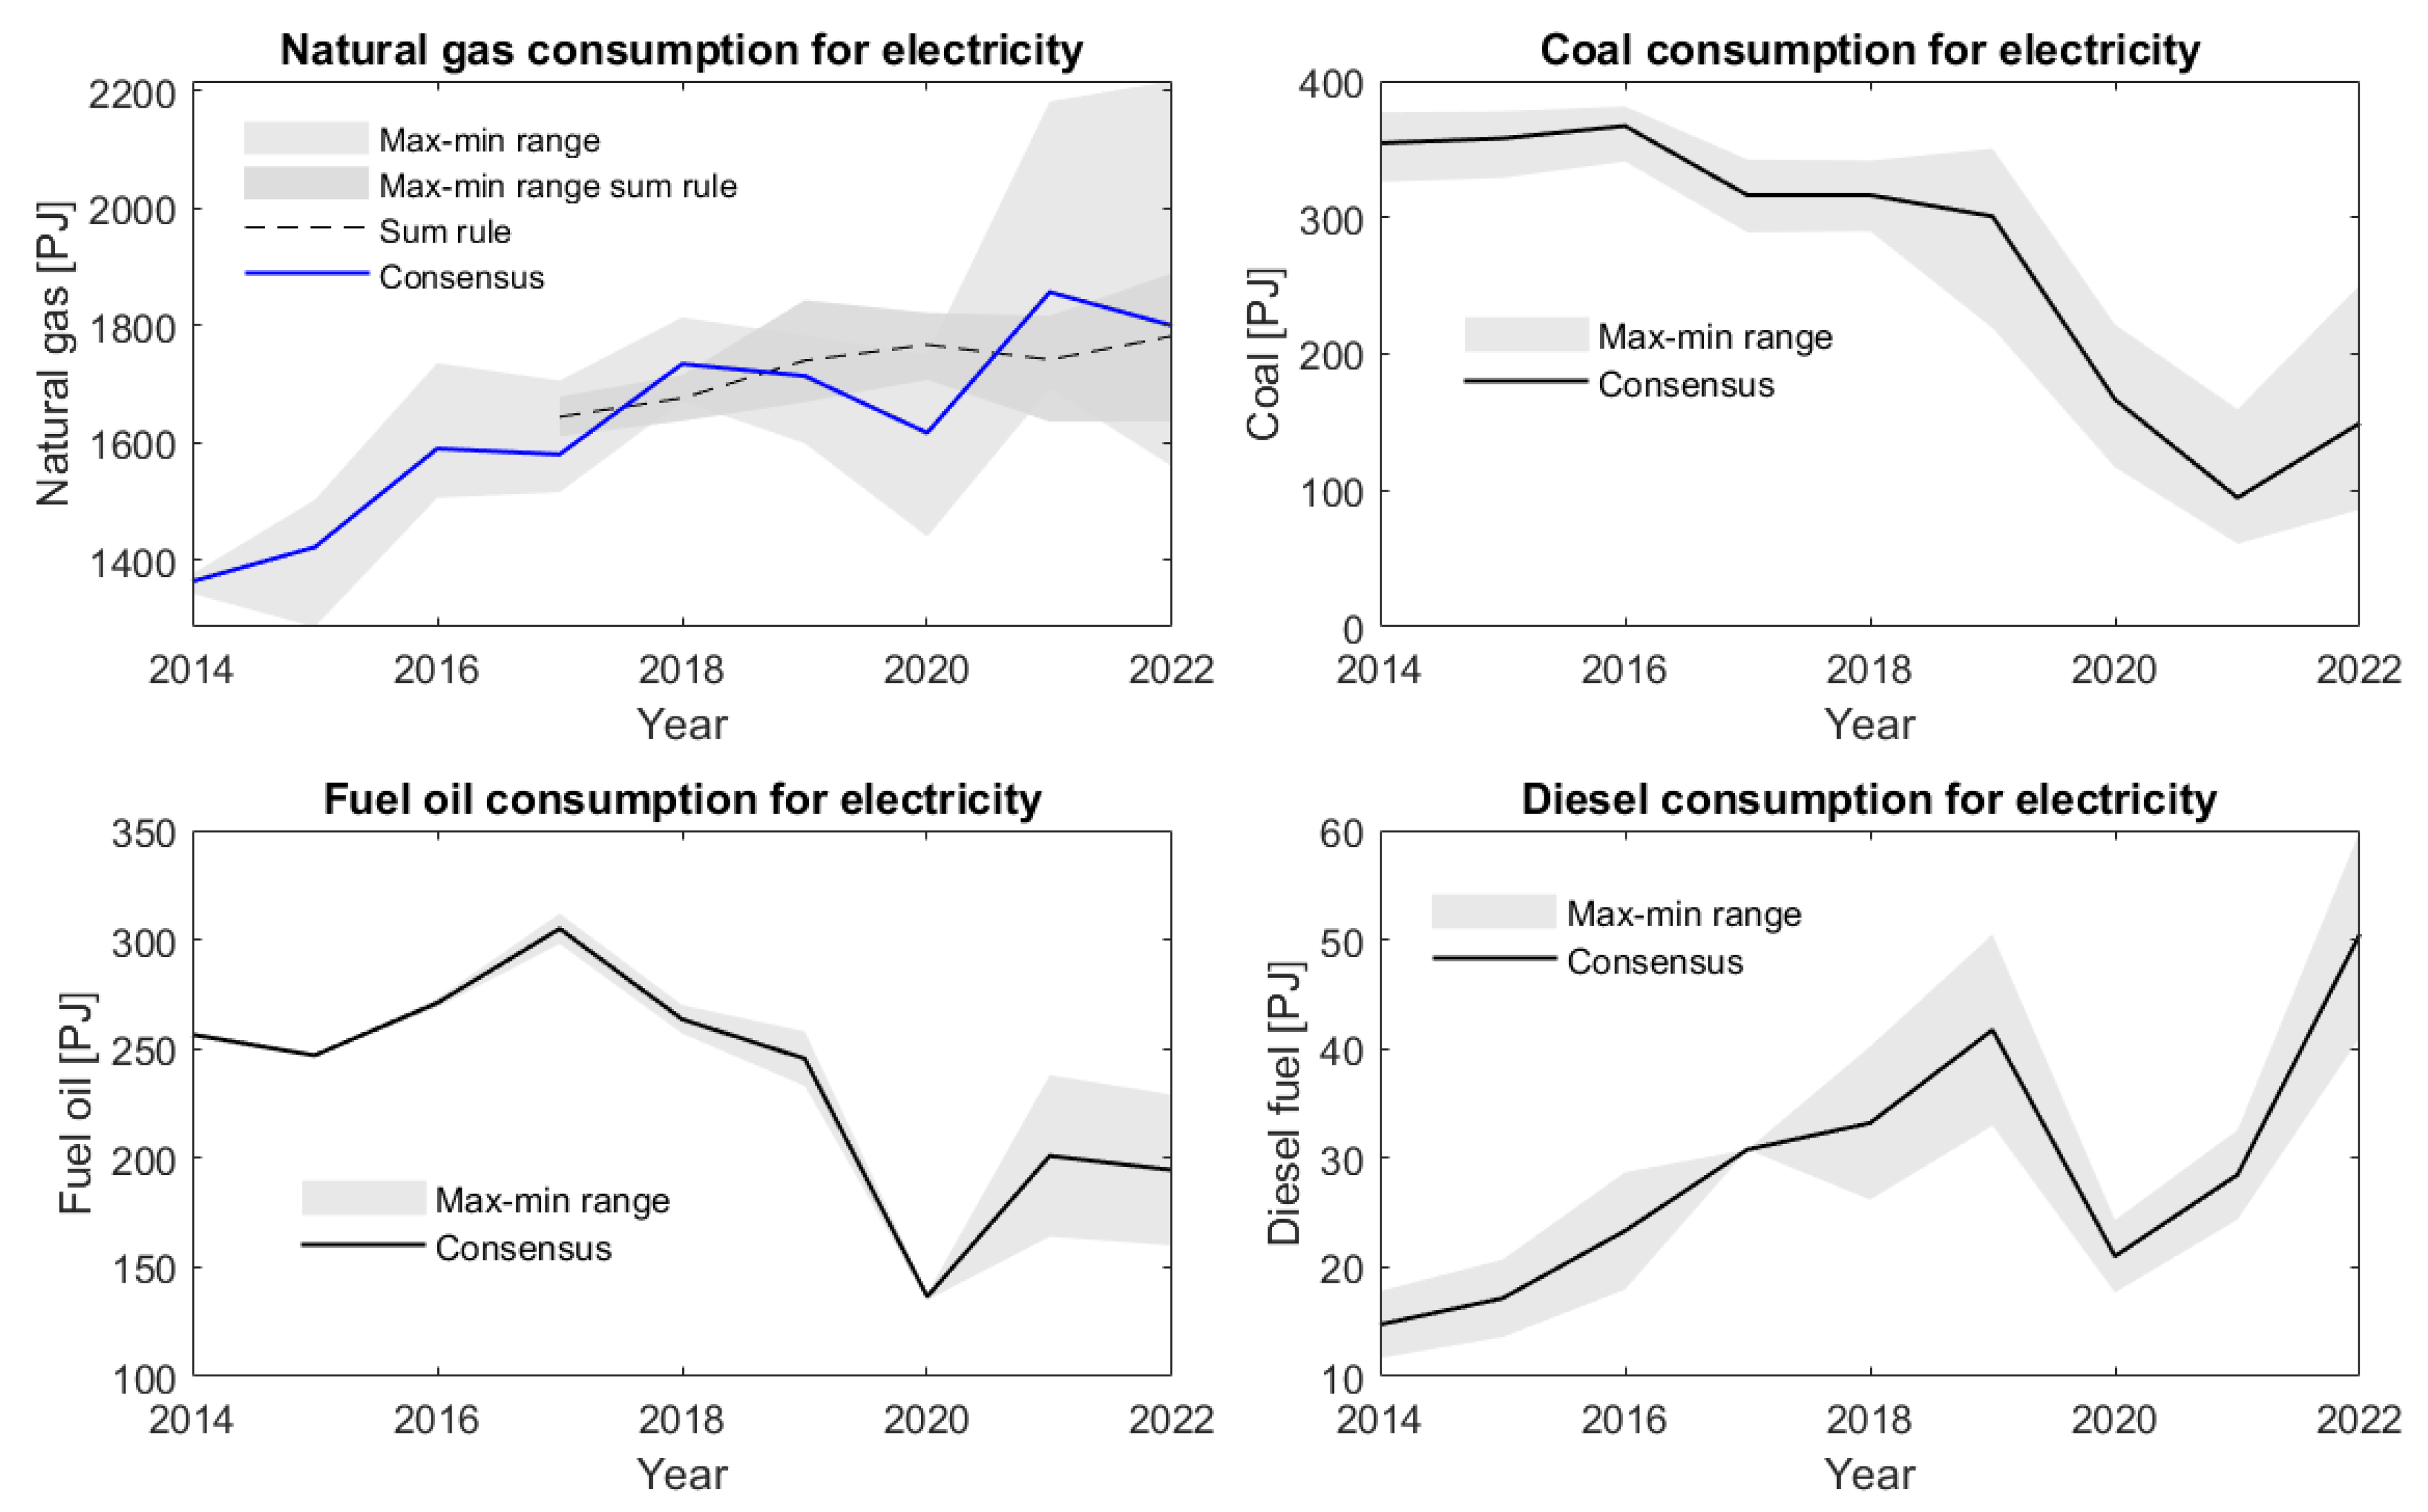
Figure 4.
Left: Cumulative installed wind power capacity in Mexico for the period 2008-2025; values for 2023-2025 have been estimated; see text for details. A logistic fit has been added, based on 3-year moving averages. Right: Annual additions of wind power capacity and their 3-year moving averages. Based on data provided by the Mexican Wind Energy Association [29].
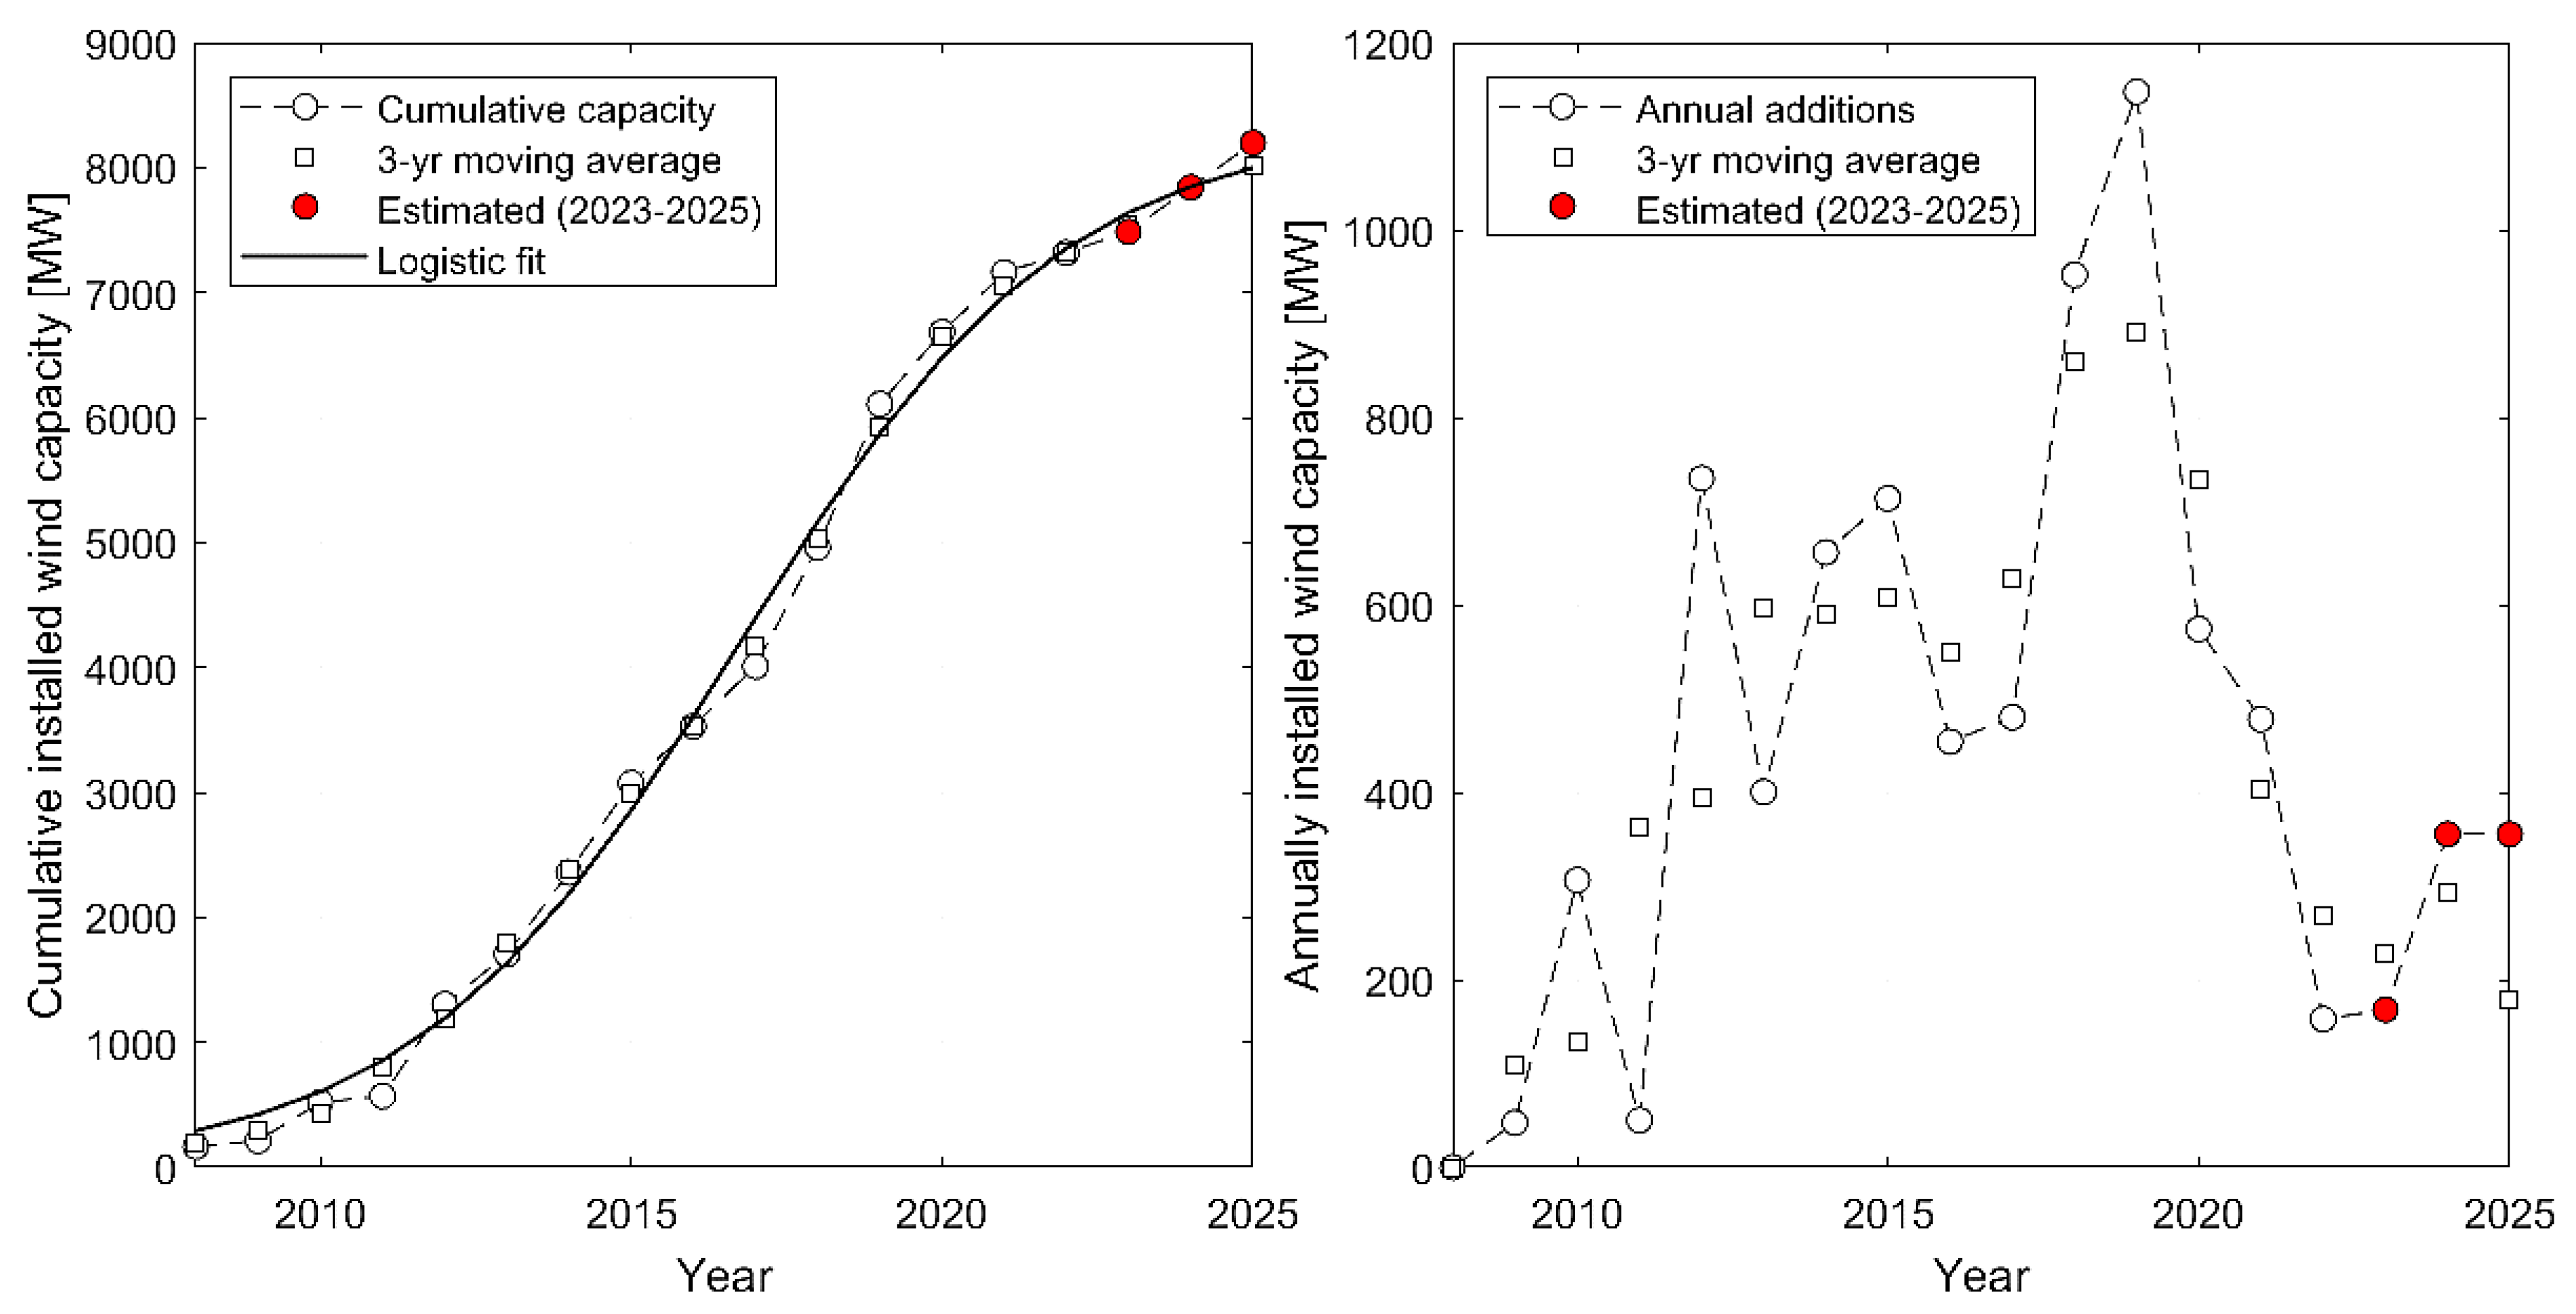
Figure 6.
Left: Cumulative installed distributed solar PV power capacity in Mexico for the period 2008-2025; the value for 2023 has been estimated; see text for details. Both a logistic and an exponential fit have been added. Right: Annual additions of distributed solar PV power capacity. Based on data from the Mexican Solar Energy Association [30].
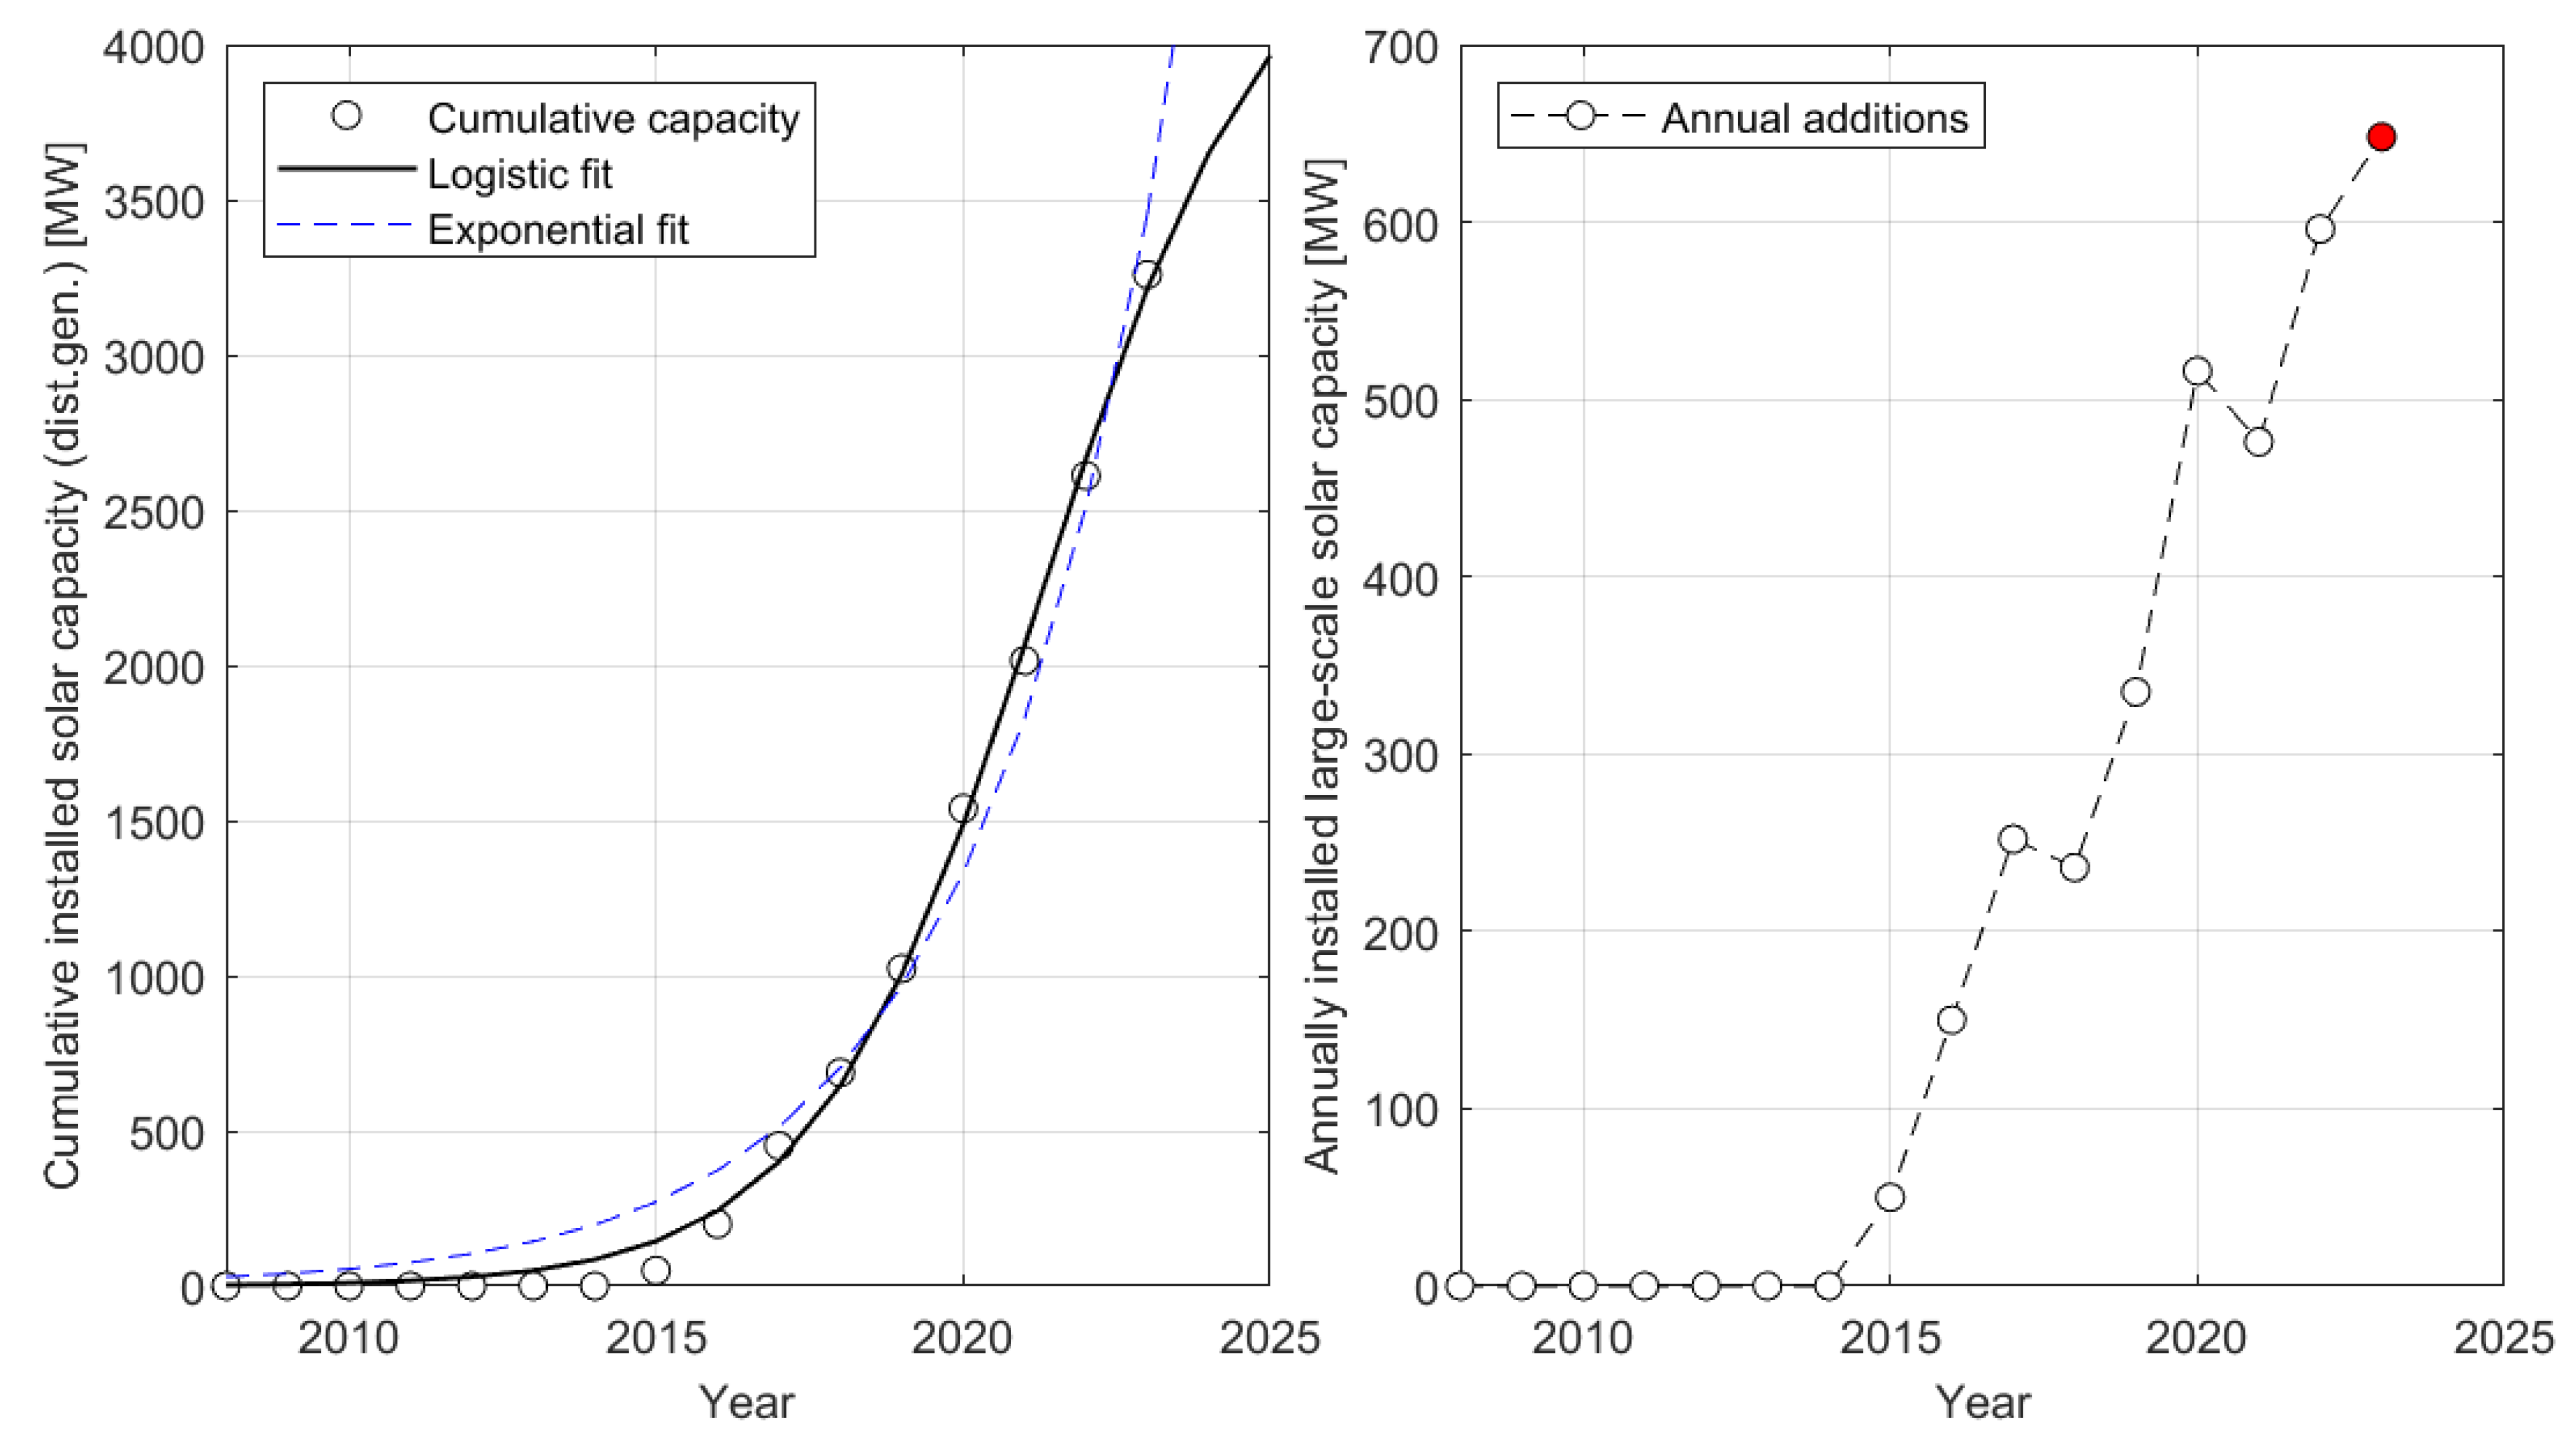
Figure 7.
Left: Life-cycle CO2, eq emissions from fossil fuels for the Mexican power system (SEN) by fuel types, based on the reported fuel consumption values for electricity consumption. Right: Life-cycle emissions of CO2, eq from renewable and nuclear energy. In the case of natural gas an additional emission curve was included based on the sum rule , where are the average efficiency values for each technology class . See section A.3 in Appendix A for further explanations.
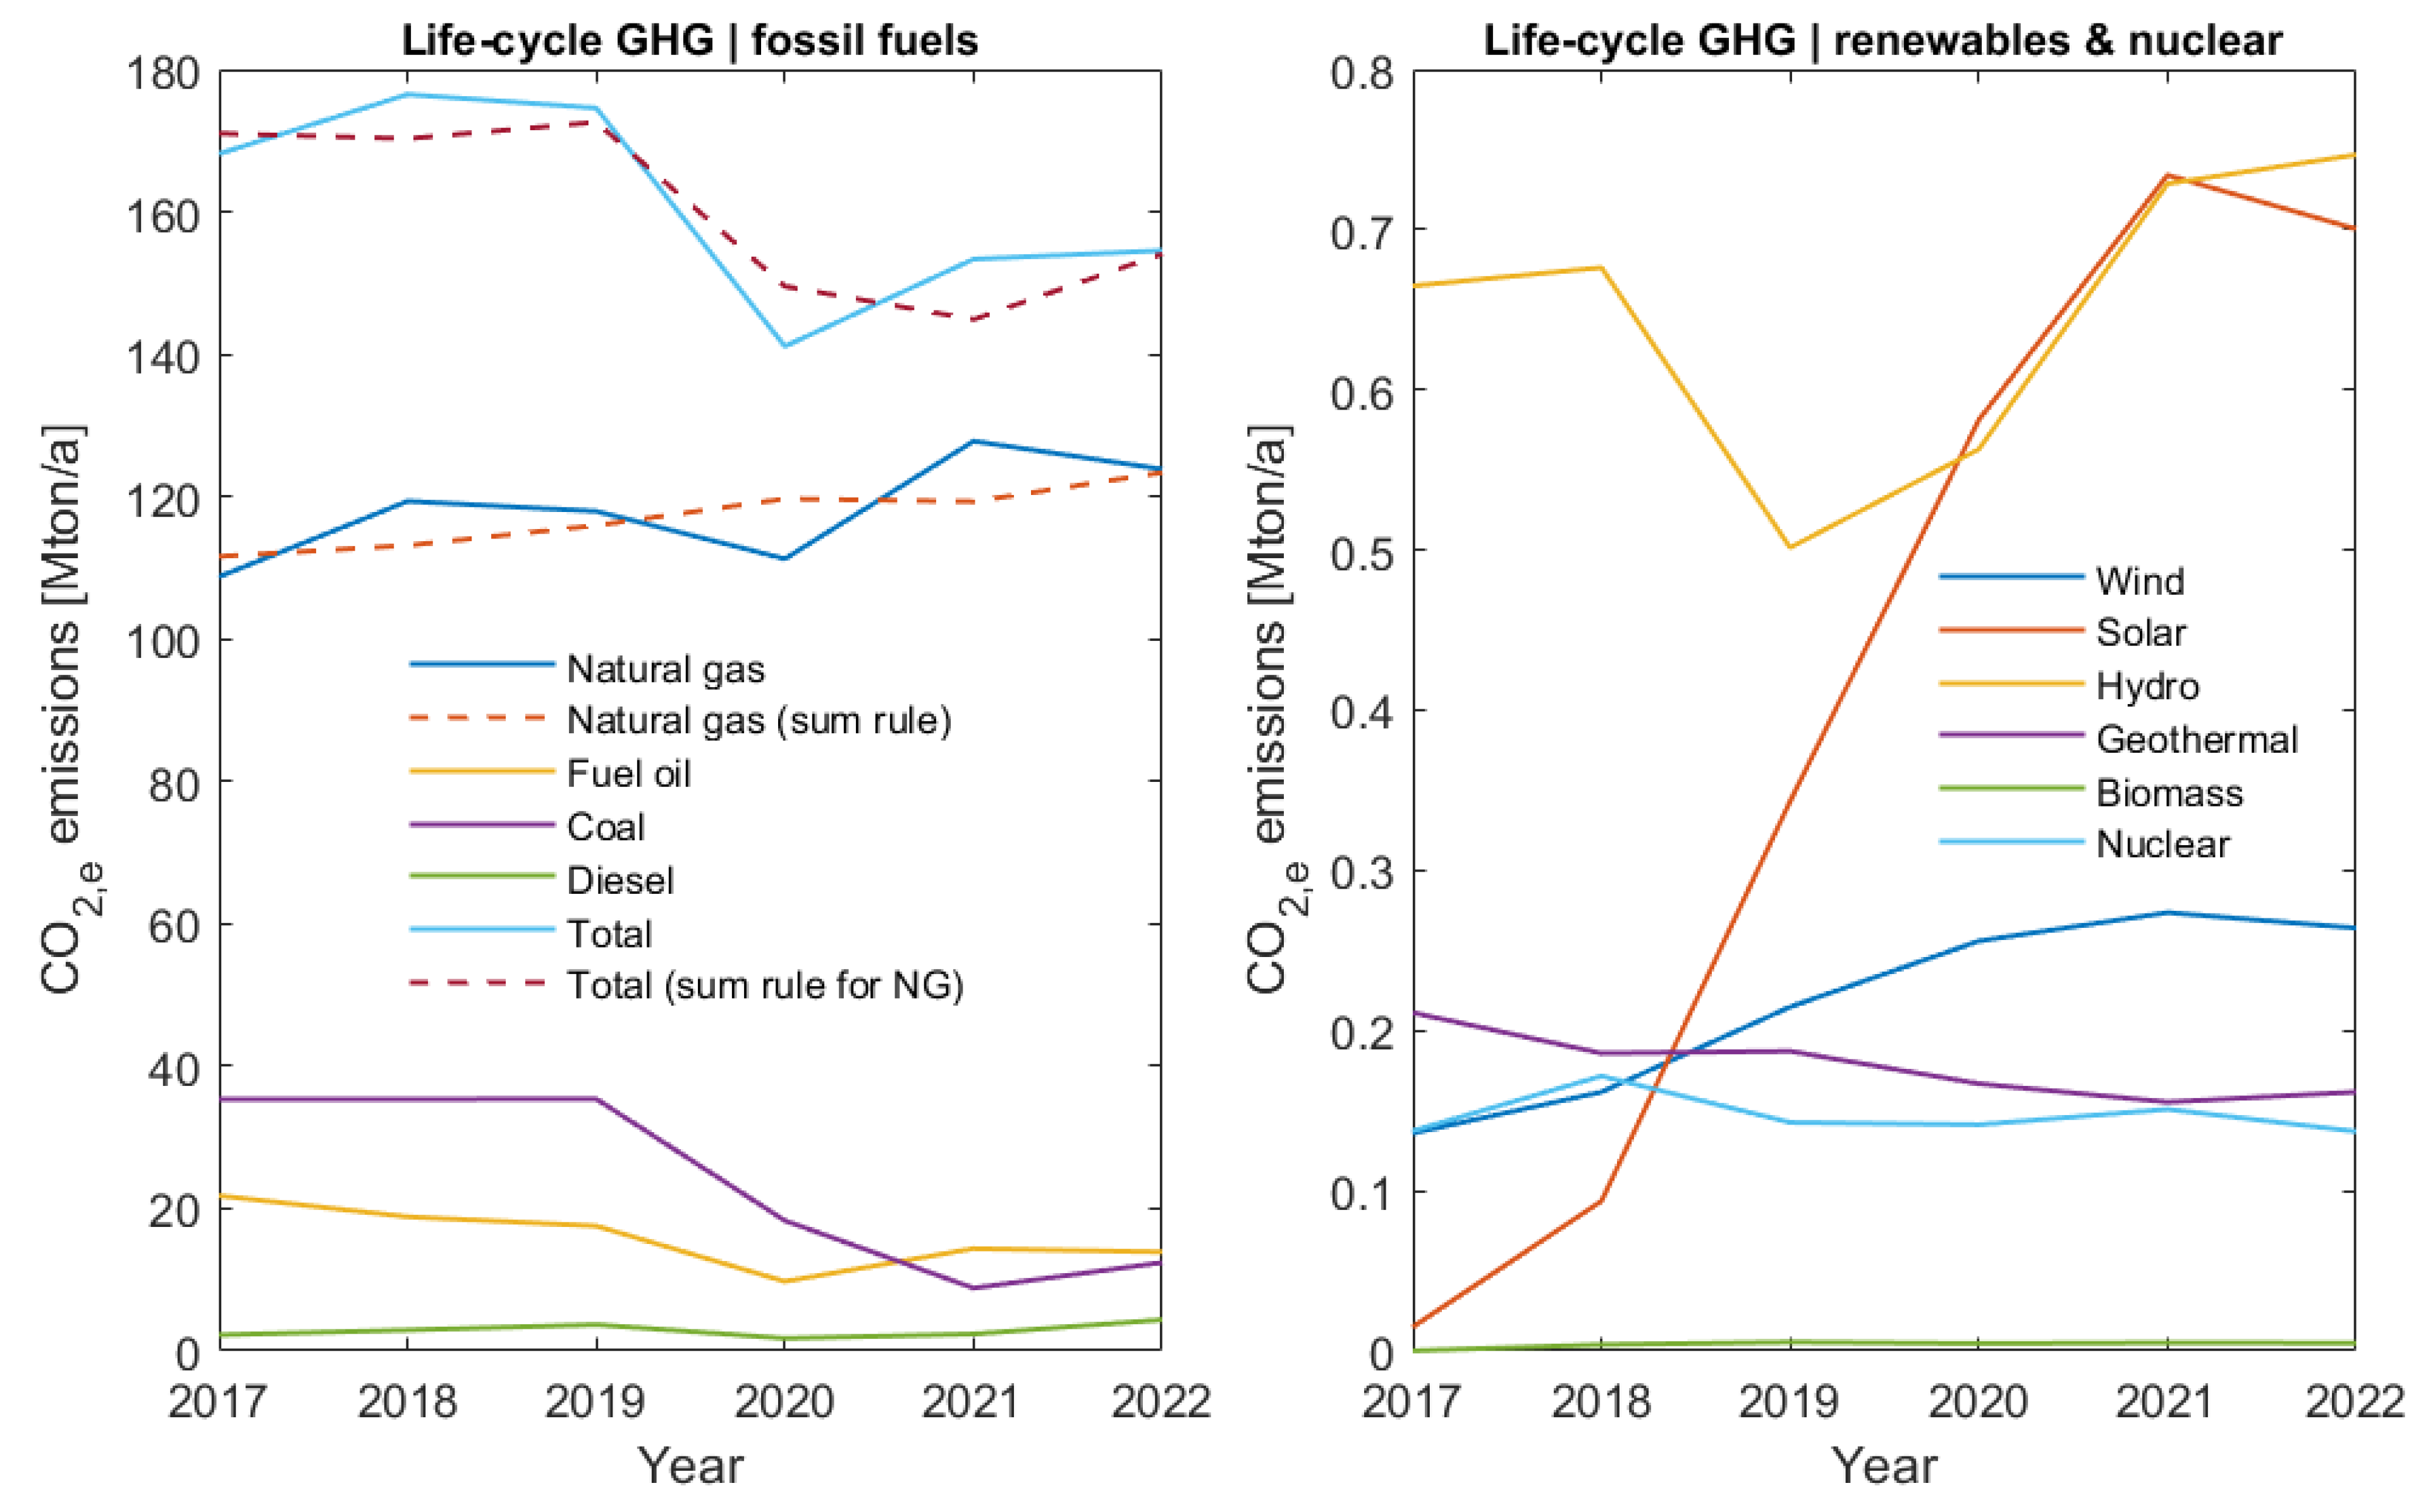
Figure 8.
Emission factors of the Mexican power system determined in this work and their comparison with the official numbers published by the Secretary of the Environment (SEMARNAT). See section A.3 in Appendix A for an explanation of the sum rule value for natural gas consumption.
Figure 8.
Emission factors of the Mexican power system determined in this work and their comparison with the official numbers published by the Secretary of the Environment (SEMARNAT). See section A.3 in Appendix A for an explanation of the sum rule value for natural gas consumption.
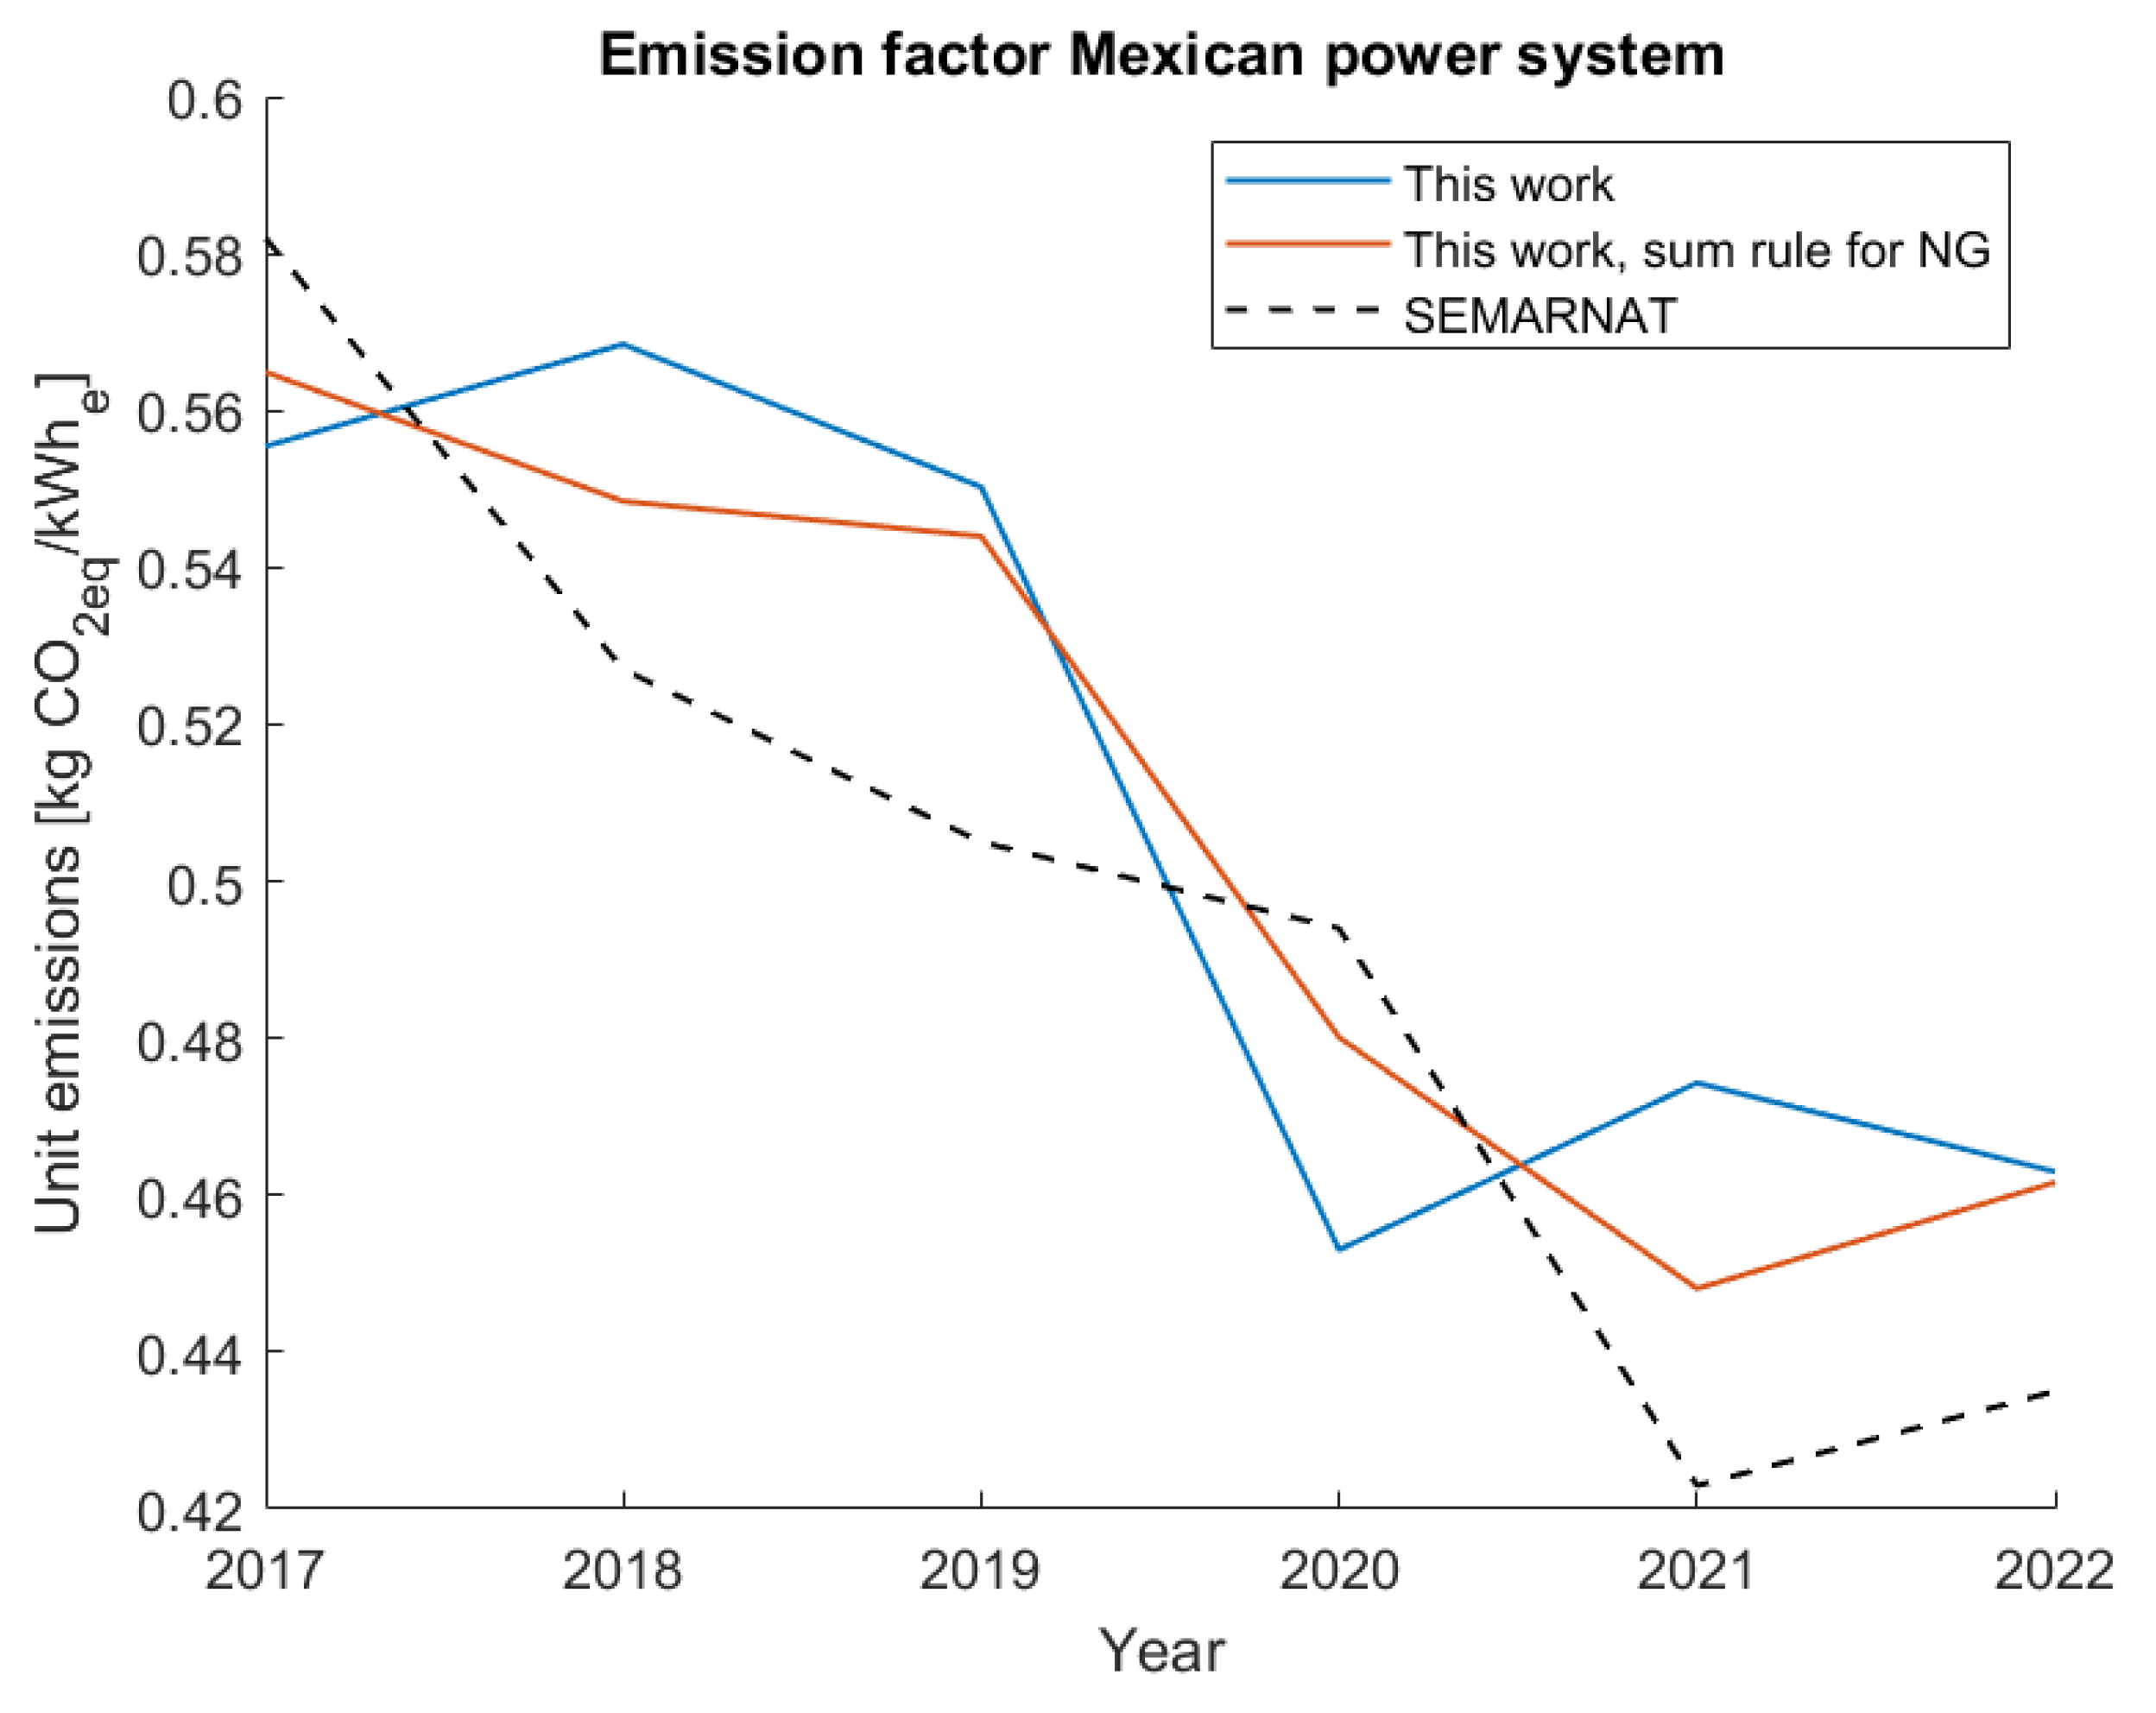
Figure 9.
Historical and projected electricity generation from fossil fuels (left) and renewables, including distributed solar, and nuclear (right) for the 2017-2026 period.
Figure 9.
Historical and projected electricity generation from fossil fuels (left) and renewables, including distributed solar, and nuclear (right) for the 2017-2026 period.
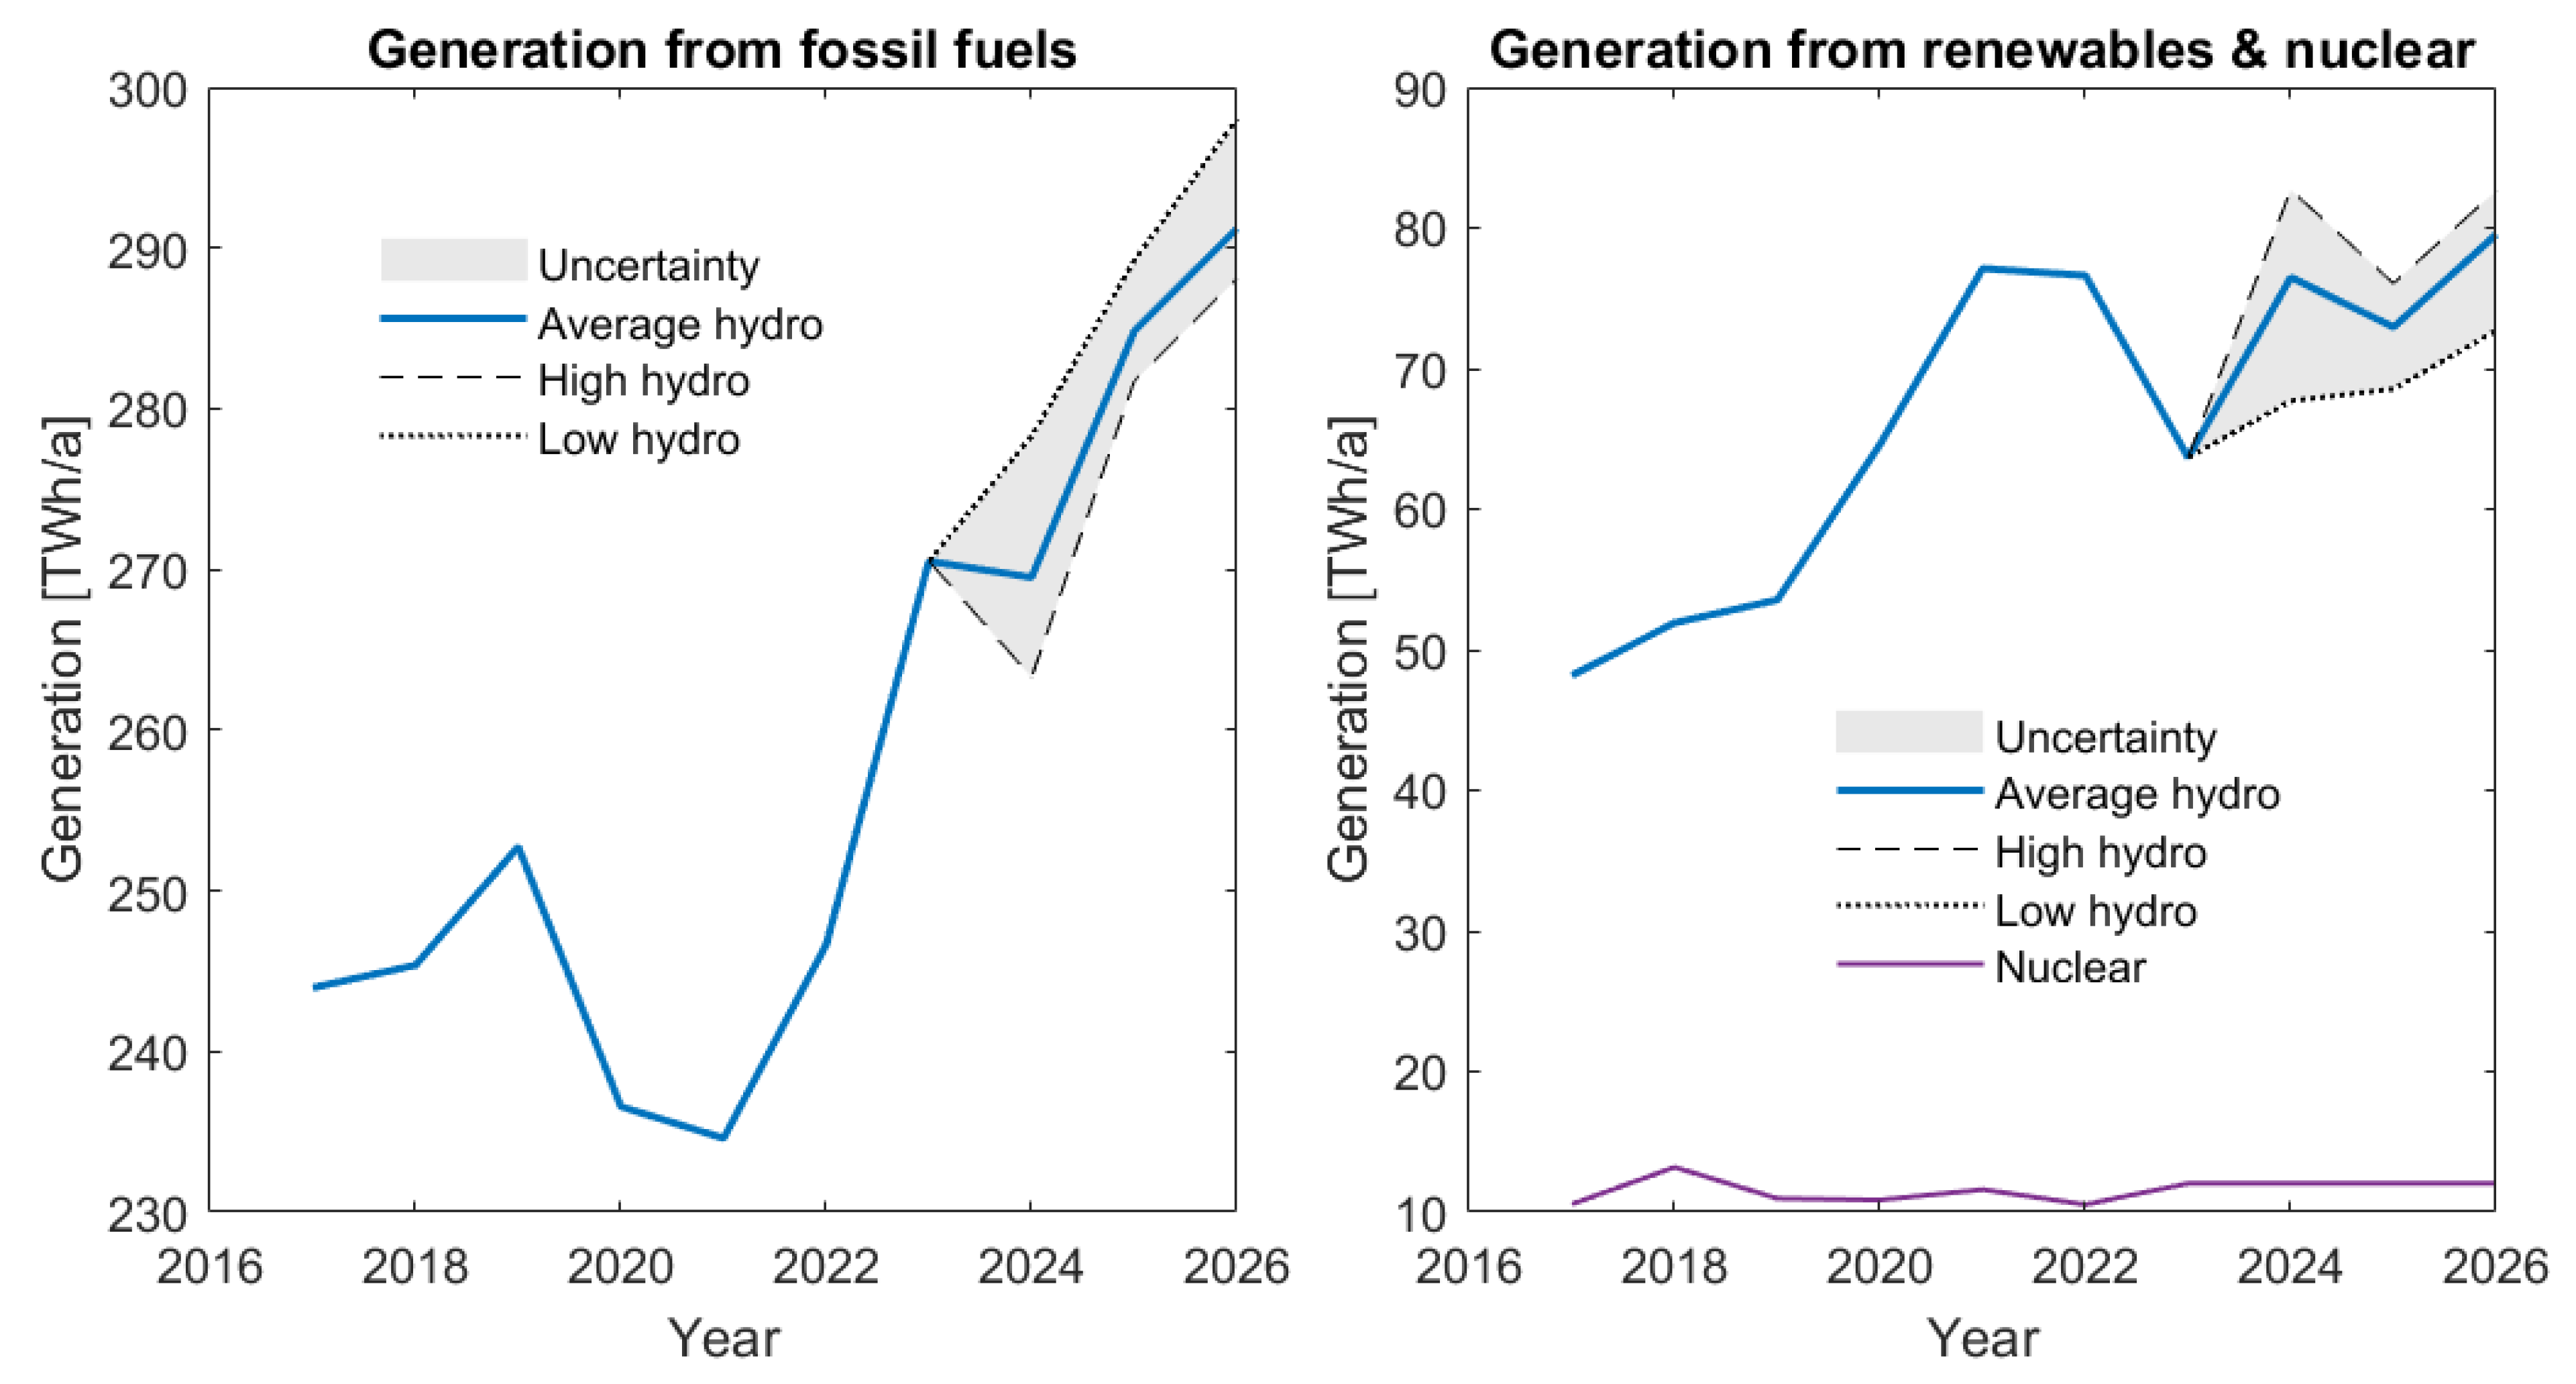
Figure 10.
Historical and projected GHG emissions (left) and clean energy fractions (right) for the 2017-2026 period. The average hydro scenario has been considered in the right graph, except for the curve identifying large-scale (LS) renewables and nuclear, for which the low-high hydro range has been indicated as well. Clean energy additions from items fuel-free fossil energy and auxiliary cooling for 2022 onwards have their regulatory standing in the disposition A/018/2023. Distributed biomass is only mentioned in recent reports of the National Energy Balance (BNE).
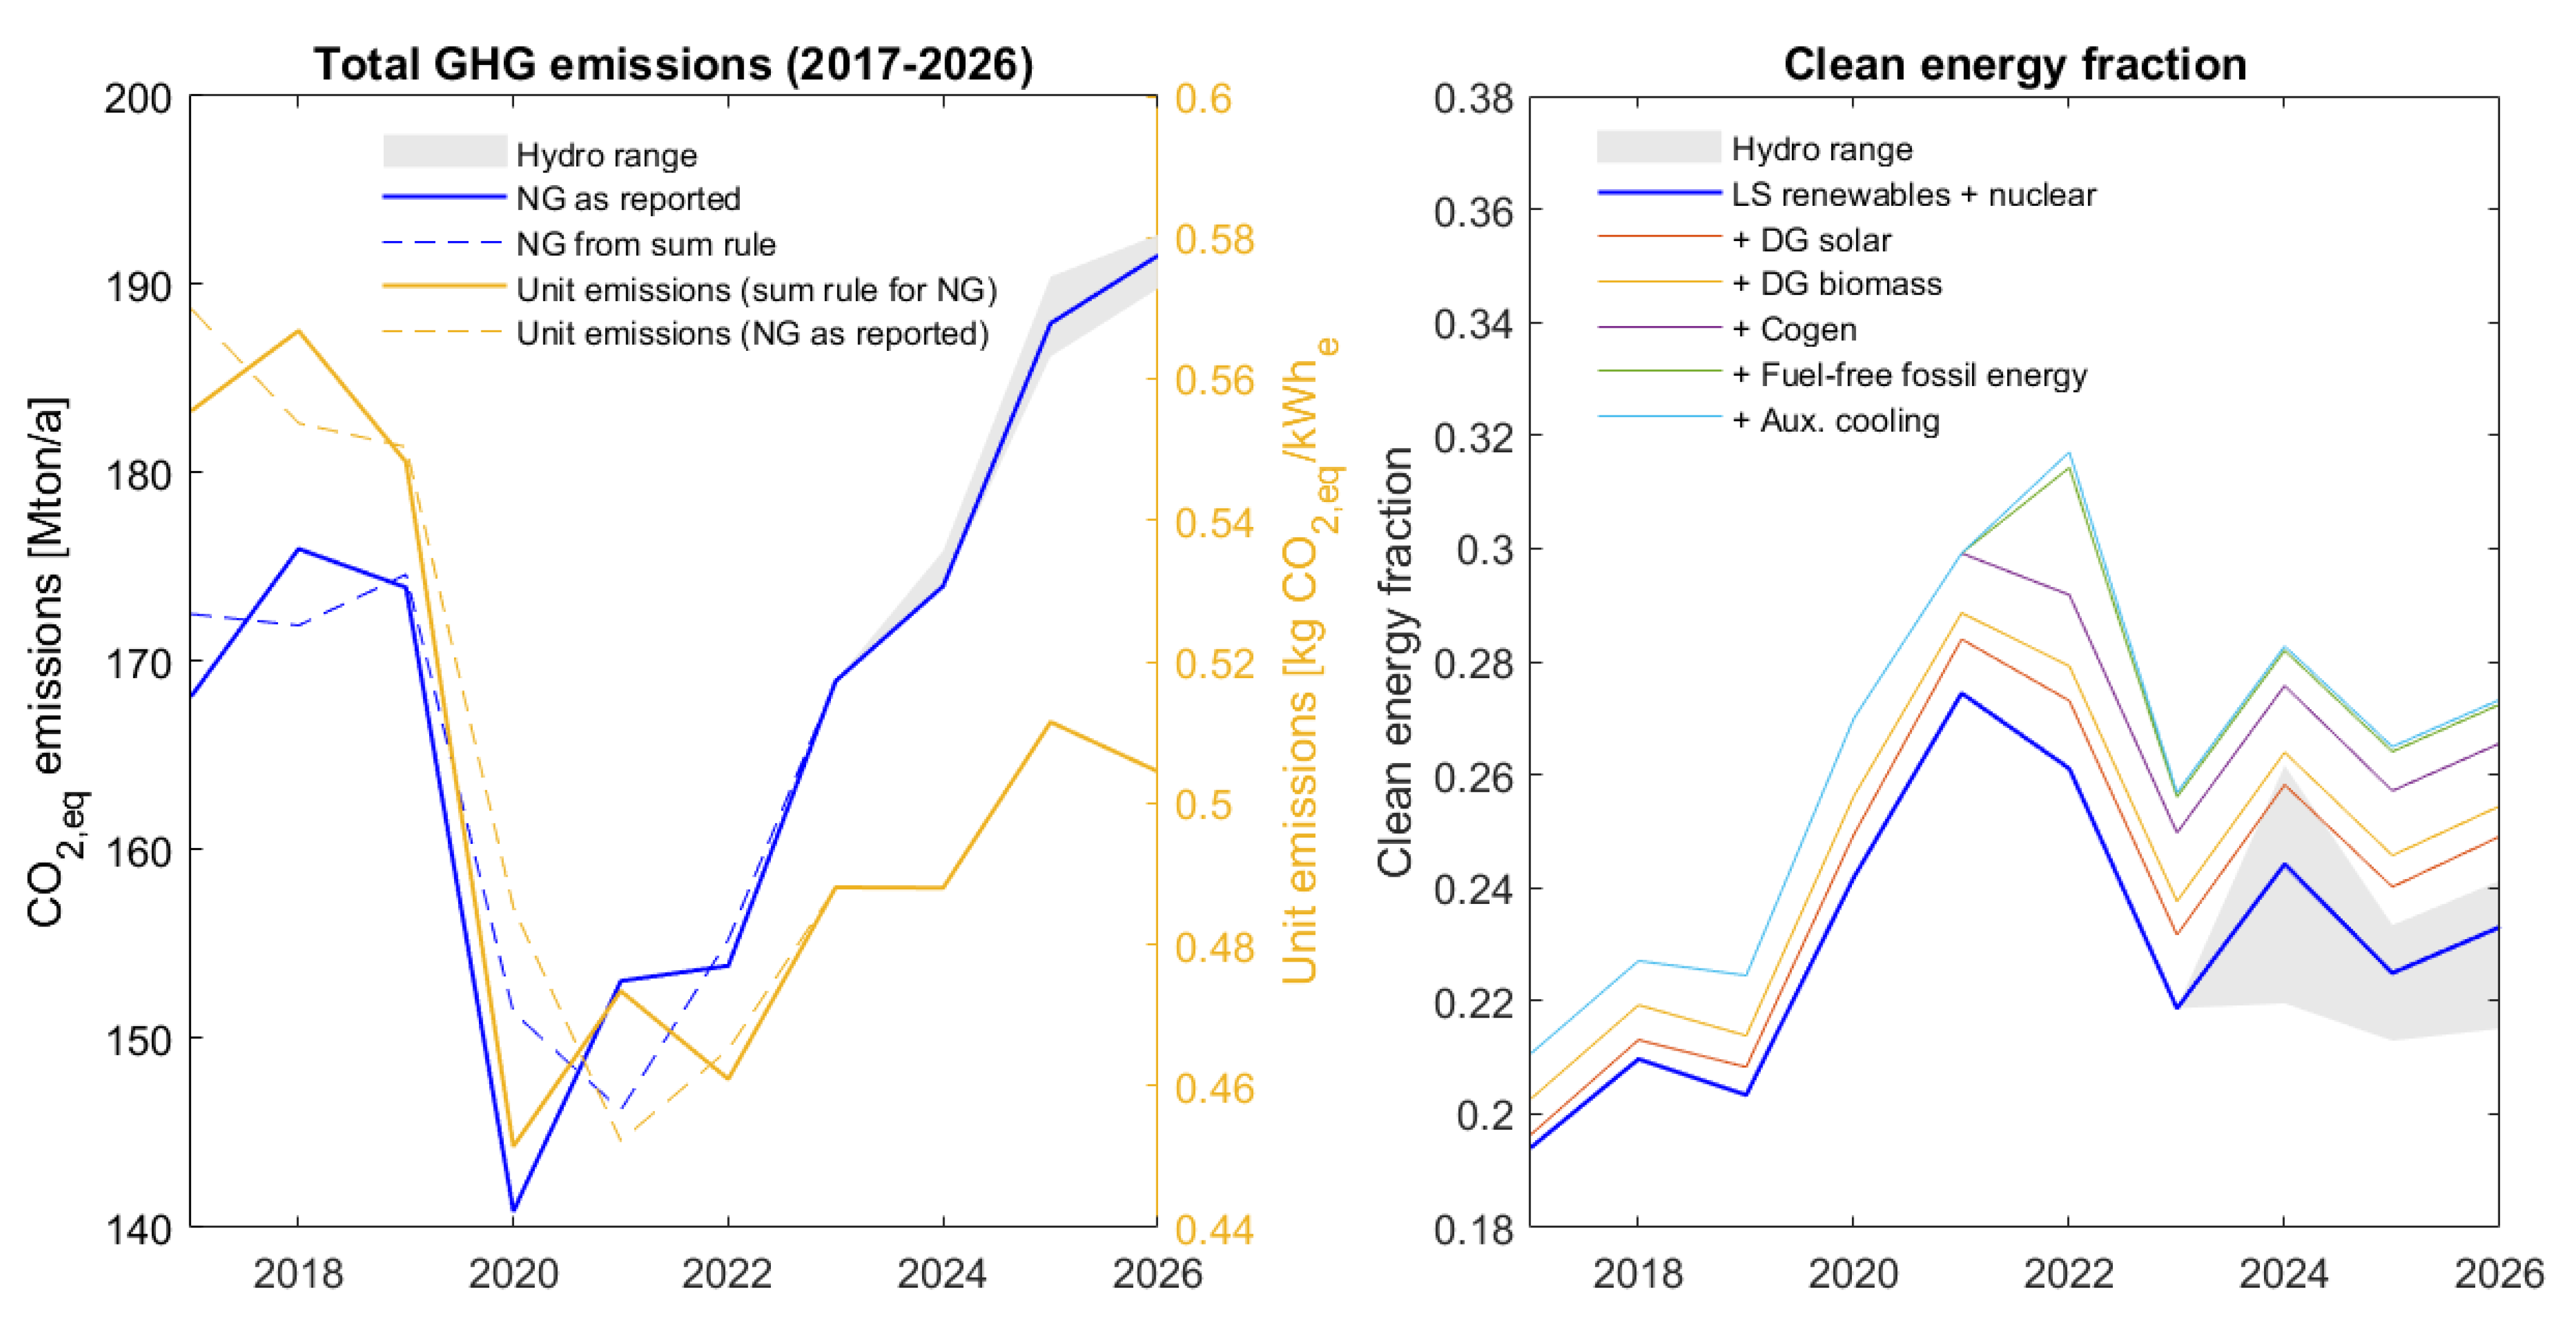
Table 5.
Expected capacity additions available at the beginning of each year for the 2024-2026 period, grouped by technology and type of generator (state-owned or private). Sources: (1) CFE data: Public versions of the business plan for 2021-2025 and 2022-2026, media reports on project progress. (2) Private generators – wind: Mexican Wind Energy Association (AMDEE, 2023). Private generators – solar PV: (ASOLMEX, 2023). Private generators – conventional / fossil fuel projects: All large-scale projects (80 MW) were found to be either operational, canceled, or indefinitely stalled. CCGT = combined-cycle gas turbine plants, ICE = internal combustion engines, SCGT = single-cycle gas turbine plants, PV-LS = large-scale photovoltaic (PV) plants, PV-DG = distributed PV generation.
| Additions by CFE (state utility) [MW] | Private generators [MW] | ||||||||
| Year | CCGT | ICE | SCGT | PV-LS | Geo | Hydro | Wind | PV-LS | PV-DG |
| 2024 | 409 | 1038 | 103 | 120 | 25 | 83 | 168 | 825 | 648 |
| 2025 | 5801 | - | - | 300 | - | 83 | 356 | 261 | 393 |
| 2026 | 348 | - | - | - | - | 83 | 355 | 261 | 314 |
| Total | 6558 | 1038 | 103 | 420 | 25 | 248 | 879 | 1347 | 1355 |
| Grand total | 7699 | 693 | 3581 | ||||||
Table 6.
Expected generation from the new capacities shown in Table 5, without considering possible curtailments, based on typical net capacity factors (NCF). DRE = dispatchable renewable energy (geo + hydro), VRE = variable renewable energy (= wind & solar), CCGT = combined-cycle gas turbine plants, SCGT = single-cycle gas turbines, ICE = internal combustion engines, PV-LS = large-scale solar photovoltaic, PV-DG = distributed solar photovoltaic.
| Renewables | New generation CFE [GWh] | New private generation [GWh] | |||||||||||
| Year | Total | Fossil | DRE | VRE | CCGT | ICE | SCGT | PV-LS | Geo | Hydro | Wind | PV-LS | PV-DG |
| 2024 | 8,796 | 4,459 | 315 | 3,717 | 2,615 | 1,546 | 298 | 305 | 123 | 193 | 486 | 2,096 | 1,135 |
| 2025 | 49,228 | 41,555 | 508 | 6,097 | 39,712 | 1,546 | 298 | 1,067 | 123 | 385 | 1,515 | 2,759 | 1,824 |
| 2026 | 53,885 | 43,781 | 701 | 8,337 | 41,937 | 1,546 | 298 | 1,067 | 123 | 578 | 2,541 | 3,422 | 2,374 |
Table 7.
Required total generation for the 2024-2026 period, based on an annual increase of 3.5%, the cumulative increase with respect to the 2023 baseline, the total new generation (see Table 6), as well as the balance between supply and demand for three hydroelectric generation scenarios. All values are in GWh/a.
| Demand | Supply | Balance | ||||
| Year | Total required generation | Generation increase | Total new generation | Low hydro | High hydro | Average hydro |
| 2024 | 358,331 | 12,117 | 8,796 | (3,322) | 11,686 | 5,465 |
| 2025 | 370,873 | 24,659 | 49,228 | 24,569 | 39,576 | 33,355 |
| 2026 | 383,853 | 37,640 | 53,885 | 16,246 | 31,253 | 25,032 |
Table 8.
Required redispatch for the 2024-2026 period, based on the required generation figures shown in Table 6 and the expected supply for the three hydro scenarios, shown in Table 7. CS = conventional steam plants, SCGT = single-cycle gas turbines, ICE = internal combustion engines, CCGT = combined-cycle gas turbine plants, VRE = variable renewable energy (= wind & solar). All values are in GWh/a.
| Redispatch - low hydro [GWh] | |||||||
| Year | Total | CS | Coal | SCGT | ICE | CCGT | VRE curt. |
| 2024 | 3,322 | - | - | - | - | 3,322 | - |
| 2025 | (24,569) | (10,064) | (5,543) | (3,722) | (1,791) | (1,725) | (1,725) |
| 2026 | (16,246) | (5,190) | (5,543) | (3,722) | (1,791) | - | - |
| Redispatch - high hydro [GWh] | |||||||
| Year | Total | CS | Coal | SCGT | ICE | CCGT | VRE curt. |
| 2024 | (11,686) | (10,064) | (1,622) | - | - | - | - |
| 2025 | (39,576) | (10,064) | (5,543) | (3,722) | (1,791) | (9,228) | (9,228) |
| 2026 | (31,253) | (10,064) | (5,543) | (3,722) | (1,791) | (5,067) | (5,067) |
| Redispatch - typical hydro [GWh] | |||||||
| Year | Total | CS | Coal | SCGT | ICE | CCGT | VRE curt. |
| 2024 | (5,465) | (5,465) | - | - | - | - | - |
| 2025 | (33,355) | (10,064) | (5,543) | (3,722) | (1,791) | (6,118) | (6,118) |
| 2026 | (25,032) | (10,064) | (5,543) | (3,722) | (1,791) | (1,957) | (1,957) |
Disclaimer/Publisher’s Note: The statements, opinions and data contained in all publications are solely those of the individual author(s) and contributor(s) and not of MDPI and/or the editor(s). MDPI and/or the editor(s) disclaim responsibility for any injury to people or property resulting from any ideas, methods, instructions or products referred to in the content. |
© 2024 by the authors. Licensee MDPI, Basel, Switzerland. This article is an open access article distributed under the terms and conditions of the Creative Commons Attribution (CC BY) license (http://creativecommons.org/licenses/by/4.0/).
Copyright: This open access article is published under a Creative Commons CC BY 4.0 license, which permit the free download, distribution, and reuse, provided that the author and preprint are cited in any reuse.


