
Submitted:
10 October 2024
Posted:
11 October 2024
You are already at the latest version
Abstract
Different polysaccharides, namely xanthan gum, guar gum, locust bean gum and κ-carrageenan were used as stabilizers, individually or in mixtures (50:50), in order to prepare nine (9) spreadable processed whey cheese (PWC) samples: X, G, L, C, X/G, X/L, C/X, C/G, and C/L. The pH and chemical composition of samples were constant. The impact of polysaccharides on the physical, textural, and sensory characteristics of PWC samples was examined, revealing significant differences (P<0.05) in all assessed properties among the samples. PWC samples had an off-white color with a slight yellowish hue. All samples were stable emulsion gels, with free oil formation values ranging between 4% (X/L) and 12% (C/G). Textural properties, as determined by texture profile analysis, highly correlated with physical and sensory attributes. The PWC samples X, G, L, X/G and C/X were less hard, while they were rated by panelists as having increased fattiness, stickiness, as well as texture and overall acceptability. Sample X was the softest and the most cohesive, adhesive, springy, stringy and gummy, in comparison to the other PWC samples. In contrast, brittleness and increased hardness were exhibited by the samples C, C/G, C/L and X/L, which were judged unsuitable for spreading by the panelists. In conclusion, the development of such cheeses aims not only at the production of tasty and nutritious products, but also at sustainability, as it utilizes whey, which is a by-product of cheese making.
Keywords:
processed cheese
; whey proteins
; polysaccharides
; physical properties
; textural properties
; sensory attributes
1. Introduction
Processed cheese, a cheese-based food, is typically produced by melting natural cheeses with emulsifying salts and optionally adding other ingredients to achieve a smooth and homogeneous texture [1]. One of the primary goals of the processed cheese industry is the development of diverse and innovative products. This can be accomplished by incorporating alternative components into formulations, such as whey proteins (WP) and polysaccharides. Whey is a by-product of the dairy industry and has primarily been considered as waste. Whey disposal poses significant environmental challenges, as this by-product can contribute to water pollution if not managed appropriately [2]. The main fraction of whey’s organic load is composed of lactose, fat, and proteins [3]. When improperly disposed of, whey can lead to nutrient overload in water bodies, promoting algal blooms that deplete oxygen and harm aquatic ecosystems [2]. This situation presents a challenge for dairy producers striving to balance cheese production with environmental responsibility. Sustainable management practices, such as utilizing whey in animal feed, bioenergy production, or as a fertilizer, among others, can effectively mitigate these impacts [4]. Moreover, by converting whey into valuable resources, such as in the production of novel products with high added value, waste can be reduced, while promoting circular economy principles that enhance overall sustainability [5]. Emphasizing innovative uses for whey not only addresses environmental concerns but also improves resource efficiency in the dairy industry, contributing to a more resilient and sustainable food system.
Recognition of the value of whey components has accelerated since they are cost effective ingredients, they can exhibit excellent functional properties and have increased digestibility and biological value. WP represent 20% of total milk proteins and are composed of β-lactoglobulin (β-lg), α-lactalbumin, serum albumin, immunoglobulin and minor proteins [6]. Research on processed cheese functionality has been focusing on partial substitution of caseins with WP or as added ingredients in typical processed cheese formulations [7,8,9,10,11,12] and has been extensively reviewed elsewhere [13,14]. Even though WP offer an extremely high potential for innovative development of functional and nutritious food products, there is a lack of literature on the properties of processed cheese prepared using whey cheese as the sole cheese base. Previous work of our group involved the development of processed whey cheese (PWC), using Myzithra cheese as the main protein ingredient [13,15]. Myzithra is a soft whey cheese that is produced throughout Greece, commonly made from the whey derived from manufacture of Feta cheese or hard cheeses [16].
In conventional processed cheese, emulsifying salts are a necessary ingredient so as to solubilise and hydrate the casein network and achieve homogeneous products [1]. Research has also been involved with products in the processed cheese category containing polysaccharides as additives which could replace emulsifying salts [9,12,17,18,19,20,21,22,23]. Polysaccharides are often added to processed cheese products, individually or combined, to improve water-holding properties, enhance viscosity, stabilize structure and modify their texture. The most common polysaccharides used in food production are galactomannans, such as guar gum and locust bean gum (LBG), as well as xanthan gum and carrageenans. Galactomannans are neutral, branched polysaccharides, whose molecular structure generally consists of chains of mannose residues with randomly attached galactose units as side chains. Galactomannans are capable to form viscous solutions, whereas LBG has been reported to form self-associating gels upon storage [24]. Xanthan gum, which is a high molecular-weight anionic polysaccharide consisting of a linear (1-4)-β-D-glucose backbone with a charged trisaccharide side chain on each second glucose residue, has been reported to have weak gel-like properties or can form a gel at higher concentrations, depending on solution conditions [25,26]. Carrageenans are a family of sulfated polysaccharides and possess a linear galactan backbone with alternating disaccharide repeating sequences of 1,4-linked α-D-galactose and 1,3-linked β-D-galactose and a variable proportion of sulfate groups on different positions. The less sulfated fraction and the easiest to gel is κ-carrageenan [24]. The combination of polysaccharides can enhance the development of new textures, as interactions between different polysaccharides can improve or hinder gelation. Xanthan gum has shown synergistic interactions with galactomannans, forming thermoreversible gels with guar gum and LBG, weak or strong and elastic, respectively [28]. Synergistic effects have also been observed in mixed systems of κ-carrageenan and LBG [24,25], though gelation can be facilitated or hindered, depending on interaction conditions [28]. Conservative synergistic effects have also been reported between κ-carrageenan and guar gum. In general, stronger synergy is observed between LBG and xanthan gum or carrageenan, in comparison to guar gum, due to the higher ratio of mannose to galactose (M/G) in LBG, which renders it less substituted than guar gum [25]. In the case of xanthan gum mixtures with κ-carrageenan, the system is governed by phase separation, where no binding interaction has been observed [26].
Protein-polysaccharide mixtures normally exist as two separate phases, a protein-rich and a polysaccharide-rich phase, due to thermodynamic incompatibility. In such systems, the texture is a result of intertwining gelation and phase-separation processes [29]. Thermodynamic incompatibility between WP and neutral polysaccharides (galactomannans) is well documented. Incompatibility is favored under conditions that promote biopolymer self-association, such as increased ionic strength and pH values near the protein isoelectric point of WP (pI5.2) [30,31]. Regarding mixtures of WP and LBG, no complexation was observed throughout the whole pH range [32]. However, phase separation resulted in slightly improved mechanical properties of mixed gels of WP (13% w/w) with LBG (0.4% w/w) at pH 5, due to the entrapment of the galactomannan chains within the protein gel [33]. Depending on the preparation conditions of mixed systems, xanthan gum can have a synergistic or antagonistic effect when added to WP, leading to different gel microstructures [31]. The possibility of partial formation of soluble complexes of β-lg with xanthan gum near the pI of β-lg (5.2-5.3) was demonstrated by Le & Turgeon [34]. Sulfated polysaccharides, like carrageenans, can interact with proteins more strongly than carboxylated ones, such as xanthan gum [35]. The electrostatic attraction between WP and anionic polysaccharides above or around the pI of WP is due to association of negatively charged groups with positively charged patches on the WPs surface and the presence of charge fluctuations on the WP’s surface near pI [36,37]. However, the behavior of mixed systems of WP with κ-carrageenan, which is a gelling polysaccharide upon cooling, also seems to be ruled by aggregation and demixing kinetics, resulting in micro-phase separation [30,38]. These observations suggest that in complex food systems containing biopolymers and lipids, such as processed cheese, the microstructure and properties of the final products will be determined by the interactions between different components.
Aim of this study is to investigate the influence of different polysaccharides, such as xanthan gum, guar gum, LBG, and κ-carrageenan, added individually or in mixtures (50:50), on the physical, textural, and sensory properties of spreadable PWC samples made exclusively with whey cheese as the cheese base. The ultimate goal is the production of innovative cheeses and at the same time sustainable development with important utilization of whey, a by-product of cheese making.
2. Materials and Methods
2.1. Materials
The cheese base for preparing spreadable processed whey cheese (PWC) samples was fresh Myzithra cheese, made exclusively from whey without added salt, which was kindly provided by Mevgal Dairy S.A. (Thessaloniki, Greece). Pasteurized, homogenized full cream was purchased from Agno Dairy S.A. (Thessaloniki, Greece). A freeze-dried starter culture of mixed mesophilic lactic strains (FD-DVS Flora-Danica) was acquired from Chr. Hansen’s Dairy Cultures (Hørsholm, Denmark). Xanthan gum, guar gum, LBG, κ-carrageenan, NaCl and all reagents used for analyses, which were of analytical grade, were sourced from Sigma-Aldrich (Saint-Louis, MO, USA).
2.2. Preparation of the Processed Cheese Samples
All samples were prepared using a Stephan Universal Machine UMC 5 mixer-cooker as described in detail in Chatziantoniou et al. [15]. Nine (9) PWC samples were prepared, the first four containing individual polysaccharides: xanthan gum (X), guar gum (G), LBG (L), κ-carrageenan (C) and the other five containing a mixture of two polysaccharides (50:50): xanthan gum/guar gum (X/G), xanthan gum/LBG (X/L), κ-carrageenan/xanthan gum (C/X), κ-carrageenan/guar gum (C/G), κ-carrageenan/ LBG (C/L). Myzithra cheese and cream were mixed with a starter culture until pH dropped to 5.0, then polysaccharides (0.8% w/w), and NaCl (1.0% w/w) were added, heated at 90°C and then poured into glass jars for storage at 4°C. Textural measurements were conducted on portions of the samples stored in cylindrical molds. Each sample was prepared in triplicate and measurements were taken within four days of preparation.
2.3. Chemical Composition
Compositional analyses of raw materials and PWC samples included measuring moisture content [40], fat content [41], ash, NaCl and protein contents [42]. Total nitrogen (TN) and non-protein nitrogen (NPN), the portion of TN soluble in 12% trichloroacetic acid, were determined using the Kjeldahl method. Protein content was calculated as 6.38 × (TN – NPN). The pH was measured using a Hanna Instruments pH meter (model HI 8424) with a glass electrode. All measurements were conducted in triplicate (one repeat per triplicate sample) after 1 day of storage.
2.4. Color
Color of PWC samples was determined according to the International Commission on Illumination (CIE) using a Micro Color colorimeter (Dr. Lange, Düsseldorf, Germany), on cylindrical samples 10mm × 50mm (height × diameter). The instrument provides the three color parameters (coordinates) L* (lightness), a* (+redness, –greenness) and b* (+yellowness, –blueness), in accordance with the CIELab system, after having been calibrated with black and white calibration tiles. Measurements were conducted in nine repeats (three repeats per triplicate sample).
2.5. Free oil
Free oil in PWC samples was measured using the method described by Kindstedt and Fox [42], which involves using centrifugal force to recover free oil from heated samples, serving as an accelerated test of fat globule coalescence. Specifically, a 6 g (to the nearest 0.1 mg) PWC sample is weighed into a glass centrifuge tube with a screw cap and placed in a 100°C water bath for 4 minutes. Then, 10 ml of 60°C distilled water acidified with HCl to pH 2.2 is added, followed by centrifugation at 65°C for 5 minutes. Next, 10 ml of a distilled water-methanol solution (1:1 v/v) is added. The tube is placed in a 60°C water bath for 1 minute, centrifuged for 2 minutes, and returned to the water bath for another minute, forming a distinct grease layer at the top. The fat layer and aqueous-methanolic phase are transferred to a butyrometer using a Pasteur pipette. The butyrometer is stoppered, placed in a 60°C water bath for 1 minute, centrifuged for 8 minutes, then returned to the 60°C water bath for 2 minutes before reading the fat content. Half the fat content yields fat released per 100 g of sample. Determinations were performed in triplicate (one repeat per triplicate sample).
2.6. Textural Measurements
Cylindrical samples with a height and diameter of 22 mm were used for texture profile analysis (TPA). Samples were compressed between two metal disks (Ø = 100 mm) at a speed of 20 mm/min until reaching 80% deformation. The analysis involved two consecutive compression-decompression cycles. The textural properties assessed included brittleness (or fracturability), hardness 1 and 2, compression work 1 and 2, cohesiveness, adhesiveness, springiness, stringiness, and gumminess, as described by Bourne and Comstock [43].
2.7. Sensory Evaluation
PWC samples were evaluated by two different panels, comprising of members of the Department of Food Science and Technology, conforming to ISO 8586 [44]. The first panel, consisting of 18 expert sensory assessors, evaluated the intensity of sensory characteristics using a descriptive intensity rating test. The second panel, made up of 72 habitual consumers, assessed the samples for acceptability using a hedonic rating test. Both evaluations took place in a climate-controlled sensory analysis laboratory, featuring individual testing booths with neutral walls and D65 lighting. All samples were presented individually as cubic specimens and labeled with randomized three-digit codes. The PWC samples were distributed to the panelists using a randomized, balanced block design accounting for order and carry-over effects. Each PWC sample was evaluated using 9-point scales [45]. Regarding intensity, sensory attributes such as yellow color (not at all yellow-very yellow), fattiness (not fatty – extremely fatty) and stickiness (not sticky – extremely sticky) were evaluated. In hedonic evaluations, aroma-flavor, texture and overall acceptability were rated (dislike extremely – like extremely). Each PWC sample was evaluated six times on each sensory attribute for intensity (two repeats per triplicate sample) and twenty-four times for acceptability (eight repeats per triplicate sample).
2.8. Statistical Analysis
One-way analysis of variance (ANOVA) was employed on physical, textural and sensory parameters of the PWC samples. When significant effects were detected (P<0.05), the Student-Newman-Keuls’ (SNK) multiple range test was applied. Pearson’s correlation coefficients (r) were determined, in order to reveal relationships between the properties of samples. Statistical analyses were performed using Minitab 18 statistical software (Minitab Inc, PA, USA).
3. Results and Discussion
3.1. Chemical Composition
The pH of the PWC samples was kept constant (5.21 ± 0.03), as was the chemical composition (Table 1).
3.2. Color
Results of color determinations are presented in Table 2. Differences in color parameters L*, a* and b* between PWC samples, although statistically significant (P<0.05), were very small. All samples had lightness, L*, of around 90 which corresponds to an off-white color. One-way ANOVA (P<0.05) revealed that the samples G, C/X, X/L and X/G had increased lightness, while sample C had the lowest L* value.
All PWC samples exhibited a slight yellowish hue (positive b* values), as well as a very slight greenish hue not perceptible to the eye (negative a* values and close to zero). Specifically, the samples C, C/G and C/L were more yellow, in relation to other samples, due to the yellowish color of κ-carrageenan. Yellow color, which is characteristic of processed cheese [46], is mostly due to the milk fat carotenoid content [47] and greenish color, which is mainly due to the whey riboflavin content [48], have been observed in processed cheese spreads [49] and PWC of varying chemical composition [13]. Analogous results regarding color have been reported for WP gels [50], low fat processed cheese [18] and processed cheese analogues [51].
3.3. Free oil Formation
Free oil formation, which is the tendency of liquid fat to separate from melted cheese and accumulate as oil pockets, is thought to be an indication of fat emulsification in cheese [42]. Extensive fat globule aggregation and rupture contributes to free oil formation and the determination of this property can be an indication of stability of emulsions during storage. However, this quantitative method for the determination of free oil formation, which reflects heat-related properties, may not extract the fat held in emulsified form by proteins in the cheese [52]. Since it is an accelerated test of coalescence, it would rather give an indication of the ease in rupturing and aggregation of fat globules during heating and centrifugation. The different polysaccharides added to PWC samples are expected to behave as emulsion stabilizers, by forming viscous or gelled networks in the aqueous phase [53], which are thermally reversible [25]. Free oil formation is expected to be aided by the melting of PWC samples, as the milk fat globules melt below 39°C [54] and the gelled structure at various relatively low temperatures, depending on the type of added polysaccharide [25]. A moderate free oil formation could be considered desirable. Some attributes required for specific process cheese functionality, like enhanced spreadability or meltability, can be achieved due to a small amount of free oil from fat globules partially rupturing over time [53].
Figure 1 presents the results of free oil formation expressed as percentage (w/w) in PWC samples, where it is shown that the type of polysaccharide affected (P<0.05) this property. However, the low values of free oil (≤12%) showed that all PWC samples were stable emulsion gels. In such systems, the rate of oil droplet coalescence is generally decreased [31]. The narrow range of values (4.17-11.75%) showed that the differences in free oil were small, despite the large differences in the thickening-gelling behavior of the different polysaccharides, as well as in the melting properties of the resulting emulsion gels.
In general, three groups of samples can be distinguished. In the first, the four polysaccharides used individually and the mixture of xanthan and guar gums gave similar intermediate free oil values (6.88-8.83% w/w), indicating a relatively loose or porous structure and moderate stabilizing ability. The strongly gelling κ-carrageenan which simultaneously forms electrostatic complexes with WP showed a free oil value equal to those of galactomannans (guar gum and LBG) which are relatively weak thickeners as well as thermodynamically incompatible with WP. κ-carrageenan forms mechanically resistant but thermally sensitive gels, since its aqueous gels (1% w/w) were found to melt at low temperature (36°C) [25]. Equal free oil values were also observed in PWC sample X/G. Synergistic effects between xanthan and guar gums leading to enhanced viscosity, via intermolecular binding between the disordered xanthan and unsubstituted regions of the galactomannan backbone [27], would have allowed improving the steric stabilization of fat globules [55]. However, PWC samples containing such blends may have good melting characteristics, as reported for xanthan gum/guar gum aqueous blends (1% w/w total concentration) which are not resistant to melting (at 32.5°C) [25].
Slightly lower free oil values were observed in sample X compared to others with individual polysaccharides, because xanthan gum has been shown to stabilize emulsion structures containing milk proteins due to the formation of a long-lasting gel like network of aggregated droplets [35]. Moreover, xanthan gum aqueous gels (1% w/w) have been found to be resistant to melting (≈65°C) [25], which possibly hindered free oil formation in PWC samples.
The samples X/L, C/L and C/X had the lowest free oil values (4.17-5.58% w/w), indicating that these polysaccharide mixtures provided the strongest macromolecular barrier at the interface [35], arising from enhanced emulsification and stabilization in a gelled phase. In relation to samples with the respective polysaccharides individually added, the observed lower values in sample X/L can be attributed to intermolecular interaction between xanthan and unsubstituted segments of mannan backbone of LBG, leading to synergistic gelling upon cooling [25,56], which have been found to be more heat stable than gels of the respective polysaccharides individually added [57]. Similarly, in sample C/L the combination of the incompatibility of LBG with WP, the electrostatic interaction of κ-carrageenan with WP [36] and the interaction of κ-carrageenan’s double helix with smooth regions of LBG mannan backbone [24] strengthened the stability of fat globules against breakage during centrifugation. Regarding the lower values of free oil in sample C/X, the decreased ability of free oil to be formed can be attributed to the segregative interaction between the two polysaccharides and their complexation with WP. Since xanthan gum and κ-carrageenan are both anionic and κ-carrageenan can interact with proteins more strongly than xanthan gum [35], the latter would preferentially desorb to the bulk [32], thus increasing its thickening properties. This would allow for the increased effective volume of κ-carrageenan to aggregate or even partially bind to WP stabilized fat globules and form negatively charged aggregates [37], thus increasing the rigidity of the film around fat globules [32].
The highest values of free oil formation (11.75%) were observed in PWC sample C/G, possibly due to a combination of a more open structure and decreased rigidity of the film around fat globules. Both are reported to result in phase separation in mixed systems with WP and mixtures of κ-carrageenan with guar gum are much less synergistic than those with LBG [25,58]. Furthermore, while mixed κ-carrageenan/galactomannan gels are thermally reversible, κ-carrageenan/guar gum aqueous blends (1% w/w) have been reported to melt at lower temperatures (35°C) than κ-carrageenan/LBG blends (45-52°C) [25,59]. As found in the present study, in mixed κ-carrageenan/galactomannan gels, larger pore size, increased sensitivity to temperature rise, coarser and weaker gels were formed in the presence of guar gum, compared to LBG. Specifically, mixed gels became extremely soft at 40°C [55].
When comparing sample C/G to sample C/X, which both involve decreased polysaccharide interactions, the increased free oil formed in sample C/G may also be attributed to the higher flexibility of guar gum compared to xanthan gum [27,55]. This may have enabled guar gum to be depleted from the interparticle distance, thus the ability of fat globules to breakage during centrifugation was further increased. The above explain the observed weaker macromolecular barrier at the interface [35] of the sample containing κ-carrageenan and guar gum, where fat globules ruptured or aggregated more easily during melting and centrifugation. Also, there may have been hampering of κ-carrageenan self-association and weaker gel formation which is far more prone to hydrolysis at the acidic conditions of free oil formation [60].
Free oil in PWC samples containing guar gum was previously found to be 0.01-9.75% w/w, affected by the fat content [13].
3.4. Textural Properties
The TPA properties of PWC samples, namely brittleness, B, hardness 1, H1, hardness 2, H2, compression work 1, A1, compression work 2, A2, cohesiveness, A2/A1, adhesiveness, A3, springiness, S1, stringiness, S2 and gumminess, G, as affected by added polysaccharides, are given in Table 3. Characteristic curves of PWC samples X and C are shown in Figure 2a and b, respectively. During the first compression cycle, the curve of sample X did not show any significant break, which means that the emulsion gel flowed rather than fractured. Similar behavior was observed in cream cheese [43] and block-type processed cheese [61]. In contrast, the break in the curve of sample C, corresponding to the fracture point, indicated that it was an emulsion gel that fractured during compression.
Significant differences (P<0.05) among the samples were observed for all the textural properties determined. Regarding the shape of the TPA curve during the first compression cycle, two groups of samples can be distinguished: those that did not present a fracture point (samples X, G, L, X/G and C/X), and those that exhibited brittleness, B, which is the force corresponding to the fracture point (samples C, C/G, C/L and X/L). However, according to ANOVA, four groups are distinguished. The first (samples X, G and L) presented decreased values of H1, H2, A1, A2 and increased values of A2/A1 and A3. On the contrary, the second group (samples C, C/L and X/L) exhibited increased values of H1, H2, A1, A2 and decreased values of A2/A1 and A3. With intermediate values, a third group (samples X/G and C/X) had properties close to those of the first group, as well as a fourth group (sample C/G) had texture properties close to those of the second group. Hardness 1, H1, was the property showing major differences among samples, in the following sample order: X<L<G=C/X<X/G<C/G<X/L<C<C/L.
Sample X was not only the softest but also the most cohesive, adhesive, springy, stringy and gummy, compared to the other PWC samples, due to the fact that xanthan gum gives low viscosity in solution as well as weak electrostatic attraction with WP. Flocculation or partial aggregation of fat droplets could also be the cause of decreased firmness but increased cohesiveness and springiness [53], in agreement with the large size of fat globules previously determined for sample X [15]. In contrast, in the presence of emulsifying salts in processed cheese spreads, the addition of guar gum resulted in softer products than xanthan gum [62] or LBG [12]. The higher hardness and compression work values observed for samples G and L must be due to the thermodynamic incompatibility of galactomannans with WP leading to a segregative interaction with self-association of guar gum or LBG on the one hand and aggregation of WP on the other hand. Much higher hardness and compression work values were found in sample C, due to the strong gelling capacity of κ-carrageenan which additionally exhibits a high electrostatic attraction with WP. Similarly, when carrageenan was used alone in the formulation of cheese analogues, the products were harder than when using xanthan gum or LBG [9,63]. Furthermore, Mozzarella cheese analogues with xanthan gum were found to be softer and springier than those containing carrageenan or LBG [63]. It has also been reported that xanthan gum formed more adhesive samples than κ-carrageenan (0.5% w/v) in mixed gels with bovine serum albumin (20% w/v) [64].
Comparable TPA results were reported for PWC samples [13,15], commercial pasteurized processed cheese products with added WP [65], processed cheese [46], processed cheese analogues [9] and cream cheese [43]. Also, similar results of textural properties were reported for low-fat processed cheese [18,22] and processed cheese analogues [21] with polysaccharide addition. Dabour & El-Shanshory [21] also observed that adhesiveness of processed cheese analogues with added polysaccharides decreased in the same order: xanthan gum>guar gum>carrageenan.
PWC samples prepared with polysaccharide mixtures showed different textural behavior which should also be due to interactions between polysaccharides, besides their above-mentioned interactions with WP. According to the additivity law, in all five samples prepared with mixtures, the polysaccharides showed synergistic or antagonistic effects, meaning that the interactions between polysaccharides are stronger than those between polysaccharides and WP. The mixture of xanthan gum and guar gum (sample X/G) or LBG (sample X/L) increased the hardness and compression work while decreasing the cohesiveness, adhesiveness and gumminess, due to the synergy of polysaccharides through their cross-linking, especially in the case of LBG. The blending of κ-carrageenan and guar gum or LBG showed weak antagonism in the first case (sample C/G) but strong synergy in the second (sample C/L). That is, the gelation of κ-carrageenan should be impeded by guar gum due to its high degree of galactose substitution but enhanced by LBG due to its strong cross-linking with κ-carrageenan. Finally, κ-carrageenan and xanthan gum acted antagonistically and gave a rather soft texture to the sample C/X, which should be due to the electrostatic repulsions between these two anionic polysaccharides.
The results are consistent with those of similar PWC samples examined by squeezing flow viscometry [15]. Adhesiveness decreased when polysaccharide mixtures were used in PWC samples, where samples X/L and C/L were the least adhesive PWC samples. Analogous results regarding adhesiveness were reported by Gustaw and Mleko [9] for processed cheese analogues containing WP (0.1% w/w) and mixtures (50:50) of LBG with xanthan gum or κ-carrageenan (0.2% w/w total concentration), at pH 6.2.
TPA results of PWC samples were found to be highly correlated (P<0.05). In particular, H1 positively correlated with H2 (r = 0.995), A1 (r = 0.989) and A2 (r = 0.824), and negatively correlated with A3 (r = –0.799). H2 also showed a positive correlation with A1 (r = 0.984) and a negative correlation with A3 (r = –0.836), while A1 negatively correlated with A3 (r = –0.811). Positive correlations were found between A2 and G (r = 0.725), between A3 and A2/A1 (r = 0.974), between A2/A1 and S1 and S2 (r = 0.797 and 0.821, respectively) and between S1 and S2 (r = 0.858). The above results reveal that PWC samples measured as hard were less adhesive and samples with increased cohesiveness were also more adhesive, springy and stringy. Between the TPA and free oil results, no correlation was found, indicating that the stability of the prepared emulsion gels was achieved in all samples, regardless of texture, given the narrow range of free oil values.
3.5. Sensory Attributes
Significant differences were observed (P<0.05) among the mean scores of PWC samples’ sensory attributes (Table 4). From intensity rating tests, samples C/G and C/L were found to have more intense yellow color in relation to other PWC samples, while samples L and X/G were perceived as having increased fattiness. Samples C/L and X/L were perceived as the least fatty and sticky, while samples X, G, L and X/G were rated as very sticky. From hedonic rating tests, results showed that samples G, L and X/G obtained high scores in terms of aroma-flavor, texture and overall acceptability. On the contrary, samples C and X/L received very low texture and overall acceptability scores by panelists. PWC samples containing guar gum or LBG were overall rated as more acceptable than the sample containing xanthan. However, a study on the sensory attributes of processed cheese analogues containing xanthan gum or carrageenan did not reveal any differences in odor, color or acceptability of samples [21].
Results of sensory attributes showed high correlations among them (P<0.05). Positive correlations were observed between fattiness and stickiness (r = 0.952) and between stickiness and texture acceptability (r = 0.933). Fattiness and texture acceptability also showed a positive correlation (r = 0.837). Finally, aroma-flavor and texture acceptability correlated with overall acceptability (r = 0.905 and 0.973, respectively), showing the importance of aroma-flavor and texture on the acceptability of PWC samples by consumers.
3.6. Correlations between Instrumental and Sensory Methods
It is known that instrumental evaluation of food properties can lead to measurements that correlate with sensory perception, providing practical information to the food industry. In this direction, results of sensory evaluation showed strong correlations with various parameters of PWC samples. Specifically, the yellow color of PWC samples was well recognized by panelists during intensity rating tests, since the sensory yellow color highly correlated with the instrumental measure of yellowness, parameter b* (r = 0.897), as previously observed [13]. Stickiness highly positively correlated with A3 (r = 0.789), revealing the concordance between instrumental adhesiveness and sensory stickiness, and negatively correlated with H1 (r = –0.816), H2 (r = –0.816) and A1 (r = –0.847), showing that the firmer PWC samples were rated as less sticky.
Texture acceptability had negative correlations with H1 (r = –0.788), H2 (r = –0.789) and A1 (r = –0.785), showing that as the solid character of PWC samples strengthened, samples were perceived as less acceptable by panelists, as the product is intended for spreadable cheese. On the contrary, texture acceptability showed a positive correlation with A3 (r = 0.785), revealing the expected ability of cheese to adhere to the bread surface during spreading.
4. Conclusions
As the pH and chemical composition of the PWC samples prepared were constant, the differences in their physical, textural and sensory properties were due to the type of polysaccharides added individually or in mixtures. All samples had an off-white color with a slight yellowish hue, the characteristic color of processed cheeses. The samples were stable emulsion gels with free oil formation between 4% and 12%, which can be considered beneficial for cheese spreading.
In a complex system such as PWC samples, textural properties appeared to be the result of interactions between milk fat, whey proteins, aqueous phase and polysaccharide, as well as interactions between two different polysaccharides, when mixtures were used. In the latter case, the texture strengthening revealed a synergy between the polysaccharides (samples X/G, X/L and C/L), while the texture weakening showed an antagonism between them (samples C/X and C/G). Samples X, G, L, X/G and C/X were soft and did not fracture under compression, with sample X being the softest and the most cohesive, adhesive, springy, stringy and gummy. In contrast, samples C, C/G, C/L and X/L were hard and fractured under compression. For these latter samples, reducing the concentration of added polysaccharides could also lead to softer and more spreadable products.
Correlations of the results between the studied properties showed that the lower the instrumentally measured hardness of PWC samples, the higher the sensory fattiness, stickiness and texture acceptability. The correlations also showed the importance of aroma-flavor and texture on the overall acceptability of the samples by consumers.
This proposed alternative utilization of whey via the industrial production of PWC, which requires large quantities of whey proteins, could offer the market innovative nutritious food and also make a decisive contribution to environmental protection.
Author Contributions
Conceptualization, A.T. and S.C.; methodology, A.T. and S.C.; formal analysis, S.C.; resources, A.T. and S.C.; data curation, S.C.; writing—original draft preparation, S.C.; writing—review and editing, A.S.; supervision, A.S. All authors have read and agreed to the published version of the manuscript.
Funding
This research received no external funding.
Institutional Review Board Statement
Not applicable.
Institutional Review Board Statement
Not applicable.
Informed Consent Statement
Not applicable.
Data Availability Statement
The raw data supporting the conclusions of this article will be made available by the authors on request.
Acknowledgments
The preparation and provision of Myzithra cheese by Mevgal Dairy S.A. (Thessaloniki, Greece) is gratefully acknowledged.
Conflicts of Interest
The authors declare no conflicts of interest.
References
- Guinee, T.P.; Carić, M.; Kaláb, M. Pasteurized processed cheese and substitute/imitation cheese products. In: Cheese Chemistry, Physics and Microbiology, Vol. 2, 3rd ed.; P.F. Fox, P.L.H. McSweeney, T.M. Cogan; T.P. Guinee, Eds.; Elsevier Academic Press: London, UK, 2004; pp. 350–394. [CrossRef]
- Rao, M.; Bast, A.; de Boer, A. Valorized food processing by-products in the EU: Finding the balance between safety, nutrition, and sustainability. Sustainability 2021, 13(8). [Google Scholar] [CrossRef]
- Zandona, E.; Blažić, M.; Jambrak, A.R. Whey utilisation: Sustainable uses and environmental approach. Food Technol. Biotech. 2021, 59(2). [Google Scholar] [CrossRef] [PubMed]
- Lappa, I.K.; Papadaki, A.; Kachrimanidou, V.; Terpou, A.; Koulougliotis, D.; Eriotou, E.; Kopsahelis, N. Cheese Whey Processing: Integrated biorefinery concepts and emerging food applications. Foods 2019, 8, 347. [Google Scholar] [CrossRef] [PubMed]
- Kumar, N., Heena, Dixit, A., Mehra, M., Daniloski, D., Trajkovska Petkoska, A. (2023). Utilization of Whey: Sustainable Trends and Future Developments. In: Whey Valorization, A. Poonia, A. Trajkovska Petkoska Eds.; Springer: Singapore, 2023.
- El-Aidie, S.A.M.; Khalifa, G.S.A. Innovative applications of whey protein for sustainable dairy industry: Environmental and technological perspectives—A comprehensive review. Compr. Rev. Food. Sci. Food Saf. 2024, 23, 13319. [Google Scholar] [CrossRef]
- Awad, S.; Ahmed, N.; Soda, M. Application of salt whey from Egyptian Ras cheese in processed cheese making. Food Nutr. Sci. 2013, 4, 79–86. [Google Scholar] [CrossRef]
- El-Shibiny, S.; Shenana, M.E.; El-Nagar, G.F.; Abdou, S.M. Preparation and properties of low fat processed cheese spreads. Int. J. Dairy Sci. 2007, 2(1), 13–22. [Google Scholar] [CrossRef]
- Gustaw, W.; Mleko, S. The effect of polysaccharides and sodium chloride on physical properties of processed cheese analogs containing whey proteins. Milchwissenschaft 2007, 62(1), 59–62. [Google Scholar]
- Mihulová, M.; Vejlupková, M.; Hanušová, J.; Štětina, J.; Panovská, Z. Effect of modified whey proteins on texture and sensory quality of processed cheese. Czech J. Food Sci. 2013, 31(6), 553–558. [Google Scholar] [CrossRef]
- Sołowiej, B.G.; Nastaj, M.; Szafranska, J.O.; Terpiłowski, K.; Małecki, J.; Mleko, S. The effect of fat replacement by whey protein microcoagulates on the physicochemical properties and microstructure of acid casein model processed cheese. Int. Dairy J. 2022, 131, 105385. [Google Scholar] [CrossRef]
- Swenson, B.J.; Wendorff, W.L.; Lindsay, R.C. Effects of ingredients on the functionality of fat-free process cheese spreads. J. Food Sci. 2000, 65(5), 822–825. [Google Scholar] [CrossRef]
- Chatziantoniou, S.E.; Thomareis, A.S.; Kontominas, M.G. Effect of chemical composition on physico-chemical, rheological and sensory properties of spreadable processed whey cheese. Eur. Food Res. Technol. 2015, 241, 737–748. [Google Scholar] [CrossRef]
- Lee, S.K.; Anema, S.G. The effect of the pH at cooking on the properties of processed cheese spreads containing whey proteins. Food Chem. 2009, 115, 373–380. [Google Scholar] [CrossRef]
- Chatziantoniou, S.E.; Thomareis, A.S.; Kontominas, M.G. Effect of different stabilizers on rheological properties, fat globule size and sensory attributes of novel spreadable processed whey cheese. Eur. Food Res. Technol. 2019, 245(1), 2401–2412. [Google Scholar] [CrossRef]
- Dermiki, M.; Ntzimani, A.; Badeka, A.; Savvaidis, I.N.; Kontominas, M.G. Shelf-life extension and quality attributes of the whey cheese “Myzithra Kalathaki” using modified atmosphere packaging. LWT 2008, 41, 284–294. [Google Scholar] [CrossRef]
- Ahmad, S.; Butt, M.S.; Pasha, I.; Sameen, A. Quality of processed cheddar cheese as a function of emulsifying salt replaced by κ-carrageenan. Int. J. Food Prop. 2015, 19(8), 1874–1883. [Google Scholar] [CrossRef]
- Anjo, A.F.; Saraiva, B.R.; da Silva, J.B.; Ogawa, C.Y.L.; Sato, F.; Bruschi; M. L.; Riegel-Vidotti, I.C.; Simas, F.F.; Matumoto-Pintro, P.T. A new food stabilizer in technological properties of low-fat processed cheese. Eur. Food Res. Tech. 2023, 249, 597–606. [Google Scholar] [CrossRef]
- Černíková, M.; Buňka, F.; Pavlínek, V.; Březina, P.; Hrabě, J.; Valásěk, P. Effect of carrageenan type on viscoelastic properties of processed cheese. Food Hydrocoll. 2008, 22, 1054–1061. [Google Scholar] [CrossRef]
- Černíková, M.; Buňka, F.; Pospiech, M.; Tremlová, B.; Hladká, K.; Pavlínek, V.; Březina, P. Replacement of traditional emulsifying salts by selected hydrocolloids in processed cheese production. Int. Dairy J. 2010, 20(5), 336–343. [Google Scholar] [CrossRef]
- Dabour, N.; El-Shanshory, A. The influence of protein content and some hydrocolloids on textural attributes of spreadable processed cheese. TJSAR 2018, 14(5), 5–11. [Google Scholar] [CrossRef]
- da Silva, D.F.; de Souza Ferreira, S.B.; Bruschi, M.L.; Britten, M.; Matumoto-Pintro, P.T. Effect of commercial konjac glucomannan and konjac flours on textural, rheological and microstructural properties of low fat processed cheese. Food Hydrocoll. 2016, 60, 308–316. [Google Scholar] [CrossRef]
- Kratochvílová, A.; Salek, R.N.; Vašina, M.; Lazárková, Z.; Dostálová, J.; Šenkýrová, J. The impact of different hydrocolloids on the viscoelastic properties and microstructure of processed cheese manufactured without emulsifying salts in relation to storage time. Foods 2022, 11, 3605. [Google Scholar] [CrossRef] [PubMed]
- Arda, E.; Kara, S.; Pekcan, O. Synergistic effect of the locust bean gum on the thermal phase transitions of κ-carrageenan gels. Food Hydrocoll. 2009, 23, 451–459. [Google Scholar] [CrossRef]
- Pinheiro, A.C.; Bourbon, A.I.; Rocha, C.; Ribeiro, C.; Maia, J.M.; Gonçalves, M.P.; Teixeira, J.A.; Vicente, A.A. Rheological characterization of κ-carrageenan/galactomannan and xanthan/galactomannan gels: Comparison of galactomannans from non-traditional sources with conventional galactomannans. Carbohydr. Polym. 2011, 83, 392–399. [Google Scholar] [CrossRef]
- Thaiudom, S.; Goff, H.D. Effect of κ-carrageenan on milk protein polysaccharide mixtures. Int. Dairy J. 2003, 13, 763–771. [Google Scholar] [CrossRef]
- Khouryieh, H.A.; Herald, T.J.; Aramouni, F.; Alavi, S. Intrinsic viscosity and viscoelastic properties of xanthan/guar mixtures in dilute solutions: Effect of salt concentration on the polymer interactions. Food Res. Int. 2007, 40, 883–893. [Google Scholar] [CrossRef]
- Dunstan, D.E.; Chen, Y.; Liao, M.-L.; Salvatore, R.; Boger, D.V.; Prica, M. Structure and rheology of the κ-carrageenan/locust bean gum gels. Food Hydrocoll. 2001, 15, 475–484. [Google Scholar] [CrossRef]
- Renard, D.; van de Velde, F.; Visschers, R.W. The gap between food gel structure, texture and perception. Food Hydrocoll. 2006, 20, 423–431. [Google Scholar] [CrossRef]
- Çakir, E.; Foegeding, E.A. Combining protein micro-phase separation and protein-polysaccharide segregative phase separation to produce gel structures. Food Hydrocoll. 2011, 25, 1538–1546. [Google Scholar] [CrossRef]
- Cavallieri, A.L.F.; Cunha, R.L. Cold-set whey protein gels with addition of polysaccharides. Food Biophys. 2009, 4, 94–105. [Google Scholar] [CrossRef]
- Benichou, A.; Aserin, A.; Garti, N. W/O/W double emulsions stabilized with WPI–polysaccharide complexes. Colloid Surf. A: Physicochem. Eng. Asp. 2007, 294, 20–32. [Google Scholar] [CrossRef]
- Tavares, C.; Lopes da Silva, J.A.L. Rheology of galactomannan–whey protein mixed systems. Int. Dairy J. 2003, 13, 699–706. [Google Scholar] [CrossRef]
- Le, X.T.; Turgeon, S.L. Textural and water binding behaviors of β-lactoglobulin-xanthan gum electrostatic hydrogels in relation to their microstructure. Food Hydrocoll. 2015, 49, 216–223. [Google Scholar] [CrossRef]
- Dickinson, E. Hydrocolloids at interfaces and the influence on the properties of dispersed systems. Review Article. Food Hydrocoll. 2003, 17, 25–40. [Google Scholar] [CrossRef]
- Stone, A.K.; Nickerson, M.T. Formation and functionality of whey protein isolate- (kappa-, iota-, and lambda-type) carrageenan electrostatic complexes. Food Hydrocoll. 2012, 27, 271–277. [Google Scholar] [CrossRef]
- Gu, Y.S.; Decker, E.A.; McClements, D.J. Influence of pH and carrageenan type on properties of β-lactoglobulin stabilized oil-in-water emulsions. Food Hydrocoll. 2005, 19(1), 83–91. [Google Scholar] [CrossRef]
- Çakir, E.; Khan, S.A.; Foegeding, E.A. The effect of pH on gel structures produced using protein-polysaccharide phase separation and network inversion. Int. Dairy J. 2012, 27, 99–102. [Google Scholar] [CrossRef]
- IDF Standard 4, Cheese and processed cheese. Determination of total solid content (reference method); International Dairy Federation: Brussels; 2004.
- ISO Standard 3433, Cheese - Determination of fat content - Van Gulik method. ISO: Geneva; 2008.
- AOAC Official methods of analysis. , 17th ed.Association of Official Analytical Chemists: Washington DC, USA, 2005.
- Kindstedt, P.S.; Fox, P.F. Modified Gerber test for free oil in melted mozzarella cheese. J. Food Sci. 1991, 56(4), 1115–1116. [Google Scholar] [CrossRef]
- Bourne, M.C.; Comstock, S.H. Effect of degree of compression on texture profile parameters. J. Texture Stud. 1981, 12, 201–216. [Google Scholar] [CrossRef]
- ISO Standard 8586, Sensory analysis -- General guidelines for the selection, training and monitoring of selected assessors and expert sensory assessors. ISO: Geneva; 2012.
- Rousseau, B. Sensory evaluation techniques. In Handbook of Food Analysis: Physical Characterization and Nutrient Analysis, Vol. 1, 2nd ed.; L.M.L. Nollet, Ed.; Marcel Dekker Inc.: New York, USA, 2004; pp. 21–38. [Google Scholar] [CrossRef]
- Bianchi, A.D.; Mallmann, S.; Gazoni, I.; Cavalheiro, D.; Rigo, E. Effect of acid casein freezing on the industrial production of processed cheese. Int. Dairy J. 2021, 118, 105043. [Google Scholar] [CrossRef]
- Scarso, S.; McParland, S.; Visentin, G.; Berry, D.P.; McDermott, A.; De Marchi, M. Genetic and nongenetic factors associated with milk color in dairy cows. J. Dairy Sci. 2017, 100, 7345–7361. [Google Scholar] [CrossRef]
- Paul-Sadhu, S. Impact of low refrigeration temperature on colour of milk. Acta Aliment. 2016, 45(3), 390–397. [Google Scholar] [CrossRef]
- Kristiansen, D.; Hansen, E.; Arndal, A.; Appelgren Trinderup, R.; Skibsted, L.H. Influence of light and temperature on the colour and oxidative stability of processed cheese. Int. Dairy J. 2001, 11, 837–843. [Google Scholar] [CrossRef]
- Dissanayake, M.; Kelly, A.L.; Vasiljevic, T. Gelling properties of microparticulated whey proteins. J. Agric. Food Chem. 2010, 58, 6825–6832. [Google Scholar] [CrossRef]
- Cunha, C.R.; Dias, A.I.; Viotto, W.H. Microstructure, texture, colour and sensory evaluation of a spreadable processed cheese analogue made with vegetable fat. Food Res. Int. 2010, 43, 723–729. [Google Scholar] [CrossRef]
- Rowney, M.; Roupas, P.; Hickey, M.W.; Everett, D.W. Factors affecting the functionality of mozzarella cheese. Aust. J. Dairy Technol. 1999, 54, 94–102. [Google Scholar] [CrossRef]
- Dickinson, E. Emulsion gels: The structuring of soft solids with protein-stabilized oil droplets. Review Article. Food Hydrocoll. 2012, 28, 224–241. [Google Scholar] [CrossRef]
- Thomareis, A.S.; Hardy, J. Evolution de la chaleur spécifique apparente des fromages fondus entre 40 et 100°C. Influence de leur composition. J. Food Eng. 1985, 4, 117–134. [Google Scholar] [CrossRef]
- Ye, A.; Hemar, Y.; Singh, H. Influence of polysaccharides on the rate of coalescence in oil-in-water emulsions formed with highly hydrolyzed whey proteins. J. Agric. Food Chem. 2004, 52, 5491–5498. [Google Scholar] [CrossRef]
- Khouryieh, H.A.; Puli, G.; Williams, K.; Aramouni, F. Effects of xanthan–locust bean gum mixtures on the physicochemical properties and oxidative stability of whey protein stabilised oil-in-water emulsions. Food Chem. 2015, 167, 340–348. [Google Scholar] [CrossRef]
- Copetti, G.; Grassi, M.; Lapasin, R.; Pricl, S. Synergistic gelation of xanthan gum with locust bean gum: a rheological investigation. Glycoconjugate J. 1997, 14, 951–961. [Google Scholar] [CrossRef]
- Murayama, A.; Ichikawa, Y.; Kawabata, A. Rheological properties of mixed gels of κ-carrageenan with galactomannans. Biosci. Biotech. Biochem. 1995, 59(1), 5–10. [Google Scholar] [CrossRef]
- Patel, A.R.; Dumlu, P.; Vermeir, L.; Lewille, B.; Lesaffer, A.; Dewettinck, K. Rheological characterization of gel-in-oil-in-gel type structured emulsions. Food Hydrocoll. 2015, 46, 84–92. [Google Scholar] [CrossRef]
- Paderes, M.; Ahirwal, D.; Pieto, S.F. Natural and synthetic polymers in fabric and home care applications. Phys. Sci. Rev. 2017, 20170021. [Google Scholar] [CrossRef]
- Dimitreli, G.; Thomareis, A.S. Texture evaluation of block-type processed cheese as a function of chemical composition and in relation to its apparent viscosity. J. Food Eng. 2007, 79, 1364–1373. [Google Scholar] [CrossRef]
- Brummel, S.E.; Lee, K. Soluble hydrocolloids enable fat reduction in process cheese spreads. J. Food Sci. 1990, 55, 1290–1307. [Google Scholar] [CrossRef]
- Jana, A.H.; Patel, H.G.; Pinto, S.; Prajapati, J.P. Quality of casein based Mozzarella cheese analogue as affected by stabilizer blends. J. Food Sci. Technol. 2010, 47(2), 240–242. [Google Scholar] [CrossRef]
- Totosaus, A.; Guerrero, I.; Montejano, J.G. Effect of added salt on textural properties of heat-induced gels made from gum–protein mixtures. J. Texture Stud. 2005, 36, 78–92. [Google Scholar] [CrossRef]
- Lu, Y.; Shirashoji, N.; Lucey, J.A. Rheological, textural and melting properties of commercial samples of some of the different types of pasteurized processed cheese. Int. J. Dairy Tech. 2007, 60(2), 74–80. [Google Scholar] [CrossRef]
Figure 1.
Free oil of PWC samples expressed as percentage (w/w) in sample (X: xanthan gum, G: guar gum, L: LBG, C: κ-carrageenan). Interval bars denote pooled standard deviation (means of three replications and 95% confidence level).
Figure 1.
Free oil of PWC samples expressed as percentage (w/w) in sample (X: xanthan gum, G: guar gum, L: LBG, C: κ-carrageenan). Interval bars denote pooled standard deviation (means of three replications and 95% confidence level).
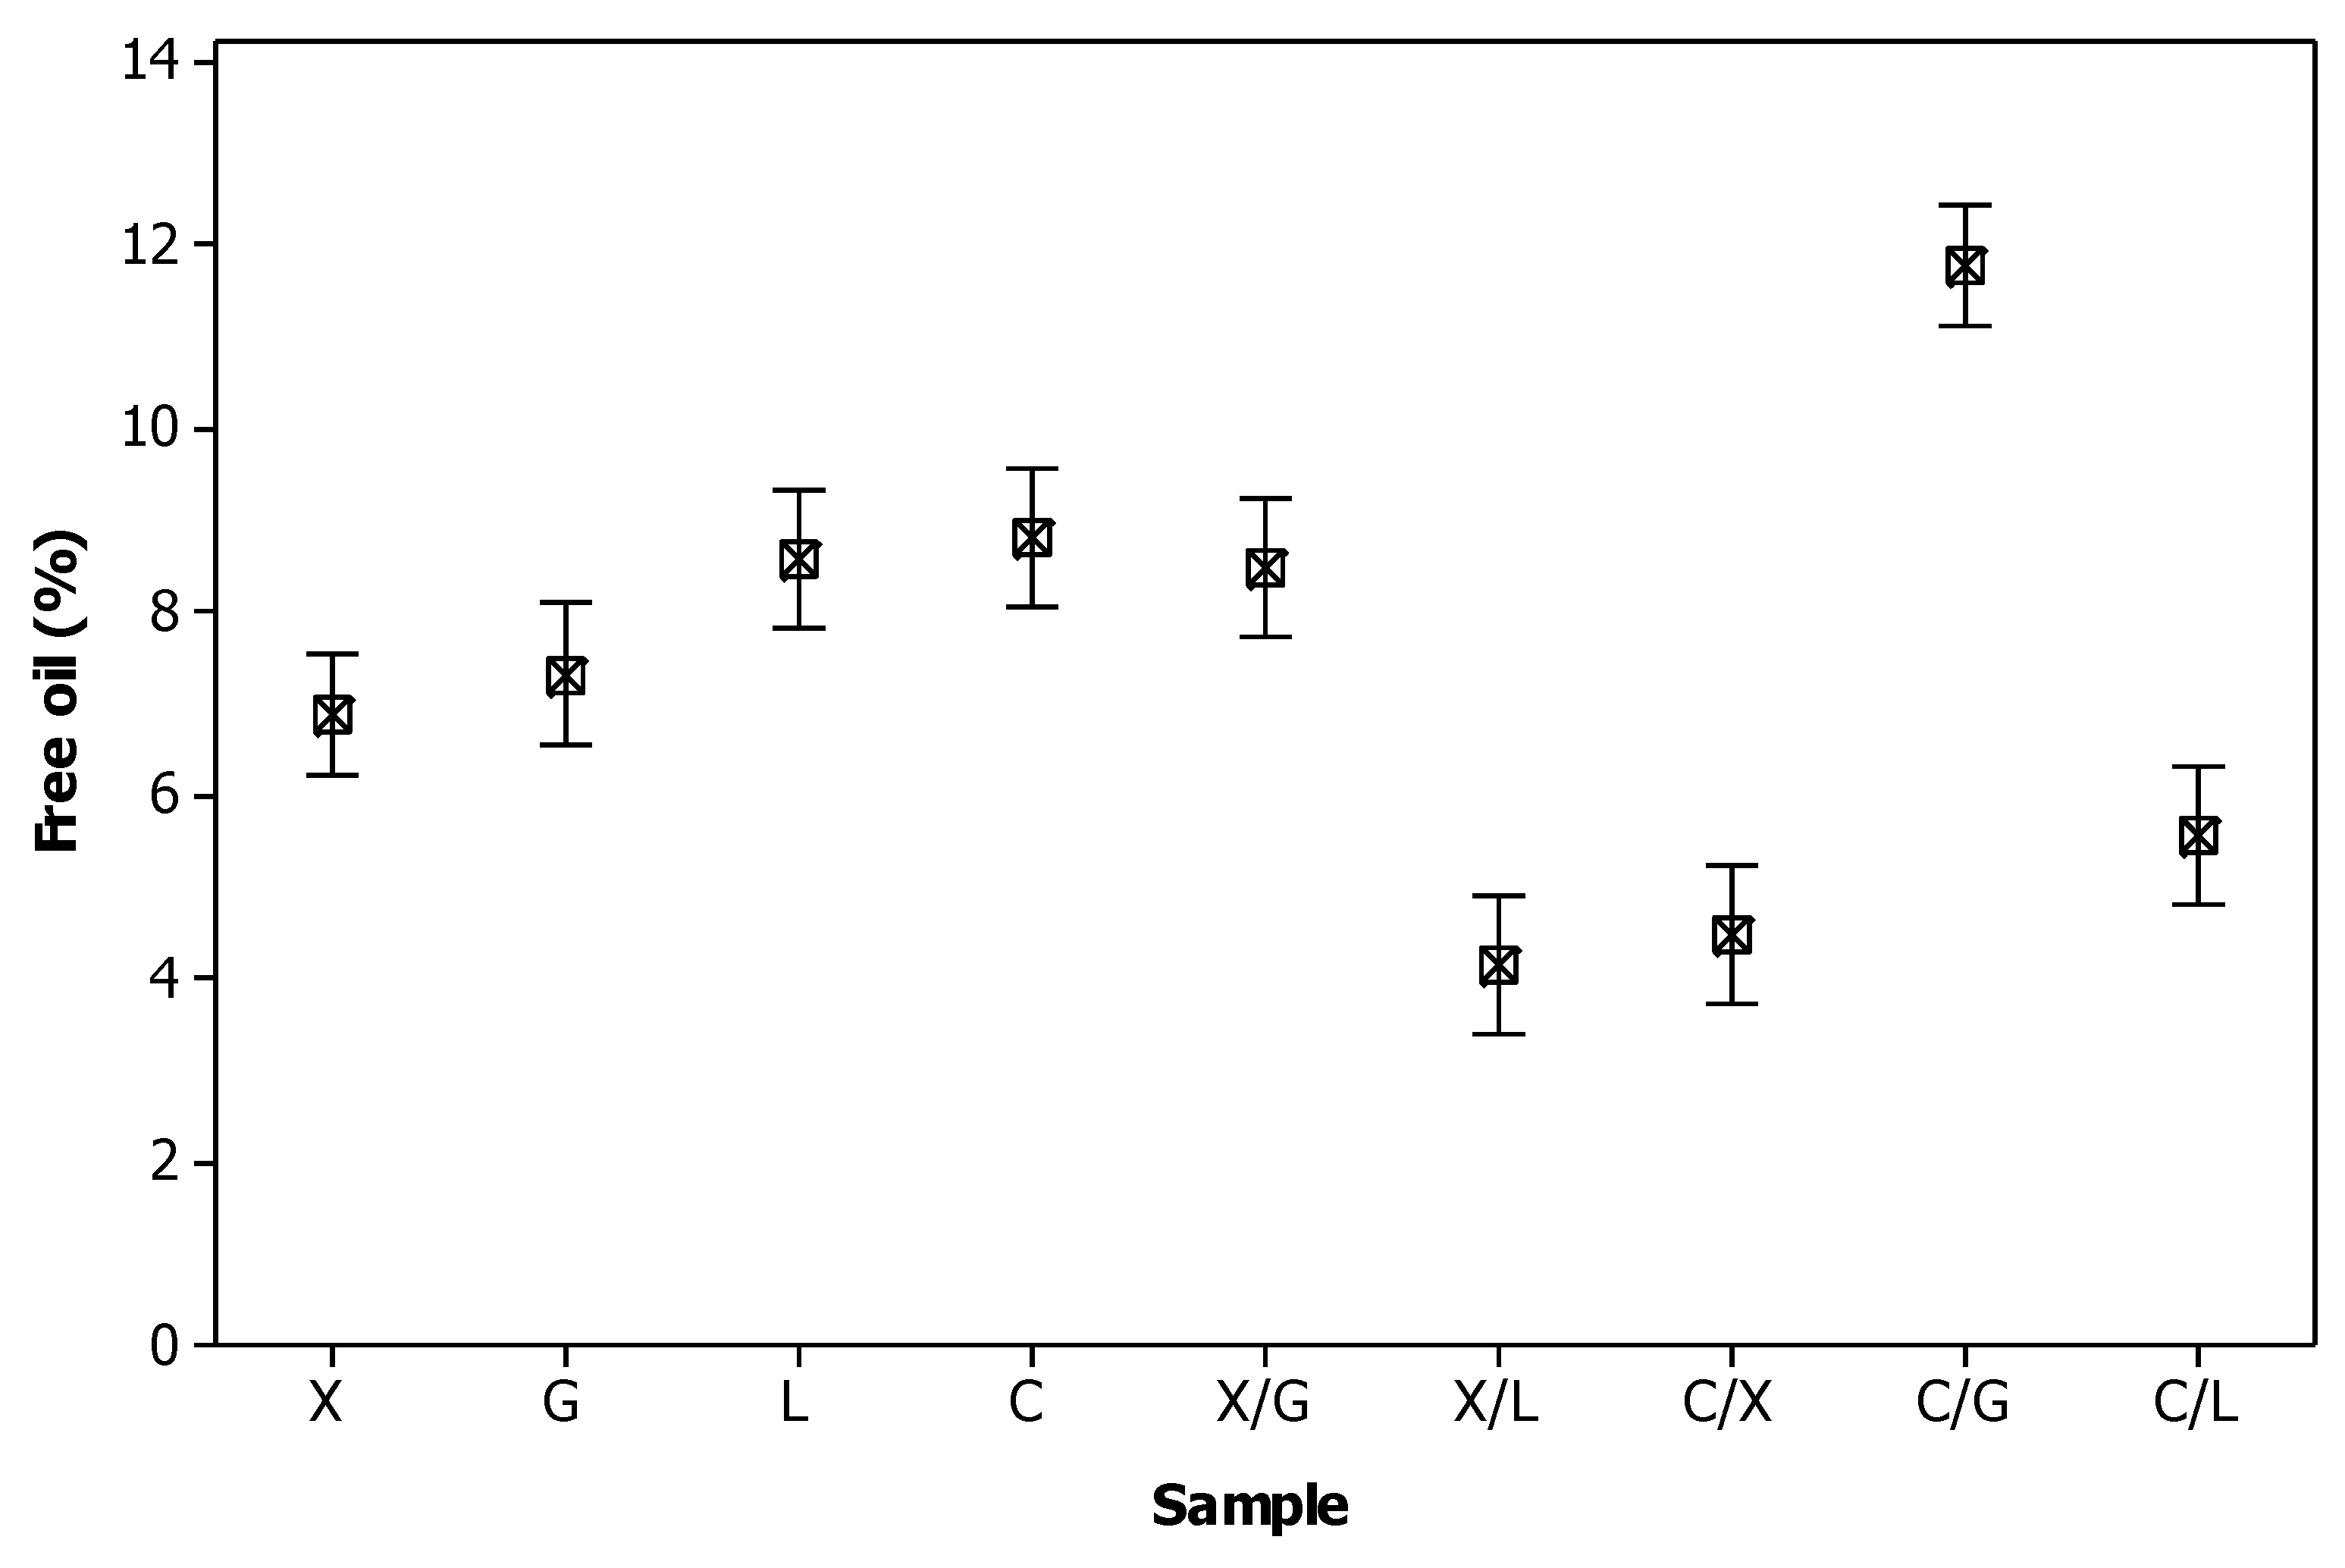
Figure 2.
Typical texture profile analysis curves (80% deformation, 20 mm/min compression speed) of PWC a) sample X (without fracture point) and b) sample C (with fracture point). The two consecutive cycles of compression–decompression are shown.
Figure 2.
Typical texture profile analysis curves (80% deformation, 20 mm/min compression speed) of PWC a) sample X (without fracture point) and b) sample C (with fracture point). The two consecutive cycles of compression–decompression are shown.
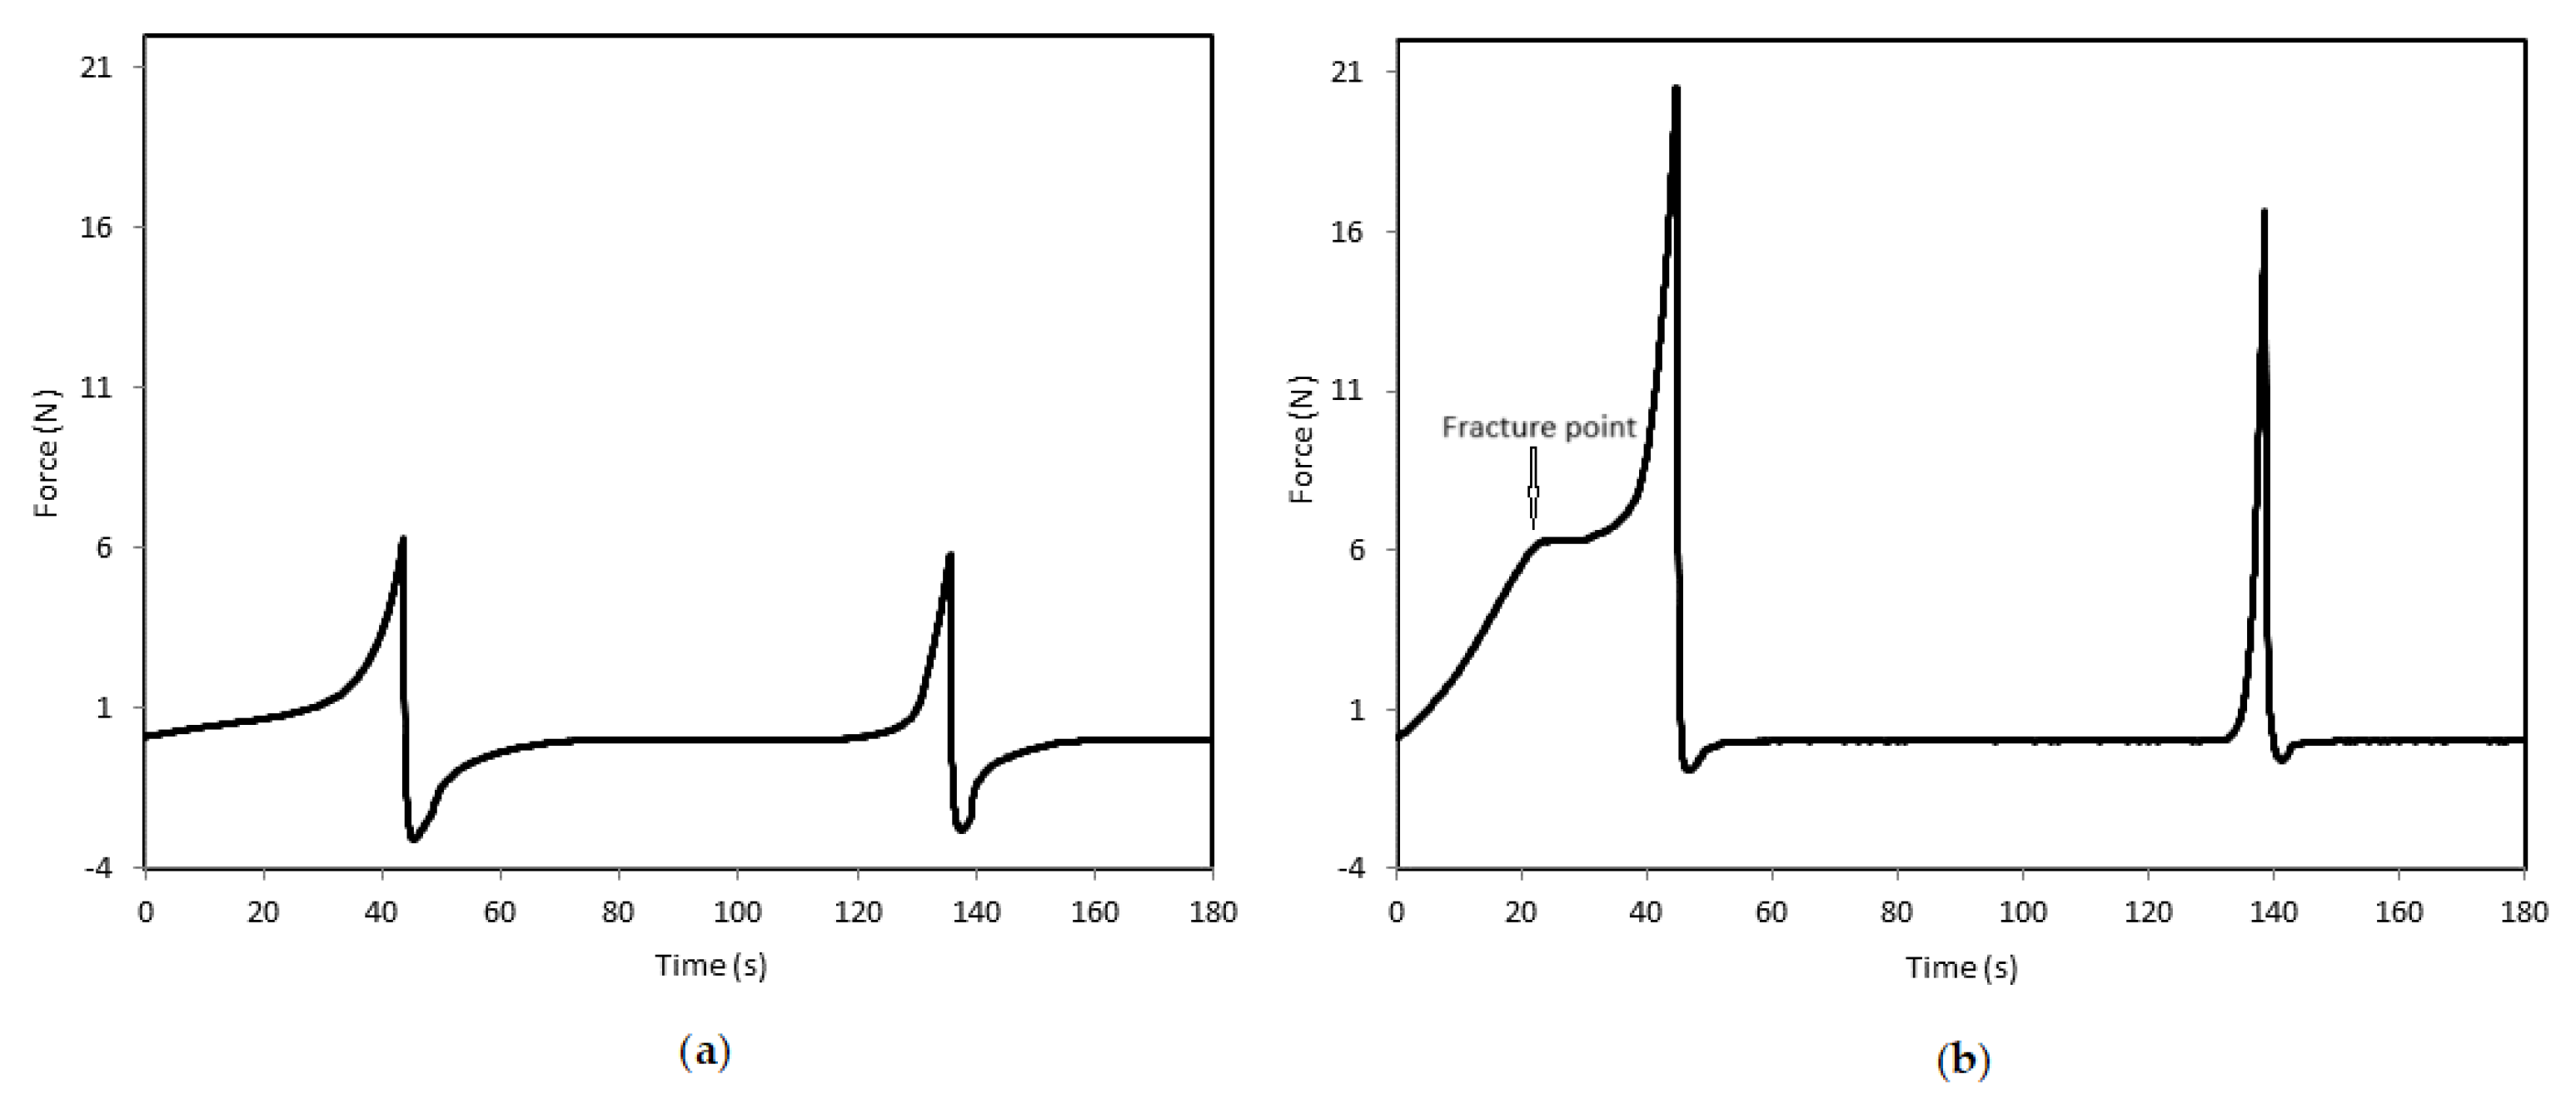

Table 1.
Chemical composition of PWC samples containing different polysaccharides.
| Component | Content1 (% w/w) |
|---|---|
| Moisture | 55.93 ± 0.45 |
| Protein | 12.35 ± 0.12 |
| Fat Fat in dry matter |
25.50 ± 0.10 57.86 ± 0.55 |
| Ash | 1.65 ± 0.23 |
| NaCl | 1.04 ± 0.08 |
1 Mean values of 27 determinations ± standard deviation.
Table 2.
Color parameters1 of PWC samples.
| Sample | Lightness, L* | Parameter a* | Parameter b* |
|---|---|---|---|
| X | 90.7 ± 0.3b 2 | –1.1 ± 0.3a | 6.3 ± 0.7d |
| G | 91.8 ± 0.3a | –1.3 ± 0.2ab | 6.2 ± 0.1d |
| L | 90.9 ± 0.7b | –1.6 ± 0.3bc | 6.4 ± 0.1c |
| C | 90.2 ± 0.3c | –1.5 ± 0.2bc | 7.1 ± 0.1 a |
| X/G | 91.4 ± 0.3a | –1.6 ± 0.3bc | 6.8 ± 0.2b |
| X/L | 91.6 ± 0.4a | –1.7 ± 0.3c | 6.8 ± 0.2b |
| C/X | 91.6 ± 0.3a | –1.3 ± 0.2ab | 6.6 ± 0.2c |
| C/G | 90.9 ± 0.4b | –1.7 ± 0.2c | 7.2 ± 0.2a |
| C/L | 90.6 ± 0.5b | –1.6 ± 0.3bc | 7.1 ± 0.3a |
X: xanthan gum, G: guar gum, L: LBG, C: κ-carrageenan. 1 Mean values of nine replications ± standard deviation. 2 Means within a column with different superscripts differ significantly (P<0.05).
Table 3.
Textural properties1 of PWC samples obtained by texture profile analysis.
| Textural Property | Sample | ||||||||
|---|---|---|---|---|---|---|---|---|---|
| X | G | L | C | X/G | X/L | C/X | C/G | C/L | |
| B (N) | - | - | - | 4.56 ± 1.30c | - | 5.85 ± 1.58b | - | 3.19 ± 0.78d | 10.26 ± 1.67a |
| H1 (N) | 6.99 ± 1.70g 2 | 11.03 ± 0.41ef | 8.87 ± 0.68fg | 25.64 ± 2.40b | 12.11 ± 0.36e | 22.21 ± 2.51c | 11.04 ± 1.67ef | 16.33 ± 1.72d | 31.71 ± 1.76a |
| H2 (N) | 6.38 ± 1.53f | 10.47 ± 0.33d | 8.34 ± 0.65e | 18.86 ± 1.07b | 11.06 ± 0.35d | 17.90 ± 1.53b | 10.08 ± 1.27d | 13.44 ± 1.15c | 23.10 ± 1.38a |
| A1 (mJ) | 22.33 ± 4.41e | 34.50 ± 2.26de | 28.33 ± 2.50de | 101.97 ± 22.34b | 46.83 ± 2.14d | 94.83 ± 18.86b | 44.00 ± 10.86d | 73.00 ± 12.18c | 154.67 ± 14.35a |
| A2 (mJ) | 10.83 ± 3.13c | 9.67 ± 1.03cd | 8.83 ± 2.14cd | 13.67 ± 2.73b | 8.33 ± 0.82cd | 10.83 ± 2.31c | 6.17 ± 0.41e | 9.49 ± 1.27cd | 16.83 ± 1.17a |
| A2/A1 (-) | 0.48 ± 0.01a | 0.28 ± 0.01b | 0.31 ± 0.07b | 0.13 ± 0.02cd | 0.18 ± 0.02c | 0.12 ± 0.04cd | 0.15 ± 0.03cd | 0.13 ± 0.01cd | 0.11 ± 0.01d |
| A3 (mJ) | 12.00 ± 3.16a | 7.67 ± 1.03b | 8.00 ± 2.68b | 3.50 ± 0.56cd | 5.17 ± 0.75c | 1.50 ± 0.55d | 4.00 ± 0.89cd | 2.67 ± 0.52cd | 1.00 ± 0.01d |
| S1 (mm) | 16.12 ± 2.17a | 5.78 ± 1.03cd | 8.54 ± 0.86b | 6.88 ± 1.23bc | 5.07 ± 0.71cd | 6.28 ± 1.69c | 3.93 ± 0.50d | 5.14 ± 1.42cd | 8.32 ± 0.60b |
| S2 (mm) | 16.44 ± 2.12a | 8.41 ± 1.39d | 14.09 ± 2.83b | 10.98 ± 3.02c | 6.89 ± 1.16d | 6.74 ± 1.95d | 5.15 ± 0.90d | 7.73 ± 2.04d | 7.62 ± 0.88d |
| G (N) | 3.41 ± 1.07a | 3.04 ± 0.36ab | 2.82 ± 0.75b | 3.35 ± 0.49a | 2.12 ± 0.18cd | 2.33 ± 0.33bcd | 1.58 ± 0.20d | 1.58 ± 0.18d | 3.45 ± 0.15a |
X: xanthan gum, G: guar gum, L: LBG, C: κ-carrageenan. Β: Brittleness, H1: Hardness 1, H2: Hardness 2, A1: Compression work 1, A2: Compression work 2, A2/A1: Cohesiveness, A3: Adhesiveness, S1: Springiness, S2: Stringiness, G: Gumminess. 1 Mean values of six replications ± standard deviation. 2 Means within a row with different superscripts differ significantly (P<0.05).
Table 4.
Panelists’ scores on the intensity of sensory characteristics and acceptability of PWC samples (9-point scales).
Table 4.
Panelists’ scores on the intensity of sensory characteristics and acceptability of PWC samples (9-point scales).
| Intensity rating test1 | Hedonic rating test2 | |||||
|---|---|---|---|---|---|---|
| Sample | Yellow color | Fattiness | Stickiness | Aroma-flavor acceptability | Texture acceptability | Overall acceptability |
| X | 2.43 ± 0.64e 3 | 7.37 ± 0.82ab | 6.80 ± 0.80a | 6.33 ± 1.21ab | 7.02 ± 0.78a | 6.23 ± 1.57ab |
| G | 3.00 ± 0.71de | 5.98 ± 0.69bc | 7.67 ± 0.57a | 6.87 ± 0.76a | 8.42 ± 0.49a | 8.20± 0.63a |
| L | 3.47 ± 0.69cd | 8.10 ± 0.75a | 7.92 ± 0.84a | 6.98 ± 1.18a | 6.58 ± 0.99a | 7.05 ± 1.02a |
| C | 4.88 ± 0.48b | 4.55 ± 0.69cd | 4.62± 0.55b | 3.42 ± 1.49c | 2.70 ± 1.19c | 2.23 ± 0.96c |
| X/G | 4.00 ± 0.52c | 8.05 ± 0.67a | 8.07 ± 0.67a | 6.73 ± 0.94a | 7.78 ± 0.58a | 7.53 ± 0.77a |
| X/L | 3.65 ± 0.48cd | 3.35 ± 1.77de | 2.43 ± 1.41c | 3.30 ± 1.22c | 0.77 ± 0.50d | 1.07 ± 0.38c |
| C/X | 2.95 ± 0.29de | 4.73 ± 2.15cd | 4.85 ± 1.63b | 4.75 ± 1.02bc | 4.83 ± 2.04b | 4.65 ± 2.48b |
| C/G | 5.62 ± 0.53a | 4.05 ± 2.28cde | 4.10 ± 0.93b | 5.73 ± 1.26ab | 3.57 ± 2.18bc | 4.87 ± 1.19b |
| C/L | 6.10 ± 0.68a | 2.18 ± 1.18e | 2.05 ± 1.10c | 3.98 ± 0.88c | 2.63 ± 1.63c | 2.35 ± 0.63c |
1 Mean values of six replications ± standard deviation 2 Mean values of twenty four replications ± standard deviation 3 Means within a column with different superscripts differ significantly (P<0.05).
Disclaimer/Publisher’s Note: The statements, opinions and data contained in all publications are solely those of the individual author(s) and contributor(s) and not of MDPI and/or the editor(s). MDPI and/or the editor(s) disclaim responsibility for any injury to people or property resulting from any ideas, methods, instructions or products referred to in the content. |
© 2024 by the authors. Licensee MDPI, Basel, Switzerland. This article is an open access article distributed under the terms and conditions of the Creative Commons Attribution (CC BY) license (https://creativecommons.org/licenses/by/4.0/).
Copyright: This open access article is published under a Creative Commons CC BY 4.0 license, which permit the free download, distribution, and reuse, provided that the author and preprint are cited in any reuse.


