Submitted:
20 October 2025
Posted:
22 October 2025
You are already at the latest version
Abstract
Sorghum flour was milled and fractionated into three particle-size classes A (181–215 µm), B (96–181 µm), and C (<96 µm) then blended with wheat flour at a 30:70 (sorghum: wheat) ratio. Composite flours were evaluated for physicochemical properties, dough rheology, and noodle quality. Particle size significantly affected pasting, farinograph, and thermal behavior. The blend prepared with the finest fraction (WC) exhibited the greatest thermal stability, with onset (Tₒ) 58.84 °C, peak (Tₚ) 64.52 °C, and conclusion (Tc) 69.38 °C, whereas the highest enthalpy of gelatinization (ΔH) occurred in the wheat control 6.62 (J/g). The particle size significantly altered the T23, A21, A22 and A23 of the dough. Where the decreasing trend with decreasing particle size in A21 19.02%, 18.15%, 17.28% and 16.99% for W, WA, WB and WC respectively. Particle size also modulated glutenin macropolymer (GMP) content and protein secondary structure in dough sheets. Noodle performance improved with decreasing particle size, finer composites showed greater water absorption and lower cooking loss, and WC noodles achieved the highest acceptability among composites, second only to W. Texture profile analysis corroborated these trends, hardness and cohesiveness were highest for W, followed by WC, WB, and WA, respectively. Overall, reducing sorghum particle size enhanced the functional quality of sorghum–wheat composites, improving dough structure, thermal stability, and noodle performance while maintaining desirable textural attributes.
Keywords:
combined flour
; dough sheet
; particle size
; rheological property
; sorghum
; sorghum flour
1. Introduction
Nowadays, consumer preferences have shifted towards food products that not only taste good, but also offer nutritional benefits and additional health advantages [1]. Local food commodities have a high potential for optimization as they often possess abundant resources and contain functional compounds beneficial to health. For instance, incorporating moringa leaves and Chinese tea into bread [1] and noodle [2] formulations can significantly enhance their nutritional profiles by increasing antioxidant compounds, minerals, proteins, insoluble fibers and soluble dietary fiber contents. Additionally, the alterations induced by these components can enhance flavor quality, thereby contributing to greater consumer acceptability.
Noodles are a widely favored staple food across numerous countries and represent a popular carbohydrate choice with favorable sensory attributes and convenient preparation methods, contributing to their widespread popularity globally. Traditionally developed from wheat, noodles are known for their velvety, tender, and flexible texture [3]. However, research has delved into alternative noodle ingredients beyond wheat, incorporating indigenous resources such as pumpkin and breadfruit [4], rice flour, Jabuticaba peel flour, and chickpeas to enhance their functional properties [5,6]. A prior research study examined the sensory and physical characteristics of noodles produced using sorghum, mung bean, and sago starch. The study revealed that these food materials contributed to enhanced functional properties due to their elevated fiber and resistant starch levels, contributed to enhanced functional properties. Notably, the noodle with a composition ratio of 20% sorghum, 30% mung bean, and 50% sago exhibited texture characteristics like those of wheat noodles and demonstrated the highest texture quality among the tested variants [7].
The coarse nature of sorghum flour, antinutritional factors, and high fiber content can negatively impact the end product's structure and sensory appeal, leading to reduced customer acceptance [8]. The production of foods enriched with sorghum flour remains challenging, and further research is needed to enhance their quality. Owing to the absence of gluten, sorghum-based products often exhibit poor appearance and lack structural integrity. Therefore, it is important to enhance the pre-treatment of sorghum flour. Previous studies have underscored the critical role of flour particle size in modulating dough rheology, influencing physicochemical characteristics, and ultimately determining the overall quality of the final product [9,10]. Numerous studies have focused on the relationship between particle size and its influence on the quality of wheat flour dough [10,11,12] . Some of these studies have concentrated on ultrafine bran grinding and its implications on dough characteristics and the excellence of steamed bread [9]. Moreover, studies have established that flour particle size exerts a significant impact on the baking performance of bread formulated from pulse flours. The findings revealed that breads produced using finer pulse flours received higher quality ratings and exhibited a more compact and uniform crumb structure [13]. This finding is consistent with a substantial body of research demonstrating the beneficial influences of particle size reduction on the quality attributes of various food products, including Asian noodles, crackers, and flatbreads. The accumulated evidence underscores the critical role of particle size control in improving overall product quality and textural characteristics in a wide range of cereal- and flour-based food applications [14,15]. The influence of whole wheat flour particle size has been extensively examined both within China and internationally [16]. Evidence suggests that reducing the particle size of whole wheat flour can enhance the quality of steamed bread [17]. Additionally, Wang et al. [18] observed that while a finer median diameter of bran particles (ranging from 90 to 96μm) had little impact on gluten development, however it led to a highly favorable quality in whole-wheat crackers produced using this flour.
The existing knowledge of how sorghum flour particle size influences product quality is limited, with only a few studies exploring this aspect. Therefore, progress in developing sorghum flour products has been constrained. To bridge this knowledge gap, sorghum flour with three distinct particle sizes was combined with wheat flour. The findings provide valuable insights that can be leveraged to enhance the quality of functional foods containing sorghum flour. This study contributes to broadening comprehension of the connection between particle size of sorghum flour and product attributes, thereby aiding the advancement of sorghum-based food products.
2. Materials and Methods
2.1. Raw Material and Preparation of Sorghum Flour
Wheat and red sorghum flours were procured from Zhengzhou Wantian Biotechnology Co., Ltd., China. All other chemicals employed in the study were of analytical grade or the highest available purity. To obtain sorghum flour with distinct particle sizes, the following methodology was adopted: an experimental mill (MLU-202, Wuxi Buhler Machinery Manufacturing Co., Ltd., China) was used. Different sieves were used to obtain three sorghum flour fractions. A fraction 181-215 µm (average 114 µm), B fraction 96-181µm (average 91 µm), C fraction <96 µm (average 39 µm). A laser particle size analyzer (Mastersizer 2000, Malvern) was used to estimate the particle size distribution and comparable diameters at cumulative volumes of 10% (D10), 50% (D50) and 97% (D97). To make the composite sorghum-wheat flour, 30% of the wheat flour was replaced with sorghum flour (g sorghum flour/100 g combined flour). The combined flours made from sorghum flour with the A fraction, B fraction and C fraction particle sizes were named as WA, WB and WC respectively; the flour sample without sorghum flour was the control group, which was indicated as W.
2.2. Chemical Composition and Determination of Damaged Starch (DS)
2.3. Pasting Properties
Pasting profile measurements were conducted using a Rapid Visco-analyzer (Perten, Sweden). A 3.5 g flour sample, adjusted for its moisture content, was dispersed in 25.00 g of deionized water. The mixture was manually agitated by moving a paddle up and down 7 times. Subsequently, it subjected a standardized heating-cooling cycle: held at 50°C for 1 min, heated to 95°C in 3.7 min, maintained at 95°C for 2.5 min, cooled to 50°C in 3.8 min, and held at 50°C for 2 min.
2.4. Thermal Property
The thermal characteristics of the specimens were analyzed using a differential scanning calorimeter (DSC 1, Mettler-Toledo, Schwerzenbach, Switzerland) following the methodology outlined by Bodjrenou et al. [21] with slight changes. For calibration, indium was used as the standard. Each product sample (approximately 3 mg, db) along with 6 mg of distilled water was deposited into a stainless-steel pan, sealed hermetically, and stored at 4 °C for 24 hours. To detect any remaining enthalpy gelatinization peaks, the samples were heated from 20 °C to 120 °C at a rate of 10 °C/min. Subsequently, the endothermic enthalpy (ΔH), onset temperature (To), peak temperature (Tp), and conclusion temperature (Tc) were computed.
2.5. Farinograph Test
The dough's mixing characteristics were analyzed using a Farinograph instrument (Brabender, Duisburg, Germany) with a 50 g stainless steel vessel. The flour samples were precisely weighed and placed into the designated mixing bowls of the Farinograph. Water was methodically added from a burette to the flour, and the mixture was kneaded to form dough. At the same time, the Farinograph meticulously recorded a graph. The farinograph simultaneously charted a graphical curve on the computer monitor connected to the device throughout the mixing process. Key parameters assessed in this study included stability, water absorption, softening degree and dough development time.
2.6. Preparation of Dough Sheet and Noodle
Dough sheets were made following the methodology outlined in prior research [22] with slight adaptations. In summary, the dough was created by blending 100 g of composite flour, 1 g of salt, and water in a pin mixer HMZ200 (East Fude Technology Development Center, Beijing, China), followed by a period of resting. The dough was hand-pressed into a wooden mold to reduce the likelihood of dropping and then passed through the laboratory noodle machine (JMTD-168/140, Dongfang Fude Technology Development Center, Beijing, China) with gradually narrowing gaps. The noodle strands, measuring 3 mm in width and 60 cm in length, were cut using specialized blades and subsequently placed in a drying chamber (Tengwei Co., Ltd, Beijing, China) to produce dried noodles for subsequent analytical evaluations. Some dough sheets were examined for rheological and water distribution characteristics, while others were prepared for remaining tests after undergoing freezing, drying, grinding, and sieving.
2.7. Scanning Electron Microscopy (SEM) of Dough Sheet
The specimens destined for scanning electron microscopy (SEM) examination underwent preparation by affixing the lyophilized dough sheets onto a circular sample stub. Following this, a gold sputter coating was applied to the specimen, enabling the observation of the fracture surface using a Quanta 250 FEG scanning electron microscope (FEI, Oregon, USA) at an acceleration voltage of 3.0 KV. Detailed micrographs were captured at a magnification of 15000×.
2.8. Determination of Viscoelastic of Dough
The dynamic rheological characteristics of the dough sheets were evaluated using a Haake RS6000 Rheometer (Thermo Fisher Haake, Germany) equipped with a parallel plate geometry of 35 mm diameter. Following a 5-minute relaxation period to alleviate any residual stress, measurements were conducted while safeguarding the dough's edge with vaseline oil. Dynamic frequency sweep tests were carried out at 0.1% strain, ranging from 10 to 0.1 Hz at 25°C to determine the elastic modulus (G'), viscous modulus (G''), and loss tangent (Tan δ = G' / G''). The power-law model was utilized to analyze the relationship between G' and frequency, aiding in the assessment of inter- or intramolecular interaction strengths:
Here, f represents the frequency, while the parameters z' and k' denote the nature and intensity, respectively, of the molecular interactions within the dough [22].
2.9. Glutenin Macropolymer (GMP) of Dough Sheet
The determination of GMP contents in the composite dough sheets was conducted according to the procedure outlined by M. Song et al. [23] with adjustments. A 1.0 g dough specimen was immersed in a 1.5% SDS solution (20 mL) and subjected to agitation for an hour at room temperature, followed by centrifugation at 13,164 rpm for 15 min. The resulting supernatant was decanted, and the residue was reconstituted in SDS solution, undergoing subsequent extraction and centrifugation as detailed earlier. The remaining residue was collected for protein content assessment utilizing the Kjeldahl method, representing the GMP content.
2.10. Low-Field Nuclear Magnetic Resonance (LF-NMR) of Dough Sheet
Water distribution within fresh dough sheets was quantified utilizing LF-NMR (VTMR20-010V-T, Suzhou Niumai Analytical Instrument Co., Ltd., Jiangsu, China) featuring a 0.5T permanent magnet corresponding to a proton resonance frequency of 21 MHz at 35 °C. Transverse relaxation times (T2) were examined employing the Carr-Purcell-Meiboom-Gill (CPMG) pulse sequence with specific parameters: spectral width (SW) of 200 kHz, echo time (TE) of 0.100 ms, waiting time (TW) of 1500 ms, scanning number (NS) of 64, and echo count (NECH) of 3000. Each sample underwent triplicate measurements.
2.11. Secondary Structure Analysis of Dough Sheet
The freeze-dried specimen (1 mg) was mixed with potassium bromide and ground. Fourier transform infrared Spectroscopy was used for determining the secondary structures (Bruker, Saarbrucken, Germany). 64 scans were performed at a resolution of 4 cm−1 within the range of 400–4000 cm−1. The spectra were analyzed utilizing OMNIC software [24].
2.12. Cooking Properties of Noodles
The optimum cooking time (OCT) for a 10 g, 20 cm noodle sample was determined by boiling it in 400 mL of water until the central white core vanished upon being pressed between glass plates. Based on the method of F. Xu et al [25], cooking yield was quantified by boiling a 10-strand noodle sample in 400 mL of water for its optimum cooking time, followed by rinsing and draining. The yield was then calculated from the weight gained after cooking via equation 2. Cooking loss was measured by boiling a 20 g noodle sample and collecting the combined cooking and rinsing water, which was then volumetrically adjusted to 500 mL. A precise 100 mL aliquot of this solution was evaporated and dried to a constant weight at 105°C to isolate the leached solids. The mass of this residue was used to calculate the rate of dry matter loss during the cooking process via equation 3.
where WA and WB represent the weight (g) of the noodles after and before cooking, respectively.
where WR is the final mass of the beaker with residue (g), WB is the tare mass of the beaker (g), and WS is the initial noodle mass (g).
2.13. Texture Properties of Noodles
Textural evaluation of cooked noodles was performed using a TA-XT texture analyzer (Stable Micro Systems, UK) in accordance with the protocol established by F. Xu et al [25].
2.14. Morphology Property of Cooked Noodle
The SEM of cooked noodles was performed as described in section 2.7. Representative micrographs were acquired at a nominal magnification of 2000×.
2.15. Sensory Evaluation of Noodles
For sensory evaluation, 20 cooked noodle strips (20 cm long) were selected after a 5-minute resting period, following a slightly modified method adapted from Zainab et al,. [26]. The assessment was conducted in a standardized sensory laboratory at the College of Food Science and Engineering, Henan University of Technology, Zhengzhou, China. Twenty panelists, comprising an equal ratio of male and female teachers and students, were chosen based on their sensory evaluation knowledge and ability to differentiate samples through sensory attributes. Participants, who signed informed consent forms for anonymous use of results, were trained according to ISO 8586:2012 standards. They evaluated odor (0–15), appearance (0–25), palatability (0–35), and taste (0–25) on a 100-point scale, rinsing their mouths between samples and completing assessments within 10 minutes. No ethical approval was required, as the study involved no additives or health risks.
2.16. Data Analysis
Statistical analysis involved the use of analysis of variance with Duncan's multiple comparison tests in SPSS Statistics 25.0 (SPSS Inc., Chicago, USA) software to detect significant differences (p < 0.05). Plots in the article were generated using Origin software (version 2022, OriginLab, USA). All experiments were performed in triplicate and the data was presented as the mean ± standard deviation.
3. Results and Discussion
3.1. Particle Size and Chemical Composition of the Flours
Table 1 shows the particle size distribution of size and average particle diameters for sorghum flours. This study’s findings should be interpreted with caution due to the relatively small sample size. The coarse, fine, and very fine sorghum flour and wheat flour particle size differences, were assessed in terms of D (10 µm), D (50 µm), and D (97µm). The D (97μm) value for coarse sorghum flour was approximately 215.45 μm, significantly surpassing that of wheat flour (164.55 μm), fine sorghum flour (181.07 μm), and very fine sorghum flour (96.20 μm). Table 1 also provides the impact of particle size on the physiochemical characteristics of sorghum flour.
Protein, starch, and fat values in sorghum and wheat flour samples differed significantly. Naturally, the values of starch 66.34 %, fat 0.93 % and protein 9.71 % for white wheat flour were the lowest compared to the sorghum flours samples, which recorded higher values. The refining process of wheat flour can strip away most of the beneficial nutrients. Several studies have reported similar findings, indicating that whole sorghum flour contains higher levels of key nutritional components, such as fat and starch compared to wheat flour [8,25,27]. Significant variations were observed in DS values. As particle size decreased, the degree of DS increased markedly by 20.88 %, 24.25 %, and 27.74 % for coarse, fine, and very fine sorghum flour respectively. The WC sample, which had a higher DS level, demonstrated superior adhesive properties compared to the other samples. Consistent with these findings, previous studies have shown that a high DS content can be particularly beneficial in flour-based products such as bread and may also enhance the quality of noodles. Specifically, an optimal level of DS can enhance hydration capacity and farinograph properties, while simultaneously promoting fermentation activity. These improvements collectively contribute to enhanced quality characteristics in bread-making processes [28]. However, an excessively elevated DS level may lead to disproportionate water absorption in the dough and accelerate enzymatic activity. This results in a softer, more viscous dough with diminished structural integrity, ultimately impairing the volume retention of steamed bread or conventional bread [10]. Therefore, the DS content of flour is a critical factor influencing the quality of both the dough and the final wheat-based products. In conclude the flour particle size substantially influences the quality characteristics of noodles by affecting parameters such as water absorption, starch gelatinization, protein network development, and texture. Flour with smaller particle sizes exhibits a higher water absorption rate, resulting in more uniform hydration and the formation of a firm dough, thereby yielding noodles of superior quality. Conversely, larger particles typically lead to inferior results. Particle size is also particularly important in gluten-free food manufacturing; for instance, finely milled sorghum flour with a particle size of approximately 80 µm can closely replicate the textural properties of wheat flour [29].
3.2. Pasting Characteristics of Sorghum-Wheat Composite Flour
In food industry, the examination of pasting attributes holds significant importance as it impacts the ultimate qualities of starch-based food items like noodles. A previous study has shown that the gelatinization degree of most sorghum varieties is higher than that of wheat flour [30]. Table 2 presents the pasting properties of each sample. Peak, trough, final, breakdown, setback, and peak time viscosities all exhibited significant increases as particle size decreased, whereas the pasting temperature remained relatively unchanged. The peak viscosity was 2882 BU, 2092 BU, 2277.50 BU and 2429 BU of W, WA, WB and WC respectively. The finer grinding of sorghum flour particles can indeed enhance the dough's resistance to mixing stress by modifying its water absorption capacity and starch gelatinization behavior. Here’s a detailed discussion of these effects: (1) Increased water absorption; finer particles have a larger surface area per unit volume, which allows for greater interaction with water molecules. (2) Higher hydration capacity; more water is bound to the flour particles, increasing dough consistency and rigidity. (3) Enhanced starch gelatinization; Finer particles influence starch behavior in two key ways: (1) Faster heat transfer; Smaller granules gelatinize more uniformly due to efficient heat penetration during mixing or baking. (2) Increased starch damage; Mechanical grinding can disrupt starch granules, increasing damaged starch content. Damaged starch absorbs more water and is more susceptible to enzymatic hydrolysis, which can alter dough rheology and gas retention. This finding is consistent with the study by Yang et al. [31], which examined the effect of black soybean flour particle size when blended with wheat flour. The improved dough mixing stability observed in formulations containing finely ground sorghum flour can be attributed to the reduced interference of smaller particles with gluten network formation. Similarly, these findings align with the study by Liu et al. [28], which suggests that the increase in flour viscosity is primarily attributed to the water absorption and swelling behavior of damaged starch. Moreover, as the particle size of sorghum flour decreases, its crystalline structure becomes increasingly disrupted, thereby facilitating greater water penetration and enhancing pasting potential [32]. A substantial reduction in the breakdown viscosity of wheat flour was observed, recorded at 676.50 BU, while the WC sample exhibited the highest value at 777 BU. This decrease can be attributed to factors such as incomplete starch structure and diminished swelling volume in wheat flour. Incomplete starch structure refers to starch molecules which have been partially damaged, resulting in shorter or less branched polymers compared to normal starch. These characteristics potentially hinder the process of amylose exudation, ultimately leading to a decrease in the value of breakdown [33].
3.3. Thermal Properties of Sorghum-Wheat Flour
The thermal characteristics of composite sorghum-wheat flour are presented in Table 3. There was no difference between the values of To, Tp and Tc for sorghum-wheat composite flour, However, all three values were notably higher than those recorded for the pure wheat flour. Additionally, the (Tc-To) and ∆H values for wheat flour were greater compared to those of sorghum-wheat combined flour. Peak temperature (Tp) of WC (58.84 °C) was higher than WA and WB (58.68 °C, 58.57 °C) respectively, however, wheat flour sample was a lowest (57.05 °C) that of composite samples (62.68 °C). This indicates that the extent of starch damage did not notably influence the gelatinization temperature. Regardless of the levels of starch damage, the samples exhibited similar gelatinization behavior in terms of temperature. In this investigation, the denaturation peak temperature (Tp) of wheat flour was identified as the lowest at 63.10°C compared to the composite samples. This phenomenon indicates that the existence of gluten protein in wheat flour impedes the expansion of starch granules through gelatinization. Comparable result has been recorded previous study [34]. The closing of sorghum flour surface channels as a result of denatured proteins may be the cause of the observed increase in Tp values.
3.4. Farinograph Properties of Sorghum-Wheat Flours
As indicated in Table 3, wheat flour had the lowest water absorption of 63.50 %, and there were no significant differences for the combined flours. The findings reveal a notable increase (P<0.05) in the sorghum-wheat combination dough contrast to that of wheat flour. This difference can be linked to the presence of bran in sorghum flour, as the bran can increase the flour’s water absorption because of its high hydroxyl group content, which forms hydrogen bonds with the flour molecules to compete for water [8,35]. There was no significant alteration (P < 0.05) in Dough Development Time (DDT) across varying particle sizes, nevertheless a slight reduction was observed for the flour containing smaller particles, at 1.14 min, which was similar as reported by Coda et al. [36]. The stability time of the sorghum-wheat composite samples exhibited a notable disparity (P<0.05) from the W value, with durations recorded at 6.26 minutes, 4.06 minutes, 2.40 minutes, and 3.13 minutes for W, WA, WB, and WC, respectively. This is due to the reduced strength of gluten when mixed with sorghum flour specially flour containing small particle size of sorghum flour. Significantly lower softening values may indicate that the dough is capable of withstanding extended mechanical treatment. Additionally, the softening degrees across the samples varied, measuring 72, 109, 112, and 110 BU for W, WA, WB, and WC, respectively, indicating that increasing the degree of softening indicates weak mixture quality [31].
3.5. Scanning Electron Microscopy (SEM)
Figure 1 depicts scanning electron microscope (SEM) images of a dough sheet produced from a blend of sorghum flour with different particle sizes and wheat flour. The wheat dough exhibited a denser gluten network with a significant portion of wheat starch granules deeply integrated, contrasting with the structure observed in dough derived from the combined flours. The sorghum–wheat composite dough exhibited numerous fissures and a discontinuous gluten network, with loosely dispersed starch granules and an elevated density of voids among the protein matrix, starch granules, and other constituents (highlighted by red circles in the SEM image). These microstructural defects were particularly pronounced in doughs containing the coarse particle-size fraction, indicating poorer matrix continuity at larger granulations. This behavior likely reflects the elevated phenolic content of sorghum, particularly in the coarse particle-size fraction, which is richer in bran-derived phenolics. These compounds can interact with gluten proteins (e.g., via hydrogen bonding, hydrophobic interactions, and oxidative cross-linking), thereby disrupting the continuity of the starch–protein matrix. Besides, some free starch granules were found in WC dough (highlighted by red arrow in the SEM image), and few areas exhibited a lack of cohesion between gluten matrix and starch. This observation was consistent with research showing that dough made with fine wheat flour lacked adequate starch-gluten network interaction [11].
3.6. Rheology Property
The assessment of product quality heavily depends on dough rheology, where elasticity is indicated by the elastic modulus G' and viscosity by the viscous modulus G" [31]. Frequency-dependent graphs of G', G", and tan δ were produced for the dough samples (Figure. 2).
Regardless of the scanning frequency, the G' values of the dough samples consistently exceeded the G" values, indicating a predominance of elasticity over viscosity (Figure 2a,b). In each specimen, the loss tangent (tan δ) remained below 1, while G' and G'' exhibited gradual increases, indicating a characteristic dynamic rheological profile of a delicate gel. The addition of sorghum flour, especially the very fine type to the dough significantly elevated G' and G'', suggesting enhanced gluten network and increased dough elasticity. Furthermore, the incorporation of fine sorghum flour in wheat-based systems demonstrates functional properties analogous to dough-strengthening agents (e.g., hydrocolloids), facilitating both structural stability and network development [37]. The decreased G' and G'' values in W and WC samples were affected by the increase in damaged starch content and reduced particle size. The enhanced water absorption capacity noted in the dough can be linked to the augmented surface area of the bran fraction post-milling. The finer particle size of the bran enables quicker water absorption during the mixing phase [38]. Moreover, previous study has similarly indicated a rise in dough water absorption following the reduction in bran particle size, allows for faster water absorption during the mixing period [39]. Tan δ, the ratio of G'' to G', remained below 1 for all frequencies. Adding sorghum flour with its various particles size decreased tan δ, indicating changes in dough strength and a low elastic ratio [30,31]. These results are influenced by both the sorghum variety and the treatment method applied.
3.7. Glutenin Macropolymer (GMP)
Highly polymerized glutenin polymer, or GMP, is insoluble in SDS and plays a major role in the physical characteristics of dough. It is composed of low and high molecular weight glutenin connected by disulfide bonds [40]. The GMP content exhibited a significant decrease upon the incorporation of sorghum flour into wheat flour, as illustrated in Figure 3.
This decrease took an upward trend, so that the larger particle size of sorghum flour, the lower GMP value. This effect arises from the gluten-free nature of sorghum, which disrupts the formation of a continuous gluten network, especially when using coarse fractions of sorghum flour. Additionally, sorghum exhibits different water absorption characteristics compared to wheat, often requiring higher hydration levels without contributing to gluten development. Moreover, coarse sorghum flour contains higher amount of polyphenols and tannins, which interact with proteins and inhibit the formation of disulfide (S–S) bonds essential for gluten strength. Collectively, these factors compromise the quality of noodle products, resulting in denser texture and reduced chewiness, as reflected in the noodle texture analysis discussed in section 3.10) [40]. In other words, a higher GMP content is indicative of a more stable and well-structured dough matrix, which in turn contributes to improved noodle texture. [41].
3.8. Water Distribution Properties of Sorghum-Wheat Dough Sheet
Water distribution can affect the interactions between dough ingredients, as well as the chemical and physical responses that occur throughout the processing of noodles, and thus the final quality [22]. Transverse relaxation time (T2) indicates the ability for water binding, with shorter T2 reflects a tighter conjunction of water and material. T21, T22, and T23 represent the peak position times, which are also referred to as tightly bound water, weakly bound water, and free water, respectively. The corresponding peak area proportion, denoted by A (A21, A22, and A23), shows the amounts of various status water in specimens. The greater the peak proportion, bigger the relative content of water in that stage [22].
The results of water distribution shown in (Table 4) that the percentage of closely bound water A21 decreased significantly in the sorghum-wheat composite dough samples from the wheat dough sample, and this decrease was descending that is, starting from WA to WC were 18.15 %, 17.28 % and 16.99 %. In contrast, it could find that an increase in the percentage of weakly bound water A22 for samples containing smaller particle sizes, were as follows: 80.19 %, 81.50 % and 81.60 % WA, WB and WC respectively, and lowest it was wheat flour dough 79.91 %. It should be noted that the higher the percentage of A21, the greater the water content associated with the dough. As a result, improved water retention capacity in the dough is closely associated with greater structural stability [42]. The highest percentage of free water A23 was for WA 1.62 and the lowest percentage was for W was 0.42. This implies that a slightly larger particle size of sorghum flour may augment the quantity of unbound water in the dough while diminishing the capacity of water molecules to bind. Besides, T22 showed a declining trend, while there was a clear discrepancy in the data for T23, while there were no significant differences (p < 0.05) in T21 between all samples. This suggests that the sorghum fraction in the sorghum-wheat composite dough played a role in the water-binding ability of weakly bound water and free water in dough sheets.
3.9. Secondary Structure
Fourier-transform infrared spectroscopy (FTIR) is a commonly employed analytical method that offers significant insights into the structural attributes of protein biomolecules. As depicted in Figure 4, the FTIR spectra of the flour samples exhibited analogous characteristic peaks at 3423 cm−1, 2931 cm−1, 1660 cm−1, and 1018 cm−1, representing stretching vibrations of O–H, glucose C–H deformation vibrations, bending vibrations of O–H in water molecules, and amorphous characteristics, respectively.
The baseline of all samples corresponds to the propagation of sound waves at 3423 cm−1, signifying O–H stretching vibrations. The absorbance bands around 2931 cm−1 are linked to the asymmetric stretching of the C–H bond. The H–O–H bending vibrations at 1660 cm−1 in the amorphous segments of the flour are connected with the internal forces of intra-molecular hydrogen bonds [21,43,44].
The peaks' intensity within the 1300-1475 cm−1 range was more pronounced in WB and WC in contrast to WA and W, denoting the stretching vibrations of CH2 and CH3. WA led to an increase in the intensity of the 1550 cm−1 band, indicating a decrease in the structured nature of the flours.
Typically, the P=O group's infrared absorption peak is expected to lie between 1400 and 1150 cm−1, however because of its weak absorption, it is often not clearly apparent in the infrared spectrum [43]. According to previous studies, the absorption peak at 1022 cm⁻¹ is indicative of amorphous structural characteristics, whereas the peaks at 1048 cm⁻¹ and 995 cm⁻¹ are specifically associated with the crystalline structure of materials such as flour and starch [31,45]. In this study, short range structure and double helix structure were obtained by analyzing the degrees of 1048/1022 cm−1 (R1048/1022) and 995/1022 cm−1 (R995/1022) respectively according to Gu Y et al [45] and it were shown in Table 4. The absorption of R1048/1022 was for wheat flour dough by 1.887 while the absorption of mixed flour was 1.859, 1.817 and 1.869 for WA, WB and WC respectively. While R995/1022 absorption was ranged from 0.891, 0.892, 0.912 and 0.914 for W, WA, WB and WC respectively. This indicates the quality of the short-range crystalline structure for WP and WC. However, the small particle size led to the regulated the internal hydrogen bonds of molecules, potentially promoting the good connection of the double helices. This is consistent with the results of Yang L's study [31].
3.10. Cooking Properties of Noodles
The cooking and texture properties of noodles were shown in Table 5. The duration of cooking plays a crucial role in determining the preferred sensory characteristics and overall quality of noodles. A reduced cooking time is considered a desirable attribute in noodle manufacturing [46]. In this study, it was observed that the cooking time of sorghum-wheat composite noodles were reduced compared to wheat noodle. This may be due to the weakened protein network, the structural integrity of noodles is compromised during cooking, leading to increased surface disruption. This promotes rapid starch water absorption, thereby significantly shortening noodle cooking time [47]. Additionally, the highest water absorption values were observed in the W and WC samples, attaining 206.89 % and 181.96 %, respectively. This enhancement can be ascribed to a greater proportion of damaged starch, which promotes water uptake by augmenting granule porosity and facilitating granule swelling. Increased porosity notably expands the available surface area for hydration, thus directly enhancing their ability to retain water [48]. Cooking losses were comparatively greater in noodles formulated with coarse and fine sorghum flours than those made from very fine sorghum flour and wheat flour. This phenomenon can be attributed to inadequate dough characteristics, which impair water retention within noodles, thereby diminishing their structural integrity during cooking. The compromised dough structure negatively influences hydration capacity, ultimately leading to increased cooking loss [49].
3.11. Texture Profile of Noodles
Texture Profile Analysis (TPA) is a fundamental, objective method for evaluating noodle eating quality by simulating mastication [50]. Typically, the textural attributes of noodles correlate closely with their cooking characteristics. As indicated in Table 5, a reduction in the particle size of sorghum flour within sorghum-wheat composite noodles resulted in a significant increase (p<0.05) in both hardness and chewiness parameters. This increment can be ascribed to the diminished presence of fiber as particle size decreases, since dietary fiber interferes with the starch-gluten network, consequently causing reductions in noodle hardness and chewiness [50]. The firmness and chewiness of noodles are primarily influenced by the structural network formed between gluten proteins and starch. When fiber content is reduced, gluten–starch interactions are enhanced through several mechanisms, thereby improving noodle texture.
The key contributing factors include: (1) Reduced physical interference from fiber—insoluble fibers, such as bran particles, act as physical barriers that disrupt the formation of a cohesive gluten network; lower fiber content minimizes this interference, enabling the development of a more continuous gluten matrix that effectively entraps starch granules; (2) Improved hydration and gluten development—soluble fibers (e.g., β-glucans, arabinoxylans) compete for water, limiting the hydration of gluten and starch; reducing fiber allows more water to be available for proper gluten formation; (3) A stronger gluten–starch matrix in the absence of fiber, gluten proteins can form a more uninterrupted network, enhancing starch encapsulation and overall structural integrity [50]. The reduced fiber content enhances structural coherence by minimizing disruptions within the gluten-starch matrix, thereby increasing noodle firmness.
3.12. Microstructule of Cooked Noodle
The microstructure of cooked sorghum–wheat composite noodles, as observed by SEM in Figure 5, reveals notable differences depending on the particle size of the sorghum flour used in the formulation. In the control wheat noodles (W), a smooth and continuous internal structure was observed, typical of well-developed gluten matrices supporting gelatinized starch. By contrast, the incorporation of coarse sorghum flour (WA) disrupted this structure. The internal matrix of WA noodles exhibited large, irregular voids (red arrows) and disrupted continuity, suggesting weakened gluten development. However, the gaps progressively diminish as particle size decreases. Coarse particles may have physically interfered with gluten network formation and contributed to heterogeneous water distribution, leading to partial gelatinization. Similar microstructural disruptions were reported by Yu et al., [51], who found that coarse particles impede water migration and reduce matrix cohesiveness in multigrain noodles.
A marked improvement was noted in noodles enriched with fine sorghum flour (WB). The microstructure of WB noodles displayed a more integrated and uniform starch–protein matrix compared to WA, with fewer voids and more cohesive interfaces. The most compact and homogenous structure was evident in the noodles made with very fine sorghum flour (WC) it was close to wheat noodles. Here, starch granules were fully swollen and fused, forming dense, gel-like matrices with fewer detectable voids. The SEM images revealed near-complete gelatinization, indicative of efficient water uptake and strong integration between gluten and starch phases.
3.13. Sensory Evaluation of Sorghum-Wheat Composite Noodles
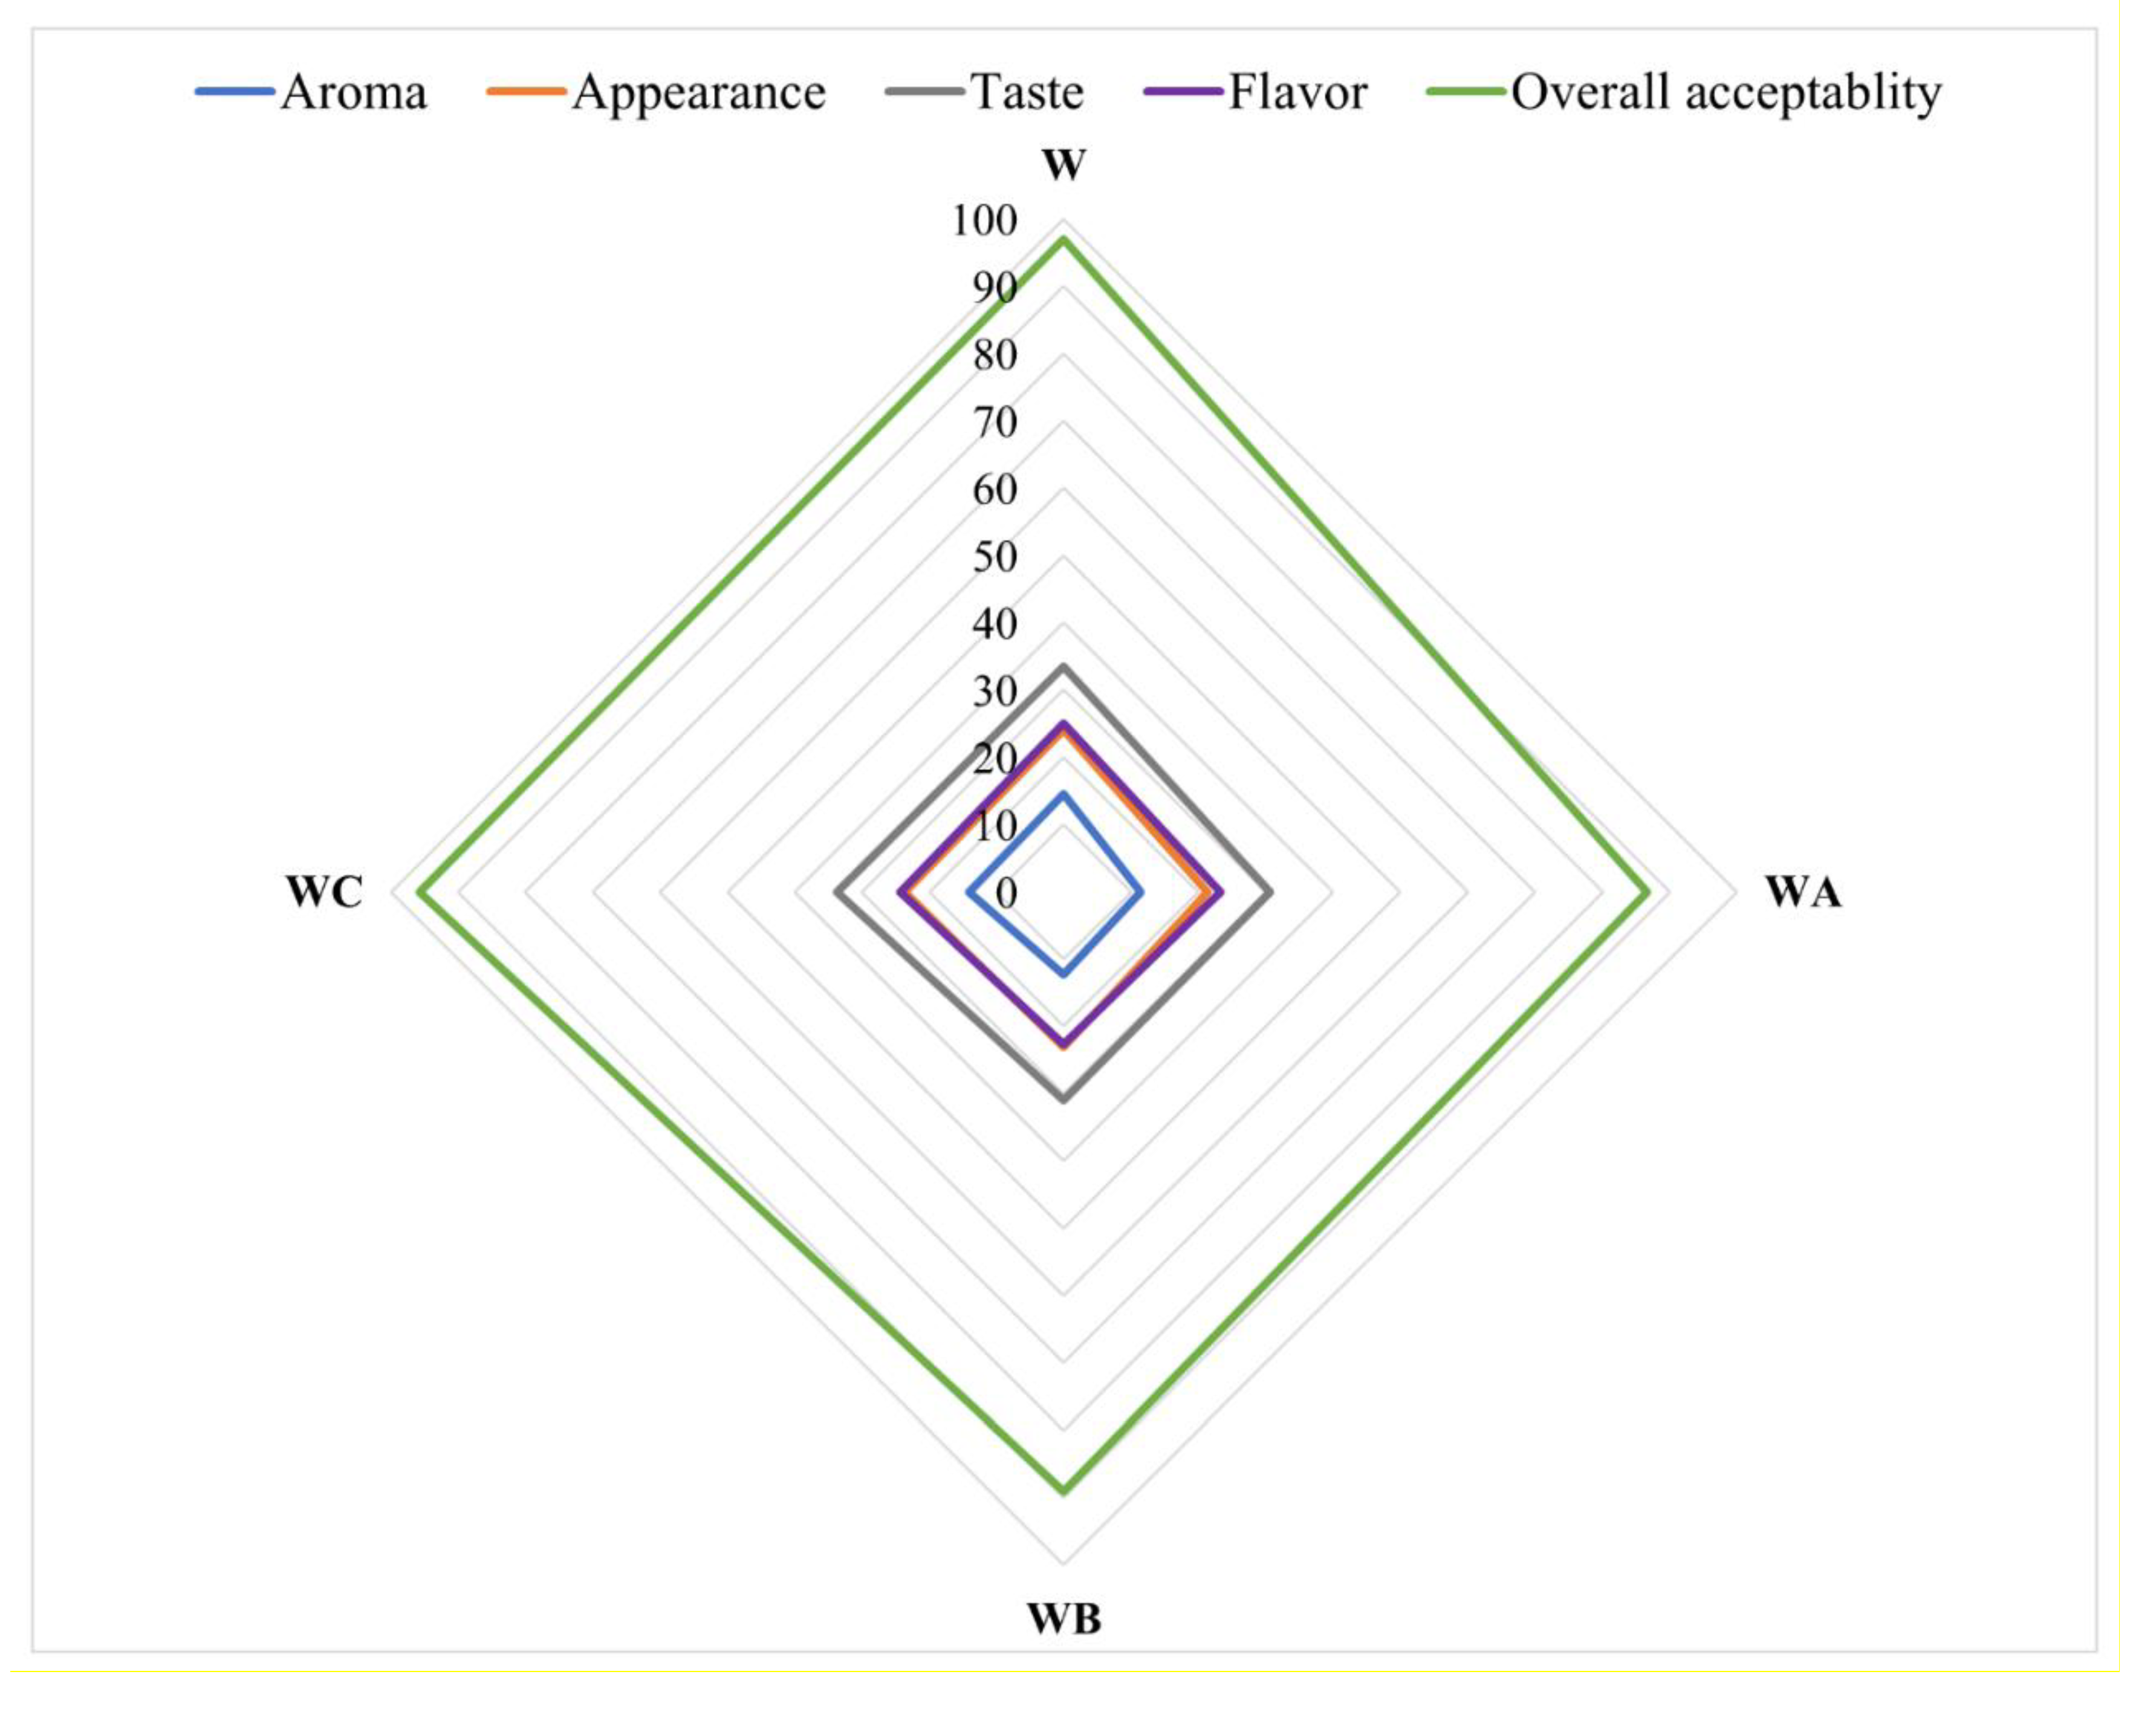
Figure 5 demonstrates that noodles formulated from wheat flour and those containing very fine sorghum flour blends achieved the highest scores in the sensory evaluation. The samples designated as W 97 points and WC 95 points received the highest comprehensive sensory scores, whereas samples WA and WB obtained scores of 86 points and 89 points, respectively. The superior sensory ratings of these noodle variants may be linked to their lake of anthocyanins. Anthocyanins, belonging to the flavonoid subclass found within sorghum grains, have been recognized as promising natural food colorants [25]. Consequently, the incorporation of coarse sorghum flour led to a proportional intensification in noodle coloration, reflecting elevated of anthocyanins pigment concentrations. Besides, it can consider that the incorporation of very fine sorghum flour resulted in noodles with sensory scores closely approximating those of the control wheat noodles, especially in attributes such as appearance and texture. The improvement in texture might be due to reduced particle interference with gluten network formation. However, the slightly lower scores for WA samples could be due to coarse particles disrupting the noodle matrix and negatively affecting mouthfeel. Despite these differences, all sorghum-containing noodles remained within an acceptable sensory range, suggesting that sorghum flour, particularly in finer particle sizes, can be effectively incorporated into noodle formulations to enhance nutritional content without compromising consumer acceptability.
4. Conclusions
The properties of sorghum-wheat composite flour dough were notably impacted by the particle size of sorghum flour. The thermal, pasting, mixing, and viscoelastic properties of combined dough were found to be affected by particle size distribution, as demonstrated through farinograph, pasting, DSC measurements, and rheology analysis. Dough with fine sorghum flour had the highest GMP content after wheat flour dough. The research findings demonstrated that the dough containing smaller particle size of sorghum flour enhanced the stability of the gluten structure within the dough. Increases in extension resistance and dough firmness were found compared with wheat flour. The study results indicated that diminishing the particle size of sorghum flour could improve the structural stability of the blended flour and dough sheet. Besides, noodles made from fine sorghum flour has better water absorption, reduced cooking losses and, in turn, superior performance in analyzing texture properties and sensory priority. However, further research is necessary to explore the effects of sorghum flour on the overall quality of final products. Future studies could focus on developing sorghum-enriched pasta to enhance nutritional value, as well as formulating gluten-free cakes and breads. Future research should explore the relationship between product quality and sorghum flour particle size to gain a deeper understanding of their interrelation. This study’s findings should be interpreted with caution due to the relatively small sample size, which may limit statistical power and external validity. Future studies with larger, more diverse cohorts are needed to confirm these results.
Author Contributions
Conceptualization, Methodology, Investigation, Data curation, Writing original draft, Writing-review and editing, Saeed hamid saeed omer; Methodology, Investigation, Data curation, Hassan A. Mohamed; Supervision, Funding acquisition, Xueling Zheng.
Acknowledgments
This work was supported by Special Fund of National Wheat Industry Technology System of China (No. CARS-03).
Conflicts of Interest
The authors affirm that there are no financial conflicts of interest or personal connections that might have influenced the work presented in this study.
References
- Nudel, R. Cohen, S. Abbo, and Z. Kerem, ‘Developing a nutrient-rich and functional wheat bread by incorporating Moringa oleifera leaf powder and gluten’, LWT, vol. 187, Sep. 2023. [CrossRef]
- T., W. H., Z. T., W. H., Z. H., C. C., L. T. W. H. Z. H. C. C. W. Z. Z. S. W. K. Y. S. Li, ‘ The characterization of sensory properties, aroma profile and antioxidant capacity of noodles incorporated with asparagus tea ultra-micro powder’, Food Chemistry: X, vol. 26, p.102297., 2025. [CrossRef]
- M. M. and X. B. Liu J, ‘ Effect of unripe banana flour and wheat gluten on physicochemical characteristics and sensory properties of white salted noodles’, J Food Process Preserv, vol. 44(7):e14513, 2020. [CrossRef]
- L. I. T. P. and K. P. Nanthachai N, ‘ Development of pumpkin powder incorporated instant noodles’, Curr Res Nutr Food Sci J, vol. 8(2):524-530, 2020. [CrossRef]
- L. Gonçalves et al., ‘Preparation of Gluten-free Noodles Incorporated of Jabuticaba Peel Flour’, Journal of Food and Nutrition Research, vol. 4, no. 2, pp. 82–87, 2016. [CrossRef]
- L. Padalino, M. L. Padalino, M. Mastromatteo, L. Lecce, S. Spinelli, A. Conte, and M. Alessandro Del Nobile, ‘Optimization and characterization of gluten-free spaghetti enriched with chickpea flour’, Int J Food Sci Nutr, vol. 66, no. 2, pp. 148–158, Mar. 2015. [CrossRef]
- Wahjuningsih, Sudjatinah, M. Nurul Azkia, and D. Anggraeni, ‘The study of sorghum (Sorghum bicolor l.), mung bean (vigna radiata) and sago (metroxylon sagu) noodles: Formulation and physical characterization’, Current Research in Nutrition and Food Science, vol. 8, no. 1, pp. 217–225, Apr. 2020. [CrossRef]
- N. M. Dube, F. N. M. Dube, F. Xu, R. Zhao, and J. Chen, ‘Effect of using Zimbabwean Marcia sorghum and high-gluten flour on composite bread specific volume’, J Food Process Preserv, vol. 45, no. 4, Apr. 2021. [CrossRef]
- X. Xu, Y. X. Xu, Y. Xu, N. Wang, and Y. Zhou, ‘Effects of superfine grinding of bran on the properties of dough and qualities of steamed bread’, J Cereal Sci, vol. 81, pp. 76–82, 18. 20 May. [CrossRef]
- J. Pang, E. J. Pang, E. Guan, Y. Yang, M. Li, and K. Bian, ‘Effects of wheat flour particle size on flour physicochemical properties and steamed bread quality’, Food Sci Nutr, vol. 9, no. 9, pp. 4691–4700, Sep. 2021. [CrossRef]
- J. Bressiani et al., ‘Properties of whole grain wheat flour and performance in bakery products as a function of particle size’, J Cereal Sci, vol. 75, pp. 269–277, 17. 20 May. [CrossRef]
- X. Tian et al., ‘Particle size distribution control during wheat milling: nutritional quality and functional basis of flour products—a comprehensive review’, Dec. 01, 2022, John Wiley and Sons Inc. [CrossRef]
- L. Bourré et al., ‘Influence of particle size on flour and baking properties of yellow pea, navy bean, and red lentil flours’, Cereal Chem, vol. 96, no. 4, pp. 655–667, Jul. 2019. [CrossRef]
- M. Niu, G. G. M. Niu, G. G. Hou, L. Wang, and Z. Chen, ‘Effects of superfine grinding on the quality characteristics of whole-wheat flour and its raw noodle product’, J Cereal Sci, vol. 60, no. 2, pp. 382–388, 2014. [CrossRef]
- S. Ma, L. S. Ma, L. Li, X. X. Wang, X. L. Zheng, K. Bian, and Q. D. Bao, ‘Effect of mechanically damaged starch from wheat flour on the quality of frozen dough and steamed bread’, Food Chem, vol. 202, pp. 120–124, Jul. 2016. [CrossRef]
- S. Barak, D. S. Barak, D. Mudgil, and B. S. Khatkar, ‘Effect of flour particle size and damaged starch on the quality of cookies’, J Food Sci Technol, vol. 51, no. 7, pp. 1342–1348, 2014. [CrossRef]
- N. Wang, G. G. N. Wang, G. G. Hou, and A. Dubat, ‘Effects of flour particle size on the quality attributes of reconstituted whole-wheat flour and Chinese southern-type steamed bread’, LWT, vol. 82, pp. 147–153, Sep. 2017. [CrossRef]
- N. Wang, G. G. N. Wang, G. G. Hou, M. Kweon, and B. Lee, ‘Effects of particle size on the properties of whole-grain soft wheat flour and its cracker baking performance’, J Cereal Sci, vol. 69, pp. 187–193, 16. 20 May. [CrossRef]
- AACC, ‘ Approved methods of the AACC ’, (10th ed). St. Paul, MN, USA: American Association of Cereal Chemists, 2000.
- J. Hong et al., ‘Effects of Bifidobacteria Fermentation on Physico-Chemical, Thermal and Structural Properties of Wheat Starch’, Foods, vol. 11, no. 17, Sep. 2022. [CrossRef]
- M. Bodjrenou, Z. M. Bodjrenou, Z. Huang, T. Liu, B. Zheng, and H. Zeng, ‘Effects of crosslinking with sodium trimetaphosphate on structural, physicochemical, rheological and in vitro digestibility properties of purple sweet potato starch’, Food Research International, vol. 173, Nov. 2023. [CrossRef]
- J. Shang et al., ‘Impact of wheat starch granule size on viscoelastic behaviors of noodle dough sheet and the underlying mechanism’, Food Hydrocoll, vol. 134, Jan. 2023. [CrossRef]
- M. Song et al., ‘Effects of repeated sheeting on rheology and glutenin properties of noodle dough’, J Cereal Sci, vol. 90, Nov. 2019. [CrossRef]
- X., L. X., L. X., L. X., L. J., C. J., J. L., S. G., C. A. and Z. Z. Hou, ‘ Changes in the structural and physicochemical characteristics of sonicated potato flour’, Ultrason Sonochem, vol. 99, p.106573., 2023. [CrossRef]
- F. Xu, N. M. F. Xu, N. M. Dube, Han, R. Zhao, Y. Wang, and J. Chen, ‘The effect of Zimbabwean tannin-free sorghum flour substitution on fine dried noodles quality characteristics’, J Cereal Sci, vol. 102, Nov. 2021. [CrossRef]
- S. Zainab, X. S. Zainab, X. Zhou, Y. Zhang, S. Tanweer, and T. Mehmood, ‘Suitability of early indica rice for the preparation of rice noodles by its starch properties analysis’, Food Chem X, vol. 24, Dec. 2024. [CrossRef]
- M. Jafari, A. M. Jafari, A. Koocheki, and E. Milani, ‘Physicochemical and sensory properties of extruded sorghum–wheat composite bread’, Journal of Food Measurement and Characterization, vol. 12, no. 1, pp. 370–377, Mar. 2018. [CrossRef]
- T. Liu, G. G. T. Liu, G. G. Hou, B. Lee, L. Marquart, and A. Dubat, ‘Effects of particle size on the quality attributes of reconstituted whole-wheat flour and tortillas made from it’, J Cereal Sci, vol. 71, pp. 145–152, Sep. 2016. [CrossRef]
- R. , B. D., S. S., F. J., G. L., H. J., J. H. and S. R. Rumler, ‘Chemical and physical characterization of sorghum milling fractions and sorghum whole meal flours obtained via stone or roller milling’, Foods, vol. 16; 10(4): 870, Apr. 2021. [Google Scholar]
- J. R. N. Taylor and M. N. Emmambux, ‘Developments in our understanding of sorghum polysaccharides and their health benefits’, 2010, American Association of Cereal Chemists. [CrossRef]
- L. Yang, S. L. Yang, S. Wang, H. Zhang, C. Du, S. Li, and J. Yang, ‘Effects of black soybean powder particle size on the characteristics of mixed powder and wheat flour dough’, LWT, vol. 167, Sep. 2022. [CrossRef]
- Q. Wang, L. Q. Wang, L. Li, and X. Zheng, ‘A review of milling damaged starch: Generation, measurement, functionality and its effect on starch-based food systems’, Jun. 15, 2020, Elsevier Ltd. [CrossRef]
- M. Niu, B. M. Niu, B. Zhang, C. Jia, and S. Zhao, ‘Multi-scale structures and pasting characteristics of starch in whole-wheat flour treated by superfine grinding’, Int J Biol Macromol, vol. 104, pp. 837–845, Nov. 2017. [CrossRef]
- M. Li et al., ‘Effect of gliadin/glutenin ratio on pasting, thermal, and structural properties of wheat starch’, J Cereal Sci, vol. 93, May 2020. [CrossRef]
- M. Rosell, E. M. Rosell, E. Santos, and C. Collar, ‘Physical characterization of fiber-enriched bread doughs by dual mixing and temperature constraint using the Mixolab®’, European Food Research and Technology, vol. 231, no. 4, pp. 535–544, 2010. [CrossRef]
- R. Coda, I. R. Coda, I. Kärki, E. Nordlund, R. L. Heiniö, K. Poutanen, and K. Katina, ‘Influence of particle size on bioprocess induced changes on technological functionality of wheat bran’, Food Microbiol, vol. 37, pp. 69–77, Feb. 2014. [CrossRef]
- C. M. Rosell, J. A. C. M. Rosell, J. A. Rojas, and C. Benedito De Barber, ‘Influence of hydrocolloids on dough rheology and bread quality’, 2001. [CrossRef]
- G. M. Campbell, M. G. M. Campbell, M. Ross, and L. Motoi, ‘Bran in Bread: Effects of Particle Size and Level of Wheat and Oat Bran on Mixing, Proving and Baking’, in Bubbles in Food 2: Novelty, Health and Luxury, Elsevier, 2008, pp. 337–354. [CrossRef]
- P. J. Jacobs, S. P. J. Jacobs, S. Bogaerts, S. Hemdane, J. A. Delcour, and C. M. Courtin, ‘Impact of Wheat Bran Hydration Properties As Affected by Toasting and Degree of Milling on Optimal Dough Development in Bread Making’, J Agric Food Chem, vol. 64, no. 18, pp. 3636–3644, 16. 20 May. [CrossRef]
- X. Guo, X. X. Guo, X. Sun, Y. Zhang, R. Wang, and X. Yan, ‘Interactions between soy protein hydrolyzates and wheat proteins in noodle making dough’, Food Chem, vol. 245, pp. 500–507, Apr. 2018. [CrossRef]
- P. Wang, F. P. Wang, F. Wu, N. Rasoamandrary, Z. Jin, and X. Xu, ‘Frozen-induced depolymerization of glutenin macropolymers: Effect of the frozen storage time and gliadin content’, J Cereal Sci, vol. 62, pp. 159–162, Mar. 2015. [CrossRef]
- L. Huang, J. L. Huang, J. Wan, W. Huang, P. Rayas-Duarte, and G. Liu, ‘Effects of glycerol on water properties and steaming performance of prefermented frozen dough’, J Cereal Sci, vol. 53, no. 1, pp. 19–24, Jan. 2011. [CrossRef]
- H. Heo, Y. K. H. Heo, Y. K. Lee, and Y. H. Chang, ‘Effect of cross-linking on physicochemical and in vitro digestibility properties of potato starch’, Emir J Food Agric, vol. 29, no. 6, pp. 463–469, 2017. [CrossRef]
- M. Cai, C. M. Cai, C. Shen, Y. Li, S. Xiong, and F. Li, ‘Effects of particle size on quality characteristics of stone-milled whole wheat flour’, J Sci Food Agric, vol. 103, no. 5, pp. 2483–2491, Mar. 2023. [CrossRef]
- Y. Gu et al., ‘Effects of heat treatment at different moisture of mung bean flour on the structural, gelation and in vitro digestive properties of starch’, Food Chem, vol. 443, Jun. 2024. [CrossRef]
- B.-K. Baik, ‘Effects of Flour Protein and Starch on Noodle Quality’, Aug. 2010. [CrossRef]
- M. , L. M. , D. S. , T. Y. , G. B. Yao, ‘ Texture and digestion of noodles with varied gluten contents and cooking time: the view from protein matrix and inner structure’, Food Chem, vol. 12 6230, 2020.
- C. Liu et al., ‘Effect of mechanically damaged starch on wheat flour, noodle and steamed bread making quality’, Int J Food Sci Technol, vol. 49, no. 1, pp. 253–260, Jan. 2014. [CrossRef]
- S. Sirichokworrakit, J. S. Sirichokworrakit, J. Phetkhut, and A. Khommoon, ‘Effect of Partial Substitution of Wheat Flour With Riceberry Flour on Quality of Noodles’, Procedia Soc Behav Sci, vol. 197, pp. 1006–1012, Jul. 2015. [CrossRef]
- S. A., P. S., N. S. A., P. S., N. J., K. K., P. K., S. N. Alam, ‘The effect of structure and texture on the breakdown pattern during mastication and impacts on in vitro starch digestibility of high fibre rye extrudates’, Food & Function, pp. 1958–1973, 2019. [CrossRef]
- K. Yu, H. M. K. Yu, H. M. Zhou, K. X. Zhu, X. N. Guo, and W. Peng, ‘Water cooking stability of dried noodles enriched with different particle size and concentration green tea powders’, Foods, vol. 9, no. 3, 2020. [CrossRef]
Figure 1.
Scanning electron microscopy analysis of dough from wheat flour and flour enriched with different particle size of sorghum flour. The feature in the red circle in SEM images refers to the voids in the doughs, (W, WA, WB and WC represent wheat flour, wheat-coarse sorghum composite flour, wheat-fine sorghum composite flour and wheat-very fine sorghum composite flour respectively. For interpretation of the references to color in this figure legend, the reader is referred to the main text of this article).
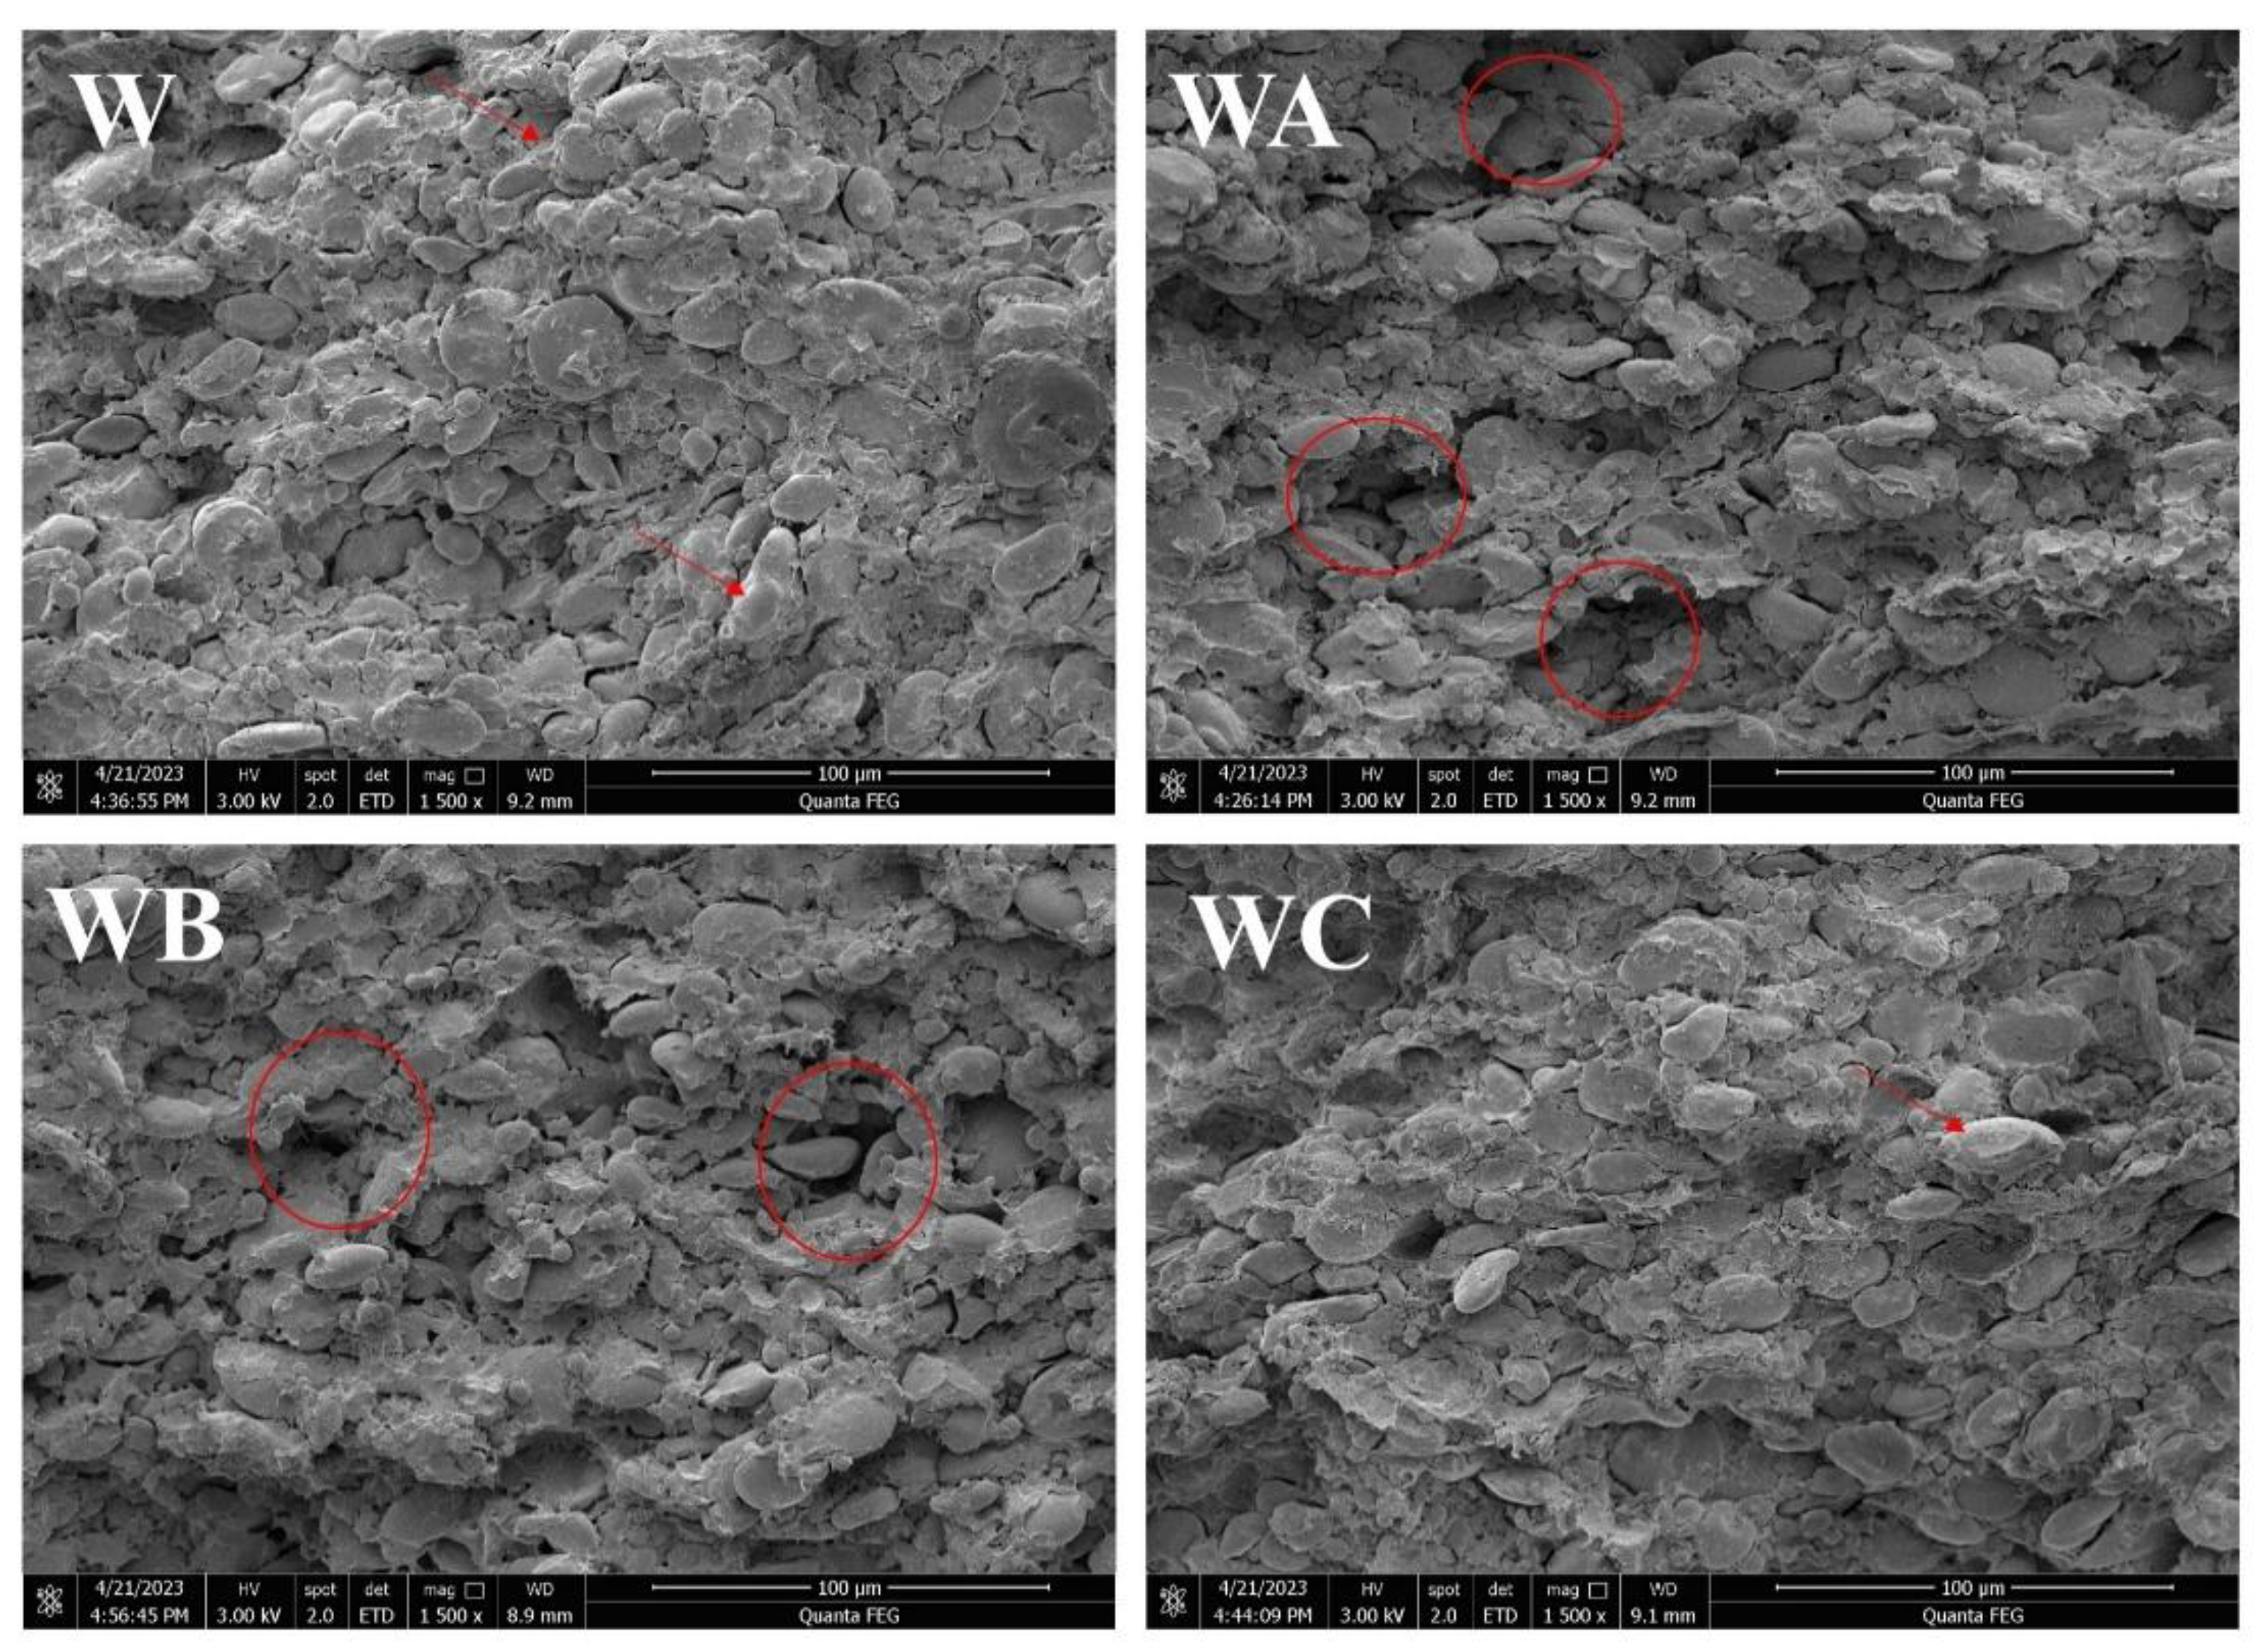
Figure 2.
Dynamic shear curves of dough from wheat flour and flour enriched with different particle size of sorghum flour at 25 °C: (a) G′ vs frequency plot; (b) G′′ vs frequency plot; (c) tan δ vs frequency plot. (W, WA, WB and WC represent wheat flour, wheat-coarse sorghum composite flour, wheat-fine sorghum composite flour and wheat-very fine sorghum composite flour respectively).
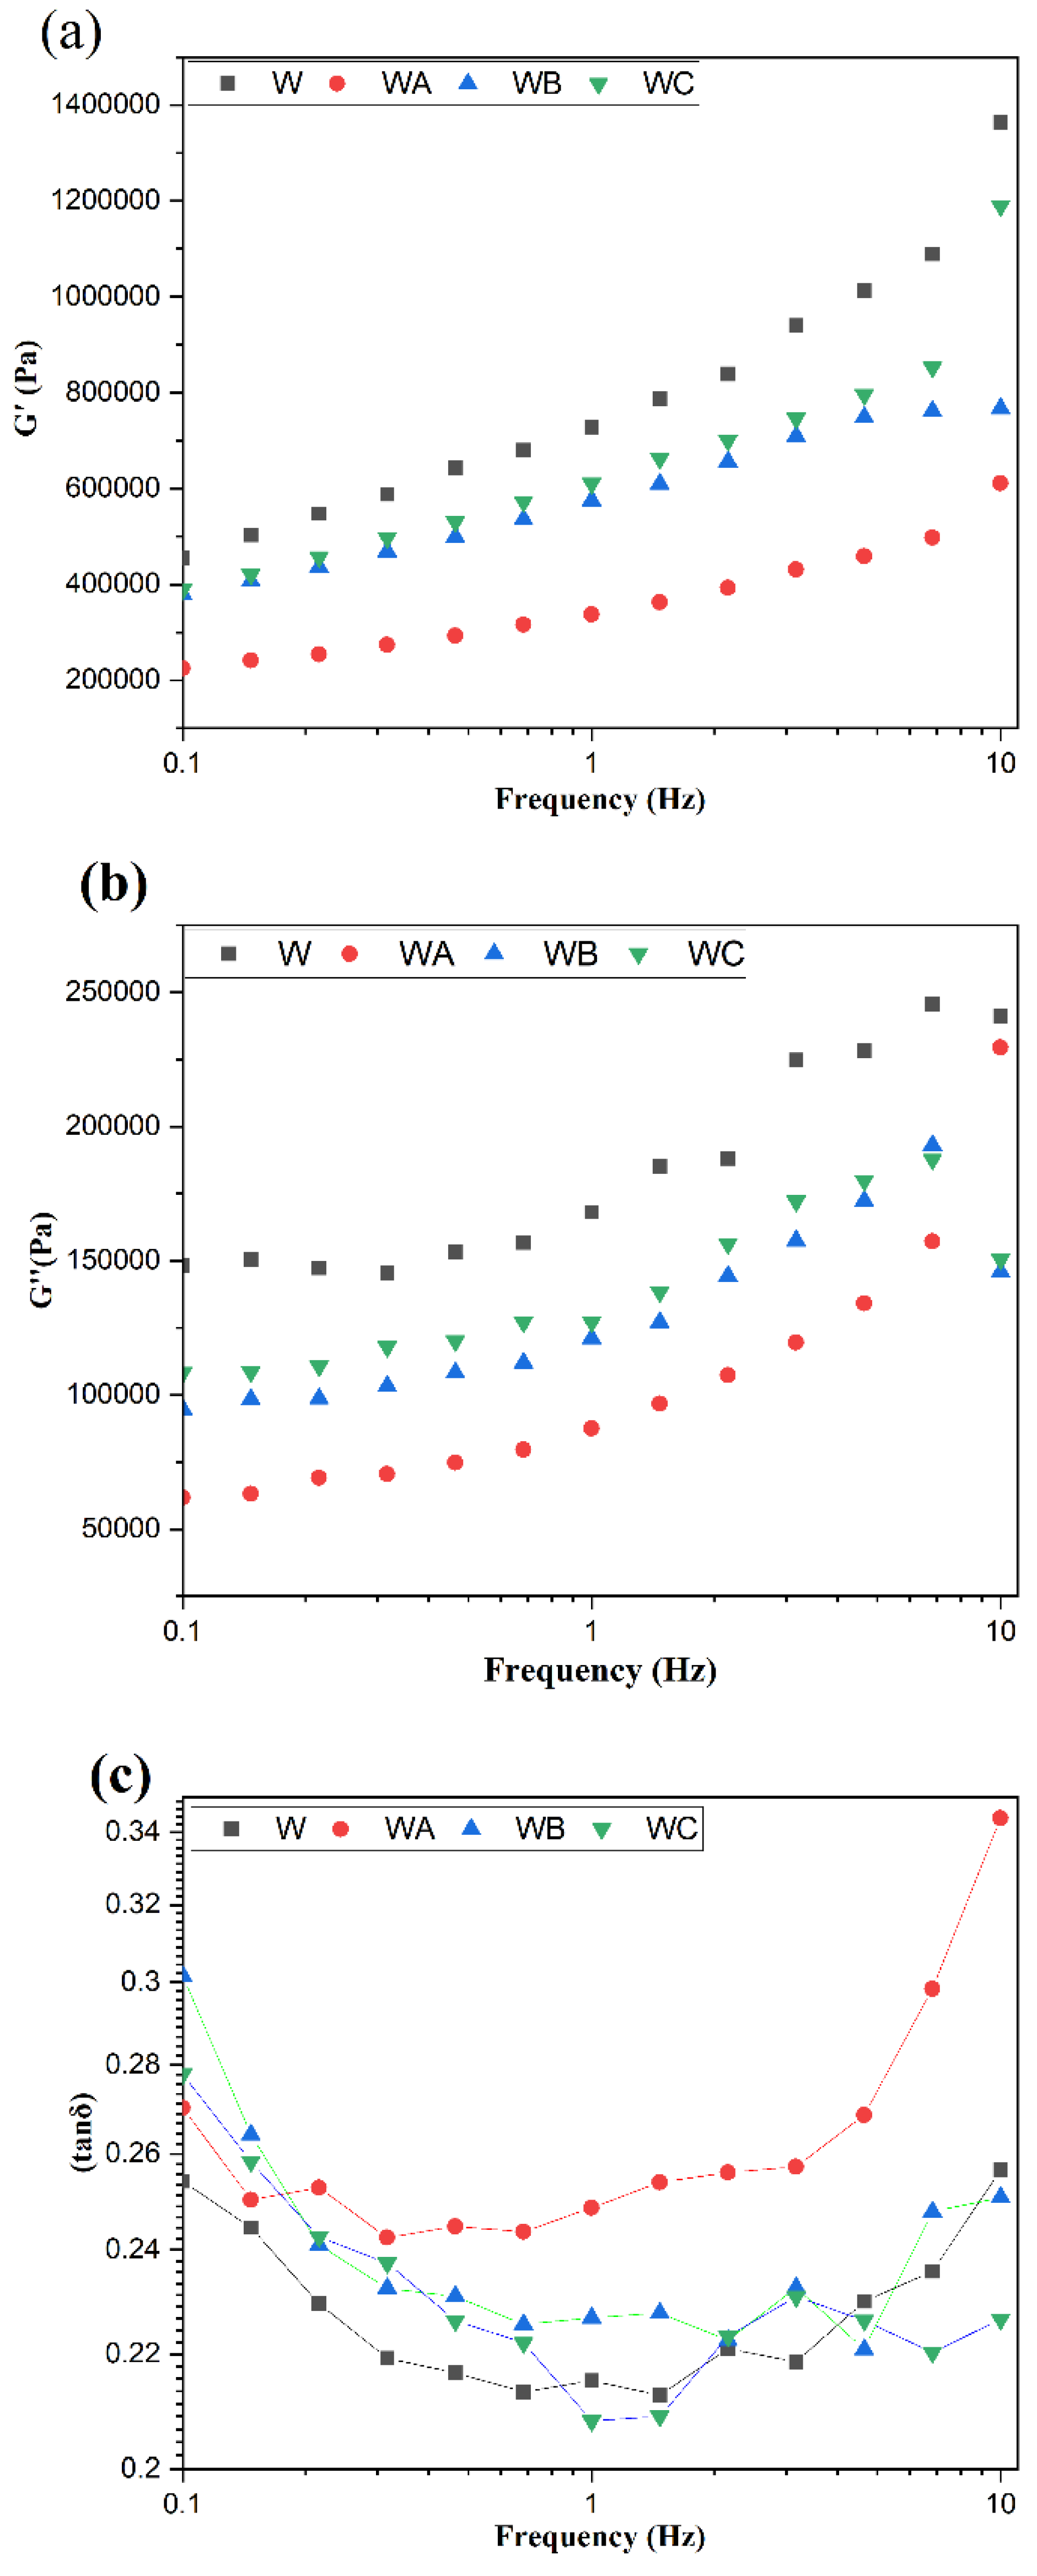
Figure 3.
GMP content of sorghum-wheat composite dough. (W, WA, WB and WC represent wheat flour, wheat-coarse sorghum composite flour, wheat-fine sorghum composite flour and wheat-very fine sorghum composite flour respectively).
Figure 3.
GMP content of sorghum-wheat composite dough. (W, WA, WB and WC represent wheat flour, wheat-coarse sorghum composite flour, wheat-fine sorghum composite flour and wheat-very fine sorghum composite flour respectively).
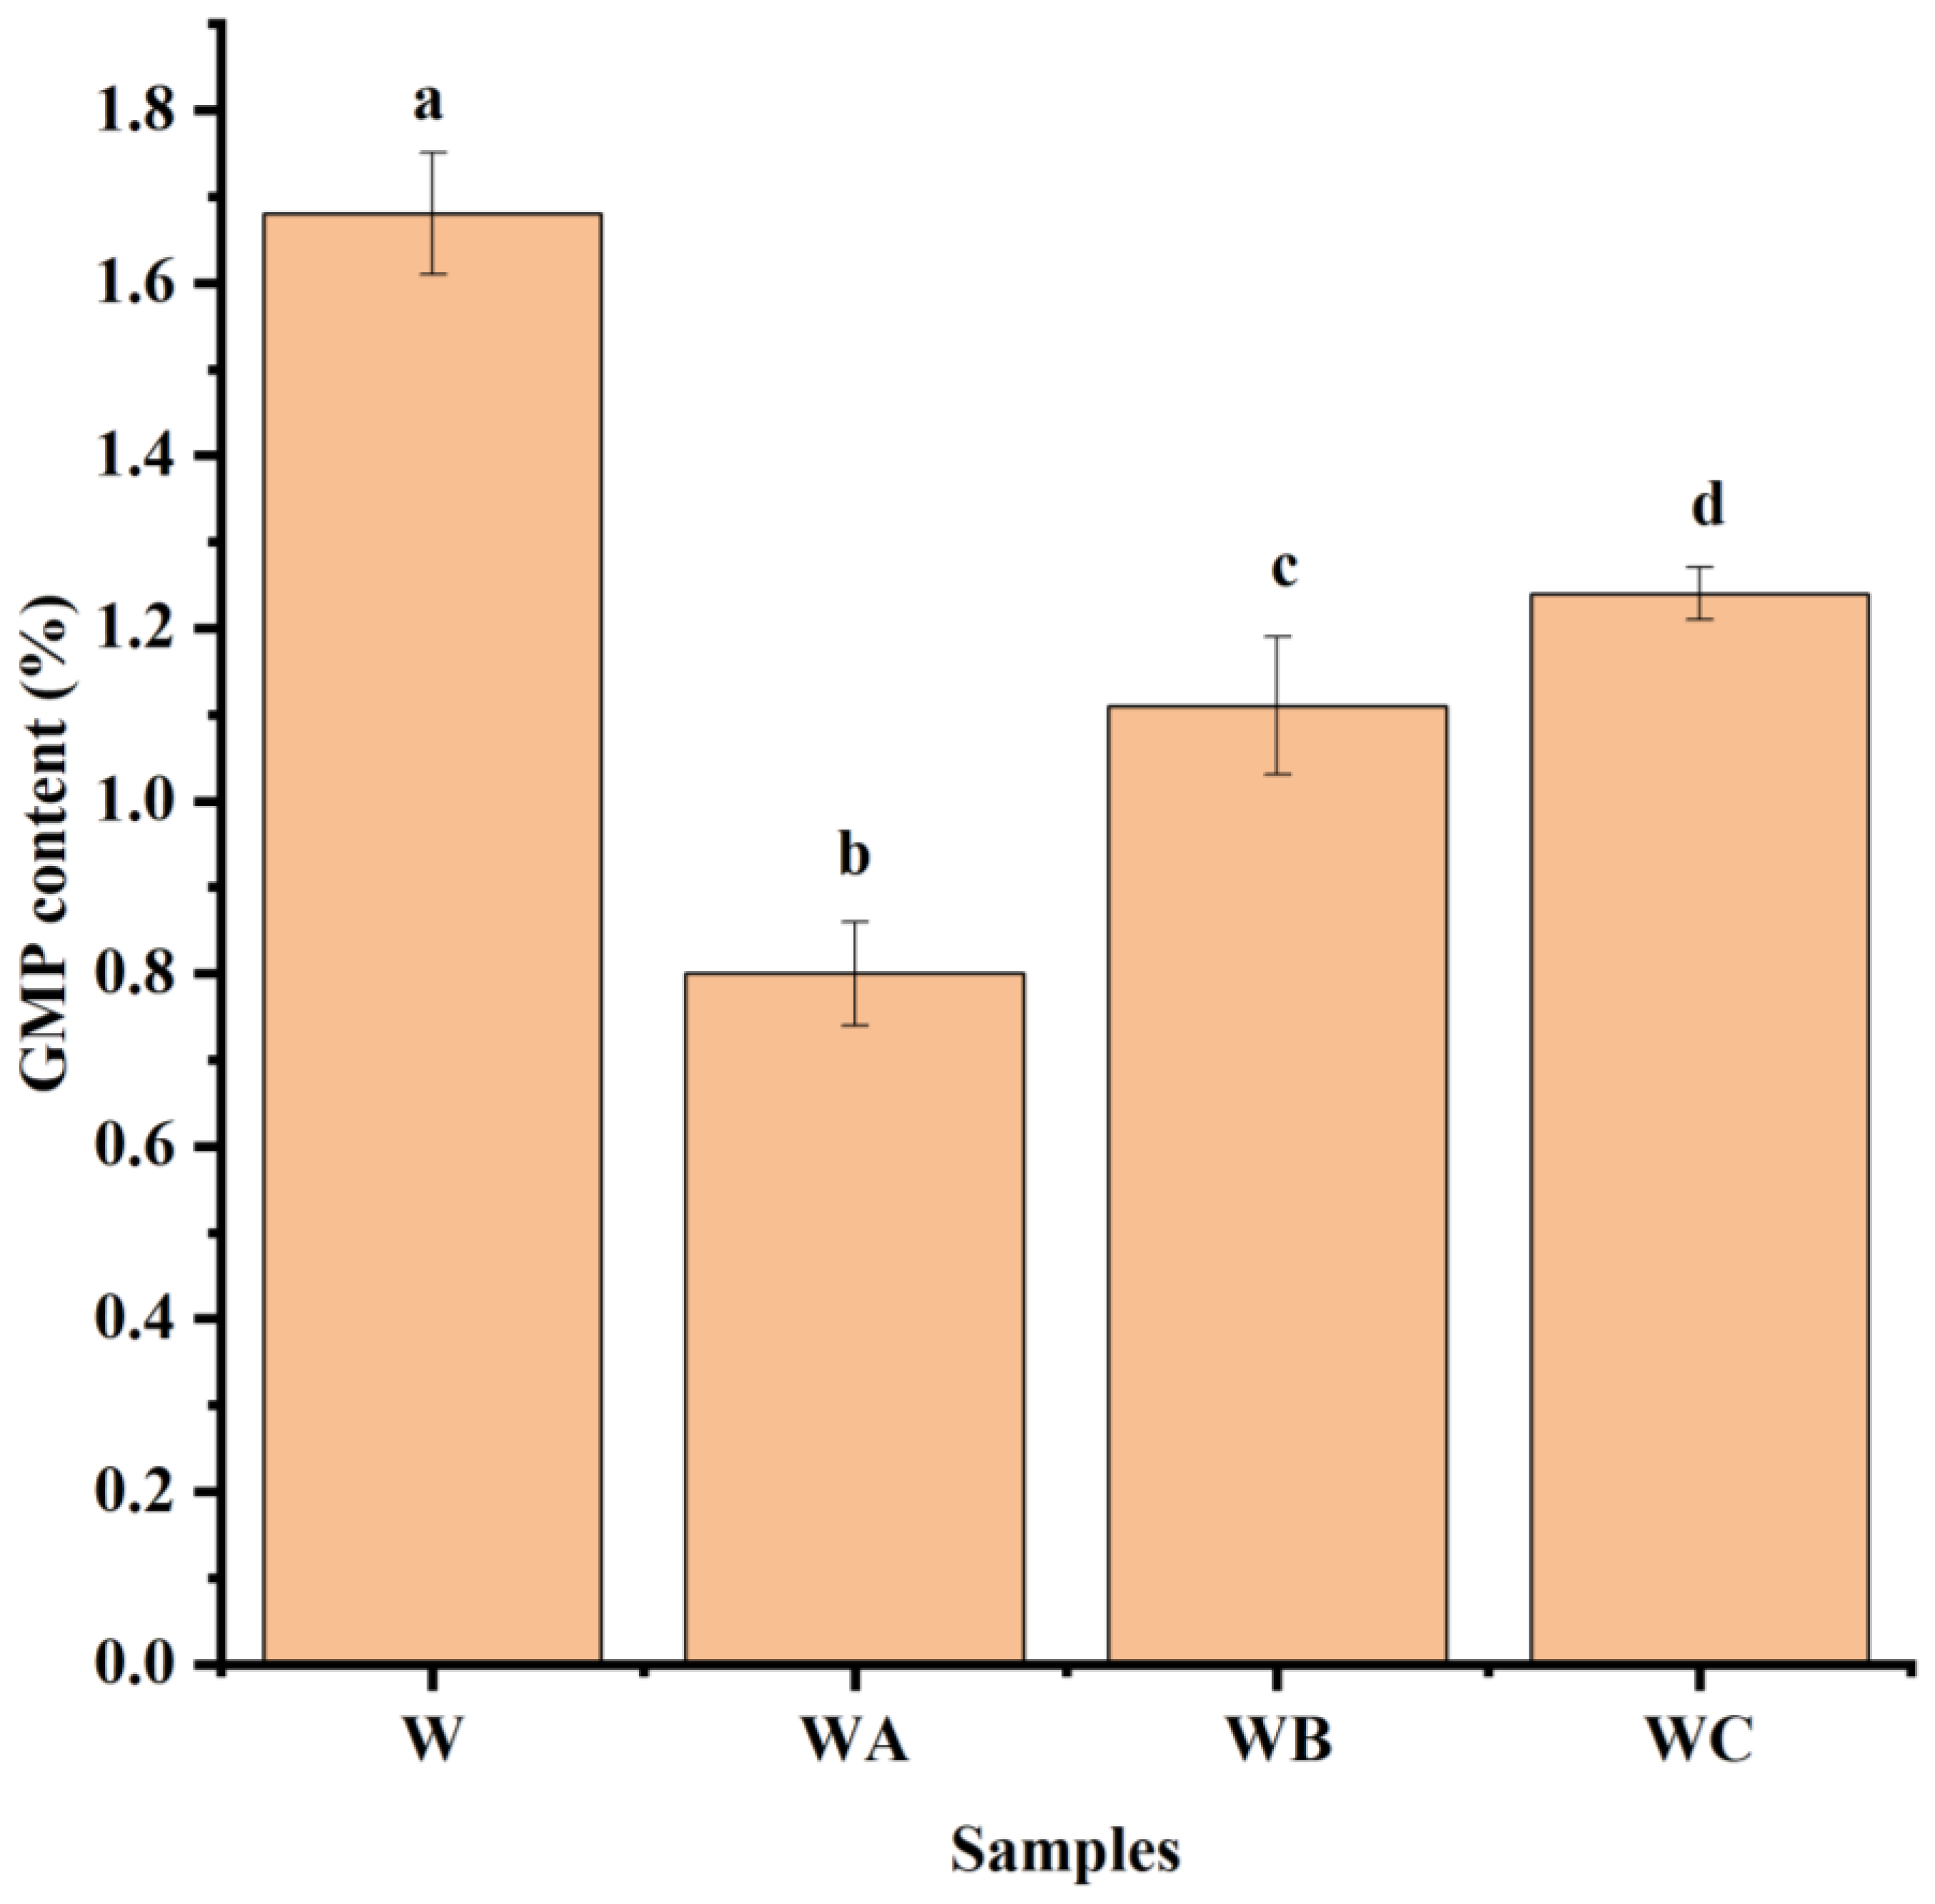
Figure 4.
FTIR spectra analysis of dough from wheat flour and flour enriched with different particle size of sorghum flour. (W, WA, WB and WC represent wheat flour, wheat-coarse sorghum composite flour, wheat-fine sorghum composite flour and wheat-very fine sorghum composite flour respectively).
Figure 4.
FTIR spectra analysis of dough from wheat flour and flour enriched with different particle size of sorghum flour. (W, WA, WB and WC represent wheat flour, wheat-coarse sorghum composite flour, wheat-fine sorghum composite flour and wheat-very fine sorghum composite flour respectively).
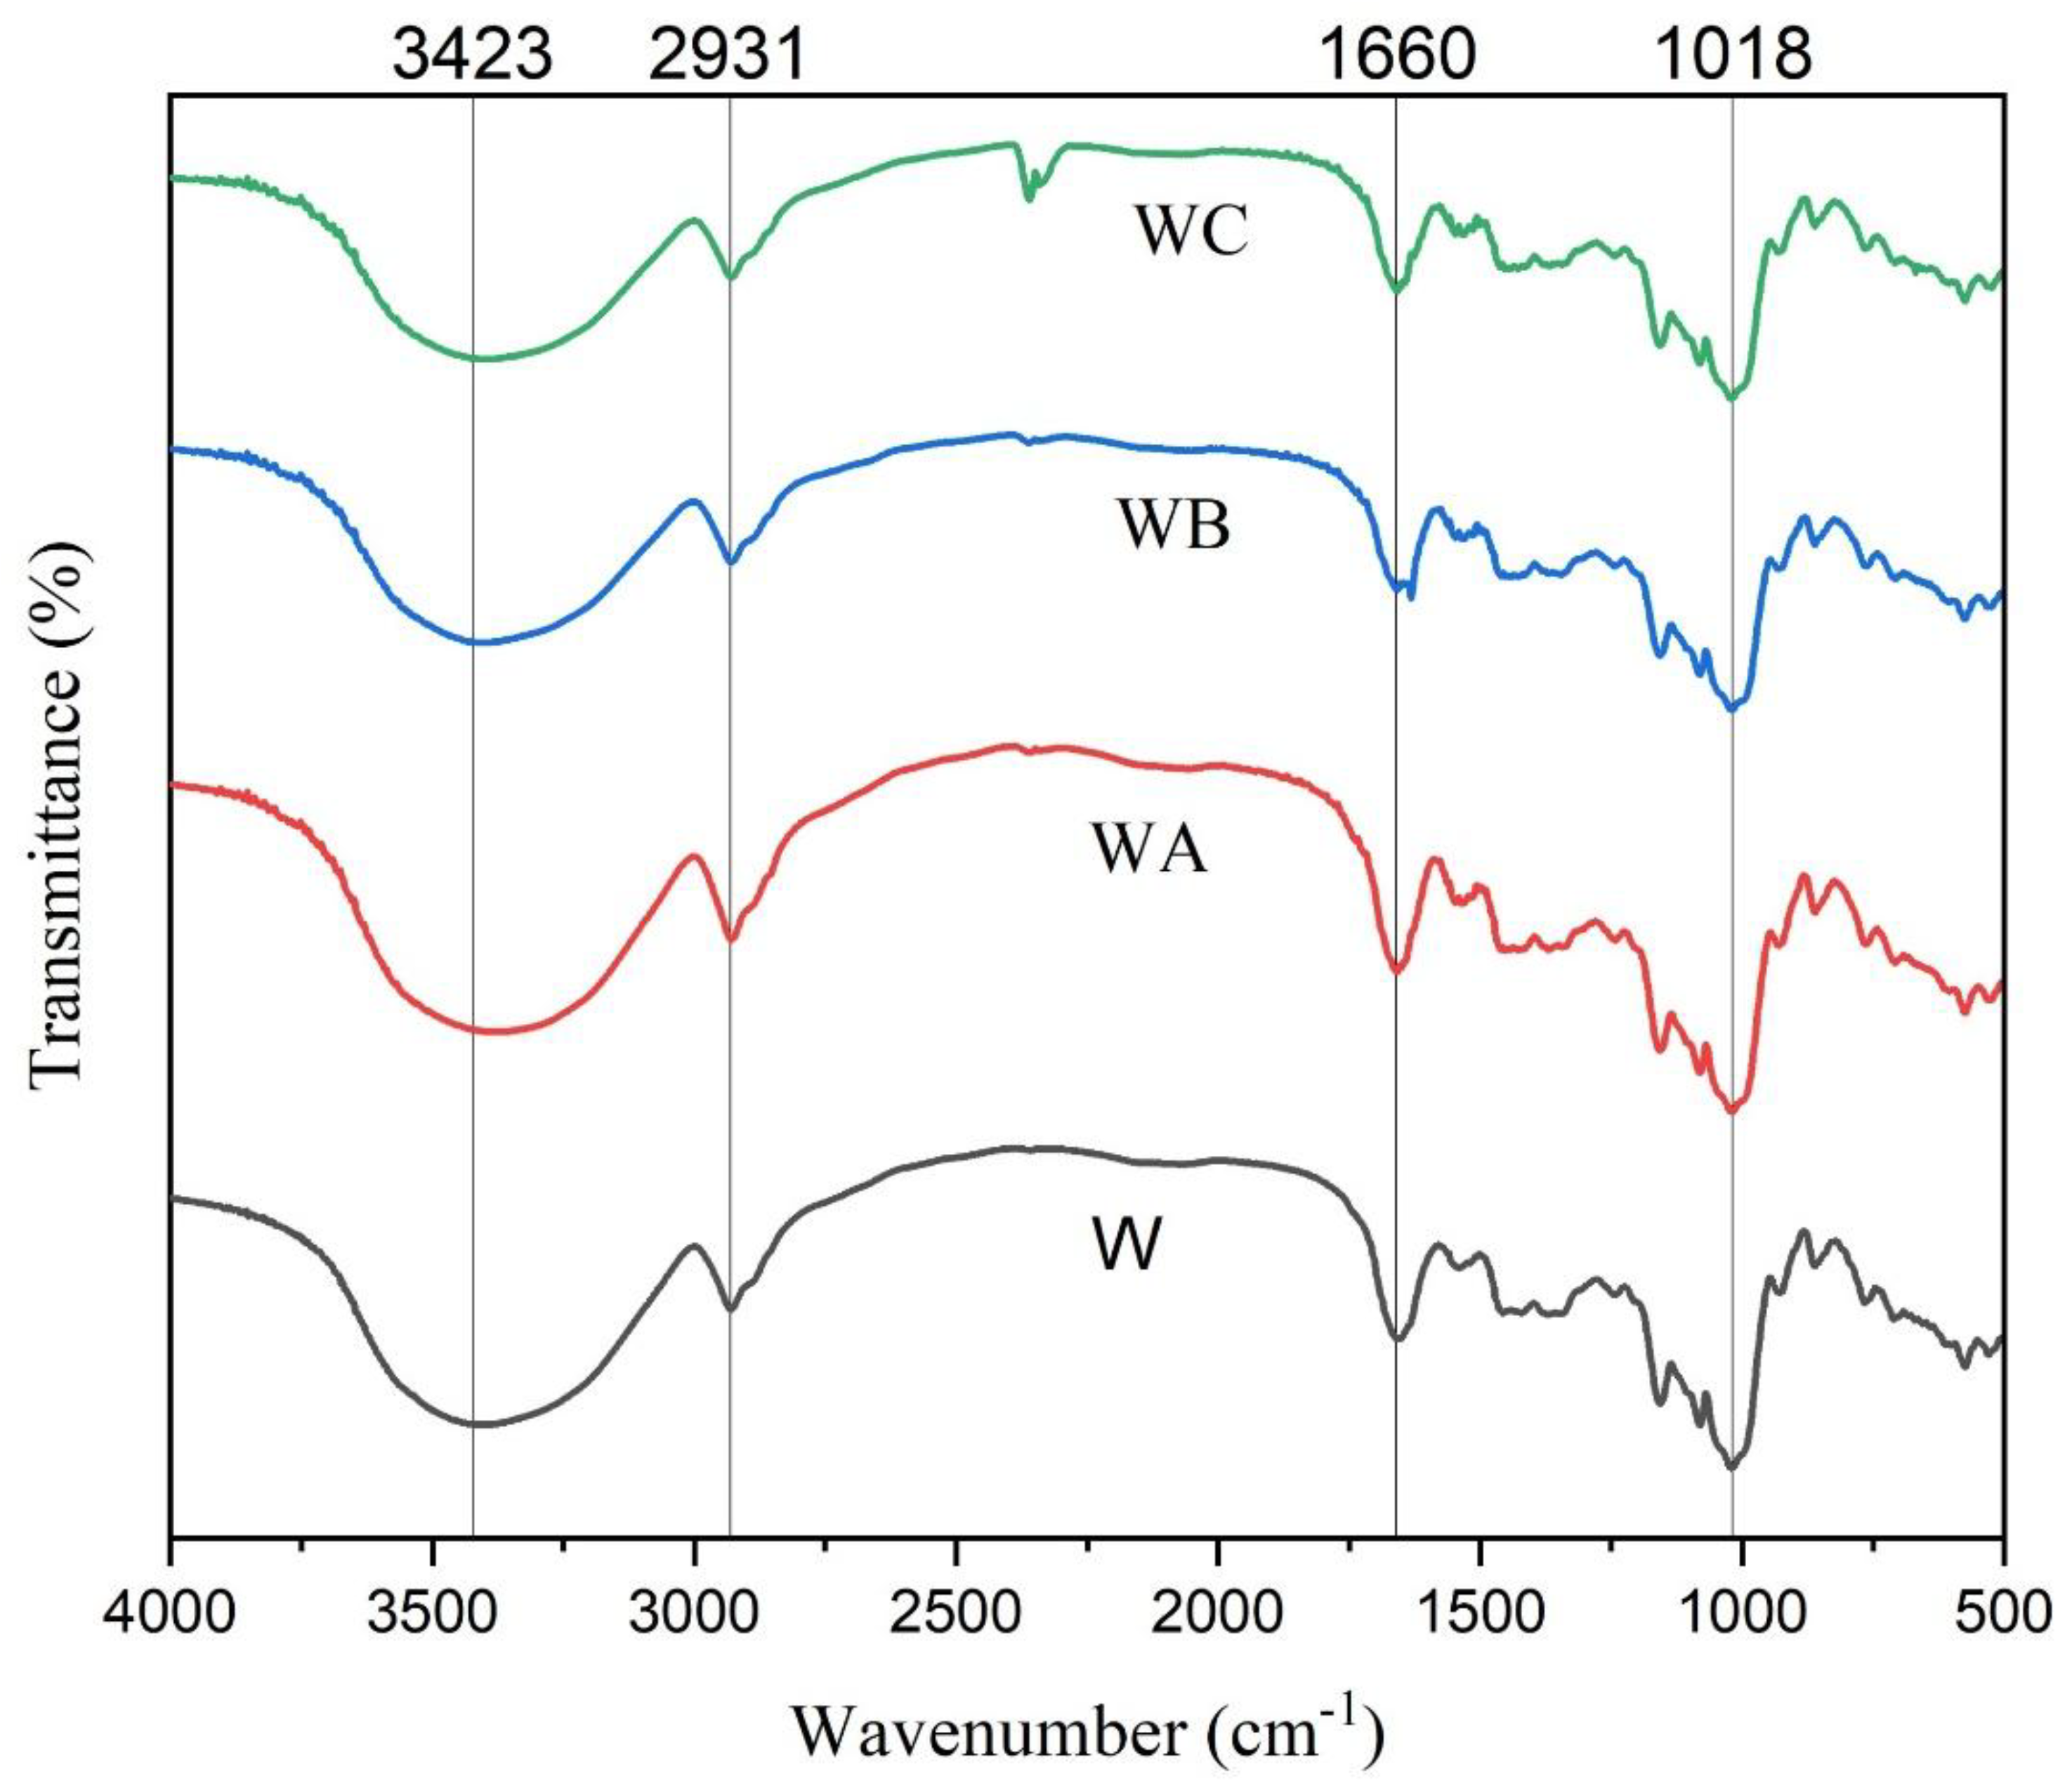
Figure 4.
Scanning electron microscopy of cooked noodle from wheat flour and flour enriched with different particle size of sorghum flour. W, WA, WB and WC represent wheat flour noodle, wheat-coarse sorghum composite noodle, wheat-fine sorghum composite noodle and wheat-very fine sorghum composite noodle respectively. (For interpretation of the references to color in this figure legend, the reader is referred to the main text of this article).
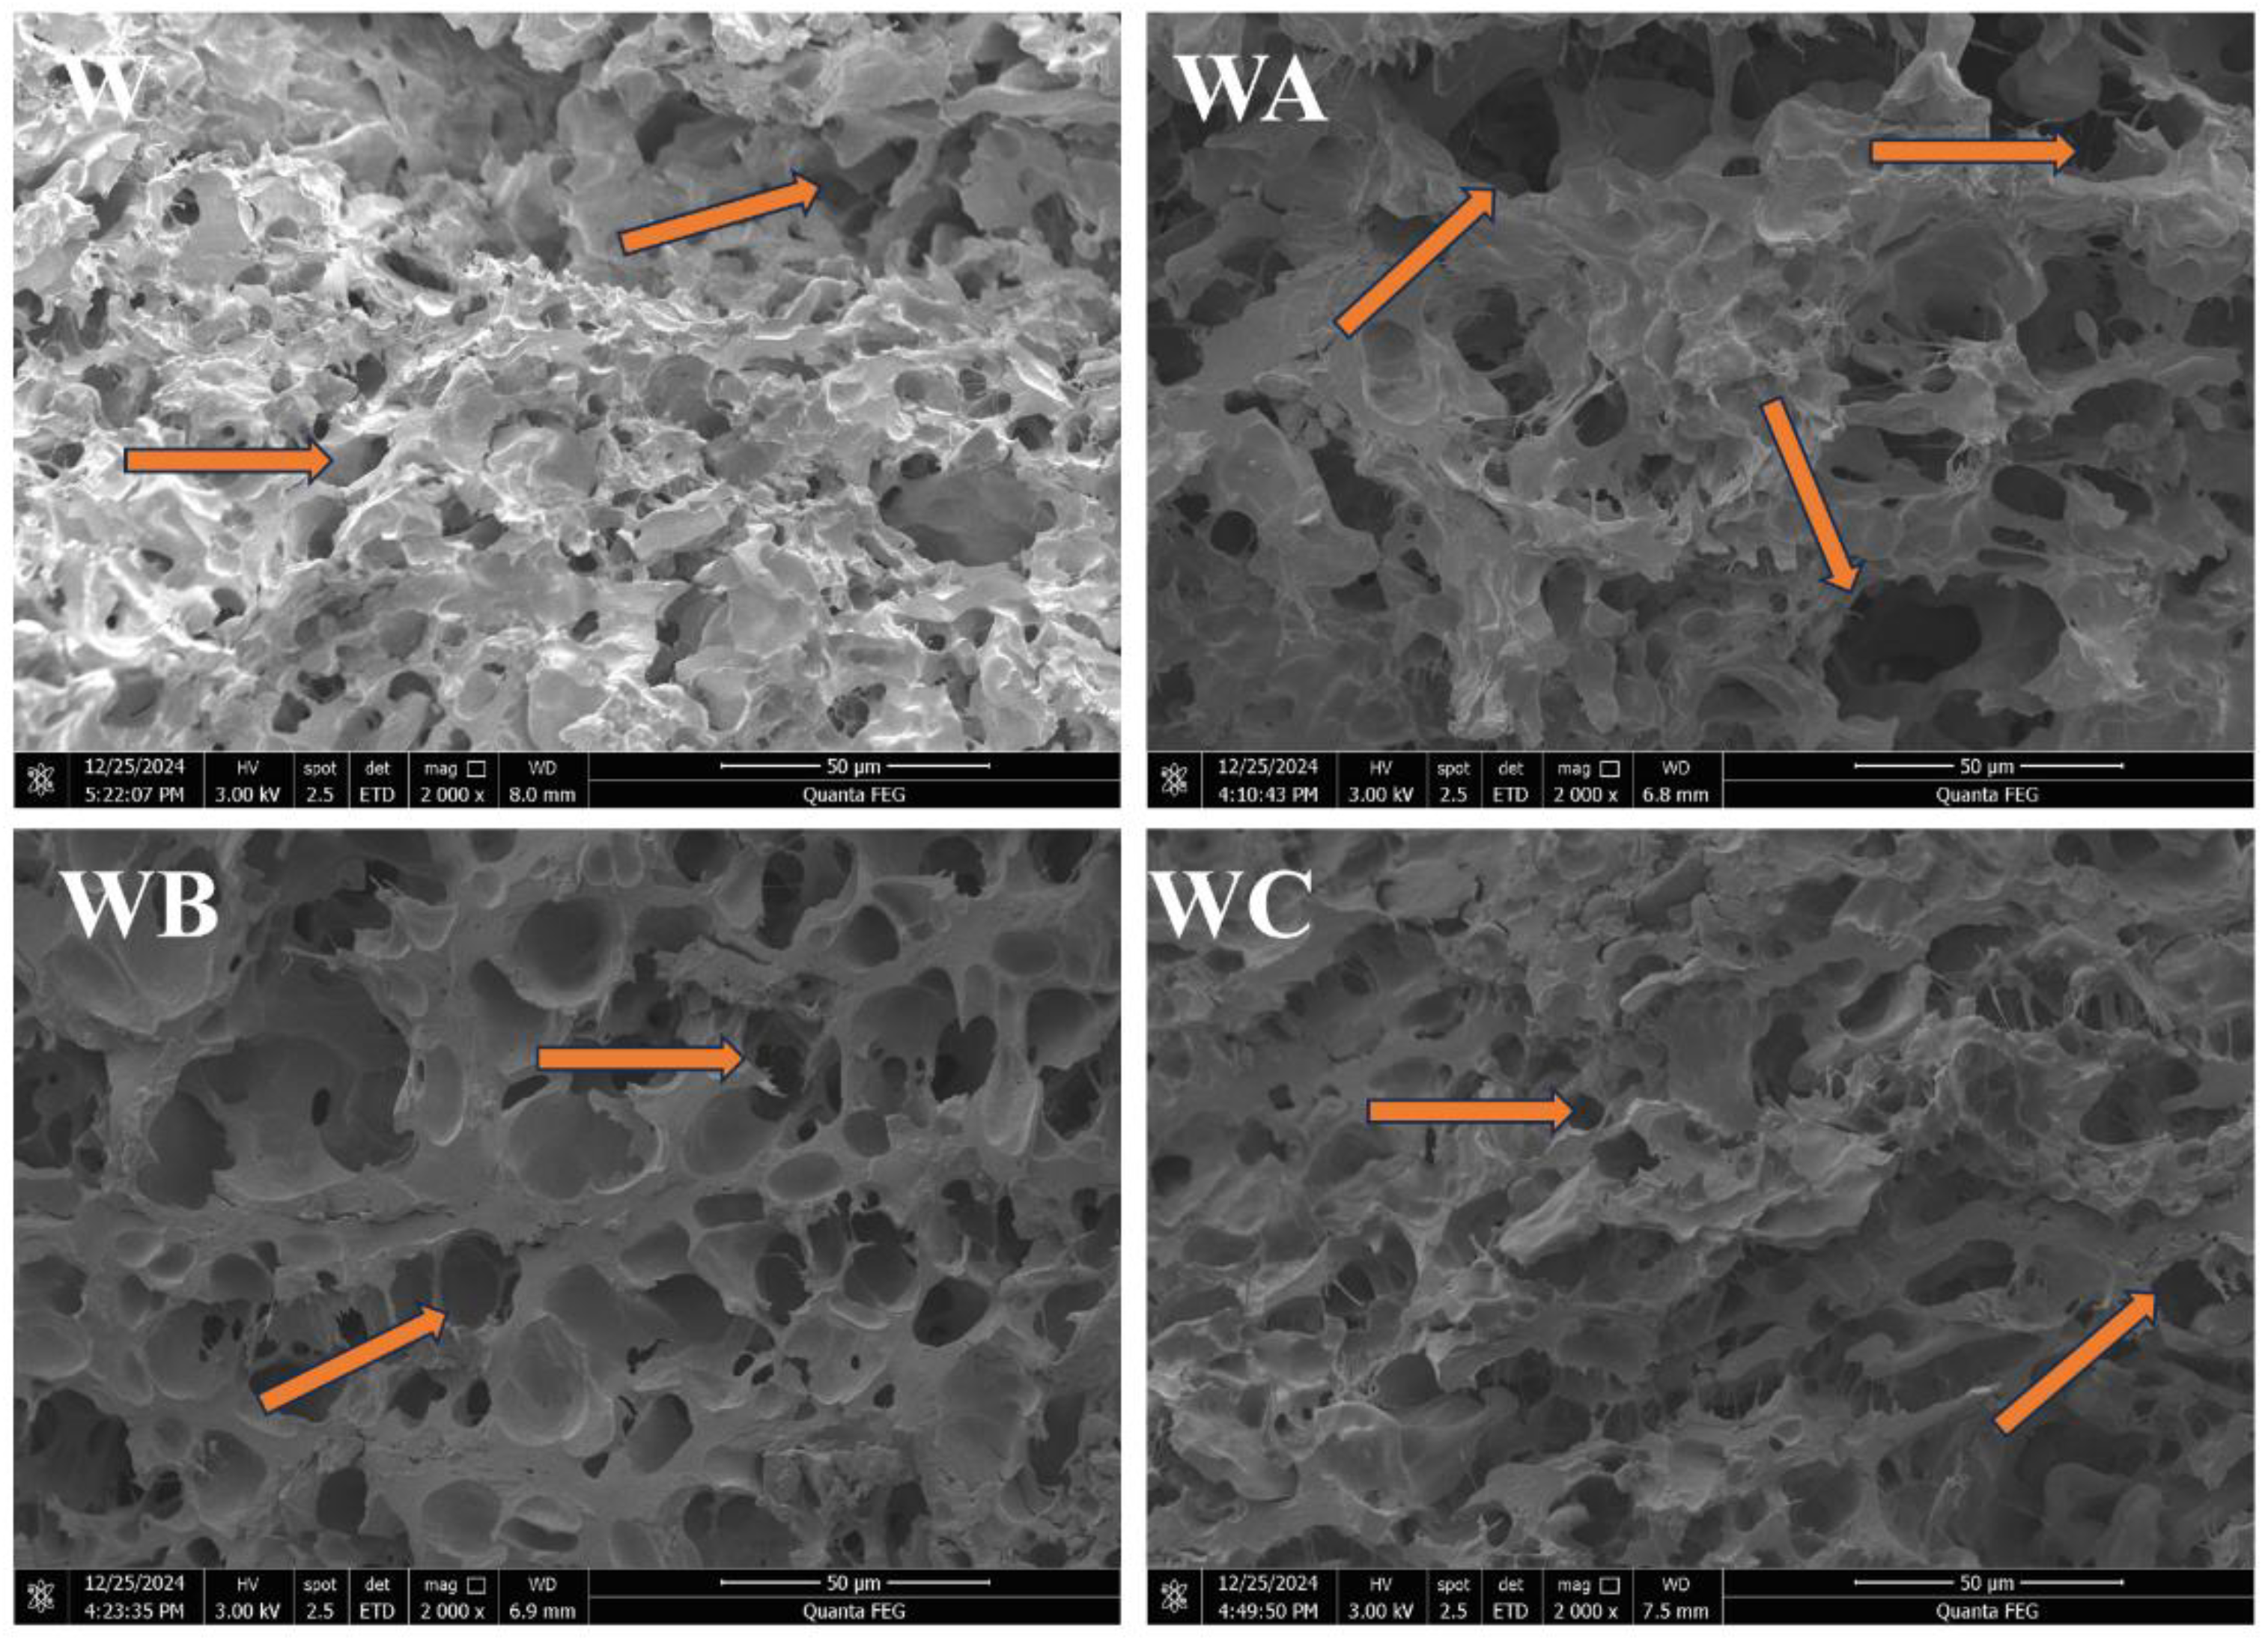

Table 1.
Particle size distribution, chemical composition and damaged starch (DS) of sorghum and wheat flour.
Table 1.
Particle size distribution, chemical composition and damaged starch (DS) of sorghum and wheat flour.
| Sample | D10 (µm) | D50 (µm) | D97 (µm) | Protein (%) | Moisture (%) | Starch (%) | Fat (%) | DS (%) |
|---|---|---|---|---|---|---|---|---|
| Coarse sorghum flour | 54.18±0.45a | 110.41±0.35a | 215.79±4.90a | 12.47±0.23a | 12.51±0.12b | 71.49 ±0.12c | 4.09±0.09b | 20.88±0.05d |
| Fine sorghum flour | 42.91±0.07b | 86.49±.25b | 181.45±0.39b | 12.07±0.04b | 12.09±0.03c | 86.18±0.14a | 4.35±0.06a | 24.25±0.05c |
| Very Fine sorghum flour | 14.58±0.06d | 34.03±0.24d | 95.21±0.30d | 12.35 ±0.12ab | 12.22±0.06c | 87.47±0.16b | 2.69±0.01c | 27.74±0.10a |
| wheat flour | 33.11±0.25c | 76.21±0.32c | 162.03±0.3c | 9.71±0.19c | 13.38±0.07a | 66.34±0.09d | 0.93±0.01d | 25.17±0.10b |
a Values in the same columns with different letters indicate significant differences, P < 0.05. D10 (µm), D50 (µm) and D97 (µm) represent the 10th Percentile, Median or 50th Percentile, and 97th Percentile respectively it means the particle size distribution of flour).
Table 2.
Pasting properties of sorghum-wheat composite flours.
| Sample | Peak Viscosity (BU) | Trough Viscosity (BU) | Breakdown (BU) | Final (BU) | Setback (BU) | Peak time (min) | Pasting temp (°C) |
|---|---|---|---|---|---|---|---|
| W | 2882.00±41.01a | 2205.50±61.51a | 676.50±20.0c | 3522.00±32.52a | 1316.50±28.99c | 6.49±0.04a | 69.75±0.63b |
| WA | 2092.00±7.07d | 1390.00±9.89b | 702.00±16.97bc | 2799.00±24.04d | 1409.00±33.94b | 6.20±0.00c | 88.70±0.28a |
| WB | 2277.50±7.77c | 1526.00±5.65c | 736.50±19.09ba | 2989.00±26.87c | 1463.00±21.21b | 6.28±0.02bc | 88.47±0.60a |
| WC | 2429.00±63.63b | 1634.00±74.95c | 777.00±14.14a | 3214.50±86.97b | 1580.50±12.02a | 6.35±0.07b | 89.60±0.00a |
* Note:All experiments were carried out in triplicate according to independent replicate experiments, and the results were reported as mean value ± standard deviation. Values with the same superscript letters in a column are not significantly different at P < 0.05. by LSD Test. (W, WA, WB and WC represent wheat flour, wheat-coarse sorghum composite flour, wheat-fine sorghum composite flour and wheat-very fine sorghum composite flour respectively).
Table 3.
Farinograph and thermal properties of sorghum-wheat composite flour.
|
Sample |
Farinograph properties |
Thermal properties | |||||||||
|---|---|---|---|---|---|---|---|---|---|---|---|
| WA (%) | DDT (min) | Stability (min) | DS (BU) | To (°C) | Tp (°C) | Tc (°C) | Tc - To (°C) | ΔH (J/g) | |||
| W | 63.50±0.14c | 3.90±0.52a | 6.26±0.20a | 72.00±0.00c | 57.05±0.12b | 63.10±0.14b | 68.39±0.23b | 11.34±0.36a | 6.62±0.06a | ||
| WA | 64.05±0.07b | 1.11±0.00b | 4.06±0.02b | 109.00±1.41b | 58.68±0.14a | 64.42±0.08a | 69.08±0.12ab | 10.39±0.02b | 5.39±0.07b | ||
| WB | 64.15±0.07b | 1.14±0.01b | 2.40±0.02d | 112.00±1.41a | 58.57±0.05a | 64.37±0.16a | 68.82±0.38ab | 10.25±0.32b | 5.37±0.23b | ||
| WC | 64.45±0.07a | 1.15±0.01b | 3.13±0.15c | 110.00±0.00ab | 58.84±0.00a | 64.52±0.10a | 69.38±0.36a | 10.53±0.36ba | 5.74±0.32b | ||
*Note: All experiments were carried out in twice according to independent replicate experiments, and the results were reported as mean value ± standard deviation. Values with the same superscript letters in a column are not significantly different at P < 0.05. by LSD Test. (WA- Water absorption (%), DDT-Dough development time (min), DS-Degree of softening (BU), To, Tp and Tc indicate onset, peak and conclusion temperature, respectively. ΔH: gelatinization enthalpy change. W, WA, WB and WC represent wheat flour, wheat-coarse sorghum composite flour, wheat-fine sorghum composite flour and wheat-very fine sorghum composite flour respectively).
Table 4.
Water distribution and FTIR spectra analysis parameters of sorghum-wheat composite dough.
|
Sample |
Water distribution | FTIR | ||||||||
|---|---|---|---|---|---|---|---|---|---|---|
|
T21(ms) |
T22(ms) |
T23(ms) |
A21% |
A22% |
A23% |
R1048/1022 |
R995/1022 |
|||
| W | 0.14±0.18a | 6.51±0.00a | 154.78±24.99a | 19.02±0.84a | 79.91±0. .98b | 0.42±0.03c | 1.887±0.061a | 0.891±0.011b | ||
| WA | 0.14±0.13a | 5.25±0.24b | 97.03±4.59b | 18.15±0.58ab | 80.19±0.59ab | 1.62±0.08a | 1.859±0.010a | 0.892±0.001ab | ||
| WB | 0.14±0.17a | 5.11±0.00b | 108.09±4.98b | 17.28±0.91b | 81.50±0.96a | 1.16±0.08b | 1.817±0.007a | 0.912±0.012ab | ||
| WC | 0.14±0.13a | 5.11±0.00b | 108.09±4.98b | 16.99±0.25b | 81.60±0.20a | 1.23±0.04b | 1.869±0.008a | 0.914±0.004a | ||
*Note: All experiments were carried out in triplicate according to independent replicate experiments, and the results were reported as mean value ± standard deviation. Values with the same superscript letters in a column are not significantly different at P < 0.05. by LSD Test (W, WA, WB and WC represent wheat flour, wheat-coarse sorghum composite flour, wheat-fine sorghum composite flour and wheat-very fine sorghum composite flour respectively. T21 represents bound water closely bound to starch and gluten proteins. T22 represents weakly bound water bound to macromolecules such as starch and protein. T23 represents free water. A21 represents the peak area percentage of bound water. A22 represents the peak area percentage of weakly bound water. A23 represents the peak area percentage of free water. (ms) represents the milliseconds).
Table 5.
Cooking and texture characteristics of sorghum-wheat composite dried noodles.
| Parameters | W | WA | WB | WC |
|---|---|---|---|---|
| Optimal cooking time (min) | 6.54±0.00a | 6.21±0.01b | 6.04±0.04c | 5.15±0.04d |
| Water absorption (%) | 206.89±3.35a | 166.21±1.05b | 177.24±1.01c | 181.96±1.52d |
| Cooking loss (%) | 6.30±0.28a | 10.31±0.07b | 9.65±0.06c | 8.44±0.11d |
| Hardness (g) | 7169.30±33.49a | 6096.39±12.69d | 6234.52±32.35c | 6455.27±33.24b |
| Adhesiveness (g. sec) | -115.30±0.10a | -91.00±0.11d | -92.90±0.18c | -94.93±0.11b |
| Springiness (g) | 0.93±0.00a | 0.76±0.00d | 0.77±0.01c | 0.78±0.00b |
| Cohesiveness (g) | 0.74±0.01a | 0.58±0.00d | 0.59±0.00c | 0.62±0.00b |
| Chewiness | 4910.93±13.38a | 3538.40±20.15d | 3615.23±9.65c | 3712.33±6.03b |
| Resilience | 0.54±0.01a | 0.35±0.01d | 0.38±0.00c | 0.40±0.00b |
*Note: For each index, no marked difference existed between samples if the same letter occurred behind the value (P< 0.05). W, WA, WB and WC represent wheat flour noodle, wheat-coarse sorghum composite noodle, wheat-fine sorghum composite noodle and wheat-very fine sorghum composite noodle respectively.
Disclaimer/Publisher’s Note: The statements, opinions and data contained in all publications are solely those of the individual author(s) and contributor(s) and not of MDPI and/or the editor(s). MDPI and/or the editor(s) disclaim responsibility for any injury to people or property resulting from any ideas, methods, instructions or products referred to in the content. |
© 2025 by the authors. Licensee MDPI, Basel, Switzerland. This article is an open access article distributed under the terms and conditions of the Creative Commons Attribution (CC BY) license (http://creativecommons.org/licenses/by/4.0/).
Copyright: This open access article is published under a Creative Commons CC BY 4.0 license, which permit the free download, distribution, and reuse, provided that the author and preprint are cited in any reuse.


