
Submitted:
27 June 2025
Posted:
30 June 2025
You are already at the latest version
Abstract
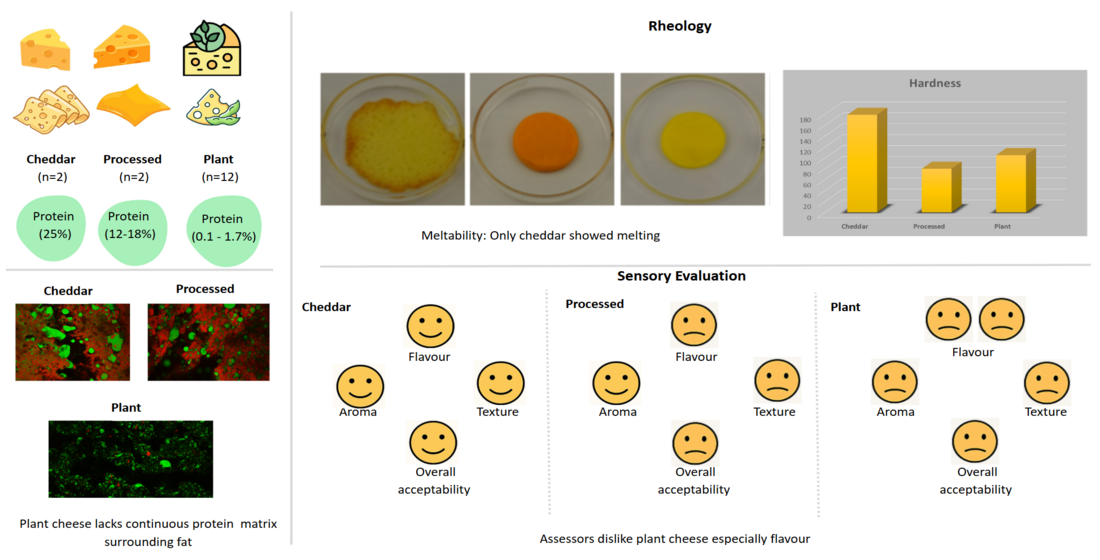
The increasing demand for plant-based foods has led to significant growth in the availability, at retail level, of plant-based cheese analogue products. This study compares composition, structure, rheology, and sensory characteristics of block- and slice-style plant-based cheeses with those of traditional dairy and processed cheeses. A total of 16 cheese products were selected from Irish retail outlets, comprising five block-style plant-based analogues, seven slice-style analogues, two Cheddar samples, and two processed cheese samples. Results showed that plant-based cheese analogues had significantly lower protein content (0.1–1.7%) than Cheddar (25%) and processed cheese (12.9-18.2%), and lacked a continuous protein matrix, being instead stabilized largely by solid fats, starch and hydrocolloids. While Cheddar cheese exhibited highest hardness, some plant-based cheeses achieved comparable hardness using texturizing agents, but still demonstrated lower tan δmax values, indicating inferior melting behaviour. Differential scanning calorimetry thermograms showed a consistent single peak at ~20°C across most plant-based variants, unlike the dual-phase melting transitions observed in dairy cheeses. Most significantly, sensory evaluation indicated that cheese analogues were disliked in terms of liking of appearance, texture, aroma, overall acceptability, especially flavour attributes. These results highlighted that considerable development is required to improve cheese analogues in terms of composition and functionality, especially in mimicking the flavour and other sensory attributes of conventional dairy-based cheeses.
Keywords:
plant-based cheese
; dairy cheese
; structure
; meltability
; rheology
; texture
; sensory evaluation
1. Introduction
Environmental and health considerations are contributing strongly to increasing demand for plant-based food offerings in the diet use [1,2]. The global market for plant-based dairy products anticipated to expand from USD 30.49 billion in 2024 to USD 62.03 billion by 2031, with a compound annual growth rate (CAGR) of 10.7% [3]. Specifically, the plant-based cheese market, which was valued at $1.4 billion in 2023, is projected to grow at a CAGR of over 16.0% by 2030 [4]. This significant growth highlights the rising consumer demand for plant-based offerings, diversity and choice in their purchasing choices.
Cheese, a fundamental component of diets worldwide, is celebrated for its wide range of flavours, textures, and versatility. Among the most popular types is Cheddar, which is traditionally made from pasteurized cow’s milk, using calf rennet or its alternatives for coagulation [5]. Processed cheese, on the other hand, is created by melting and heating natural cheese blends with the addition of emulsifying salts and other ingredients [6,7]. These conventional cheese products set the standard for the sensory and functional qualities that plant-based alternatives aim to replicate.
Plant-based cheese analogues use water, fats, proteins, emulsifiers, hydrocolloids, and flavouring agents in an attempt to mimic conventional cheese products [8,9]. Such plant-based products typically have lower protein content, higher saturated fats and carbohydrates, and different structural properties compared to established dairy products, complicating efforts to mimic the texture and melting characteristics of traditional cheese [10,11]. For example, plant proteins, with their larger molecular size and more complex quaternary structures, struggle to form the compact gel networks that casein proteins do, making it difficult to replicate functional properties such as meltability and flowability in plant-based cheeses [12].
Sensory attributes such as flavour and texture, play a crucial role in determining consumer acceptance of cheese products. Traditional dairy cheeses are highly valued for their ability to deliver these qualities. However, consumer preference remains a significant challenge for plant-based products, primarily due to their often-unpleasant intrinsic flavours and odours, which can limit their appeal. These off-flavours, frequently described as “green,” “grassy,” and “beany” arise from common volatile off-flavour (such as aldehydes, furans, alcohols, pyrazines, ketones) as well as non-volatile compounds (like phenolics, peptides, alkaloids, saponins), negatively impacting their consumer acceptance [13,14]. Assessing sensory properties is therefore essential for evaluating product performance and guiding the development of plant-based cheese products to overcome these challenges and meet consumer expectations [15].
There are different formats of cheese products including block-style and slice-style available in the market. Block cheeses are typically used for slicing and grating, while slice cheeses are primarily used in sandwiches and burgers, where texture and meltability are critical. This study analysed commercially available plant-based cheese analogues on the Irish market, specifically focusing on block-style and slice-style formats, to assess how these products compare to conventional dairy cheeses in terms of composition, physical properties, and sensory performance. A total of 16 cheese products, including plant-based blocks and slices, Cheddar, and processed cheeses, were collected from leading Irish retailers. These products were evaluated for proximate composition, microstructure, rheology, thermal behaviour, and sensory attributes using instrumental analysis and a trained sensory panel. The objective was to identify key differences and potential performance gaps between plant-based and dairy cheeses, particularly regarding flavour, texture, and meltability across both formats. By completing a comprehensive benchmarking exercise, this work provides insights into how current plant-based cheese analogues align with consumer expectations and highlights specific areas for product improvement to enhance acceptance and expand market potential.
2. Materials and Methods
2.1. Commercial Products
A total of five block-style and seven slice-style plant-based cheese analogues were identified through a survey of major Irish supermarket chains, including Tesco, Dunnes Stores, Aldi, Lidl, and SuperValu. These products were selected to represent a cross-section of popular brands and formulations available to Irish consumers, with a focus on those marketed as dairy-free cheese alternatives. To provide meaningful comparisons, two Cheddar cheeses and two processed cheese products were included as dairy-based benchmarks, reflecting typical products used for slicing, grating, or melting in everyday culinary applications. Products were sourced from Irish retailers (Tesco, Aldi, Lidl, Quay Co-op, and Dunnes) and subsequently stored at 4°C, and analysed within seven days of purchase. The details and ingredients listing for all experimental samples are presented in Table 1 (Block-style product) and Table 2 (Sliced product).
2.2. Compositional Analysis, pH and Water Activity Measurements
The composition of all experimental samples used in this study was initially determined. Protein content was measured using the Kjeldahl method 2001.14 [16], with a nitrogen to protein conversion factor of 6.38 (Cheddar and processed cheeses) and 6.25 (plant-based products) [17]. Fat content was determined using the Gerber method 933.05 for dairy [18] and Soxhlet method 30-25.01 [19] employing Sox-Cap and Sox-Tec units (Foss UK Ltd., UK) for plant-based products. Moisture and ash contents were analysed by oven drying (103°C, 5 h) and incineration (800°C, 5 h) [20,21]. Total carbohydrate content was calculated by subtracting the sum of protein, fat, ash, and moisture from 100. Sample pH was measured by creating homogenized slurries, consisting of 10 g of product and 10 mL of water at room temperature, blended for 5 min in a Stomacher (Seward Ltd., Worthing, West Sussex, UK). Water activity was measured at 20°C using a calibrated water activity meter (Aqua Lab, Decagon Devices, Inc., Pullman, WA, US). Samples were prepared for water activity measurement by cutting cylinders of 5 mm height and 40 mm diameter using a meat slicer (Scharfen G330F, Hermann Scharfen GmbH & Co. Maschinenfabrik KG, Witten, Germany) and a circular cutter, after which the water activity was measured.
2.3. Colour Measurement
Sample colour (L∗, a∗, b∗) was assessed using a CR400 chromameter (Konica Minolta Sensing, Inc., Osaka, Japan), calibrated with a white tile, following the method outlined in [22]. Measurements were taken both before and after meltability tests has been conducted (Section 2.5).
2.4. Confocal Laser Scanning Microscopy
Microstructural analysis of the products was conducted using an OLYMPUS FV1000 confocal laser scanning biological microscope (Olympus Corporation, Japan). Sample preparation followed the method described by [23], with fat and protein stained using Nile Red and Fast Green FCF, respectively. A solution containing 200 μL of Fast Green FCF (0.1 g/L in water) and 600 μL of Nile Red (0.1 g/L in 1,2-propanediol) was prepared. Approximately 50 μL of this mixture was applied to the sample, which was kept at 4°C for 10 min prior to imaging. Fast Green FCF and Nile Red were excited at wavelengths of 633 nm and 488 nm, respectively [24], and representative images were captured using a 20x magnification objective lens.
2.5. Schreiber Meltability Test
The meltability of the products was evaluated using a modified version of the Schreiber test, based on the method described in [25]. Cylindrical samples, 5 mm in height and 40 mm in diameter were prepared using a circular cutter and meat slicer, then stored at 4°C until testing. Samples were kept in a covered glass Petri dish and heated at 232°C for 5 min in an oven (Memmert, Schwabach, Germany). After heating, the samples were allowed to cool at room temperature for 30 min. Expansion of the specimens was measured with a ruler along six lines drawn on a set of concentric circles. Meltability was determined as the average of these six measurements and expressed as a percentage of specimen expansion [26]. Photographs were taken before and after melting.
2.6. Rheological Properties
2.6.1. Dynamic Low Amplitude Oscillatory Shear Rheology
A controlled-stress rheometer (AR-G2, TA Instruments Ltd., Waters LLC, Leatherhead, UK) with stainless steel parallel plates featuring a crosshatched surface was used to assess the rheological properties of the products as detailed in [27]. Samples, measuring 2 mm in height and 50 mm in diameter, were prepared with the help of a circular cutter and meat slicer, then stored overnight at 4°C. Before analysis, samples were allowed to equilibrate to room temperature. The analysis involved applying a constant force at a frequency of 1 Hz while gradually increasing the temperature from 20 to 90°C at a rate of 3°C per min. The measurements included the storage modulus (G’), loss modulus (G’’), loss tangent (Tan δ), and the maximum loss tangent (Tan δ max).
2.6.2. Texture Profile Analysis
A texture analyser (TA-XT2i, Stable Micro Systems, Godalming, Surrey, UK) was used to conduct texture profile analysis (TPA) for the block-style products following the method outlined in [28]. Cylindrical samples, measuring 20 mm in diameter and 12 mm in height, were made with stainless-steel wire cutter and a circular cutter, then stored overnight at 4°C. Upon removal from storage, the samples were immediately compressed to 25% of their original height in a double compression test at a speed of 1.0 mm/s. Measurements of hardness, adhesiveness, springiness, and cohesiveness for each product were recorded, as described in [29].
2.6.3. Uniaxial Compression Testing
Uniaxial compression testing was performed for slice-style products using a Texture Analyser TAXT2i (Stable Micro Systems Ltd., Godalming, Surrey, UK). Slices were punctured to a depth of 6 mm at a fixed test speed of 1.0 mm·s−1 and the hardness of the products was measured.
2.7. Differential Scanning Calorimetry
A differential scanning calorimeter (DSC; Mettler DSC821, Mettler-Toledo, Schwerzenbach, Switzerland) equipped with liquid nitrogen cooling was used to generate thermograms of the products, following a slightly modified version of the method described in [27]. Samples, weighing between 12 and 18 mg, were cut, prepared, and placed into standard aluminium pans (Mettler, 40 μl), which were then hermetically sealed. The calorimeter was calibrated for both temperature and heat flow using indium, and the thermal behaviour of the products was measured over a range from −40 to 90°C at a heating rate of 5°C per min to determine their thermal properties. The DSC curves obtained were analysed using the Mettler-Toledo STARe system, version 8.10, for thermal analysis.
2.8. Sensory Analysis
A sensory analysis was carried out with 25 untrained assessors (n=25) in the sensory kitchen at University College Cork, which is equipped with sensory booths. Participants were recruited from the University College Cork community, including students and staff, and represented a range of age groups (25–60+ years) and nationalities. Panellists were selected based on specific criteria: they were healthy, not following any prescribed diets, had no food allergies or swallowing difficulties, and were regular cheese consumers.
The samples were labelled with random three-digit codes using Red Jade software. Assessors were instructed to rinse their mouths with water between each sample to cleanse their palates. The panellists evaluated the coded and randomized samples using a ten-point hedonic scale. The analysis was completed in two sections. Firstly, a sensory acceptance test (SAT) using the attributes; liking of appearance, aroma, flavour, texture, and overall acceptability. Assessors then completed an optimized descriptive profiling (ODP) [30,31,32] for the attributes; colour, Cheddar aroma, firmness in the mouth, pasty texture, crumbly texture, sweetness, saltiness, sourness, bitterness, cream flavour, cheddar flavour, dairy sweetness, dairy fat flavour, fruity (ester) flavour, off-flavour, and astringent aftertaste. All samples were presented in duplicate. Sensory analysis data were processed using Unscrambler software.
2.9. Statistical Data Analysis
All analyses were conducted with nine replicates per product, derived from three independently purchased packages of each cheese analogue, with three subsamples taken from each package. Levene’s test was employed to assess the homogeneity of variance, and one-way analysis of variance (ANOVA) was performed using SPSS version 28 (SPSS Inc., Chicago, IL, USA). To identify statistically significant differences (p < 0.05) between the mean values of different samples, Tukey’s post-hoc test was applied at a 95% confidence level. The results are presented as mean ± standard deviation, with statistically significant differences indicated by superscript letters.
3. Results and Discussion
3.1. Formulation, Chemical Composition, pH and Water Activity of Products
The formulations of the products are outlined in Table 1 and Table 2. Cheddar cheese had the simplest dairy-based formulation while processed cheese was comprised of 60% cheese, along with modified starch, emulsifying salts, milk protein, and vegetable oils. All plant-based products were composed of coconut oil and various starch mixtures, with added flavourings. Notably, only slice-style Plant 6 included shea oil, in addition to coconut oil. The chemical composition, pH, and water activity of all products are detailed in Table 3 (Block) and Table 4 (Slice). The measured values for the chemical composition and pH of Cheddar and processed cheeses were in line with those reported in previous studies for retail Cheddar and processed cheeses [33,34].
Of the block-style cheeses, Cheddar cheese had the highest protein and fat content (25.6% and 34.8%, respectively), followed by processed cheese (18.5% and 24.9%). Protein levels in plant-based products ranged from 0.1% to 1.7%, much lower than dairy-based products, with Plant 4 having the highest protein (1.7%) due to the presence of potato protein components, and Plant 1 second (1.2%) as a consequence of containing lentil protein. Plant 4 also had the highest moisture content (56.9%), followed by Plant 2 (53.2%), while Cheddar cheese had the lowest (38.0%). Processed cheese had the highest ash content (4.5%). The pH of plant-based products ranged from 3.56 to 4.20, while Cheddar and processed cheeses had significantly higher pH values (5.28 and 6.03). Cheddar cheese had the lowest water activity among the products tested and was comparable to the mature cheddar results [35] and the retail cheddar cheese [33,36]. Plant 3 and 5 products had water activity comparable with cheddar cheese. The water activity (0.98) of the processed cheese was comparable to the findings for processed cheeses with roughly 50% moisture (0.97–0.98) [37]. Plant 1, 2 and 4 products had water activity comparable with processed cheese.
Similarly, in slice-style (Table 4), dairy cheese exhibited the highest protein content, with Plant 7 having the highest among others. This discrepancy is due to the high concentration of casein in dairy cheese [38]. The highest fat concentration was found in dairy cheese while among plant-based cheeses, Plant 6 had the highest fat content, reflecting the use of fat sources like coconut and shea oils [39]. Compared to dairy cheese, moisture content was higher in plant-based cheeses due to hydrocolloids and water-binding compounds present [10]. Ash content was lowest in Plant 7 but highest in processed cheese, indicating higher mineral levels. While cheddar cheese had no carbohydrates, plant-based cheeses varied, with Plant 7 being highest linked to the presence of starches and carbohydrates [40,41]. Processed cheese had the highest pH, while the most acidic plant-based cheese was Plant 4 (4.7 ± 0.0). All samples had slightly different water activities; dairy-based cheese having the lowest (0.95 ± 0.0), while Plant 5 and Plant 6 having the highest values (0.98 ± 0.0).
3.2. Colour Measurements
In the context of appearance of food, colour is crucial since it reflects quality factors like composition, consumer preference, and deterioration [42]. Processing conditions, pH, composition, age, use of colouring ingredients, and temperature all significantly impact cheese colour [43,44,45,46]. Given that temperature affects colour, measurements were made both before and after cheese melting treatments, using the CIELAB coordinates shown in Table 5 and Table 6.
In the case of Block-style (Table 5) cheeses prior to melting, the highest L* value (brightness) was determined for Plant 4 (93.6), followed by Plant 5 (92.1) and Plant 3 (90.0), with Plant 2 possessing the lowest values (79.8). Most samples possessed negative a* values (redness to greenness), with the exception of that for processed cheese (9.1) and Plant 2 (10.3), indicating a redder hue. Positive b* values (yellowness) were observed, with Plant 2 possessing the highest (50.6) values followed by processed cheese (47.6) and with Plant 4 having the lowest (7.7) values. Increased a* and b* values in processed cheese and Plant 2 may have resulted from the addition of colouring food ingredients like paprika extract and β-carotene [47,48]. After melting, significant changes in colour parameters were observed due to phase change, fat loss, moisture evaporation, and protein matrix collapse [49]. The L* values decreased across all samples indicating reduced brightness. The a* values generally decreased, with the exception of that for Plant 2, which presented an increase to 15.49, thereby maintaining its high redness values. The b* values increased in most samples, indicating greater yellowness after melting, with Plant 2 showing the highest increase (68.6) in these values. These changes can be attributed to modifications in translucency during melting [50].
Slice-style cheeses (Table 6), before melting, generally exhibited higher lightness (L*) values, indicating a lighter colour compared to dairy cheese, with Plant 1 and Plant 4 being the lightest in appearance. Processed cheese, Plant 2 and Plant 6 displayed positive a* values (reddish hue due to added colourants), whereas most other samples, including dairy cheese, had negative a* values, indicating a greenish hue. The highest b* values were observed in processed cheese, Plant 2 and Plant 6 presented a strong yellow hue. After melting, all samples showed a decrease in lightness, with Plant 2 and Plant 6 presenting the most significant darkening. The a* values become more negative in most samples, indicating a shift towards a greener hue, with the exception of that for processed cheese, Plant 2 and Plant 6 conversely became redder in appearance. The b* values increased for all samples post-melting.
3.3. Confocal Laser Scanning Microscopy (CLSM)
The confocal laser scanning microscopy images (Figure 1. Block-style and Figure 2. Slice-style) revealed significant differences in the microstructural organization of proteins (red) and fats (green) among dairy, processed cheese and plant-based cheese analogues.
Analysis of the microstructure of block-style cheeses showed that for Cheddar cheese (Figure 1a) mostly non-spherical shaped coalesced pockets/pools of fat and a continuous protein phase was observed which was consistent with previous observations [51,52]. Laser scanning of the processed cheese (Figure 1b) showed spherical and non-spherical fat globules, starch particles (black areas), and a uniform fat-protein distribution. However, the uniform distribution of fat and protein with no distinct granules suggests that starch was fully gelatinized and integrated into the matrix [53]. The microstructure was comparable to commercial processed cheeses [53]. Plant-based products also exhibited non-spherical fat globules within a starch-hydrocolloid matrix. The absence of distinct starch granules indicated full gelatinization. The plant 5 product showed very small fat globules (Figure 1g) while Plant 3 had larger fat globules than all other plant-based products (Figure 1e). While the protein content of the other plant-based products was from 0.1 to 0.1%, the plant 1 (Figure 1c) and 4 products (Figure 1f), had slightly higher protein concentrations. However, both exhibited sparse and unevenly distributed protein aggregates within the cheese matrix, indicating a lack of homogenous protein network formation.
For slice-style Cheddar cheese (Figure 2a), protein was shown to form a continuous network with larger, dispersed fat globules (green), providing elasticity, and desirable melting properties [54]. Processed cheese showed a fragmented protein matrix and smaller, finely dispersed fat globules due to emulsifying salts and heating that created a homogeneous and stable product [55,56].
Plant-based cheeses exhibited sparse red dots, indicating low protein content. Plant 1 and Plant 4 had small, well-dispersed fat globules. Plant 6 presented a very fine distribution of fat globules and intricate structure of starch, indicative of the use of emulsifying agents similar to processed cheese [7]. Plant 2 had larger, uneven fat globules, while Plants 3 and 5 possessed moderately sized fat globules. Plant 7 possessed mixed-size fat globules.
3.4. Meltability
The results of the Schreiber test for meltability are reported in Table 3 and Table 4. For block-style cheeses it was shown that after 5 min at 232°C (Figure 3h) Cheddar cheese showed the highest diameter expansion (81.7%), far exceeding that of the plant-based products (0.0–17.2%). Melting occurred due to fat flow and moisture evaporation, stretching the protein network. Fat acted as a lubricant, aiding protein mobility at higher temperatures [49]. The processed cheese (2.2%) had the lowest meltability. The use of starch in the formulation often results in decreased meltability of processed cheese due to the physical breakdown of the protein matrix with swollen starch granules [57]. Furthermore, emulsifying salts significantly impact the meltability of processed cheese [58]. Starch and hydrocolloids in plant-based products formed a continuous network, hindering melting due to starch gelatinization properties [54]. Among plant-based products, Plant 5 (Figure 3n) showed no melting and the remainder of plant-based products presented diameter expansions ranging from 2.2 to 17.2%. Plant 4 exhibited the highest melting among plant-based products (17.2%) and this was attributed to its higher moisture content.
Similarly, in slice-style products (Figure 4) Cheddar cheese exhibited the highest meltability, attributed to its well-developed protein network and larger, uniformly distributed fat globules, which facilitated better flow and spread upon heating [54]. In contrast, processed cheese showed a low meltability. Among the plant-based cheeses, most samples (Plants 1, 2, 3, 5, and 7) also demonstrated low meltability owing to the potential use of stabilizers and thickeners that inhibited melting [59]. However, Plant 4 (34.5%) and Plant 6 (46.1%) exhibited significantly higher meltability which could be attributed to their higher fat contents.
3.5. Rheological Properties
3.5.1. Dynamic Low Amplitude Oscillatory Shear Rheology
Rheological profiles for all products, as determined using dynamic low amplitude oscillatory shear testing, are shown in Figure 5 and Figure 6, with the relevant rheological parameters reported in Table 7 and Table 8.
For block-style (Table 7) Cheddar cheese G’ (elastic modulus) and G’’ (viscous modulus) decreased with increasing temperature. Initially, G’ (56.9) exceeded G’’ (15.1), reflecting solid-like behaviour. Both moduli sharply declined at 40–50°C due to fat melting and protein matrix disruption, leading to structural breakdown and desirable melting properties [6]. The tan δ (G’’/G’) increased, indicating a shift from solid-like (tan δ < 1) to fluid-like (tan δ > 1) behaviour, with a peak (1.9) at 73.3°C, reflecting maximum fluidity. After the peak, tan δ decreased slightly due to hydrophobic protein interactions [60]. Cheddar cheese’s rheological profile matched previous reporting for aged cheese [61], with G’ and G’’ crossing over (0.36 kPa) at 62.8°C, indicating the transition to fluid-like behaviour. This rheological behaviour aligns with its melting characteristics (Section 3.4).
Processed cheese exhibited a gradual decrease in moduli and a smoother tan δ increase, reflecting stability due to emulsifiers and stabilizers [62]. The Tan δmax of the plant-based products ranged between 0.1 and 0.3. These products, as well as the processed cheese, did not show a melting profile, due to the starch and hydrocolloid interactions and their rheological characteristics, as also reported previously in [63].
Slice-style Cheddar and processed cheeses showed similar rheological patterns to block styles. All slice-style plant-based products exhibited high elasticity at elevated temperatures, attributed to starch content, with slight softening above 50°C due to starch gelatinization [64]. The exceptional behaviour of Plant 6 (Figure 6h) might be due to the combination (shea & coconut oil) and amount (32g/100g) of fats used.
3.5.2. Texture Profile Analysis
The textural parameters including cohesiveness, adhesiveness, hardness, and springiness for block-type products are shown in Table 7. Dairy cheese exhibited the highest hardness, moderate springiness and cohesiveness, attributed to a firm and resilient natural protein and fat matrix, while the hardness value for the Cheddar cheese was in line with the previous study [28]. Processed cheese exhibited lower hardness and springiness but higher adhesiveness, due to emulsifiers and stabilizers. Plant-based cheeses showed wide variability in hardness, with Plant 2 and Plant 3 being hardest, while Plant 4 was the softest. Adhesiveness was generally lower, with Plant 1 being the least adhesive and Plant 5 being the most adhesive. Plant 2 demonstrated the highest springiness and cohesiveness, indicating effective hydrocolloid use for a resilient texture like dairy cheese.
3.5.3. Uniaxial Compression Testing
Uniaxial compression testing is a fundamental method used to measure the mechanical properties of materials. Hardness values of slice-style products (Table 8) showed dairy cheese as having a moderate hardness, attributed to its balanced protein and fat matrix. Processed cheese had the lowest hardness due to emulsifiers and stabilizers [66,67]. Among the plant-based cheeses, hardness varied widely, with Plant 6 being the firmest, this likely being due to the high proportion of proteins present in the sample or hydrocolloids and Plant 4 also shows high firmness, suggesting strong structural integrity. In contrast, Plant 1 (2.8 ± 0.03 N) and Plant 3 (3.3 ± 0.02 N) had hardness values closer to dairy cheese, indicating that product formulations had focussed on balancing firmness and elasticity, similar to natural cheese [68]. Plant 7 (3.8 ± 0.02 N) was firmer than dairy based cheese but softer than the firmest plant-based samples.
3.6. Differential Scanning Calorimetry
Differential scanning calorimetry (DSC) profiles (Figure 7 and Figure 8) characterised the thermal behaviour of dairy-based cheese, processed cheese, and other plant-based cheese substitutes.
The block styled dairy-based products displayed two distinct endotherms at ~10°C and ~30°C (Figure 7), corresponding to the melting of low/middle melting fractions (LMF/MMF) and high melting fractions (HMF) of milk fat, respectively [53]. The Cheddar cheese thermogram matched the findings from earlier studies [69,70], which demonstrated a constant melting pattern. Processed cheese exhibited broader peaks due to its blend of natural cheeses and emulsifying salts, leading to variable melting temperatures [7]. Plant-based cheeses, using coconut oil for their saturated fat content [71], displayed a peak around 20°C, corresponding to its melting [72].
For slice-style (Figure 8) distinct peaks in dairy cheese also represented the melting of milk fat and protein transitions. Processed cheese had a broader melting profile, peaking at ~30°C, reflecting palm oil melting and the emulsified fat-protein matrix [6].
Most plant-based cheeses, except Plant 6, showed peaks at ~20°C, linked to coconut oil usage. Plant 6, with shea and coconut oils, displayed a peak near 30°C. The absence of peaks at 60–80°C suggests minimal starch gelatinization, likely due to pre-gelatinized starch use, which does not undergo typical transitions in DSC analysis [73].
3.7. Sensory Profile Analysis
ANOVA-Partial Least Squares Regression (APLSR plot) illustrates the sensory profiles of cheeses, with Factor 1 (x-axis) and Factor 2 (y-axis) representing variance. Blue points denote products, and red points represent sensory attributes. Proximity between product and attribute indicates a positive association, while opposing positions imply a negative correlation.
Figure 9 presents the APLSR plot for block style products. Cheddar cheese emerged as the most acceptable to assessors, followed by processed cheese, being strongly associated with positive attributes such as liking of appearance, liking of flavour, liking of aroma, liking of texture, overall acceptability, cheddar aroma and cheddar flavour, which is consistent with the literature [6]. The Processed product shows a unique profile, strongly associated with attributes like colour and cheddar aroma, likely due to its standardized formulation and controlled processing conditions aligning with previous findings [74]. It is positioned away from the centre but to the right, indicating a product that may appeal in specific ways but lacks broad sensory profile like Cheddar. All plant-based cheeses were generally disliked and were close to undesirable attributes such as off-flavour, crumbly texture and astringent aftertaste etc. Beta coefficients for block-style products are presented in Table 9 which indicates the strength and direction of the relationship between each sensory attribute and the respective cheese product. Table 10 presents correlation values for each block-style product relative to sensory attributes, with green indicating positive significant correlations and red indicating negative significant correlations. Cheddar is consistently associated with positive sensory attributes, as evidenced by high beta coefficients for liking of appearance, liking of aroma, liking of flavour, liking of texture, overall acceptability, cheddar aroma etc. Processed cheese was also liked by assessors after cheddar cheese as it presented significant positive association (P<0.05) with attributes such as liking of flavour, colour, cheddar aroma and cheddar flavour etc. On the other hand, all plant-based cheese were disliked with Plant 2 and Plant 5 being the most disliked as they presented significant negative association with attributes such as liking of flavour, liking of texture and overall acceptability, colour and pasty texture. Similarly, liking of appearance, colour, firmness in mouth, cheddar flavour and aroma were significantly negatively correlated with Plant 4. Plants 1 and 3 were also negatively associated with desirable attributes. Moreover, all the plant-based products are positively associated (Table 9) with undesirable sensory characteristics such as crumbly texture, off flavour and astringent aftertaste, highlighting their limitation for replication of milk products. The sensory evaluation of slice-style cheeses is presented in the APLSR plot (Figure 10). Cheddar cheese is positioned to the far left of the plot along Factor 1 and slightly above the origin on Factor 2, indicating that it is distinct from the other products. Cheddar is closely associated with positive attributes such as liking of appearance, liking of aroma, liking of flavour, liking of texture, overall acceptability, cheddar flavour etc. This positioning suggests that Cheddar is perceived very positively, aligning with traditional expectations for this product type. Assessors did not like the processed cheese especially due to its sticky and pasty texture that could be attributed to its formulation process which resulted in more homogenized product. All the plant-based cheese products were disliked as they were far from desirable attributes and closer to undesirable sensory characteristics.
The combined results from Table 11 (beta coefficients) and Table 12 (correlation values) reinforce the sensory profiles suggested by the APLSR plot for the slice-style products. Cheddar stands out with high positive beta coefficients and strong correlations across key sensory attributes such as liking of appearance, liking of aroma, liking of flavour, liking of texture, overall acceptability, cheddar aroma, cheddar flavour, dairy fat flavour confirming its favourable sensory profile. In contrast, Processed cheese shows negative beta coefficients and correlations for most sensory attributes, particularly pasty texture which could be the reason for its dislikeness. Plants 4, 6 and 7 were significantly negatively correlated with desirable attributes such as liking of aroma, liking of flavour and overall acceptability while significantly positively associated with undesirable attributes like off flavour. Plant 1, 3 and 5 showed non-significant positive correlations with many attributes like liking of texture, liking of appearance, liking of flavour and overall acceptability but also negative correlations for other attributes such as colour, crumbly texture, off-flavour indicating a mixed sensory profile that is reflected in their moderate placement in the APLSR plot. Lastly, Plant 2 is significantly negatively correlated with liking of flavour, pasty texture and sour taste. Negative attributes such as off-flavour, astringent aftertaste, and crumbly texture significantly detract from their acceptability, highlighting the sensory limitations of plant-based cheese alternatives. These findings emphasize the importance of ingredient selection and fermentation to improve the texture and flavour of plant-based cheeses [14,75].
4. Conclusions
Significant differences were observed between plant-based and dairy-based products. With plant-based cheeses having lower protein, higher moisture, and higher carbohydrate content due to the use of hydrocolloids and starches, while Cheddar cheese had the simplest composition and highest protein content. Before melting, plant-based cheeses generally had higher lightness (L*), with redness (a*) and yellowness (b*) as influenced by colorants like paprika extract, while upon melting, lightness decreased across all samples. Microstructural analysis revealed no continuous protein network in plant-based products, unlike Cheddar cheese, which exhibited a natural protein-fat matrix contributing to its high hardness. Plant-based cheeses showed varied hardness, with some achieving firmness similar to dairy cheese through hydrocolloids. Processed and most plant-based cheeses had low meltability due to starch, stabilizers, and emulsifying salts. Sensory evaluation found traditional dairy cheese most preferred, with strong positive correlations for flavour, texture, and acceptability. Processed cheese was moderately accepted, while plant-based cheeses had least likeness of flavour and texture leading to lowest overall acceptability.
The study highlights the challenges plant-based cheeses face in replicating dairy cheese’s sensory and functional attributes. Despite advancements, textural and sensory deficiencies remain, emphasizing the need for further research on ingredient optimization and fermentation to improve consumer acceptance and market competitiveness.
Author Contributions
Conceptualization, F.A., J.A.O., and J.P.K.; analysis, F.A.; data curation, F.A.; writing—original draft preparation, F.A.; writing—review and editing, F.A., J.A.O., J.P.K., M.O.S.; supervision, J.P.K., J.A.O. and M.O.S; funding acquisition, J.P.K. All authors have read and agreed to the published version of the manuscript.
Funding
Author Farhan Ali was supported by the Department of Agriculture, Food and Marine (DAEM) under the research funding programme of Food Institutional Research Measure (FIRM).
Data Availability Statement
Data are presented within the article.
Conflicts of Interest
The authors declare no conflict of interest.
References
- Poore, J.; Nemecek, T. Reducing Food’s Environmental Impacts through Producers and Consumers. Science 2018, 360, 987–992. [Google Scholar] [CrossRef] [PubMed]
- Springmann, M.; Clark, M.; Mason-D’Croz, D.; Wiebe, K.; Bodirsky, B.L.; Lassaletta, L.; De Vries, W.; Vermeulen, S.J.; Herrero, M.; Carlson, K.M.; et al. Options for Keeping the Food System within Environmental Limits. Nature 2018, 562, 519–525. [Google Scholar] [CrossRef] [PubMed]
- Research, V.M. Dairy Alternatives Market Size Worth $ 62.03 Billion, Globally, by 2031 at 10.68% CAGR—Report By Verified Market Research®. Available online: https://www.globenewswire.com/en/news-release/2024/03/21/2850339/0/en/Dairy-Alternatives-Market-size-worth-62-03-Billion-Globally-by-2031-at-10-68-CAGR-Report-By-Verified-Market-Research.html (accessed on 29 August 2024).
- Vegan Cheese Market Size and Trend Analysis by Region, Type, Source (Almond, Cashew, Coconut, Soy) and Segment Forecast to 2030. Mark. Res. Rep. Consult. Glob. UK Ltd.
- Fox, P.F.; McSweeney, P.L.H.; Cogan, T.M.; Guinee, T.P. Cheese: Chemistry, Physics and Microbiology, Volume 1: General Aspects; Elsevier, 2004; ISBN 978-0-08-050093-5.
- Fox, P.F.; Guinee, T.P.; Cogan, T.M.; McSweeney, P.L.H. Fundamentals of Cheese Science; Springer US: Boston, MA, 2017; ISBN 978-1-4899-7679-6. [Google Scholar]
- Tamime, A.Y. Processed Cheese and Analogues; John Wiley & Sons, 2011; ISBN 978-1-4443-4183-6.
- Guinee, T.P.; Carić, M.; Kaláb, M. Pasteurized Processed Cheese and Substitute/Imitation Cheese Products. In Cheese: Chemistry, Physics and Microbiology; Fox, P.F., McSweeney, P.L.H., Cogan, T.M., Guinee, T.P., Eds.; Major Cheese Groups; Academic Press, 2004; Vol. 2, pp. 349–394. https://doi.org/10.1016/S1874-558X(04)80052-6. [CrossRef]
- Guinee, T.P.; Mulholland, E.O.; Kelly, J.; Callaghan, D.J.O. Effect of Protein-to-Fat Ratio of Milk on the Composition, Manufacturing Efficiency, and Yield of Cheddar Cheese. J. Dairy Sci. 2007, 90, 110–123. [Google Scholar] [CrossRef] [PubMed]
- Ferawati, F.; Hefni, M.; Östbring, K.; Witthöft, C. The Application of Pulse Flours in the Development of Plant-Based Cheese Analogues: Proximate Composition, Color, and Texture Properties. Foods 2021, 10, 2208. [Google Scholar] [CrossRef]
- Kamath, R.; Basak, S.; Gokhale, J. Recent Trends in the Development of Healthy and Functional Cheese Analogues-a Review. LWT 2022, 155, 112991. [Google Scholar] [CrossRef]
- Nicolás Saraco, M.; Blaxland, J. Dairy-Free Imitation Cheese: Is Further Development Required? Br. Food J. 2020, 122, 3727–3740. [Google Scholar] [CrossRef]
- Leonard, W.; Zhang, P.; Ying, D.; Fang, Z. Surmounting the Off-Flavor Challenge in Plant-Based Foods. Crit. Rev. Food Sci. Nutr. 2023, 63, 10585–10606. [Google Scholar] [CrossRef]
- Short, E.C.; Kinchla, A.J.; Nolden, A.A. Plant-Based Cheeses: A Systematic Review of Sensory Evaluation Studies and Strategies to Increase Consumer Acceptance. Foods 2021, 10, 725. [Google Scholar] [CrossRef]
- McClements, D.J. Development of Next-Generation Nutritionally Fortified Plant-Based Milk Substitutes: Structural Design Principles. Foods 2020, 9, 421. [Google Scholar] [CrossRef]
- AOAC Official Methods of Analysis-Determination of Nitrogen (Total) in Cheese 2001.14 2002.
- Jones, D.B. Factors for Converting Percentages of Nitrogen in Foods and Feeds Into Percentages of Proteins; U.S. Department of Agriculture, 1931.
- AOAC Official Methods of Analysis-fat 933.05 1990.
- AACC Approved Methods of Analysis-Crude Fat in Wheat, Corn, and Soy Flour, Feeds, and Mixed.
- Feeds 30-25.01 2009.
- AOAC Official Methods of Analysis-Moisture in Cheese 926.08 1990.
- AOAC Official Methods of Analysis-Ash of Cheese 935.42 1990.
- Li, B.; Waldron, D.S.; Tobin, J.T.; Subhir, S.; Kelly, A.L.; McSweeney, P.L.H. Evaluation of Production of Cheddar Cheese from Micellar Casein Concentrate. Int. Dairy J. 2020, 107, 104711. [Google Scholar] [CrossRef]
- Le Tohic, C.; O’Sullivan, J.J.; Drapala, K.P.; Chartrin, V.; Chan, T.; Morrison, A.P.; Kerry, J.P.; Kelly, A.L. Effect of 3D Printing on the Structure and Textural Properties of Processed Cheese. J. Food Eng. 2018, 220, 56–64. [Google Scholar] [CrossRef]
- Auty, M. a. E.; Twomey, M.; Guinee, T.P.; Mulvihill, D.M. Development and Application of Confocal Scanning Laser Microscopy Methods for Studying the Distribution of Fat and Protein in Selected Dairy Products. J. Dairy Res. 2001, 68, 417–427. [Google Scholar] [CrossRef] [PubMed]
- Altan, A.; Turhan, M.; Gunasekaran, S. Short Communication: Comparison of Covered and Uncovered Schreiber Test for Cheese Meltability Evaluation. J. Dairy Sci. 2005, 88, 857–861. [Google Scholar] [CrossRef]
- Ramel, P.R.; Marangoni, A.G. Processed Cheese as a Polymer Matrix Composite: A Particle Toolkit for the Replacement of Milk Fat with Canola Oil in Processed Cheese. Food Res. Int. 2018, 107, 110–118. [Google Scholar] [CrossRef]
- Grasso, N.; Roos, Y.H.; Crowley, S.V.; Arendt, E.K.; O’Mahony, J.A. Composition and Physicochemical Properties of Commercial Plant-Based Block-Style Products as Alternatives to Cheese. Future Foods 2021, 4, 100048. [Google Scholar] [CrossRef]
- O’Mahony, J.A.; Lucey, J.A.; McSweeney, P.L.H. Chymosin-Mediated Proteolysis, Calcium Solubilization, and Texture Development During the Ripening of Cheddar Cheese. J. Dairy Sci. 2005, 88, 3101–3114. [Google Scholar] [CrossRef]
- Ahmed, J.; Basu, S. Advances in Food Rheology and Its Applications; Woodhead Publishing, 2016; ISBN 978-0-08-100432-6.
- de Cássia dos Santos Navarro da Silva, R.; Minim, V.P.R.; Simiqueli, A.A.; da Silva Moraes, L.E.; Gomide, A.I.; Minim, L.A. Optimized Descriptive Profile: A Rapid Methodology for Sensory Description. Food Qual. Prefer. 2012, 24, 190–200. [Google Scholar] [CrossRef]
- Silva, R. de C. dos S.N. da; Minim, V.P.R.; Carneiro, J. de D.S.; Nascimento, M.; Della Lucia, S.M.; Minim, L.A. Quantitative Sensory Description Using the Optimized Descriptive Profile: Comparison with Conventional and Alternative Methods for Evaluation of Chocolate. Food Qual. Prefer. 2013, 30, 169–179. [Google Scholar] [CrossRef]
- Silva, R. de C. dos S.N. da; Minim, V.P.R.; Silva, A.N. da; Peternelli, L.A.; Minim, L.A. Optimized Descriptive Profile: How Many Judges Are Necessary? Food Qual. Prefer. 2014, 36, 3–11. [Google Scholar] [CrossRef]
- McCarthy, C.M.; Wilkinson, M.G.; Kelly, P.M.; Guinee, T.P. A Profile of the Variation in Compositional, Proteolytic, Lipolytic and Fracture Properties of Retail Cheddar Cheese. Int. J. Dairy Technol. 2017, 70, 469–480. [Google Scholar] [CrossRef]
- Trivedi, D.; Bennett, R.J.; Hemar, Y.; Reid, D.C.W.; Lee, S.K.; Illingworth, D. Effect of Different Starches on Rheological and Microstructural Properties of (II) Commercial Processed Cheese. Int. J. Food Sci. Technol. 2008, 43, 2197–2203. [Google Scholar] [CrossRef]
- Hickey, D.K.; Guinee, T.P.; Hou, J.; Wilkinson, M.G. Effects of Variation in Cheese Composition and Maturation on Water Activity in Cheddar Cheese during Ripening. Int. Dairy J. 2013, 30, 53–58. [Google Scholar] [CrossRef]
- Marcos, A.; Alcalá, M.; León, F.; Fernández-Salguero, J.; Esteban, M.A. Water Activity and Chemical Composition of Cheese. J. Dairy Sci. 1981, 64, 622–626. [Google Scholar] [CrossRef]
- Duggan, E.; Noronha, N.; O’Riordan, E.D.; O’Sullivan, M. Effect of Resistant Starch on the Water Binding Properties of Imitation Cheese. J. Food Eng. 2008, 84, 108–115. [Google Scholar] [CrossRef]
- Craig, W.J.; Mangels, A.R.; Brothers, C.J. Nutritional Profiles of Non-Dairy Plant-Based Cheese Alternatives. Nutrients 2022, 14, 1247. [Google Scholar] [CrossRef]
- Mattice, K.D.; Marangoni, A.G. Fat Crystallization and Structure in Bakery, Meat, and Cheese Systems. In Structure-Function Analysis of Edible Fats; Elsevier, 2019; pp. 287–311 ISBN 978-0-12-814041-3.
- Fan, M.; Wei, T.; Lu, X.; Liu, M.; Huang, Y.; Chen, F.; Luo, T.; Fan, Y.; Liu, R.; Deng, Z.; et al. Comprehensive Quality Evaluation of Plant-Based Cheese Analogues. J. Sci. Food Agric. 2023, 103, 6595–6604. [Google Scholar] [CrossRef]
- Fresán, U.; Rippin, H. Nutritional Quality of Plant-Based Cheese Available in Spanish Supermarkets: How Do They Compare to Dairy Cheese? Nutrients 2021, 13, 3291. [Google Scholar] [CrossRef]
- MacDougall, D.B. 3—Colour Measurement of Food: Principles and Practice. In Colour in Food; MacDougall, D.B., Ed.; Woodhead Publishing Series in Food Science, Technology and Nutrition; Woodhead Publishing, 2002; pp. 33–63 ISBN 978-1-85573-590-3.
- Dave, R.I.; McMahon, D.J.; Broadbent, J.R.; Oberg, C.J. Reversibility of the Temperature-Dependent Opacity of Nonfat Mozzarella Cheese1. J. Dairy Sci. 2001, 84, 2364–2371. [Google Scholar] [CrossRef]
- Joshi, N. s.; Muthukumarappan, K.; Dave, R. i. Effect of Calcium on Physicochemical Properties of Fat-Free Mozzarella Cheese. J. Food Sci. 2003, 68, 2289–2294. [Google Scholar] [CrossRef]
- Metzger, L.E.; Barbano, D.M.; Kindstedt, P.S. Effect of Milk Preacidification on Low Fat Mozzarella Cheese: III. Post-Melt Chewiness and Whiteness. J. Dairy Sci. 2001, 84, 1357–1366. [Google Scholar] [CrossRef] [PubMed]
- Wadhwani, R.; McMahon, D.J. Color of Low-Fat Cheese Influences Flavor Perception and Consumer Liking. J. Dairy Sci. 2012, 95, 2336–2346. [Google Scholar] [CrossRef] [PubMed]
- Ghosh, S.; Sarkar, T.; Chakraborty, R.; Shariati, M.A.; Simal-Gandara, J. Nature’s Palette: An Emerging Frontier for Coloring Dairy Products. Crit. Rev. Food Sci. Nutr. 2024, 64, 1508–1552. [Google Scholar] [CrossRef] [PubMed]
- Sharma, P.; Segat, A.; Kelly, A.L.; Sheehan, J.J. Colorants in Cheese Manufacture: Production, Chemistry, Interactions, and Regulation. Compr. Rev. Food Sci. Food Saf. 2020, 19, 1220–1242. [Google Scholar] [CrossRef]
- Wang, H.-H.; Sun, D.-W. Melting Characteristics of Cheese: Analysis of Effects of Cooking Conditions Using Computer Vision Technology. J. Food Eng. 2002, 51, 305–310. [Google Scholar] [CrossRef]
- Ibáñez, R.A.; Waldron, D.S.; McSweeney, P.L.H. Effect of Fat Content and Temperature on the Translucency of Cheddar Cheese. Int. Dairy J. 2016, 54, 33–42. [Google Scholar] [CrossRef]
- Guinee, T.P.; Auty, M.A.E.; Fenelon, M.A. The Effect of Fat Content on the Rheology, Microstructure and Heat-Induced Functional Characteristics of Cheddar Cheese. Int. Dairy J. 2000, 10, 277–288. [Google Scholar] [CrossRef]
- Rogers, N.R.; McMahon, D.J.; Daubert, C.R.; Berry, T.K.; Foegeding, E.A. Rheological Properties and Microstructure of Cheddar Cheese Made with Different Fat Contents. J. Dairy Sci. 2010, 93, 4565–4576. [Google Scholar] [CrossRef]
- Ramel, P.R.; Marangoni, A.G. Characterization of the Polymorphism of Milk Fat within Processed Cheese Products. Food Struct. 2017, 12, 15–25. [Google Scholar] [CrossRef]
- Lucey, J.A.; Johnson, M.E.; Horne, D.S. Invited Review: Perspectives on the Basis of the Rheology and Texture Properties of Cheese. J. Dairy Sci. 2003, 86, 2725–2743. [Google Scholar] [CrossRef]
- Savello, P.A.; Ernstrom, C.A.; Kalab, M. Microstructure and Meltability of Model Process Cheese Made with Rennet and Acid Casein. J. Dairy Sci. 1989, 72, 1–11. [Google Scholar] [CrossRef]
- Vollmer, A.; Kieferle, I.; Youssef, N.N.; Kulozik, U. Mechanisms of Structure Formation Underlying the Creaming Reaction in a Processed Cheese Model System as Revealed by Light and Transmission Electron Microscopy. J. Dairy Sci. 2021. [Google Scholar] [CrossRef]
- Mounsey, J. s.; O’riordan, E. d. Characteristics of Imitation Cheese Containing Native Starches. J. Food Sci. 2001, 66, 586–591. [Google Scholar] [CrossRef]
- Masotti, F.; Cattaneo, S.; Stuknytė, M.; De Noni, I. Status and Developments in Analogue Cheese Formulations and Functionalities. Trends Food Sci. Technol. 2018, 74, 158–169. [Google Scholar] [CrossRef]
- Beykont, E.; Kilic-Akyilmaz, M. Physical Properties of an Imitation Cheese as Affected by Emulsifying Salts and Citric Acid. J. Food Process. Preserv. 2014, 38, 1918–1925. [Google Scholar] [CrossRef]
- Bryant, C.M.; McClements, D.J. Molecular Basis of Protein Functionality with Special Consideration of Cold-Set Gels Derived from Heat-Denatured Whey. Trends Food Sci. Technol. 1998, 9, 143–151. [Google Scholar] [CrossRef]
- Lucey, J.A.; Mishra, R.; Hassan, A.; Johnson, M.E. Rheological and Calcium Equilibrium Changes during the Ripening of Cheddar Cheese. Int. Dairy J. 2005, 15, 645–653. [Google Scholar] [CrossRef]
- Brickley, C.A.; Govindasamy-Lucey, S.; Jaeggi, J.J.; Johnson, M.E.; McSweeney, P.L.H.; Lucey, J.A. Influence of Emulsifying Salts on the Textural Properties of Nonfat Process Cheese Made from Direct Acid Cheese Bases. J. Dairy Sci. 2008, 91, 39–48. [Google Scholar] [CrossRef]
- Mattice, K.D.; Marangoni, A.G. Physical Properties of Plant-Based Cheese Products Produced with Zein. Food Hydrocoll. 2020, 105, 105746. [Google Scholar] [CrossRef]
- Liu, S.; Yuan, T.Z.; Wang, X.; Reimer, M.; Isaak, C.; Ai, Y. Behaviors of Starches Evaluated at High Heating Temperatures Using a New Model of Rapid Visco Analyzer ‒ RVA 4800. Food Hydrocoll. 2019, 94, 217–228. [Google Scholar] [CrossRef]
- Mahmood, K.; Kamilah, H.; Shang, P.L.; Sulaiman, S.; Ariffin, F.; Alias, A.K. A Review: Interaction of Starch/Non-Starch Hydrocolloid Blending and the Recent Food Applications. Food Biosci. 2017, 19, 110–120. [Google Scholar] [CrossRef]
- Dimitreli, G.; Thomareis, A.S. Instrumental Textural and Viscoelastic Properties of Processed Cheese as Affected by Emulsifying Salts and in Relation to Its Apparent Viscosity. Int. J. Food Prop. 2009, 12, 261–275. [Google Scholar] [CrossRef]
- Hladká, K.; Randulová, Z.; Tremlová, B.; Ponížil, P.; Mančík, P.; Černíková, M.; Buňka, F. The Effect of Cheese Maturity on Selected Properties of Processed Cheese without Traditional Emulsifying Agents. LWT—Food Sci. Technol. 2014, 55, 650–656. [Google Scholar] [CrossRef]
- Milani, J.; Maleki, G.; Milani, J.; Maleki, G. Hydrocolloids in Food Industry. In Food Industrial Processes—Methods and Equipment; IntechOpen, 2012 ISBN 978-953-307-905-9.
- Chen, Y.; MacNaughtan, W.; Jones, P.; Yang, Q.; Foster, T. The State of Water and Fat during the Maturation of Cheddar Cheese. Food Chem. 2020, 303, 125390. [Google Scholar] [CrossRef]
- Mulet, A.; Benedito, J.; Bon, J.; Rossello, C. Ultrasonic Velocity in Cheddar Cheese as Affected by Temperature. J. Food Sci. 1999, 64, 1038–1041. [Google Scholar] [CrossRef]
- Shen, Z.; Birkett, A.; Augustin, M.; Dungey, S.; Versteeg, C. Melting Behavior of Blends of Milk Fat with Hydrogenated Coconut and Cottonseed Oils. J. Am. Oil Chem. Soc. 2001, 78, 387–394. [Google Scholar] [CrossRef]
- Bulaka, B.; Syarifuddin, S.; Harianto, E. Coconut Oil Heat Capacity. 2021. [Google Scholar] [CrossRef]
- Lelièvre, J.; Liu, H. A Review of Thermal Analysis Studies of Starch Gelatinization. Thermochim. Acta 1994, 246, 309–315. [Google Scholar] [CrossRef]
- McSweeney, P.L.H.; Ottogalli, G.; Fox, P.F. Diversity of Cheese Varieties: An Overview. In Cheese: Chemistry, Physics and Microbiology; Fox, P.F., McSweeney, P.L.H., Cogan, T.M., Guinee, T.P., Eds.; Major Cheese Groups; Academic Press, 2004; Vol. 2, pp. 1–23.
- Pua, A.; Tang, V.C.Y.; Goh, R.M.V.; Sun, J.; Lassabliere, B.; Liu, S.Q. Ingredients, Processing, and Fermentation: Addressing the Organoleptic Boundaries of Plant-Based Dairy Analogues. Foods 2022, 11, 875. [Google Scholar] [CrossRef]
Figure 1.
Confocal laser scanning microscopy images (x20) of block-style Cheddar (a), processed (b), plant 1 (c), plant 2 (d), plant 3 (e), plant 4 (f) and plant 5 (g) products. The images show distribution of fat globules (green) and protein (red). Scale bar corresponds to 30 μm.
Figure 1.
Confocal laser scanning microscopy images (x20) of block-style Cheddar (a), processed (b), plant 1 (c), plant 2 (d), plant 3 (e), plant 4 (f) and plant 5 (g) products. The images show distribution of fat globules (green) and protein (red). Scale bar corresponds to 30 μm.
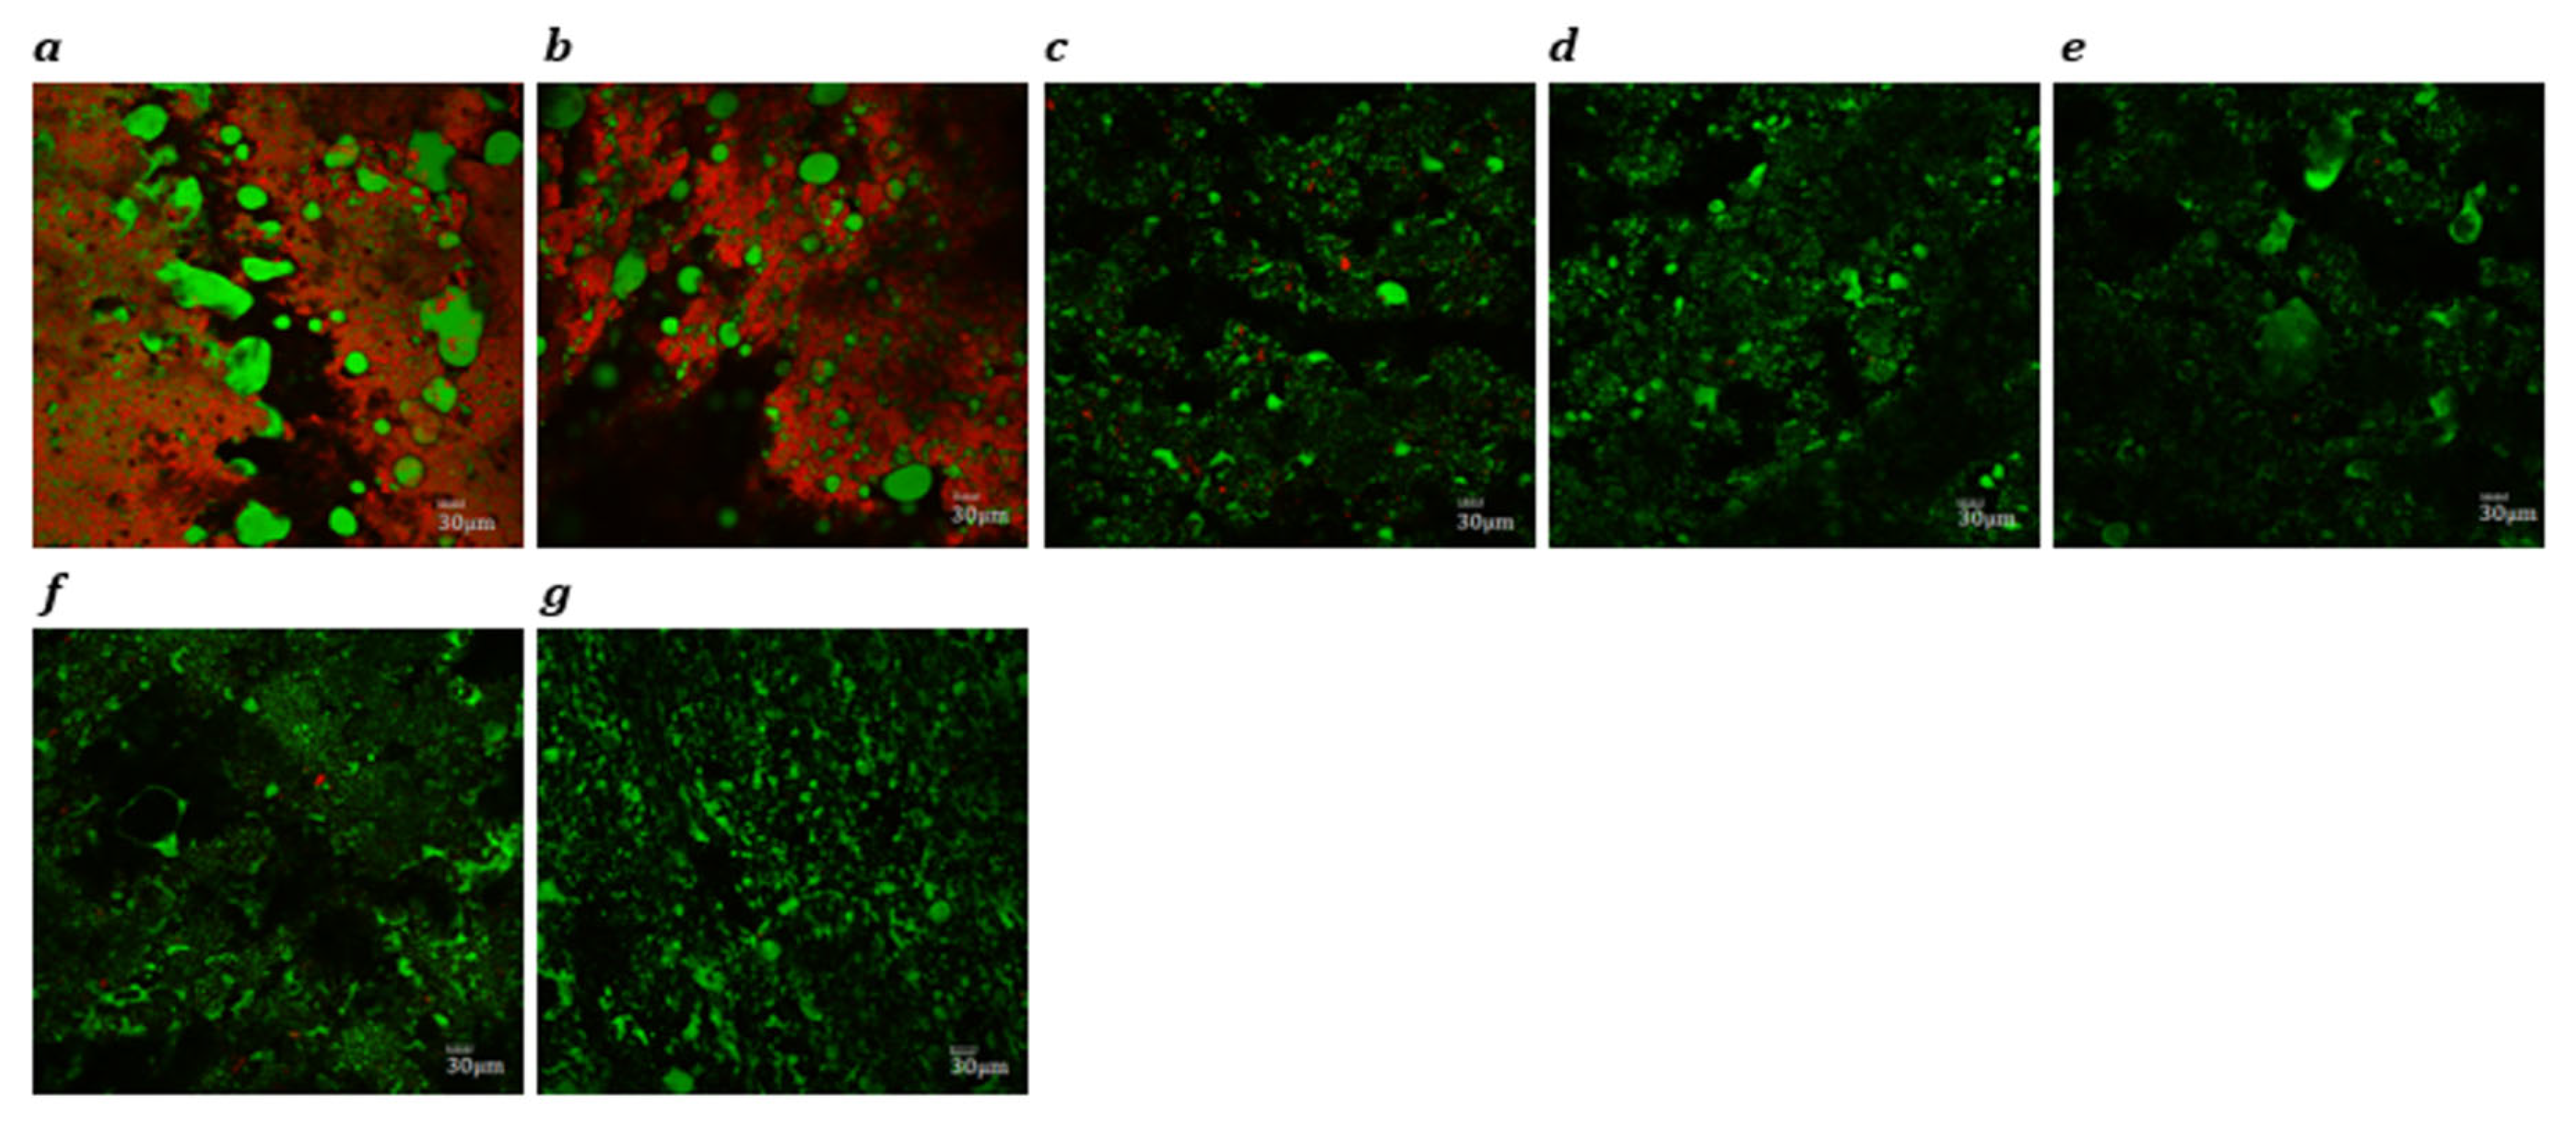
Figure 2.
Confocal laser scanning microscopy images (x20) of Slice-style Cheddar (a), processed (b), plant 1 (c), plant 2 (d), plant 3 (e), plant 4 (f), plant 5 (g), plant 6 (h) and plant 7 (i) products. The images show distribution of fat globules (green) and protein (red). Scale bar corresponds to 30 μm.
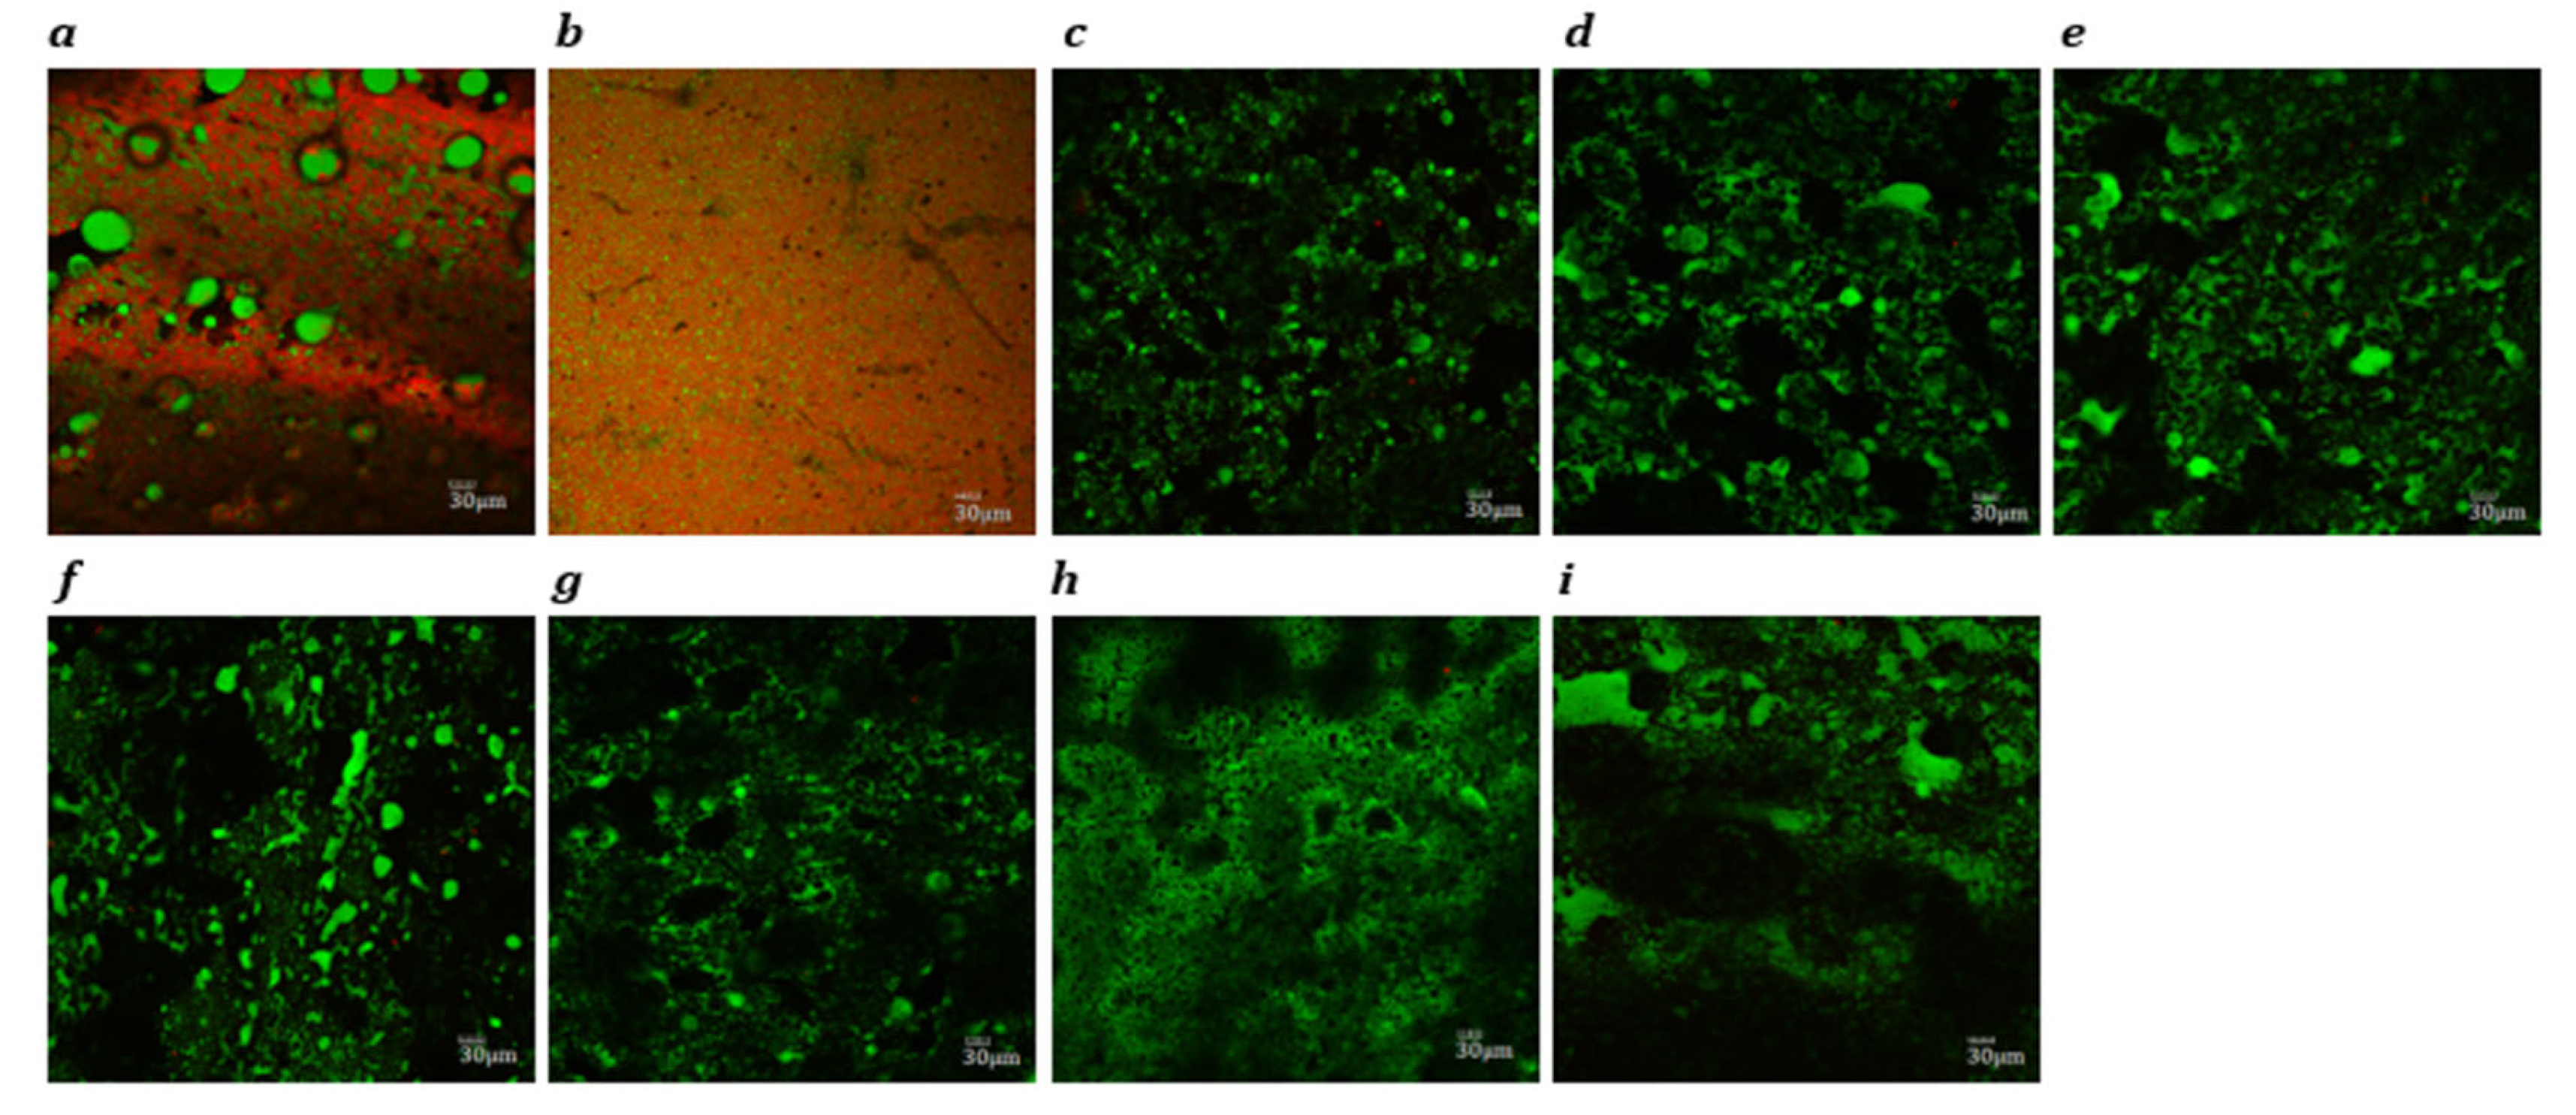
Figure 3.
Photographs of Block style cheddar, processed, plant 1, plant 2, plant 3, plant 4 and plant 5 products before (a-g) and after (h-n) oven melting at 232°C for 5 min.
Figure 3.
Photographs of Block style cheddar, processed, plant 1, plant 2, plant 3, plant 4 and plant 5 products before (a-g) and after (h-n) oven melting at 232°C for 5 min.
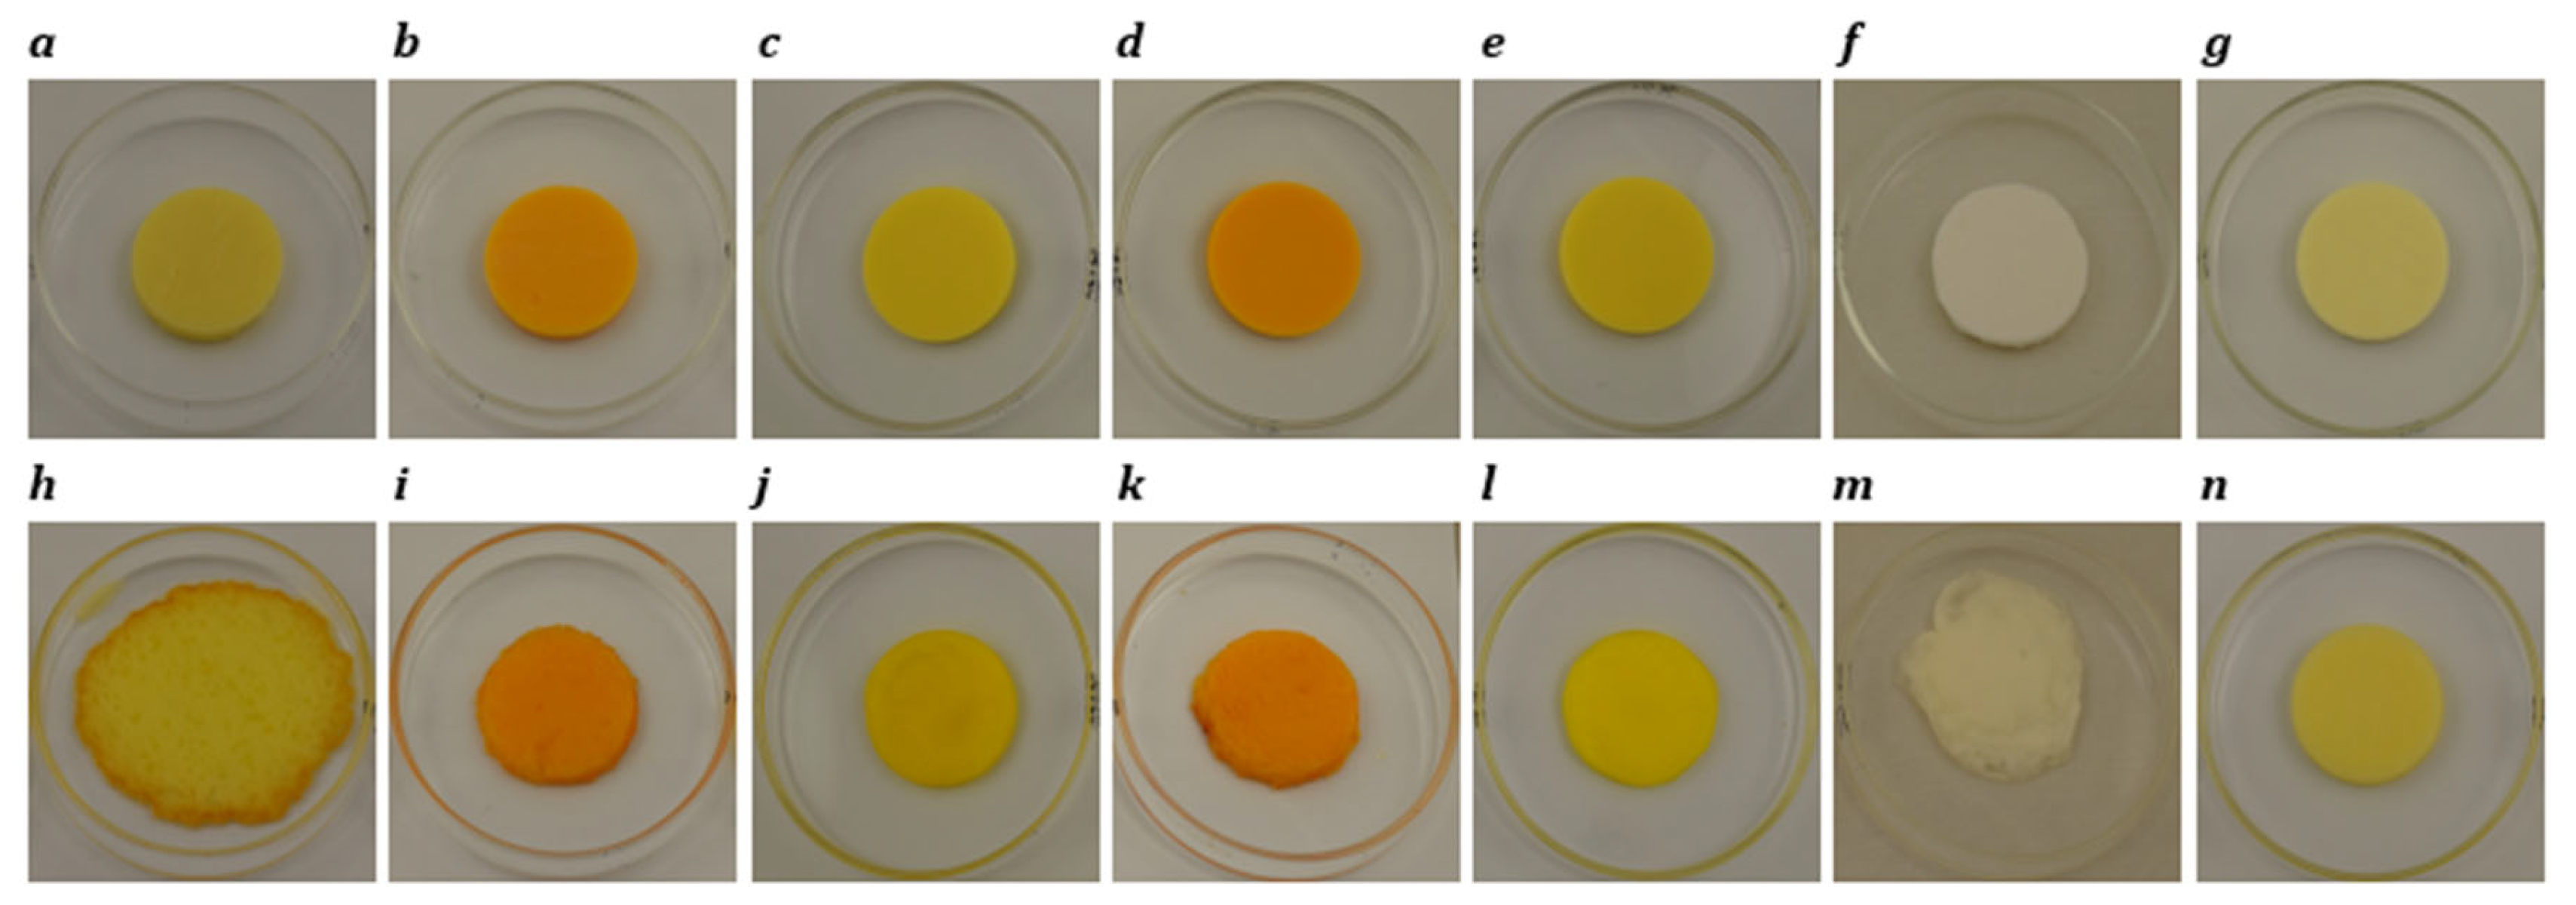
Figure 4.
Photographs of Slice style cheddar, processed, plant 1, plant 2, plant 3, plant 4, plant 5, plant 6 and plant 7 products before (a-i) and after (j-r) oven melting at 232°C for 5 min.
Figure 4.
Photographs of Slice style cheddar, processed, plant 1, plant 2, plant 3, plant 4, plant 5, plant 6 and plant 7 products before (a-i) and after (j-r) oven melting at 232°C for 5 min.
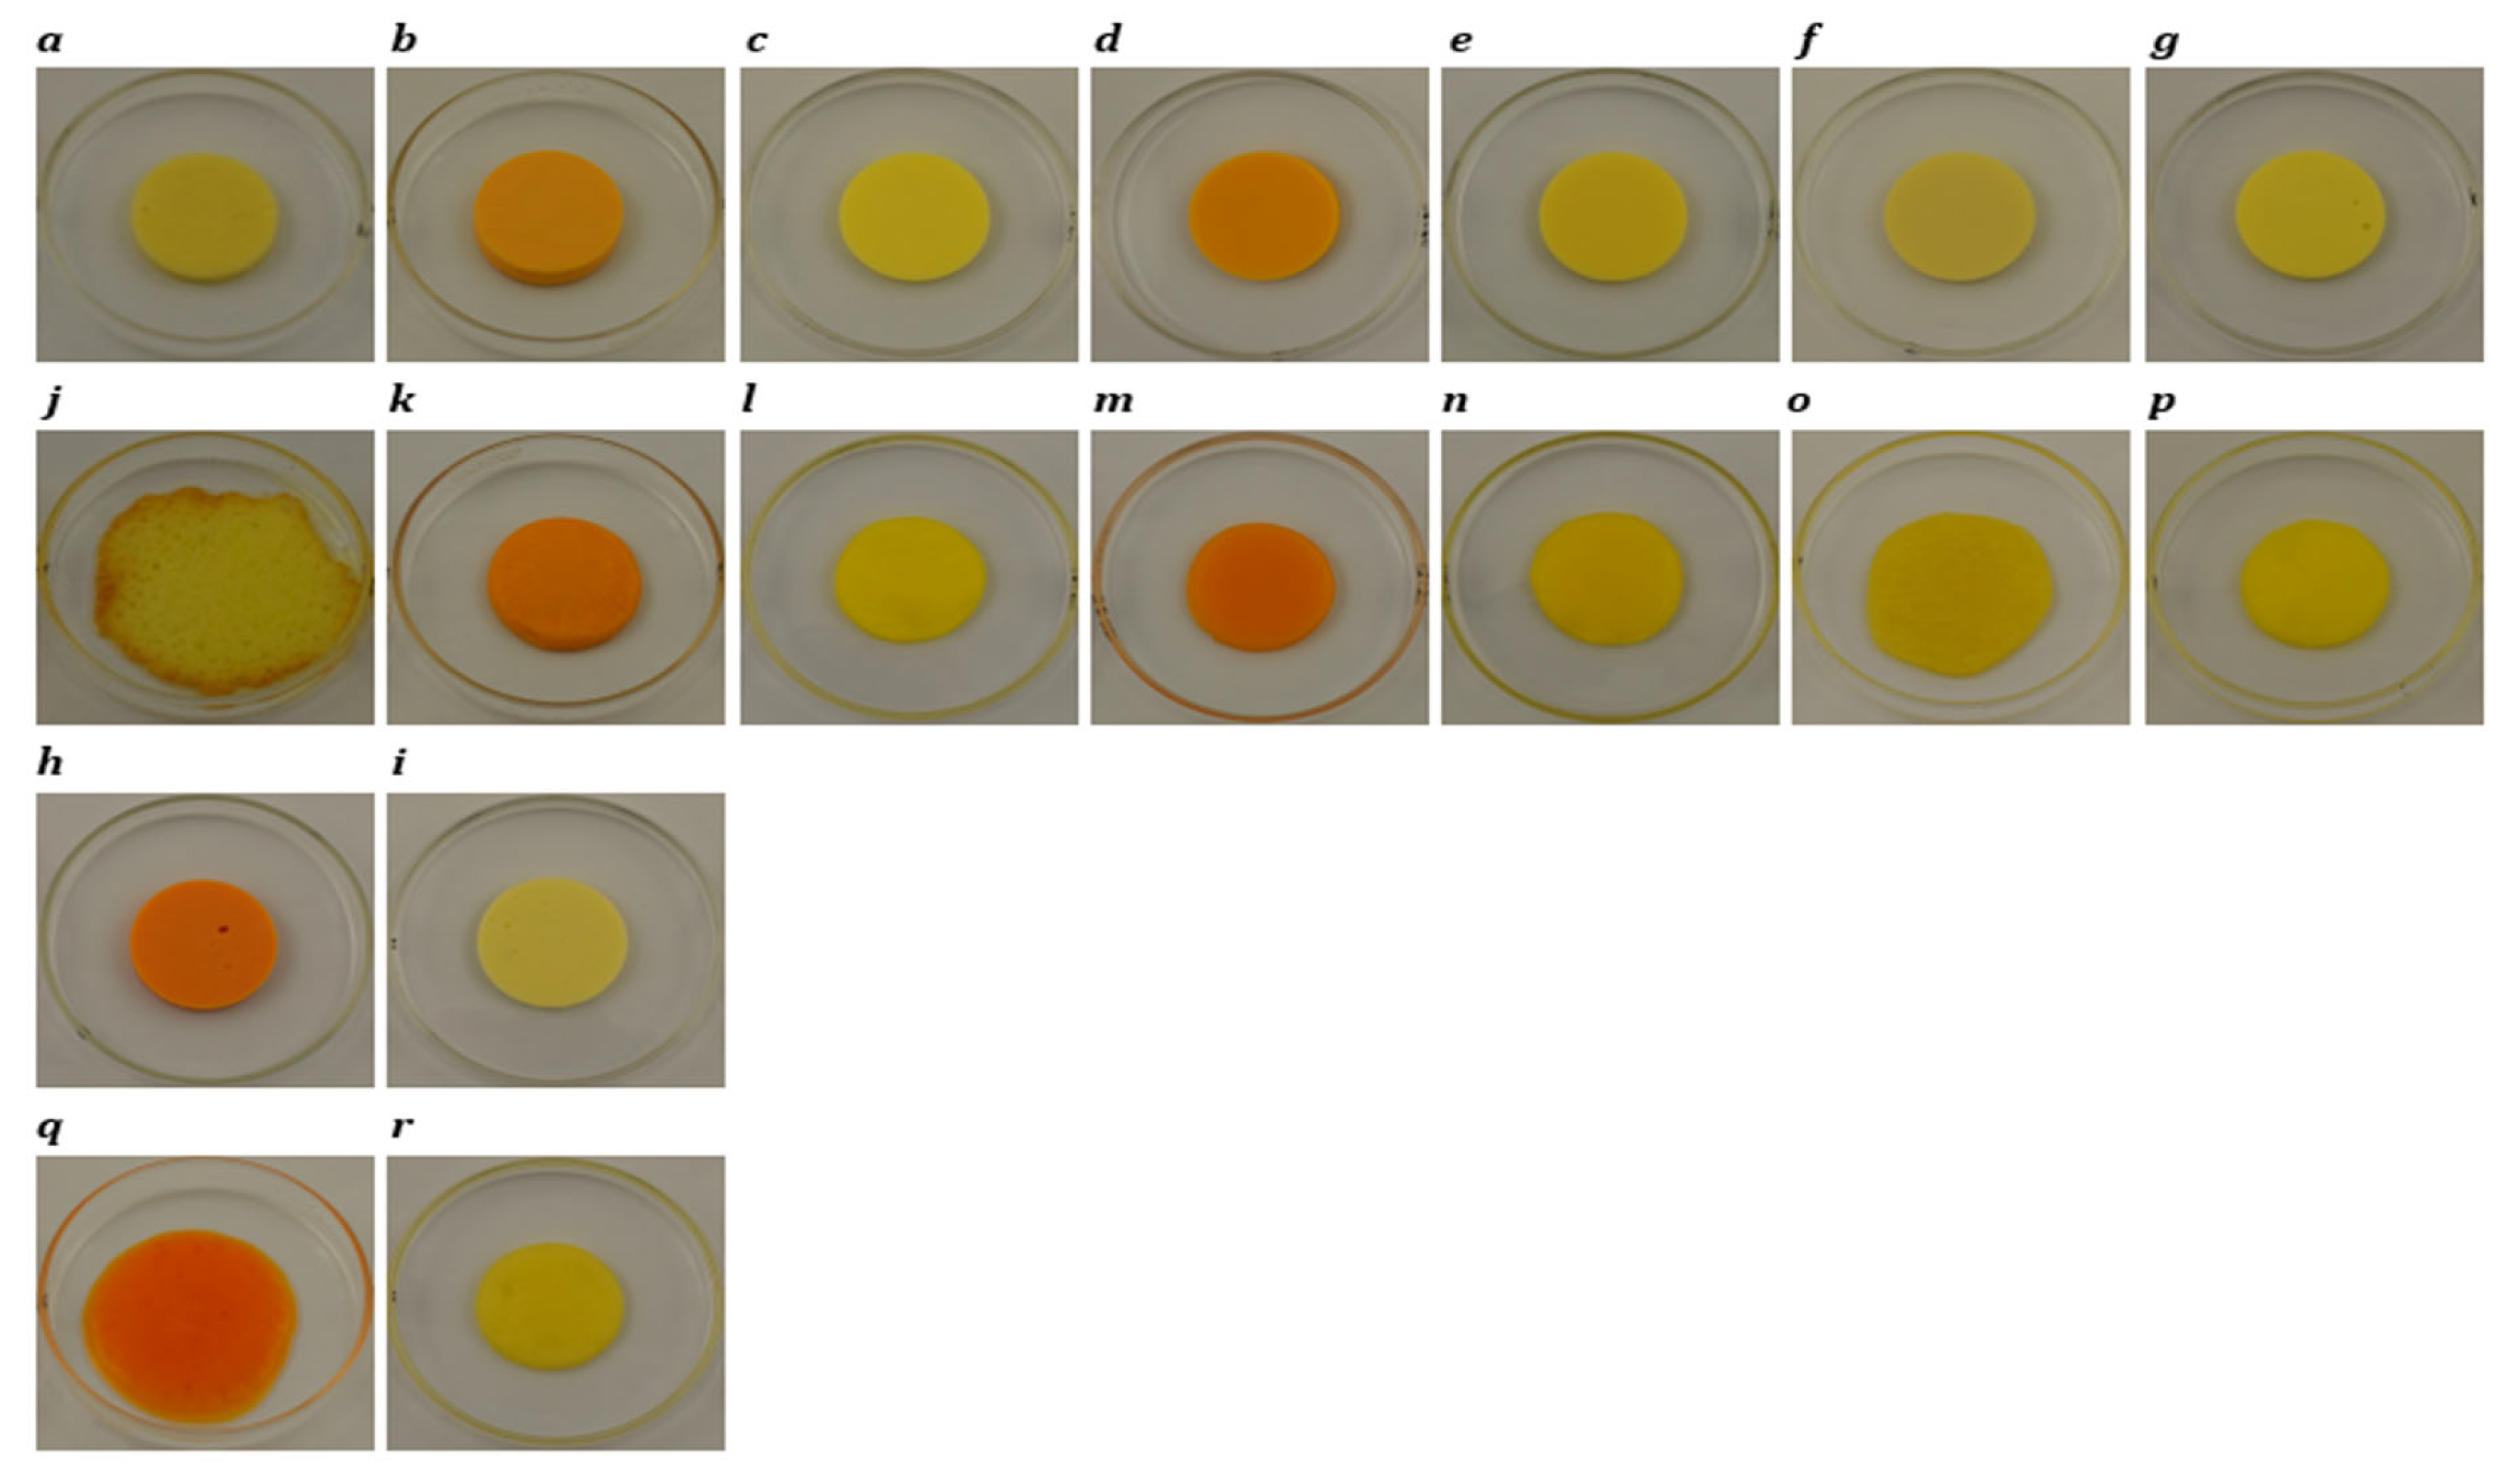
Figure 5.
Rheological profiles showing storage modulus (G’) (filled square), loss modulus (G’’) (filled triangle) and loss tangent (Tan δ) (cross) as a function of temperature in the range 20–90°C for block style cheddar (a), processed (b), plant 1 (c), plant 2 (d), plant 3 (e), plant 4 (f) and plant 5 (g) products.
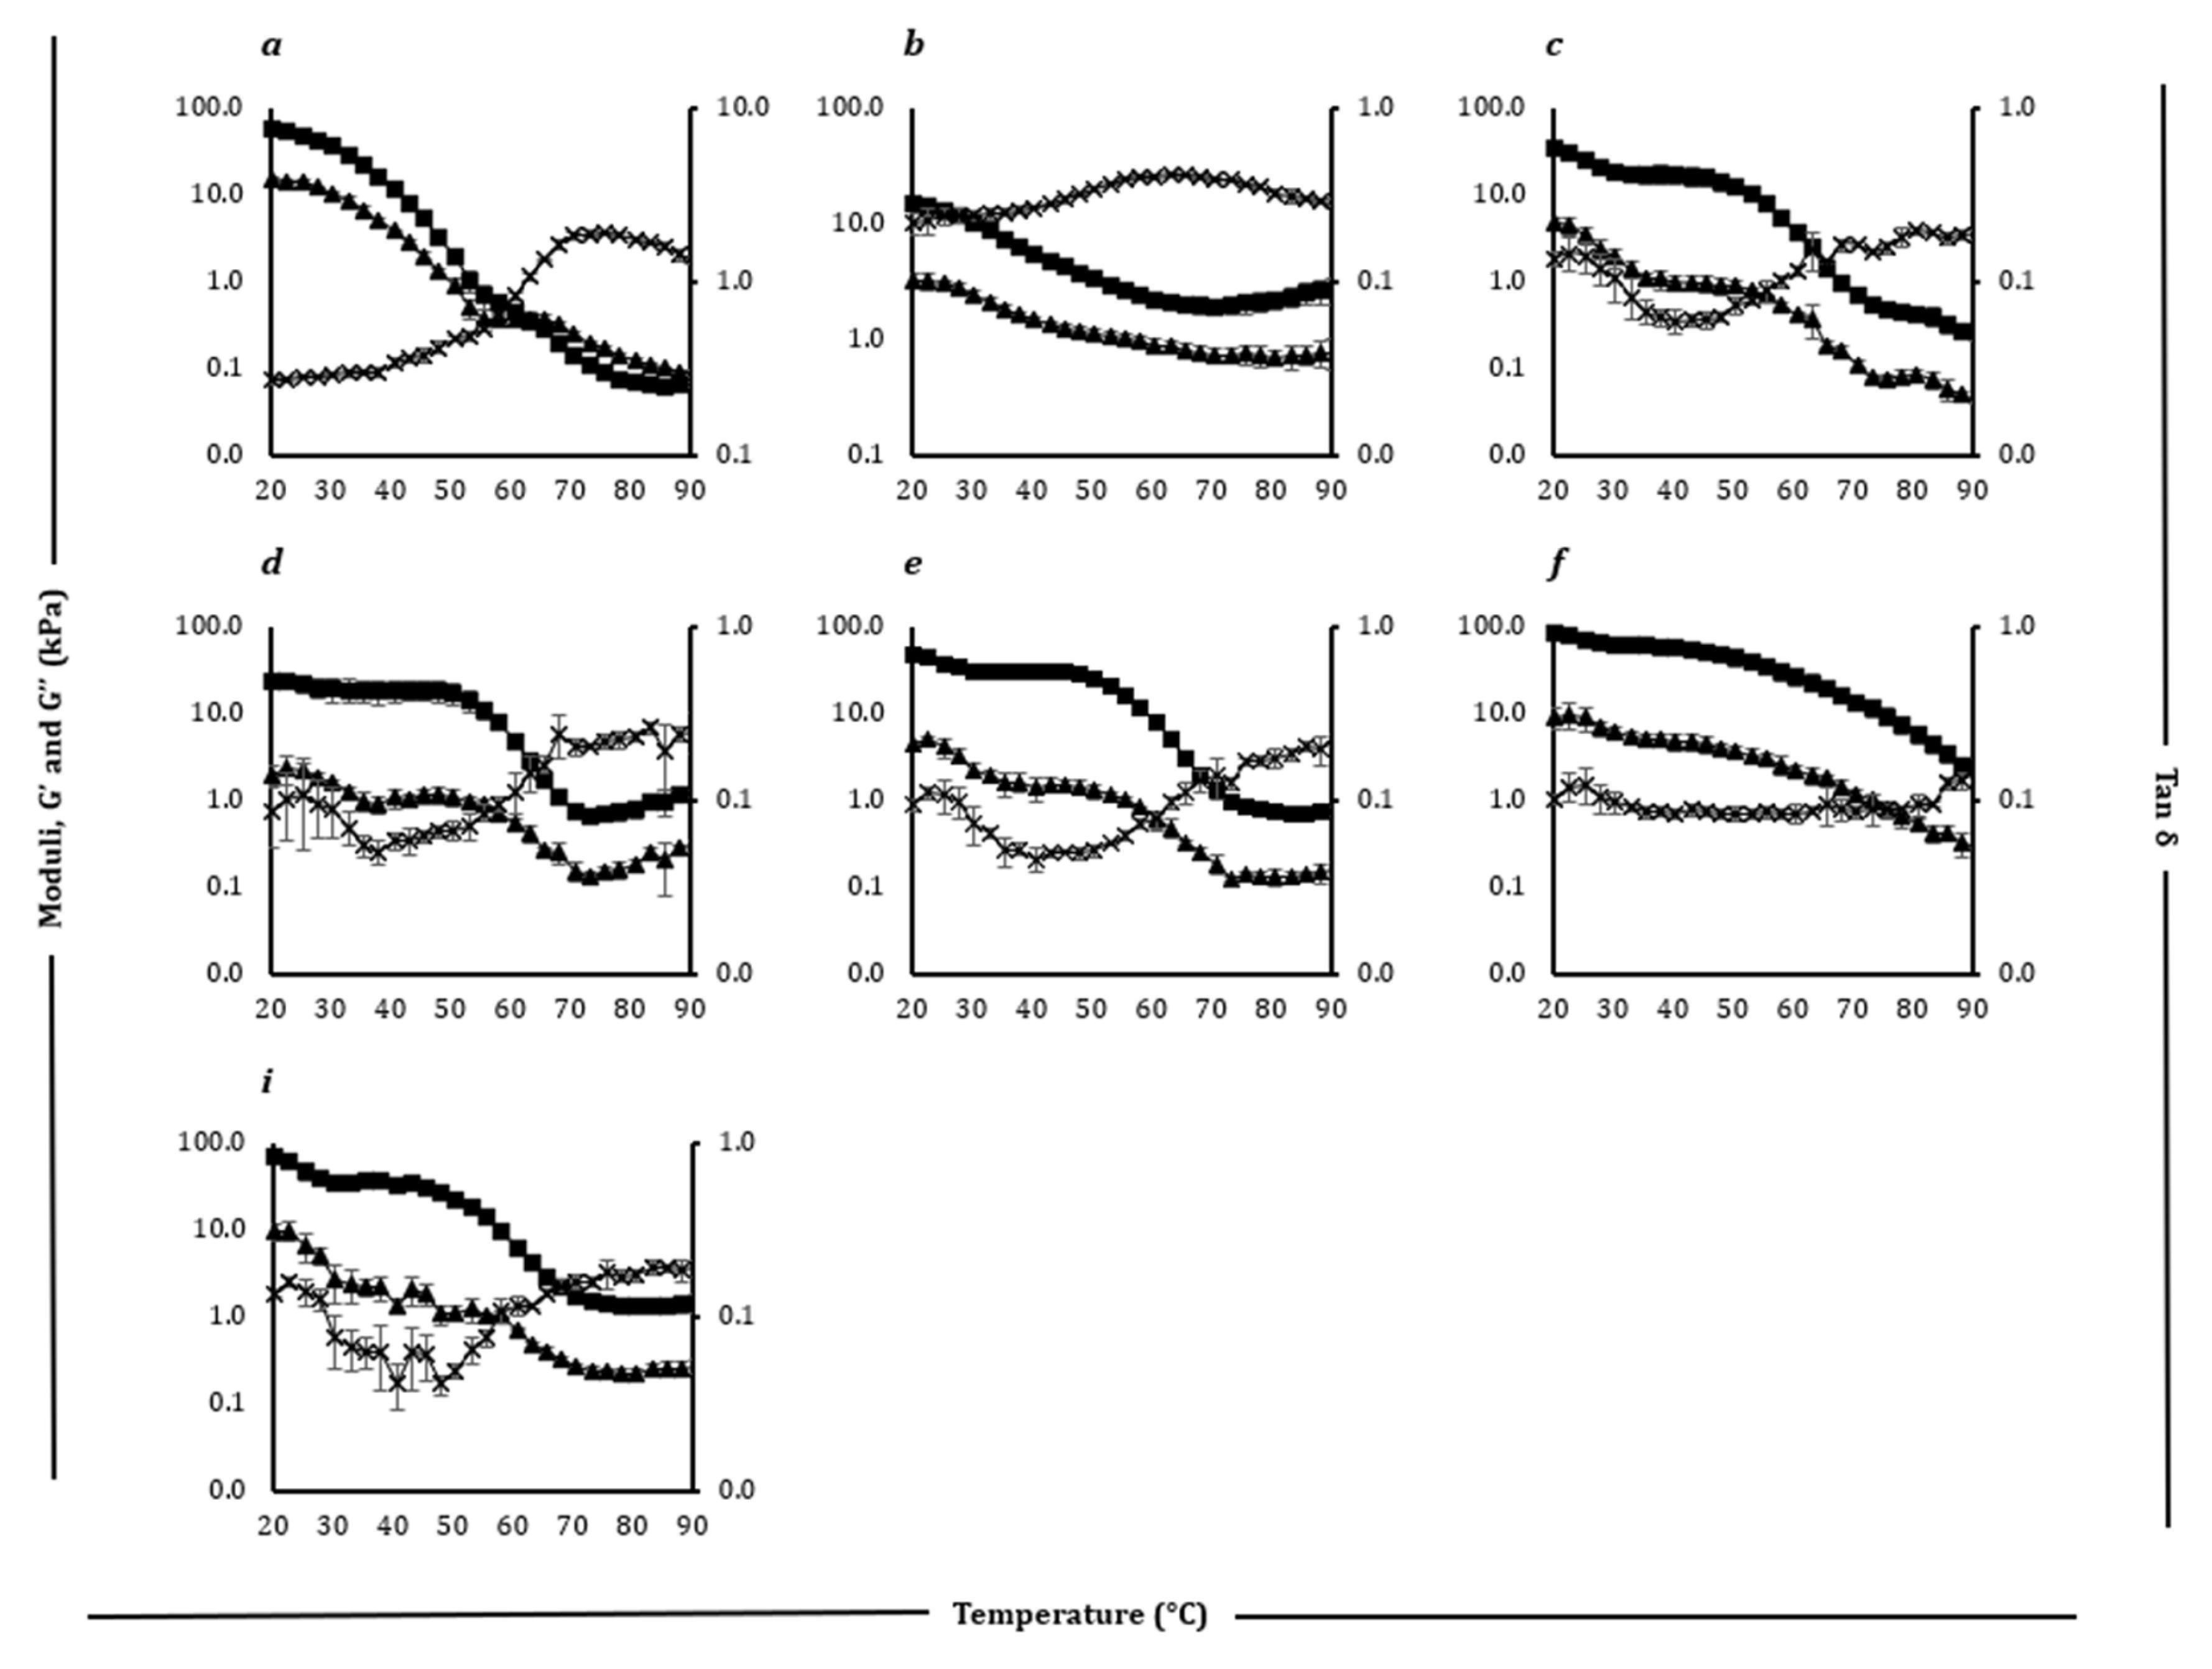
Figure 6.
Rheological profiles showing storage modulus (G’) (filled square), loss modulus (G’’) (filled triangle) and loss tangent (Tan δ) (cross) as a function of temperature in the range 20–90°C for Slice style cheddar (a), processed (b), plant 1 (c), plant 2 (d), plant 3 (e), plant 4 (f), plant 5 (g), plant 6 (h) and plant 7 (i) products.
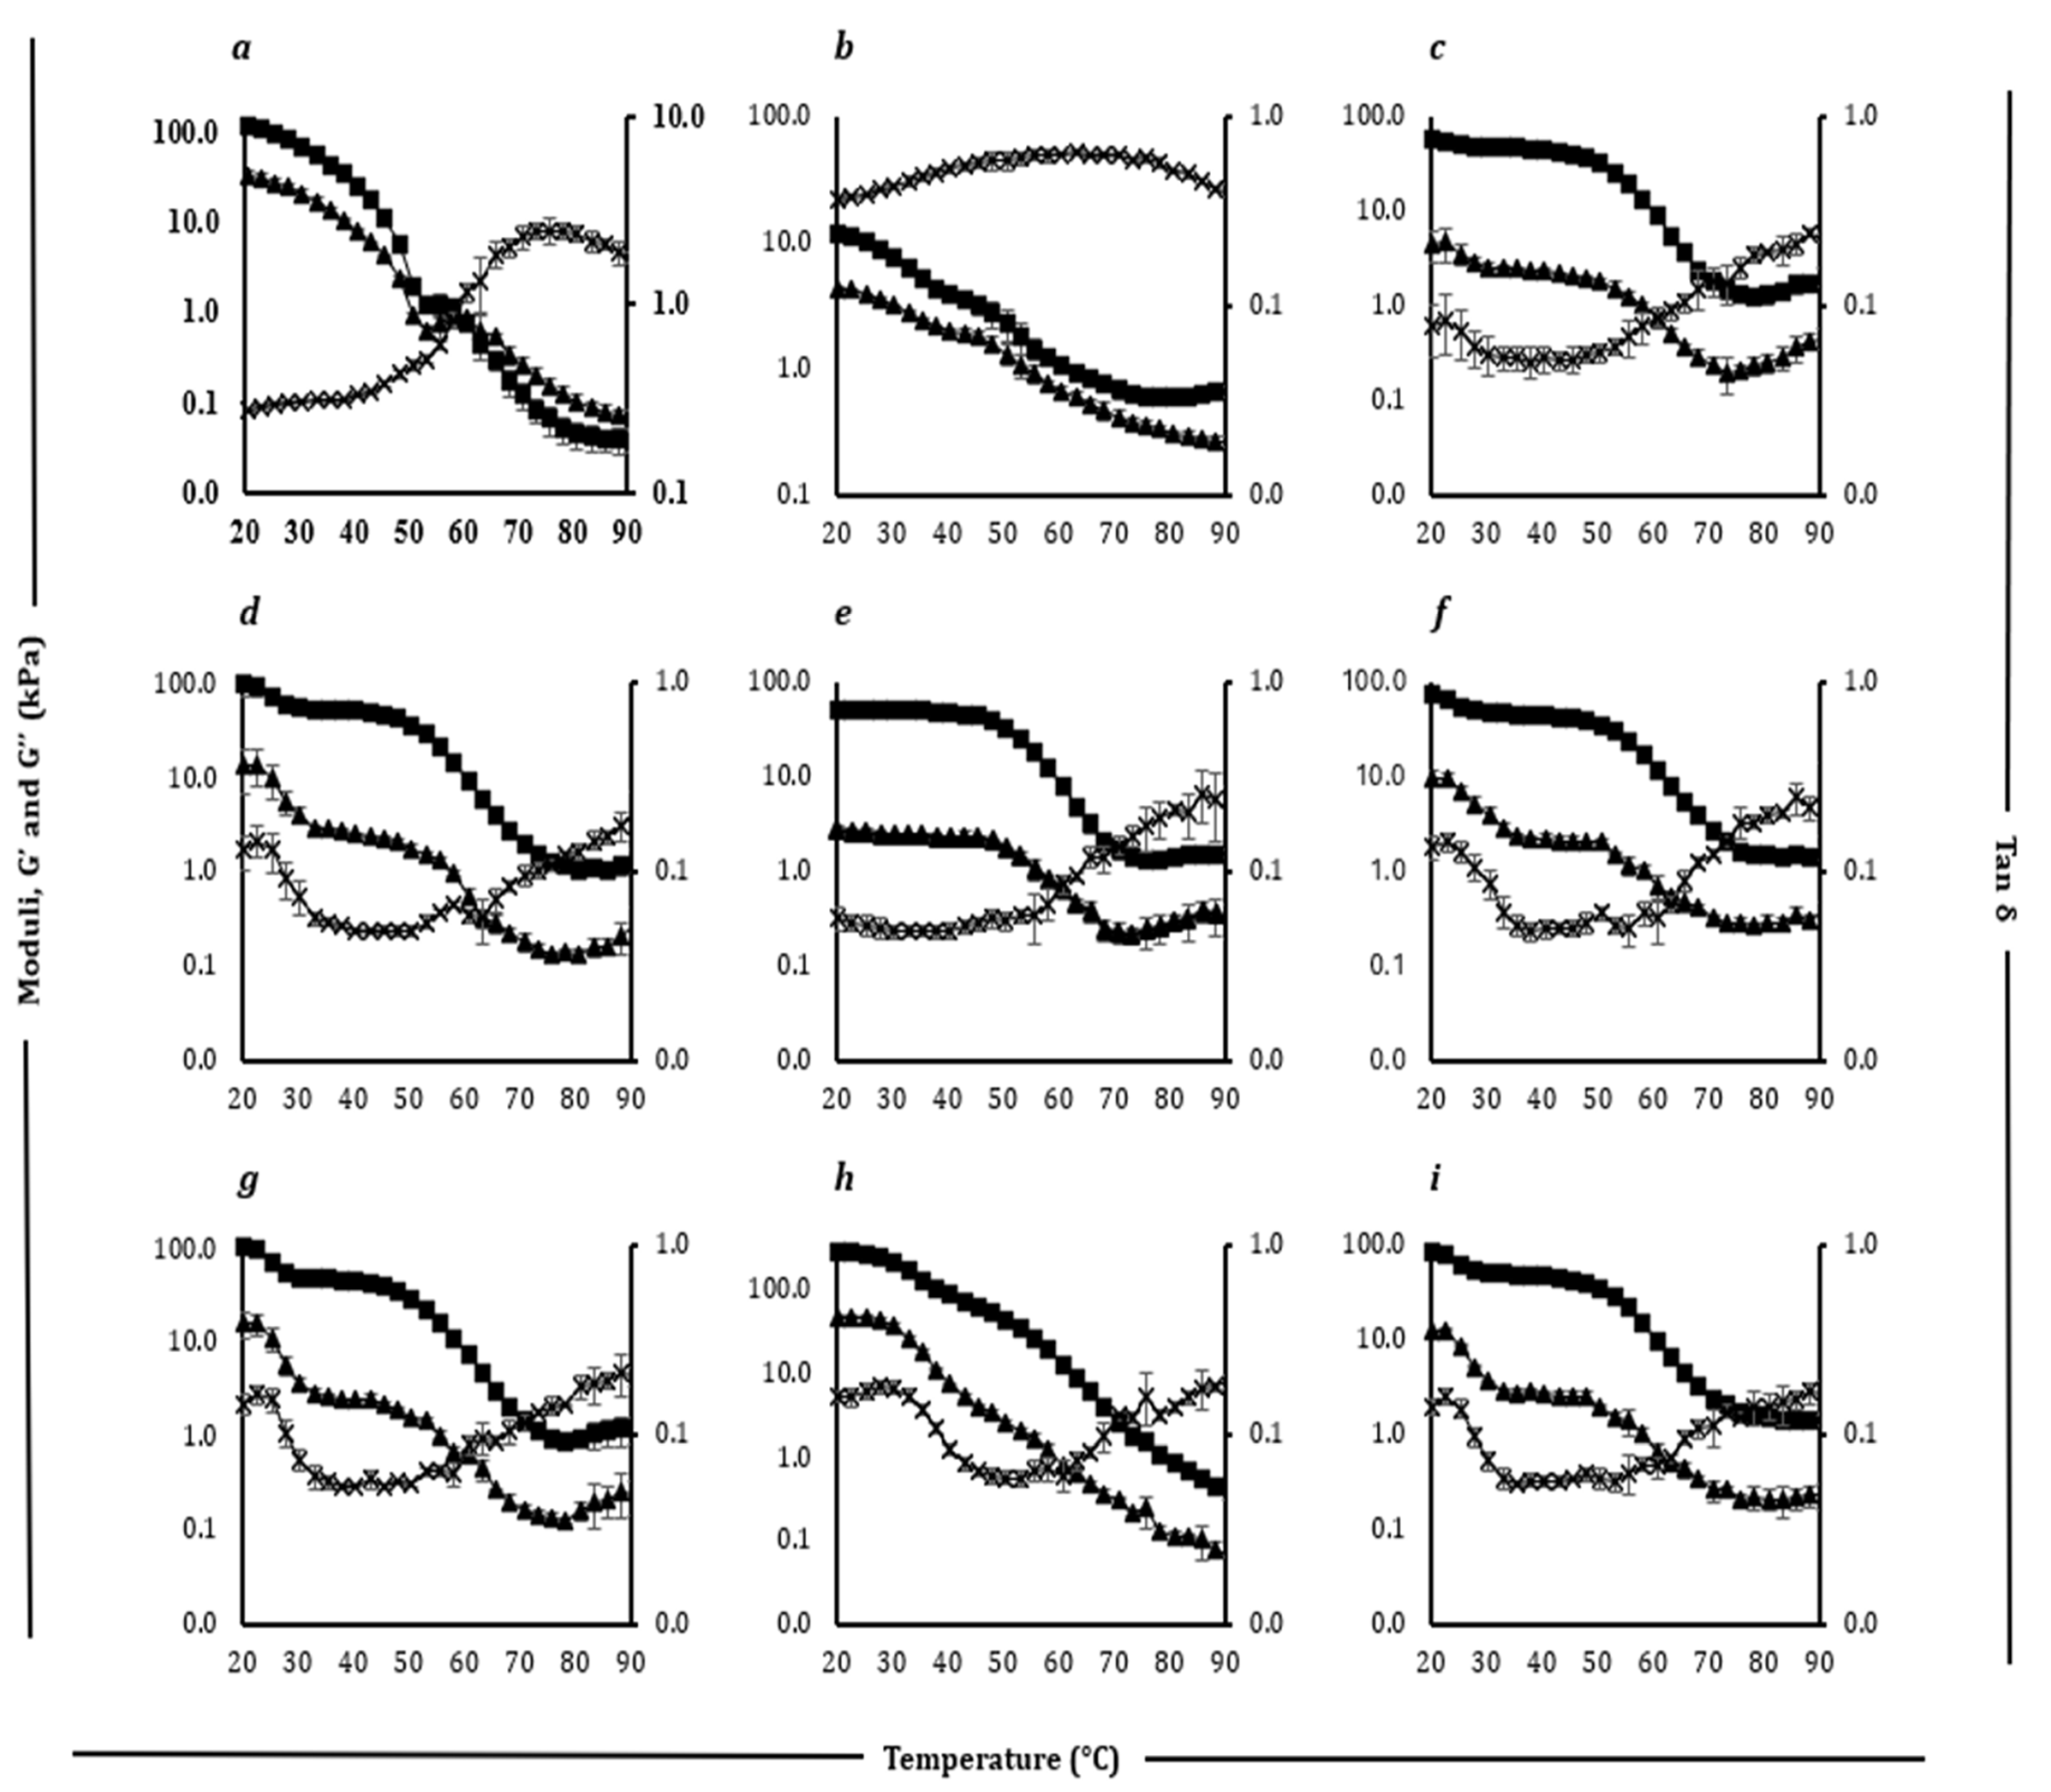
Figure 7.
Differential scanning calorimetry thermograms of heating ramp from −40 to 90°C for block style cheddar (a), processed (b), plant 1 (c), plant 2 (d), plant 3 (e), plant 4 (f) and plant 5 (g) products.
Figure 7.
Differential scanning calorimetry thermograms of heating ramp from −40 to 90°C for block style cheddar (a), processed (b), plant 1 (c), plant 2 (d), plant 3 (e), plant 4 (f) and plant 5 (g) products.
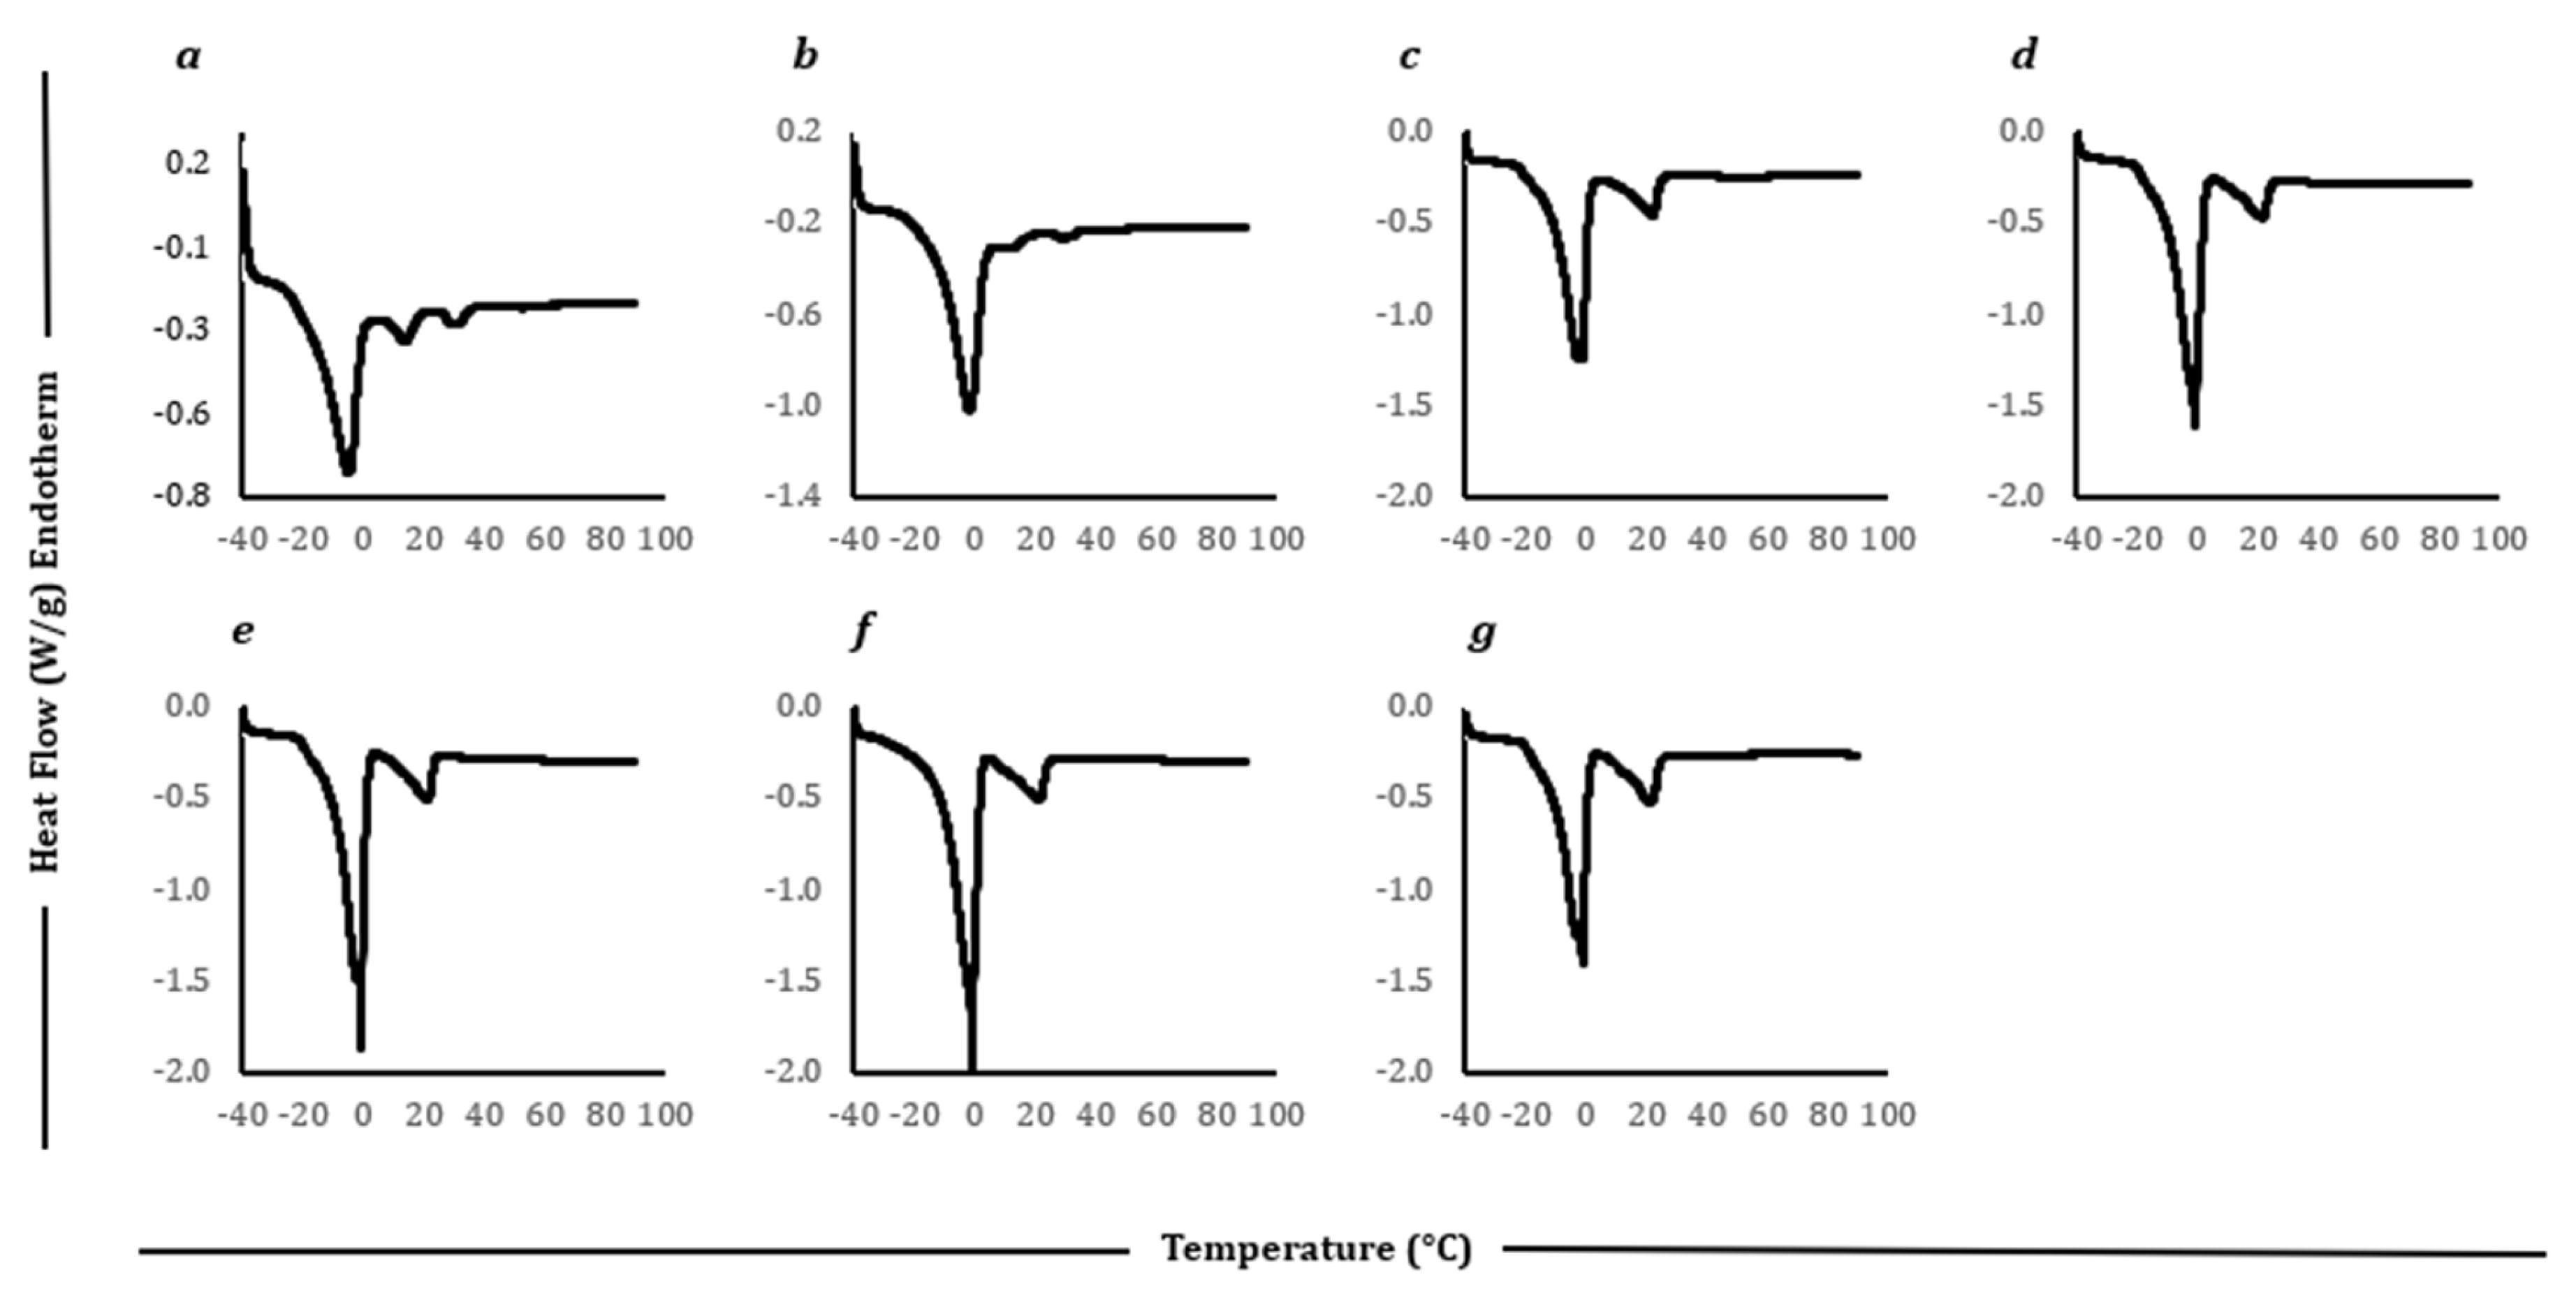
Figure 8.
Differential scanning calorimetry thermograms of heating ramp from −40 to 90°C for Slice style cheddar (a), processed (b), plant 1 (c), plant 2 (d), plant 3 (e), plant 4 (f), plant 5 (g), plant 6 (h) and plant 7 (i) products.
Figure 8.
Differential scanning calorimetry thermograms of heating ramp from −40 to 90°C for Slice style cheddar (a), processed (b), plant 1 (c), plant 2 (d), plant 3 (e), plant 4 (f), plant 5 (g), plant 6 (h) and plant 7 (i) products.
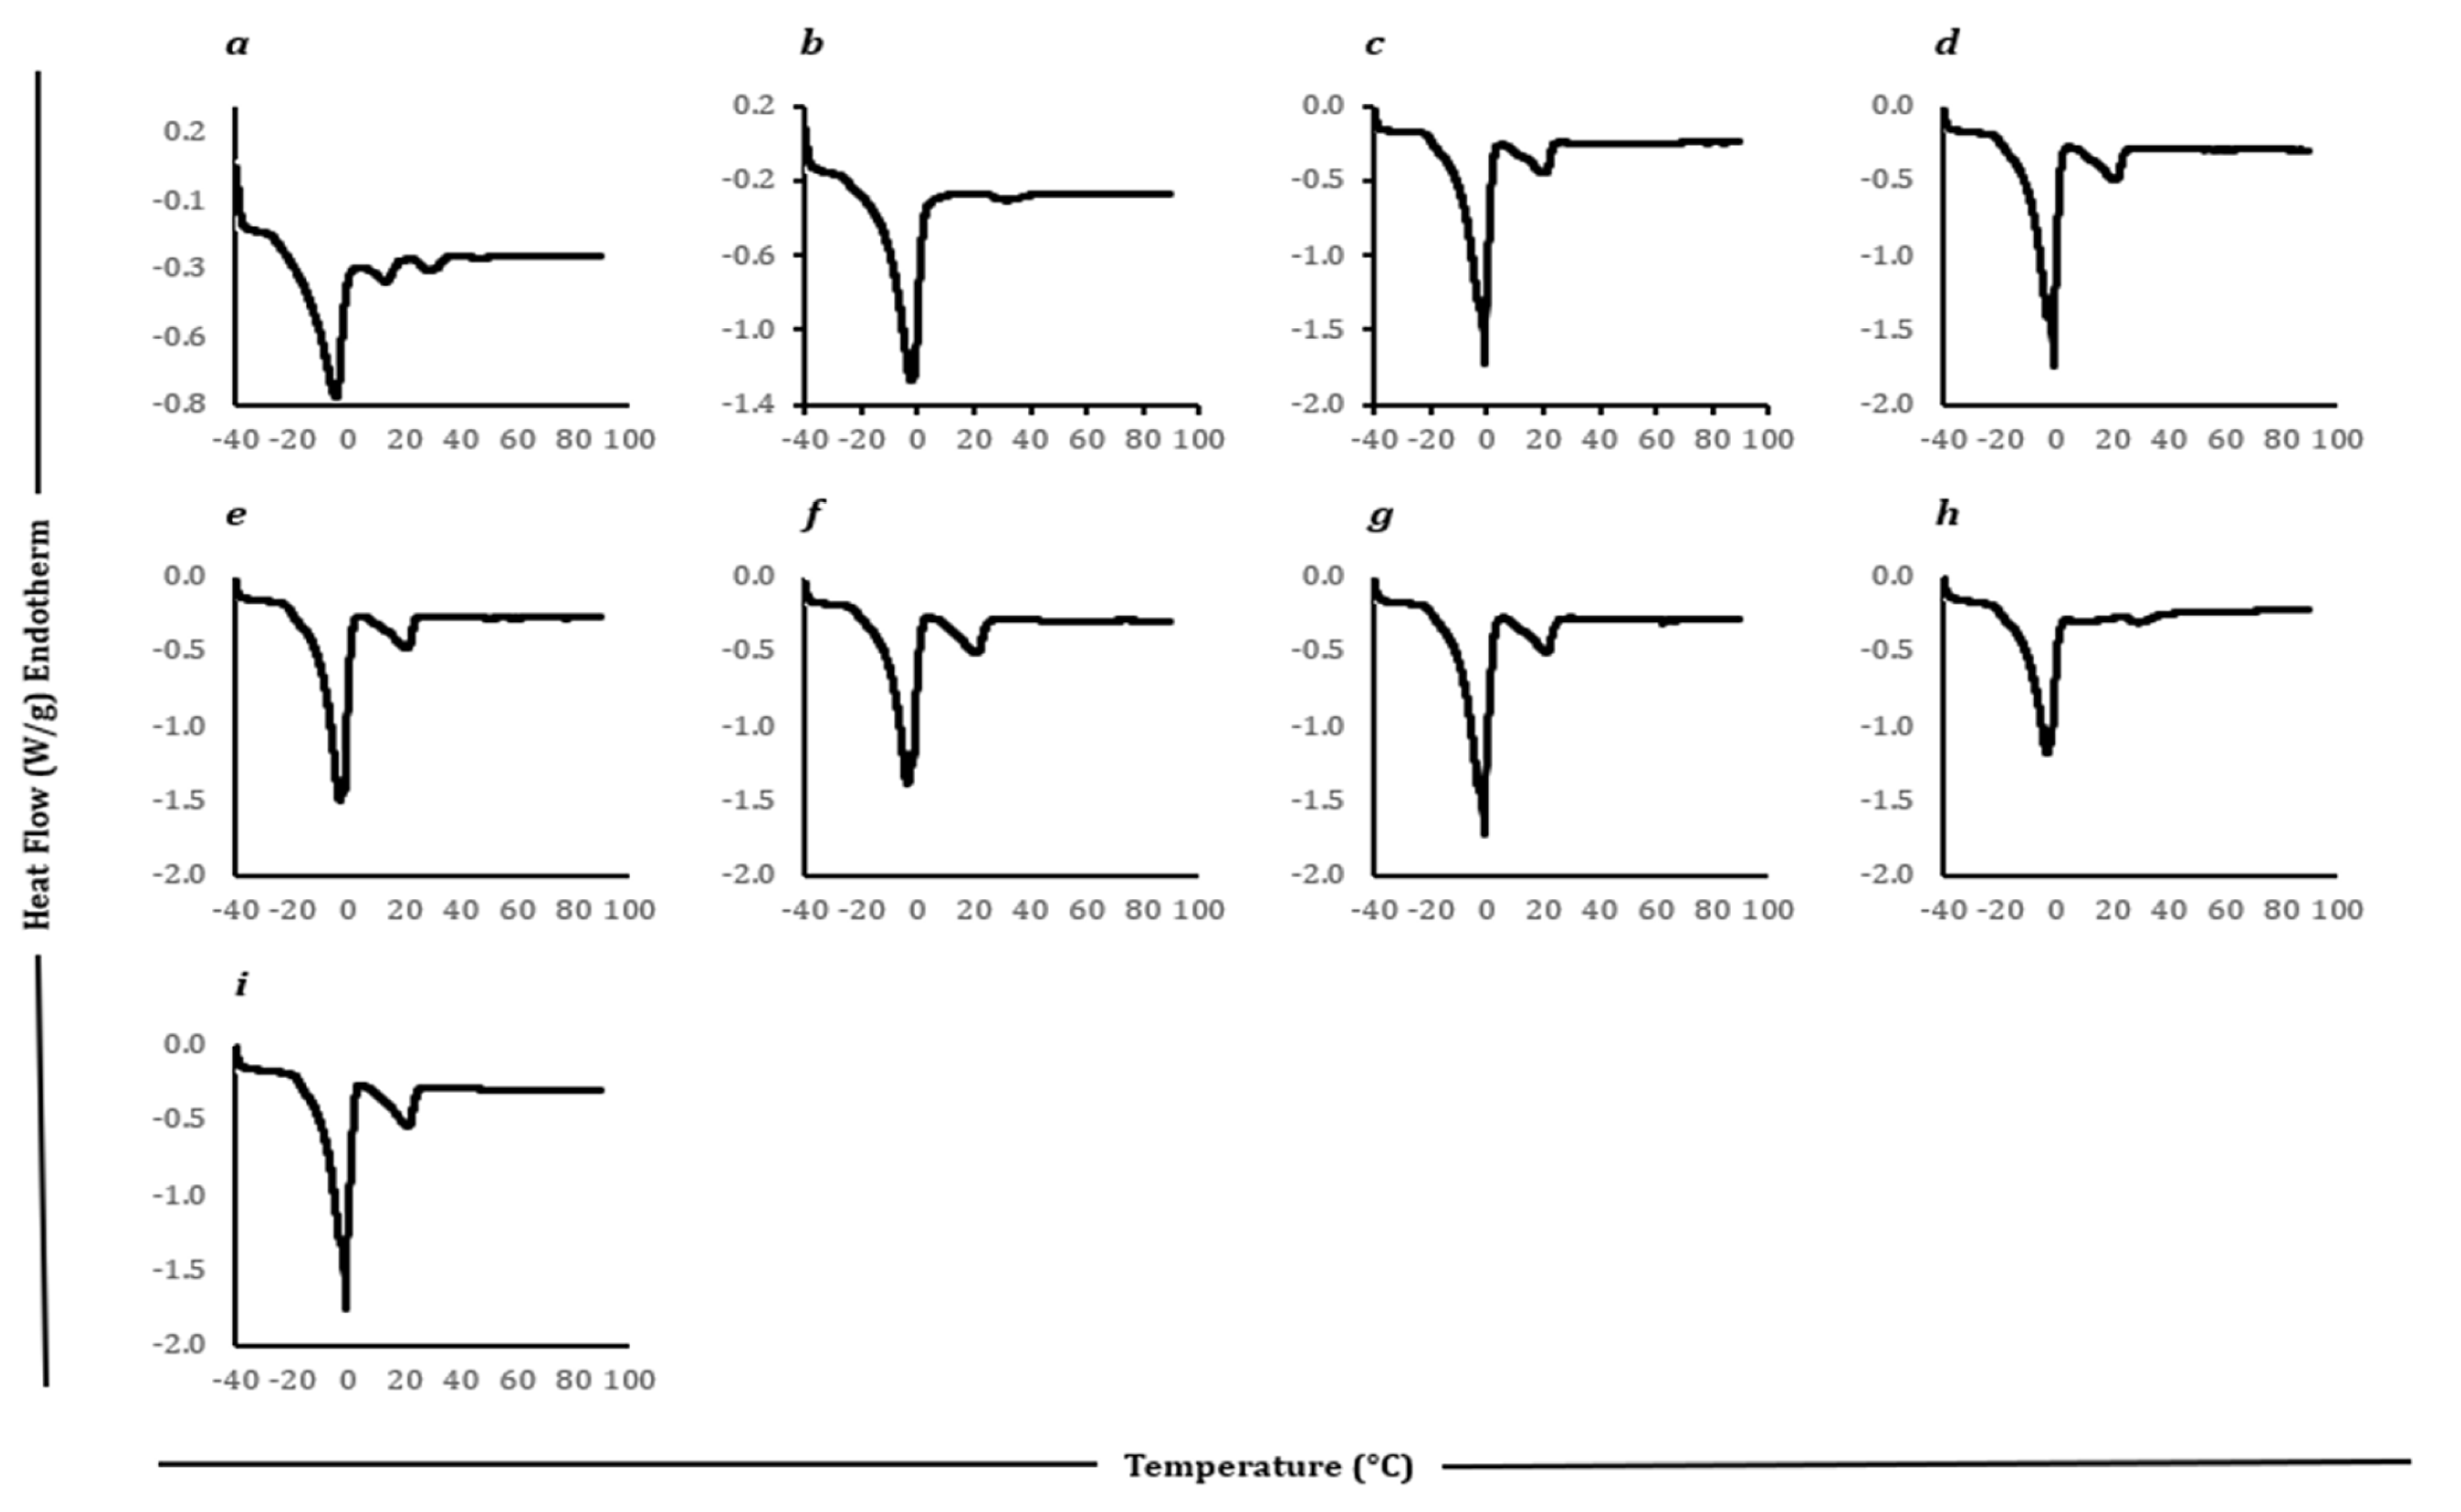
Figure 9.
APLSR graph for sensory evaluation of block-style products. Plotted are cheese variants verses sensory (hedonic and descriptive) attributes.
Figure 9.
APLSR graph for sensory evaluation of block-style products. Plotted are cheese variants verses sensory (hedonic and descriptive) attributes.
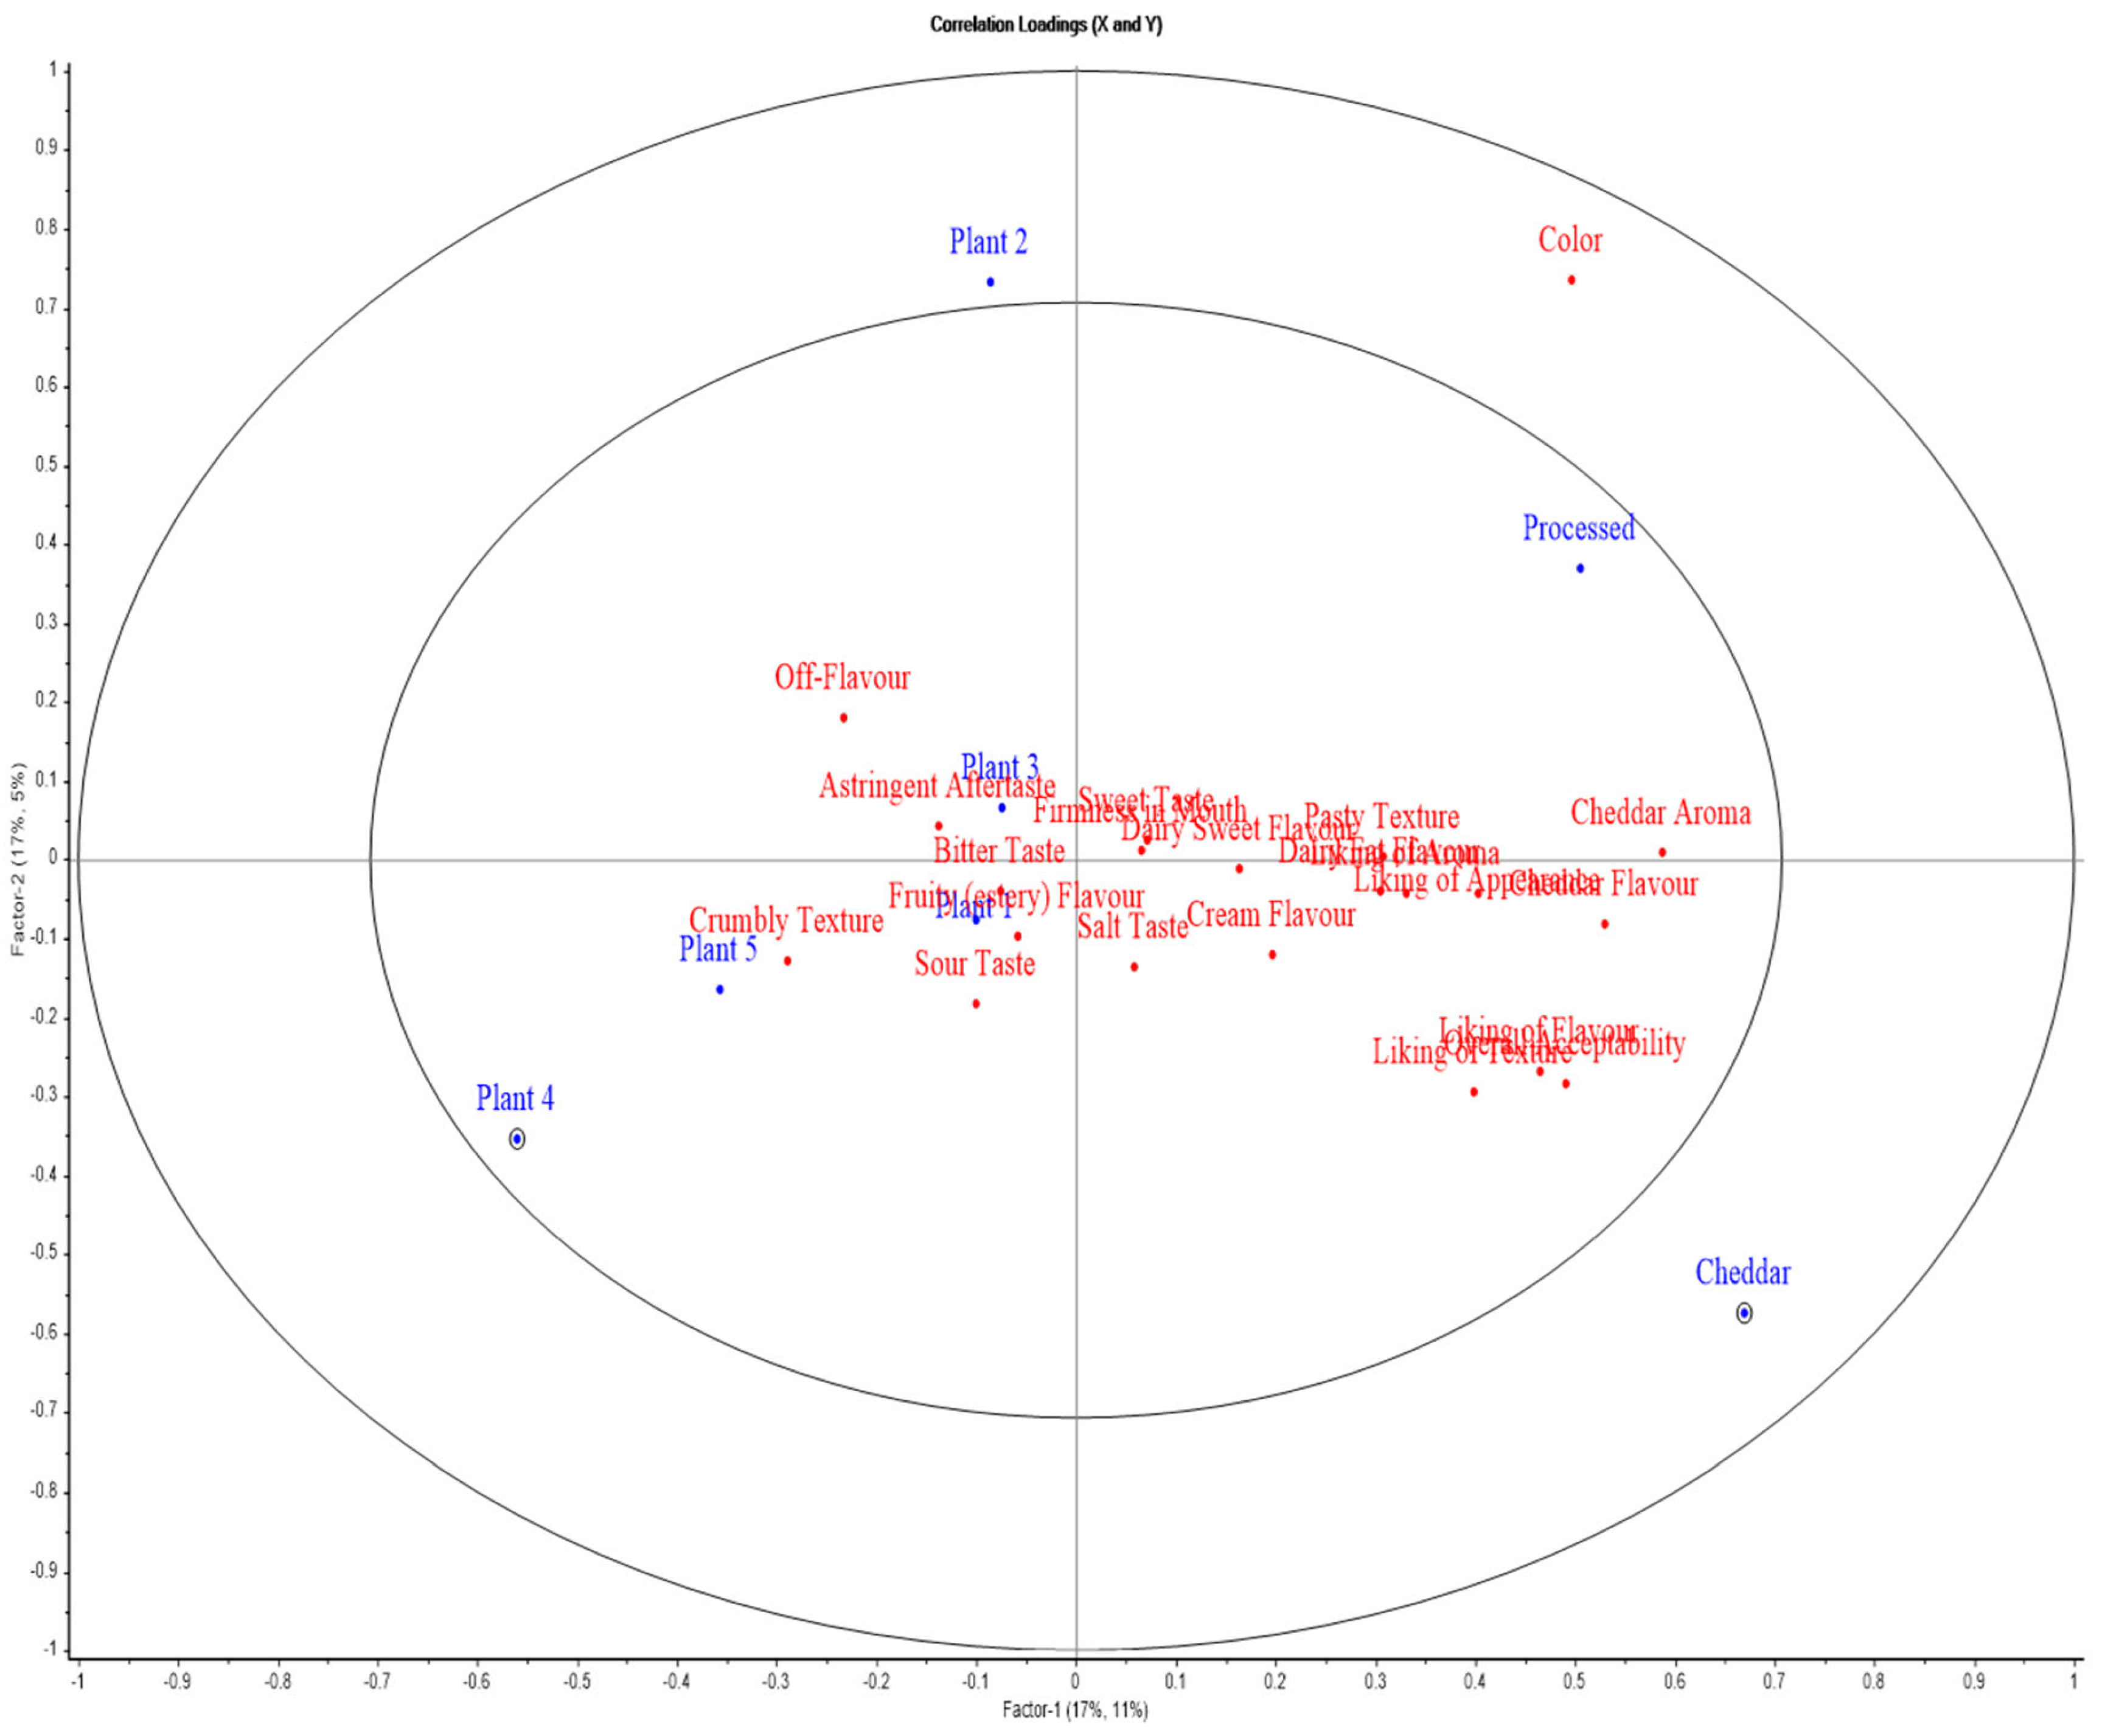
Figure 10.
APLSR graph for sensory evaluation of slice style products. Plotted are cheese variants verses sensory (hedonic and descriptive) attributes.
Figure 10.
APLSR graph for sensory evaluation of slice style products. Plotted are cheese variants verses sensory (hedonic and descriptive) attributes.
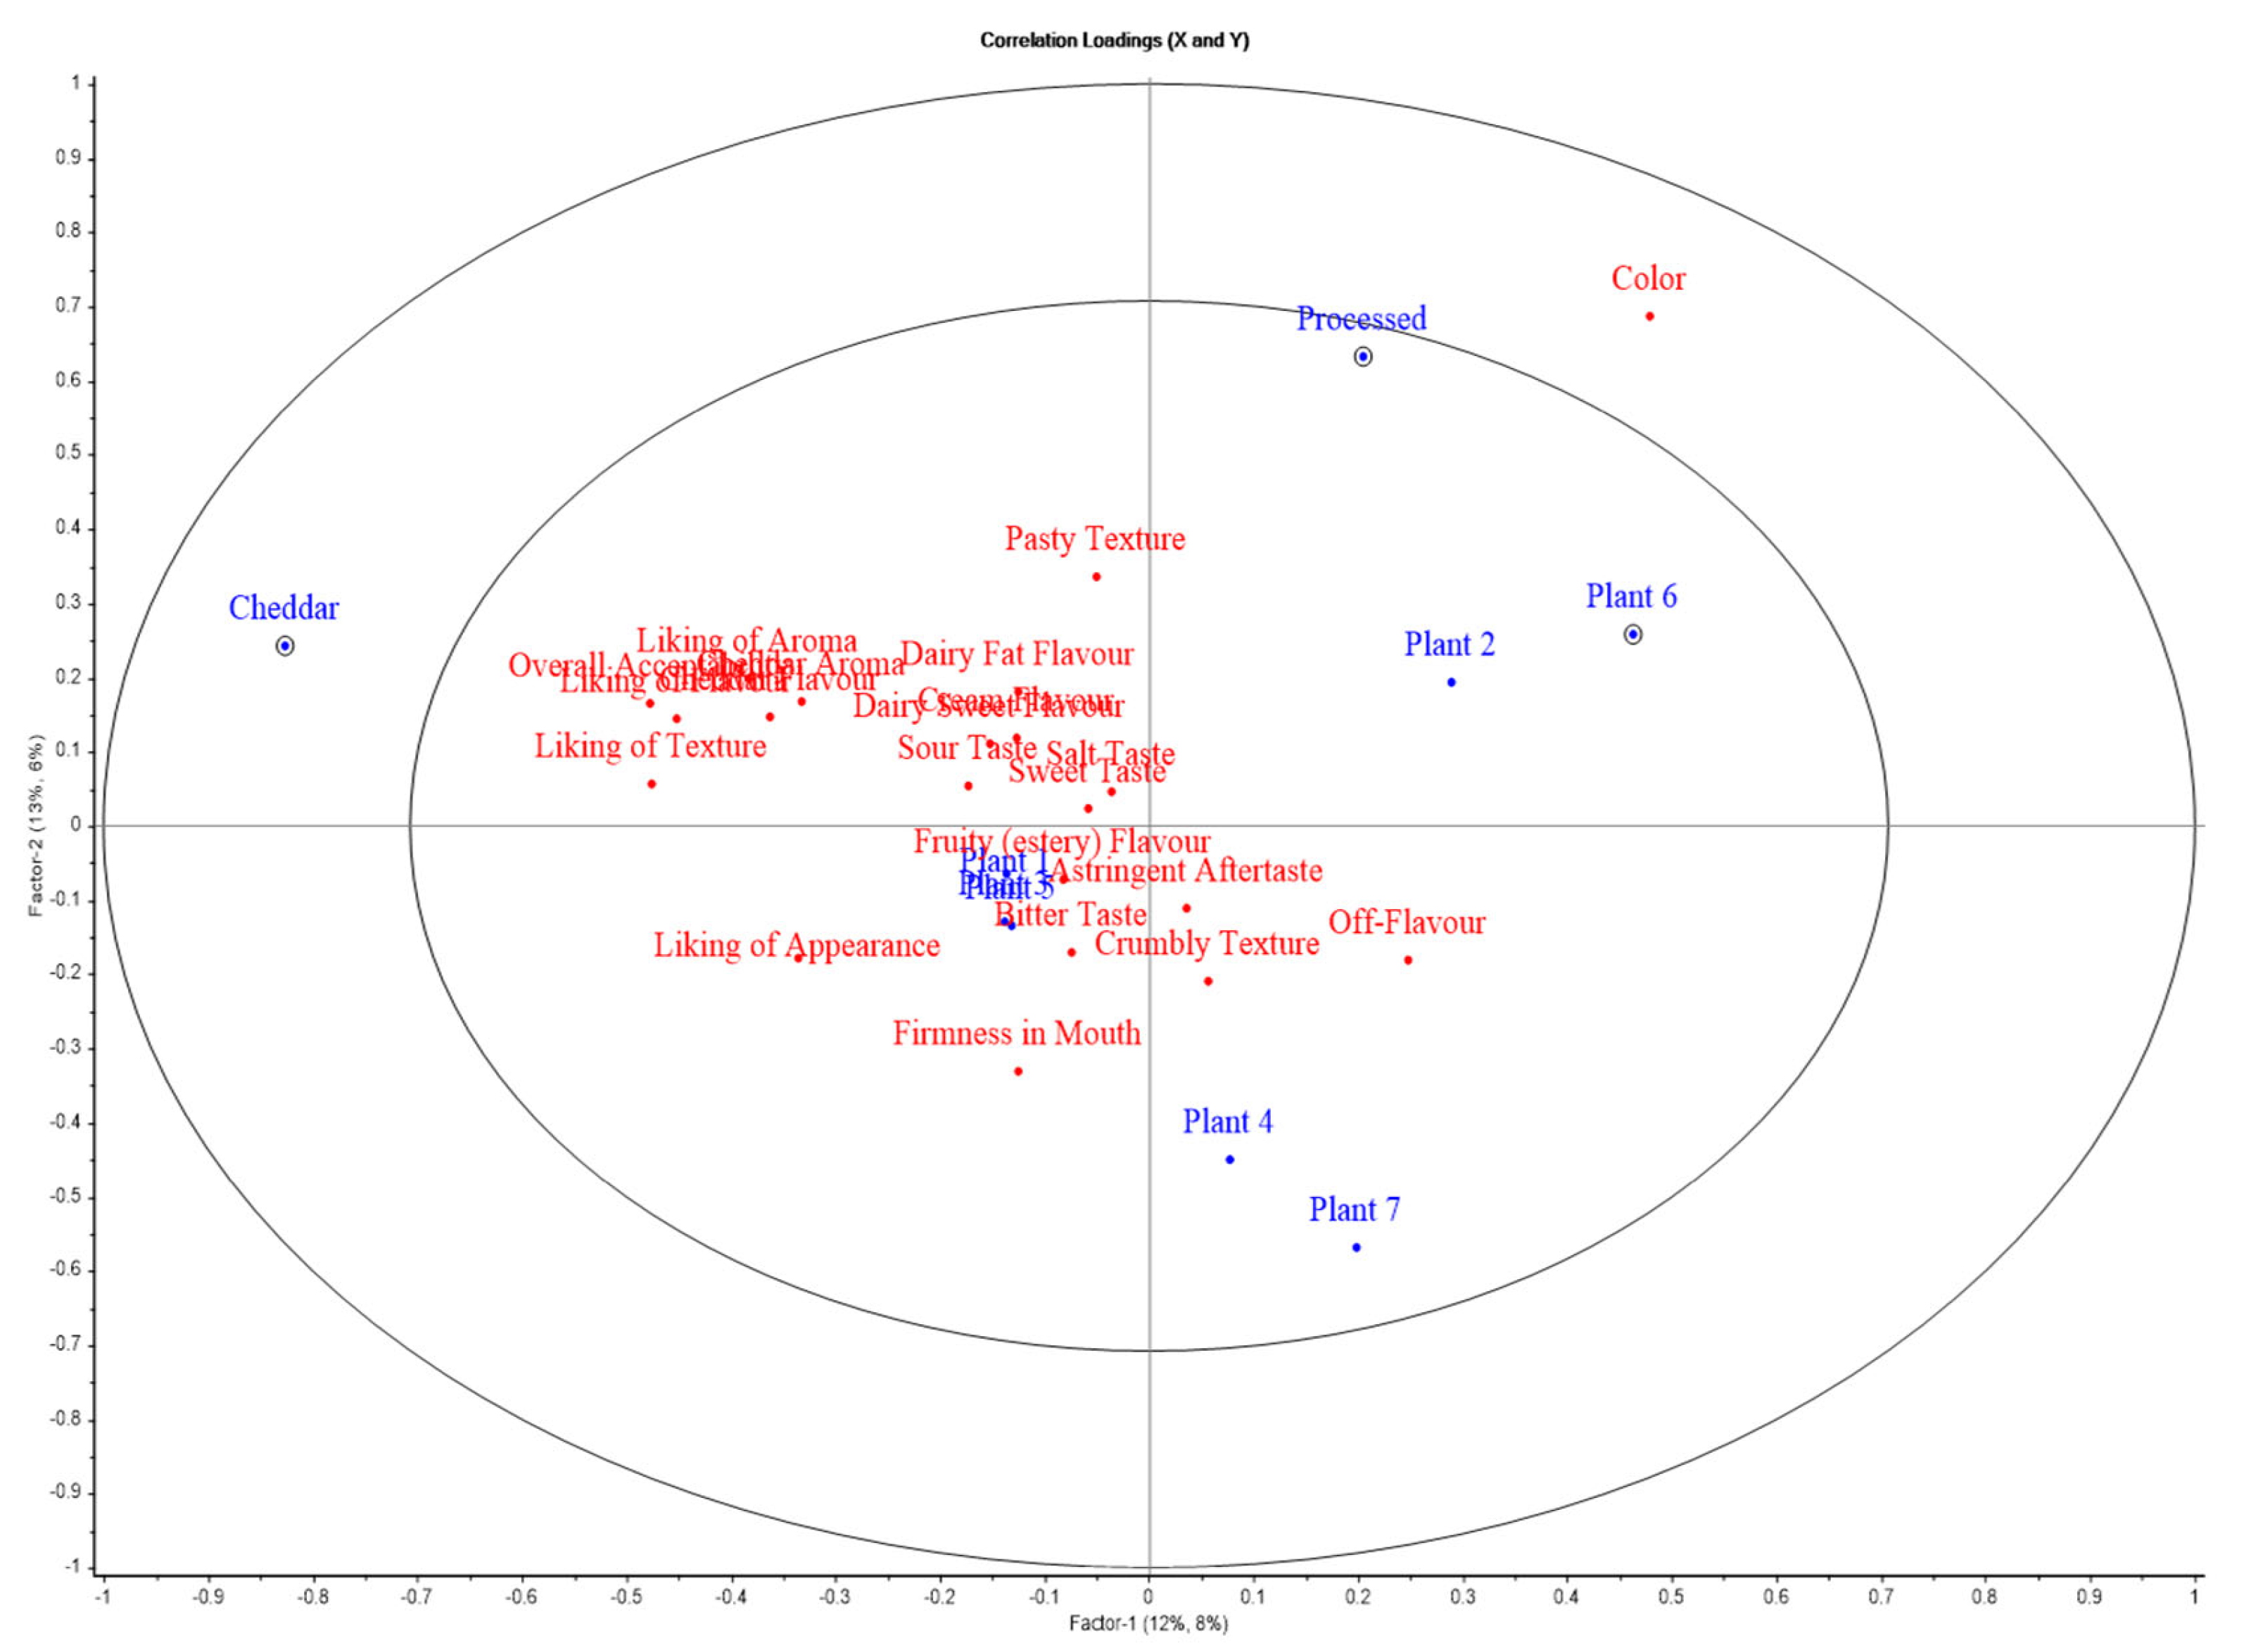

Table 1.
List of ingredients and images for Block style products.
| Products | Ingredients | Pictures |
|---|---|---|
| Cheddar | Milk, rennet, salt |  |
| Processed | Cheese (60%), water, vegetable oils (coconut, palm), milk protein, emulsifying salts (sodium phosphates, sodium polyphosphate), modified maize starch, whey powder (milk), tri-calcium phosphate, acidity regulator (citric acid), colour (paprika, carotene) | 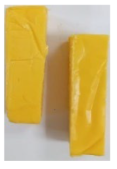 |
| Plant 1 | Water, coconut oil (24%), modified starch, starch, sea salt, lentil protein, cheddar flavour, acidity regulator (lactic acid), olive extract, colour (beta-carotene), vitamin B12 | 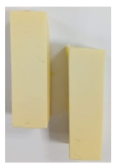 |
| Plant 2 | Water, coconut oil (21%), modified starch, starch, sea salt, cheddar flavour, olive extract, colour (beta-carotene, paprika extract, vitamin B12 | 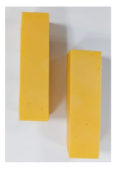 |
| Plant 3 | Water, coconut oil (24%), maize starch, modified maize starch, modified potato starch, modified tapioca starch, sea salt, flavouring, olive extract, colour (carotenes), vitamin B12 | 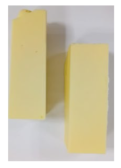 |
| Plant 4 | Water, coconut oil (25%) (non-hydrogenated), starch, sea salt, potato protein, acidity regulator (lactic acid) (non-dairy), vegan flavourings, olive extract, vitamin B12 | 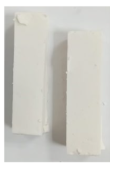 |
| Plant 5 | Water, coconut oil (24%) (non-hydrogenated), modified starch, starch, tapioca maltodextrin, sea salt, vegan natural flavourings, olive extract, colour (natural beta-carotene), vitamin B12 | 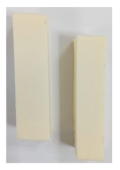 |
Table 2.
List of ingredients and images for Slice style products.
| Products | Ingredients | Pictures |
|---|---|---|
| Cheddar | Milk, rennet, salt | 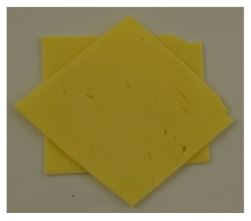 |
| Processed | Cheese (60%), water, palm oil, milk protein, modified potato starch, emulsifying salts (E452, E339), calcium phosphate, salt, acidity regulator (lactic acid) (milk), flavouring (milk), natural colours (beta carotene, paprika extract) | 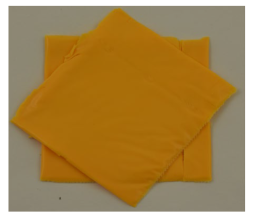 |
| Plant 1 | Water, coconut oil (23%), modified starch, starch, sea salt, flavouring, olive extract, colour (beta-carotene), vitamin B12 |  |
| Plant 2 | Water, coconut oil (23%), modified starch, starch, sea salt, cheddar flavour, olive extract, colour (beta-carotene, paprika), vitamin B12 | 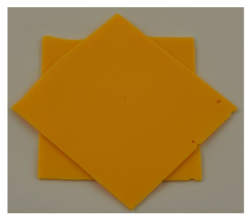 |
| Plant 3 | Water, coconut oil (23%), modified starch, starch, sea salt, smoke flavour, olive extract, colour (beta-carotene), vitamin B12 | 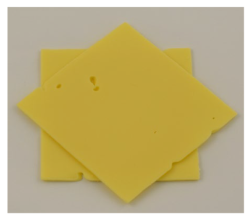 |
| Plant 4 | Water, coconut oil (25%), modified potato starch, salt, calcium lactate, preservative (sorbic acid), natural flavouring, natural colour (beta-carotene), iron, vitamin D2, B6 & B12 | 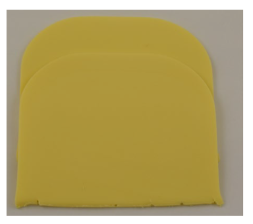 |
| Plant 5 | Water, coconut oil (24%) (non-hydrogenated), modified starch, sea salt, olive extract, vegan flavourings, colour (natural beta-carotene), vitamin B12 | 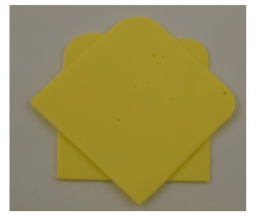 |
| Plant 6 | Water, shea oil, coconut oil, modified starch, salt, flavouring, lemon juice powder, spice extract, colour (beta-carotene) |  |
| Plant 7 | Water, coconut oil (24%) (non-hydrogenated), modified starch, sea salt, olive extract, vegan flavourings, colour (natural beta-carotene), vitamin B12 |  |
Table 3.
Chemical composition, pH, water activity, and meltability of Block-style products.
| Cheddar | Processed | Plant 1 | Plant 2 | Plant 3 | Plant 4 | Plant 5 | |
|---|---|---|---|---|---|---|---|
| Protein (%) | 25.6 ± 0.1a | 18.5 ± 0.1b | 1.2 ± 0.0d | 0.1 ± 0.0e | 0.1 ± 0.0e | 1.7 ± 0.0c | 0.1 ± 0.0e |
| Fat (%) | 34.8 ± 0.8a | 24.9 ± 0.2c | 23.8 ± 0.2d | 21.1 ± 0.2f | 22.6 ± 0.4e | 24.2 ± 0.8cd | 26.6 ± 0.1b |
| Moisture (%) | 38.0 ± 0.1g | 47.8 ± 0.1f | 50.7 ± 0.0d | 53.2 ± 0.1b | 51.9 ± 0.1c | 56.9 ± 0.1a | 46.9 ± 0.1e |
| Ash (%) | 3.8 ± 0.0b | 4.5 ± 0.0a | 2.4 ± 0.1c | 2.2 ± 0.1d | 2.1 ± 0.0d | 2.4 ± 0.0c | 2.2 ± 0.0d |
| CHO* (%) | < 0.0e | 4.8 ± 0.2d | 21.9 ± 0.3b | 23.4 ± 0.2a | 23.3 ± 0.4ab | 14.9 ± 0.8c | 24.2 ± 0.1a |
| pH | 5.28 ± 0.0b | 6.03 ± 0.0a | 4.06 ± 0.0d | 3.56 ± 0.0e | 4.01 ± 0.0d | 3.50 ± 0.0f | 4.20 ± 0.0c |
| Water activity | 0.95 ± 0.0c | 0.98 ± 0.0a | 0.98 ± 0.0ab | 0.98 ± 0.0ab | 0.96 ± 0.0bc | 0.98 ± 0.0a | 0.96 ± 0.0bc |
| Meltability (%) | 81.7 ± 4.4a | 2.2 ± 0.4c | 6.7 ± 1.7c | 2.2 ± 2.6c | 3.3 ± 1.7c | 17.2 ± 7.5b | 0.0d |
Values followed by different superscript letters (a–g) in the same row are significantly different (p < 0.05). *CHO: Carbohydrates.
Table 4.
Chemical composition, pH, water activity, and meltability of Slice-style products.
| Cheddar | Processed | Plant 1 | Plant 2 | Plant 3 | Plant 4 | Plant 5 | Plant 6 | Plant 7 | |
|---|---|---|---|---|---|---|---|---|---|
| Protein (%) | 25.2 ± 0.4a | 12.9 ± 0.0b | 0.1 ± 0.0c | 0.1 ± 0.0c | 0.1 ± 0.0c | 0.1 ± 0.0c | 0.1 ± 0.0c | 0.2 ± 0.0c | 0.2 ± 0.0c |
| Fat (%) | 35.0 ± 0.5a | 20.5 ± 0.8f | 22.5 ± 0.3de | 22.7 ± 0.1de | 21.6 ± 0.3e | 25.3 ± 0.4c | 22.9 ± 0.35d | 32.0 ± 0.1b | 25.8 ± 0.0c |
| Moisture (%) | 37.5 ± 0.0h | 53.4 ± 0.0a | 52.9 ± 0.2b | 52.4± 0.0c | 52.6 ± 0.0c | 48.2 ± 0.1e | 51.8± 0.0d | 42.7 ± 0.1g | 47.3 ± 0.0f |
| Ash (%) | 3.7 ± 0.0b | 5.7 ± 0.0a | 2.3 ± 0.0d | 2.3 ± 0.0d | 2.4 ± 0.0d | 2.6 ± 0.1c | 2.3 ± 0.1d | 2.2 ± 0.1d | 1.8 ± 0.0e |
| CHO* (%) | <0.0e | 7.8 ± 0.8d | 22.1 ± 0.5c | 22.6 ± 0.1c | 23.3 ± 0.4bc | 23.8 ± 0.5ab | 22.8 ± 0.4bc | 22.9 ± 0.3bc | 24.9 ± 0.1a |
| pH | 5.32 ± 0.0a | 6.00 ± 0.0b | 4.10 ± 0.0e | 4.05 ± 0.0f | 3.91 ± 0.0g | 4.71 ± 0.0c | 3.89 ± 0.0h | 4.49 ± 0.0d | 4.47 ± 0.0d |
| Water activity | 0.95 ± 0.0e | 0.97 ± 0.0bcd | 0.97 ± 0.0ab | 0.98 ± 0.0a | 0.97 ± 0.0abcd | 0.97 ± 0.0abcd | 0.96 ± 0.0cd | 0.97 ± 0.0abc | 0.96 ± 0.0d |
| Meltability (%) | 83.3 ± 3.3a | 4.0 ± 0.0d | 1.7 ± 0.0d | 1.8 ± 0.2d | 1.7 ± 0.0d | 34.5 ± 2.6c | 2.2 ± 0.9c | 46.1 ± 1.9b | 1.7 ± 0.0c |
Values followed by different superscript letters (a–h) in the same row are significantly different (p < 0.05). *CHO: Carbohydrates.
Table 5.
Colour space values (L*, a*, b*) before and after melting for Block-style products.
| Cheddar | Processed | Plant 1 | Plant 2 | Plant 3 | Plant 4 | Plant 5 | |
|---|---|---|---|---|---|---|---|
| Before melting | |||||||
| L* | 83.3 ± 0.2e | 76.7 ± 1.1g | 88.2 ± 0.1d | 79.8 ± 0.4f | 90.0 ± 0.1c | 93.6 ± 0.4a | 92.1 ± 0.1b |
| a* | -3.6 ± 0.1f | 9.1 ± 0.2b | -1.6 ± 0.0d | 10.3 ± 0.1a | -4.2 ± 0.0g | -1.3 ± 0.0c | -2.3 ± 0.0e |
| b* | 28.6 ± 0.5e | 47.6 ± 0.2b | 29.5 ± 0.3d | 50.6 ± 0.5a | 34.5 ± 0.1c | 7.7 ± 0.1g | 16.5 ± 0.1f |
| After melting | |||||||
| L* | 73.7 ± 0.9e | 67.5 ± 0.4f | 77.7 ± 0.4d | 68.2 ± 4.1b | 78.7 ± 0.9c | 88.5 ± 0.3a | 81.9 ± 0.5b |
| a* | -6.3 ± 0.1g | 8.8 ± 0.4b | -1.9 ± 0.1d | 15.5 ± 0.2a | -5.8 ± 0.1f | -1.2 ± 0.0c | -4.2 ± 0.0e |
| b* | 27.8 ± 0.6d | 52.3 ± 0.2b | 51.1 ± 0.5c | 68.6 ± 2.0a | 53.8 ± 0.7b | 11.3 ± 0.2f | 22.3 ± 0.1e |
Values followed by different superscript letters (a–g) in the same row are significantly different (p < 0.05).
Table 6.
Colour space values (L*, a*, b*) before and after melting for Slice-style products.
| Cheddar | Processed | Plant 1 | Plant 2 | Plant 3 | Plant 4 | Plant 5 | Plant 6 | Plant 7 | |
|---|---|---|---|---|---|---|---|---|---|
| Before melting | |||||||||
| L* | 81.7 ± 0.4f | 80.6 ± 0.3g | 86.9 ± 0.1c | 79.2 ± 0.1h | 85.8 ± 0.1e | 88.1 ±0.0a | 87.4 ± 0.1b | 75.4 ± 0.2i | 86.7 ± 0.1d |
| a* | -3.9 ± 0.01e | 11.4 ± 0.2b | -5.2 ± 0.0h | 9.0 ± 0.1c | -4.1 ± 0.1f | -3.0 ±0.0d | -4.9 ± 0.1g | 17.5 ± 0.1a | -3.9 ± 0.0e |
| b* | 30.4 ± 0.3f | 45.9 ± 0.2b | 35.8 ± 0.1d | 51.5 ± 0.1a | 35.6 ± 0.3d | 32.4 ± 0.0f | 34.6 ± 0.1e | 44.5 ± 0.8c | 23.9 ± 0.0g |
| After melting | |||||||||
| L* | 70.9 ± 0.6e | 77.5 ± 0.8b | 76.6 ± 1.2bc | 63.7 ± 0.0f | 75.9 ± 0.1c | 81.5 ±1.1a | 73.8 ± 0.3d | 64.5 ± 0.4f | 70.4 ± 0.0e |
| a* | -6.4 ± 0.0g | 17.8 ± 0.2b | -5.4 ± 0.1f | 15.0 ± 0.1c | -4.1 ± 0.0d | -6.2 ±0.0g | -3.9 ± 0.0d | 21.8 ± 0.2a | -5.1 ± 0.0e |
| b* | 30.9 ± 0.7g | 67.8 ± 0.6a | 54.2 ± 0.6e | 61.4 ± 0.1b | 53.9 ± 0.1d | 53.1 ±0.3de | 53.5 ± 0.2de | 58.2 ± 0.8c | 33.1 ± 0.0f |
Values followed by different superscript letters (a–i) in the same row are significantly different (p < 0.05).
Table 7.
Rheological parameters storage modulus (G’), loss modulus (G’’) at 20°C and 90°C, maximum loss tangent (Tan δmax), texture profile analysis parameters; hardness, adhesiveness, springiness and cohesiveness of block-style products.
Table 7.
Rheological parameters storage modulus (G’), loss modulus (G’’) at 20°C and 90°C, maximum loss tangent (Tan δmax), texture profile analysis parameters; hardness, adhesiveness, springiness and cohesiveness of block-style products.
| Cheddar | Processed | Plant 1 | Plant 2 | Plant 3 | Plant 4 | Plant 5 | |
|---|---|---|---|---|---|---|---|
| Hardness (N) | 179.2 ± 2.4a | 80.8 ± 1.6f | 105.9 ± 0.6e | 145.3 ± 2.3b | 131.5 ± 0.6c | 65.7 ± 0.7g | 124.5 ± 2.2d |
| Adhesiveness (N.s) | 11.1 ± 0.8b | 16.1 ± 4.1c | 0.8 ± 0.3a | 2.1 ± 0.7a | 4.5 ± 0.4a | 1.3 ± 0.1a | 5.1 ± 0.8a |
| Springiness (-) | 0.2 ± 0.0ab | 0.1 ± 0.0b | 0.4 ± 0.1ab | 0.5 ± 0.2a | 0.4 ± 0.2ab | 0.2 ± 0.0ab | 0.2 ± 0.1ab |
| Cohesiveness (-) | 0.1 ± 0.0c | 0.1 ± 0.0c | 0.1 ± 0.0b | 0.1 ± 0.0a | 0.1 ± 0.0b | 0.1 ± 0.0d | 0.1 ± 0.0d |
| G’ (20°C) | 56.9 ± 5.6bc | 15.1 ± 0.9d | 34.7 ± 4.3cd | 23.4 ± 2.8d | 47.3 ± 0.2bc | 86.1 ± 16.5a | 70.5 ± 12.9ab |
| G’’ (20°C) | 15.1 ± 0.8a | 3.3 ±0.5c | 4.7 ± 0.8c | 1.9 ± 0.5c | 4.4 ± 0.4c | 8.8 ± 2.3b | 9.5 ± 2.2b |
| G’ (90°C) | 0.1 ± 0.0d | 2.7 ± 0.7a | 0.2 ± 0.0d | 1.2 ± 0.1bc | 0.7 ± 0.1cd | 1.9 ± 0.2b | 1.4 ± 0.3bc |
| G’’ (90°C) | 0.1 ± 0.0bc | 0.8 ± 0.2a | 0.0 ± 0.0c | 0.3 ± 0.0b | 0.2 ± 0.0bc | 0.3 ± 0.0bc | 0.3 ± 0.1bc |
| Tan δ max | 1.9 ± 0.0a | 0.4 ± 0.0b | 0.2 ± 0.0d | 0.3 ± 0.0c | 0.2 ± 0.0cd | 0.1 ± 0.0e | 0.2 ± 0.0de |
Values followed by different superscript letters (a–g) in the same row are significantly different (p < 0.05).
Table 8.
Rheological parameters storage modulus (G’), loss modulus (G’’) at 20°C and 90°C, maximum loss tangent (Tan δmax) and uniaxial compression testing parameters; hardness of slice-style products.
Table 8.
Rheological parameters storage modulus (G’), loss modulus (G’’) at 20°C and 90°C, maximum loss tangent (Tan δmax) and uniaxial compression testing parameters; hardness of slice-style products.
| Cheddar | Processed | Plant 1 | Plant 2 | Plant 3 | Plant 4 | Plant 5 | Plant 6 | Plant 7 | |
|---|---|---|---|---|---|---|---|---|---|
| Hardness (N) | 3.4 ± 0.0ef | 0.6 ± 0.0h | 2.8 ± 0.0g | 3.6 ± 0.0d | 3.3 ± 0.0f | 4.7 ± 0.0b | 3.5 ± 0.0e | 6.6 ± 0.1a | 3.8 ± 0.0c |
| G’ (20°C) | 119.4 ± 16.7b | 11.7 ± 2.4f | 57.5 ± 7.1de | 94.3 ± 21.2bcd | 49.6 ± 5.1ef | 72.4 ± 6.7cde | 106.8 ± 21.5bc | 290.4 ± 14.9a | 85.9 ± 7.8bcde |
| G’’ (20°C) | 32.3 ± 4.3b | 4.3 ± 0.2de | 4.5 ± 1.6 cd | 13.9 ± 5.8bc | 2.8 ± 0.3e | 9.7 ± 1.6bcd | 15.6 ± 4.7c | 45.9 ± 5.7a | 11.9 ± 0.3bcd |
| G’ (90°C) | 0.0 ± 0.0d | 0.7 ± 0.1cd | 1.9 ± 0.4a | 1.3 ± 0.4abc | 1.5 ± 0.1ab | 1.5 ± 0.2ab | 1.2 ± 0.4bc | 0.4 ± 0.0d | 1.4 ± 0.2ab |
| G’’ (90°C) | 0.1 ± 0.0b | 0.3 ± 0.0ab | 0.5 ± 0.1a | 0.3 ± 0.1ab | 0.3 ± 0.1ab | 0.4 ± 0.1a | 0.2 ± 0.1ab | 0.1 ± 0.0b | 0.2 ± 0.1ab |
| Tan δ max | 2.5 ± 0.4a | 0.6 ± 0.0b | 0.2 ± 0.0c | 0.2 ± 0.3c | 0.2 ± 0.0c | 0.2 ± 0.0c | 0.2 ± 0.0c | 0.2 ± 0.0c | 0.2 ± 0.0c |
Values followed by different superscript letters (a–h) in the same row are significantly different (p < 0.05).
Table 9.
Beta coefficient values for Block style dairy and plant-based cheese analogues.
| Liking of Appearance | Liking of Aroma | Liking of Flavour | Liking of Texture | Overall Acceptability | Colour | Cheddar Aroma | Firmness in Mouth | Pasty Texture | Crumbly Texture | Sweet Taste | Salt Taste | Sour Taste | Bitter Taste | Cream Flavour | Cheddar Flavour | Dairy Sweet Flavour | Dairy Fat Flavour | Fruity (estery) Flavour | Off-Flavour | Astringent Aftertaste | |
|---|---|---|---|---|---|---|---|---|---|---|---|---|---|---|---|---|---|---|---|---|---|
| Cheddar | 1.83 | 1.49 | 2.21 | 1.83 | 2.28 | 2.63 | 2.62 | 0.29 | 1.48 | -1.42 | 0.28 | 0.22 | -0.47 | -0.31 | 0.85 | 2.43 | 0.67 | 1.25 | -0.27 | -1.22 | -0.65 |
| Processed | 0.13 | 0.09 | 0.15 | 0.08 | 0.14 | 0.50 | 0.20 | -0.25 | 0.29 | -0.21 | -0.05 | -0.01 | 0.00 | -0.03 | 0.06 | 0.18 | 0.03 | 0.07 | -0.08 | -0.07 | 0.00 |
| Plant 1 | -0.27 | -0.22 | -0.33 | -0.27 | -0.34 | -0.39 | -0.39 | -0.04 | -0.22 | 0.21 | -0.04 | -0.03 | 0.07 | 0.05 | -0.13 | -0.36 | -0.10 | -0.19 | 0.04 | 0.18 | 0.10 |
| Plant 2 | -0.23 | -0.19 | -0.28 | -0.23 | -0.29 | -0.34 | -0.33 | -0.04 | -0.19 | 0.18 | -0.04 | -0.03 | 0.06 | 0.04 | -0.11 | -0.31 | -0.09 | -0.16 | 0.03 | 0.16 | 0.08 |
| Plant 3 | -0.20 | -0.16 | -0.24 | -0.20 | -0.25 | -0.29 | -0.29 | -0.03 | -0.16 | 0.16 | -0.03 | -0.02 | 0.05 | 0.03 | -0.09 | -0.27 | -0.07 | -0.14 | 0.03 | 0.14 | 0.07 |
| Plant 4 | -1.53 | -1.24 | -1.84 | -1.53 | -1.91 | -2.20 | -2.19 | -0.24 | -1.24 | 1.18 | -0.24 | -0.18 | 0.40 | 0.26 | -0.71 | -2.04 | -0.56 | -1.05 | 0.22 | 1.02 | 0.55 |
| Plant 5 | -0.98 | -0.79 | -1.17 | -0.97 | -1.21 | -1.40 | -1.40 | -0.15 | -0.79 | 0.75 | -0.15 | -0.12 | 0.25 | 0.17 | -0.45 | -1.30 | -0.36 | -0.67 | 0.14 | 0.65 | 0.35 |
Table 10.
P-Values of Beta Coefficients (Figures shaded in green and red represented positive and negative significant correlations [+/- (P<0.05) respectively, for Block style products.
Table 10.
P-Values of Beta Coefficients (Figures shaded in green and red represented positive and negative significant correlations [+/- (P<0.05) respectively, for Block style products.
| Liking of Appearance | Liking of Aroma | Liking of Flavour | Liking of Texture | Overall Acceptability | Colour | Cheddar Aroma | Firmness in Mouth | Pasty Texture | Crumbly Texture | Sweet Taste | Salt Taste | Sour Taste | Bitter Taste | Cream Flavour | Cheddar Flavour | Dairy Sweet Flavour | Dairy Fat Flavour | Fruity (estery) Flavour | Off-Flavour | Astringent Aftertaste | |
|---|---|---|---|---|---|---|---|---|---|---|---|---|---|---|---|---|---|---|---|---|---|
| Cheddar | 0.00 | 0.00 | 0.00 | 0.00 | 0.00 | 0.25 | 0.00 | 0.00 | 0.20 | 0.75 | 0.61 | 0.08 | 0.11 | 0.65 | 0.02 | 0.00 | 0.14 | 0.00 | 0.43 | 0.00 | 0.23 |
| Processed | 0.12 | 0.33 | 0.01 | 0.38 | 0.06 | 0.00 | 0.01 | 0.00 | 0.00 | 0.00 | 0.72 | 0.69 | 0.06 | 0.10 | 0.30 | 0.00 | 0.68 | 0.24 | 0.07 | 0.17 | 0.51 |
| Plant 1 | 0.55 | 0.64 | 0.57 | 0.73 | 0.59 | 0.07 | 0.49 | 0.40 | 0.33 | 0.68 | 0.56 | 0.94 | 0.78 | 0.90 | 0.82 | 0.51 | 0.96 | 0.84 | 0.74 | 0.72 | 0.79 |
| Plant 2 | 0.62 | 0.99 | 0.00 | 0.00 | 0.00 | 0.00 | 0.53 | 0.02 | 0.02 | 0.38 | 0.97 | 0.37 | 0.84 | 0.42 | 0.10 | 0.19 | 0.87 | 0.46 | 0.96 | 0.03 | 0.26 |
| Plant 3 | 0.80 | 0.56 | 0.20 | 0.24 | 0.12 | 0.36 | 0.49 | 0.13 | 0.37 | 0.50 | 0.10 | 0.36 | 0.12 | 0.29 | 0.92 | 0.64 | 0.68 | 0.56 | 0.69 | 0.58 | 0.32 |
| Plant 4 | 0.02 | 0.06 | 0.07 | 0.19 | 0.08 | 0.00 | 0.00 | 0.00 | 0.71 | 0.01 | 0.00 | 0.61 | 0.00 | 0.11 | 0.36 | 0.00 | 0.06 | 0.00 | 0.38 | 0.53 | 0.05 |
| Plant 5 | 0.08 | 0.09 | 0.01 | 0.02 | 0.01 | 0.00 | 0.00 | 0.15 | 0.02 | 0.34 | 0.33 | 0.65 | 0.05 | 0.28 | 0.61 | 0.01 | 0.64 | 0.35 | 0.92 | 0.35 | 0.38 |
Table 11.
Beta coefficient values for Slice style dairy and plant-based cheese analogues.
| Liking of Appearance | Liking of Aroma | Liking of Flavour | Liking of Texture | Overall Acceptability | Colour | Cheddar Aroma | Firmness in Mouth | Pasty Texture | Crumbly Texture | Sweet Taste | Salt Taste | Sour Taste | Bitter Taste | Cream Flavour | Cheddar Flavour | Dairy Sweet Flavour | Dairy Fat Flavour | Fruity (estery) Flavour | Off-Flavour | Astringent Aftertaste | |
|---|---|---|---|---|---|---|---|---|---|---|---|---|---|---|---|---|---|---|---|---|---|
| Cheddar | 1.98 | 2.44 | 2.95 | 3.12 | 3.19 | -3.35 | 2.04 | 0.77 | 0.31 | -0.35 | 0.29 | 0.21 | 0.97 | 0.43 | 0.73 | 2.09 | 0.80 | 0.75 | 0.46 | -1.89 | -0.24 |
| Processed | -0.49 | -0.60 | -0.72 | -0.76 | -0.78 | 0.82 | -0.50 | -0.19 | -0.07 | 0.09 | -0.07 | -0.05 | -0.24 | -0.11 | -0.18 | -0.51 | -0.20 | -0.18 | -0.11 | 0.46 | 0.06 |
| Plant 1 | 0.33 | 0.41 | 0.49 | 0.52 | 0.53 | -0.56 | 0.34 | 0.13 | 0.05 | -0.06 | 0.05 | 0.04 | 0.16 | 0.07 | 0.12 | 0.35 | 0.13 | 0.13 | 0.08 | -0.32 | -0.04 |
| Plant 2 | -0.69 | -0.84 | -1.02 | -1.08 | -1.11 | 1.16 | -0.71 | -0.27 | -0.11 | 0.12 | -0.10 | -0.07 | -0.33 | -0.15 | -0.25 | -0.72 | -0.28 | -0.26 | -0.16 | 0.66 | 0.08 |
| Plant 3 | 0.33 | 0.41 | 0.50 | 0.52 | 0.54 | -0.56 | 0.34 | 0.13 | 0.05 | -0.06 | 0.05 | 0.04 | 0.16 | 0.07 | 0.12 | 0.35 | 0.14 | 0.13 | 0.08 | -0.32 | -0.04 |
| Plant 4 | -0.19 | -0.24 | -0.28 | -0.30 | -0.31 | 0.32 | -0.20 | -0.07 | -0.03 | 0.03 | -0.03 | -0.02 | -0.09 | -0.04 | -0.07 | -0.20 | -0.08 | -0.07 | -0.04 | 0.18 | 0.02 |
| Plant 5 | 0.32 | 0.40 | 0.48 | 0.51 | 0.52 | -0.54 | 0.33 | 0.13 | 0.05 | -0.06 | 0.05 | 0.03 | 0.16 | 0.07 | 0.12 | 0.34 | 0.13 | 0.12 | 0.07 | -0.31 | -0.04 |
| Plant 6 | -1.10 | -1.36 | -1.64 | -1.73 | -1.77 | 1.86 | -1.13 | -0.43 | -0.17 | 0.20 | -0.16 | -0.12 | -0.54 | -0.24 | -0.40 | -1.16 | -0.45 | -0.42 | -0.25 | 1.05 | 0.13 |
| Plant 7 | -0.47 | -0.58 | -0.70 | -0.74 | -0.75 | 0.79 | -0.48 | -0.18 | -0.07 | 0.08 | -0.07 | -0.05 | -0.23 | -0.10 | -0.17 | -0.49 | -0.19 | -0.18 | -0.11 | 0.45 | 0.06 |
Table 12.
P-Values of Beta Coefficients (Figures shaded in green and red represented positive and negative significant correlations [+/- (P<0.05) respectively, for Slice style products.
Table 12.
P-Values of Beta Coefficients (Figures shaded in green and red represented positive and negative significant correlations [+/- (P<0.05) respectively, for Slice style products.
| Liking of Appearance | Liking of Aroma | Liking of Flavour | Liking of Texture | Overall Acceptability | Colour | Cheddar Aroma | Firmness in Mouth | Pasty Texture | Crumbly Texture | Sweet Taste | Salt Taste | Sour Taste | Bitter Taste | Cream Flavour | Cheddar Flavour | Dairy Sweet Flavour | Dairy Fat Flavour | Fruity (estery) Flavour | Off-Flavour | Astringent Aftertaste | |
|---|---|---|---|---|---|---|---|---|---|---|---|---|---|---|---|---|---|---|---|---|---|
| Cheddar | 0.00 | 0.00 | 0.00 | 0.00 | 0.00 | 0.00 | 0.00 | 0.08 | 0.09 | 0.93 | 0.62 | 0.21 | 0.00 | 0.19 | 0.03 | 0.00 | 0.06 | 0.01 | 0.25 | 0.00 | 0.87 |
| Processed | 0.01 | 0.53 | 0.73 | 0.11 | 0.99 | 0.00 | 0.24 | 0.00 | 0.00 | 0.00 | 0.84 | 0.50 | 0.82 | 0.00 | 0.33 | 0.36 | 0.33 | 0.06 | 0.51 | 0.34 | 0.11 |
| Plant 1 | 0.40 | 0.21 | 0.21 | 0.71 | 0.27 | 0.00 | 0.83 | 0.82 | 0.43 | 0.14 | 0.69 | 0.63 | 0.20 | 0.25 | 0.53 | 0.26 | 0.37 | 0.88 | 0.33 | 0.08 | 0.24 |
| Plant 2 | 0.07 | 0.82 | 0.04 | 0.07 | 0.07 | 0.00 | 0.72 | 0.10 | 0.04 | 0.10 | 0.91 | 0.48 | 0.03 | 0.10 | 0.35 | 0.09 | 0.55 | 0.41 | 0.09 | 0.50 | 0.58 |
| Plant 3 | 0.07 | 0.61 | 0.46 | 0.43 | 0.50 | 0.00 | 0.81 | 0.21 | 0.31 | 0.95 | 0.65 | 0.78 | 0.90 | 0.81 | 0.83 | 0.93 | 0.70 | 0.76 | 0.86 | 0.69 | 0.92 |
| Plant 4 | 0.18 | 0.02 | 0.05 | 0.34 | 0.04 | 0.00 | 0.10 | 0.04 | 0.04 | 0.05 | 0.62 | 0.63 | 0.78 | 0.09 | 0.59 | 0.56 | 0.08 | 0.14 | 0.32 | 0.02 | 0.10 |
| Plant 5 | 0.10 | 0.49 | 0.30 | 0.46 | 0.40 | 0.00 | 1.00 | 0.61 | 0.54 | 0.59 | 0.67 | 0.62 | 0.70 | 0.92 | 0.73 | 0.81 | 0.50 | 0.83 | 0.98 | 0.52 | 0.68 |
| Plant 6 | 0.01 | 0.00 | 0.00 | 0.01 | 0.00 | 0.00 | 0.71 | 0.47 | 0.47 | 0.05 | 0.52 | 0.53 | 0.44 | 0.60 | 0.90 | 0.78 | 0.13 | 0.87 | 0.98 | 0.05 | 0.33 |
| Plant 7 | 0.47 | 0.01 | 0.01 | 0.03 | 0.00 | 0.00 | 0.00 | 0.18 | 0.02 | 0.24 | 0.70 | 0.24 | 0.53 | 0.20 | 0.19 | 0.02 | 0.14 | 0.05 | 0.37 | 0.03 | 0.23 |
Disclaimer/Publisher’s Note: The statements, opinions and data contained in all publications are solely those of the individual author(s) and contributor(s) and not of MDPI and/or the editor(s). MDPI and/or the editor(s) disclaim responsibility for any injury to people or property resulting from any ideas, methods, instructions or products referred to in the content. |
© 2025 by the authors. Licensee MDPI, Basel, Switzerland. This article is an open access article distributed under the terms and conditions of the Creative Commons Attribution (CC BY) license (http://creativecommons.org/licenses/by/4.0/).
Copyright: This open access article is published under a Creative Commons CC BY 4.0 license, which permit the free download, distribution, and reuse, provided that the author and preprint are cited in any reuse.


