
Submitted:
08 October 2024
Posted:
09 October 2024
You are already at the latest version
Abstract
Design and multi-objective optimization of auxetic sandwich panels (ASPs) are performed to enhance the blastworthiness of armored fighting vehicles (AFVs). Various metastructures in the form of four auxetic geometries are proposed as the sandwich core: re-entrant honeycomb (REH), double-arrow honeycomb (DAH), star honeycomb (SH), and tetra-chiral honeycomb (CH). This paper employs a combination of finite element (FE) and machine learning (ML) methodologies to evaluate blastworthiness performance. Optimization is carried out using the non-dominated sorting genetic algorithm II (NSGA-II) method. The optimization results show significant improvements in blastworthiness performance, with notable reductions in permanent displacement and enhancements in specific energy absorption (SEA). Global sensitivity analysis (GSA) using SHapley Additive exPlanations (SHAP) reveals that cell thickness is the most critical factor affecting blastworthiness performance, followed by the number of cells and corner angle or radius for CH. The application of optimized ASP on AFVs shows promising results, with no failure occurring in the occupant floor. Furthermore, AFVs equipped with the optimized ASP DAH significantly reduce maximum displacement and acceleration by 39.00% and 43.56%, respectively, and enhance SEA by 48.30% compared to optimized aluminum foam sandwich panels (AFSPs). This study concludes that ASPs have potential applications in broader engineering fields.
Keywords:
blastworthiness
; auxetic structure
; sandwich panels
; protective structures
; finite element
; machine learning
; armored fighting vehicle
1. Introduction
Landmines continue to pose significant threats to both military personnel and civilians. According to casualty statistics from military conflicts, approximately 60% of injuries are attributable to the explosion of mines and improvised explosive devices (IEDs) [1]. The International Campaign to Ban Landmines (ICBL) reported that in 2022, the total number of casualties and specifically anti-vehicle mines (AVMs) resulting from explosive remnants of war (ERW) reached 4,710 and 102, respectively [2]. Consequently, the development of blast-resistant or blastworthy structures for armored fighting vehicles (AFVs) as blast load mitigation remains critical.
As blast load and IEDs become more powerful, the blastworthy structures of AFVs must be increasingly resilient to withstand such threats. Various methods for blast loading mitigation have been researched through analytical, numerical, and experimental methods. As the simplest structure, single plates have been widely studied regarding their response to blast loading [3,4,5,6]. To enhance blastworthiness performance, modifications to single plates have been explored, such as adding stiffeners [7,8] and altering the flat plate to a V-shape [9,10]. However, single plates are insufficient for mitigating extreme blast loading. One of the most effective alternative blastworthy structures is the sandwich panel.
Sandwich panels are composite materials in which two or more different materials are combined at a macroscopic scale to produce a new material with superior performance compared to the constituent materials [11]. A sandwich panel consists of two thin, rigid face sheets bonded to a thick, lightweight core. This hybrid design fundamentally increases the moment of inertia of the structure without significantly adding mass. Various core structures have been studied for sandwich panels under blast loading. For example, Dharmasena et al. [12] investigated the blast response of metallic square honeycomb sandwich panels (HSPs) structures. The results showed that the deformation of the back face of the sandwich panel was 40-90% smaller than that of an equivalent solid plate. Zhu et al. [13] conducted experimental studies on the blast responses of metallic hexagonal HSP. The introduction of hexagonal HSP significantly decreased deflection. Zhang et al. [14] experimentally investigated the influence of geometric parameters of metallic trapezoidal corrugated-core sandwich panels subjected to blast loading. The results showed that increasing the sheet and cell thickness, as well as increasing the corrugated angle, enhanced the blast resistance. In addition to honeycomb and corrugated cores, aluminum foam has also proven effective as a core material in sandwich panels for withstanding blast loading. Numerous studies have examined aluminum foam sandwich panels (AFSPs) [15,16,17], for instance, Hanssen et al. [18] examined the behavior of AFSPs under blast loading experimentally, analytically, and numerically. The results demonstrated that using foam as a sacrificial layer can control the contact stress level, providing local protection to the structure. Liu et al. [19] studied the responses of AFSPs under blast loading and found that the peak load of the sandwich panel was reduced by 61.54–64.69% compared to a single plate.
Conventional honeycomb structures typically exhibit positive Poisson’s ratio (PPR) characteristics. Over the past three decades, there has been increasing interest in negative Poisson’s ratio (NPR) or auxetic materials due to their unique and contrasting properties compared to conventional materials. These auxetic materials are a prime example of metastructures, which are artificially designed structures with specific geometrical arrangements leading to unusual physical and mechanical properties. Auxetic structures, as a subset of metastructures, expand in all directions when stretched and contract when compressed. This opposite deformation behavior of auxetic materials leads to enhanced mechanical properties, such as more resistant to indentation [20,21], increased shear modulus [22,23], improvement in fracture toughness [24,25,26], and high energy absorption [20,27]. Due to these superior mechanical properties, auxetic materials have found applications in diverse fields such as medicine, biomedicine, sports, and engineering (for more details, see reference [28]). Although auxetic materials have superior mechanical properties, the application of ASPs in AFVs remains relatively uncommon and under-researched.
Several studies have investigated auxetic sandwich panels (ASPs) under air blast loading. For instance, Imbalzano et al. [29] and Yan et al. [30] studied the responses of ASP and hexagonal HSP to blast loading numerically and experimentally, respectively. Both studies demonstrated that ASP exhibits higher blast resistance than conventional HSP due to increased compressive stiffness as the impact zone of ASP shrinks inward. Lan et al. [31] examined the dynamic response of cylindrical ASP, conventional HSP, and AFSP subjected to blast loading. The results showed that cylindrical ASP outperformed both conventional HSP and AFSP across all design parameter combinations. Qi et al. [32] conducted experiments on close-in blast loading on ASP. The results showed that the introduction of ASP effectively prevented damage to the concrete base under close-in blast loading. Chen et al. [33,34] conducted experimental studies on the blast response of ASP with re-entrant and double-arrow structures as the core under paper tube-guided air blast loading. The results showed that the double-arrow structure had 10.9-20.5% less permanent displacement than re-entrant structures. Yan et al. [35] conducted blast experiments on 3D-printed auxetic honeycomb sandwich beams (AHSBs). The results showed that AHSBs possess better blast performance than regular honeycomb. Overall, most research on ASP under blast loading indicates that ASP offers superior blastworthiness compared to previous structures.
The primary objective of blastworthiness performance is to protect occupants within a structure. One quantifiable metric is the displacement or acceleration experienced by occupants. Additionally, blastworthy structures must achieve sufficient lightweight construction to facilitate the mobility of AFVs. These two objectives often conflict with each other. Multi-objective optimization has been demonstrated as effective in addressing this challenge. Due to the complexity and non-linearity, there is no direct relationship between geometric parameters of auxetic structures and blastworthiness performance. Therefore, surrogate models or metamodels are utilized. Numerous studies have focused on multi-objective optimization of blastworthiness performance, for instance, Cong et al. [10] optimized the design of multi-V hulls for light AFVs using artificial neural networks (ANNs) and the non-dominated sorting genetic algorithm II (NSGA-II). They optimized for lower tibia force and hull mass, achieving a 33-42% improvement in blastworthiness and a 43% reduction in mass compared to the baseline design. Qi et al. [36] and Wang et al. [37] conducted optimizations of curved and graded AFSPs, respectively, using NSGA-II with ANN and Kriging models as metamodels. Qi and Jiang et al. [38,39] optimized re-entrant ASP using radial basis function (RBF) and NSGA-II. The optimum design produces better performance by reducing maximum deflection until 33% and increase the areal specific energy absorption until 158.6%. Wang et al. [40] and Lan et al. [41] optimized 3D double-arrow sandwich panels.
Previous studies have primarily focused on re-entrant and double-arrow structures as cores for ASPs. However, other fundamental auxetic structures, such as star honeycomb and chiral honeycomb, remain largely unexplored. This study investigates ASPs incorporating four basic auxetic geometries: re-entrant honeycomb (REH), double-arrow honeycomb (DAH), star honeycomb (SH), and chiral honeycomb (CH), specifically for air blast loading scenarios. Numerical simulations were employed to evaluate the blastworthiness performance of these ASP configurations. Subsequently, a metamodel was developed to establish relationships between the design variables of ASPs and their blastworthiness performance. Global sensitivity analysis (GSA) was conducted to highlight the influence of each design variable on blastworthiness. Following this, multi-objective optimization was performed to generate a Pareto-optimal front. Finally, the optimal design from the Pareto front was identified as a protective structure suitable for AFVs subjected to air blast loading.
2. Materials and Methods
2.1. Geometry Description
The schematic diagram of ASP is shown in Figure 1. The ASP consists of two face sheets with thickness of and auxetic core, which has total dimensions of . The L, W, and H is the length, width, and height of the auxetic core in x, y, and z direction, respectively. The auxetic core consists of repetitive 2D unit cell of auxetic geometry with number of cell of and in y and z direction, respectively. The auxetic core is oriented with its cell’s longitudinal direction parallel to the two face sheets, as research by Walkowiak et al. [42] shows this configuration yields better blastworthiness than when the cell’s longitudinal direction is perpendicular to the face sheets. The size of ASP is determined based on the floor size of the AFV and the availability of additional space as a protective structure. Based on reference [43], typical floor size of small AFV is L = 1400 mm, W = 2500 mm, and H = 120 mm. The stand-off distance (SoD) from blast charge position to the front face is 800 mm. However, to reduce the computational time, the size of ASP is reduced into half of it, where L = 700 mm, W = 1250 mm, and H = 100 m with SoD of 400 mm to compensate the smaller size of ASP.
In this study, four auxetic basic geometries were proposed as the core of ASP, which are re-entrant honeycomb (REH), double-arrow honeycomb (DAH), star honeycomb (SH), and tetra-chiral honeycomb (CH). Figure 2 shows the unit cell configuration of each auxetic geometry. There are four independent geometric parameters which are defined in this study: the cell width w, the cell height h, the cell angle and node radius r for CH, and cell thickness t. The variable w and h are proportional with and , respectively, except for the variable h of DAH, which depends on and . Other dependent geometric parameters include inner cell spacing d ( and for SH), strut length and , and inner corner angle for DAH. Table 1 summarizes the geometric parameters and geometric constraints of each auxetic geometry. The relative density is defined as the ratio of the effective density of the structures to the density of the matrix or constitutive material. This parameter indicates the porosity of the cellular structure. Based on those geometric parameters, the relative density of each auxetic geometry can be expressed as follows:
2.2. Machine Learning Model
Machine learning (ML) methods are employed to develop surrogate model capable of predicting outputs based on specific input variables. The predicted output is related to the input variables via a black box function , where m and n is the dimension of input and output variables, respectively. The ML model serves multiple purposes. Firstly, it can be utilized to explore the design space, providing valuable insights into how each input variable interacts and contributes to the output. Secondly, it is used for optimization, enabling the determination of the Pareto front of the model for specific objective functions.
2.2.1. Metamodel
This paper utilizes an artificial neural network (ANN) as the metamodel to predict outputs. A typical ANN works like a black box to predict outputs based on given inputs. The working concept of ANN is inspired by the working process of biological neuron system, where many neurons are interconnected to form a complex and nonlinear network. The adaptive nature of input changes allows the ANN method to produce the best output without altering the output criteria. A typical ANN architecture consists of three layers: (1) the input layer, (2) hidden layers, and (3) the output layer. Neurons at the input and output layer represent the number of input and output variables, respectively. Each pair of neurons is connected with the connection weight w, and each neuron possesses a unique bias b. Mathematically, the output of l-th layer in ANN algorithm can be expressed as follows:
where k is the number of layer, is the activation function, is the weight matrix, and is the bias vector. and represents the input and output layer, respectively. During the model training process, the weight and bias values undergo meticulous updates through tailored training algorithms and optimizers, aimed at improving prediction accuracy and minimizing the loss incurred during prediction. For regression problems, common loss functions used to evaluate model training include the maximum absolute error (MAX) and mean squared error (MSE). Additionally, R-squared () is employed to quantify how effectively the input variables explain the variability in the output variable. These metrics: MAX, MSE, and , are calculated as follows:
where is the number of sample, is the actual value, is the mean value.
2.2.2. Sensitivity Analysis
Sensitivity analysis assesses how variations in input values influence output variables, providing insights into the robustness and reliability of a ML model. SHapley Additive exPlanations (SHAP) [44] is an explainability technique based on the Shapley value concept introduced by Shapley [45] in cooperative game theory. Essentially, the Shapley value calculates the average contribution of a feature across all possible subsets F. Unlike variance-based decomposition methods such as Sobol indices, SHAP values offer a more accurate reflection of the input-output relationship in design exploration, as input variables are considered to be non-random [46]. The Shapley value of j-th feature is defined as:
where S is the one subset of F and the right term is the marginal contribution of feature j to a subset S. An essential characteristic of the Shapley value is its efficiency, ensuring that the total sum of Shapley values for all features equals the model output. Therefore, the output value of can be expressed as:
where is the output of reference input value or . For global sensitivity analysis (GSA), averaged SHAP values are utilized to assess feature sensitivity at a global scale [46]. Averaged SHAP values indicate the average impact of input variables on specific outputs. The averaged SHAP of j-th feature can be expressed as:
2.2.3. Multi-Objective Optimization
A multi-objective optimization problem (MOOP) involves achieving optimal solutions from two or more conflicting objectives. Genetic algorithms (GA) are evolutionary optimization techniques widely applied to such problems. GA operates on the principles of natural selection inspired by Charles Darwin’s theory, employing genetic operators including selection, crossover, and mutation [47]. In this paper, the second-generation non-dominated sorting genetic algorithm or NSGA-II is used as the multi-objective optimization method. NSGA-II represents an advancement over NSGA proposed by [48], recognized as a popular GA for generating the Pareto front in MOOP within engineering. NSGA-II employs two effective sorting principles: elitist non-dominated sorting to rank solutions and crowding distance sorting to maintain diversity in the solution set.
2.3. Numerical Modeling
In this paper, all numerical simulations were conducted using the non-linear explicit finite element (FE) program LS-DYNA.
2.3.1. Geometry, Boundary Conditions, and Contact Modeling
The ASP was modeled as a quarter-symmetric model, as shown in Figure 3, due to symmetric nature of the simulation. This approach reduces computational time by up to four times compared to a full model. Therefore, the quarter model of ASP has dimensions of L = 350 mm, W = 625 mm, and H = 100 mm. Symmetric boundary conditions in x and y directions were applied to the ASP side in and plane, respectively, while outer face sheets were fixed on the other two sides. The face sheets and auxetic core were modeled using fully integrated shell with five and two integration points, respectively, to minimize the hourglass energy. For data sampling process, thickness of both face sheets is set to 5 mm. The mesh convergence analysis was performed to obtain the mesh size for auxetic core, which converged at mesh size of 3 mm, while 10 mm was used for the face sheets [43]. AUTOMATIC_SINGLE_SURFACE was applied to all parts of ASP for self-contact, while AUTOMATIC_SURFACE_TO_SURFACE was applied between the auxetic core and both face sheets to prevent the penetration. The upper and lower node of auxetic core was assumed to be fully connected with both face sheets using TIED_NODES_TO_SURFACE. Dynamic and static coefficient of friction for all contact is 0.3 and 0.2, respectively.
2.3.2. Material Modeling
Considering its high strain capability, good manufacturability, and low cost, the ASP was modeled using stainless steel 304 material. Due to strain rate dependency in blast simulation, a modified Johnson-Cook (J-C) model was adapted for the simulation. According to this constitutive model, the effective plastic stress is given by the following equation:
The first term represents material plasticity, where is the effective plastic strain, A is the yield strength, B and n are strain hardening parameters. The second term accounts for strain rate dependency, where is the strain rate, is the reference strain rate, and C is the strain rate sensitivity coefficients. The final term addresses temperature dependency, where T, , and are the working temperature, room temperature, and melting temperature, respectively, and m is the thermal softening coefficient.
All material parameters can be determined through curve-fitting of experimental data. The modified J-C parameters for SS304 were obtained from curve-fitting of the stress-strain curve by [14] and [49,50], as shown in Figure 4. These material parameters were summarized in Table 2.
For the material failure criterion, Cockcroft-Latham damage evolution rule was used to simulate the failure of the modified J-C model. This criterion is based on the concept that ductile fracture occurs when the accumulated plastic strain energy in a material reaches a critical value [51]. Mathematically, the Cockcroft-Latham damage criterion can be written as:
where is the critical damage parameter, is the maximum principal stress, and is the plastic strain energy, with is the strain failure. The value of is 1 [43], while is obtained from the stress-strain curve, with a value of 296 MPa. In this study, failure criteria were not applied during the data sampling process but were only considered for the application of the armored fighting vehicle sub-system.
2.3.3. Blast Load Modeling
Several blast load models can be implemented in numerical simulations. The simplest model for blast load simulation is the Conventional Weapons Effects Program (CONWEP), developed by Kingery and Bulmash [52]. This model is selected for its computational efficiency, as it does not require Euler field or particle calculations. The CONWEP model considers two types of pressure from a blast load: reflected pressure and incident pressure, as given in the following equation:
where is the incidence angle, is the reflected pressure, and is the incident pressure. This empirical model is valid in range of 0.147 m/kg1/3 40 m/kg1/3, where is called scaled distance, with R is the stand-off distance (SoD) and m is the mass of TNT. As previously mentioned, the R and m used in this study are 400 mm and 8 kg, respectively, such that Z equal to 0.2 m/kg1/3, which is still inside the range.
Another method for simulating blast phenomena is smoothed-particle hydrodynamics (SPH), a particle-based computational technique developed by [53,54]. SPH is a mesh-free Lagrangian method where the system’s state is represented by a finite number of discrete particles whose positions can move according to the velocity field. In this study, the SPH model does not account for the effects of air particles and the casing of the charge. The material model HIGH_EXPLOSIVE_BURN was used for the explosion, characterized by parameters such as density , detonation velocity , and Chapman-Jouget pressure . The corresponding Jones-Wilkins-Lee (JWL) equation of state (EOS) was employed to compute pressure as a function of initial relative volume and internal energy per unit volume, The EOS of JWL is defined by:
where A, B, , , and are the constant, E is the internal energy per unit volume, and is the ratio of the density at the time of the explosion and the initial density of TNT. The material parameters and the corresponding JWL EOS of TNT was given in Table 3.
3. Results and Discussion
3.1. Validation of FE Model
To validate the numerical models employed, the response to blast events was compared with experimental data. This study encompasses two main validation aspects: (1) validating the modeling of blast loads and (2) validating the blast response of sandwich panels.
3.1.1. Validation and Comparison of Air Blast Model
Firstly, three air blast models were validated and compared: (1) CONWEP, (2) SPH, and (3) multi-material Arbitrary Lagrangian-Eulerian (MMALE). CONWEP and SPH models are detailed in Section 2.3.3. MMALE represents an advanced method in which air blast dynamics are modeled using Eulerian formulations. This approach allows blast waves to propagate through the air domain and interact with Lagrangian structures. In this validation, the contact algorithm used between Eulerian and Lagrangian part is penalty based method through the keyword CONSTRAINED_LAGRANGE_IN_SOLID.
Experimental data from Børvik et al. [6] used as validation for the air blast models. A single AL-6XN steel plate specimen with dimension of 406 × 406 × 3.4 mm3 was subjected to a 0.15 kg C-4 explosive charge at SoD of 150, 200, and 250 mm. For the CONWEP model, the 0.15 kg C-4 was equated to 0.18 kg TNT based on mass equivalence [56]. The J-C material model parameters from reference [6] were implemented in the numerical simulations. SPH and MMALE methods utilized the MAT_HIGH_EXPLOSIVE_BURN model and JWL EOS for modeling the C-4 charge, with material properties and JWL EOS details provided in [55]. The primary comparative metric was the permanent displacement of the central node of the plate. Figure 5 illustrates the FE models of the three air blast models.
Table 4 summarizes the numerical result compared to the experimental results. MMALE shows the smallest error for SoD of 150 and 200 mm, while CONWEP performs best for SoD of 250 mm. On average, MMALE exhibits the smallest error, followed by SPH and CONWEP. Figure 6 shows the bar plot of for each air blast model alongside experimental data. This observation is consistent with the fact that CONWEP relies solely on empirical formulas with inherent limitations. In contrast, SPH and MMALE provide more accurate and detailed simulations by solving the governing equations of fluid and solid dynamics. However, the computational time required by CONWEP is significantly faster, approximately 55 times faster than SPH and 305 times faster than MMALE. Considering computational efficiency, the CONWEP method is chosen for the optimization process, while the SPH model is used for final evaluation.
3.1.2. Validation of Sandwich Panels
The experiments conducted by Børvik et al. [6] only involved a single plate, whereas this paper focuses on the blast response of a sandwich panel. Therefore, it is essential to validate the numerical model of the sandwich panel. Experimental data provided by Zhang et al. [14] is relevant as it also investigates the blast response of a sandwich panel, despite using a non-auxetic core geometry. The experimental setup, objectives, and material properties align closely with those used in this paper. Zhang et al. [14] conducted experiments on metallic trapezoidal corrugated-core sandwich panels under air blast loads. Figure 7 shows the experimental set-up and schematic diagram of trapezoidal corrugated-core sandwich panel. Their study primarily explores the influence of geometric parameters and SoD on mid-point displacements. The horizontal plane have dimensions of 452 × 440 mm, and the exposed area of the blast or the corrugated core dimensions are 300 × 288 mm.
The numerical model utilizes a symmetric-quarter model with symmetric boundaries fixed at the outer sides. The material properties of 304 stainless steel were represented using a modified J-C model, with parameters listed in Table 2. A 55 g cylindrical TNT charge, with a radius of 17.5 mm and height of 37.2 mm, was simulated using the SPH method due to its specific shape, while the CONWEP method approximated the charge as a spherical air blast.
Figure 8 shows a correlation plot of comparing experimental and numerical simulation results. The close alignment of data points around the line of perfect match indicates strong agreement between numerical predictions and experimental data. The average error across all samples, as detailed in Table 5 is less than 10%. To further validate the numerical model’s reliability, deformation modes of three sandwich panels with different core configurations were compared between numerical simulations and experimental results. As shown in Figure 9 (left), the numerical model accurately reproduces major deformations, including global deflection in the middle area of the corrugated core and local buckling of the core web. Figure 9 (right) also shows the cross-sectional displacement profiles, showing close correspondence between numerical and experimental results. Overall, the numerical methods employed in this study demonstrate validity and accuracy suitable for subsequent optimization processes.
3.2. Metamodel and Multi-Objective Optimization
In this paper, MOOP was defined and solved to find the optimal solution from two conflicting objectives. As previously mentioned, the metamodel was constructed using an ANN method, while the multi-objective optimization was performed using NSGA-II. Before establishing the ANN algorithm, Design of Experiments (DoE) was generated using numerical methods. To construct the metamodel, 160 samples for each auxetic geometry were generated and simulated using FE solver.
3.2.1. Design Variables, Objective Function, and Constraint
Two conflicting objective variables were optimized in this MOOP, which are permanent displacement of ASP back face and specific energy absorption (SEA) of the auxetic core. The was obtained by averaging the displacement-time history in the area where the displacement had already converged, while the SEA of the core was calculated by dividing the internal energy E by the core mass m. The objective functions are to minimize the and -SEA.
The design optimization focused solely on the independent geometric parameters of each auxetic geometry. Two face sheets, material types, and other variables were not optimized since this study focuses only on the influence of auxetic geometry on blast responses. The independent variables w and h were converted into the number of cells and , respectively, due to the constraint of fixed ASP dimensions. The design variables for the MOOP for REH, DAH, and SH are specified as follows:
and for the CH, the variable is changed with the r:
Design constraints for the MOOP are listed in Table 6 taking into account the geometric limitations. Based on the design variables and constraints, the design space with the corresponding normalized for each auxetic model is presented in Figure 10. As shown in Figure 10, higher input variables result in higher of the model.
3.2.2. Metamodel Accuracy
In establishing the metamodel, 90% of the DoE samples were used as the train set, while 10% were reserved as the test set. Additionally, 10% of the training set was employed as the validation set during the training process. This ratio was chosen to ensure model accuracy given the limited number of sampling points generated in this study. The Adam optimizer was used due to its efficiency in accelerating the gradient descent algorithm. A learning rate of 0.001 and an early stopping algorithm were also employed to monitor the loss of the validation set, preventing overfitting. All hidden layers used the ReLU (rectified linear unit) activation function to capture model non-linearity, while the output layer used a linear activation function to produce continuous values.
The error parameters of each metamodel are presented in Table 7. All MAX values are less than 5 mm for and 0.5 J/g for the SEA, respectively. Generally, the values of all metamodels are greater than 0.95, indicating that the predicted values from the ANN model are very close to the simulation values. The predicted values of the trained metamodel for each auxetic geometry are shown in Figure 11. The deviations between the predicted values and the simulation sampling points are very small. Based on the three evaluation parameters, all metamodels are confirmed to be accurate and can be used for the subsequent multi-objective optimization process.
3.2.3. Global Sensitivity Analysis
In this section, the sensitivities of each input variable are analyzed using the SHAP method on 50,000 generated samples. The average SHAP values for are presented in Figure 12a. It can be observed that the variables and t exhibit very high average SHAP values, indicating a significant influence on . On average, varying and t results in changes in of 5.06 mm and 5.68 mm, respectively. In contrast, the variables and have relatively low average SHAP values in of 2.07 mm and 1.42 mm, respectively. The averaged SHAP of SEA is given in Figure 12b. Similar to , the variable t has the highest average SHAP value, contributing an average change of 1.21 J/g, followed by with 0.89 J/g, with 0.77 J/g, and with 0.43 J/g. Overall, the variable t has the greatest influence on both blastworthiness performance metrics, while have the least influence.
To provide a more intuitive understanding of how each input variable affects the output, summary plots of SHAP for each auxetic geometry are presented in Figure 13. These summary plots display the SHAP values for each variable alongside the input values for each sample. The sign of SHAP values indicates the change of output value with respect to the reference value. In this case, the reference value is the baseline model. In general, higher input values result in lower outputs for both and SEA, as indicated by the gradual change in color. However, the variable shows a nonlinear influence on as indicated by disordered coloring. Figure 14 shows the scatter plot of the influence of each feature for all auxetic geometries. As illustrated in Figure 14, high input values, especially for variables and t, correspond to the lower-left region of the plot, indicating small and small SEA, and vice versa. The SHAP values from Figure 13 are consistent with the trends observed in Figure 14, as both depict the same influence of inputs on outputs. This consistency between SHAP values and scatter plots highlights the robustness of the input-output relationship analysis.
3.2.4. Pareto Front and Optimal Solution
Based on NSGA-II optimization, the Pareto front for each auxetic model is shown in Figure 15. Each orange circle in Figure 15 represents a non-dominated solution. As expected, the Pareto front illustrates the conflict between the two objectives, positioned at the outer side of the prediction sample marked with blue circles. As increases, SEA also increases, and vice versa.
Several design points from Figure 15 are listed in Table 8. The table shows that the average prediction error from the ML model compared to the simulation is relatively small, with values less than 10%, except for the ideal design with minimum and the optimized designs for the REH and CH models. However, when examining the absolute value difference between prediction and simulation, it remains below the MAX value from our trained model, as indicated in Table 7. Therefore, considering the small sample size used in this study, we can conclude that the model’s error is within an acceptable range, indicating that the optimization results are reliable.
A comparison between the Pareto front and selected design points was conducted. First, the baseline model, marked with a red triangle, is located at the lower right of the Pareto front, as shown in Figure 15. The optimization results in an improvement of 12.55-35.60% in reduction for the same SEA and 26.21-83.68% in SEA enhancement for the same . Therefore, the Pareto front offers superior performance in at least one objective.
Next, the compromised design, marked with the purple pentagon, is compared with the baseline model. A compromised design is a design point on the Pareto front that has a minimum distance to all existing ideal points, which marked with a green "+". As given in Table 8, although the compromised designs for REH and DAH have larger than the baseline model by 22.97% and 2.36%, respectively, they offer superior blastworthiness in SEA, with improvements of 98.06% and 47.84%, respectively. Meanwhile, the SH and CH models outperform the baseline model in both and SEA by 4.63-11.86% and 13.14-49.37%, respectively. These results indicate that the compromised models yield optimal design points that balance multiple objectives and still surpass the baseline model in at least one objective.
The optimized design from Table 8 was selected by comparing it with other optimized designs. This is carried out to assess the effectiveness of the optimization results. In this paper, the optimized design used for comparison is the optimized AFSP conducted by Pratomo et al. [43]. The optimized AFSP shares the same dimensions as the ASP with a relative density of 0.6. The material of aluminum foam was modeled as CRUSHABLE_FOAM. The design point from the Pareto front with the same mass as the optimized AFSP was selected as the optimized design for ASP. Figure 16 shows the comparison between the optimized ASP and AFSP. The selected optimized design of each auxetic geometry are marked with black "X," while the optimized AFSP is marked with yellow diamond in Figure 15.
As shown in Figure 15 and Table 8, the optimized ASP for all auxetic geometries outperforms the optimized AFSP in SEA by 133.33-156.86%. However, some auxetic models exhibit worse , specifically REH and CH, by 16.21% and 0.13%, respectively. In contrast, DAH and SH models produce a better by 36.71% and 6.49%, respectively. Overall, the optimized ASP results from the Pareto front, with the same mass as the optimized AFSP, demonstrate superior blastworthiness. Furthermore, the DAH configuration in Table 8 shows promising performance compared to the optimized AFSP and other auxetic geometries.
Figure 17 shows the comparison of the Pareto front for all auxetic models. For small values of or SEA, the DAH exhibits the best blastworthiness performance, whereas the REH shows the poorest performance. The SH slightly outperforms the CH in terms of smaller or SEA. For large vales of or SEA, the REH and DAH share a similar Pareto front, while the CH performs better than the SH for very large values of or SEA. Overall, the DAH structure demonstrates the best blastworthiness performance among the structures, followed by the REH, SH, and CH. These results align with the findings from the experiment conducted by Chen et al. [33], where the DAH structure outperformed the REH structure.
3.3. Blastworthiness Analysis
Figure 18 illustrates the deformation of four models with varying , from low (left) to high (right), at 5 ms. The ideal model with maximum SEA shows significant compression in the central area, whereas the ideal model for minimum exhibits minimal compression. As seen in Figure 18 and Table 8, the ASP with higher values of tends to exhibit smaller values of , whereas those with lower tends to have larger values of . This correlation between and is further supported by the SHAP values depicted in Figure 13, where higher values of design variables correspond to smaller . These visual representations illustrate that increasing the design variables or results in a stiffer structure, thereby enhancing its resistance to blast impulses. However, higher values of also lead to lower SEA values due to the increased mass of the ASP.
Based on the GSA results, as indicated by the SHAP values (Figure 12, Figure 13), the most influential design variable in ASP under air blast loading is the thickness (t). This finding aligns well with the analytical solutions for dynamic crushing stress or plateau stress of auxetic structures, as discussed in studies by [57] and [58]. According to the formula for dynamic crushing stress in structures such as REH and SH, the variable t exhibits a quadratic relationship, reflecting its role in plastic bending moment: , where is the yield strength and b is the strut length. Therefore, increasing t results in a quadratic increase in crushing stress. Additionally, the variable significantly influences blastworthiness performance. Figure 14 illustrates that design points with higher values tend to cluster near the Pareto front. This is attributed to the increased number of cells stacked at the central blast point, enhancing ASP resistance. In contrast, variables and show opposite effects compared to , with higher values typically located in the bottom-right region, away from the Pareto front. Although increasing and reduces , this reduction is relatively minor and primarily affects SEA reduction, as depicted in Figure 13.
As seen in Figure 18, global NPR behavior is not consistently observed in ASP. During high-velocity blast impulses impacting the ASP center, the upper part of the auxetic core collapses rapidly, limiting full shrinkage. NPR behavior is more likely to occur in models with lower , where unit cells are less constrained by neighboring cells, allowing freer deformation. Another influencing factor in NPR behavior of ASP is the corner angle or node radius in CH models. Increased corner angles tend to promote NPR behavior, while smaller node radii increase the likelihood of NPR behavior in the CH due to slender ligament struts makes it easier for nodes to rotate. Figure 19 shows the displacement vector of the ASP when subjected to air blast loading. From Figure 18 and Figure 19, REH and CH show the most dominant NPR behavior, followed by DAH and SH. In general, auxetic structures configuration enhance blastworthiness as the material flows toward the impact zone (central area), as seen in Figure 19.
3.4. Application of the Optimized ASP for Armored Fighting Vehicle Protection
In this section, the optimized ASP DAH is applied to the sub-system of an AFV to achieve blastworthiness according to NATO STANAG 4569 level 3b standards [59]. Based on documents from AEP Volume 2, evaluating armored vehicles against blast threats involves three steps: (1) structural integrity test, (2) occupant survivability test, and (3) occupant survivability test overmatch. In the first step, the structure of an armored vehicle is tested for integrity under blast load conditions. The structure passes this test if there are no holes or cracks that increase the likelihood of blast penetration into the passenger compartment. In this study, the addition of ASP protective structures to armored vehicles was evaluated based on the requirements of the structural integrity test.
Figure 20 shows the finite element (FE) model of an armored vehicle (AFV) sub-system subjected to an 8 kg TNT blast. This model is adapted from reference [43] and simulated to evaluate the blastworthiness of the additional protective structure on the AFV. The structural integrity of an AFV includes the floor or occupant side plate (OSP), struck side plate (SSP), lower hull, and vehicle mass, which are supported by four holders. In this case, the vehicle mass is set to 14,000 kg and modeled as a rigid part. The bottom side of the support and steel pot are fixed. The 8 kg TNT blast is modeled using the smoothed-particle hydrodynamics (SPH) method, which has been validated in Section 3.1.2. INTITAL_DETONATION was defined at the center of the charge with the SoD of 0.8 m to the floor. The materials chosen for the OSP and lower hull are armor steel 1500 T, while HR 500 is used for the SSP. The material properties for both 1500 T and HR 500 is given in reference [43].
To assess the blastworthiness of ASP, a comparative evaluation was conducted with other structures, which are AFV without protective structures and AFV with optimized AFSP. For the AFV without protective structures, simulations were performed with OSP thicknesses of 10 mm and 20 mm. The optimized AFSP configuration used in this evaluation is the optimum configuration from optimization process conducted by Pratomo et al. [43], while the configuration of the optimized ASP DAH are presented in Table 8.
Figure 21 shows the simulation results of the AFV sub-system deformation under an 8 kg TNT blast. All deformation and failure modes that occurred in the OSP and SSP are consistent with the failure modes summarized in the research by Jacob et al. [60]. As seen in Figure 21a, the 10 mm OSP without a protective structure fails to meet structural integrity requirements due to severe perforation. According to the Cockcroft-Latham damage failure criterion, petalling damage occurs in the middle of the OSP, allowing blast fragments and debris to enter the occupant compartment. Conversely, other configurations, including the 20 mm OSP without a protective structure, maintain structural integrity. As seen in Figure 21b-d, no perforations occurred in the OSP. Failure Mode I, i.e. large inelastic deformation, occurred in the OSP for AFV sub-system with 20 mm OSP and protective structure. However, the AFV sub-system with 20 mm OSP suffer very large deformation, compared with AFV sub-system with the protective structures. From Figure 21c, the SSP of AFV sub-system with optimized AFSP experiences failure mode IIc, i.e. completely tearing at the center area and forms ring-shaped or capping. A different failure mode is observed in the SSP of the AFV sub-system with optimized ASP DAH, where the SPP experiences failure mode II*c, i.e. partial tearing in the central area of the blast, as seen in Figure 21d.
Figure 22 shows the dynamic responses of the AFV sub-system both with and without protective structures, focusing on the mid-point displacement and acceleration of the OSP. The results demonstrate that applying protective structures to AFVs significantly reduces the displacement and acceleration of the floor or OSP. Furthermore, the optimized ASP DAH structure decreases OSP deformation more effectively than single plates and the optimized AFSP. The optimized ASP DAH structure achieves a maximum displacement reduction of 56.99% and 39.00% compared to the single plate and optimized AFSP, respectively. Additionally, it reduces the maximum acceleration by 52.55% and 43.56% relative to the single plate and optimized AFSP, respectively, indicating its superior performance.
Figure 23 presents the absorbed energy (EA) and specific energy absorption (SEA) for the AFV sub-system with different structural types. It can be seen that in AFVs with protective structures, the core structure absorbs the most energy, followed by the SSP and OSP. Additionally, the energy absorbed by the optimized ASP DAH exceeds that of both the single plate and the optimized AFSP. Notably, the optimized ASP DAH structure achieves SEA improvements of 335.00% and 48.30% compared to the single plate and optimized AFSP, respectively. This highlights the superior effectiveness of auxetic structures in absorbing energy under localized loads compared to other structures. Table 9 summarizes the blastworthiness parameters of AFV sub-systems with and without protective structures. Overall, ASP, particularly ASP DAH, demonstrates significant potential for application as a protective structure in AFVs.
4. Conclusions
The design and multi-objective optimization of four types of auxetic sandwich panels (ASPs) under air blast loading were successfully conducted using a machine learning (ML) approach. The blastworthiness performance of ASPs was evaluated using the finite element (FE) method. The optimization objectives were to reduce permanent displacement () and increase specific energy absorption (SEA). Non-dominated sorting genetic algorithm II (NSGA-II) was employed for optimization, utilizing an artificial neural network (ANN) metamodel. The results of the optimization process are summarized as follows:
- The ANN metamodel that was formed was proven to be accurate in predicting the blastworthiness performances of ASP. The optimization process using NSGA-II produces optimal designs efficiently. The optimization results shows that the permanent displacement is conflicting to the SEA.
- Global sensitivity analysis (GSA) using the SHapley Additive exPlanations (SHAP) method indicates that cell thickness in ASPs is the primary factor influencing blast-worthiness performance, significantly affecting stiffness and plastic bending moments within auxetic cells. Meanwhile, the corner angle and node radius in the CH model are identified as the least influential variables.
- The configuration of auxetic structures enables effective energy absorption, enhancing the blast resistance of sandwich structures, as the material flows toward the impact zone. The occurrence of global negative Poisson’s ratio (NPR) behavior in ASPs under air blast loading is influenced by rapid and high-velocity blast impulses, leading to localized unit cell collapse near the blast source. Generally, the REH and CH models exhibit more dominant NPR behavior at lower relative densities.
- Multi-objective optimization substantially enhances blastworthiness performance. Compared to baseline models, optimization achieves SEA improvements ranging from 26.21% to 83.68% for equivalent permanent displacements, and reduces permanent displacement by 12.55% to 35.60% for equivalent SEAs. The compromised REH and DAH models outperform baseline models in SEA only by 98.06% and 47.84%, respectively, while SH and CH models exhibit improvements in both permanent displacement (4.63-11.86%) and SEA (13.14-49.37%). Furthermore, the optimized ASP outperforms the optimized AFSP in SEA by 133.33-156.86%. However, only optimized DAH and SH that produces better permanent displacement reduction by 36.71% and 6.49%, respectively. Among the four auxetic configurations, the DAH structure offers the best blastworthiness performance.
- ASPs demonstrate promising results in armored fighting vehicle (AFV) applications, meeting structural integrity requirements effectively. In dynamic response scenarios, optimized ASP DAH significantly reduce maximum displacement and acceleration of occupant floors by 39.00-56.99% and 43.56-52.55%, respectively, compared to other structures. AFV sub-system incorporating optimized ASP DAH achieve a 48.30% increase in SEA over optimized AFSP and a remarkable 335.00% increase over single plates. This indicates the auxetic core exhibits superior energy absorption capabilities compared to aluminum foam cores and single plates.
The preliminary results of this study indicate that ASPs have significant potential as blastworthy structures for broader applications, including defense in buildings, automotive, and aerospace industries. However, further research is required to comprehensively evaluate the ASP response, as this study does not consider in manufacturing aspect of the ASP and only employs empirical methods for modeling air blast loading. Future research could incorporate additional objectives, such as minimizing acceleration and reducing the injury risk of an occupant, as part of a multi-objective optimization framework. Additionally, explainable machine learning methods could be utilized in metamodel creation to provide more intuitive insights into the relationship between ASP design variables and blastworthiness performance.
Author Contributions
Conceptualization, A. and S.P.S.; methodology, A., S.P.S., D.W., and A.N.P.; software, A.; validation, A., S.P.S., D.W., and A.N.P.; formal analysis, A., S.P.S., D.W., and A.N.P.; data curation, A.; writing—original draft preparation, A.; writing—review and editing, S.P.S., D.W., and A.N.P.; visualization, A.; supervision, S.P.S., D.W., and A.N.P. All authors have read and agreed to the published version of the manuscript.
Funding
This research received no external funding
Institutional Review Board Statement
Not applicable
Informed Consent Statement
Not applicable
Data Availability Statement
The raw data supporting the conclusions of this article will be made available by the authors on request.
Acknowledgments
This research was supported by Institut Teknologi Bandung (ITB) under Research, Innovation, and Community Service Program.
Conflicts of Interest
The authors declare no conflicts of interest.
References
- Krzystała, E.; Mężyk, A.; Kciuk, S. Minimisation of the explosion shock wave load onto the occupants inside the vehicle during trinitrotoluene charge blast. International Journal of Injury Control and Safety Promotion 2014, 23, 170–178. [Google Scholar] [CrossRef] [PubMed]
- ICBL. Landmine Monitor 2023, 2023. Last accessed 17 July 2024.
- Nurick, G.; Martin, J. Deformation of thin plates subjected to impulsive loading—A review: Part I: Theoretical considerations. International Journal of Impact Engineering 1989, 8, 159–170. [Google Scholar] [CrossRef]
- Nurick, G.; Martin, J. Deformation of thin plates subjected to impulsive loading—a review Part II: Experimental studies. International Journal of Impact Engineering 1989, 8, 171–186. [Google Scholar] [CrossRef]
- Nurick, G.; Shave, G. The deformation and tearing of thin square plates subjected to impulsive loads—An experimental study. International Journal of Impact Engineering 1996, 18, 99–116. [Google Scholar] [CrossRef]
- Børvik, T.; Olovsson, L.; Hanssen, A.; Dharmasena, K.; Hansson, H.; Wadley, H. A discrete particle approach to simulate the combined effect of blast and sand impact loading of steel plates. Journal of the Mechanics and Physics of Solids 2011, 59, 940–958. [Google Scholar] [CrossRef]
- Chung Kim Yuen, S.; Nurick, G. Experimental and numerical studies on the response of quadrangular stiffened plates. Part I: subjected to uniform blast load. International Journal of Impact Engineering 2005, 31, 55–83. [Google Scholar] [CrossRef]
- Goel, M.D.; Matsagar, V.A.; Gupta, A.K. Blast resistance of stiffened sandwich panels with aluminum cenosphere syntactic foam. International Journal of Impact Engineering 2015, 77, 134–146. [Google Scholar] [CrossRef]
- Chung Kim Yuen, S.; Langdon, G.; Nurick, G.; Pickering, E.; Balden, V. Response of V-shape plates to localised blast load: Experiments and numerical simulation. International Journal of Impact Engineering 2012, 46, 97–109. [Google Scholar] [CrossRef]
- Cong, M.; bo Zhou, Y.; Zhang, M.; wang Sun, X.; Chen, C.; Ji, C. Design and optimization of multi-V hulls of light armoured vehicles under blast loads. Thin-Walled Structures 2021, 168, 108311. [Google Scholar] [CrossRef]
- Jones, R. Mechanics Of Composite Materials; 500 Tips, Taylor & Francis, 1998.
- Dharmasena, K.P.; Wadley, H.N.; Xue, Z.; Hutchinson, J.W. Mechanical response of metallic honeycomb sandwich panel structures to high-intensity dynamic loading. International Journal of Impact Engineering 2008, 35, 1063–1074. [Google Scholar] [CrossRef]
- Zhu, F.; Zhao, L.; Lu, G.; Wang, Z. Deformation and failure of blast-loaded metallic sandwich panels—Experimental investigations. International Journal of Impact Engineering 2008, 35, 937–951. [Google Scholar] [CrossRef]
- Zhang, P.; Liu, J.; Cheng, Y.; Hou, H.; Wang, C.; Li, Y. Dynamic response of metallic trapezoidal corrugated-core sandwich panels subjected to air blast loading – An experimental study. Materials & Design (1980-2015) 2015, 65, 221–230. [Google Scholar] [CrossRef]
- Shen, J.; Lu, G.; Wang, Z.; Zhao, L. Experiments on curved sandwich panels under blast loading. International Journal of Impact Engineering 2010, 37, 960–970. [Google Scholar] [CrossRef]
- Jing, L.; Wang, Z.; Shim, V.; Zhao, L. An experimental study of the dynamic response of cylindrical sandwich shells with metallic foam cores subjected to blast loading. International Journal of Impact Engineering 2014, 71, 60–72. [Google Scholar] [CrossRef]
- Pratomo, A.N.; Santosa, S.P.; Gunawan, L.; Widagdo, D.; Putra, I.S. Numerical study and experimental validation of blastworthy structure using aluminum foam sandwich subjected to fragmented 8 kg TNT blast loading. International Journal of Impact Engineering 2020, 146, 103699. [Google Scholar] [CrossRef]
- Hanssen, A.; Enstock, L.; Langseth, M. Close-range blast loading of aluminium foam panels. International Journal of Impact Engineering 2002, 27, 593–618. [Google Scholar] [CrossRef]
- Liu, H.; Cao, Z.; Yao, G.; Luo, H.; Zu, G. Performance of aluminum foam–steel panel sandwich composites subjected to blast loading. Materials & Design 2013, 47, 483–488. [Google Scholar] [CrossRef]
- Lakes, R.; Elms, K. Indentability of Conventional and Negative Poisson’s Ratio Foams. Journal of Composite Materials 1993, 27, 1193–1202. [Google Scholar] [CrossRef]
- Alderson, K.L.; Fitzgerald, A.; Evans, K.E. The strain dependent indentation resilience of auxetic microporous polyethylene. Journal of Materials Science 2000, 35, 4039–4047. [Google Scholar] [CrossRef]
- Lakes, R.S. Design Considerations for Materials with Negative Poisson’s Ratios. Journal of Mechanical Design 1993, 115, 696–700. [Google Scholar] [CrossRef]
- Scarpa, F.; Tomlin, P.J. On the transverse shear modulus of negative Poisson’s ratio honeycomb structures. Fatigue & Fracture of Engineering Materials & Structures 2000, 23, 717–720. [Google Scholar] [CrossRef]
- Lakes, R. Foam Structures with a Negative Poisson’s Ratio. Science 1987, 235, 1038–1040. [Google Scholar] [CrossRef] [PubMed]
- Choi, J.B.; Lakes, R.S. Fracture toughness of re-entrant foam materials with a negative Poisson’s ratio: experiment and analysis. International Journal of Fracture 1996, 80, 73–83. [Google Scholar] [CrossRef]
- Bianchi, M.; Scarpa, F.L.; Smith, C.W. Stiffness and energy dissipation in polyurethane auxetic foams. Journal of Materials Science 2008, 43, 5851–5860. [Google Scholar] [CrossRef]
- Howell, B.; Prendergast, P.; Hansen, L. Examination of acoustic behavior of negative poisson’s ratio materials. Applied Acoustics 1994, 43, 141–148. [Google Scholar] [CrossRef]
- Saxena, K.K.; Das, R.; Calius, E.P. Three Decades of Auxetics Research − Materials with Negative Poisson’s Ratio: A Review. Advanced Engineering Materials 2016, 18, 1847–1870. [Google Scholar] [CrossRef]
- Imbalzano, G.; Linforth, S.; Ngo, T.D.; Lee, P.V.S.; Tran, P. Blast resistance of auxetic and honeycomb sandwich panels: Comparisons and parametric designs. Composite Structures 2018, 183, 242–261. [Google Scholar] [CrossRef]
- Yan, Z.; Liu, Y.; Yan, J.; Wang, B.; Bai, F.; Shi, Z.; Huang, F. Anti-blast performance of 3D-printed sandwich panels with auxetic hexagonal and regular hexagonal honeycomb cores. Engineering Structures 2022, 272, 114996. [Google Scholar] [CrossRef]
- Lan, X.; Feng, S.; Huang, Q.; Zhou, T. A comparative study of blast resistance of cylindrical sandwich panels with aluminum foam and auxetic honeycomb cores. Aerospace Science and Technology 2019, 87, 37–47. [Google Scholar] [CrossRef]
- Qi, C.; Remennikov, A.; Pei, L.Z.; Yang, S.; Yu, Z.H.; Ngo, T.D. Impact and close-in blast response of auxetic honeycomb-cored sandwich panels: Experimental tests and numerical simulations. Composite Structures 2017, 180, 161–178. [Google Scholar] [CrossRef]
- Chen, G.; Cheng, Y.; Zhang, P.; Cai, S.; Liu, J. Blast resistance of metallic double arrowhead honeycomb sandwich panels with different core configurations under the paper tube-guided air blast loading. International Journal of Mechanical Sciences 2021, 201, 106457. [Google Scholar] [CrossRef]
- Chen, G.; Zhang, P.; Deng, N.; Cai, S.; Cheng, Y.; Liu, J. Paper tube-guided blast response of sandwich panels with auxetic re-entrant and regular hexagonal honeycomb cores – An experimental study. Engineering Structures 2022, 253, 113790. [Google Scholar] [CrossRef]
- Yan, Z.; Liu, Y.; Yan, J.; Wu, W.; Bai, F.; Huang, F. Blast performance of 3D-printed auxetic honeycomb sandwich beams. Thin-Walled Structures 2023, 193, 111257. [Google Scholar] [CrossRef]
- Qi, C.; Yang, S.; Yang, L.J.; Han, S.H.; Lu, Z.H. Dynamic response and optimal design of curved metallic sandwich panels under blast loading. Scientific World Journal 2014, 2014, 853681. [Google Scholar] [CrossRef] [PubMed]
- Wang, E.; Li, Q.; Sun, G. Computational analysis and optimization of sandwich panels with homogeneous and graded foam cores for blast resistance. Thin-Walled Structures 2020, 147, 106494. [Google Scholar] [CrossRef]
- Qi, C.; Pei, L.Z.; Remennikov, A.; Yang, S.; Liu, J.; Wang, J.S.; Liao, X.W. Parametric study and optimization of the protect system containing a re-entrant hexagon cored sandwich panel under blast impact. Composite Structures 2020, 252, 112711. [Google Scholar] [CrossRef]
- Jiang, F.; Yang, S.; Qi, C.; Liu, H.T.; Remennikov, A.; Pei, L.Z. Blast response and multi-objective optimization of graded re-entrant circular auxetic cored sandwich panels. Composite Structures 2023, 305, 116494. [Google Scholar] [CrossRef]
- Wang, Y.; Zhao, W.; Zhou, G.; Wang, C. Analysis and parametric optimization of a novel sandwich panel with double-V auxetic structure core under air blast loading. International Journal of Mechanical Sciences 2018, 142-143, 245–254. [Google Scholar] [CrossRef]
- Lan, X.; Huang, Q.; Zhou, T.; shan Feng, S. Optimal design of a novel cylindrical sandwich panel with double arrow auxetic core under air blast loading. Defence Technology 2020, 16, 617–626. [Google Scholar] [CrossRef]
- Walkowiak, M.; Reinicke, U.; Anders, D. Numerical Investigation of Different Core Topologies in Sandwich-Structured Composites Subjected to Air-Blast Impact. Applied Sciences 2022, 12. [Google Scholar] [CrossRef]
- Pratomo, A.N.; Santosa, S.P.; Gunawan, L.; Widagdo, D.; Putra, I.S. Design optimization and structural integrity simulation of aluminum foam sandwich construction for armored vehicle protection. Composite Structures 2021, 276, 114461. [Google Scholar] [CrossRef]
- Lundberg, S.; Lee, S.I. A Unified Approach to Interpreting Model Predictions, 2017, [arXiv:cs.AI/1705.07874].
- Shapley, L.S., 17. A Value for n-Person Games. In Contributions to the Theory of Games (AM-28), Volume II; Kuhn, H.W.; Tucker, A.W., Eds.; Princeton University Press: Princeton, 1953; pp. 307–318. [CrossRef]
- Palar, P.S.; Dwianto, Y.B.; Zuhal, L.R.; Morlier, J.; Shimoyama, K.; Obayashi, S. Multi-objective design space exploration using explainable surrogate models. Structural and Multidisciplinary Optimization 2024, 67, 38. [Google Scholar] [CrossRef]
- Bhoskar, M.T.; Kulkarni, M.O.K.; Kulkarni, M.N.K.; Patekar, M.S.L.; Kakandikar, G.; Nandedkar, V. Genetic Algorithm and its Applications to Mechanical Engineering: A Review. Materials Today: Proceedings 2015, 2, 2624–2630. [Google Scholar] [CrossRef]
- Deb, K.; Agrawal, S.; Pratap, A.; Meyarivan, T. A fast and elitist multiobjective genetic algorithm: NSGA-II. IEEE Trans. Evol. Comput. 2002, 6, 182–197. [Google Scholar] [CrossRef]
- Lee, S.; Barthelat, F.; Hutchinson, J.; Espinosa, H. Dynamic failure of metallic pyramidal truss core materials – Experiments and modeling. International Journal of Plasticity 2006, 22, 2118–2145. [Google Scholar] [CrossRef]
- Zhang, W.; Wang, X.; Hu, Y.; Wang, S. Predictive modelling of microstructure changes, micro-hardness and residual stress in machining of 304 austenitic stainless steel. International Journal of Machine Tools and Manufacture 2018, 130-131, 36–48. [Google Scholar] [CrossRef]
- Cockcroft, M.; Lathan, D. Ductility and the Workability of Metals; Academic Press, 1968. [Google Scholar]
- Kingery, C.; Bulmash, G.; Laboratory, U.A.B.R. Airblast Parameters from TNT Spherical Air Burst and Hemispherical Surface Burst; Technical report ARBRL, US Army Armament and Development Center, Ballistic Research Laboratory, 1984.
- Gingold, R.A.; Monaghan, J.J. Smoothed particle hydrodynamics: theory and application to non-spherical stars. Monthly Notices of the Royal Astronomical Society 1977, 181, 375–389. [Google Scholar] [CrossRef]
- Lucy, L.B. Numerical approach to the testing of the fission hypothesis. Astron. J.; (United States) 1977, 82, 1013–1024. [Google Scholar] [CrossRef]
- Dobratz, B.; Crawford, P.; Laboratory, L.L.N. LLNL Explosives Handbook: Properties of Chemical Explosi and Explosive Stimulants; UCRL-52997, Univ. California, 1985.
- U. S. DoD. Design And analysis of hardened structures to conventional weapons effects, 2002.
- Hu, L.; Zhou, M.; Deng, H. Dynamic crushing response of auxetic honeycombs under large deformation: Theoretical analysis and numerical simulation. Thin-Walled Structures 2018, 131, 373–384. [Google Scholar] [CrossRef]
- Wei, L.; Zhao, X.; Yu, Q.; Zhang, W.; Zhu, G. In-plane compression behaviors of the auxetic star honeycomb: Experimental and numerical simulation. Aerospace Science and Technology 2021, 115, 106797. [Google Scholar] [CrossRef]
- NATO. STANAG 4569 (Edition 2) - Protection levels for occupants of armoured vehicles, 2012.
- Jacob, N.; Nurick, G.; Langdon, G. The effect of stand-off distance on the failure of fully clamped circular mild steel plates subjected to blast loads. Engineering Structures 2007, 29, 2723–2736. [Google Scholar] [CrossRef]
Figure 1.
(a) Schematic diagram of ASP which consists of two face sheets and auxetic core. (b) The overall dimensions of ASP. (c) Enlarged diagram of ASP.
Figure 1.
(a) Schematic diagram of ASP which consists of two face sheets and auxetic core. (b) The overall dimensions of ASP. (c) Enlarged diagram of ASP.
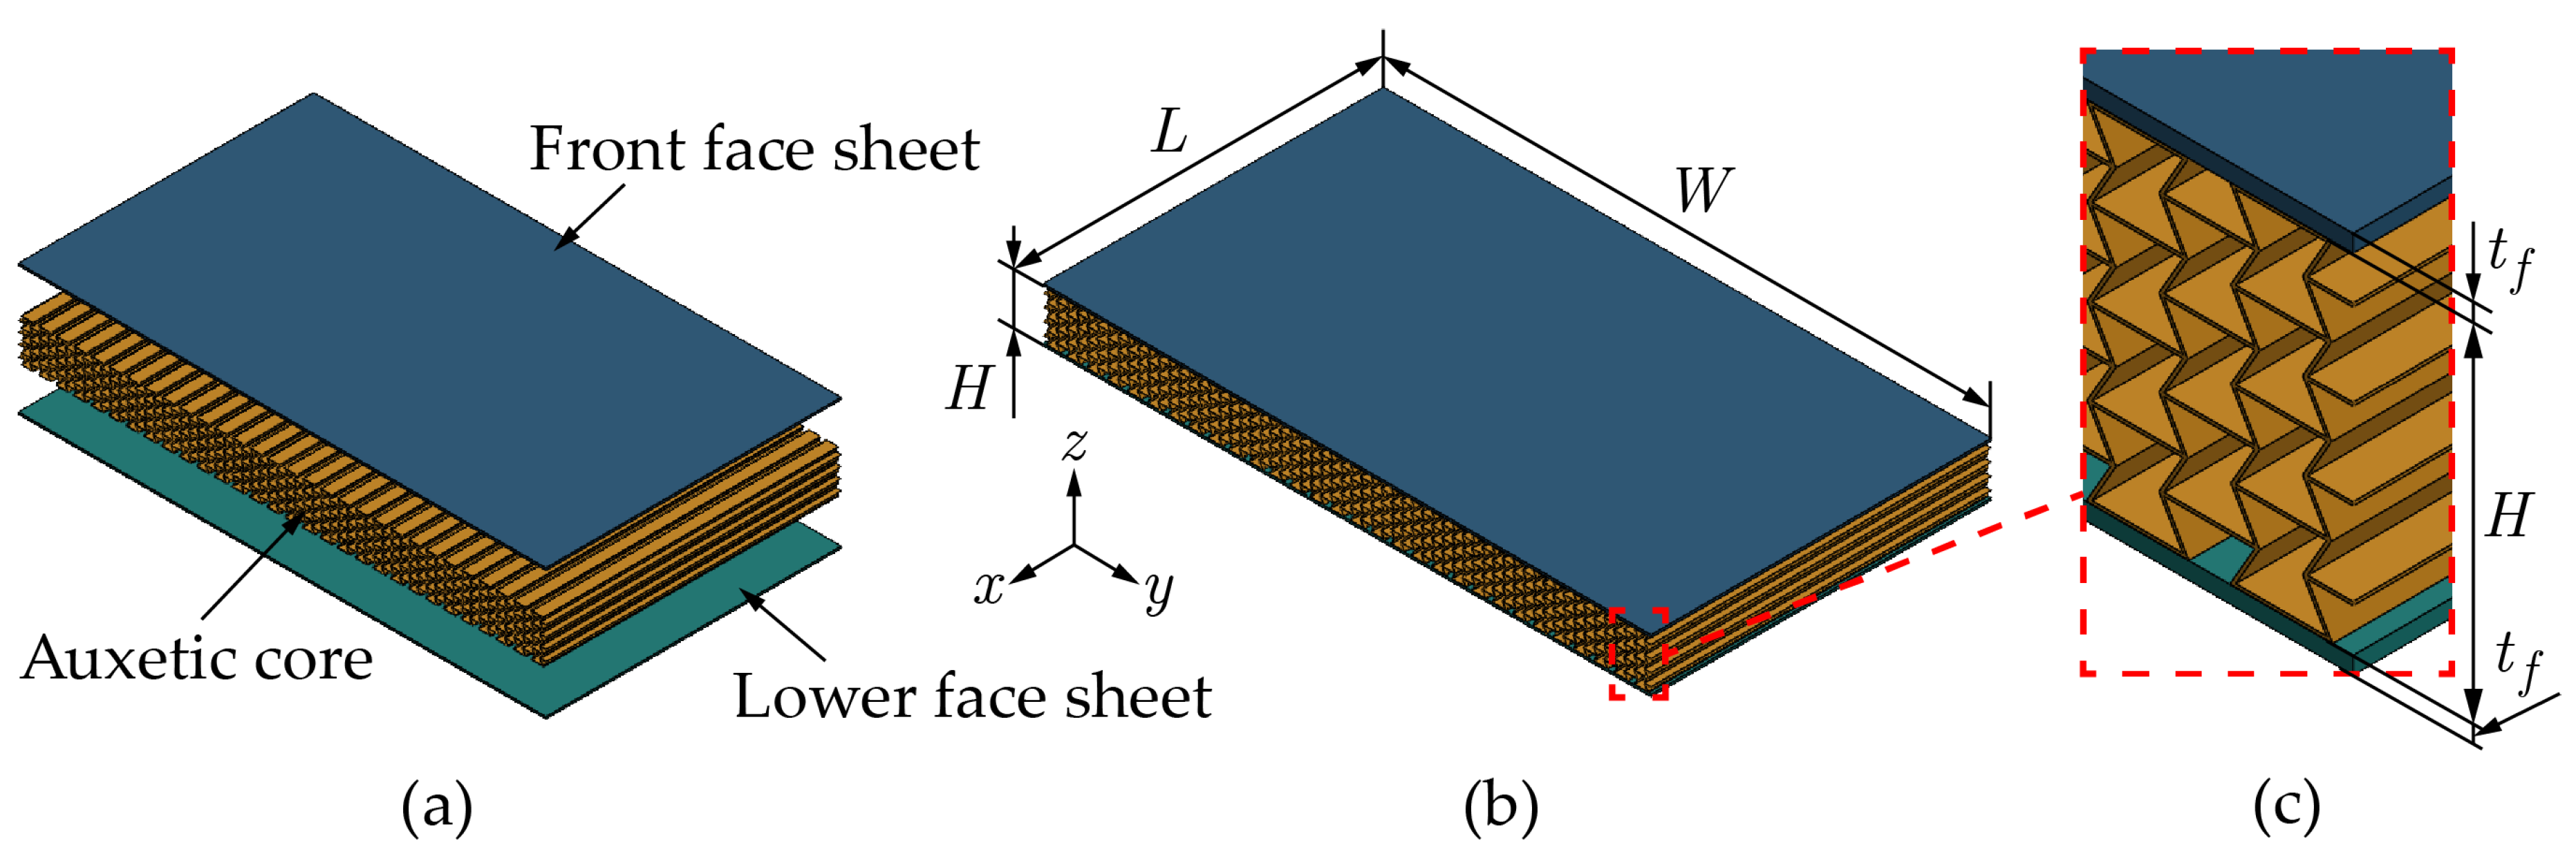
Figure 2.
Geometric parameters of: (a) REH, (b) DAH, (c) SH, and (d) CH.
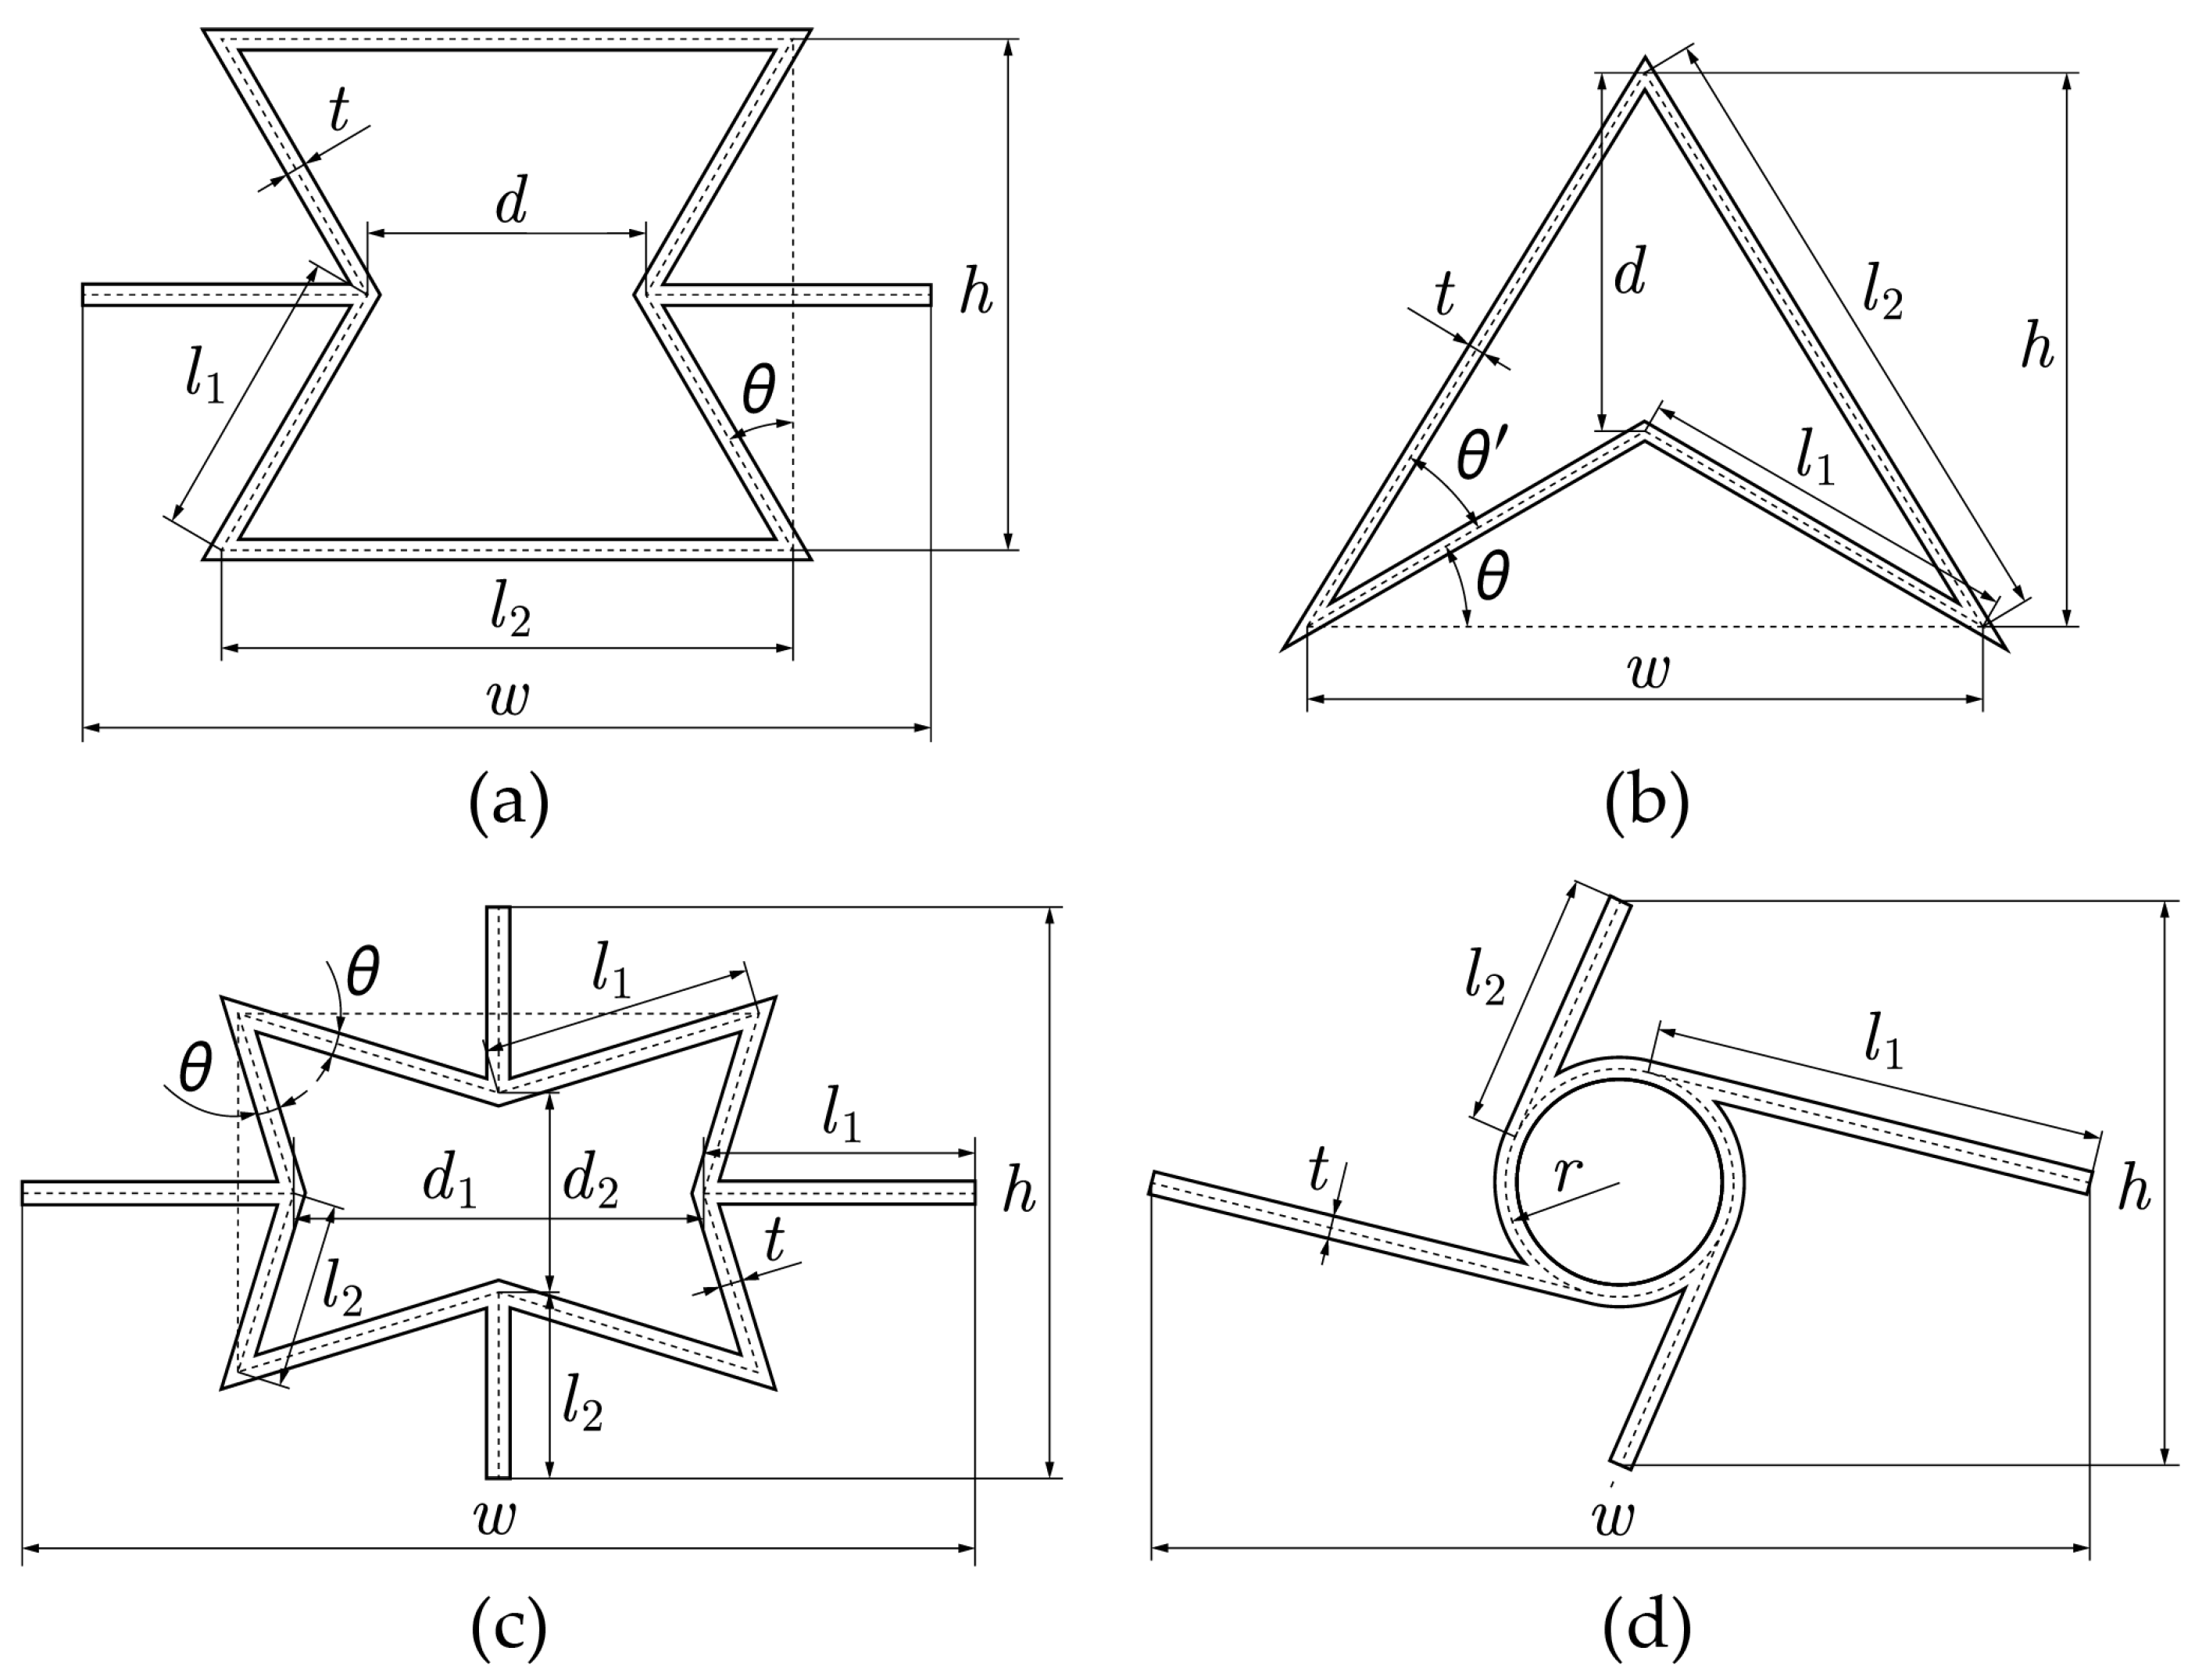
Figure 3.
The FE model of quarter-symmetric model of ASP undergoing air blast loading.
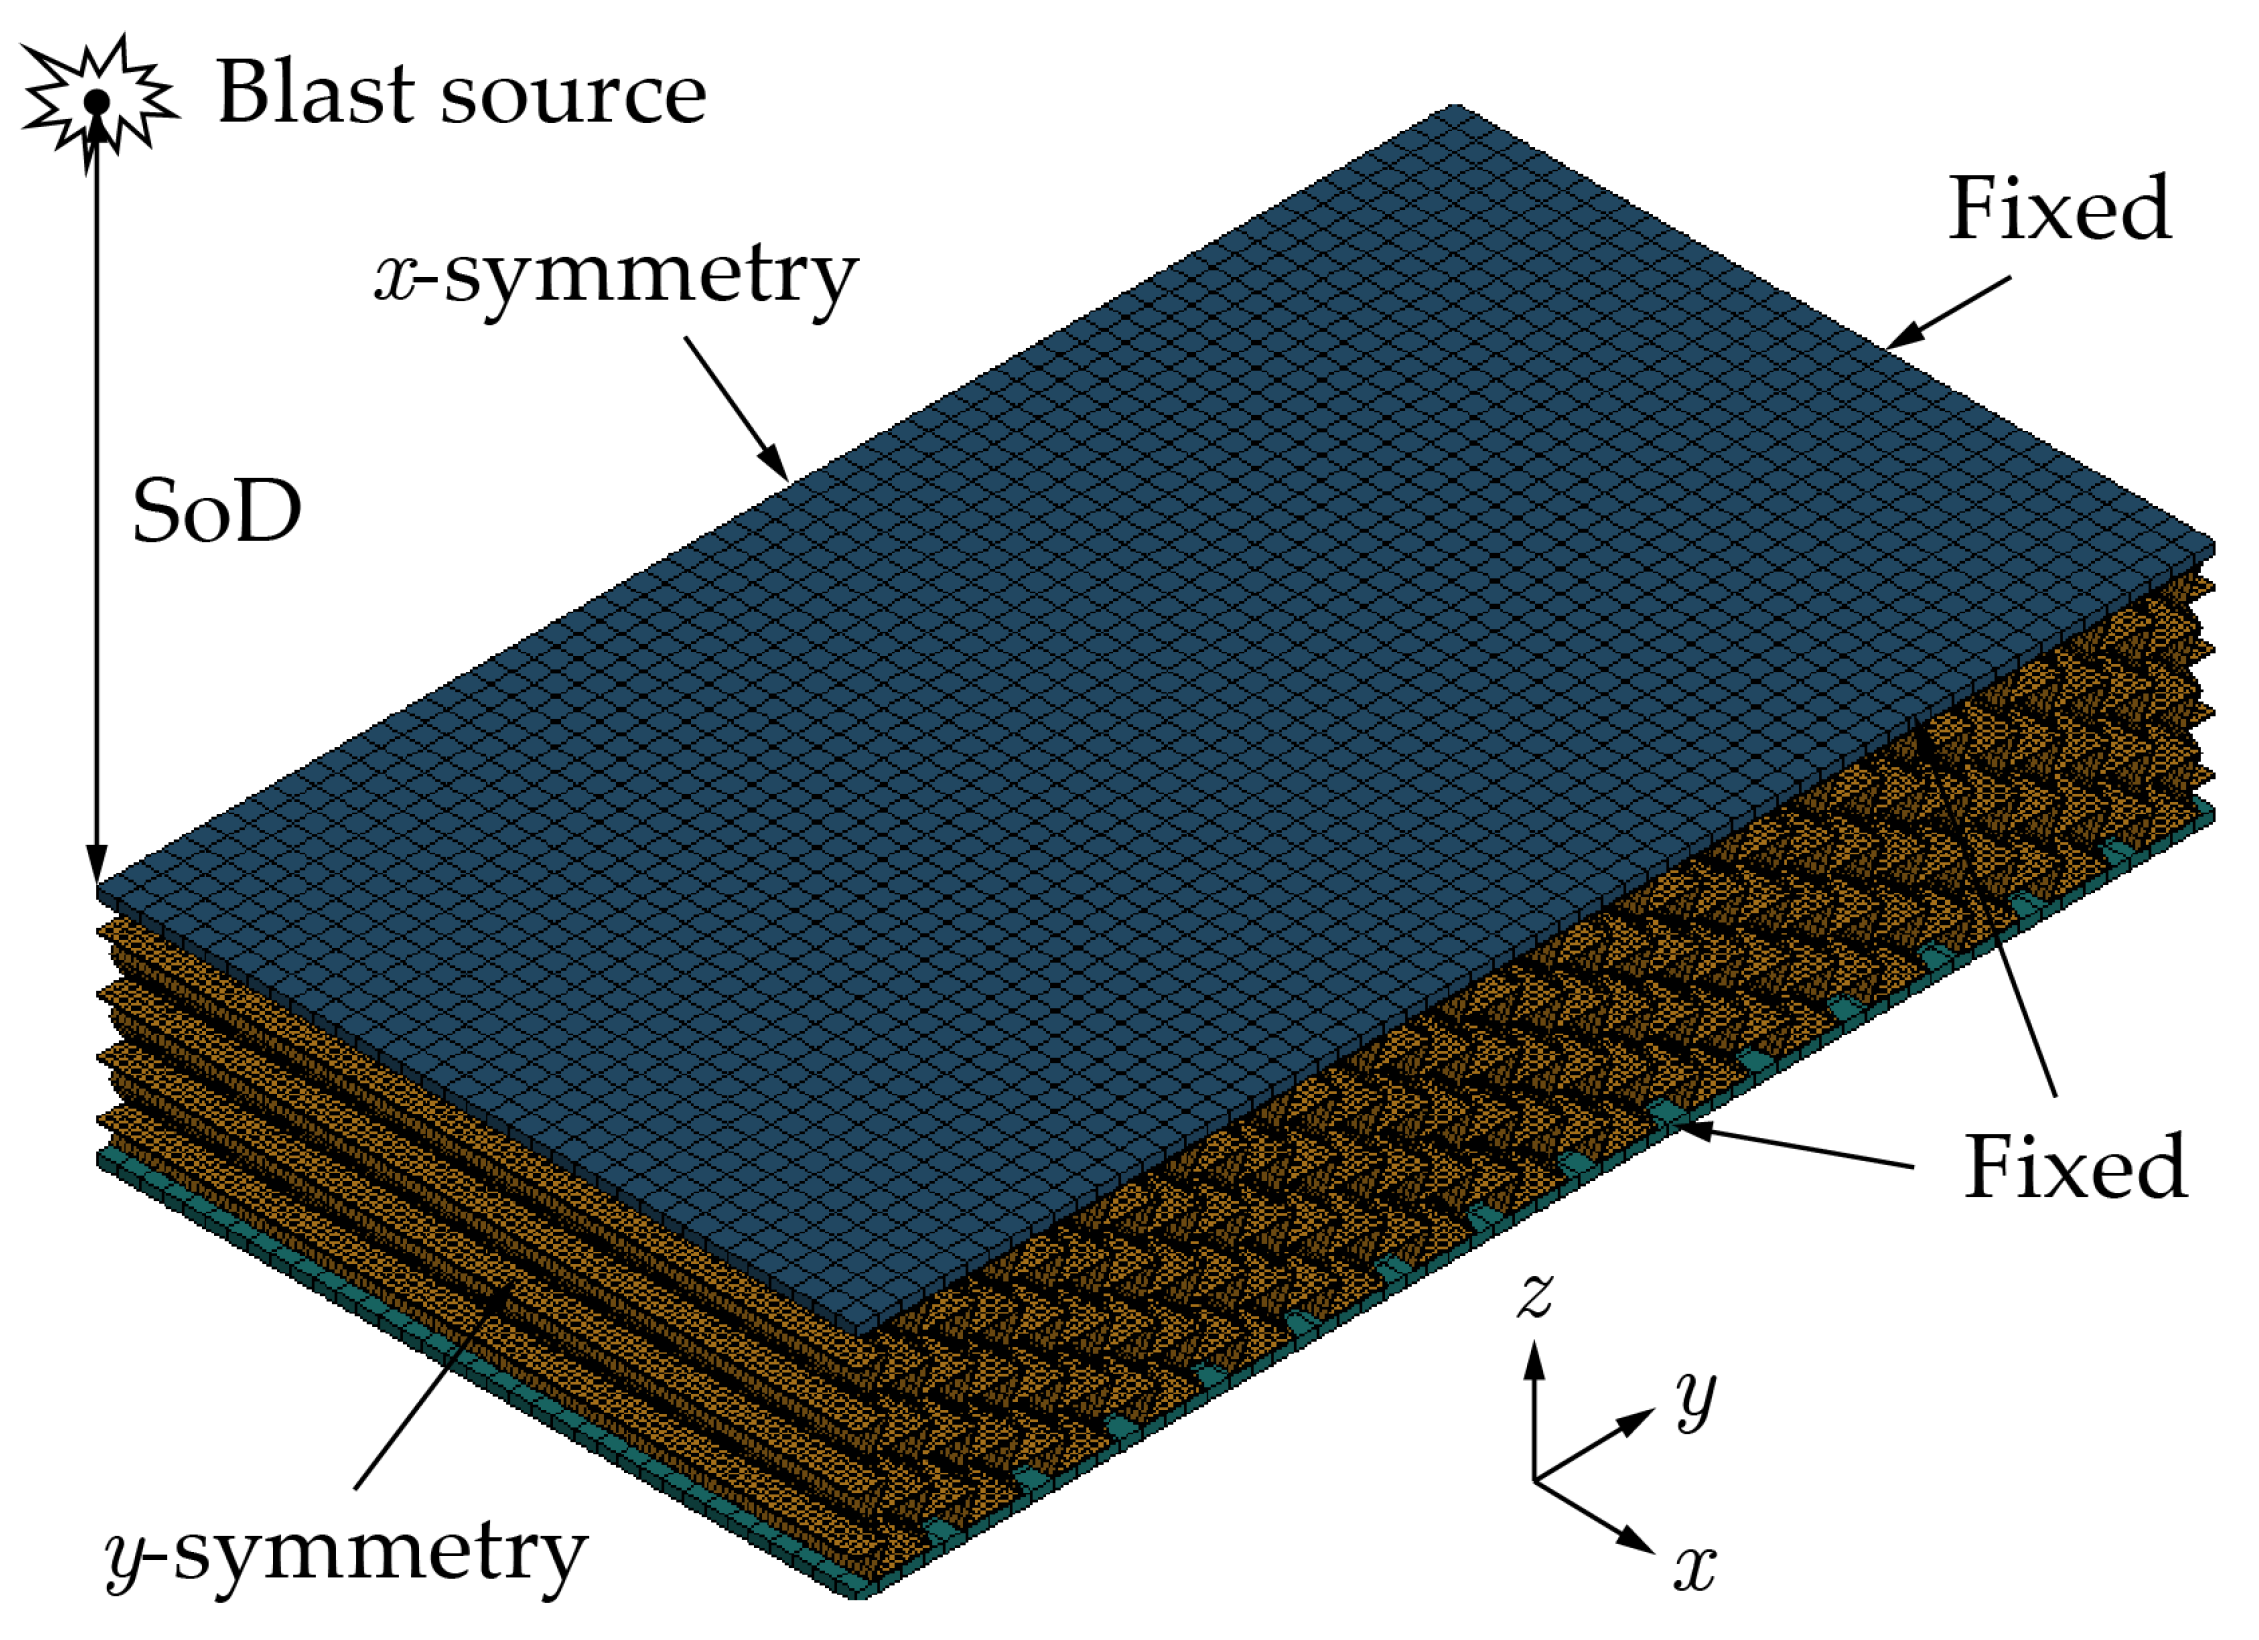
Figure 4.
The curve fitting of modified J-C parameters of 304 stainless steel with the experiment [14].
Figure 4.
The curve fitting of modified J-C parameters of 304 stainless steel with the experiment [14].
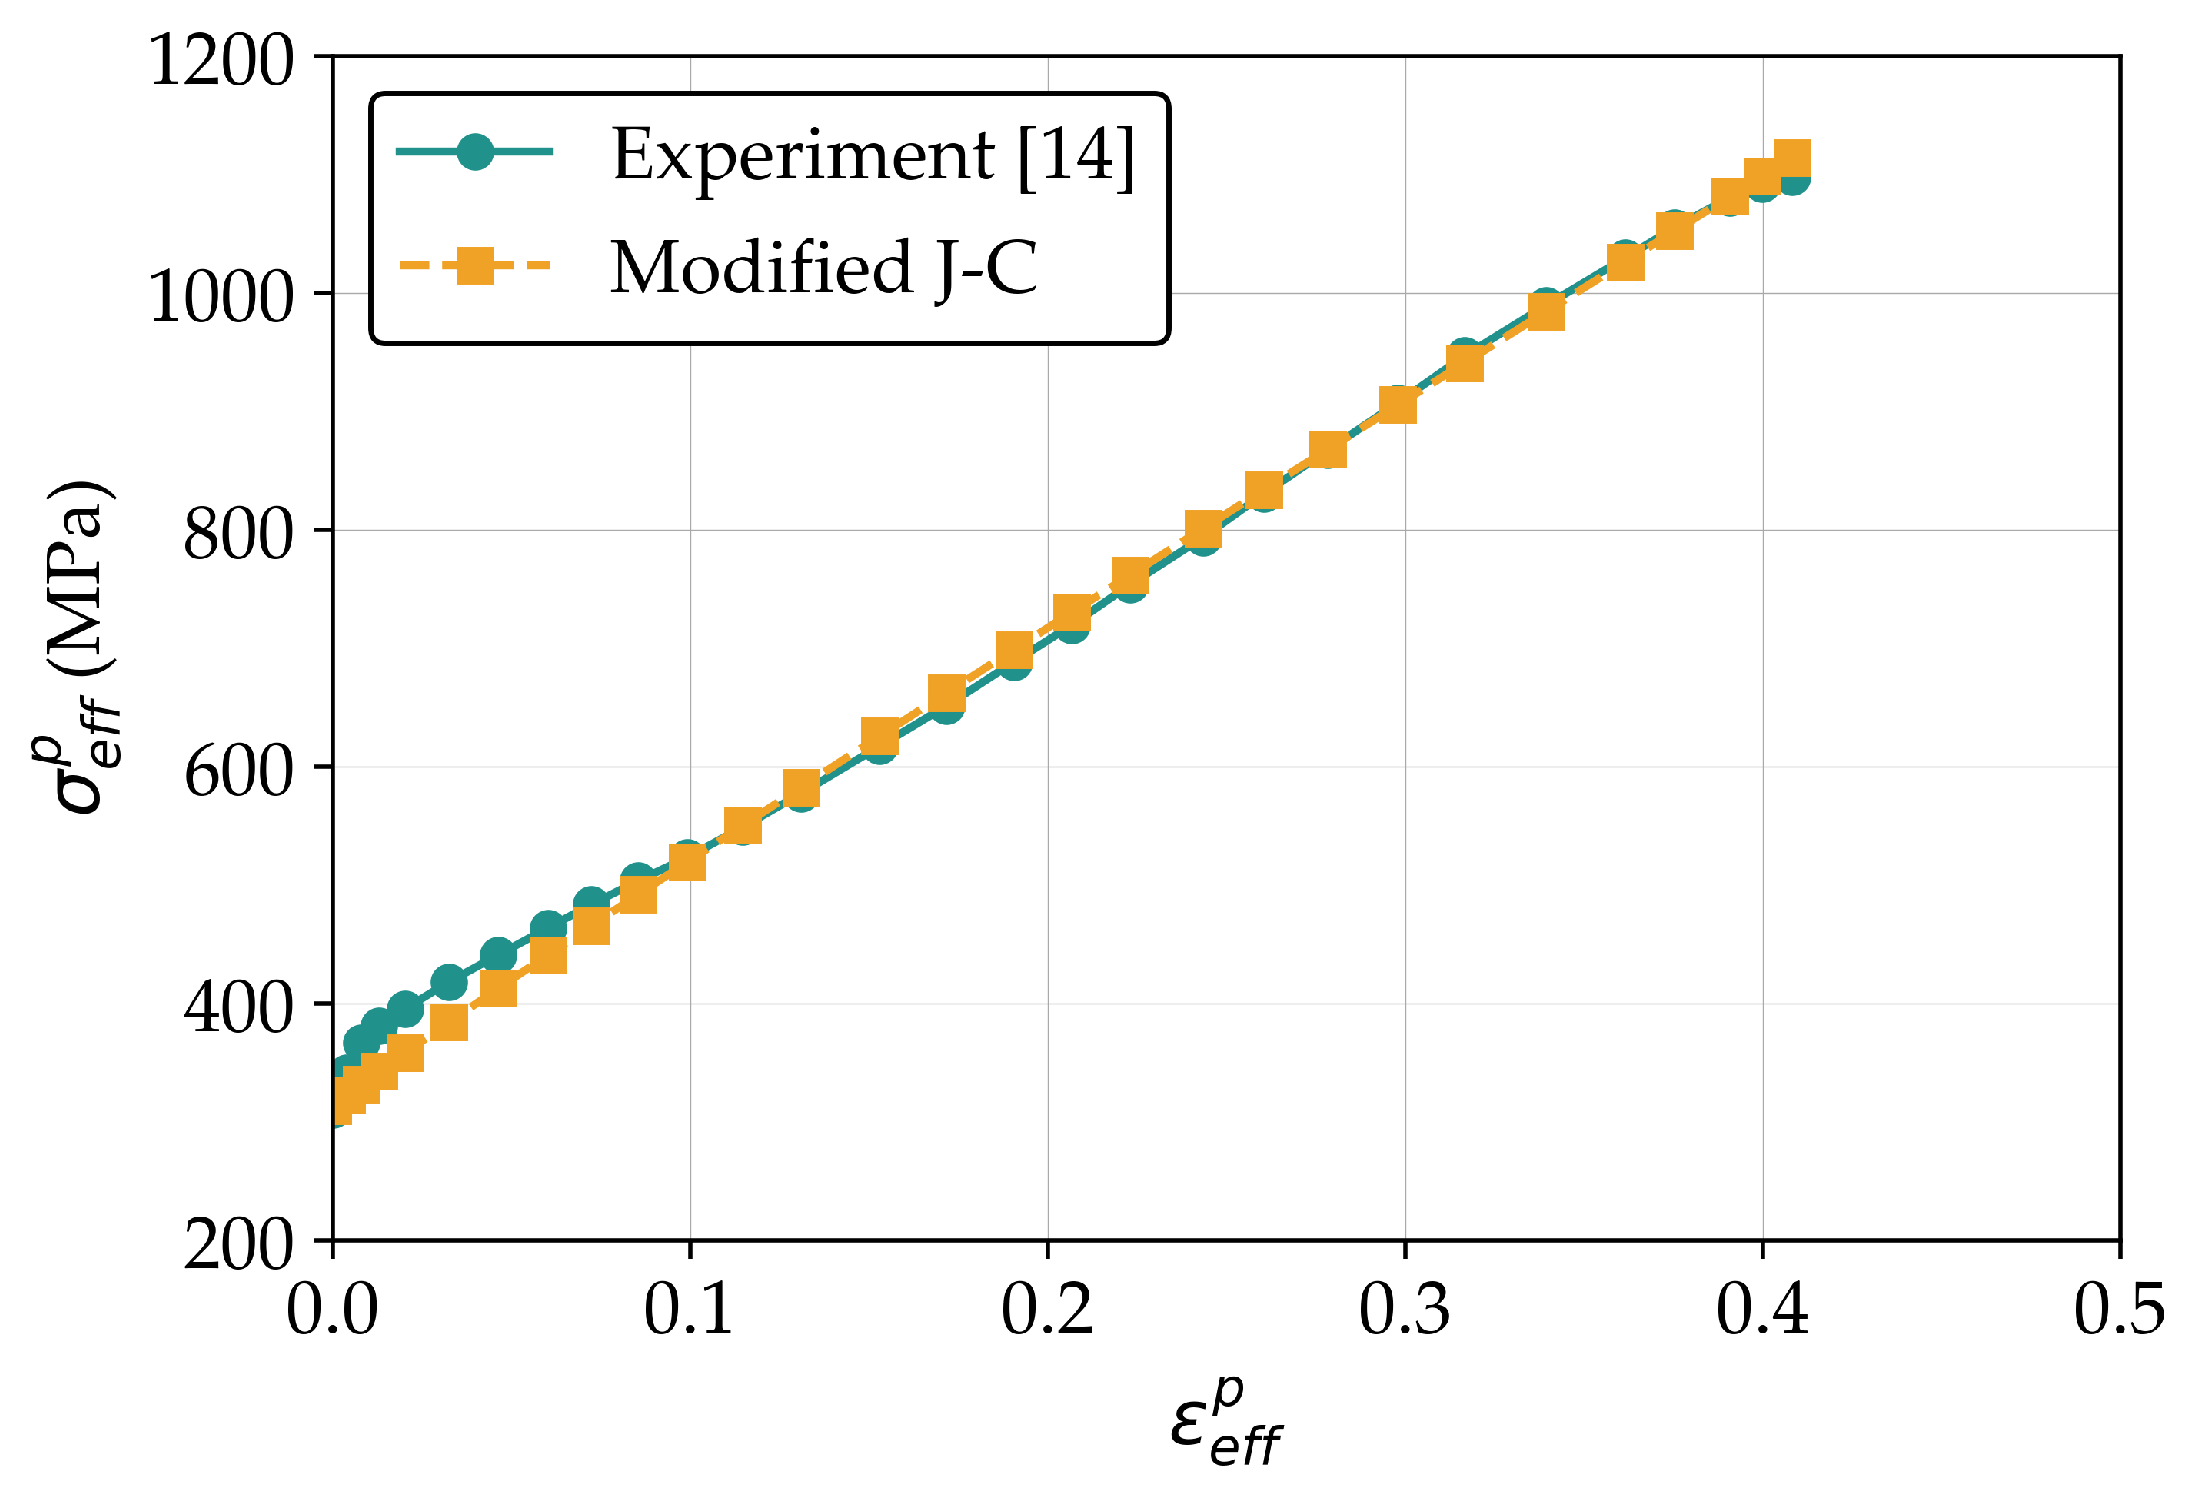
Figure 5.
The FE model of three types of air blast model: (a) CONWEP, (b) SPH, (c) MMALE.
Figure 6.
The bar plot of for different air blast model compared with the experimental results [6].
Figure 6.
The bar plot of for different air blast model compared with the experimental results [6].
Figure 7.
(a) The experimental set-up of blast test. (b) The schematic diagram of trapezoidal corrugated-core sandwich panel [14].
Figure 7.
(a) The experimental set-up of blast test. (b) The schematic diagram of trapezoidal corrugated-core sandwich panel [14].
Figure 8.
The comparison of numerical and experimental results [14] for trapezoidal corrugated-core sandwich panels.
Figure 8.
The comparison of numerical and experimental results [14] for trapezoidal corrugated-core sandwich panels.
Figure 9.
The comparison of numerical simulation and experimental [14] deformation of specimen: (a) TZ-12, (b) TZ-2, and (c) TZ-13.
Figure 9.
The comparison of numerical simulation and experimental [14] deformation of specimen: (a) TZ-12, (b) TZ-2, and (c) TZ-13.
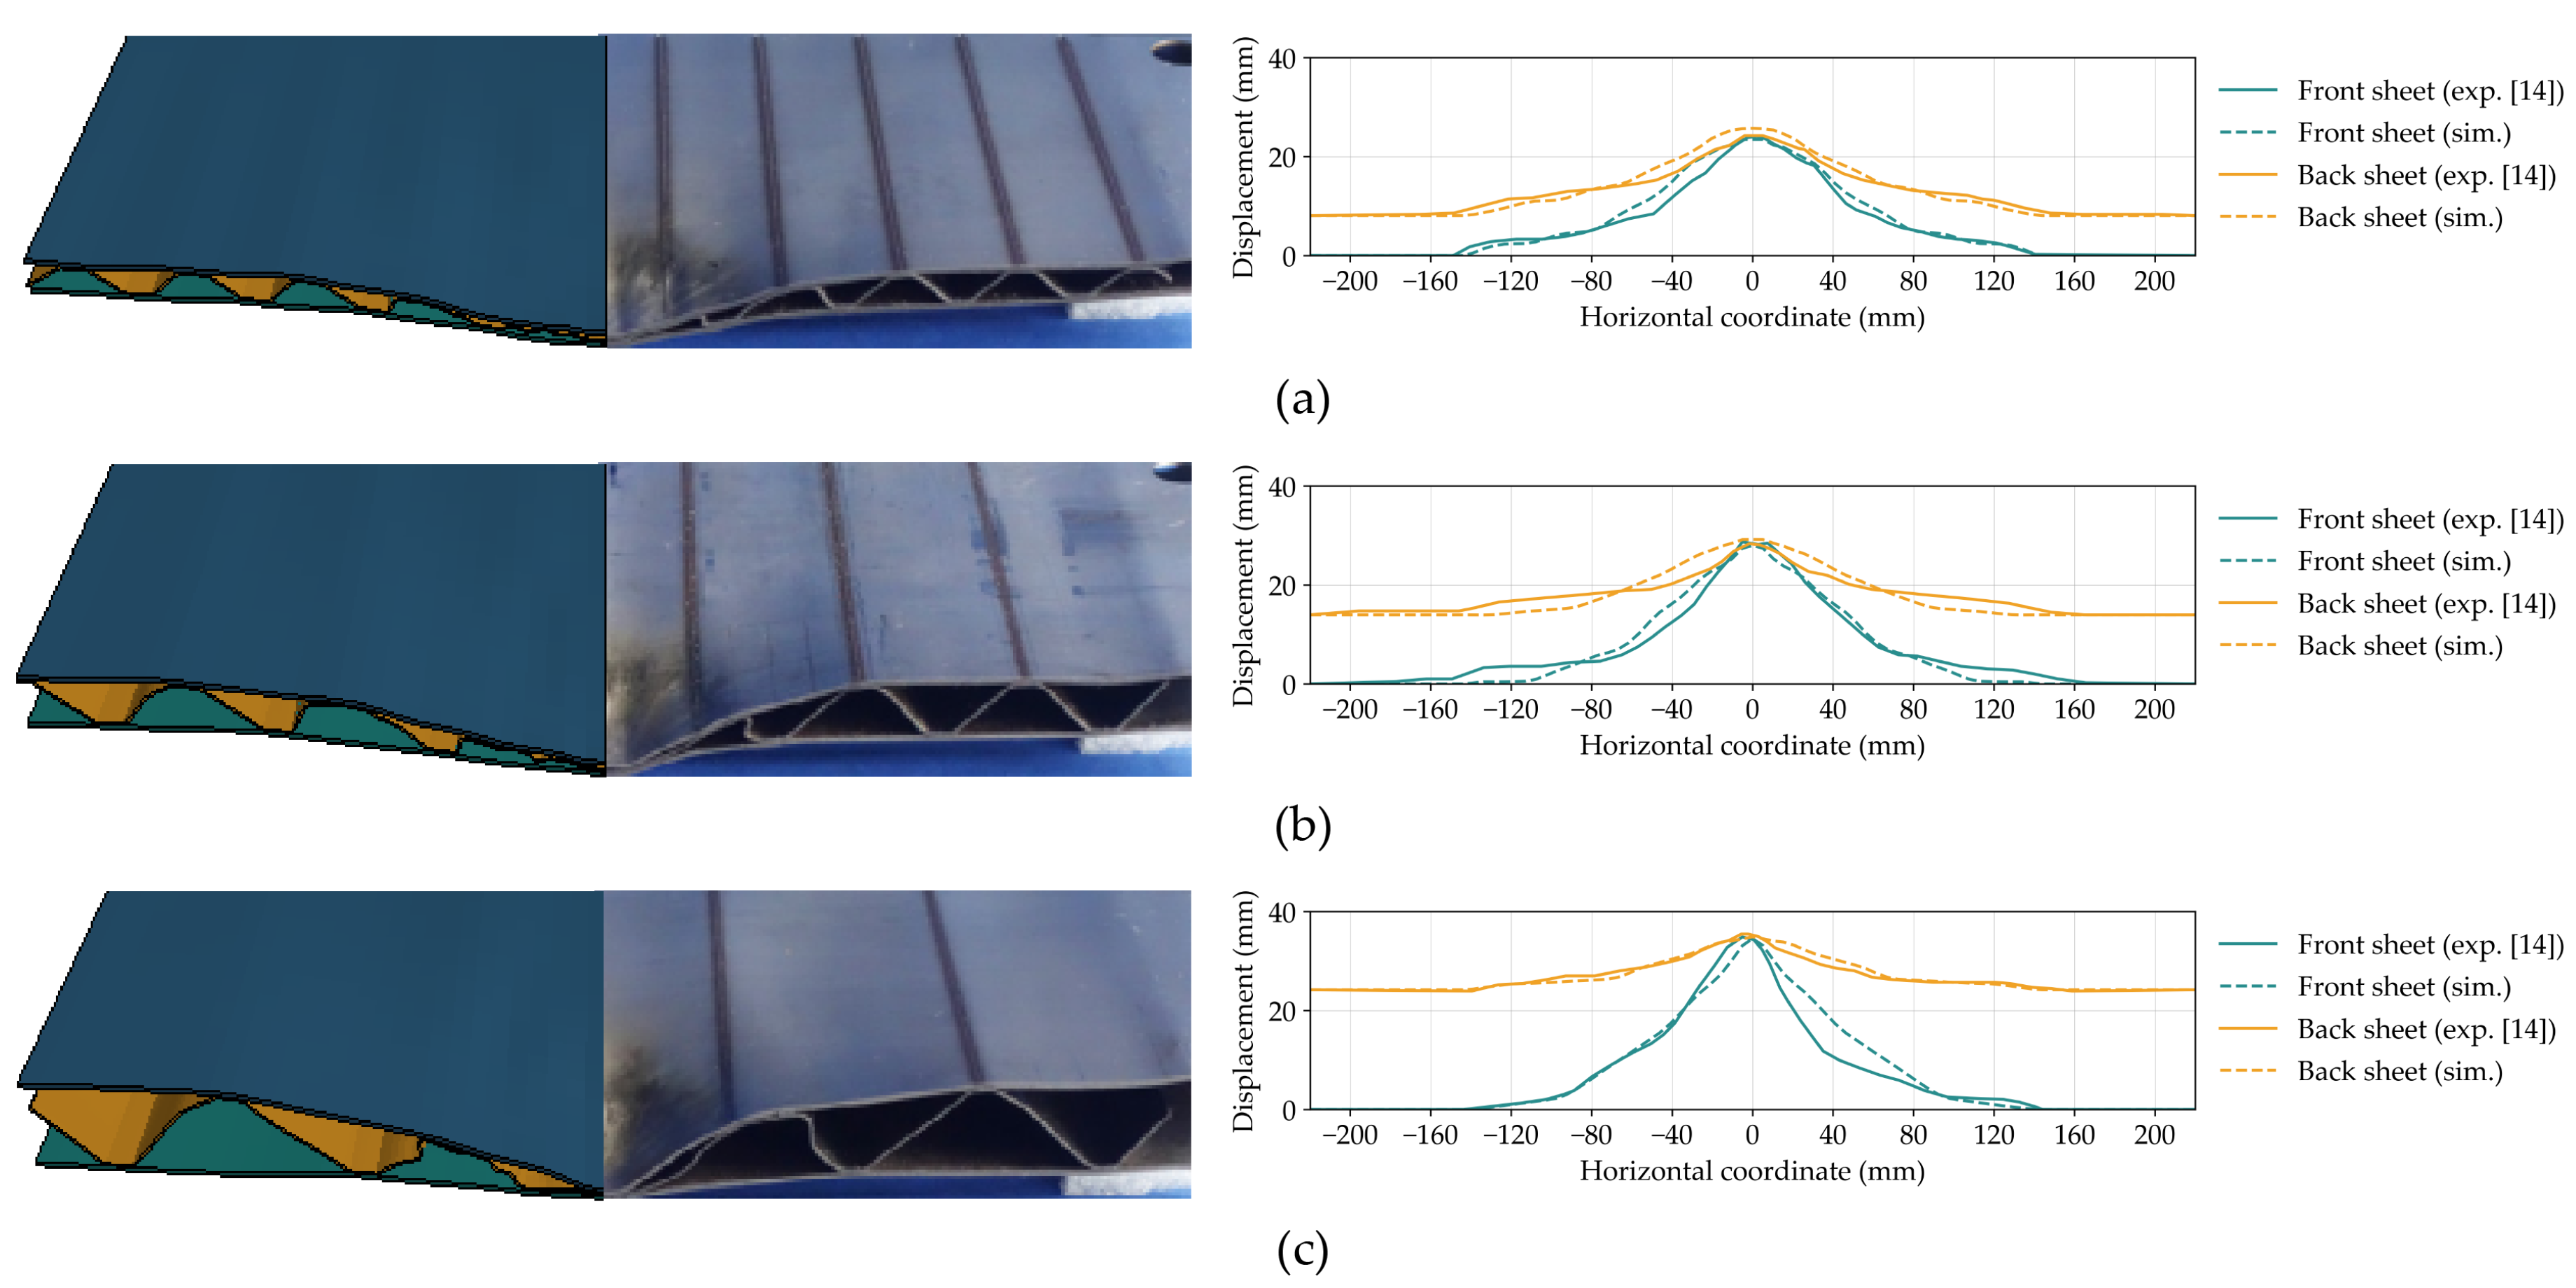
Figure 10.
Design space of: (a) REH, (b) DAH, (c) SH, and (d) CH for MOOP. The color represents the normalized .
Figure 10.
Design space of: (a) REH, (b) DAH, (c) SH, and (d) CH for MOOP. The color represents the normalized .
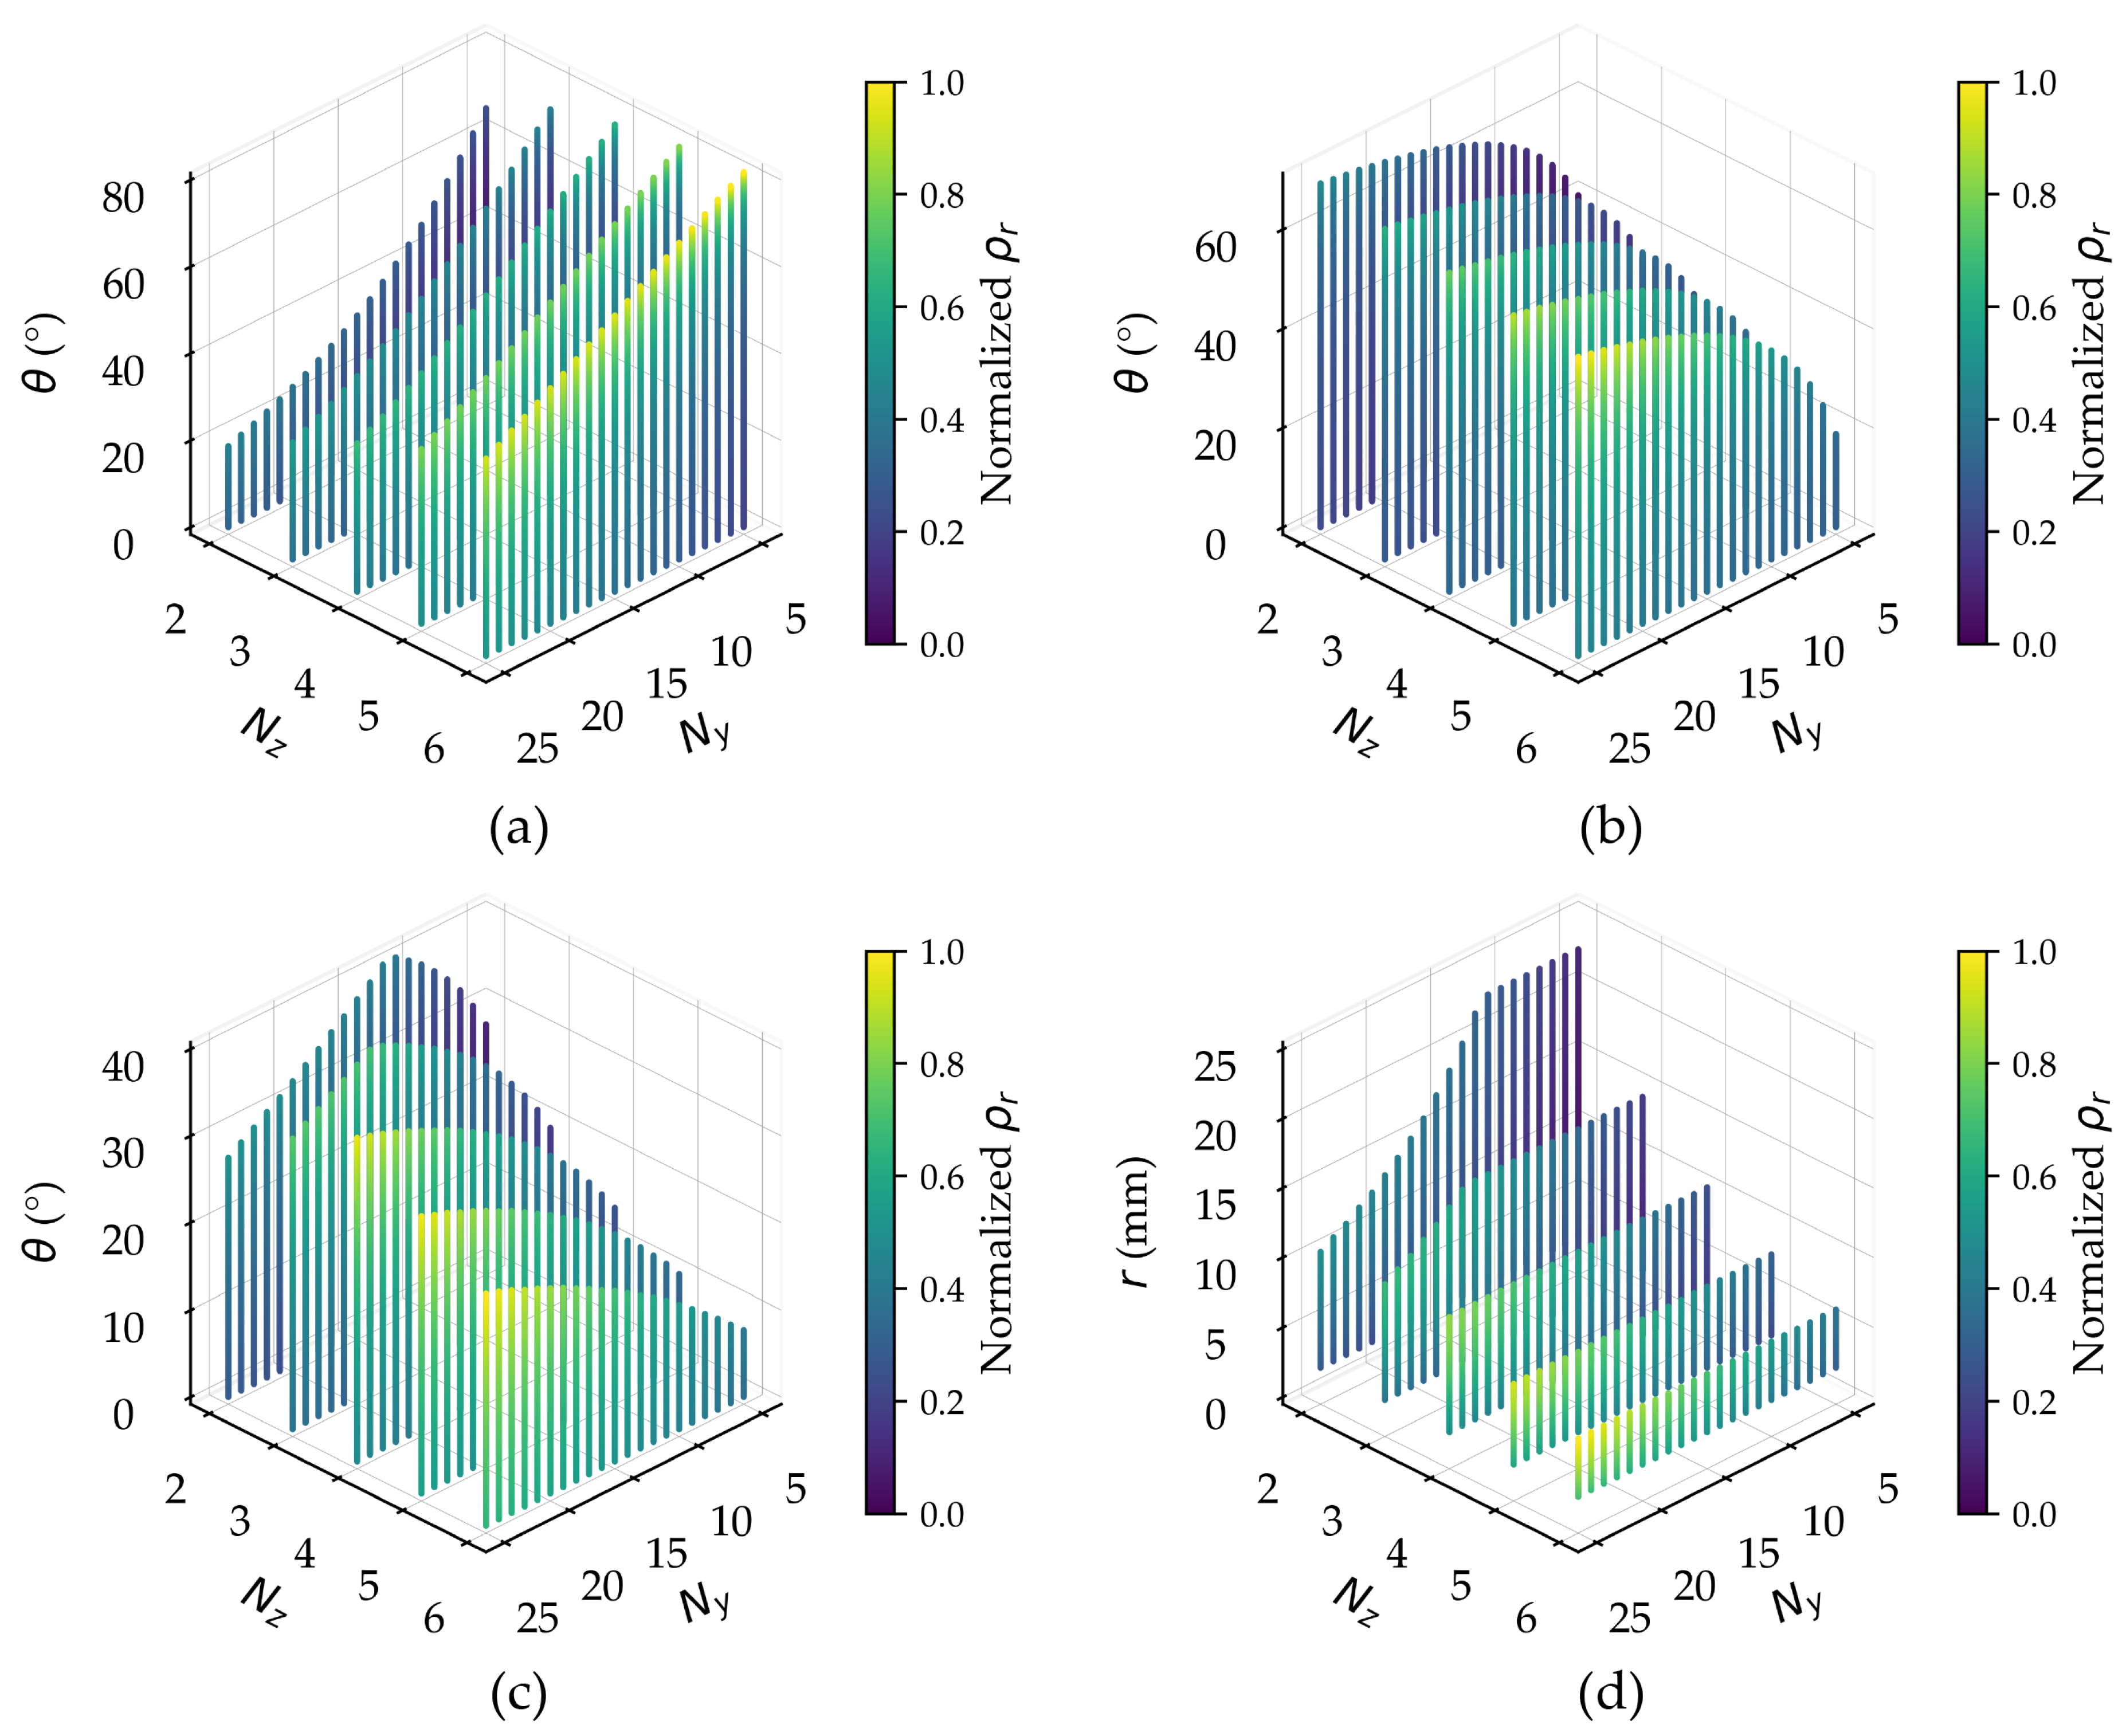
Figure 11.
Comparison of predicted (left) and SEA (right) by metamodel and simulation results of: (a) REH, (b) DAH, (c) SH, and (d) CH model.
Figure 11.
Comparison of predicted (left) and SEA (right) by metamodel and simulation results of: (a) REH, (b) DAH, (c) SH, and (d) CH model.

Figure 12.
The averaged SHAP bar plot of: (a) and (b) SEA for each auxetic model.
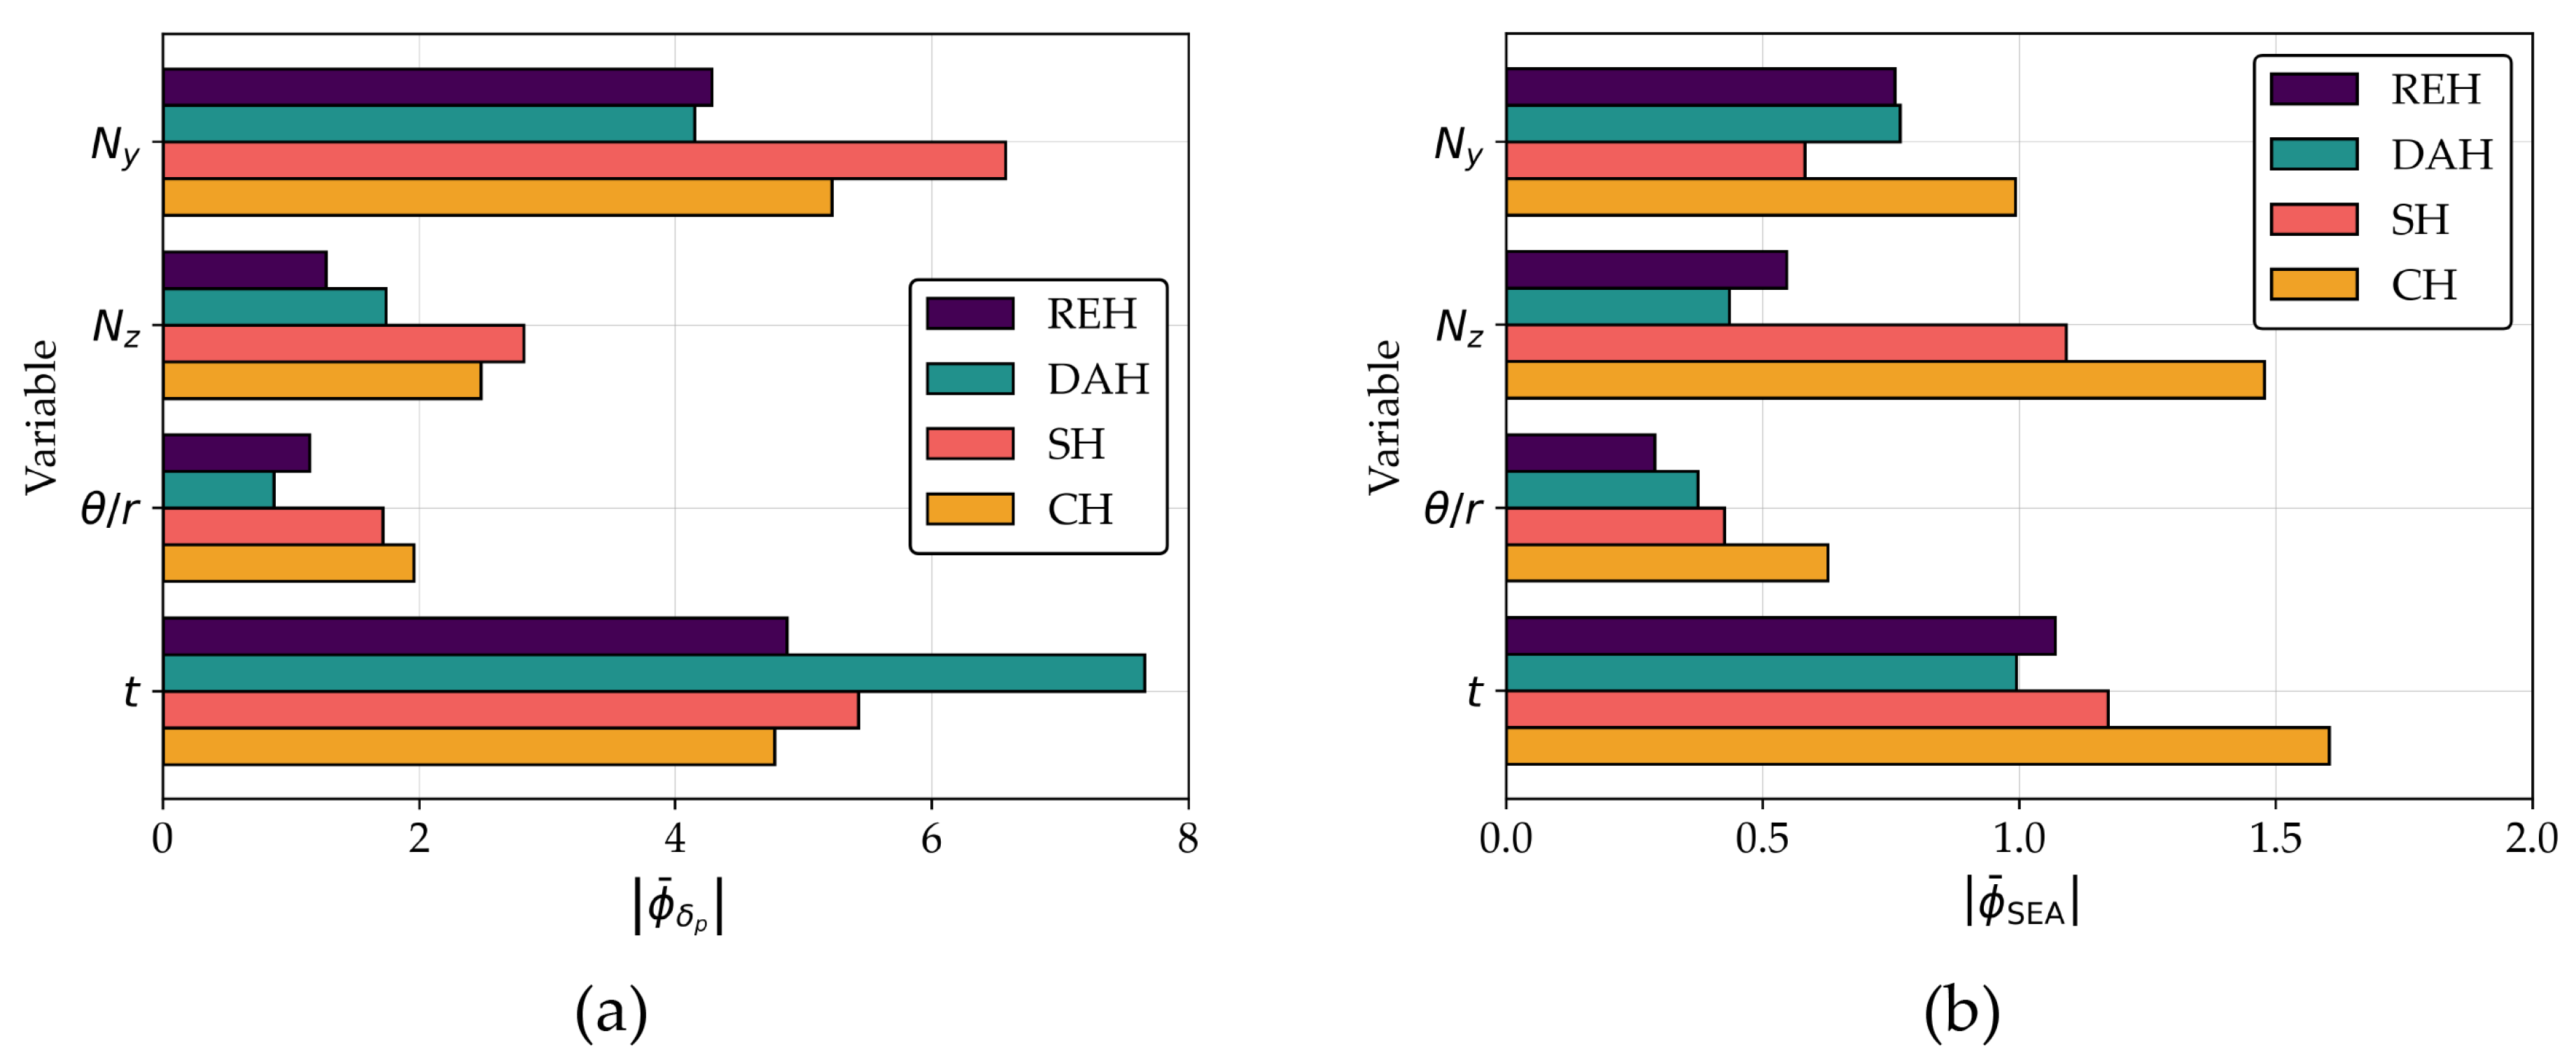
Figure 13.
SHAP summary plot of (left) and SEA (right) for: (a) REH, (b) DAH, (c) SH, and (d) CH model.
Figure 13.
SHAP summary plot of (left) and SEA (right) for: (a) REH, (b) DAH, (c) SH, and (d) CH model.
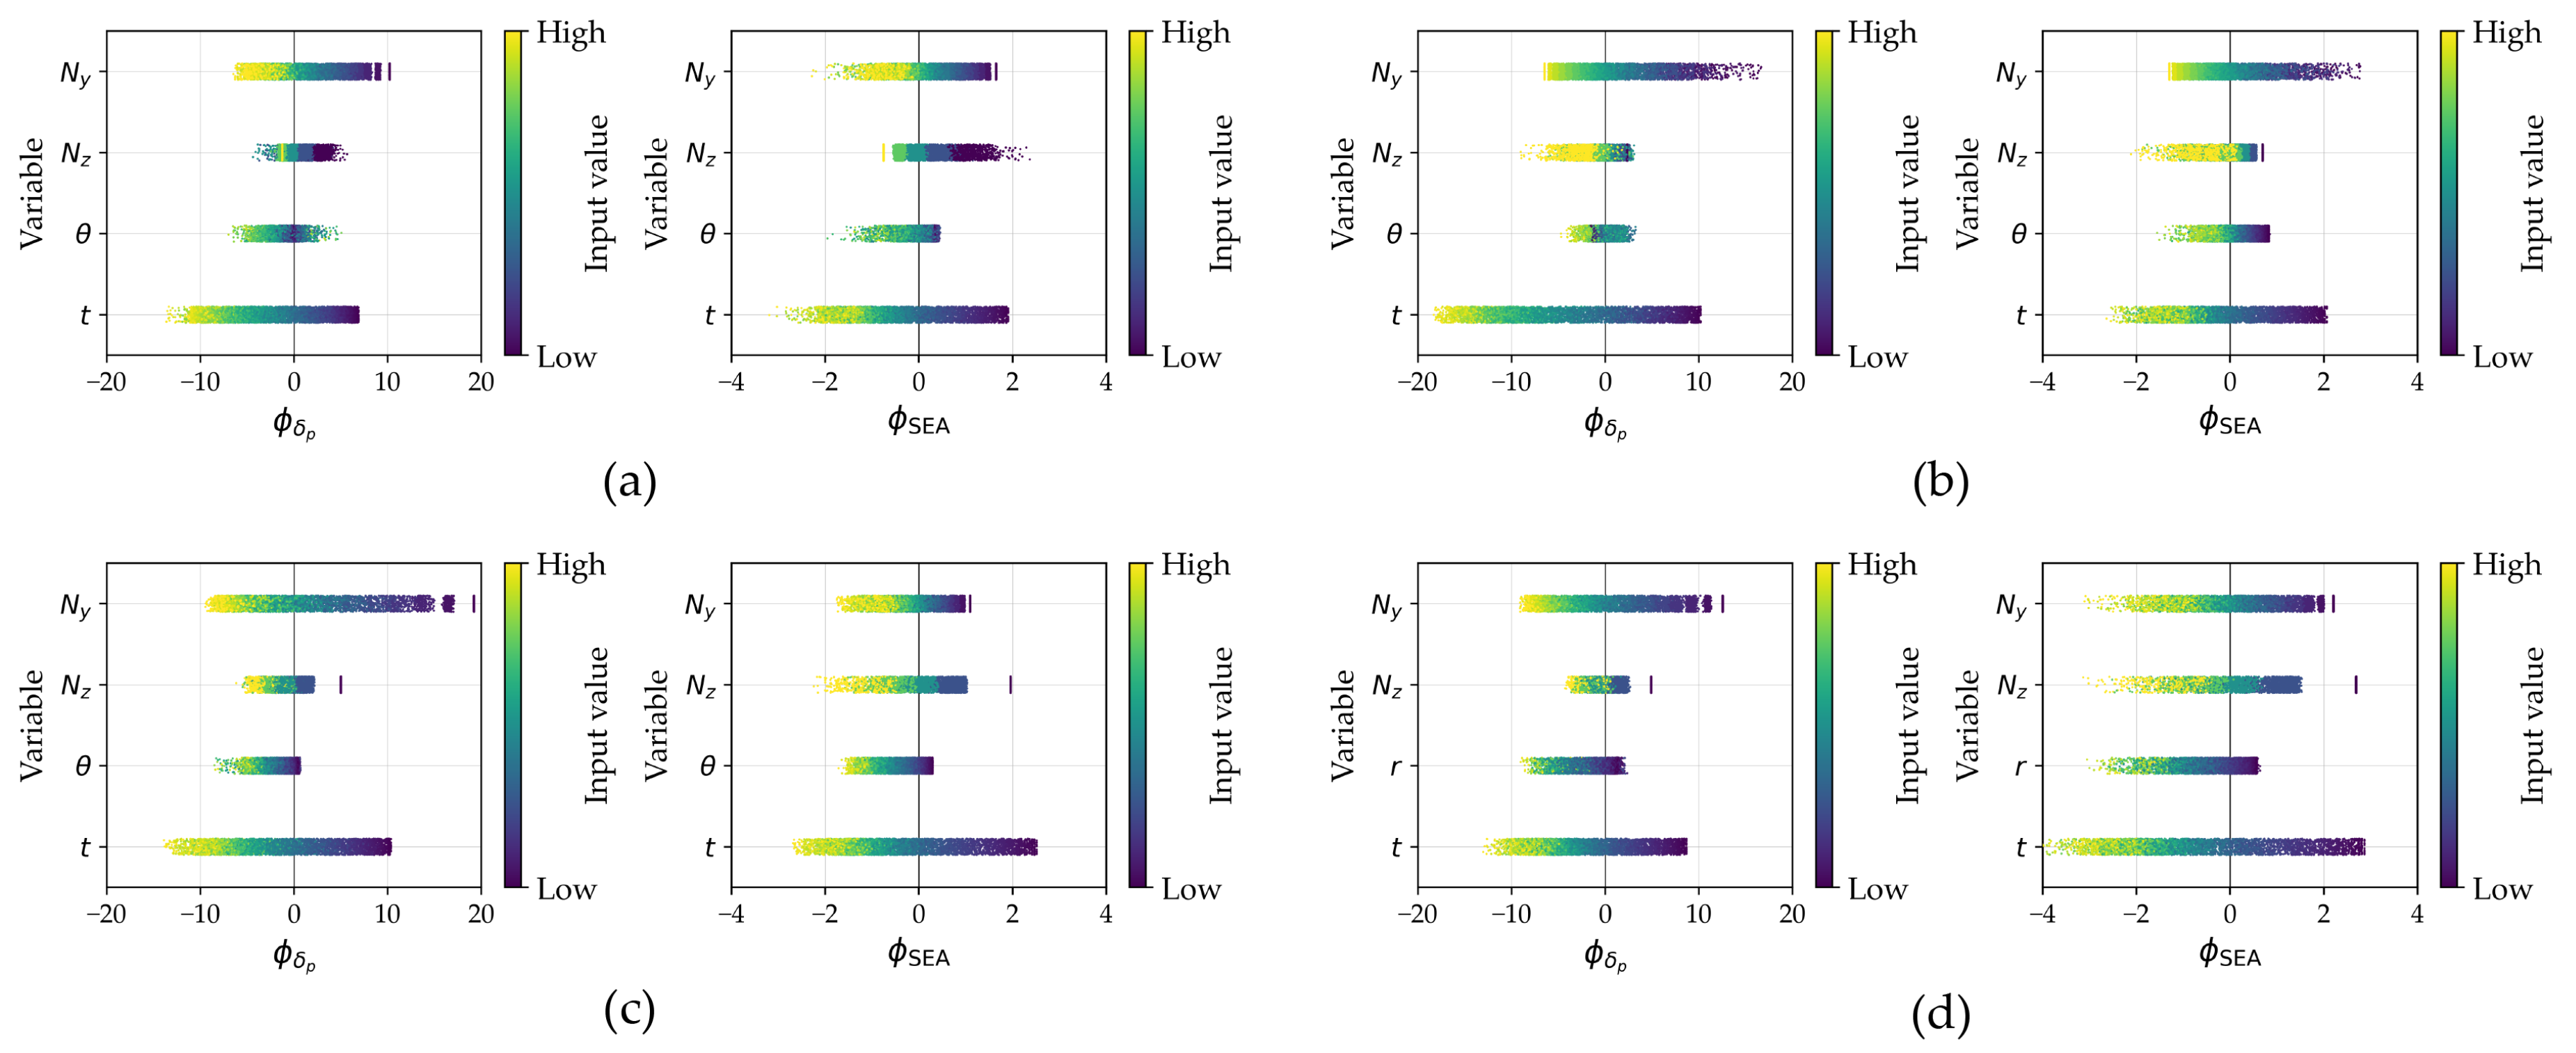
Figure 14.
Scatter plot of the influence of input variables for: (a) REH, (b) DAH, (c) SH, and (d) CH model.
Figure 14.
Scatter plot of the influence of input variables for: (a) REH, (b) DAH, (c) SH, and (d) CH model.
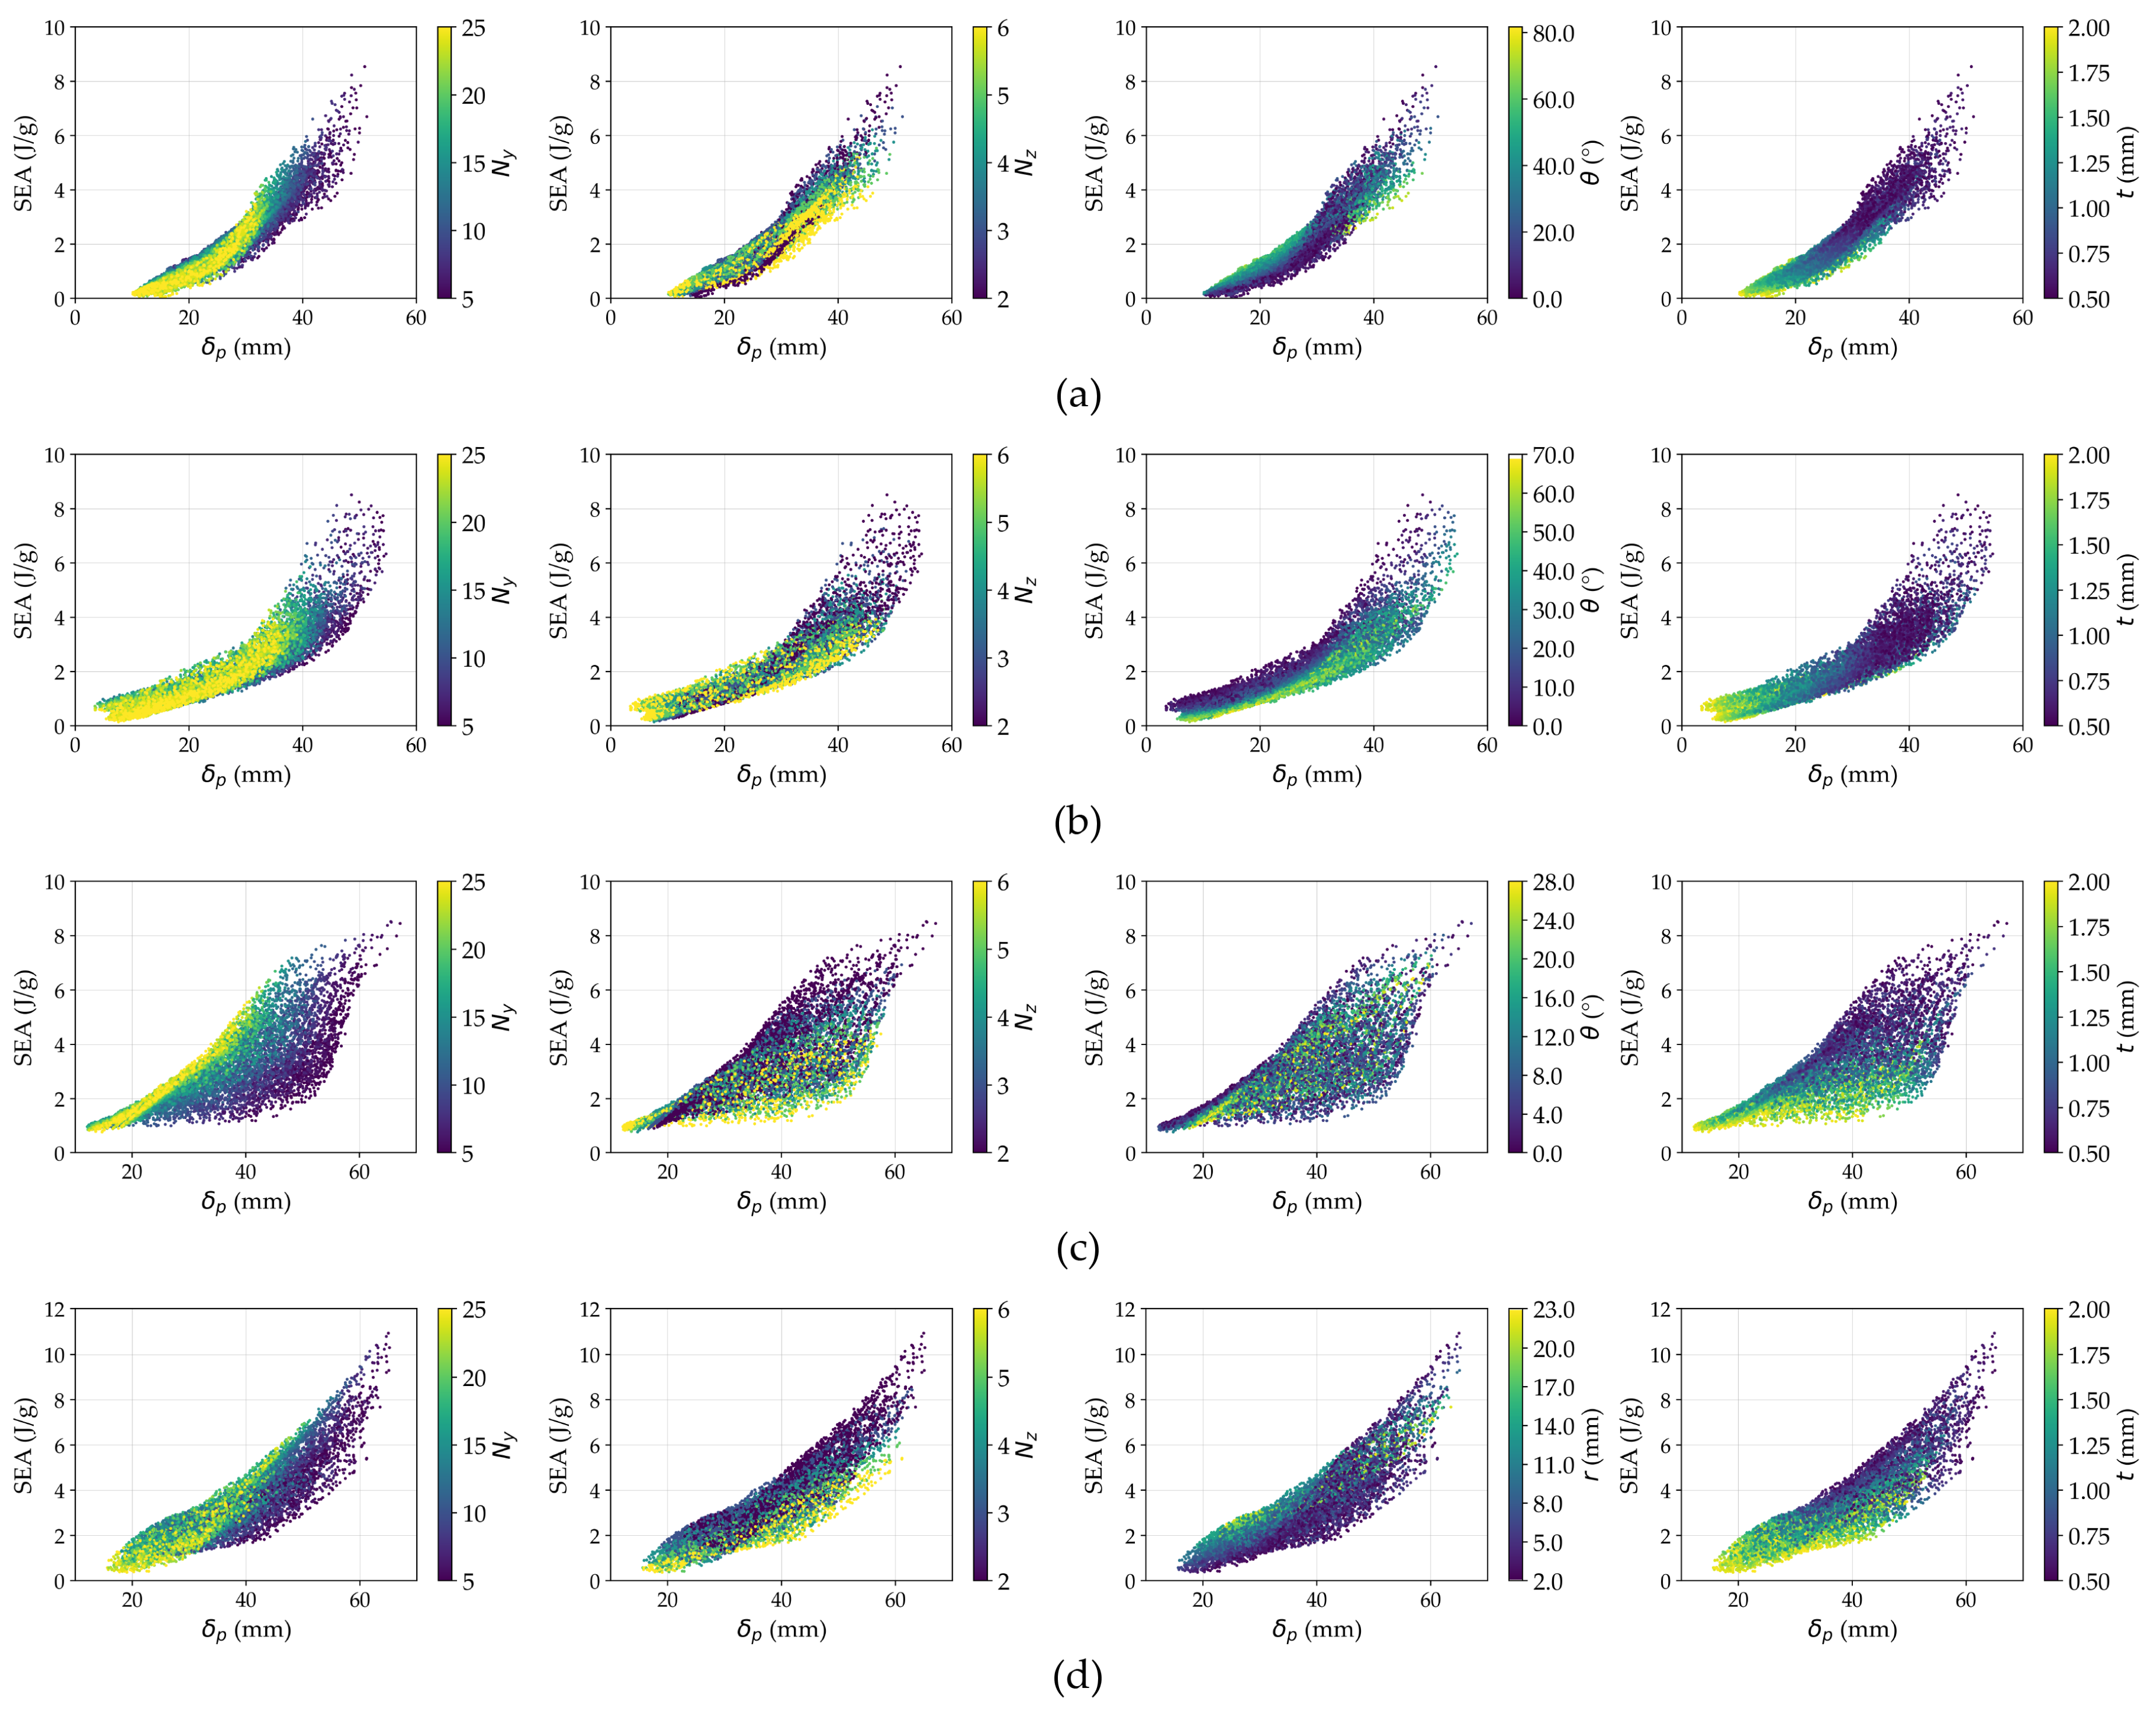
Figure 15.
Pareto front of MOOP for: (a) REH, (b) DAH, (c) SH, and (d) CH model. The pareto front is limited to .
Figure 15.
Pareto front of MOOP for: (a) REH, (b) DAH, (c) SH, and (d) CH model. The pareto front is limited to .
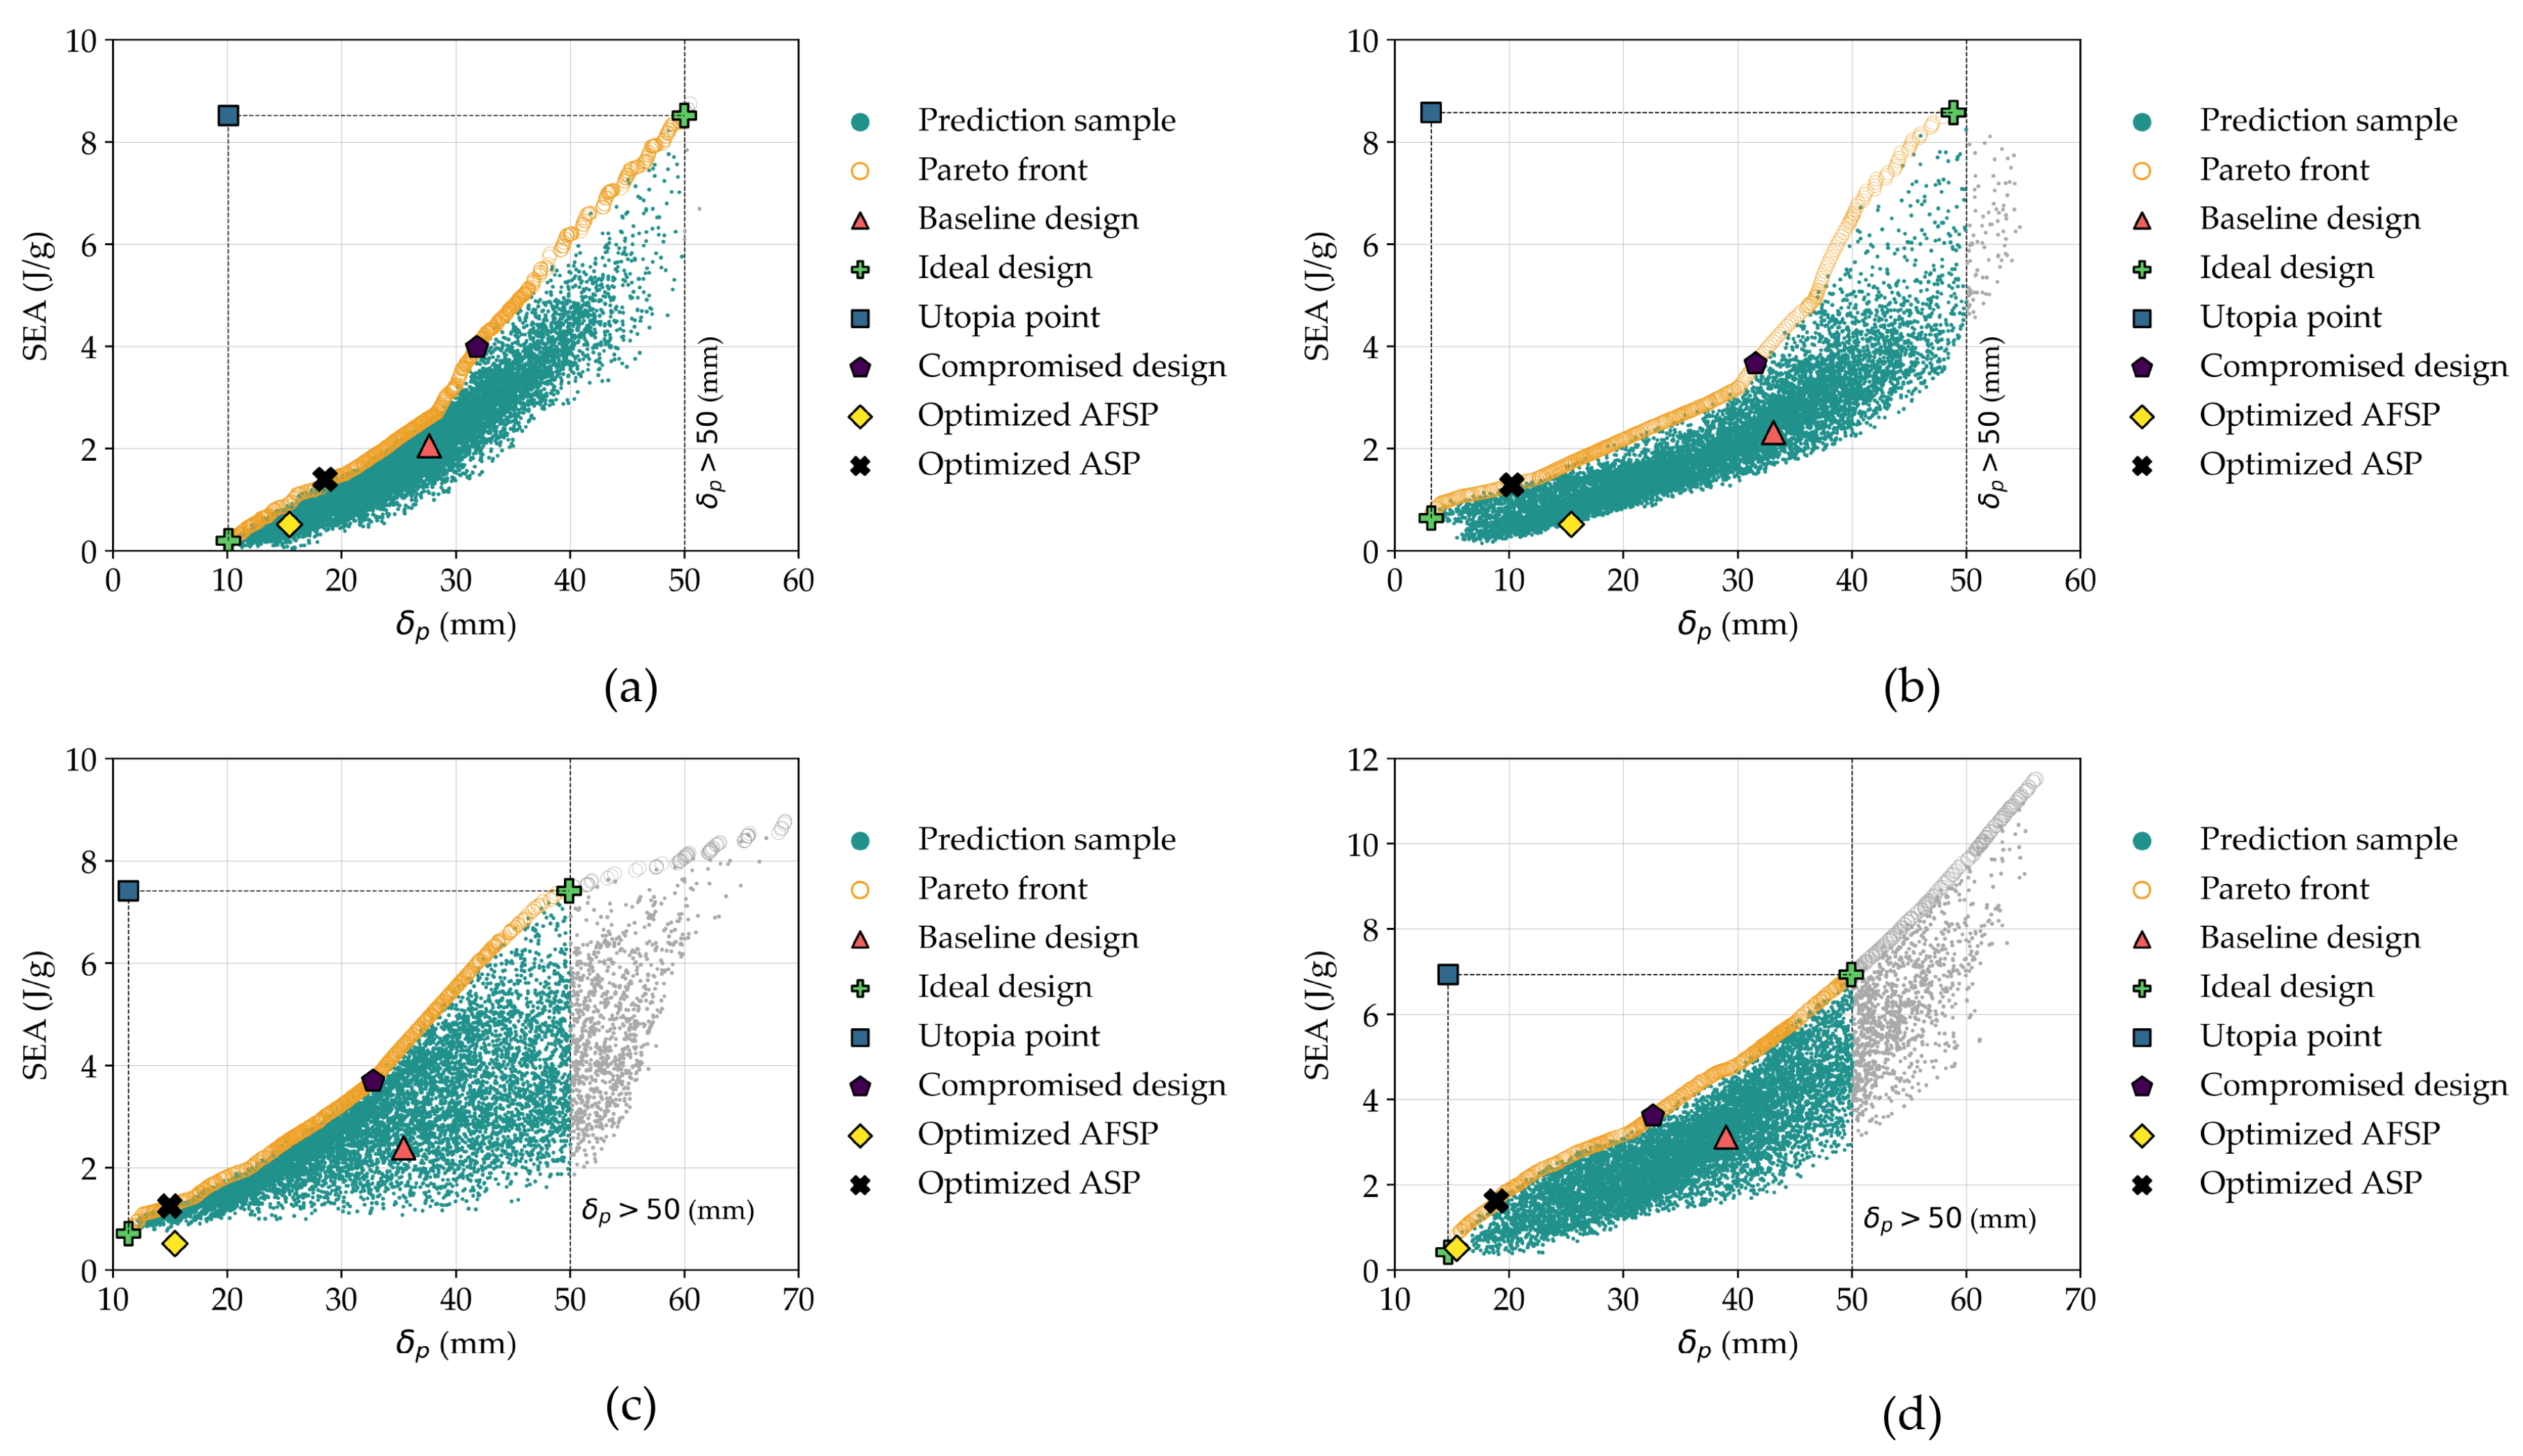
Figure 16.
The comparison of optimized ASP models: (a) REH, (b) DAH, (c) SH, (d) SH; and (e) optimized AFSP model [43].
Figure 16.
The comparison of optimized ASP models: (a) REH, (b) DAH, (c) SH, (d) SH; and (e) optimized AFSP model [43].
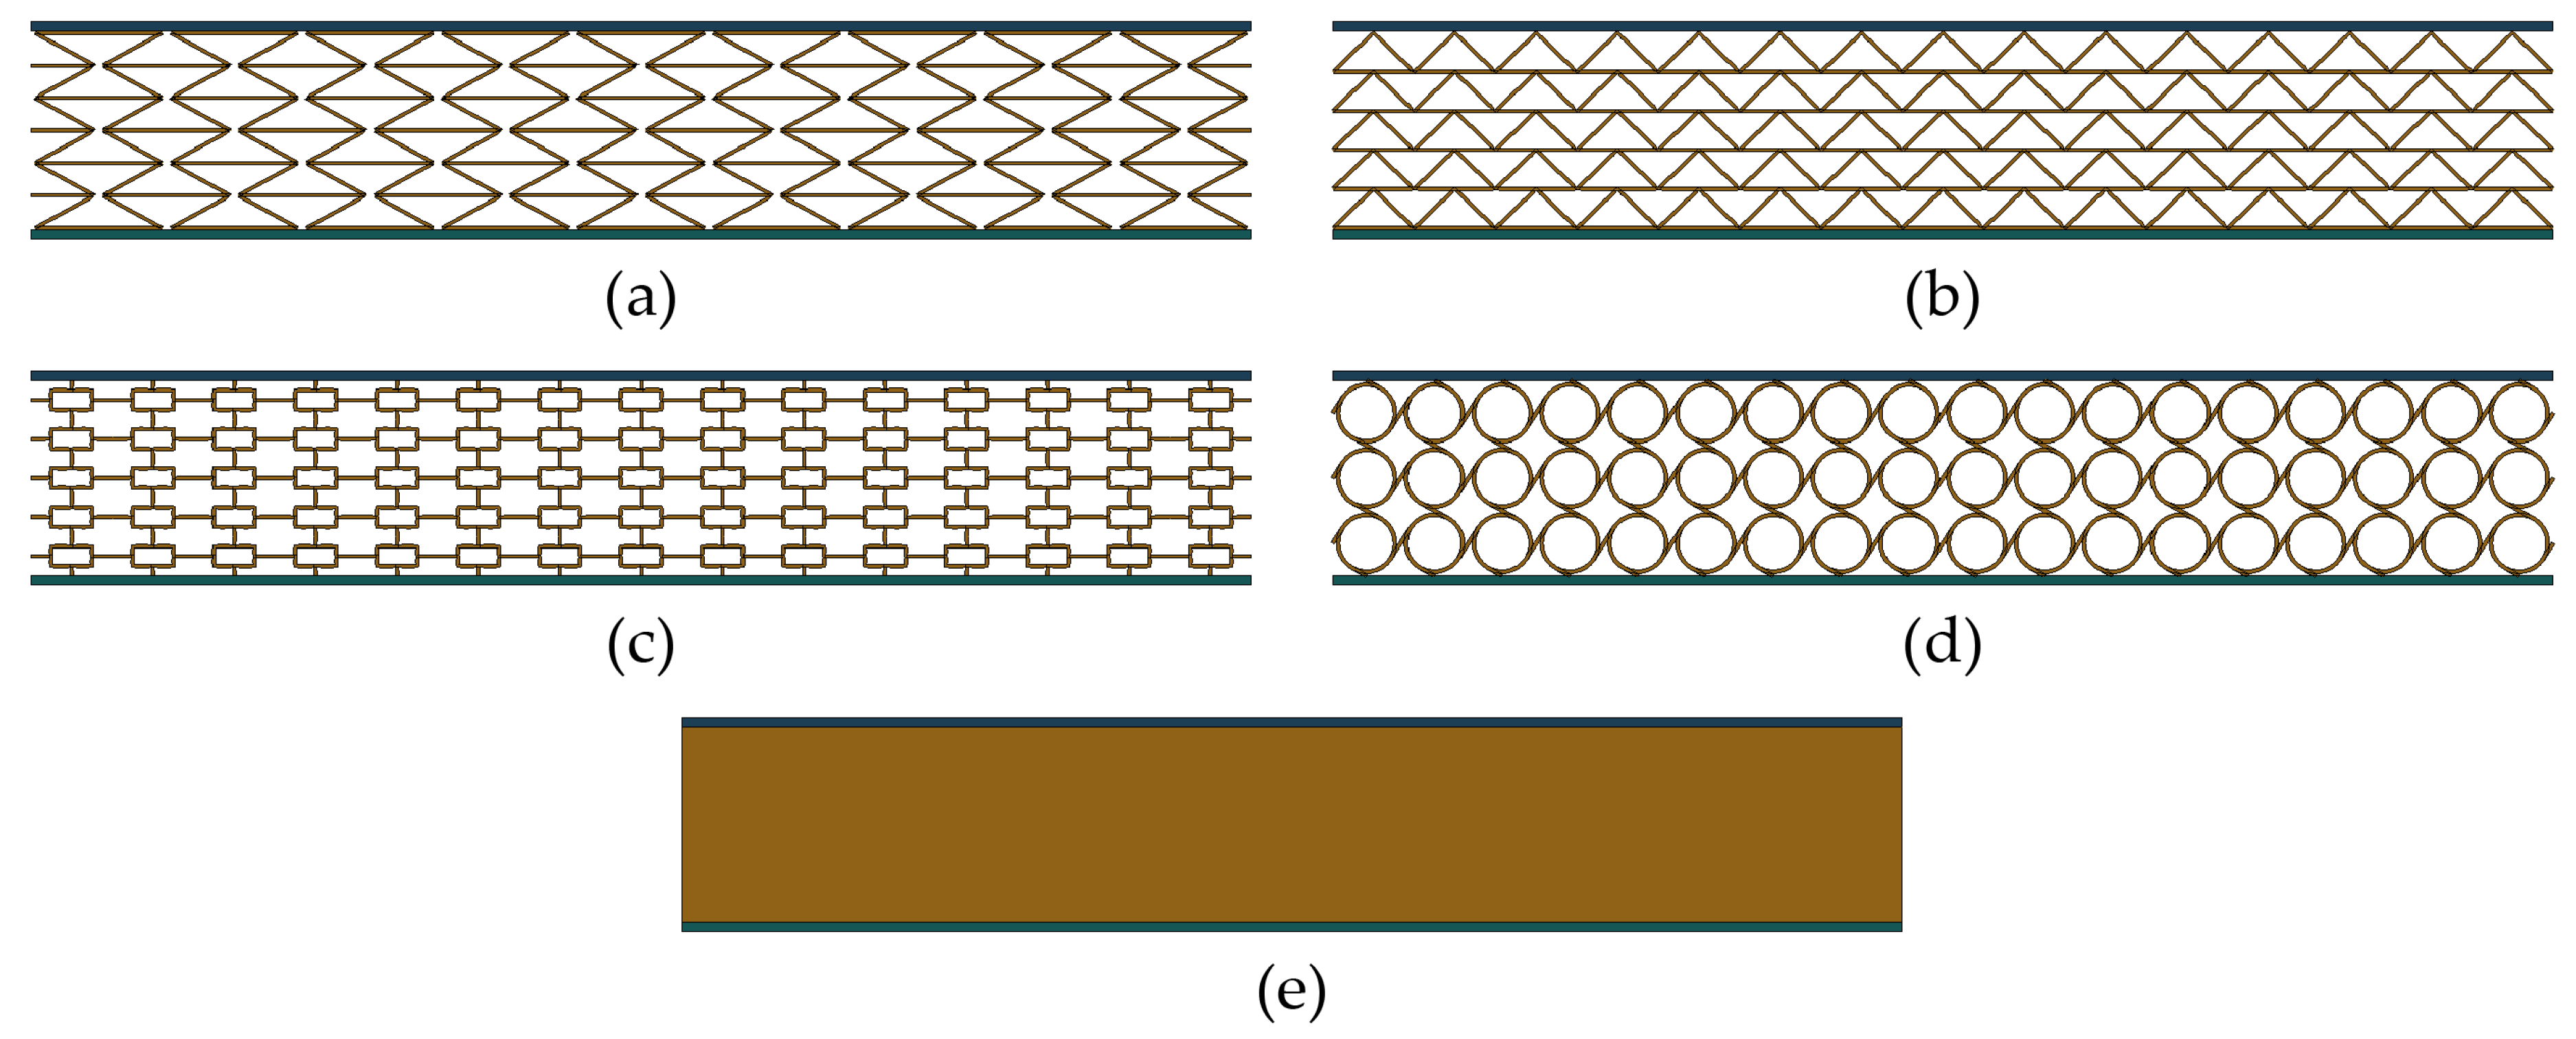
Figure 17.
The comparison of the pareto front for all auxetic models.
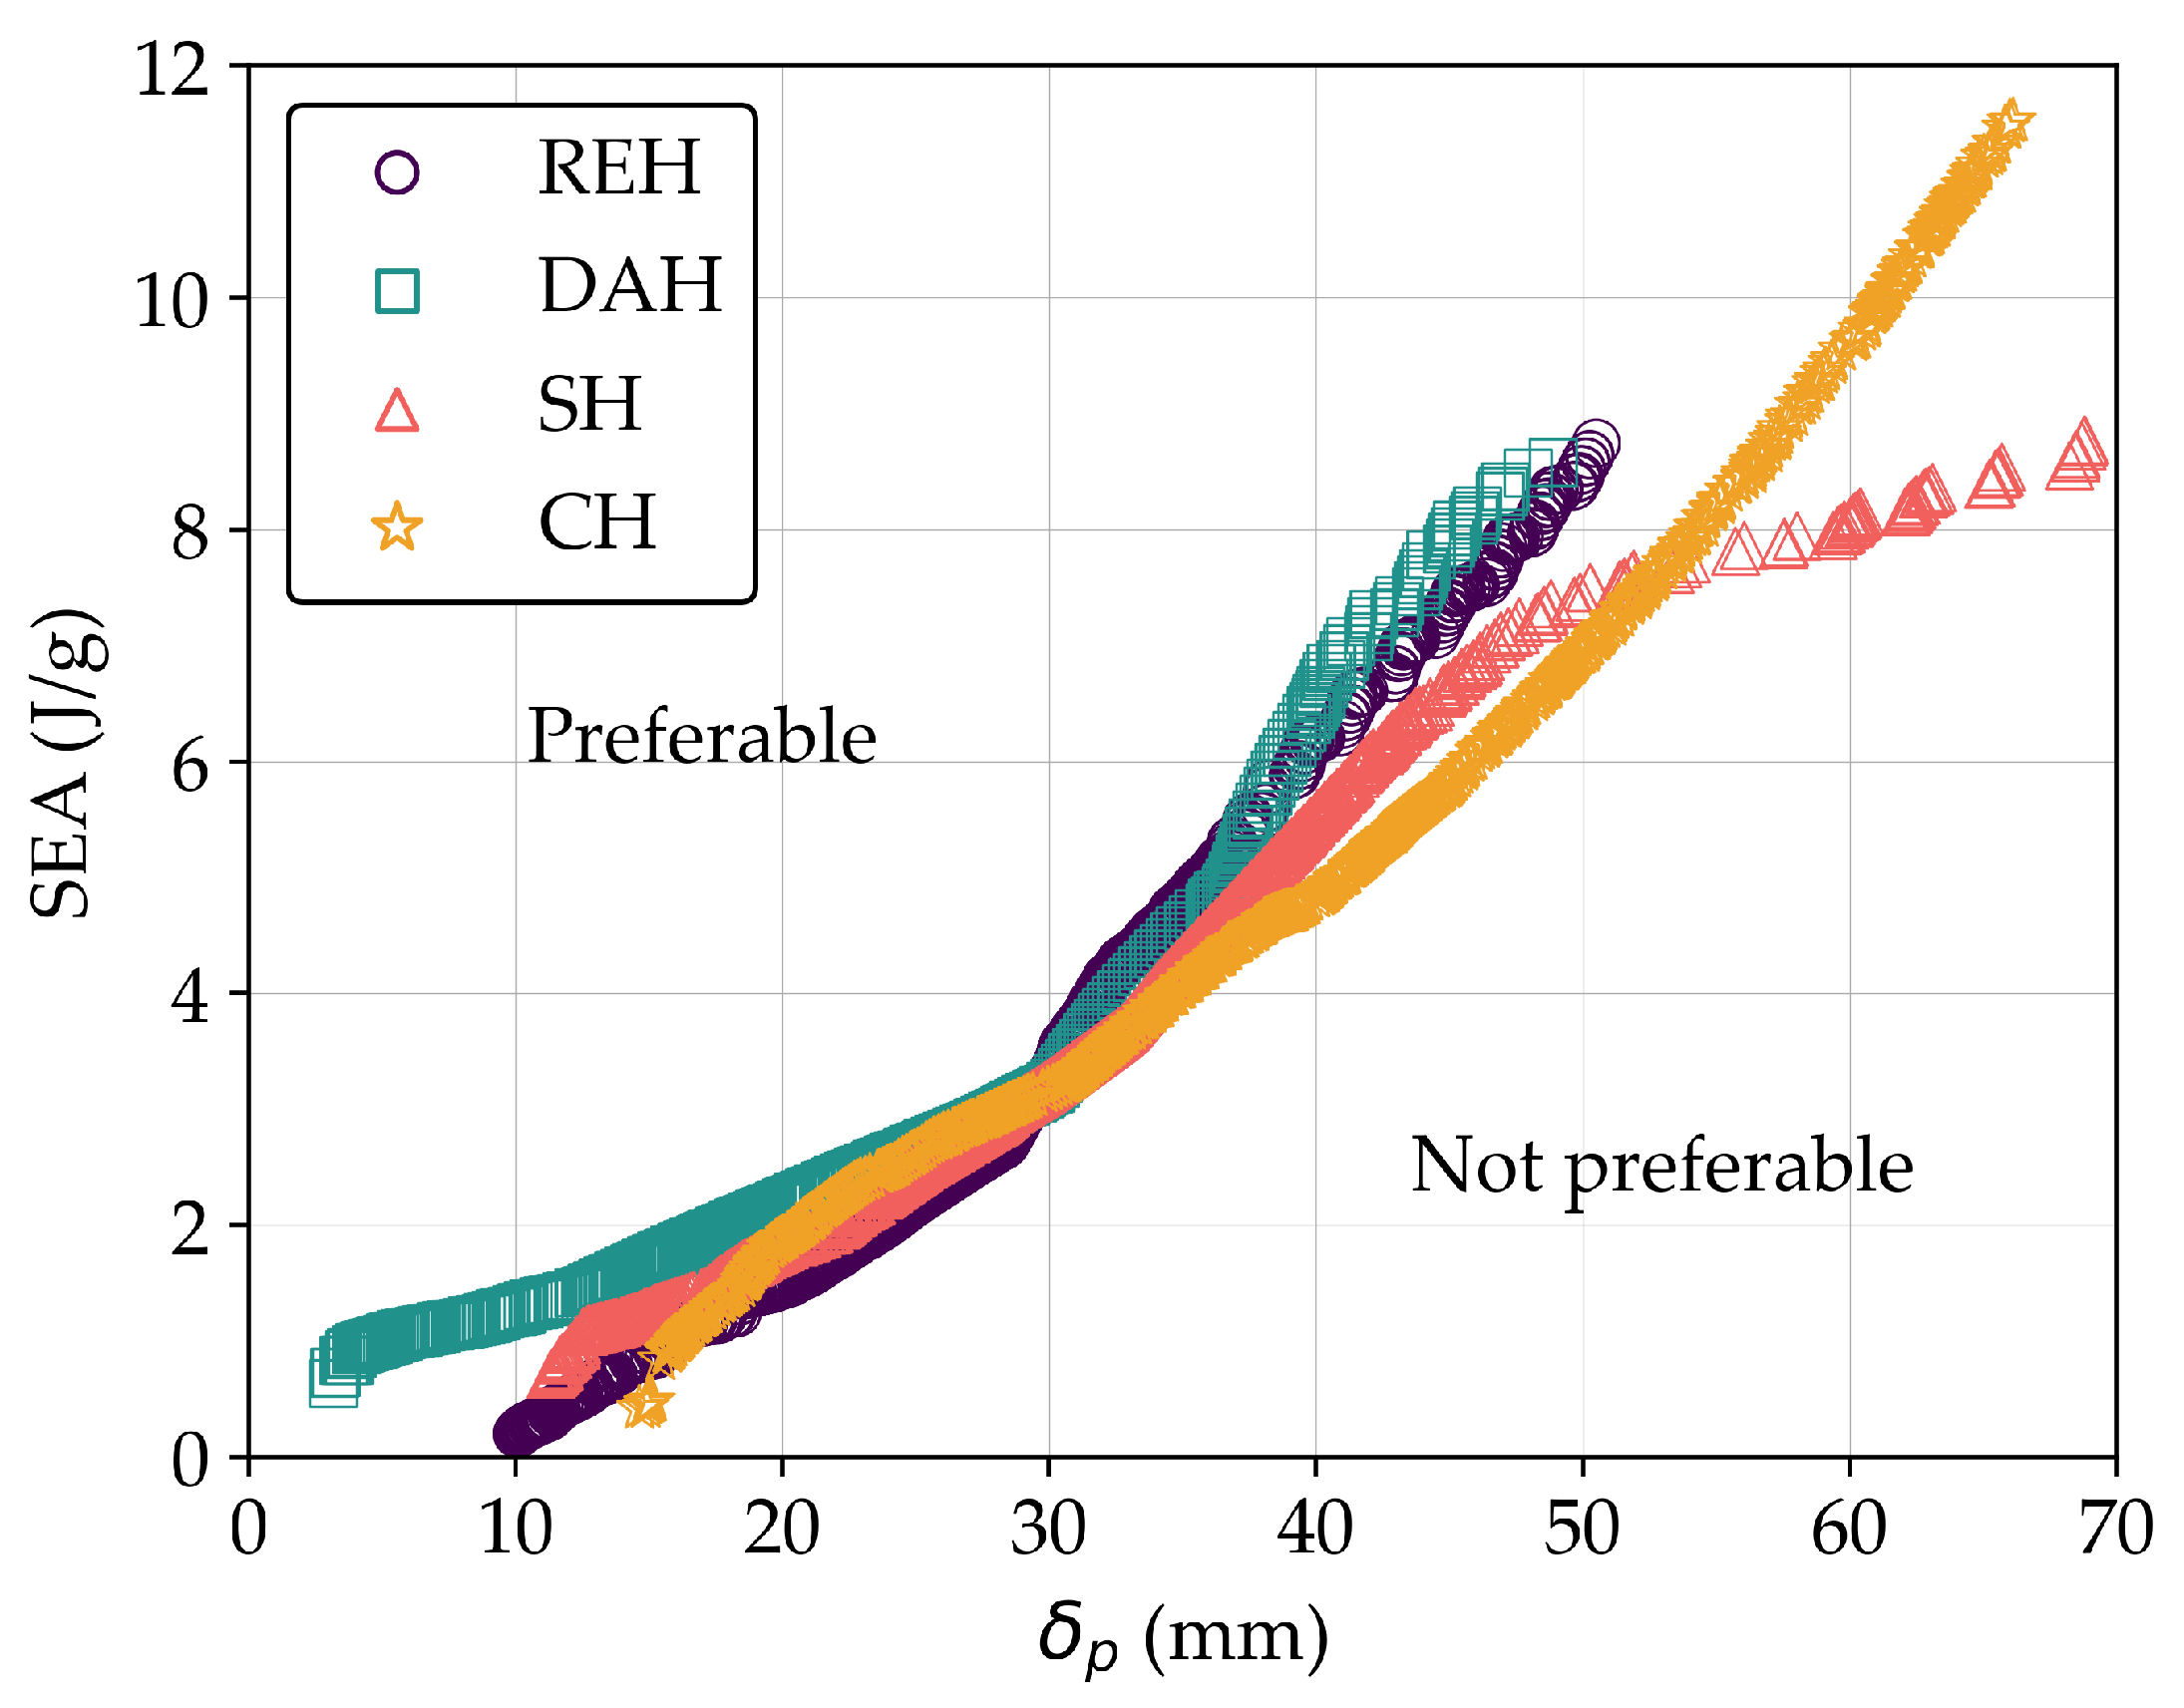
Figure 18.
Deformed shapes of four type models for each ASP: (a) REH, (b) DAH, (c) SH, and (d) CH, at 5 ms. (from left to right: ideal model of maximum SEA, compromised model, baseline model, and ideal model of minimum ).
Figure 18.
Deformed shapes of four type models for each ASP: (a) REH, (b) DAH, (c) SH, and (d) CH, at 5 ms. (from left to right: ideal model of maximum SEA, compromised model, baseline model, and ideal model of minimum ).
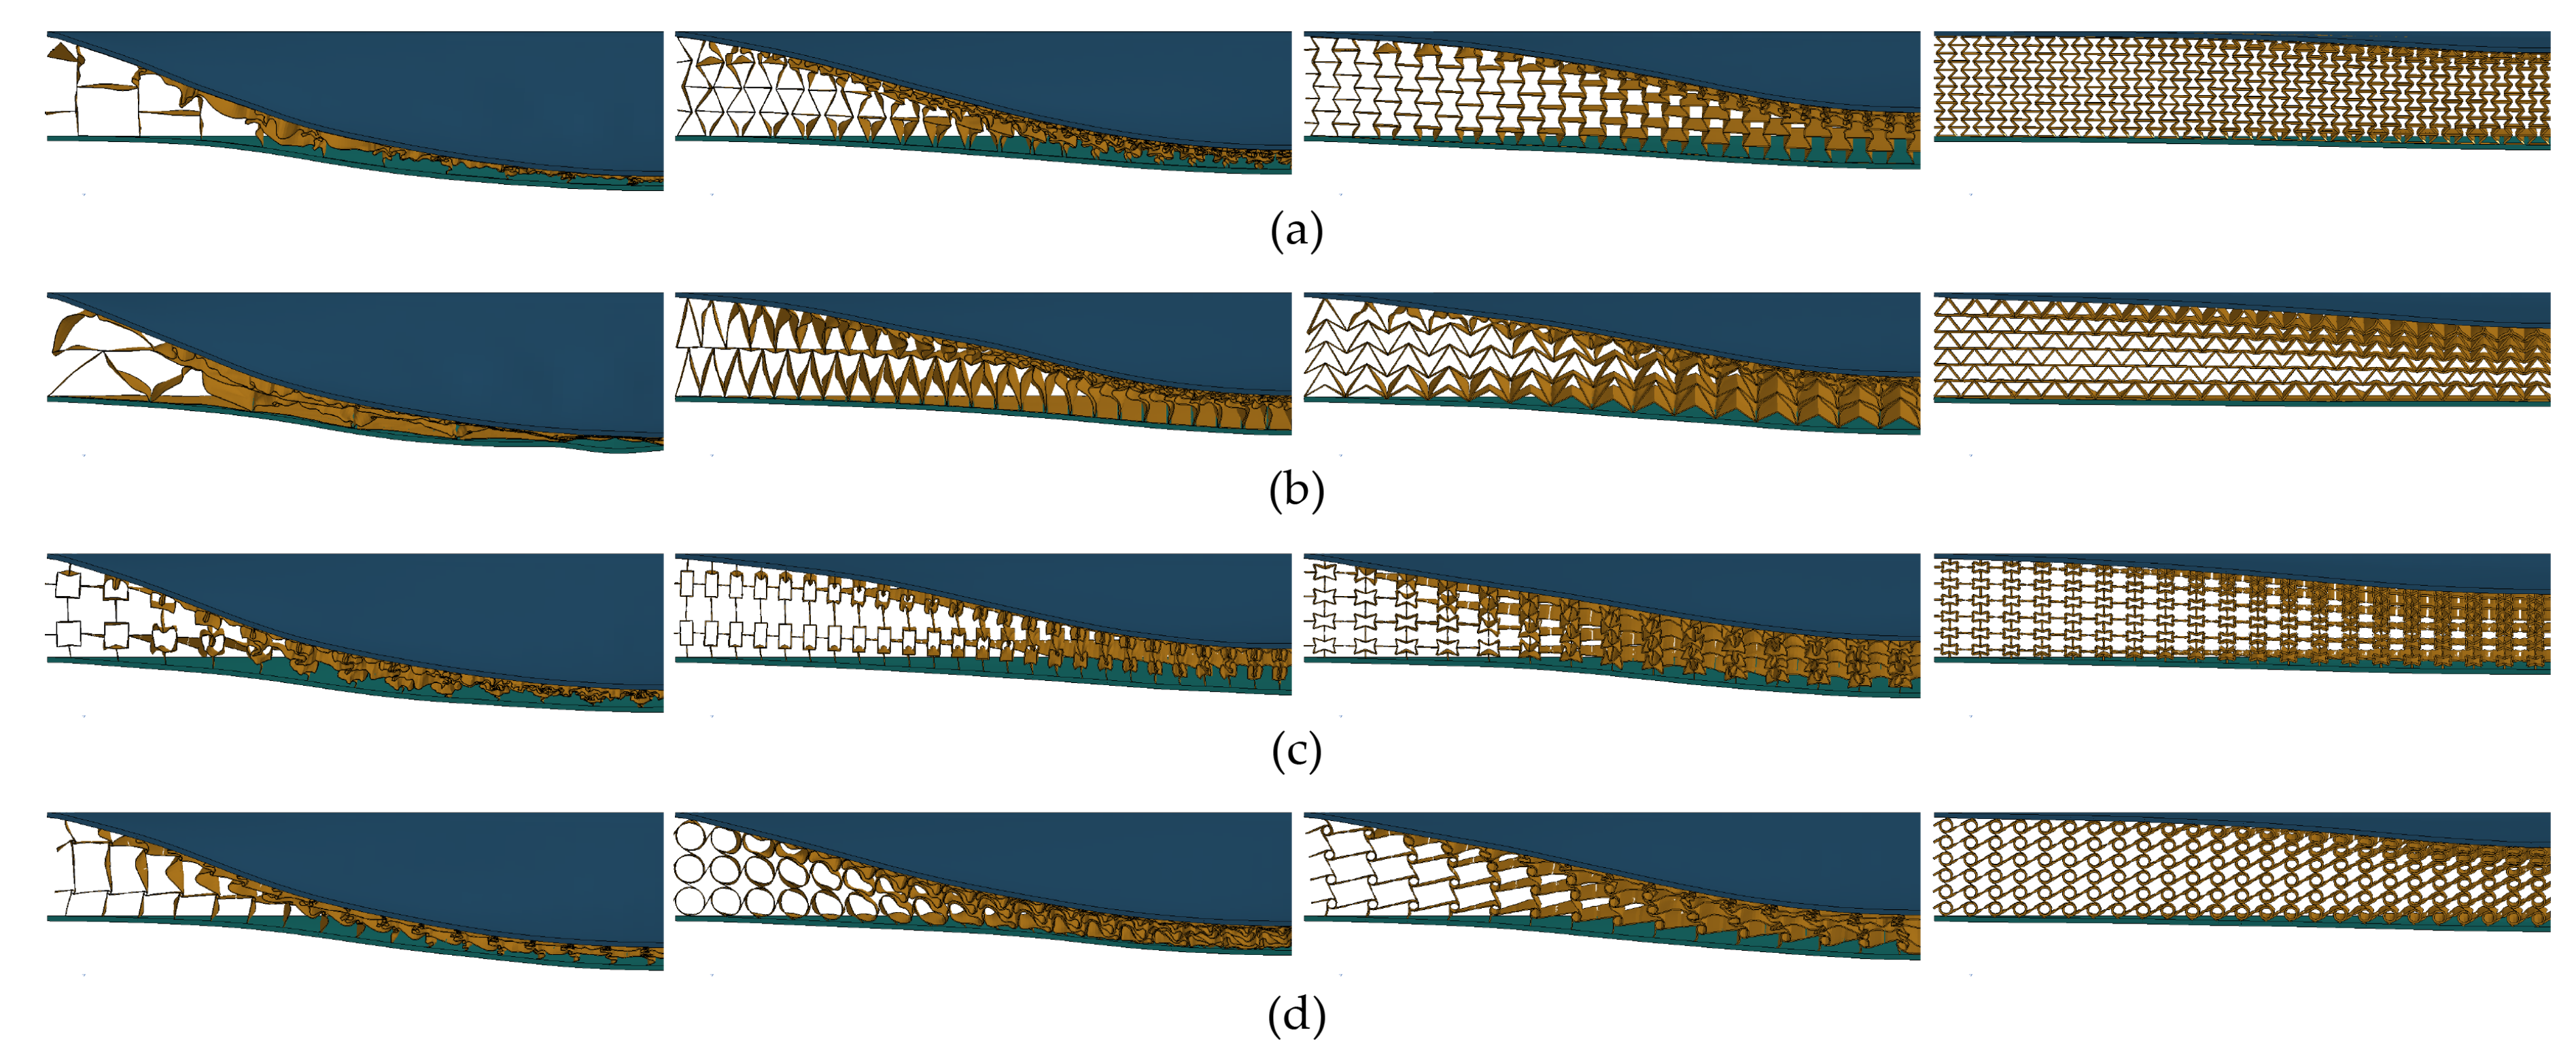
Figure 19.
Displacement vectors of ASP baseline model: (a) REH, (b) DAH, (c) SH, and (d) CH. Red ellipse indicates the area that exhibit NPR behavior.
Figure 19.
Displacement vectors of ASP baseline model: (a) REH, (b) DAH, (c) SH, and (d) CH. Red ellipse indicates the area that exhibit NPR behavior.
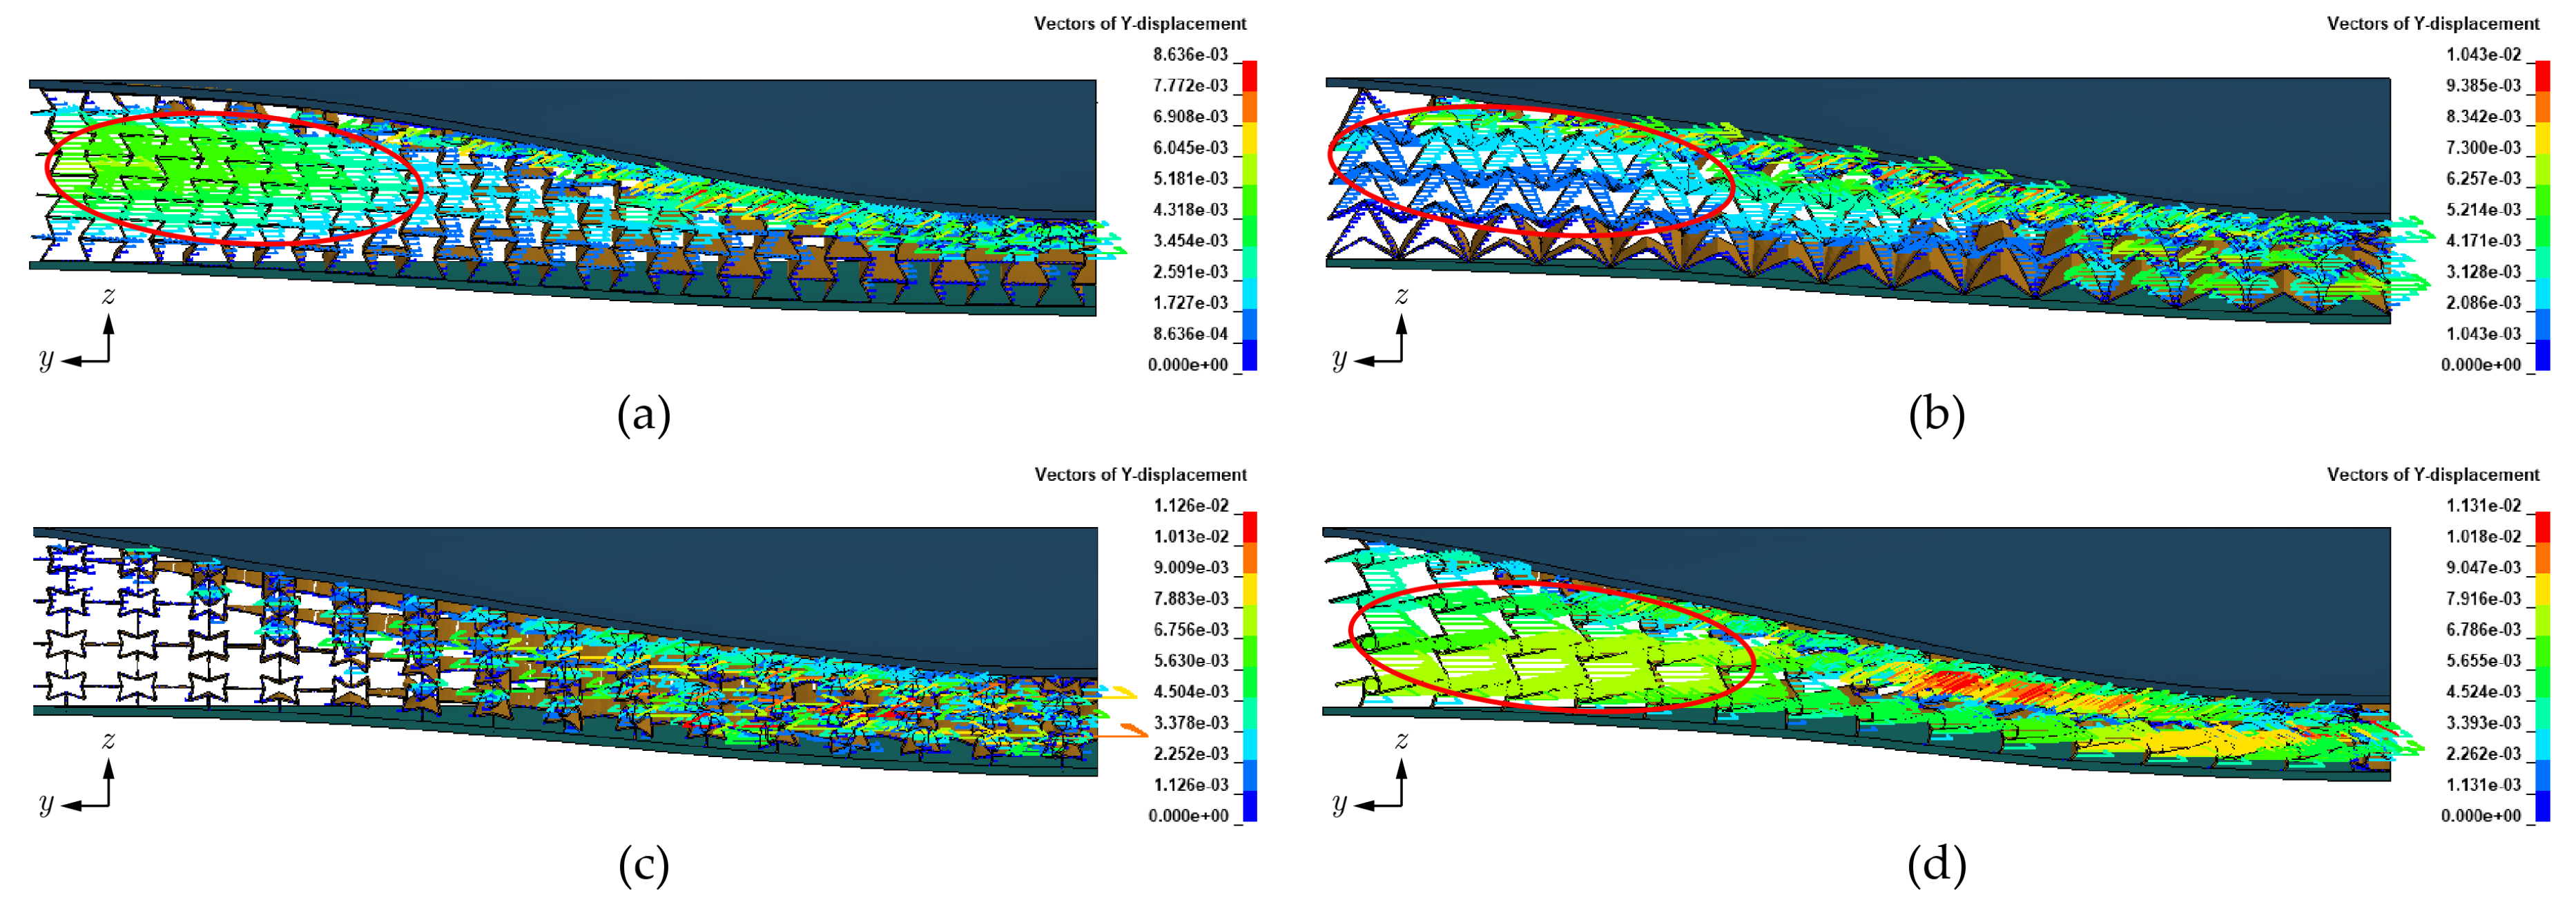
Figure 20.
The FE model of AFV sub-system under 8 kg TNT: (a) side view, (b) front view, (c) 8 kg TNT placed on a rigid steel pot.
Figure 20.
The FE model of AFV sub-system under 8 kg TNT: (a) side view, (b) front view, (c) 8 kg TNT placed on a rigid steel pot.
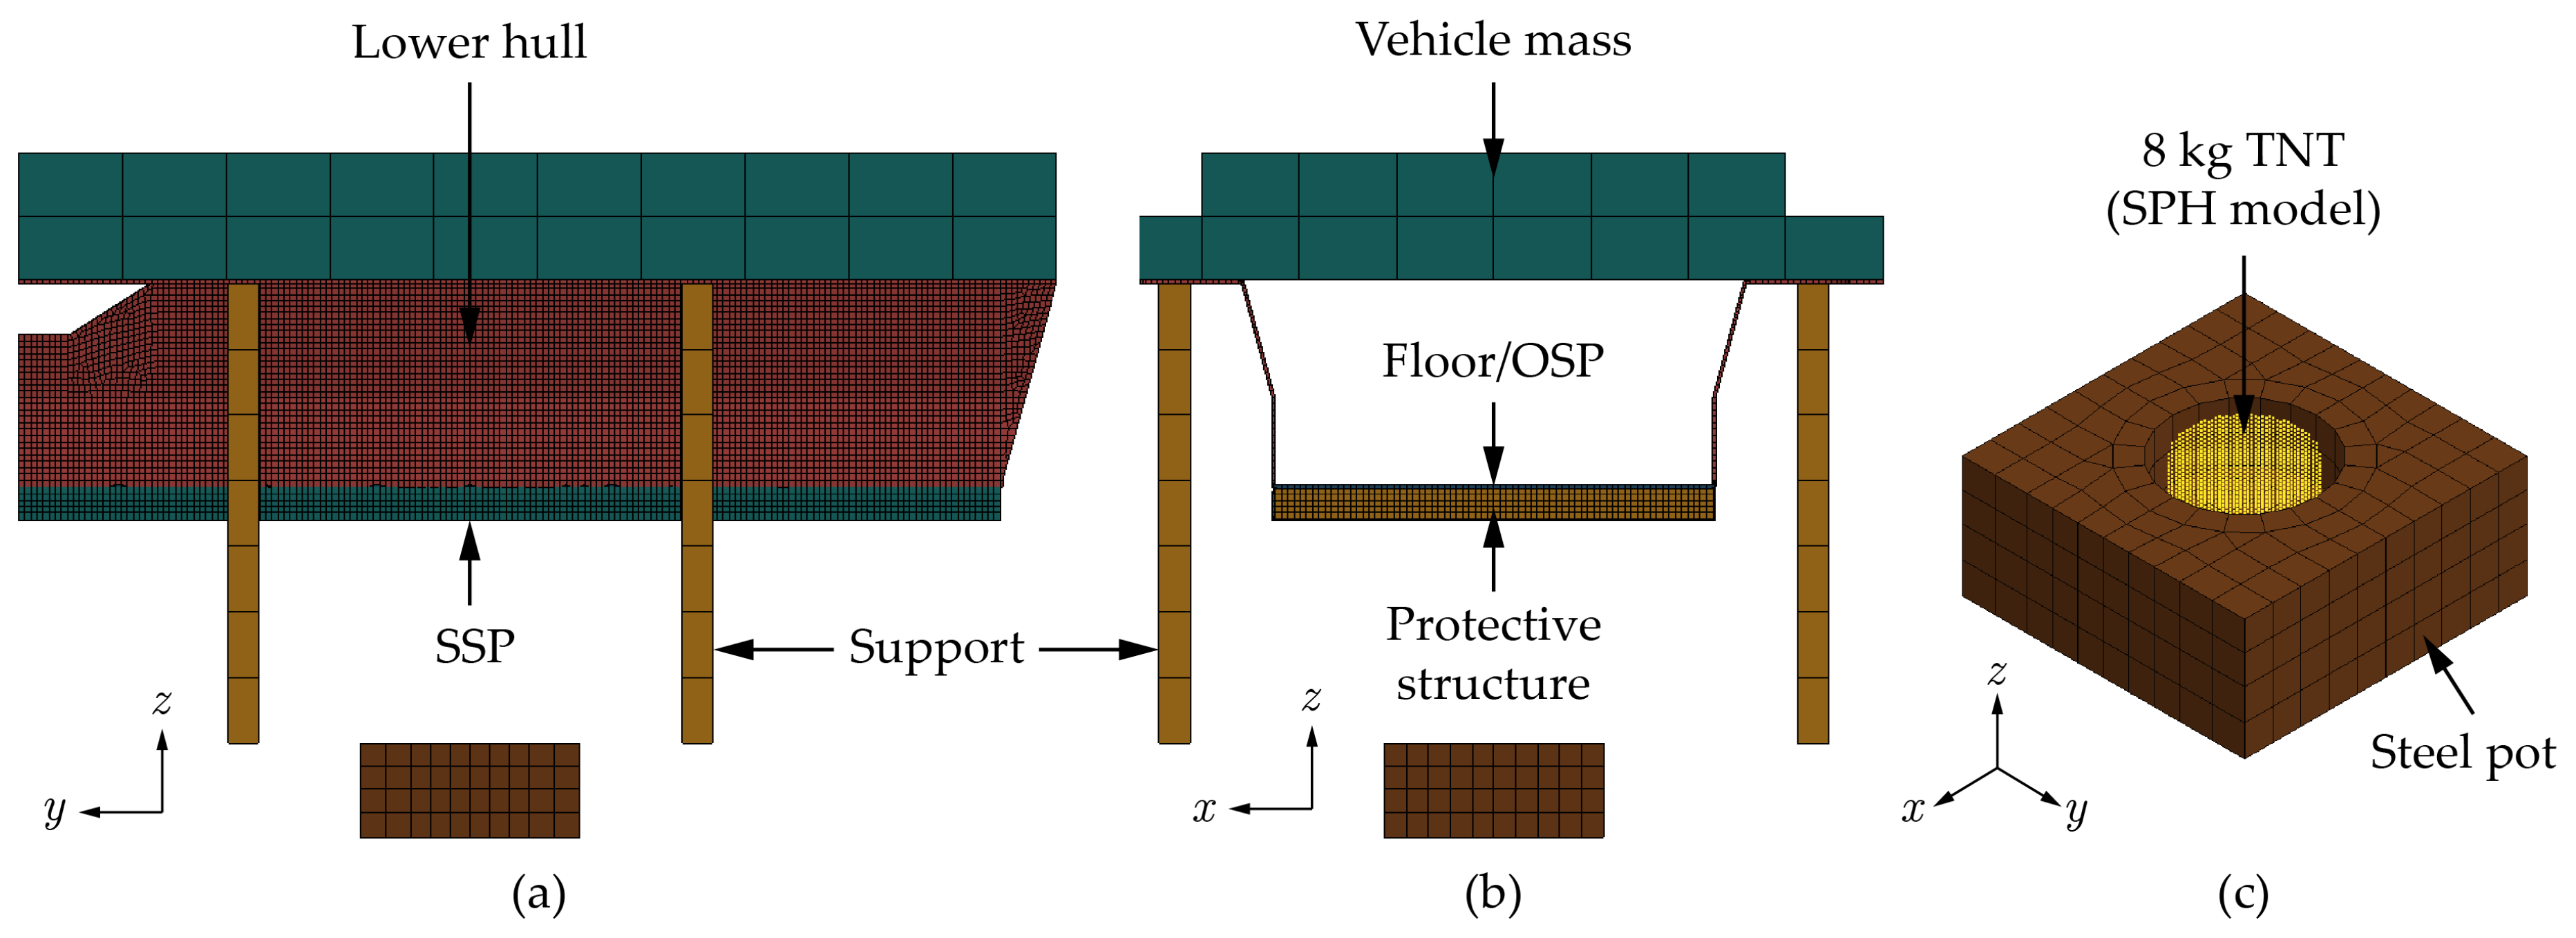
Figure 21.
Simulation result of AFV sub-system: (a) 10 mm OSP, (b) 20 mm OSP, (c) optimized AFSP, (d) optimized ASP DAH.
Figure 21.
Simulation result of AFV sub-system: (a) 10 mm OSP, (b) 20 mm OSP, (c) optimized AFSP, (d) optimized ASP DAH.
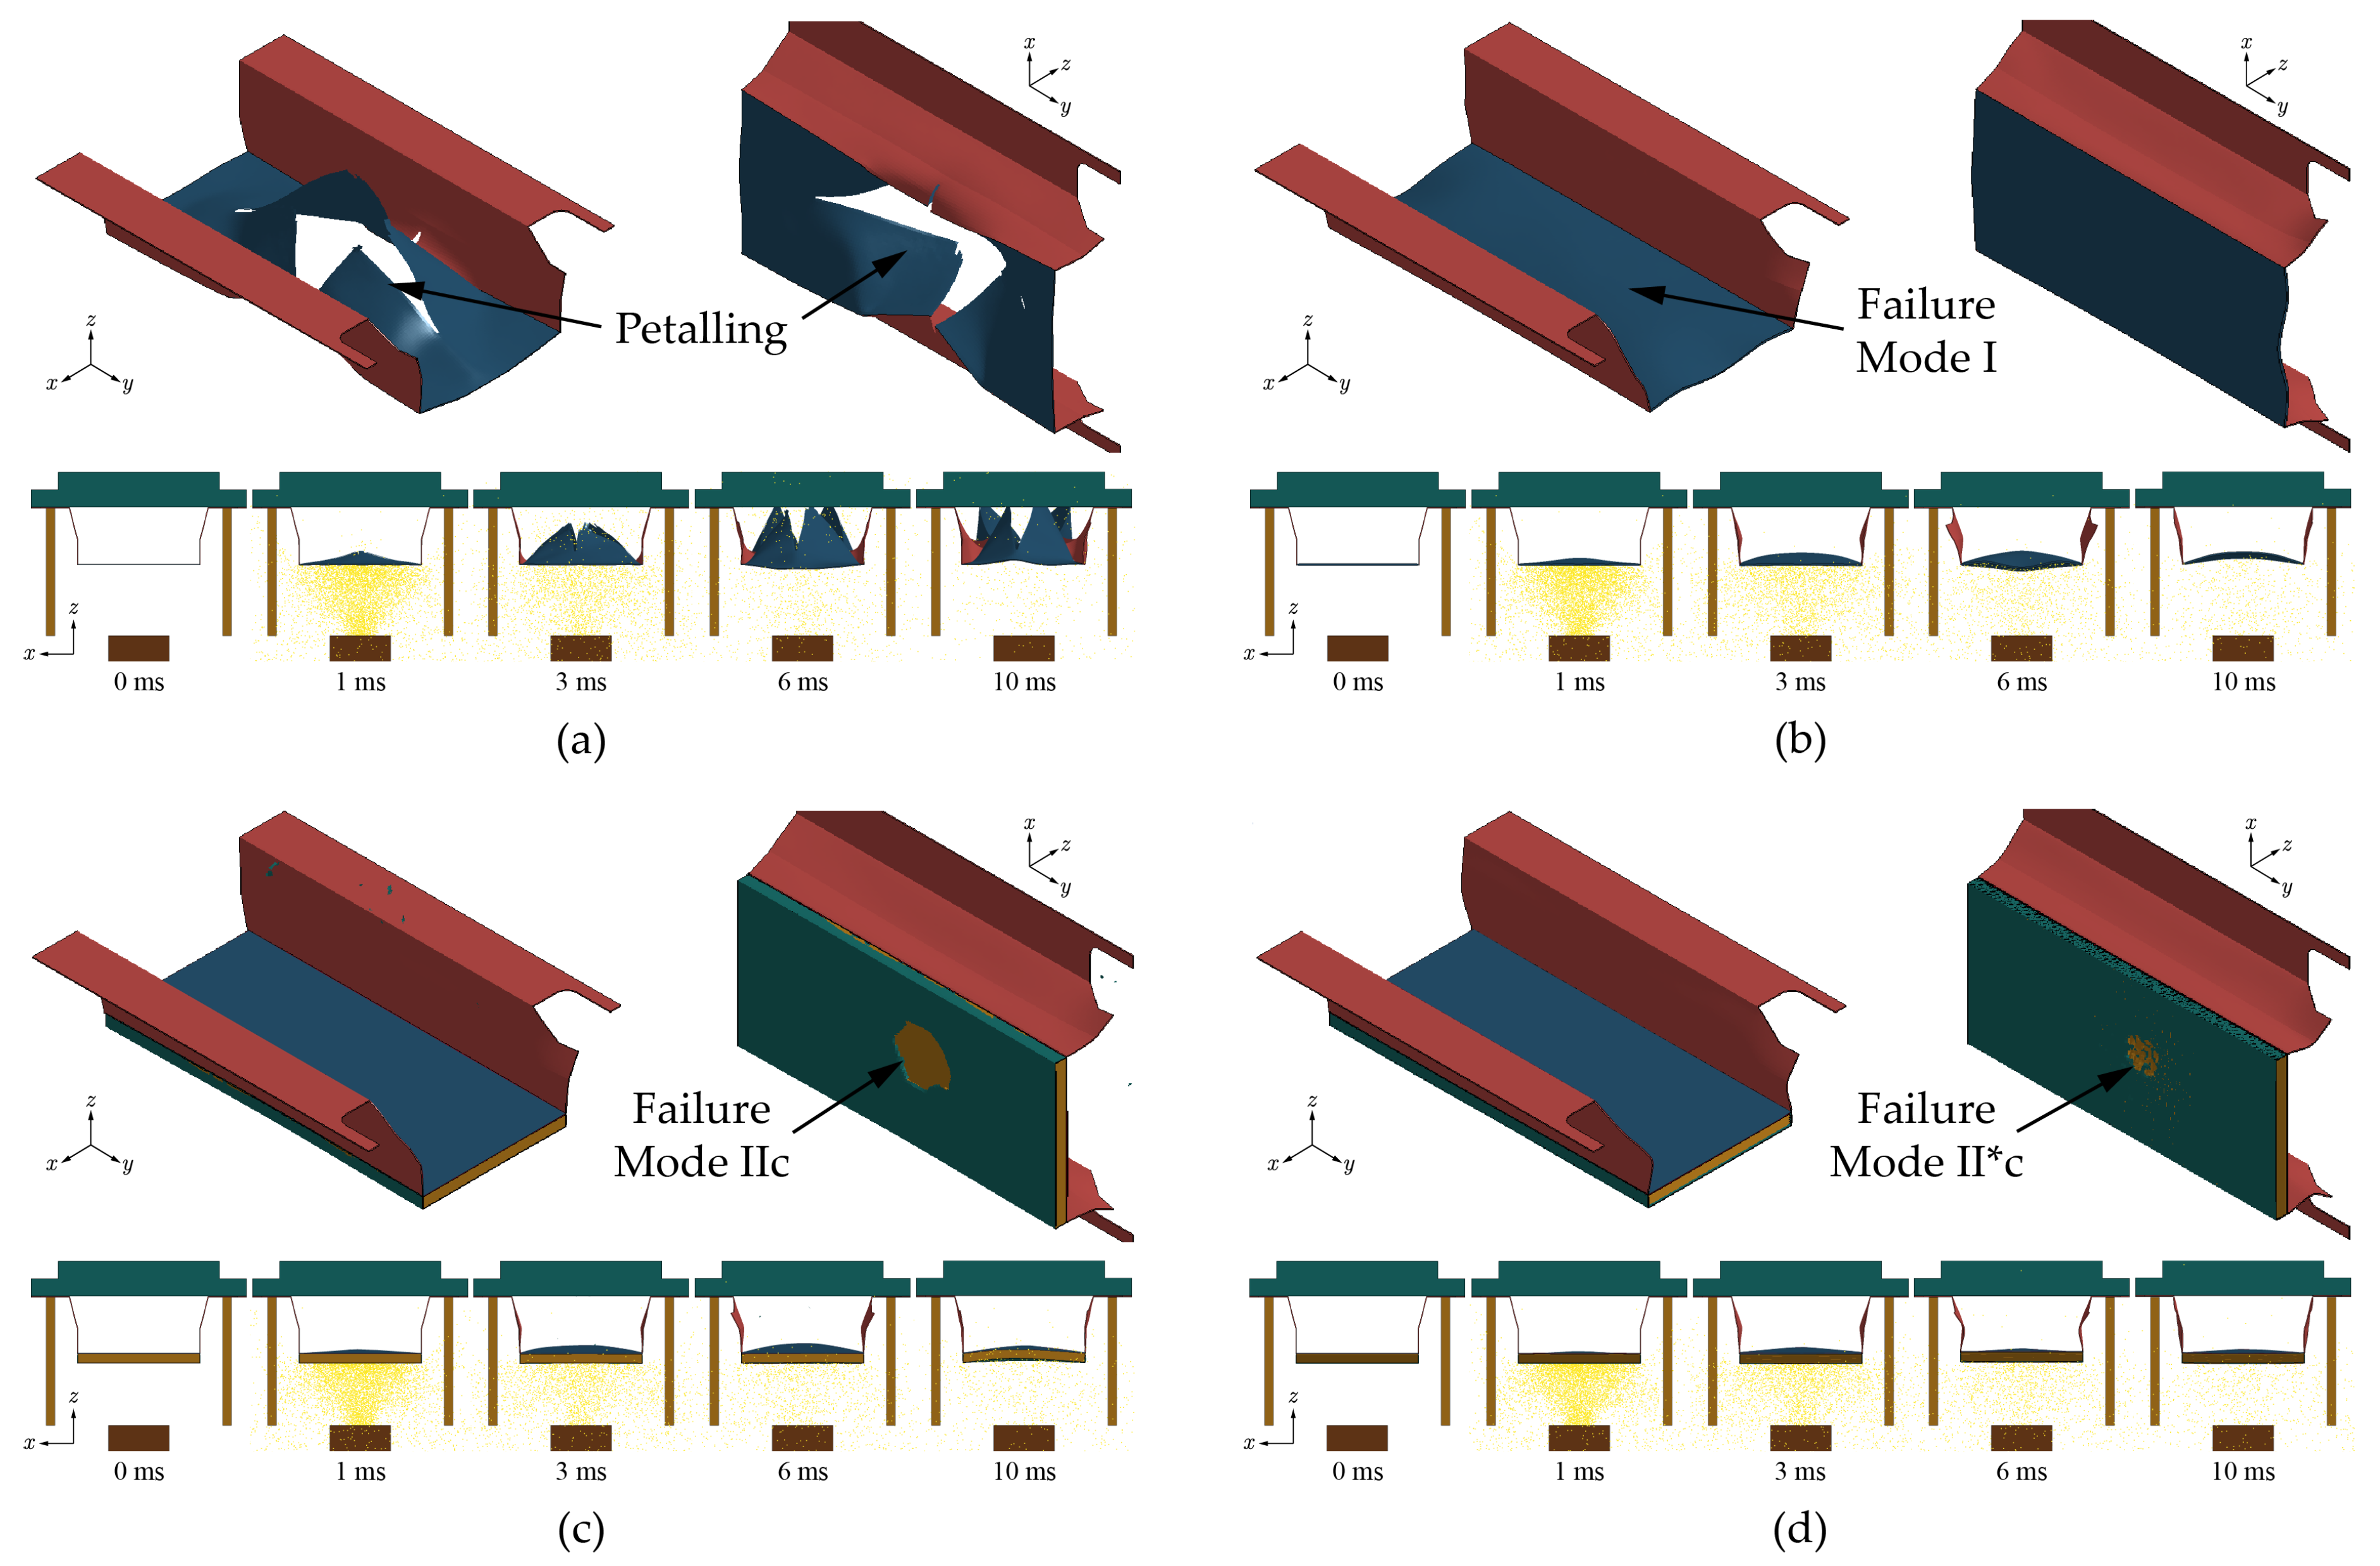
Figure 22.
Dynamic responses: (a) displacement and (b) acceleration for different structure types.
Figure 23.
(a) EA and (b) SEA from each part of AFV sub-system for different structure types.

Table 1.
Geometry parameter definition for each auxetic geometry.
| Geometry | Independent Variable | Dependent Variable | Constraint |
|---|---|---|---|
| REH | , , , t | ||
| DAH | , , , t | ||
| SH | , , , t | ||
| CH | , , r, t | ||
Table 2.
Modified J-C parameters of 304 stainless steel.
| E | A | B | n | C | m | |||||||
|---|---|---|---|---|---|---|---|---|---|---|---|---|
| (GPa) | (-) | (kg/m3) | (MPa) | (MPa) | (-) | (s-1) | (-) | (K) | (K) | (-) | (J/kg.K) | (-) |
| 200 | 0.3 | 7900 | 310 | 1872 | 0.96 | 0.001 | 0.016 | 293 | 1673 | 1 | 500 | 0.9 |
Table 3.
High explosive burn material and JWL EOS parameter of TNT [55].
Table 3.
High explosive burn material and JWL EOS parameter of TNT [55].
| A | B | ||||||||
|---|---|---|---|---|---|---|---|---|---|
| (kg/m3) | (m/s) | (GPa) | (GPa) | (GPa) | (-) | (-) | (-) | (MJ/m3) | (-) |
| 1630 | 6930 | 21 | 371.2 | 3.231 | 4.15 | 0.95 | 0.3 | 7000 | 1 |
Table 4.
The of various air blast model and experimental results [6].
Table 4.
The of various air blast model and experimental results [6].
| SoD | Exp. | CONWEP | SPH | MMALE | |||
| Sim. | Err. | Sim. | Err. | Sim. | Err. | ||
| (mm) | (mm) | (mm) | (%) | (mm) | (%) | (mm) | (%) |
| 150 | 17 | 17.81 | 4.76 | 17.75 | 4.21 | 17.41 | 2.31 |
| 200 | 12.7 | 14.77 | 16.30 | 14.23 | 10.36 | 12.54 | -1.12 |
| 250 | 11.3 | 11.23 | -0.62 | 11.42 | 1.07 | 10.27 | -9.02 |
Table 5.
The results of numerical and experimental results [14] for trapezoidal corrugated-core sandwich panels.
Table 5.
The results of numerical and experimental results [14] for trapezoidal corrugated-core sandwich panels.
| Specimen | Front Sheet | Back Sheet | ||||
| Exp. | Sim. | Err. | Exp. | Sim. | Err. | |
| (mm) | (mm) | (%) | (mm) | (mm) | (%) | |
| TZ-2 | 28.81 | 27.97 | -2.92 | 14.14 | 15.19 | 7.43 |
| TZ-4 | 34.33 | 30.89 | -10.02 | 19.81 | 18.37 | -7.27 |
| TZ-5 | 25.35 | 24.00 | -5.33 | 11.47 | 11.39 | -0.70 |
| TZ-6 | 29.55 | 27.65 | -6.43 | 16.17 | 16.46 | 1.79 |
| TZ-7 | 26.77 | 26.86 | 0.34 | 13.33 | 14.02 | 5.18 |
| TZ-8 | 31.07 | 29.49 | -5.09 | 17.15 | 17.15 | -0.06 |
| TZ-9 | 26.94 | 26.09 | -3.16 | 13.00 | 13.81 | 6.23 |
| TZ-10 | 29.90 | 28.13 | -5.92 | 16.49 | 17.64 | 6.97 |
| TZ-11 | 27.37 | 25.71 | -6.07 | 13.91 | 14.38 | 3.38 |
| TZ-12 | 23.98 | 23.49 | -2.04 | 16.23 | 17.65 | 8.75 |
| TZ-13 | 35.72 | 34.53 | -3.33 | 11.26 | 11.07 | -1.69 |
Table 6.
Design constraint of each auxetic model for MOOP.
| Geometry | Design Constraint |
|---|---|
| REH | |
| DAH | |
| SH | |
| CH |
Table 7.
Error parameter of all auxetic metamodel.
| Geometry | SEA | |||||
|---|---|---|---|---|---|---|
| MAX | MSE | MAX | MSE | |||
| (mm) | (mm2) | (-) | (J/g) | (J2/g2) | (-) | |
| REH | 3.059 | 0.713 | 0.991 | 0.418 | 0.009 | 0.996 |
| DAH | 3.307 | 0.684 | 0.994 | 0.302 | 0.006 | 0.997 |
| SH | 4.524 | 1.188 | 0.992 | 0.250 | 0.006 | 0.997 |
| CH | 4.309 | 1.779 | 0.982 | 0.498 | 0.012 | 0.996 |
Table 8.
Design variables and blastworthy performances of some selected design point for all auxetic geometry.
Table 8.
Design variables and blastworthy performances of some selected design point for all auxetic geometry.
| Geometry | Type | t | SEA | |||||||||
|---|---|---|---|---|---|---|---|---|---|---|---|---|
| Pred. | Sim. | Err. | Pred. | Sim. | Err. | |||||||
| (-) | (-) | (/mm) | (mm) | (-) | (mm) | (mm) | (%) | (J/g) | (J/g) | (%) | ||
| REH | Baseline | 15 | 4 | 30.0 | 1.00 | 0.115 | 27.50 | 27.64 | -0.51 | 2.13 | 2.06 | 3.40 |
| Ideal min | 25 | 6 | 45.3 | 1.99 | 0.434 | 10.07 | 8.32 | 21.03 | 0.20 | 0.22 | -9.09 | |
| Ideal max SEA | 5 | 2 | 0.1 | 0.54 | 0.022 | 49.96 | 50.89 | -1.83 | 8.52 | 8.58 | -0.70 | |
| Compromised | 19 | 2 | 26.3 | 0.53 | 0.059 | 31.83 | 33.99 | -6.35 | 3.98 | 4.08 | -2.45 | |
| Optimized | 9 | 3 | 61.5 | 1.63 | 0.203 | 18.58 | 17.92 | 3.68 | 1.40 | 1.19 | 17.65 | |
| DAH | Baseline | 15 | 4 | 30.0 | 1.00 | 0.123 | 30.39 | 33.12 | -8.24 | 2.25 | 2.32 | -3.02 |
| Ideal min | 23 | 6 | 0.1 | 2.00 | 0.310 | 3.16 | 2.93 | 7.85 | 0.64 | 0.63 | 1.59 | |
| Ideal max SEA | 6 | 2 | 2.6 | 0.5 | 0.024 | 48.88 | 49.51 | -1.27 | 8.58 | 8.56 | 0.23 | |
| Compromised | 25 | 2 | 0.1 | 0.68 | 0.070 | 31.56 | 33.90 | -6.90 | 3.66 | 3.43 | 6.71 | |
| Optimized | 15 | 5 | 0.1 | 1.72 | 0.205 | 10.24 | 9.76 | 4.92 | 1.29 | 1.31 | -1.53 | |
| SH | Baseline | 15 | 4 | 17.0 | 1.00 | 0.115 | 34.85 | 35.41 | -1.58 | 2.44 | 2.39 | 2.09 |
| Ideal min | 20 | 6 | 16.1 | 2.00 | 0.328 | 11.33 | 11.78 | -3.82 | 0.72 | 0.65 | 10.77 | |
| Ideal max SEA | 13 | 2 | 1.1 | 0.51 | 0.032 | 49.89 | 50.25 | -0.72 | 7.42 | 7.59 | -2.24 | |
| Compromised | 25 | 2 | 0.6 | 0.89 | 0.081 | 32.76 | 33.77 | -2.99 | 3.69 | 3.57 | 3.36 | |
| Optimized | 15 | 5 | 0.3 | 1.86 | 0.207 | 14.94 | 14.42 | 3.61 | 1.25 | 1.29 | -3.10 | |
| CH | Baseline | 15 | 4 | 5.0 | 1.00 | 0.091 | 38.51 | 38.95 | -1.13 | 3.17 | 3.12 | 1.60 |
| Ideal min | 25 | 6 | 6.3 | 2.00 | 0.346 | 14.64 | 11.81 | 23.96 | 0.42 | 0.53 | -20.75 | |
| Ideal max SEA | 17 | 2 | 2.1 | 0.62 | 0.034 | 49.92 | 49.91 | 0.02 | 6.93 | 6.92 | 0.14 | |
| Compromised | 18 | 3 | 14.5 | 0.66 | 0.072 | 32.57 | 34.33 | -5.13 | 3.61 | 3.53 | 2.27 | |
| Optimized | 18 | 3 | 14.6 | 1.88 | 0.206 | 18.87 | 15.44 | 22.22 | 1.62 | 1.28 | 26.56 | |
Table 9.
The blastworthiness parameter of AFV sub-system without and with several types of protective structures.
Table 9.
The blastworthiness parameter of AFV sub-system without and with several types of protective structures.
| Parameter | Single Plate | Optimized AFSP | Optimized ASP DAH |
|---|---|---|---|
| Max. displ. (mm) | 156.56 | 110.40 | 67.34 |
| (56.99%*/39.00%**) | |||
| SEA (J/g) | 0.60 | 1.76 | 2.61 |
| (335.00%*/48.30%**) | |||
| Max. acc. (1000G) | 118.01 | 99.20 | 55.99 |
| (52.55%*/43.56%**) |
*Improvement of optimized ASP DAH with respect to single plate. **Improvement of optimized ASP DAH with respect to optimized AFSP.
Disclaimer/Publisher’s Note: The statements, opinions and data contained in all publications are solely those of the individual author(s) and contributor(s) and not of MDPI and/or the editor(s). MDPI and/or the editor(s) disclaim responsibility for any injury to people or property resulting from any ideas, methods, instructions or products referred to in the content. |
© 2024 by the authors. Licensee MDPI, Basel, Switzerland. This article is an open access article distributed under the terms and conditions of the Creative Commons Attribution (CC BY) license (http://creativecommons.org/licenses/by/4.0/).
Copyright: This open access article is published under a Creative Commons CC BY 4.0 license, which permit the free download, distribution, and reuse, provided that the author and preprint are cited in any reuse.


