
Submitted:
08 October 2024
Posted:
09 October 2024
You are already at the latest version
Abstract
Traditional disease severity monitoring is subjective and inefficient. This study employs a Parrot multispectral sensor mounted on an unmanned aerial vehicle (UAV) to apply machine learning algorithms, such as Random Forest, for categorizing defoliation levels in R7-stage soybean plants. The research assesses the effectiveness of vegetation indices, spectral bands, and relative vegetation cover as input parameters, demonstrating that machine learning approaches combined with multispectral imagery can provide a more accurate and efficient assessment of Asian soybean rust in commercial soybean fields. The Random Forest algorithm exhibited satisfactory classification performance when compared to recent studies, achieving accuracy, precision, recall, F1-score, specificity and AUC values of 0.94, 0.92, 0.92, 0.92, 0.97 and 0.97, respectively. The input variables identified as most important for the classification model were the WDRVI and MPRI indices, the RedEdge and NIR bands, and relative vegetation cover, with the highest Gini importance index.
Keywords:
asian rust
; random forest
; aerial images
; multiline
1. Introduction
Asian soybean rust, caused by the fungus Phakopsora pachyrhizi, is characterized by reddish-brown spots on the adaxial surface of leaves. These lesions are directly linked to reduced photosynthetic activity, resulting from the progression of fungal colonization in leaf tissues. In more advanced stages, the disease triggers foliar abscission as a plant defense mechanism [1]. The adverse effects of this phytopathological issue are substantial, with yield losses that can reach up to 80% in affected crops [2].
Traditionally, soybean rust monitoring is conducted using diagrammatic scales to assist in quantifying defoliation levels in the field. However, visual assessments are time-consuming, labor-intensive, prone to subjectivity, and require skilled professionals [3]. To improve the efficiency of rust severity monitoring, high-throughput phenotyping (HTP) using sensors mounted on unmanned aerial vehicles (UAVs) has contributed to increased accuracy, precision, and operational efficiency [4].
Infection of leaf tissues by the pathogen alters the morphophysiological properties of the leaves, which can be detected by imaging sensors. Changes in canopy reflectance are due to alterations in leaf pigment content, cellular structure, chemical composition, and water content, which are effectively captured by the visible (VIS) (400 nm to 700 nm) and near-infrared (NIR) (700 nm to 1000 nm) spectral regions [5,6].
Previous studies have employed UAVs equipped with red-green-blue (RGB) sensors [7] and multispectral sensors [8] to estimate crop canopy structure characteristics. Many regression techniques, such as traditional linear regression, may encounter challenges when dealing with complex datasets and multicollinearity among predictor variables [9]. In contrast, machine learning-based regression algorithms, such as Random Forest (RF), offer more accurate models and are specifically designed to address complex interactions, making them effective for estimating key agronomic parameters in various crops [10,11,12].
In this context, vegetation indices derived from UAV imagery, combined with machine learning algorithms, were employed to classify defoliation levels caused by soybean rust. The objectives of this study were: (1) to classify defoliation levels in soybean plants affected by rust using machine learning, and (2) to assess the potential of vegetation indices, individual spectral bands, and relative vegetation cover as input parameters for the Random Forest algorithm.
2. Materials and Methods
2.1. Study Area and expe#rimental Design
The experiment was conducted across three environments during the 2020/2021 agricultural season at the following locations: (a) the Scientific and Technological Development Center in Agriculture (Muquém Farm) of the Federal University of Lavras, Lavras, Minas Gerais, Brazil, at an average altitude of 950 meters (21°12'11" S, 44°58'47" W); (b) the Development and Technology Transfer Center of the Federal University of Lavras, in Ijaci, Minas Gerais, Brazil, at an average altitude of 845 meters (21°9'51.94" S, 44°55'6.17" W); and (c) the Center for Science, Technology, and Engineering of Rehagro Research, Nazareno, Minas Gerais, Brazil, at an altitude of 1003 meters (21°15'32" S, 44°30'56" W). The experimental region falls under the Cwa climate classification (Figure 1), characterized as subtropical with dry winters and hot summers [13].
The experiment was conducted under a no-till system, with 0.50 m row spacing. Six INOX® technology soybean cultivars, along with a multiline— a genotype mixture with greater population homeostasis— and one susceptible cultivar were used (Table 1). For the multiline sowing, three seeds of each INOX® cultivar were mixed, totaling 18 seeds per linear meter.
The experimental design was a randomized complete block design, arranged in split-plots, 4 x 8 (four fungicide application management strategies and seven cultivars plus one multiline) with three replications. The number of fungicide applications was implemented in the plots, and the cultivars were assigned to the subplots (Table S1).
The experimental plots measured 4 x 5 meters, with 0.5 meters of row spacing and 18 seeds per meter. The two central rows were considered the useful area of the plots. Sowing was carried out manually under a no-till system in the first half of December 2020, and harvest occurred in March 2021. After sowing, inoculation was performed in the furrow using Bradyrhizobium japonicum at a rate of 18 mL of active ingredient per kilogram of seed, with SEMIA 5079 and 5080 strains, containing 10.8 x 10⁶ colony-forming units (CFU) per seed of Nitragin Cell Tech HC® inoculant (3 x 10⁹ CFU mL⁻¹).
A motorized backpack sprayer equipped with a boom and four XR 11002 spray nozzles, calibrated to apply a spray volume of 150 L ha⁻¹, was used for applications. Pest control was carried out as needed using insecticides from the neonicotinoid, pyrethroid, and chlorpyrifos chemical groups. Post-emergence weed control was performed with glyphosate at a rate of 2 L ha⁻¹. Only Fox Xpro® fungicide (trifloxystrobin; prothioconazole; bixafen) was applied at the recommended rate of 0.4 L of active ingredient per hectare. The sprayer used for fungicide application was a motorized backpack sprayer equipped with a boom and four XR 11002 nozzles spaced 50 cm apart, calibrated for a flow rate of 150 L ha⁻¹. The recommended adjuvant for the fungicide was added at the manufacturer’s suggested rate during application.
2.2. Phenotypic Data Collection
Defoliation of the plots was assessed by a single evaluator using the diagrammatic scale developed by [14]. This scale provides visual reference points for estimating the extent of leaf loss or defoliation in the plants. By comparing the observed defoliation with the reference images on the diagrammatic scale, an estimate of the defoliation level in each plot was determined. Data collection also involved assessing grain yield, which was measured by harvesting the plots. After standardizing the grain moisture content to 13%, yield was estimated in kg ha⁻¹ by converting the area of each plot.
2.3. Aerial Image Acquisition and Processing
The images were captured using a Matrice 100 UAV (SZ DJI Technology Co., Shenzhen, China) equipped with a Parrot Sequoia multispectral sensor (Parrot Drones SAS, Paris, France). The Sequoia sensor allows for data collection in four spectral bands: green (550 nm), red (660 nm), red edge (735 nm), and near-infrared (NIR, 790 nm). These four-band images have a resolution of 1.2 megapixels and a radiometric resolution of 16 bits.
The aerial surveys were synchronized with the field phenotypic assessments and conducted between 10:00 AM and 1:00 PM. All flight missions were performed at an altitude of 40 meters and at an approximate speed of 5 m/s. The images had a ground sampling distance (GSD) of 0.85 cm per pixel, incorporating 80% front overlap and 70% side overlap. The flight paths were automatically generated using Pix4D Capture software (Version 4.13.1, Pix4d SA, Prilly, Switzerland).
Four ground control points (GCPs) were strategically positioned in the study area to ensure precise georeferencing of the images and improve the accuracy of crop information extraction [15]. The geographic coordinates of these points were obtained using GPS equipment, specifically the Spectra SP60 receiver (Spectra Geospatial, Trimble Inc., Sunnyvale, USA) operating in Real-Time Kinematic (RTK) mode.
Multispectral images were collected on March 23, 2021, corresponding to the R7 phenological stage. These images were processed using Photoscan Professional software (Version 1.2.4, Agisoft LLC, St. Petersburg, Russia), following a systematic workflow that included image alignment, dense point cloud generation, and orthomosaic development for each field phenotypic assessment date. Vegetation indices were extracted from the Parrot sensor’s multispectral images using QGIS software (Version 3.16.1, QGIS Development Team, Trondheim, Norway). The segmentation of soil and vegetation portions in the orthomosaic was performed using a supervised classification approach with the Dzetsaka Classification Tool plugin in QGIS.
To minimize edge effects on plant reflectance, a 0.5-meter negative buffer was applied within each plot. The selection of these vegetation indices (Table 2) was driven by their established correlation with key crop biophysical characteristics, including biomass, canopy health, and chlorophyll content [16].
2.4. Statistical Data Analysis and Model Evaluation
The phenotypic data obtained from the experiments were individually subjected to descriptive and exploratory analysis, treatment of potential outliers, normality testing using the [23], and homoscedasticity testing using [24]. Classification using the training samples was based on the separation of the reflectance spectrum. The values of vegetation indices (NDVI, NDRE, GNDVI, WDRVI, MPRI, and CIrededge), individual spectral bands (red, green, red-edge, and NIR), and the relative vegetation cover extracted from the orthomosaic (Equation 1) were used as inputs for the machine learning algorithm. This was followed by evaluating the performance of the Random Forest (RF) algorithm in estimating and classifying the level of defoliation caused by Asian soybean rust.
Vegetation cover = ((pixel count in plot * pixel size) * 100) / plot area,
For RF classification, the number of decision trees (Ntree) was set to 250, and the number of variables to be tested (Mtry) was defined as the square root of the number of input variables. Additionally, the Gini index was used to assess the importance of each input variable in the classification process. According to the Mean Decrease in Gini analysis, variables with nodes that exhibit higher classification purity are assigned higher values, thus indicating greater importance within the widely used classification algorithm [25].
For the RF model, the K-fold cross-validation technique was applied to ensure that the dataset was equally compared across different subsets, allowing for more accurate estimation and reducing the risk of overfitting. The K-fold technique randomly divides the data into K equally sized subsets [26]. In this study, training was performed K times (five), each on a different subset of the data. Data normalization, using the StandardScaler method, was applied to transform variables with widely disparate values into the same scale and value distribution. The goal was to ensure that all variables contributed equally to model development and to minimize dominance between variables [27].
The performance of the algorithm and the quality of classification of defoliation levels were evaluated using statistical metrics such as accuracy, precision, recall, F1-score, specificity and AUC. The machine learning algorithm was implemented using the R programming environment (Version 4.3.3, R Core Team).
3. Results
The Pearson correlation analysis (Figure 2) revealed that the strongest correlations were observed between vegetation cover, spectral bands (NIR, RedEdge), and vegetation indices (WDRVI, NDVI, and MPRI), likely due to their close association with the physiological development of the crop (R7 growth stage). These indices were better correlated with the levels of defoliation caused by Asian soybean rust.
Furthermore, the correlation analysis between defoliation and vegetation indices can help identify patterns and distinctions between healthy plants and those undergoing defoliation, which could be valuable for monitoring and selecting rust-susceptible lines in breeding programs. The results indicated an inverse relationship between defoliation and the indices WDRVI, NDVI, MPRI, and GNDVI in plants affected by rust, suggesting that index values tend to decrease as defoliation severity increases.
The statistical metrics used to evaluate the performance of the RF-based model (Figure 3), such as accuracy, precision, recall, F1-score, specificity and AUC, allowed for reliable discrimination of the study classes. Precision values indicate how often the classifier correctly estimates the proposed classes, with values closer to 100% reflecting an excellent fit of the model to the target classes.
One key benefit is the ability to build a set of decision trees for the RF algorithm using the multispectral bands from the UAV's onboard sensor used in this study. The Random Forest classifier clearly demonstrated a high capacity to discriminate classes in the study area, which could be attributed to the limited number of analyzed classes (45%, 65%, 85%, and 100% defoliation), the study area size, and the phenotypic variability present in the field. However, some pixels were classified into erroneous classes, likely due to the pixel-by-pixel classification method. Despite this, all performance metrics for the tested algorithm fell within the acceptable range of classification excellence.
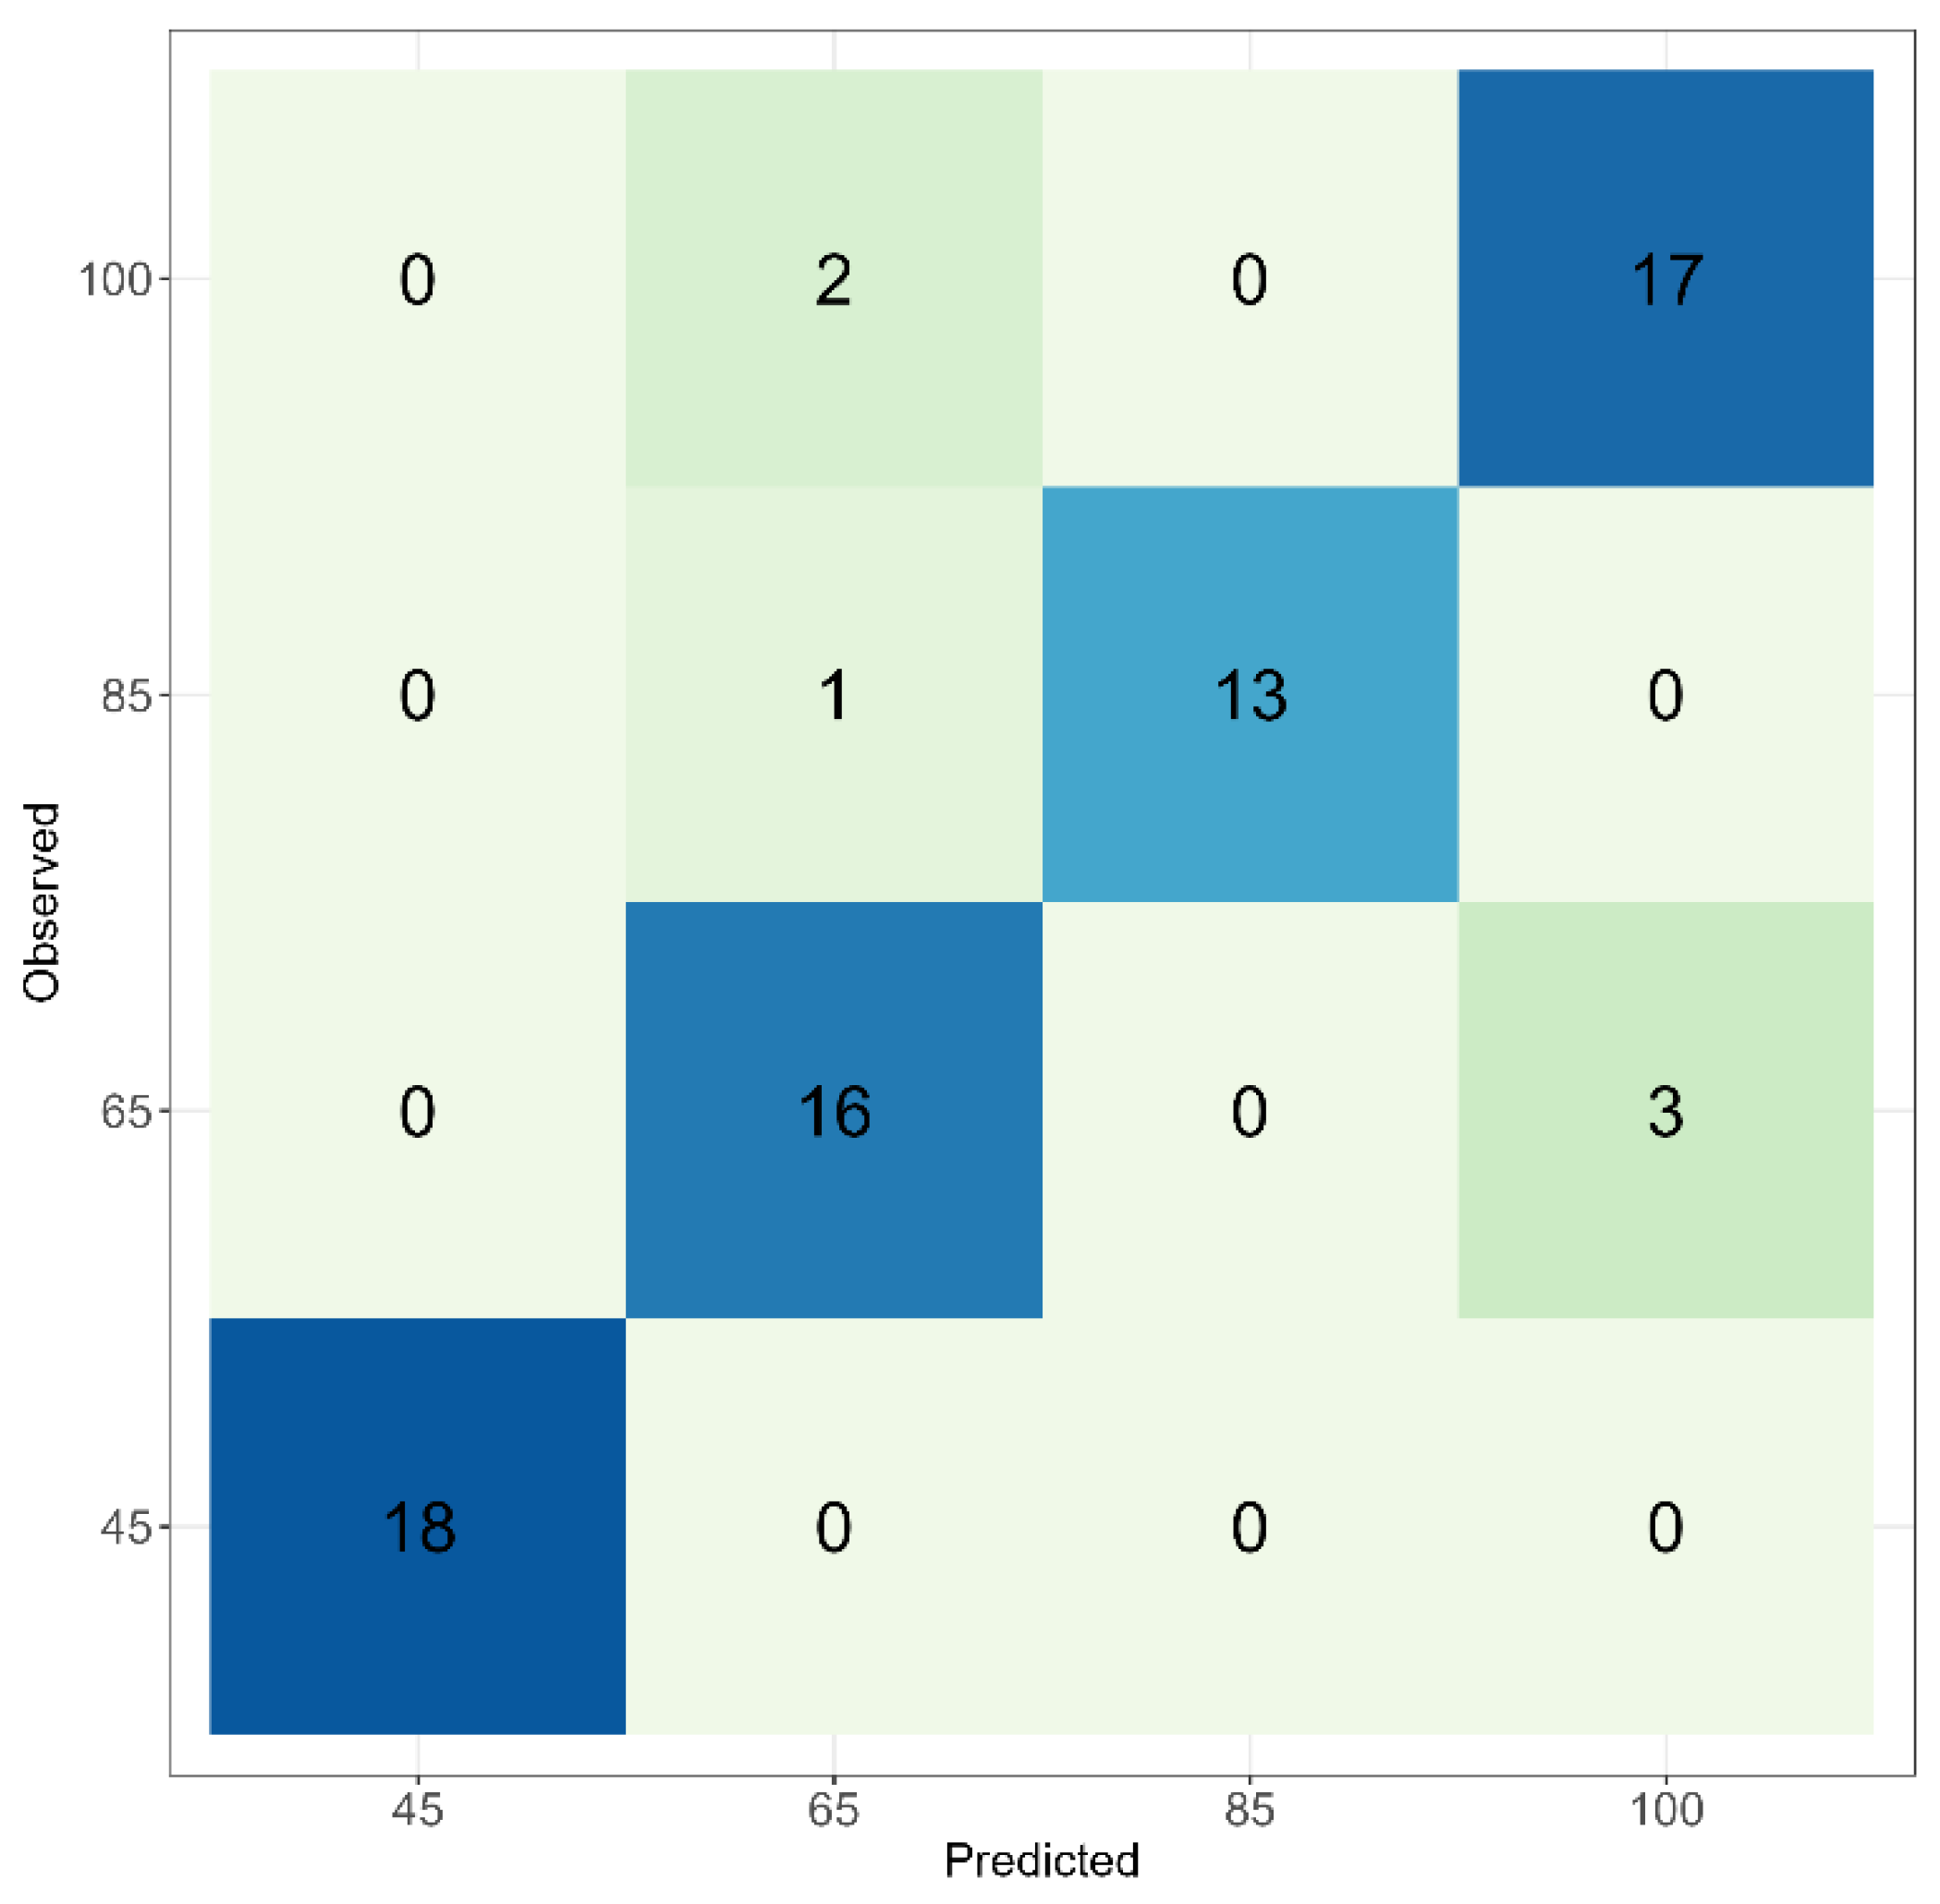
The classification algorithm results were validated using confusion matrices, as shown in Figure A1 for the RF algorithm. As indicated by the model's performance evaluation metrics, few classification errors were observed between the thematic classes. For class 45, there were 18 correct predictions. In class 65, 16 correct predictions were noted, along with two incorrect predictions: one assigned to class 85 and two to class 100. For class 85, 13 correct predictions were made and no wrong prediction. Lastly, for class 100, the analysis showed 17 correct predictions and three misclassifications, with three assigned to class 65.
The classification model demonstrated satisfactory overall performance, with relatively high precision and recall across all classes. However, some misclassifications were observed, particularly between classes 65, 85 and 100. By employing the RF classifier and the Gini index, it was possible to describe the importance of each variable in the classification process (Figure 4). In this study, relative vegetation cover emerged as the most significant predictor. Among vegetation indices, WDRVI and MPRI were the most important, while the CIrededge index had the least importance in the proposed classification. Spectral bands such as red-edge and NIR were crucial for classification, whereas the green band had the least importance.
The multidimensional scaling (MDS) coordinates of the proximity matrix generated by the Random Forest model are presented in Figure 5. These coordinates allow for visualization of the similarity and dissimilarity between dataset observations, as clustered and classified by the RF algorithm. The clustering of points suggests the degree of similarity among the observations, and the color coding highlights the 45%, 65%, 85%, and 100% defoliation classes used in this study. This demonstrates the potential and applicability of the RF algorithm and UAV-based aerial imagery for classifying defoliation levels caused by Asian soybean rust in soybean plants.
The results obtained from the Random Forest (RF) algorithm indicate that the performance of this approach was satisfactory for differentiating the study classes. High values were observed for the evaluated performance metrics, including accuracy, precision, recall, F1-score, specificity and AUC. The accuracy values reported in this study reflect the frequency with which the classifier correctly estimates the classes. Values nearing 100% were noted, underscoring the excellent fit of the model to the proposed classes, as evidenced by the satisfactory performance metrics and the minimal errors observed among the thematic classes identified in the confusion matrix. Thus, based on the presented results, RF is regarded as a suitable classification algorithm for this study.
4. Discussion
In contrast, NDRE and CIrededge showed lower correlations compared to the other indices. This result differs from [28], who found that NDRE exhibited higher correlation values during the V5 and V6 growth stages. Canopy sensing using wavelengths in the red-edge and NIR regions improves sensor performance and can mitigate the saturation issues inherent to NDVI [16]. Relative vegetation cover demonstrated a stronger and inverse correlation with canopy defoliation, as this parameter was determined by counting pixels corresponding to crop biomass [29].
In recent years, the use of UAV imagery, satellite sensing, vegetation indices, and machine learning has gained prominence as a technology that reduces the need for destructive assessments, saving time and effort in monitoring crop growth rates [16,30,31]. Machine learning algorithms, particularly Random Forest (RF), when integrated with UAV aerial imagery, have emerged as promising tools for optimizing and enhancing efficiency in classifying defoliation levels in experimental fields, thereby aiding the selection of more robust cultivars.
Based on area under the ROC curve (AUC) quantifies the discriminative power of the model, with values above 90% considered excellent for this variable [32]. It is worth noting that misclassified pixels are expected whenever classification does not reach 100% accuracy; however, the high classification performance is evidenced by the satisfactory values of the evaluated performance metrics, both in the overall analysis and in class-specific analyses via the confusion matrix and Gini index. These tools help to understand the behavior of vegetation indices and spectral bands [33].
Random Forest-based models have been widely employed for selecting vegetation indices to estimate various agronomic traits in crops [34] due to their robustness against outliers, noise tolerance, generalization ability [25], and lower susceptibility to overfitting [10]. Recent studies have utilized UAV remote sensing with red-edge, NIR, green, and red spectral bands to calculate vegetation indices, extracting valuable information about leaf surface and canopy structure [35,36,37,38]. Similarly, the RF algorithm has been applied with multispectral imagery for estimating leaf area index [39] and predicting soybean plant height [40].
Numerous studies have employed UAVs as remote sensing platforms due to their advantages in flexibility, high spatio-temporal resolution, high overlap rate, low cost, and accessibility [41]. This study, therefore, proposed the extraction of spectral information from the soybean canopy using UAV-based orthomosaics during the R7 reproductive stage. It is important to highlight the significance of conducting aerial surveys at other phenological stages of soybean to build a more robust dataset, improve the quality of extracted information, and distribute more Ground Control Points (GCPs) within the study area, thereby minimizing model error and enhancing spatial accuracy [15].
Evaluating these metrics can provide insights into improving model performance, such as through hyperparameter tuning or applying data balancing techniques [42,43]. Additionally, using variable importance analysis via the mean decrease in Gini allows for an overview of how input variables behave during the classification process, identifying those with the highest and lowest importance. This study found that healthy plants exhibited higher average reflectance in the red-edge, NIR, green, and red spectral bands than plants affected by Asian soybean rust. The red-edge spectral band was particularly important in the RF algorithm’s classification process, as it is highly sensitive to chlorophyll concentration, allowing for significant absorption of incoming energy at the leaf's surface while reducing the high reflectance typically observed in the leaf's internal structure [19].
These findings are consistent with [44], who observed that canopy spectral response in the NIR region was lower in plants with a higher percentage of rust-affected leaves than in those with less infestation. Similarly, [6] reported that NIR reflectance was significantly higher in leaves more severely affected by rust, followed by leaves with 50% severity, while healthy leaves had the lowest reflectance.
Thus, higher reflectance, particularly in the NIR region, is closely related to vegetative vigor. When infection occurs, lesions form due to necrosis of leaf tissue, and each lesion may contain numerous pustules, primarily on the abaxial side of the leaf. The final stage of rust infection leads to widespread canopy yellowing and intense defoliation, reducing the photosynthetic rate [45] and consequently decreasing vigor and spectral response in the NIR band. Therefore, Asian soybean rust epidemics can be assessed through multispectral imagery, confirming the results of this study and aligning with previous research [43,46,47]. These findings highlight the importance of spectral bands in Random Forest classifications, as demonstrated by the Gini index (Figure 4).
The WDRVI vegetation index was used as a predictive variable in the model, with a weighting coefficient of 0.05. This choice was made due to its increased sensitivity to canopy structural variability, its reduction of soil saturation effects [35,48], and its linear relationships with indicators of plant growth and phenotypic changes [22].
Notably, in studies conducted by [16,33,43], the authors employed classification algorithms and achieved satisfactory parameter values for RF based on the analyzed performance metrics. It is also recommended that future research apply alternative classifiers and algorithms to achieve improved fits. The integration of these models into real-time monitoring systems can facilitate assertive and proactive decision-making. Models with strong interpretability are suggested to aid experimental fields and breeding programs in better understanding decision-making processes and selecting soybean lines tolerant to Asian rust.
5. Conclusions
This study demonstrated the feasibility of utilizing UAV-based multispectral imagery and machine learning algorithms to classify and predict defoliation levels in soybean plants caused by Asian rust. Additionally, the results indicate that UAV platforms provide a viable alternative for assessing defoliation in soybean cultivars, enabling researchers to leverage this technology for large-scale monitoring of Asian rust.
The Random Forest algorithm exhibited satisfactory classification performance when compared to recent studies, achieving accuracy, precision, recall, F1-score, specificity and AUC values of 0.94, 0.92, 0.92, 0.92, 0.97 and 0.97, respectively. The input variables identified as most important for the classification model were the WDRVI and MPRI indices, the RedEdge and NIR bands, and relative vegetation cover, with the highest Gini importance index.
Future studies could explore the potential of other machine learning algorithms and spectral information derived from multiple agricultural years and diverse environments to enhance and increase the robustness of the classification model.
Supplementary Materials
The following supporting information can be downloaded at the website of this paper posted on Preprints.org. Table S1. Number of fungicide applications used and soybean plant development stages.
Author Contributions
“Conceptualization, M.A.J.F. and A.T.B.; methodology, M.A.J.F.; software, M.A.J.F.; validation, M.A.J.F. and A.T.B; formal analysis, M.A.J.F. and A.T.B.; investigation, M.A.J.F., A.G.S.G.S. and N.J.D.V.; resources, A.T.B. and G.A.S.F.; data curation, M.A.J.F.; writing—original draft preparation, M.A.J.F.; writing—review and editing, M.A.J.F., A.G.S.G.S. and A.T.B.; visualization, M.A.J.F. and G.A.S.F.; supervision, A.T.B.; project administration, A.T.B.; funding acquisition, A.T.B. All authors have read and agreed to the published version of the manuscript.”
Funding
This research was funded by the National Council for Scientific and Technological Development (CNPq), Coordination of Improvement of Higher Education Personnel (CAPES), and the Minas Gerais Research Support Foundation (FAPEMIG).
Data Availability Statement
The data presented in this study are available on request from the corresponding author.
Acknowledgments
We would like to thank the Federal University of Lavras (UFLA) and the postgraduate program in Agronomy/Phytotechnics for supporting this study, to the National Council for Scientific and Technological Development (CNPq), to the Minas Gerais Research Support Foundation (FAPEMIG), and to the Coordination of Improvement of Higher Education Personnel (CAPES) for financial support.
Conflicts of Interest
The authors declare no conflicts of interest.
Appendix A
Figure A1.
Confusion matrix for the Random Forest machine learning algorithm.
References
- Hossain, Md.M.; Sultana, F.; Yesmin, L.; Rubayet, Md.T.; Abdullah, H.M.; Siddique, S.S.; Bhuiyan, Md.A.B.; Yamanaka, N. Understanding Phakopsora pachyrhizi in soybean: comprehensive insights, threats, and interventions from the asian perspective. Frontiers In Microbiology, v. 14, 2024. [CrossRef]
- Scherm, H.; Christiano, R.S.C.; Esker, P.D.; Ponte, E.M.del; Godoy, C.V. Quantitative review of fungicide efficacy trials for managing soybean rust in Brazil. Crop Protection, v. 28, n. 9, p. 774-782, 2009. [CrossRef]
- Yang, W.; Feng, H.; Zhang, X.; Zhang, J.; Doonan, J.H.; Batchelor, W.D.; Xiong, L.; Yan. Crop Phenomics and High-Throughput Phenotyping: past decades, current challenges, and future perspectives. Molecular Plant, v. 13, n. 2, p. 187-214, 2020. [CrossRef]
- Lane, H.M.; Murray, S.C. High throughput can produce better decisions than high accuracy when phenotyping plant populations. Crop Science, v. 61, n. 5, p. 3301-3313, 2021. [CrossRef]
- Negrisoli, M.M.; Negrisoli, R.; Silva, F.; Lopes, L.S.; Souza Júnior, F.S.; Velini, E.D.; Carbonari, C.A.; Rodrigues, S.A.; Raetano, C.G. Soybean rust detection and disease severity classification by remote sensing. Agronomy Journal, v. 114, n. 6, p. 3246-3262, 2022. [CrossRef]
- Santana, D.C.; Otone, J.D.Q.; Baio, F.H.R.; Teodoro, L.P.R.; Alves, M.E.M.; Silva Junior, C.A.; Teodoro, P.E. Machine learning in the classification of asian rust severity in soybean using hyperspectral sensor. Spectrochimica Acta Part A: Molecular and Biomolecular Spectroscopy, v. 313, p. 124113, 2024. [CrossRef]
- Gilliot, J. M.; Michelin, J.; Hadjard, D.; Houot, S. An accurate method for predicting spatial variability of maize yield from UAV-based plant height estimation: a tool for monitoring agronomic field experiments. Precision Agriculture, v. 22, n. 3, p. 897-921, 2020. [CrossRef]
- Osco, L.P.; Marcato Junior, J.; Ramos, A.P.M.; Furuya, D.E.G.; Santana, D.C.; Teodoro, L.P.R.; Gonçalves, W.N.; Baio, F.H.R.; Pistori, H.; Silva Junior, C.A.da; Teodoro, P.E. Leaf Nitrogen Concentration and Plant Height Prediction for Maize Using UAV-Based Multispectral Imagery and Machine Learning Techniques. Remote Sensing, v. 12, n. 19, p. 3237, 2020. [CrossRef]
- Li, M.; Zhao, J.; Yang, X. Building a new machine learning-based model to estimate county-level climatic yield variation for maize in Northeast China. Computers And Electronics In Agriculture, v. 191, 2021. [CrossRef]
- Liu, B.; Liu, Y.; Huang, G.; Jiang, X.; Liang, Y.; Yang, C.; Huang, L. Comparison of yield prediction models and estimation of the relative importance of main agronomic traits affecting rice yield formation in saline-sodic paddy fields. European Journal of Agronomy, v. 148, 2023. [CrossRef]
- Luo, S.; Liu, W.; Zhang, Y.; Wang, C.; Xi, X.; Nie, S.; Ma, D.; Lin, Y.; Zhou, G. Maize and soybean heights estimation from unmanned aerial vehicle (UAV) LiDAR data. Computers And Electronics In Agriculture, v. 182, 2021. [CrossRef]
- Rodriguez-Puerta, F.; Ponce, R.A.; Pérez-Rodríguez, F.; Águeda, B.; Martín-García, S.; Martínez-Rodrigo, R.; Lizarralde, I. Comparison of Machine Learning Algorithms for Wildland-Urban Interface Fuelbreak Planning Integrating ALS and UAV-Borne LiDAR Data and Multispectral Images. Drones, v. 4, n. 2, p. 21, 2020. [CrossRef]
- Köppen, W. Climatologia: con un estudio de los climas de la tierra. México: Fondo de Cultura Economica, 1948. 478 p.
- Hirano, M.; Hikishima, M.; Silva, A. J.; Xavier, S. A.; Canteri, M. G. Validação de escala diagramática para estimativa de desfolha provocada pela ferrugem asiática em soja. Summa Phytopathologicav. 36, n. 3, p. 248-250, 2010. [CrossRef]
- He, F.; Zhou, T.; Xiong, W.; Hasheminnasab, S.; Habib, A. Automated Aerial Triangulation for UAV-Based Mapping. Remote Sensing, v. 10, n. 12, p. 1952, 2018. [CrossRef]
- Ferraz, M.A.J.; Barboza, T.O.C.; Arantes, P.deS.; Von Pinho, R.G.; Santos, A.F. Integrating Satellite and UAV Technologies for Maize Plant Height Estimation Using Advanced Machine Learning. Agriengineering, v. 6, n. 1, p. 20-33, 2024. [CrossRef]
- Rouse, J.W.; Haas, R.H.; Scheel, J.A.; Deering, D.W. Monitoring vegetation systems in the great plains with ERTS. In Proceedings of the Third Earth Resource Technology Satellite (ERTS) Symposium, Washington, DC, USA, 10–14, 1974.
- Gitelson, A.A.; Merzlyak, M.N. Quantitative estimation of chlorophyll-a using reflectance spectra: experiments with autumn chestnut and maple leaves. Journal Of Photochemistry and Photobiology B: Biology, v. 22, n. 3, p. 247-252, 1994. [CrossRef]
- Gitelson, A.A.; Merzlyak, M.N. Signature Analysis of Leaf Reflectance Spectra: algorithm development for remote sensing of chlorophyll. Journal Of Plant Physiology, v. 148, n. 3-4, p. 494-500, 1996. [CrossRef]
- Gitelson, A.A. Wide dynamic range vegetation index for remote quantification of biophysical characteristics of vegetation. JouANNl Plant Physiology, v.161, p.165-173, 2004. [CrossRef]
- Yang, Z.; Willis, P.; Mueller, R. Impact of Band-Ratio Enhanced AWIFS Image to Crop Classification Accuracy. 2008. Available online: https://www.asprs.org/a/publications/proceedings/pecora17/0041.pdf. (accessed on 10 April 2024).
- Gitelson, A.A.; Viña, A.; Arkebauer, T.J.; Rundquist, D.C.; Keydan, G.; Leavitt, B. Remote estimation of leaf area index and green leaf biomass in maize canopies. Geophysical Research Letters, v. 30, n. 5, 2003. [CrossRef]
- Shapiro, S.S.; Wilk, M.B. Na analysis of variance test for normality (complete sample). Biometrika, GreatBritain, v.52, n.3, p.591-611, 1965.
- Bartlett, M. S. Properties of sufficiency and statistical tests. Proceedings of the Royal Society of London, serie A, London, 160:268-282, 1937. [CrossRef]
- Breiman, L. Random Forests. Machine Learning, v. 45, n. 1, p. 5-32, 2001. Springer Science and Business Media LLC. [CrossRef]
- Phinzi, K.; Abriha, D.; Szabó, S. Classification Efficacy Using K-Fold CrossValidation and Bootstrapping Resampling Techniques on the Example of Mapping Complex Gully Systems. Remote Sensing, v. 13, n. 15, p. 2980, 2021. [CrossRef]
- Zamri, N.; Pairan, M.A.; Azman, W.N.A.W.; Abas, S.S.; Abdullah, L.; Naim, S.; Tarmudi, Z.; Gao, M. A comparison of unsupervised and supervised machine learning algorithms to predict water pollutions. Procedia Computer Science, v. 204, p. 172-179, 2022. [CrossRef]
- Carneiro, F.M.; Furlani, C.E.A.; Zerbato, C.; Menezes, P.C.de; Gírio, L.A.S.; Oliveira, M.F.de. Comparison between vegetation indices for detecting spatial and temporal variabilities in soybean crop using canopy sensors. Precision Agriculture, v. 21, n. 5, p. 979-1007, 2019. [CrossRef]
- Li, X.; Xu, X.; Xiang, S.; Chen, M.; He, S.; Wang, W.; Xu, M.; Liu, C.; Yu, L.; Liu, W.; Yang, W. Soybean leaf estimation based on RGB images and machine learning methods. Plant Methods, v. 19, n. 1, 2023. [CrossRef]
- Liu, W.; Li, Y.; Liu, J.; Jiang, J. Estimation of Plant Height and Aboveground Biomass of Toona sinensis under Drought Stress Using RGB-D Imaging. Forests, v. 12, n. 12, p. 1747, 2021. [CrossRef]
- Rueda-Ayala, V.; Pena, J.; Hoglind, M.; Bengochea-Guevara, J.; Andojar, D. Comparing UAV-Based Technologies and RGB-D Reconstruction Methods for Plant Height and Biomass Monitoring on Grass Ley. Sensors, v. 19, n. 3, p. 535, 2019. [CrossRef]
- Mandrekar, J.N. Receiver Operating Characteristic Curve in Diagnostic Test Assessment. Journal Of Thoracic Oncology, v. 5, n. 9, p. 1315-1316, 2010. [CrossRef]
- Bento, N.L.; Ferraz, G.A.S.; Amorim, J.S.; Santana, L.S.; Barata, R.A.P.; Soares, D.V.; Ferraz, P.F.P. Weed Detection and Mapping of a Coffee Farm by a Remotely Piloted Aircraft System. Agronomy, v. 13, n. 3, p. 830, 2023. [CrossRef]
- Shrestha, A.; Bheemanahalli, R.; Adeli, A.; Samiappan, S.; Czarnecki, J.M.P.; Mccraine, C.D.; Reddy, K.R.; Moorhead, R. Phenological stage and vegetation index for predicting corn yield under rainfed environments. Frontiers In Plant Science, v. 14, 2023. [CrossRef]
- Cao, Y.; Li, G. L.; Luo, Y. K.; Pan, Q.; Zhang, S. Y. Monitoring of sugar beet growth indicators using wide-dynamic-range vegetation index (WDRVI) derived from UAV multispectral images. Computers And Electronics In Agriculture, v. 171, 2020. [CrossRef]
- Skakun, S.; Kalecinski, N. I.; Brown, M. G. L.; Johnson, D. M.; Vermote, E. F.; Roger, Jean-Claude.; Franch, B. Assessing within-Field Corn and Soybean Yield Variability from WorldView-3, Planet, Sentinel-2, and Landsat 8 Satellite Imagery. Remote Sensing, v. 13, n. 5, p. 872, 2021. [CrossRef]
- Souza, J.B.C.; Almeida, S.L.H.de; Oliveira, M.F.de; Santos, A.F.; Brito Filho, A.L.de; Meneses, M.D.; Silva, R.P. Integrating Satellite and UAV Data to Predict Peanut Maturity upon Artificial Neural Networks. Agronomy, v. 12, n. 7, p. 1512, 2022. [CrossRef]
- Theau, J.; Lauzier-Hudon, E.; Aube, L.; Devillers, N. Estimation of forage biomass and vegetation cover in grasslands using UAV imagery. PLoS ONE v. 16, n. 1, 2021. [CrossRef]
- Du, L.; Yang, H.; Song, X.; Wei, N.; Yu, C.; Wang, W.; Zhao, Y. Estimating leaf area index of maize using UAV-based digital imagery and machine learning methods. Scientific Reports, v. 12, n. 1, 2022. [CrossRef]
- Teodoro, P.E.; Teodoro, L.P.R.; Baio, F.H.R.; Silva Junior, C.A.da; Santos, R.G.dos; Ramos, A.P.M.; Pinheiro, M.M.F.; Osco, L.P.; Gonçalves, W.N.; Carneiro, A.M.; Junior, J.M.; Pistori, H.; Shiratsuchi, L.S. Predicting Days to Maturity, Plant Height, and Grain Yield in Soybean: a machine and deep learning approach using multispectral data. Remote Sensing, v. 13, n. 22, p. 4632, 2021. [CrossRef]
- Zhou, L.; Gu, X.; Cheng, S.; Yang, G.; Shu, M.; Sun, Q. Analysis of Plant Height Changes of Lodged Maize Using UAV-LiDAR Data. Agriculture, v. 10, n. 5, p. 146, 2020. [CrossRef]
- Raza, M.M.; Harding, C.; Liebman, M.; Leandro, L.F. Exploring the Potential of High-Resolution Satellite Imagery for the Detection of Soybean Sudden Death Syndrome. Remote Sensing, v. 12, n. 7, p. 1213, 2020. [CrossRef]
- Zhang, T.; Guan, H.; Ma, X.; Shen, P. Drought recognition based on feature extraction of multispectral images for the soybean canopy. Ecological Informatics, v. 77, 2023. [CrossRef]
- Santos, L.M.dos; Ferraz, G.A.S.; Bento, N.L.; Marin, D.B.; Rossi, G.; Bambi, G.; Conti, L. Use of Images Obtained by Remotely Piloted Aircraft and Random Forest for the Detection of Leaf Miner (Leucoptera coffeella) in Newly Planted Coffee Trees. Remote Sensing, v. 16, n. 4, p. 728, 2024. [CrossRef]
- Zambolim, L.; Reis, E.M.; Guerra, W.D.; Cezar, J.F.; Menten, J.O. Integrated Management of Asian Soybean Rust. Advances In Image and Video Processing, v. 10, n. 2, p. 602-633, 2022. [CrossRef]
- Shen, P.; Ma, X.; Guan, H.; Zhang, T. Calculation method of wilting index based on fractal dimension of multispectral images for the soybean canopy. Computers And Electronics In Agriculture, v. 206, 2023. [CrossRef]
- Zhang, Z.; Khanal, S.; Raudenbush, A.; Tilmon, K.; Stewart, C. Assessing the efficacy of machine learning techniques to characterize soybean defoliation from unmanned aerial vehicles. Computers And Electronics In Agriculture, v. 193, 2022. [CrossRef]
- García-Martínez, H.; Flores-Magdaleno, H.; Ascencio-Hernández, R.; Khalil-Gardezi, A; Tijerina-Chávez, L.; Mancilla-Villa, O. R.; Vázquezpeña, M. A. Corn Grain Yield Estimation from Vegetation Indices, Canopy Cover, Plant Density, and a Neural Network Using Multispectral and RGB Images Acquired with Unmanned Aerial Vehicles. Agriculture, v. 10, n. 7, p. 277, 2020. [CrossRef]
Figure 1.
Location of experimental areas in (a) Lavras, (b) Ijaci e (c) Nazareno, Minas Gerais, Brazil.
Figure 1.
Location of experimental areas in (a) Lavras, (b) Ijaci e (c) Nazareno, Minas Gerais, Brazil.
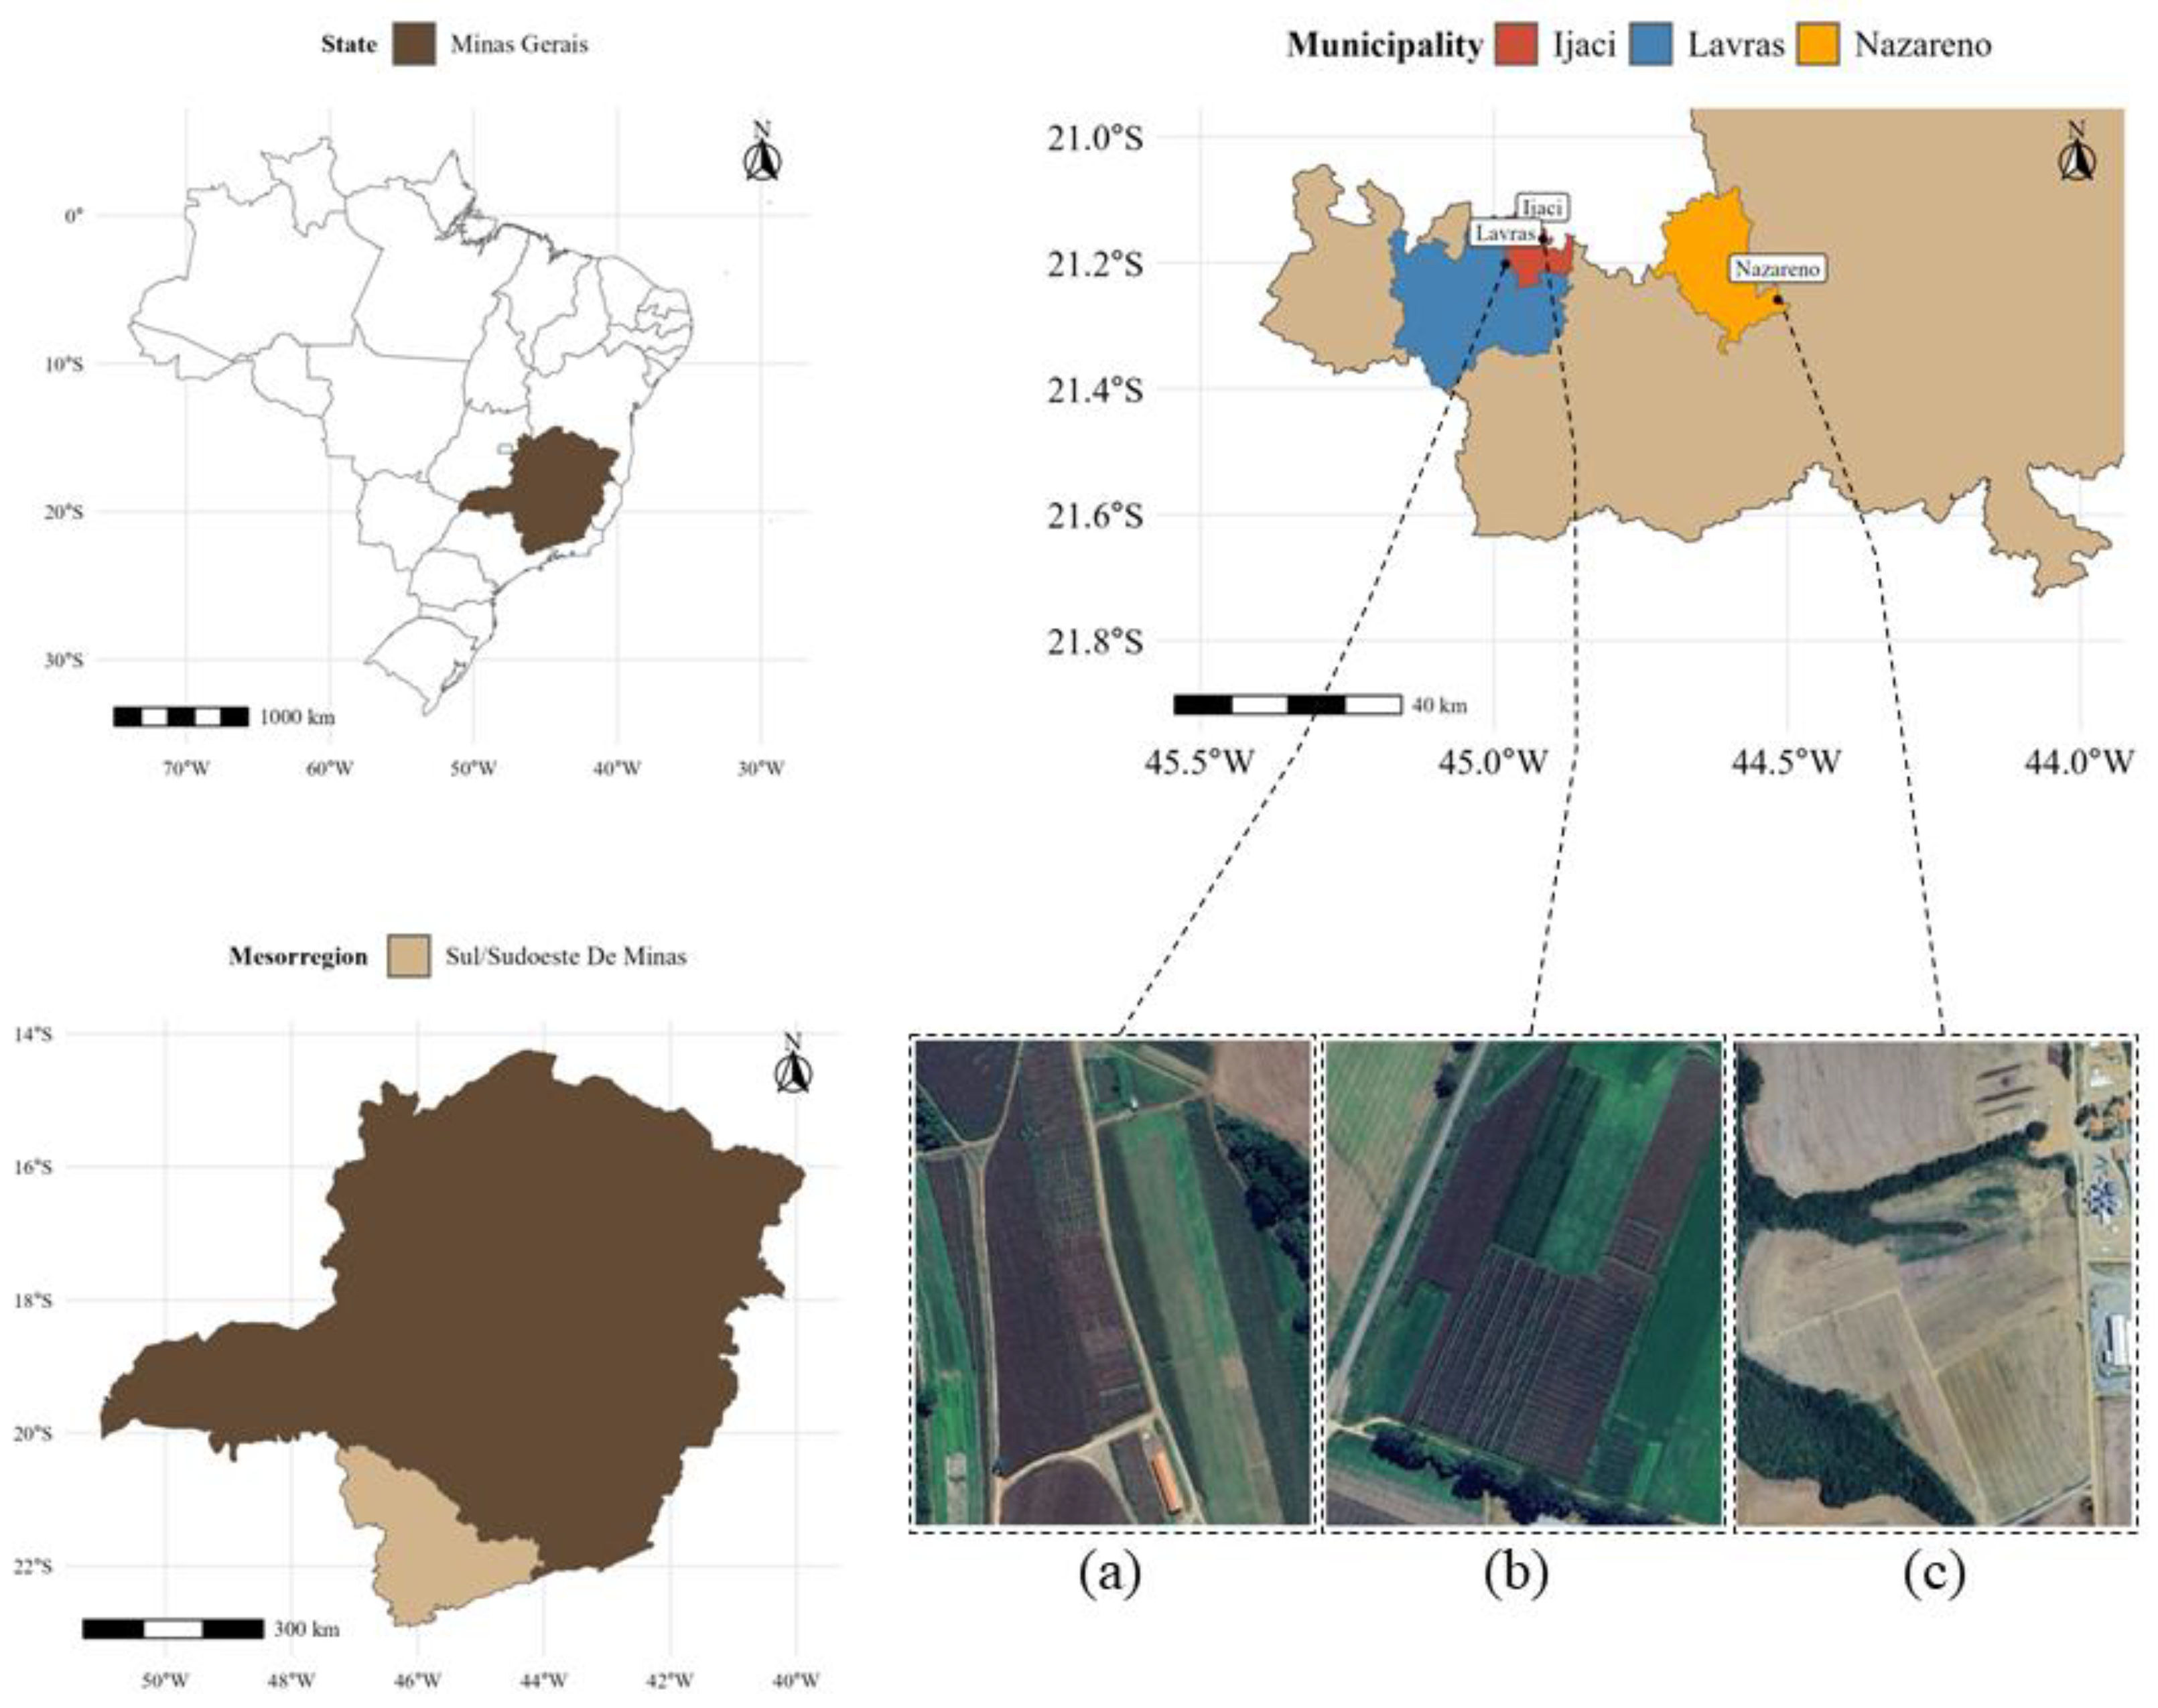
Figure 2.
Pearson correlation analysis for multiple variables.
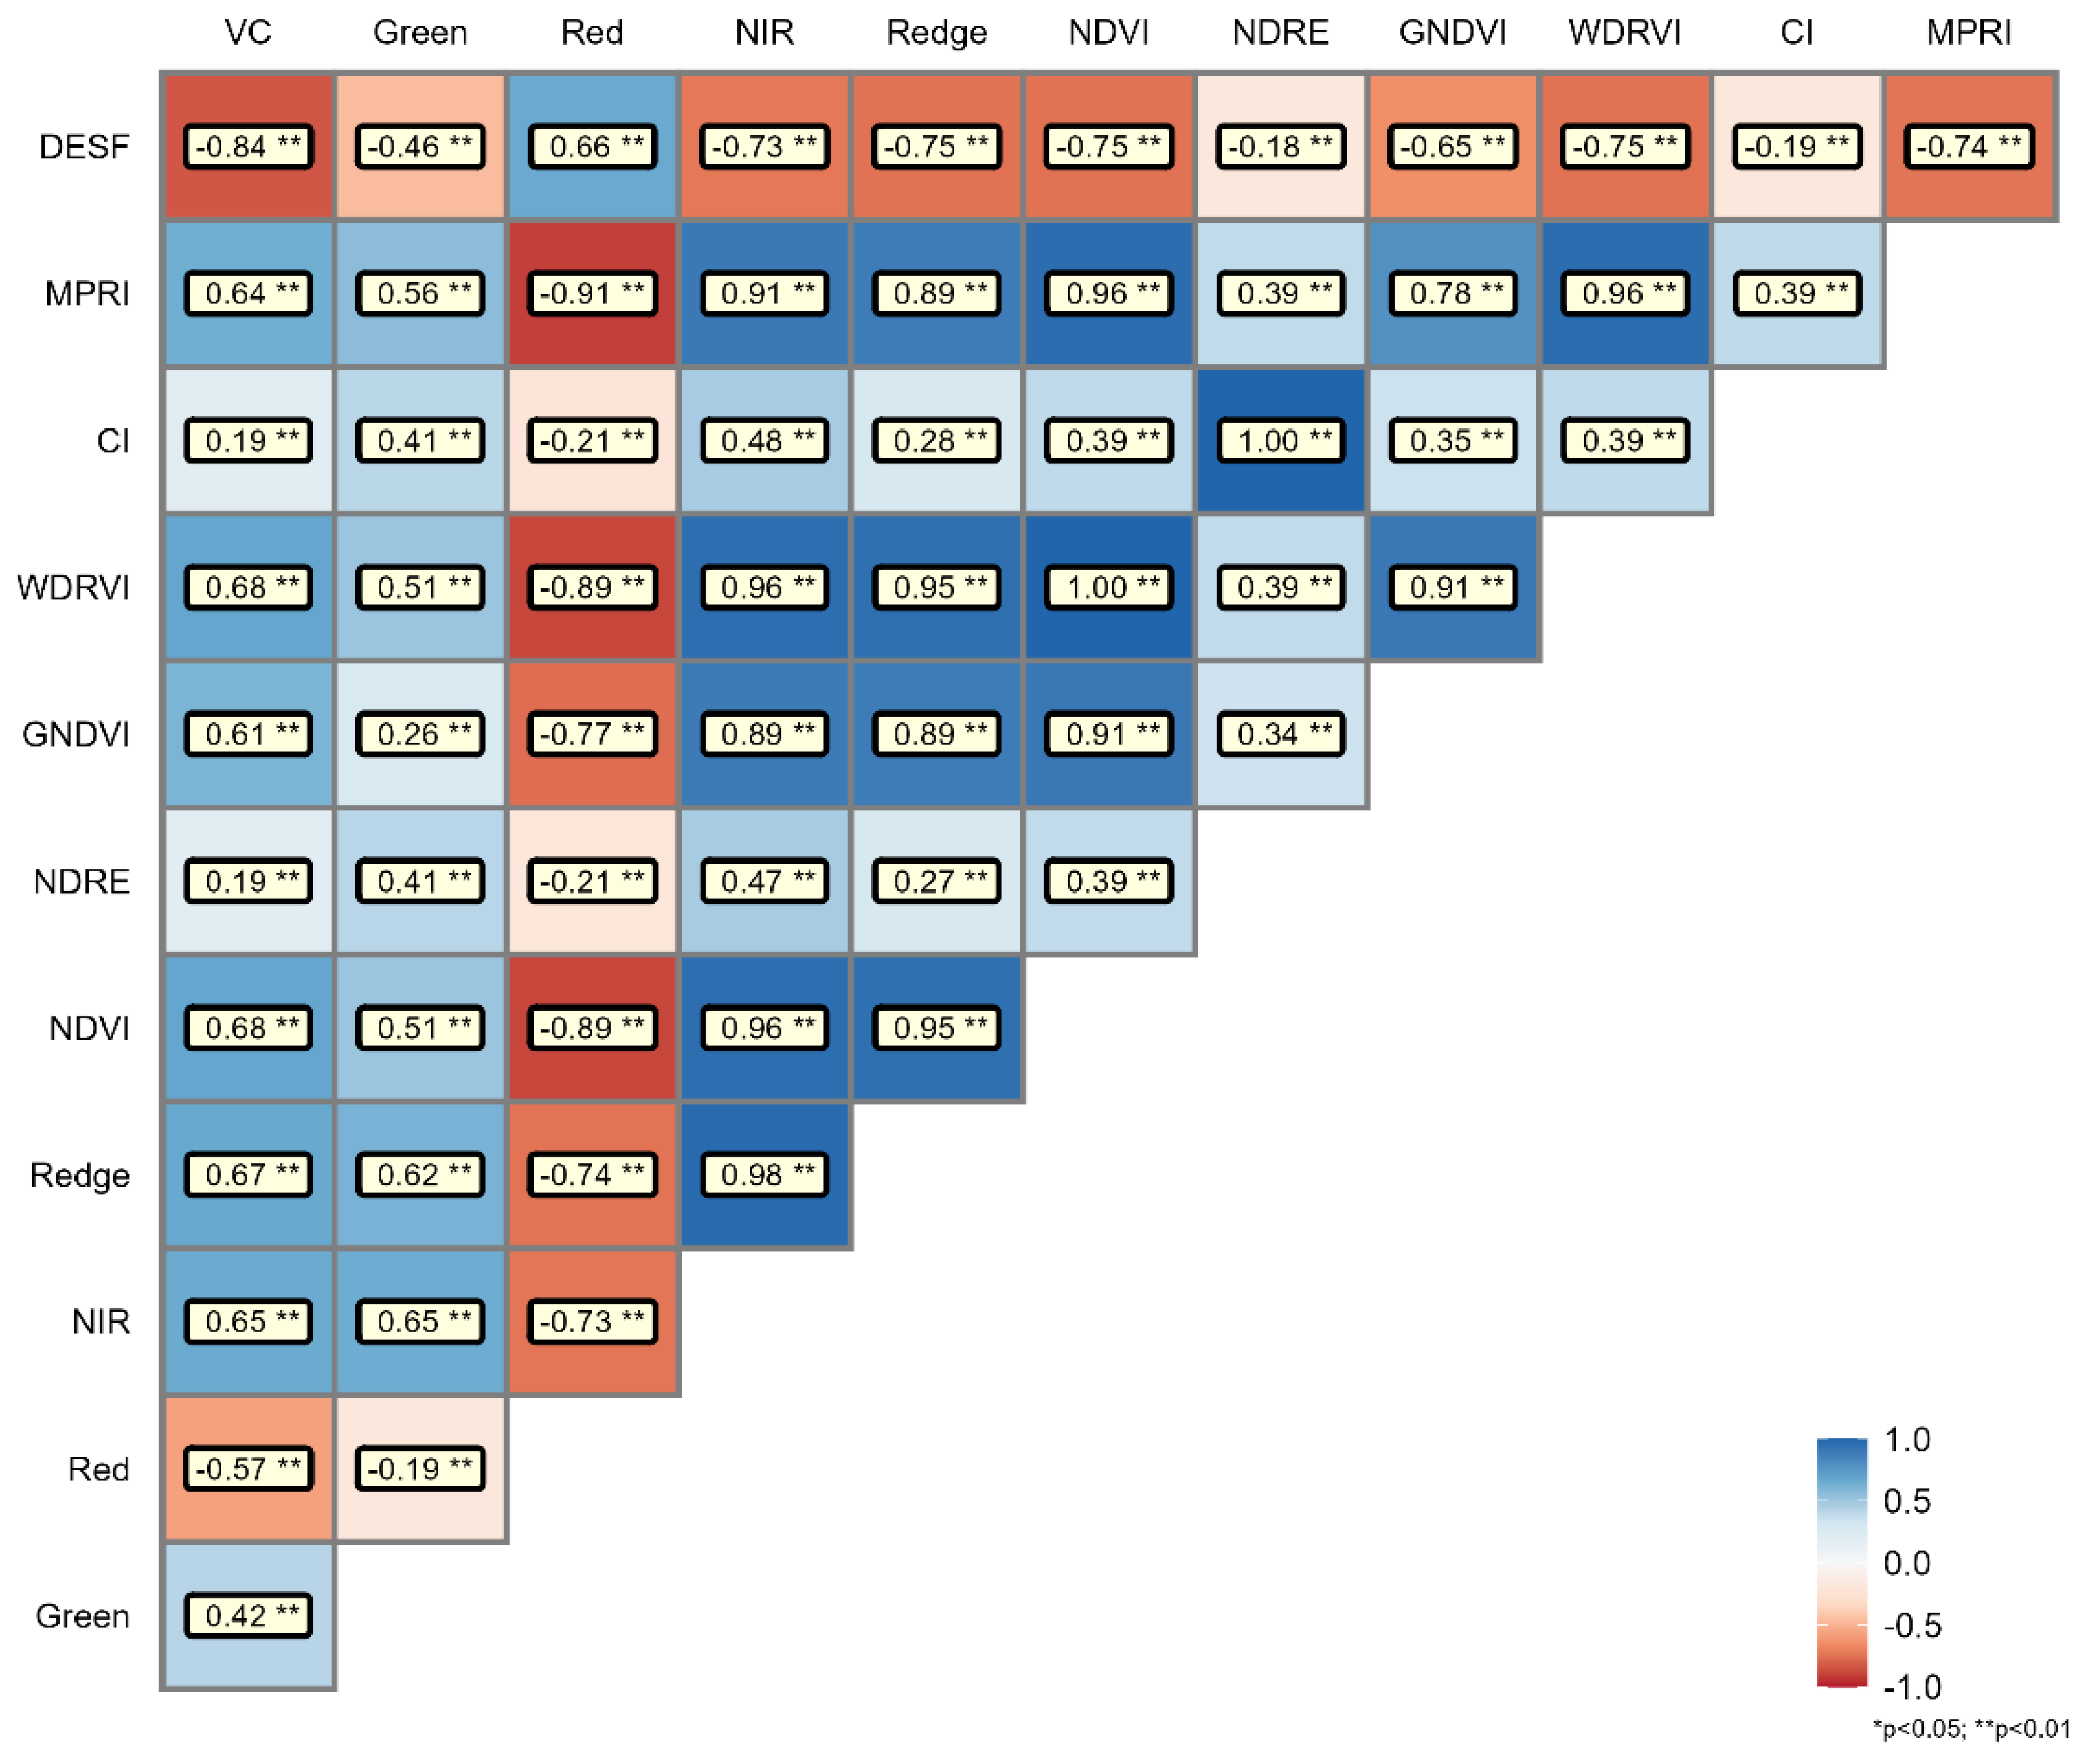
Figure 3.
Performance metrics for the Random Forest classification algorithm.
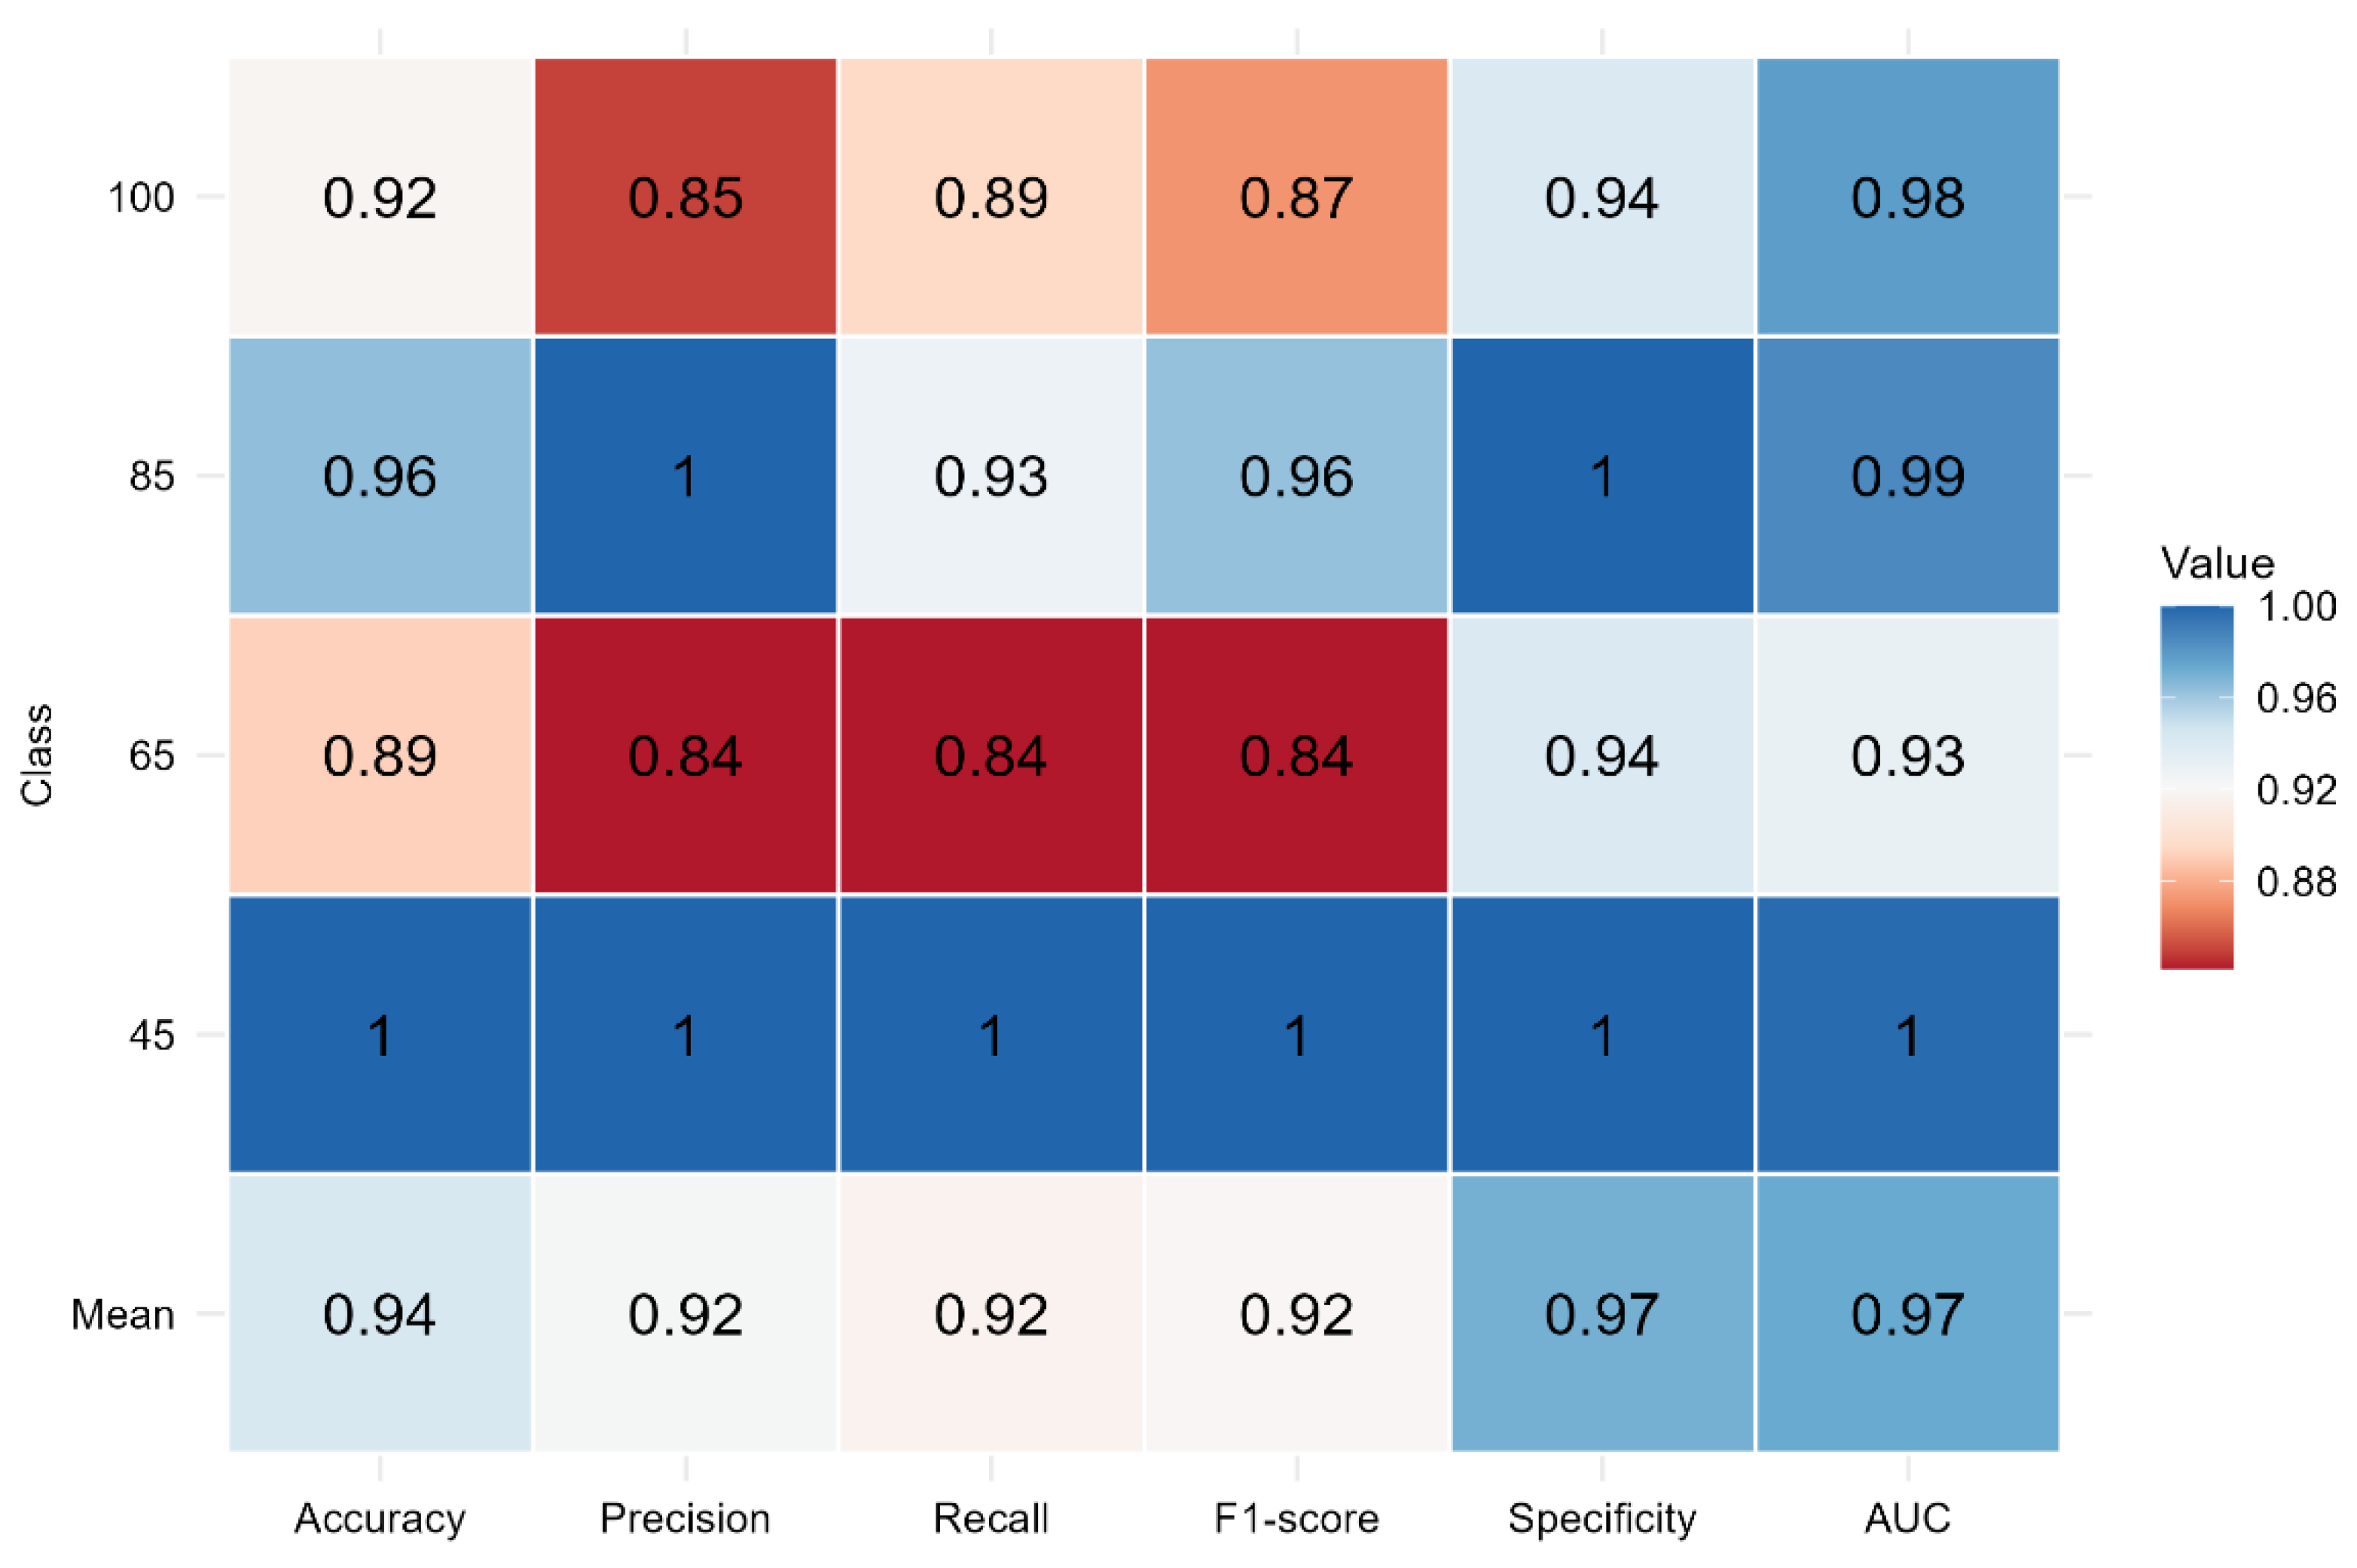
Figure 4.
Variables of importance by Mean Gini Decay in vegetation indices, spectral bands and relative vegetation cover.
Figure 4.
Variables of importance by Mean Gini Decay in vegetation indices, spectral bands and relative vegetation cover.
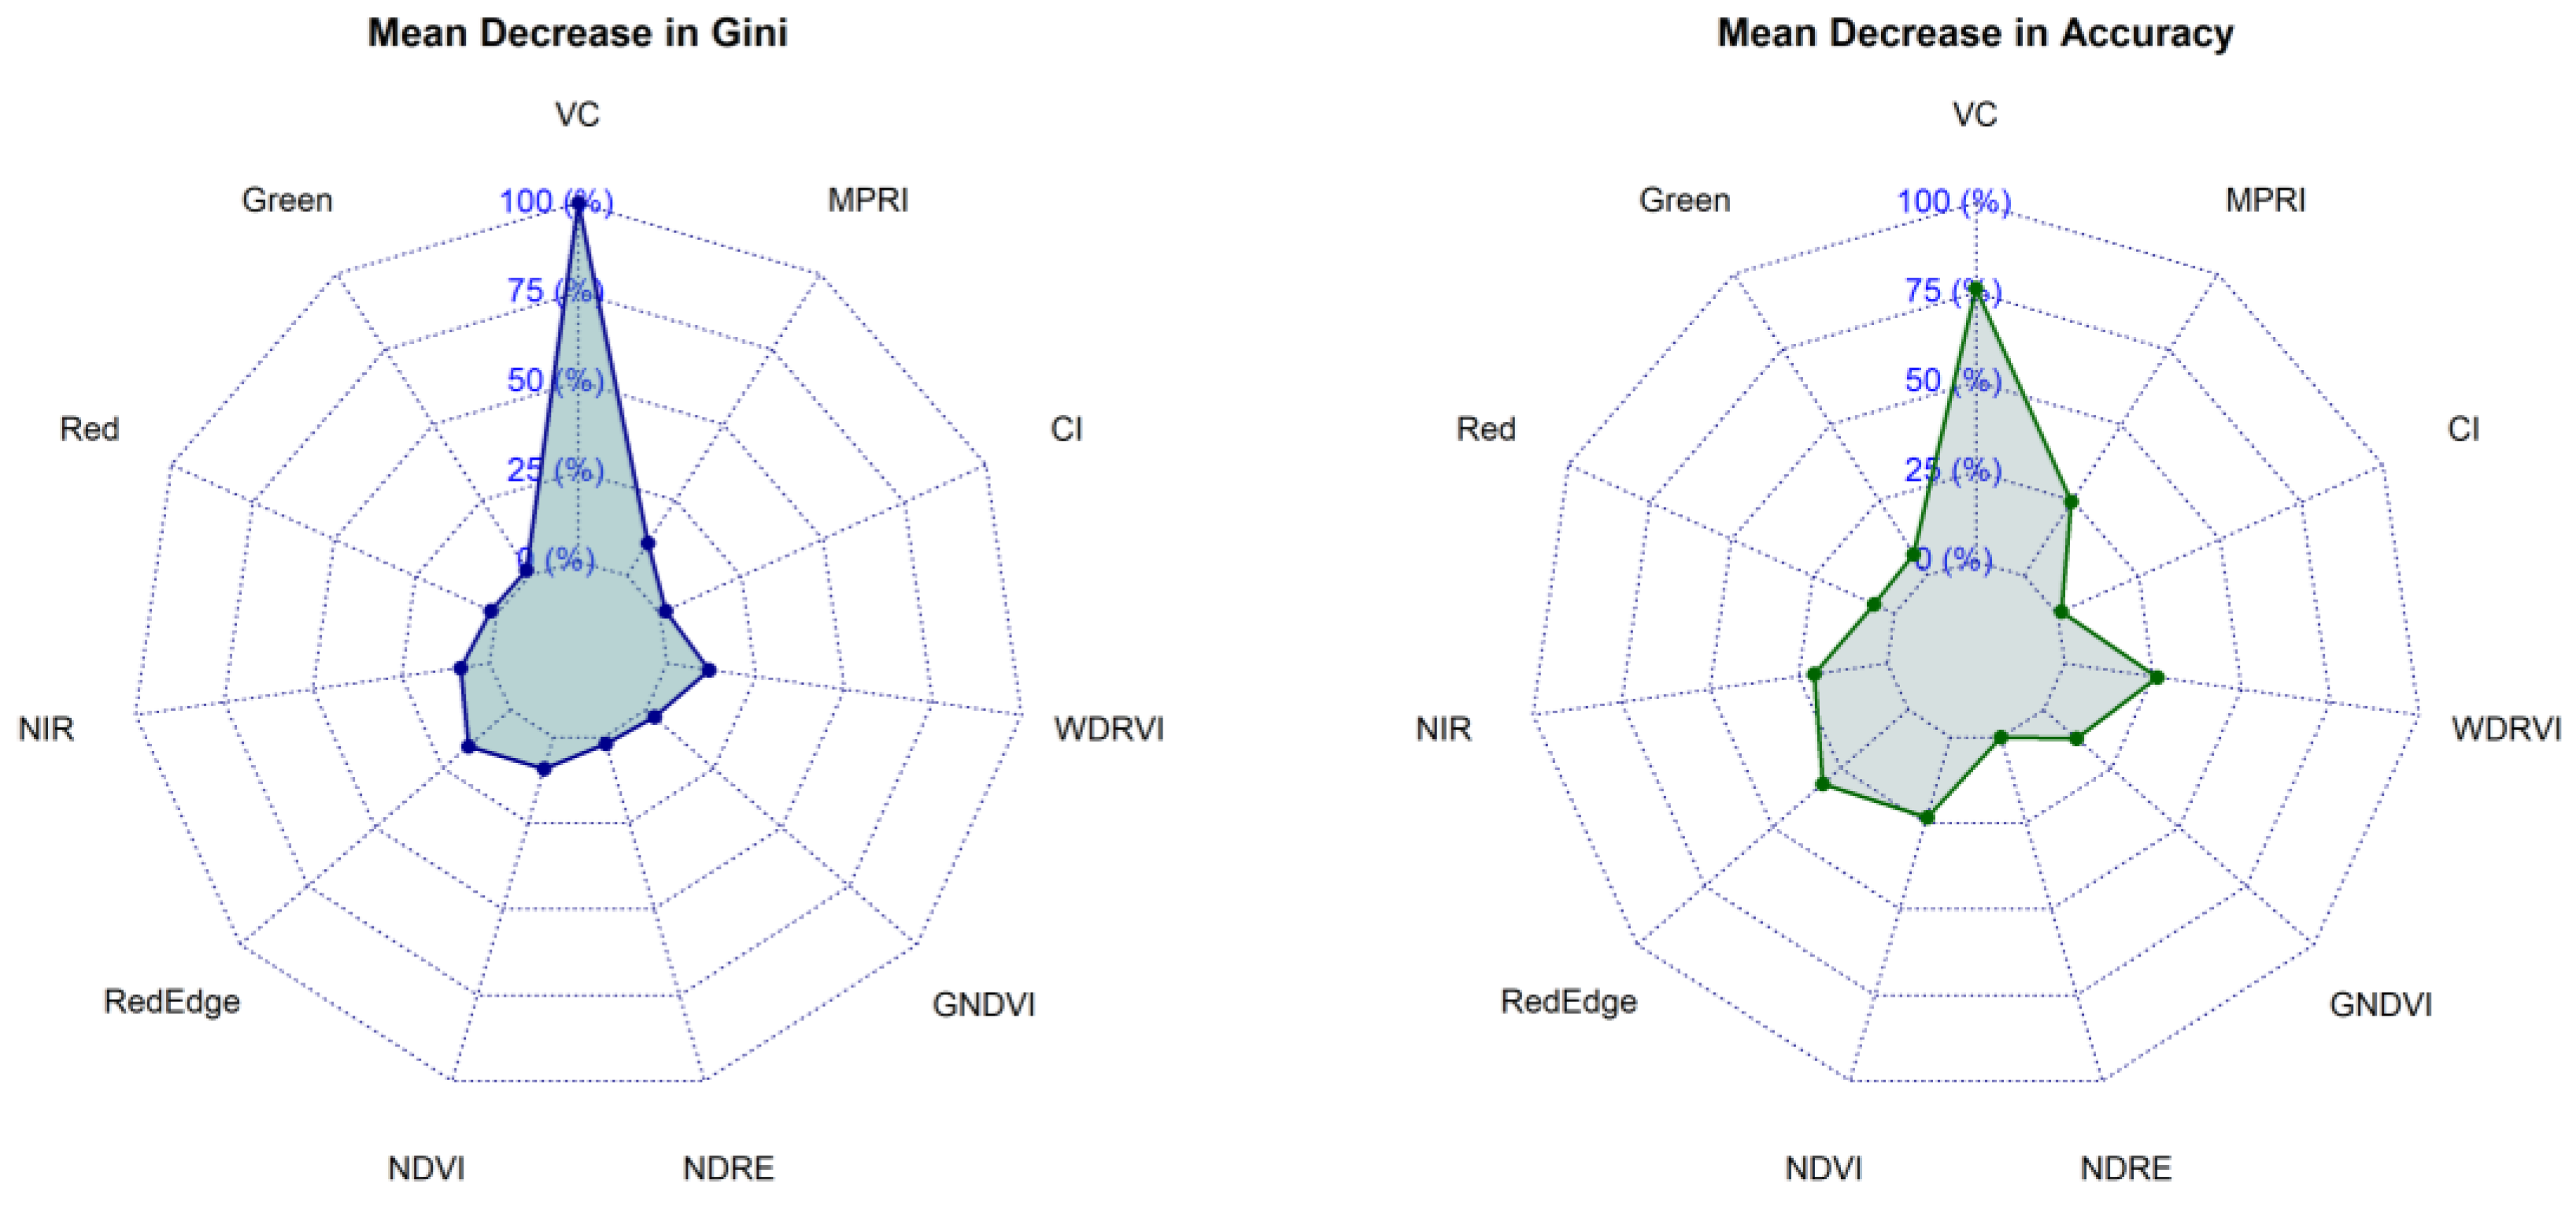
Figure 5.
Multidimensional scaling (MDS) of the proximity matrix for the Random Forest machine learning algorithm.
Figure 5.
Multidimensional scaling (MDS) of the proximity matrix for the Random Forest machine learning algorithm.
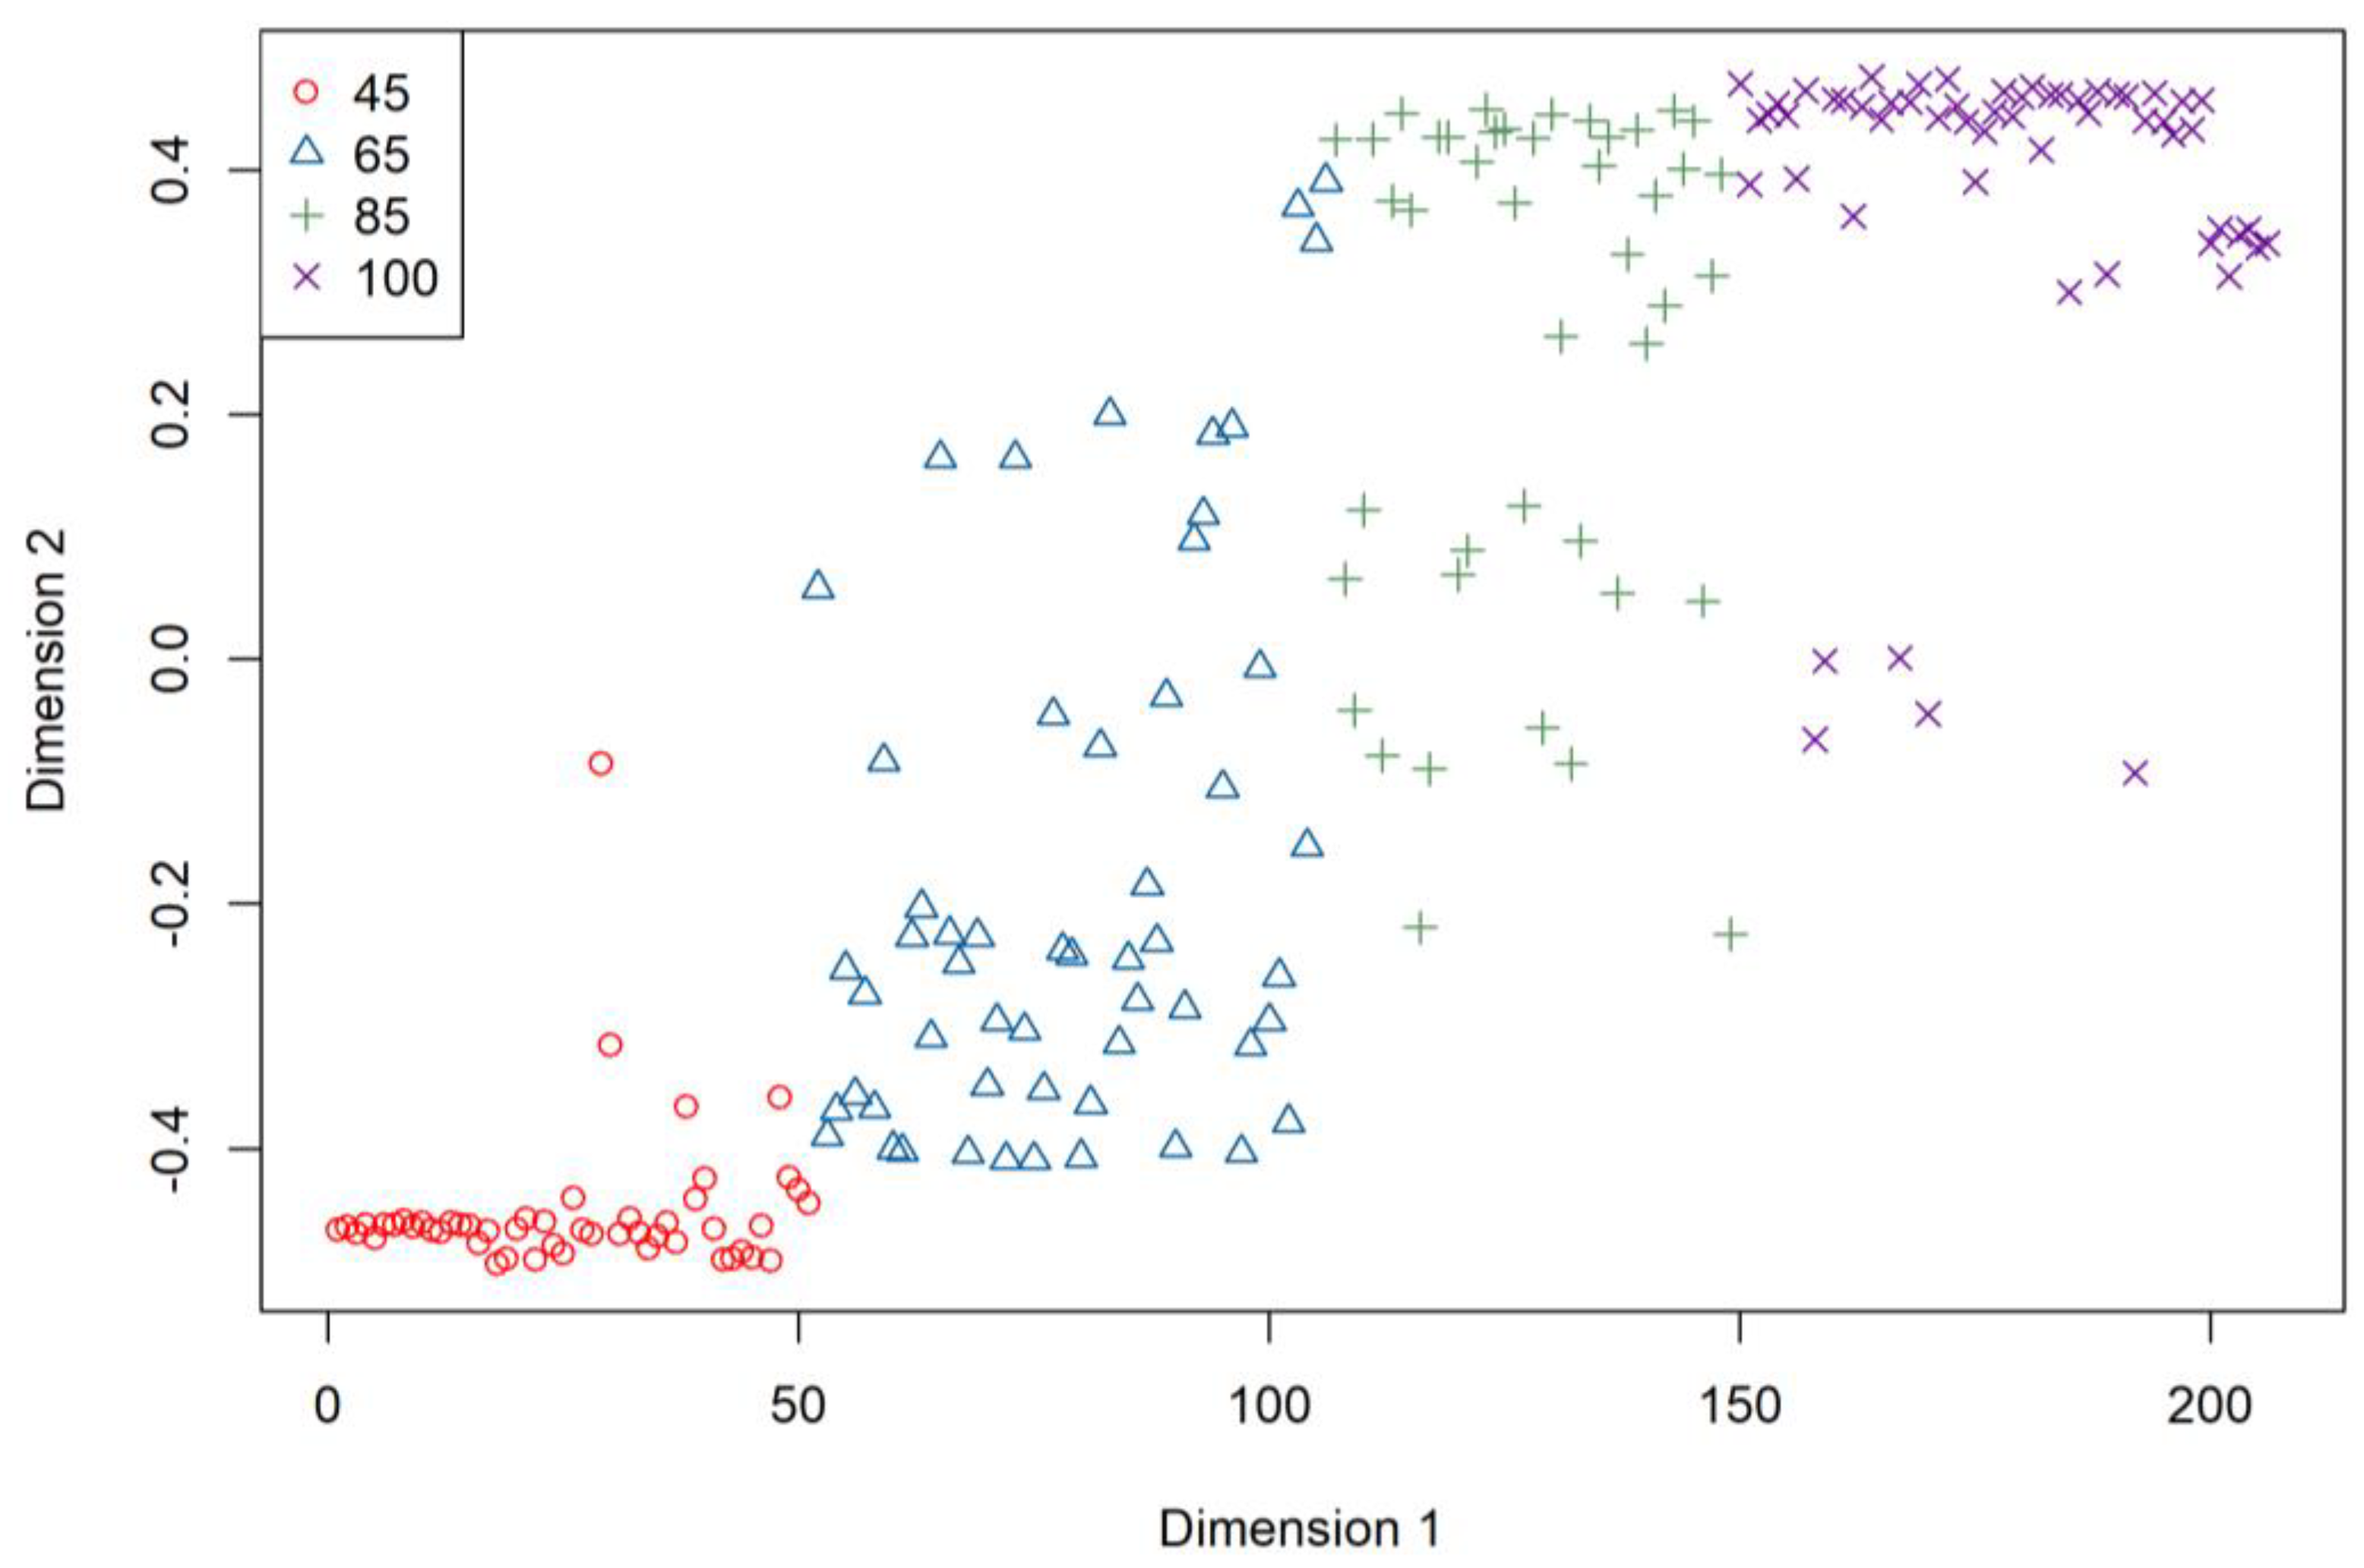

Table 1.
Description of cultivars, maturity groups (GM) and technology.
| Cultivars | GM | Technology |
|---|---|---|
| TMG 7060 IPRO | 6.0 | INTACTA RR2 IPRO/ INOX® |
| TMG 7063 IPRO | 6.3 | INTACTA RR2 IPRO/ INOX® |
| TMG 7262 RR | 6.2 | RR/ INOX® |
| TMG 7062 IPRO | 6.2 | INTACTA RR2 IPRO/ INOX® |
| TMG 7363 RR | 6.3 | RR/ INOX® / Cyst resistant |
| TMG 7067 IPRO | 6.7 | INTACTA RR2 IPRO/ INOX® |
| MULTILINES | - | - |
| M 6410 IPRO | 6.4 | INTACTA RR2 IPRO® |
Table 2.
Vegetation indices for multispectral images from the Parrot sensor.
| Vegetation index 1 | Equation | Reference |
|---|---|---|
| NDVI | ((NIR-Red))/((NIR+Red)) | [17] |
| NDRE | ((NIR-Rededge))/((NIR+Rededge)) | [18] |
| GNDVI | ((NIR-Green))/((NIR+Green)) | [19] |
| WDRVI | ((a*NIR-Red))/((a*NIR+Red)) | [20] |
| MPRI | ((Green-Red))/((Green+Red)) | [21] |
| CIrededge | ((NIR))/((Rededge))-1 | [22] |
1 NDVI: Normalized Difference Vegetation Index; NDRE: Normalized Difference Red Edge Index; GNDVI: Green Normalized Difference Vegetation Index; WDRVI: Wide Dynamic Range Vegetation Index; MPRI: Modified Photochemical Reflectance Index; CIrededge: Chlorophyll Rededge Index.
Disclaimer/Publisher’s Note: The statements, opinions and data contained in all publications are solely those of the individual author(s) and contributor(s) and not of MDPI and/or the editor(s). MDPI and/or the editor(s) disclaim responsibility for any injury to people or property resulting from any ideas, methods, instructions or products referred to in the content. |
© 2024 by the authors. Licensee MDPI, Basel, Switzerland. This article is an open access article distributed under the terms and conditions of the Creative Commons Attribution (CC BY) license (http://creativecommons.org/licenses/by/4.0/).
Copyright: This open access article is published under a Creative Commons CC BY 4.0 license, which permit the free download, distribution, and reuse, provided that the author and preprint are cited in any reuse.


