1. Introduction
Tomato (
Solanum lycopersicum L.) is one of the most important fruits for humans. It is a source of nutrients such as phosphorus (P), potassium (K), calcium (Ca), magnesium (Mg), and iron (Fe) [
1] and secondary metabolites including vitamin C [
2], vitamin K1 [
3], and vitamin B9 [
4]. Moreover, tomatoes contain a high amount of lycopene [
5], a potential antioxidant with anticarcinogenic properties [
6]. Fresh tomatoes have a relatively high K content, approximately 290 mg/100 g fresh weight (FW) [
7]. People undergoing dialysis may need to limit their dietary K intake to less than 200 mg of K per serving or 2,000 mg per day [8-9]. Plant-based foods (fruits and vegetables) vary in their contents of fiber, vitamins, and minerals which help support health in patients with kidney disorder [
10]. However, low K foods are necessary for patients who suffer from kidney disease [
11] and the role of biochemical and physiological substances in plant cell metabolism, such as protoplasmic structure maintenance, pH balance, and plant osmosis [12-15]. K deficiency directly disrupts the biochemical activities of plants, leading to a reduced growth rate and accelerated leaf senescence, which ultimately results in irreversible wilting [
16]. Conversely, excess K application leads to lower K use efficiency [17-18] This excess results in a decrease in fruit quality by increasing the incidence of blossom-end rot [
19]. Tomato plants require a higher level of K compared to other nutrients [
20]. K absorption in tomato plants increases dramatically during the fruit development stage [21-22]. In addition, K plays an important role in fruit quality and color [
23]. On the contrary, when K uptake is insufficient, several physiological traits were changed, including the mobilization of K from foliar reserves to support critical processes of fruit development, resulting in uneven ripening, blotchy ripening, high levels of internal white tissue, yellow shoulder, decreased lycopene (a pigment responsible for the red color), irregular shape, and hollow fruit [24-27]. However, the limited amount of K-level management has a significant effect on the productivity and fruit quality parameters of tomatoes [
28]. At present, an increasing number of researchers in Japan [11,29-37], China [
28], South Korea [
38], and Italy [
39] have been making notable progress in developing methods for producing low K fruits and vegetables, which are particularly beneficial for patients with chronic kidney disease (CKD). These methods aim to address the dietary restrictions of CKD patients, who need to limit their K intake to prevent hyperkalemia (high K levels in your blood). Several factors have been identified that affect the K content in plants and the quality of the resulting fruits and vegetables [11,28-37].
In this research, we concentrated on optimizing nutrient solution management within deep flow technique hydroponic systems, with the specific goal of applying a nutrient solution that maintains a low potassium nitrate concentration during the growth of cherry tomatoes. The objective was to ensure normal plant growth, yield, and high fruit quality while reducing K accumulation in the fruits. The findings of this study suggest that cultivating cherry tomatoes with lower K levels could provide a viable option for consumers who need to avoid high-K foods, such as patients with CKD. Conducting a comprehensive nutritional analysis of low K cherry tomatoes is crucial to confirm that they meet dietary requirements, particularly for patients with CKD, as stated above. This analysis should encompass the evaluation of various nutritional components, including phytochemicals such as lycopene and beta-carotene, in addition to the assessment of antioxidant activity (measured using 2,2-diphenyl-1-picrylhydrazyl radical (DPPH) and ferric ion reducing antioxidant power (FRAP) assays); phytochemicals and antioxidants are known to contribute to overall health and potentially reduce inflammation in CKD patients.
2. Materials and Methods
2.1. Plant Materials and Experimental Design
The experiment was conducted in a greenhouse at the Faculty of Agriculture, Khon Kaen University, Thailand (latitude 16°28'31.5"N, longitude 102°49'14.7"E) from 24 November 2020 to 31 March 2021. Two Thai cherry tomato varieties were utilized: 'Tabtim Deang T2021' (red color) from KNOWN-YOU SEED Co., Ltd., Chiangmai, Thailand, and 'Sweet Boy 1' (yellow color) from CHIA TAI Co., Ltd., Bangkok, Thailand. Both varieties are F1 hybrids characterized by a small fruit size, cylindrical shape, and smooth surface.
Seeds of each variety were germinated on a moist towel and kept in the dark for 2 weeks. After germination, the seedlings were pre-cultured in a nutrient solution for 20–30 days. The nutrient solution contained the following macronutrients [
11], 3.0 x 10
-3 M KNO
3, 2.0 x 10
-3 M Ca(NO
3)
2 4H
2O, 5.0 x 10
-4 M NH
4H
2PO
4, and 1.0 x 10
-3 M MgSO
4 7H
2O and micronutrients, 2.6 x 10
-5 M C
10H
12FeN
2NaO
8 3H
2O (FeNa-EDTA), 4.6 x 10
-6 M MnCl
2 4H
2O, 2.4 x 10
-5 M H
3BO
3, 3.8 x 10
-7 M ZnSO
4 7H
2O, 1.6 x 10
-7 M CuSO
4 5H
2O, and 1.5 x 10
-8 M (NH
4)
6Mo
7O
2 4H
2O. The distilled water was used to prepare the nutrient solution. All treatments were provided with similar nutrient solutions, except for KNO
3 concentration. Thereafter, seedlings with 3–5 leaves were transferred to 45 L plastic containers (length x width x depth: 54.0 x 39.0 x 28.0 cm) with the same nutrient solution with different KNO
3 contents under deep flow technique hydroponic systems with an air pump oxygen (Model: ACO-001, RESUN Electromagnetic Air pump, Shanghai, China), air pump power: 18W, Voltage: 220/100V, Frequency: 60/50Hz, Pressure: >0.02MPa, and output: 38L/min DIA. The experiment was conducted using a randomized complete block design with five levels of KNO
3 concentration treatments were applied: K1 was the control, which contained 3.0 mM KNO
3; K2 was 1.5 mM KNO
3, K3 wad 0.75 mM KNO
3, K4 was 0.50 mM KNO
3, and K5 was 0.375 mM KNO
3. There were four replications, and each container contained four plants. Eighty cherry tomato plants were planted in total. The plants were transplanted into each treatment after 31 days of seeding. The study was carried out over 158 days under natural sunlight. The air temperature averaged 14.1–35.6°C and relative humidity averaged 86.7–94.8% were recorded daily throughout the experiment from the weather station at Agronomy Research Station, Faculty of Agriculture, Khon Kaen University, Thailand. The nutrient solution was replenished every 14 days, with the pH was adjusted at 6.50 ± 0.50 using 0.5 N HNO₃ and the electrical conductivity (EC) was controlled at 1.05 mS/cm.
2.2. Data Collection
2.2.1. Yield and Physical Quality of Fruits
Tomatoes were harvested at stage 5 more than 90% maturity, indicated by a color change to red and yellow after 110 days of cultivation. Post harvest, the physical characteristics of the cherry tomatoes were harvested at sixth truss for samples data analysis, including yield weight of each fruit (sixth truss) was measured, six fruits from each truss (36 fruits) for the fruits weight of tomato were randomly selected, diameter, and length (36 fruits), were recorded using the utilizing a digital vernier caliper for each treatment.
2.2.2. Fruit Quality Parameters
Total soluble solids (TSS) were measured with a digital refractometer (Model: MSDR-P2-102, IMS Euro Ltd. Stockport, England). Titratable acidity (TA) was determined via titration against 0.1 N NaOH solution and expressed in the form of citric acid (g/gFW).
Ascorbic acid (AA) was determined using 2,4-dinitrophenylhydrazine (DNP) colorimetry. Tomato juice (0.5 ml) was transferred into a 75 ml test tube, and 0.5 ml of 10% metaphosphoric acid solution was added following the method of [
30]. In brief, the solution contained 1 ml of distilled water, 1 ml of 0.03% 2,6-dichlorophenol-indophenol (DCP), 2 ml of thiourea, and 1 ml of 2,4-DNP, which were added to each tube. The samples were maintained at 37°C for 3 hours. Subsequently, the samples were cooled with ice, and 5 ml of 85% H
2SO
4 was added to end the reaction. The ascorbic acid content was determined by using a UV–VIS spectrophotometer at 520 nm (Model; Spectro UV-2550, LABOMED Inc., Los Angeles, United States of America).
Lycopene and beta-carotene were analyzed following the method described by [
40]. Briefly, homogenates of fresh tomato fruits (0.40 g) were prepared in 50 ml centrifuge tubes with 5 ml of a mixed solution of hexane, acetone, and ethanol in a ratio of 2:1:1 (v/v/v). The mixture was thoroughly mixed and incubated in the dark for 10 minutes. After incubation, 10 ml of distilled water was added, and the solution was left to stand for 10 minutes to allow for phase separation and for air bubbles to dissipate. Lycopene and beta-carotene concentrations were measured using the UV–VIS spectrophotometer at wavelengths of 503 nm and 444 nm, respectively.
2.2.3. Mineral Content Analysis
Tomato fruits were dried at 70°C for 72 hours in a hot oven (Models: 30 -1060, UF1060 MEMMERT UNIVERSAL OVENS, Memmert, United States of America). The samples were ground and homogenized into a powder that was used for mineral analysis. The nitrogen content was determined using the Kjeldahl method [
41]. The other nutrients were analyzed using inductively coupled plasma optical emission spectroscopy (ICP-OES, Model: AVIO 500, PerkinElmer Inc., Massachusetts, United States of America) after preparing the samples via the dry ashing method. We weighed 0.2500 g of sample powder into an ashing crucible. We then placed the ashing crucible into the muffle furnace (Model: 550-126, Fisher Scientific, United States of America), and the ashing procedure proceeded at 550°C for 6 hours. We removed the ashing crucible from the muffle furnace, added 10 ml of 1 N HCl, and left the crucible for 1 hour. Next, we added 10 ml of deionized (DI) water, and the crucible was left overnight. The resulting solution was then filtered through Whatman No. 5 filter paper [
42].
2.2.4. Determination of Antioxidant Activity
For antioxidant analysis, an aliquot was extracted using the following steps: 1.00 g homogenate of the dry sample was placed in a 25 ml Erlenmeyer flask, and 5 ml of mixed solution (ethyl acetate–ethyl alcohol at a ratio of 2:3 (v/v)) was then added. The sample was incubated at 40°C overnight. Subsequently, the solution was filtered using filter paper (Whatman No. 1). The extraction process was repeated twice, and then an aliquot was evaporated until approximately 1 ml of liquid remained. The obtained sample was maintained at 4°C for further analysis.
2,2-diphenyl-1-picrylhydrazyl (DPPH) free radical scavenging activity was determined using the method described by the authors of [
43]. Briefly, 20 µl of an aliquot was added to a well plate and then 180 µl of DPPH methanolic solution was added to initiate the reaction. After 30 minutes, absorbance was measured at 517 nm using a UV–VIS spectrophotometer (SPECTROstar Nano, BMG LABTHEH, Ortenberg, Germany). The standard curves were prepared using different concentrations of ascorbic acid. The results were expressed as EC
50 (milligram of sample required to bleach 50% of the DPPH methanolic solution) through the construction of a kinetic curve for each sample. Analyses were performed in three replications. Scavenging activity was calculated using the following equation:
A0 is the absorbance of the DPPH solution (blank).
Ae is the absorbance of the sample solution.
Abg is the absorbance of the background.
Total antioxidant potential was determined using a FRAP assay adapted from [
44]. The FRAP reagent was prepared by mixing a solution of acetate buffer (250 mM (pH 3.6)), a solution of 10 mM TPTZ (2,4,6-trispyridyltriazine), and 20 mM FeCl
3 at a ratio of 10:1:1 (v/v/v). The obtained FRAP reagent (182 µL) was added to each well plate followed by 18 µL of sample solution and then incubated at 37°C for 30 min. The reactions were measured at OD 593 nm using a UV–VIS spectrophotometer. The calibration curve was prepared using different concentrations of ascorbic acid. The results were expressed as mg ascorbic acid equivalent per one-gram dry weight (mg ascorbic acid equivalent/1 gDW). The reducing power was calculated using the following equation:
y is the absorbance of the test—the absorbance of the blank control (containing all reagents except the extract solution).
a is the slope of the equation, and x is the ascorbic acid concentration in µg/mL.
b is the intercept.
2.3. Data Analysis
The obtained data were subjected to analysis of variance for assessment of the effects of each treatment. Experimental data were acquired from three replications. The significance of differences between means was analyzed by using Tukey’s multiple range test (p < 0.05). The relationships between the K concentration, fruit yield, quality of fruits, and antioxidant activity were tested as Pearson correlations, and the statistical significance of the correlation at p < 0.05 was examined. All statistical analyses were computed using SPSS program software version 28.0.1.0 (142).
3. Results
3.1. The Effect of Different K Levels on the Fruit Yield and Physical Qualities of Cherry Tomatoes
Compared to the yield of the control (K1), the ‘Tabtim Deang T2021’ yield was significantly decreased in K5 (1.50±0.16 kg/plant); in addition, the ‘Sweet Boy 1’ yield was significantly decreased in K4 (1.70±0.28 kg/plant) and K5 (1.65± 0.11 kg/plant). The highest yield was recorded in K2 (2.24±0.39 kg/plant) for ‘Tabtim Deang T2021’. However, the result was not significantly different from that of K1. Moreover, the highest yield of ‘Sweet Boy 1’ was recorded in K1 (2.42±0.39 kg/plant), followed by K2 (2.17±0.31 kg/plant) and K3 (1.97±0.44 kg/plant) (
Table 1). Similar to the tomato yield, the lowest significance for fruit weight was observed in K5 (10.02±1.89 g/fruit) for ‘Tabtim Deang T2021’ and K4 (8.70±1.19 g/fruit) and K5 (8.67±1.10 g/fruit) for ‘Sweet Boy 1’. The lowest significance for diameter was observed in K5 (23.83±1.92 mm) for ‘Tabtim Deang T2021’ and K4 (24.72±1.89 mm) and K5 (23.94±1.22 mm) for ‘Sweet Boy 1’. Lastly, the highest fruit weight and diameter were observed in K1—the same as for fruit yield. However, there was no significant difference in height under the KNO
3 restricted treatments compared to K1 for both varieties.
3.2. Nutrient Status
3.2.1. Macronutrients
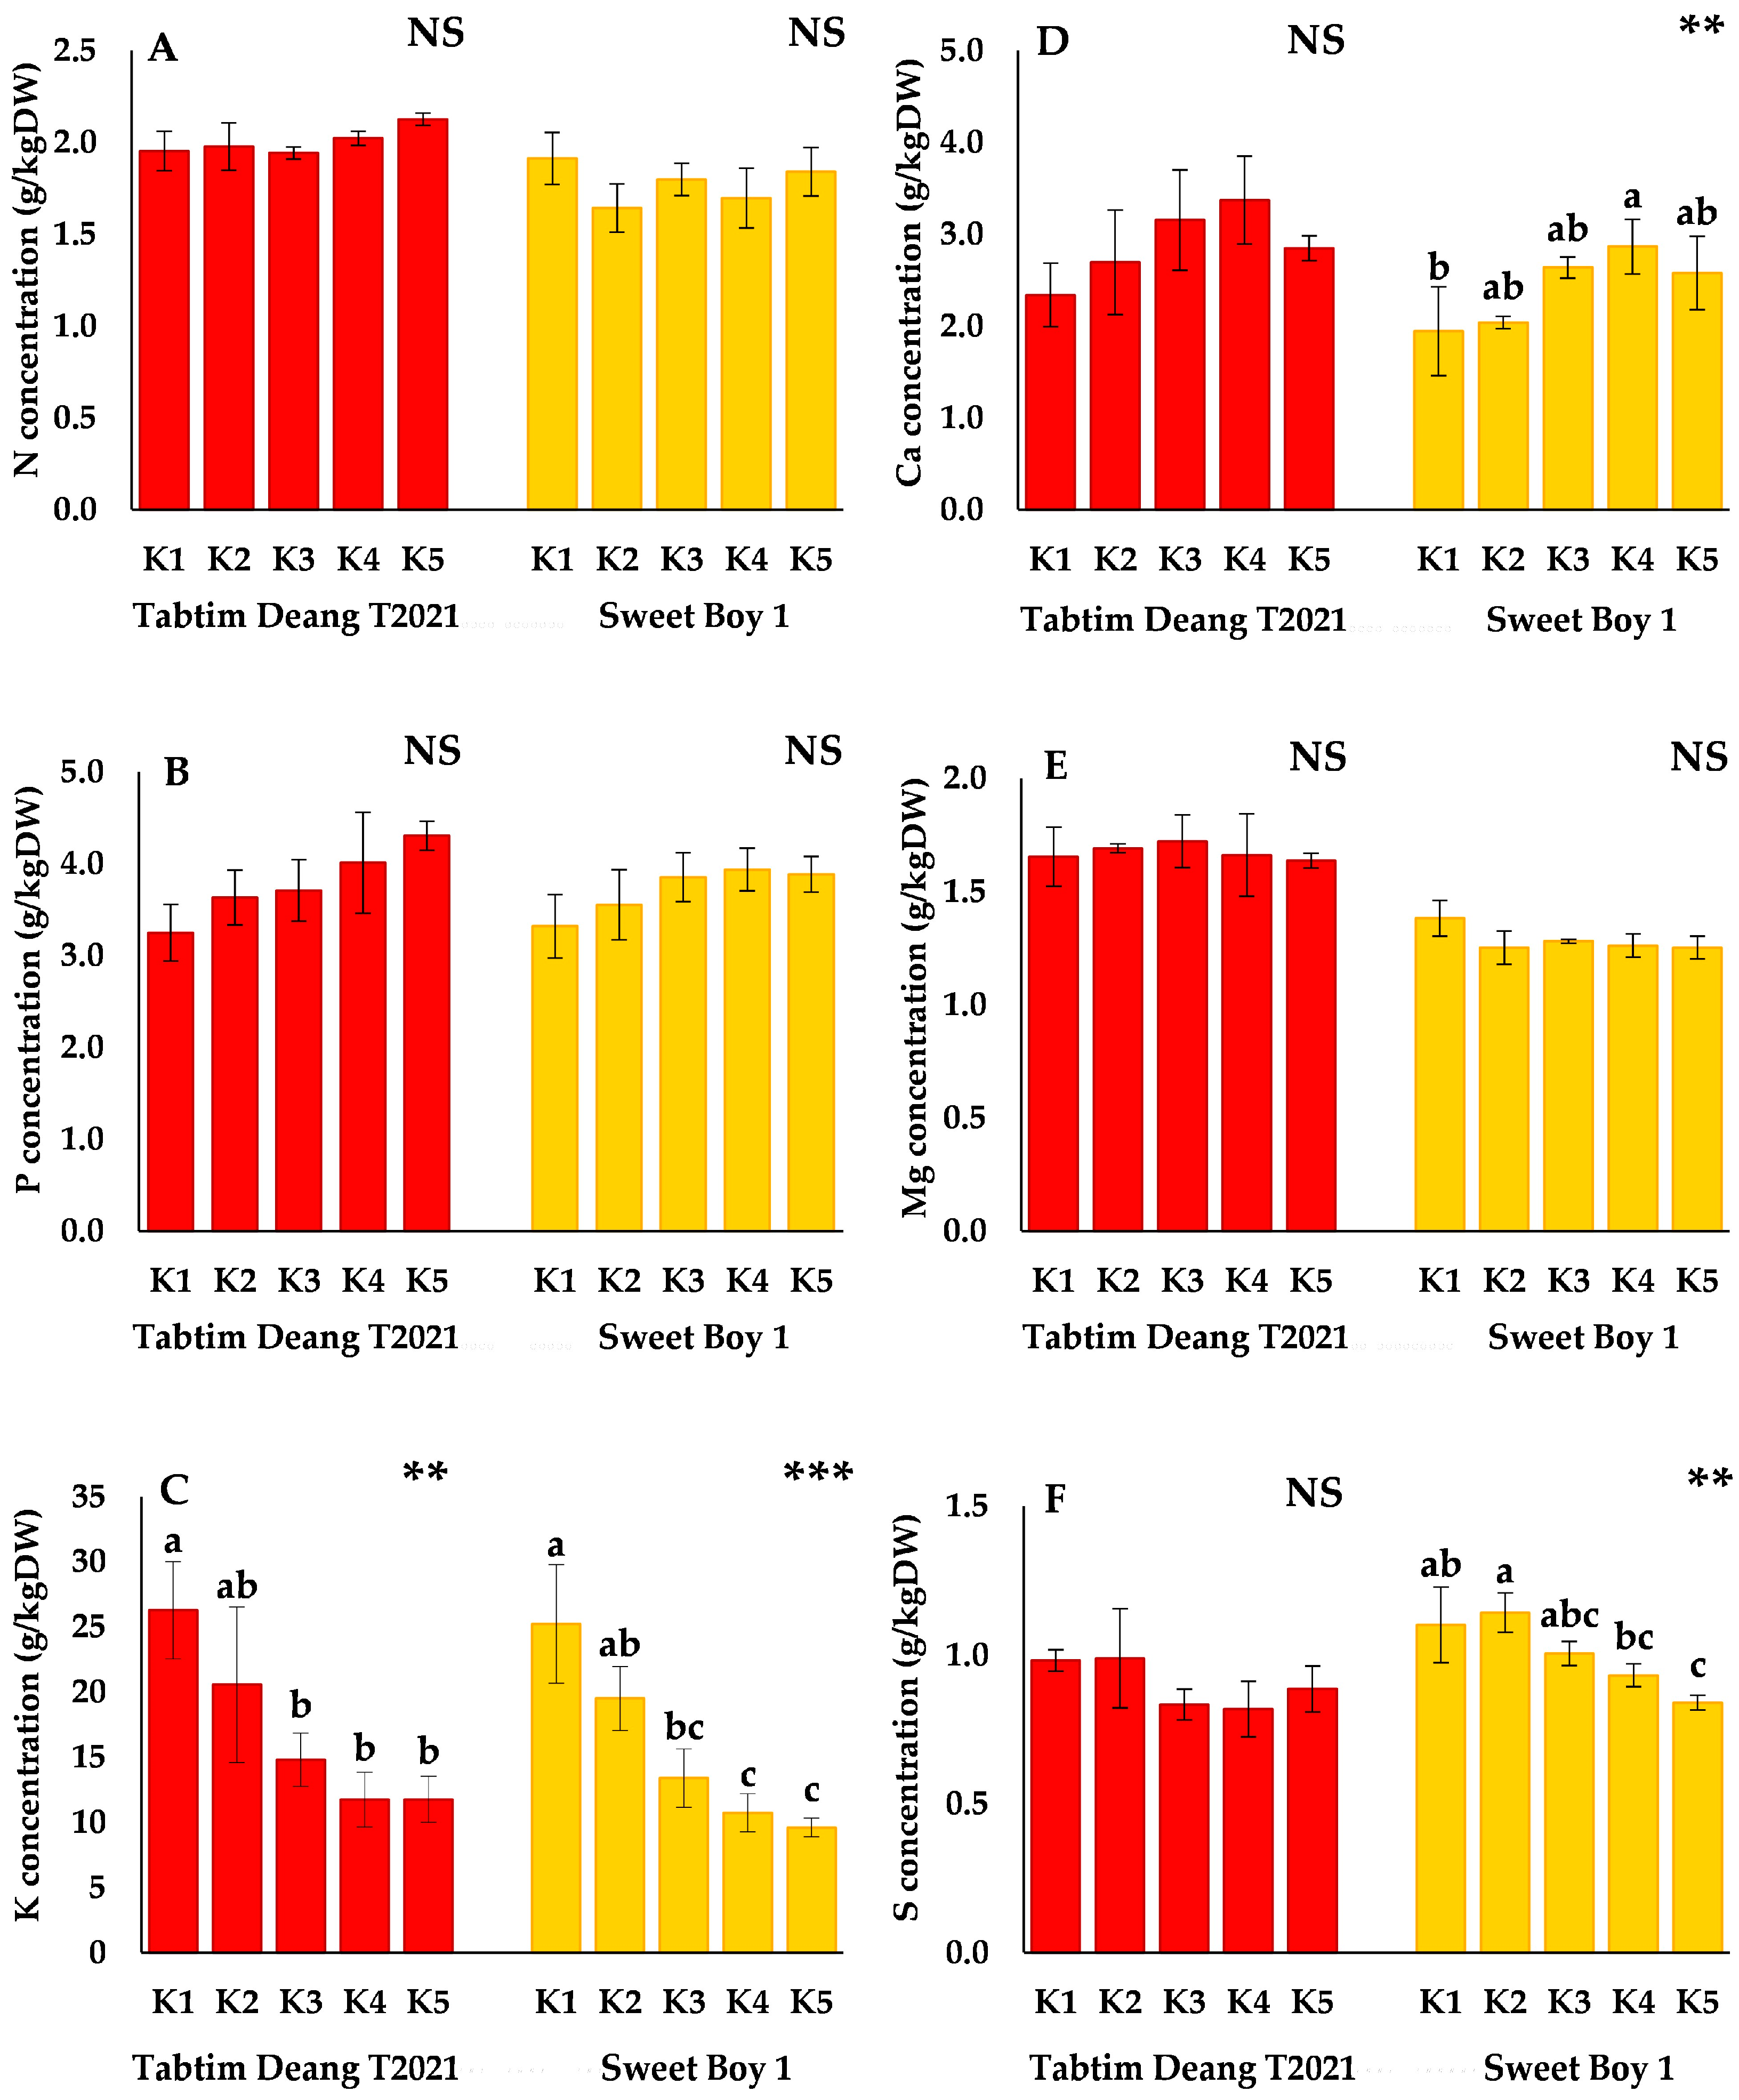
Compared to the control (K1), the concentrations of N, P, and Mg did not significantly differ across the K treatments for both varieties (
Figure 1A,B,E). However, the P concentration gradually increased from K1 to K5 in 'Tabtim Deang T2021'. K concentration significantly decreased by lowering the K concentration in the nutrient solution (
Figure 1C). Additionally, the Ca concentration gradually increased in 'Tabtim Deang T2021', excluding K5, where it decreased to 2.85±0.14 g/kgDW. In contrast, the Ca concentration in 'Sweet Boy 1' significantly increased, with the highest value observed in K4 (2.86±0.30 g/kgDW) (
Figure 1D). Compared to that in K1, the sulfur (S) concentration of 'Sweet Boy 1' also showed significant differences, with a marked decrease in the S concentration as the KNO₃ content in the nutrient solution increased. The lowest value was observed in K5 (0.84±0.002 g/kgDW) (
Figure 1F).
3.2.2. Micronutrients
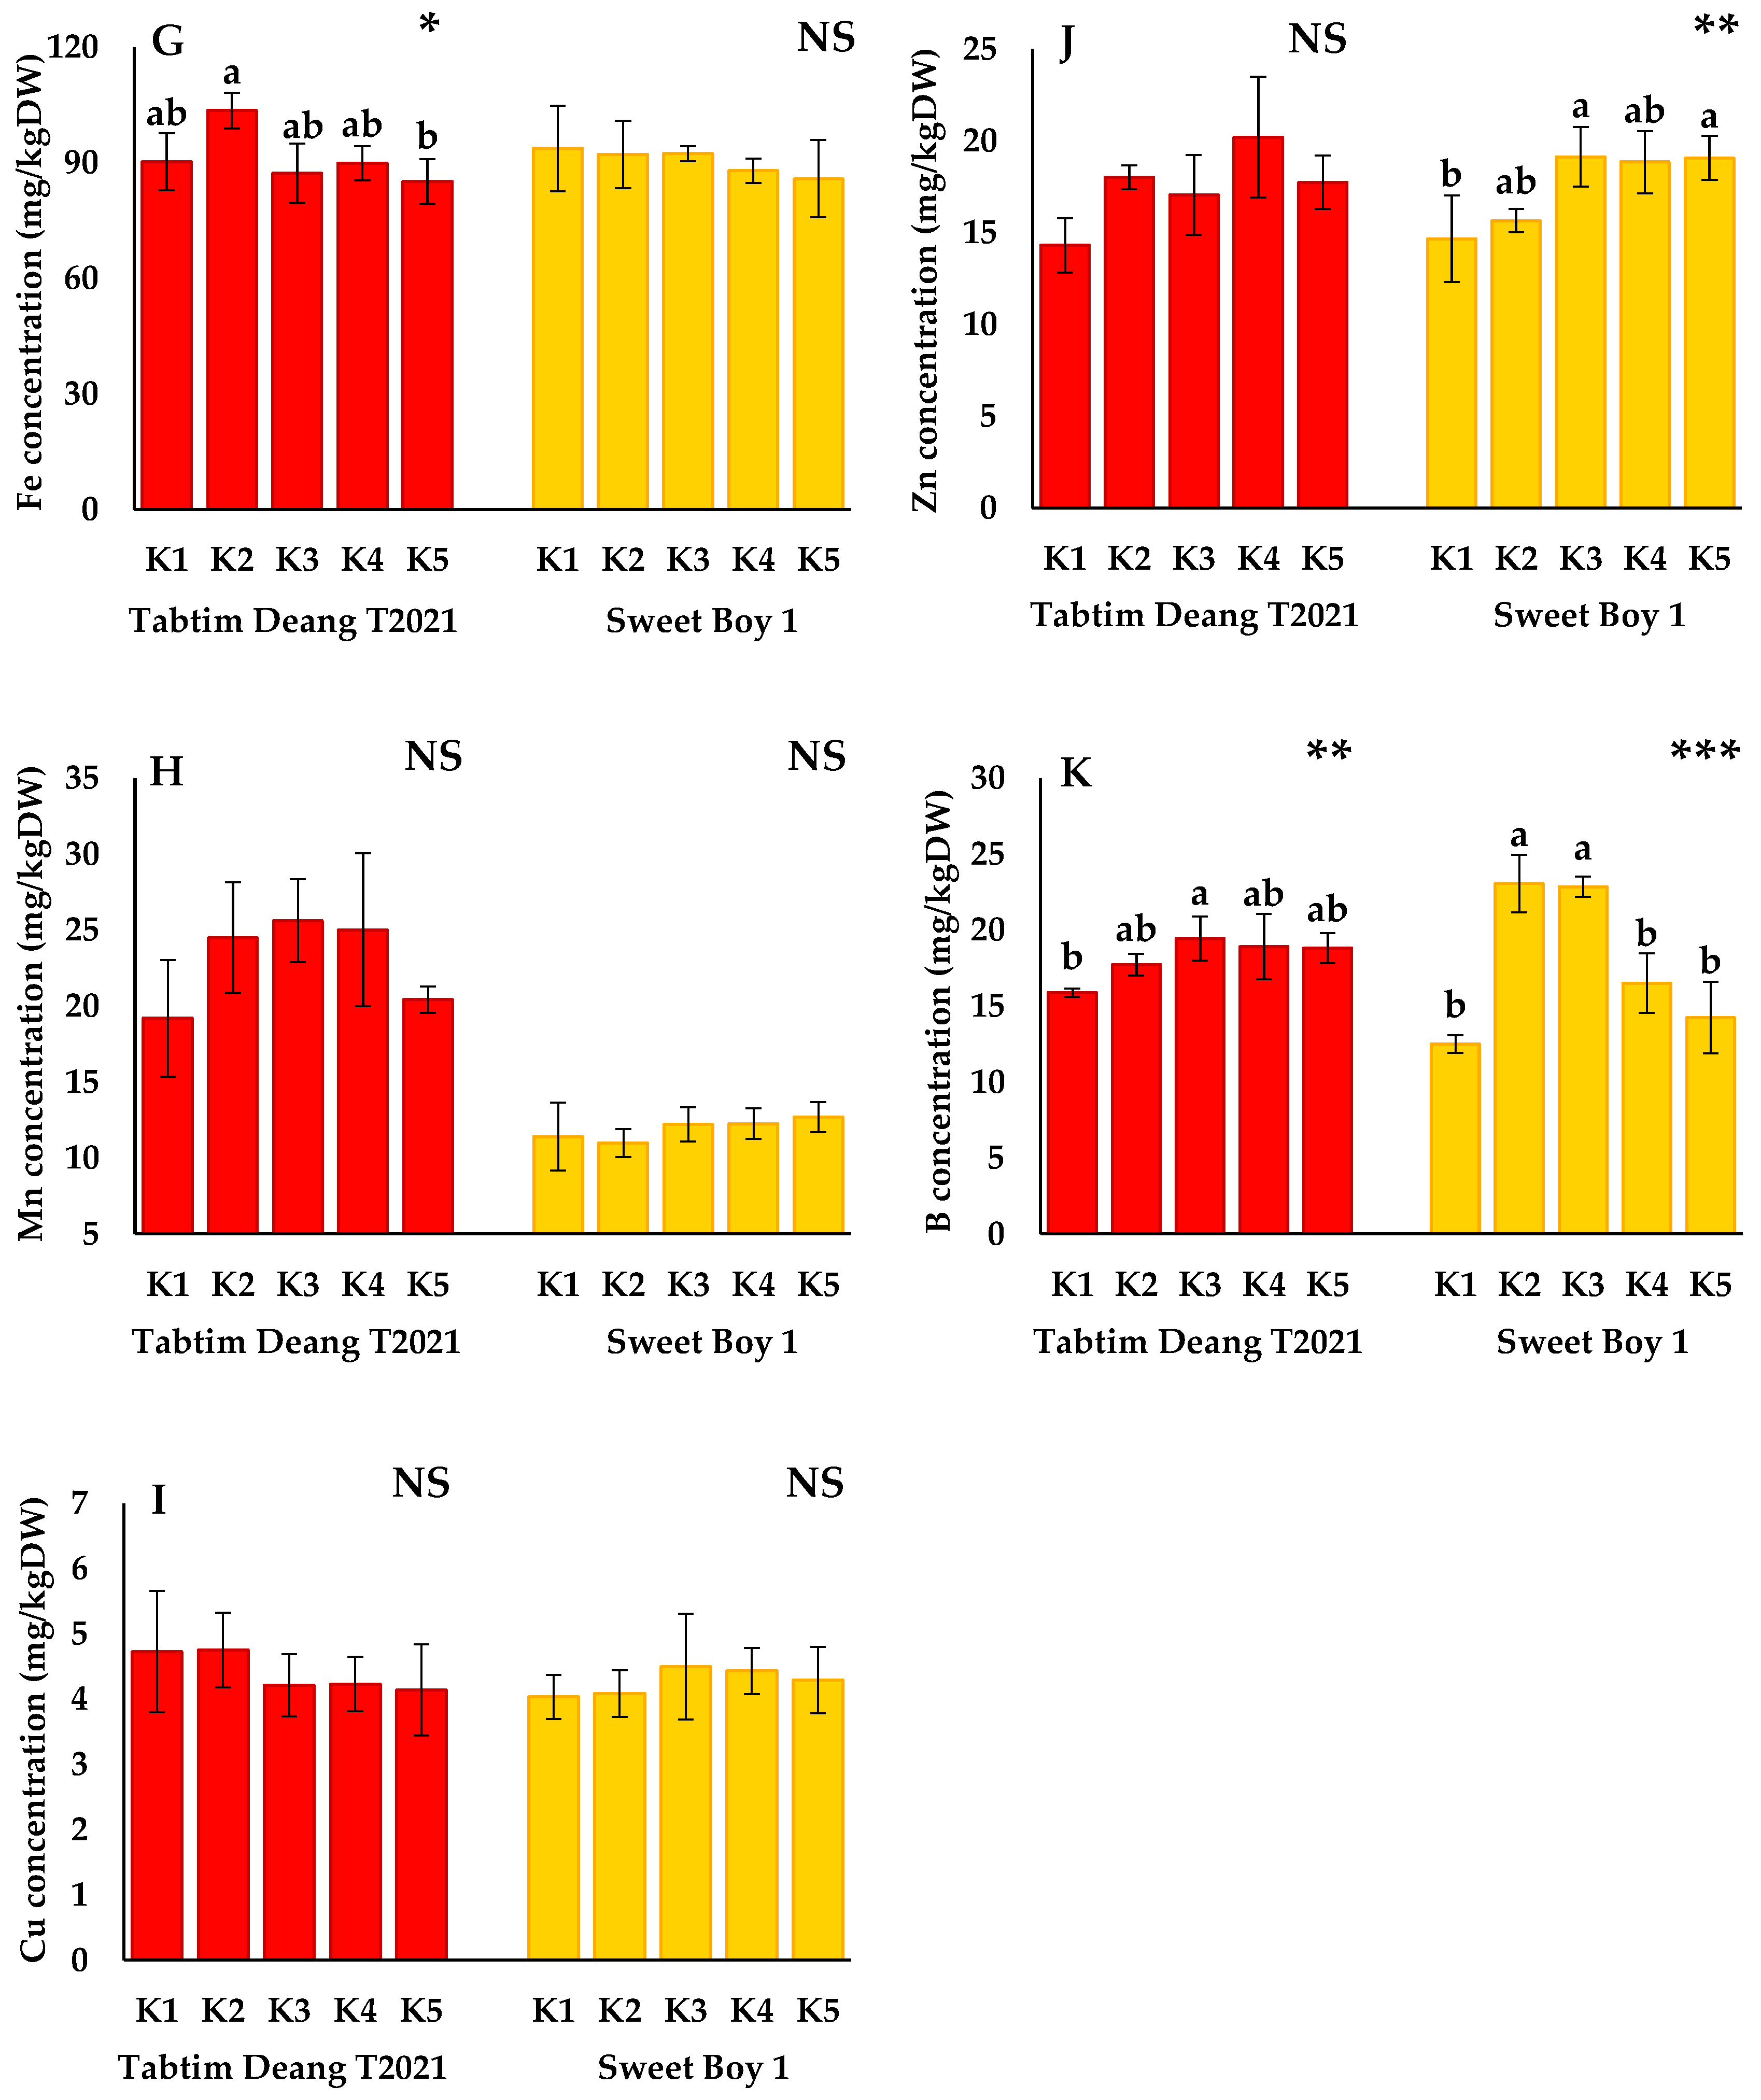
The micronutrient concentrations of ‘Tabtim Deang T2021’ and ‘Sweet Boy 1’ are presented in
Figure 2. The concentrations of Fe (
Figure 2G) in ‘Tabtim Deang T2021’ were significantly different from those in the control, with the Fe concentration being significantly higher under the K2 treatment (103.6±4.7 mg/kgDW) compared to the K1 treatment. However, the Fe concentration under the K5 treatment (85.2±5.8 mg/kgDW) was significantly lower than that in K1. In contrast, there were no significant differences in Fe concentrations between K1 and the other treatments for the ‘Sweet Boy 1’ variety. The Zn concentrations in ‘Sweet Boy 1’ were significantly higher under the K2 (15.7±0.6 mg/kgDW), K3 (19.1±1.6 mg/kgDW), K4 (18.9±1.7 mg/kgDW), and K5 (19.7±1.2 mg/kgDW) treatments compared to K1 (14.7± 2.4 mg/kgDW). The significantly highest Zn concentrations were recorded under K3 and K5. However, no significant differences in Zn concentration were observed in ‘Tabtim Deang T2021’ (
Figure 2J). Furthermore, the Mn concentration ranging from 11.0±0.9 to 25.6±2.7 mg/kgDW (
Figure 2H) and Cu concentration ranging from 4.1±0.7 to 4.8±0.6 mg/kgDW showed no significant differences under the K2, K3, K4, and K5 treatments compared to K1 for both varieties (
Figure 2I). Additionally, the B concentration in the fruit gradually increased with the reduction of K in nutrient solution, with the highest significant were observed in the K3 treatment (19.4±1.4 mg/kgDW) of ‘Tabtim Deang T2021’, and the K2 (23.1±1.9 mg/kgDW) and K3 (22.9±0.7 mg/kgDW) in ‘Sweet Boy 1’ (
Figure 2K).
3.3. Biological Properties and Antioxidant Activity
The biological properties of the tomatoes are presented in
Table 2. The results indicate that the pH values of the tomato juice, as well as the citric acid and ascorbic acid contents, slightly decreased with KNO₃ treatment in ‘Tabtim Deang T2021’. Moreover, total soluble solids (TSS) significantly decreased in K3 (4.43±0.12 %Brix), K5 (4.29±0.44 %Brix), and K4 (4.18±0.02 %Brix), but not K2 (5.31±0.28 %Brix), where no significant difference was observed between K1 and K2. The pH, TSS, and citric acid and ascorbic acid contents in ‘Sweet Boy 1’ differed from those in ‘Tabtim Deang T2021’, showing significant decreases with KNO₃ treatment. The lowest significant values for pH (4.15±0.07), TSS (5.99±0.32 %Brix), citric acid (6.11±0.26 g/gFW), and ascorbic acid (0.42±0.01 mg/gFW) were observed in K5. Additionally, the ascorbic acid content K2 (0.45±0.02 mg/gFW) showed no significant difference compared to that in K1.
The beta-carotene content in ‘Tabtim Deang T2021’ and ‘Sweet Boy 1’ showed a non-statistically significant difference in K1. The beta-carotene content decreased slightly with KNO₃ treatment in both varieties, ranging from 17.90±2.15 to 18.69±2.39 µg/gFW in ‘Tabtim Deang T2021’ and from 7.71±1.45 to 9.09±2.15 µg/gFW in ‘Sweet Boy 1’. The lycopene content in ‘Tabtim Deang T2021’ gradually decreased with KNO₃ treatment; however, no significant differences were observed compared to K1, with the lycopene content ranging from 36.00±2.67 to 43.05±6.04 µg/gFW. This value was slightly lower than the typical range for cherry tomatoes, which contain between ranges of 48.9 to 116.7 µg of lycopene per gram of fresh weight [
45]. In contrast, the lycopene content could not be determined in ‘Sweet Boy 1’, as only red tomatoes contain the lycopene pigment.
The antioxidant activities of the tomatoes are shown in
Table 3. The FRAP activities of ‘Tabtim Deang T2021’ and ‘Sweet Boy 1’ showed no significant differences in K1. Similar to the FRAP activity ranging from 1.478±0.010 to 1.493±0.001 EC
50 mg ascorbic acid equivalent/1 gDW, the DPPH activity ranging from 0.065±0.003 to 0.089±0.026 EC
50 mg ascorbic acid equivalent/1 gDW in ‘Sweet Boy 1’ showed no significant differences under the KNO
3-reduced treatment with K1. Moreover, significantly increased DPPH activity was determined in ‘Tabtim Deang T2021’. The highest significance was found in the activities of DPPH determined in K3 (0.082±0.015 EC
50 mg ascorbic acid equivalent/1 gDW) and K5 (0.082±0.012 EC
50 mg ascorbic acid equivalent/1 gDW).
3.4. Correlation Between the Potassium Content, Yield, Quality of Fruit, and Antioxidant Activity
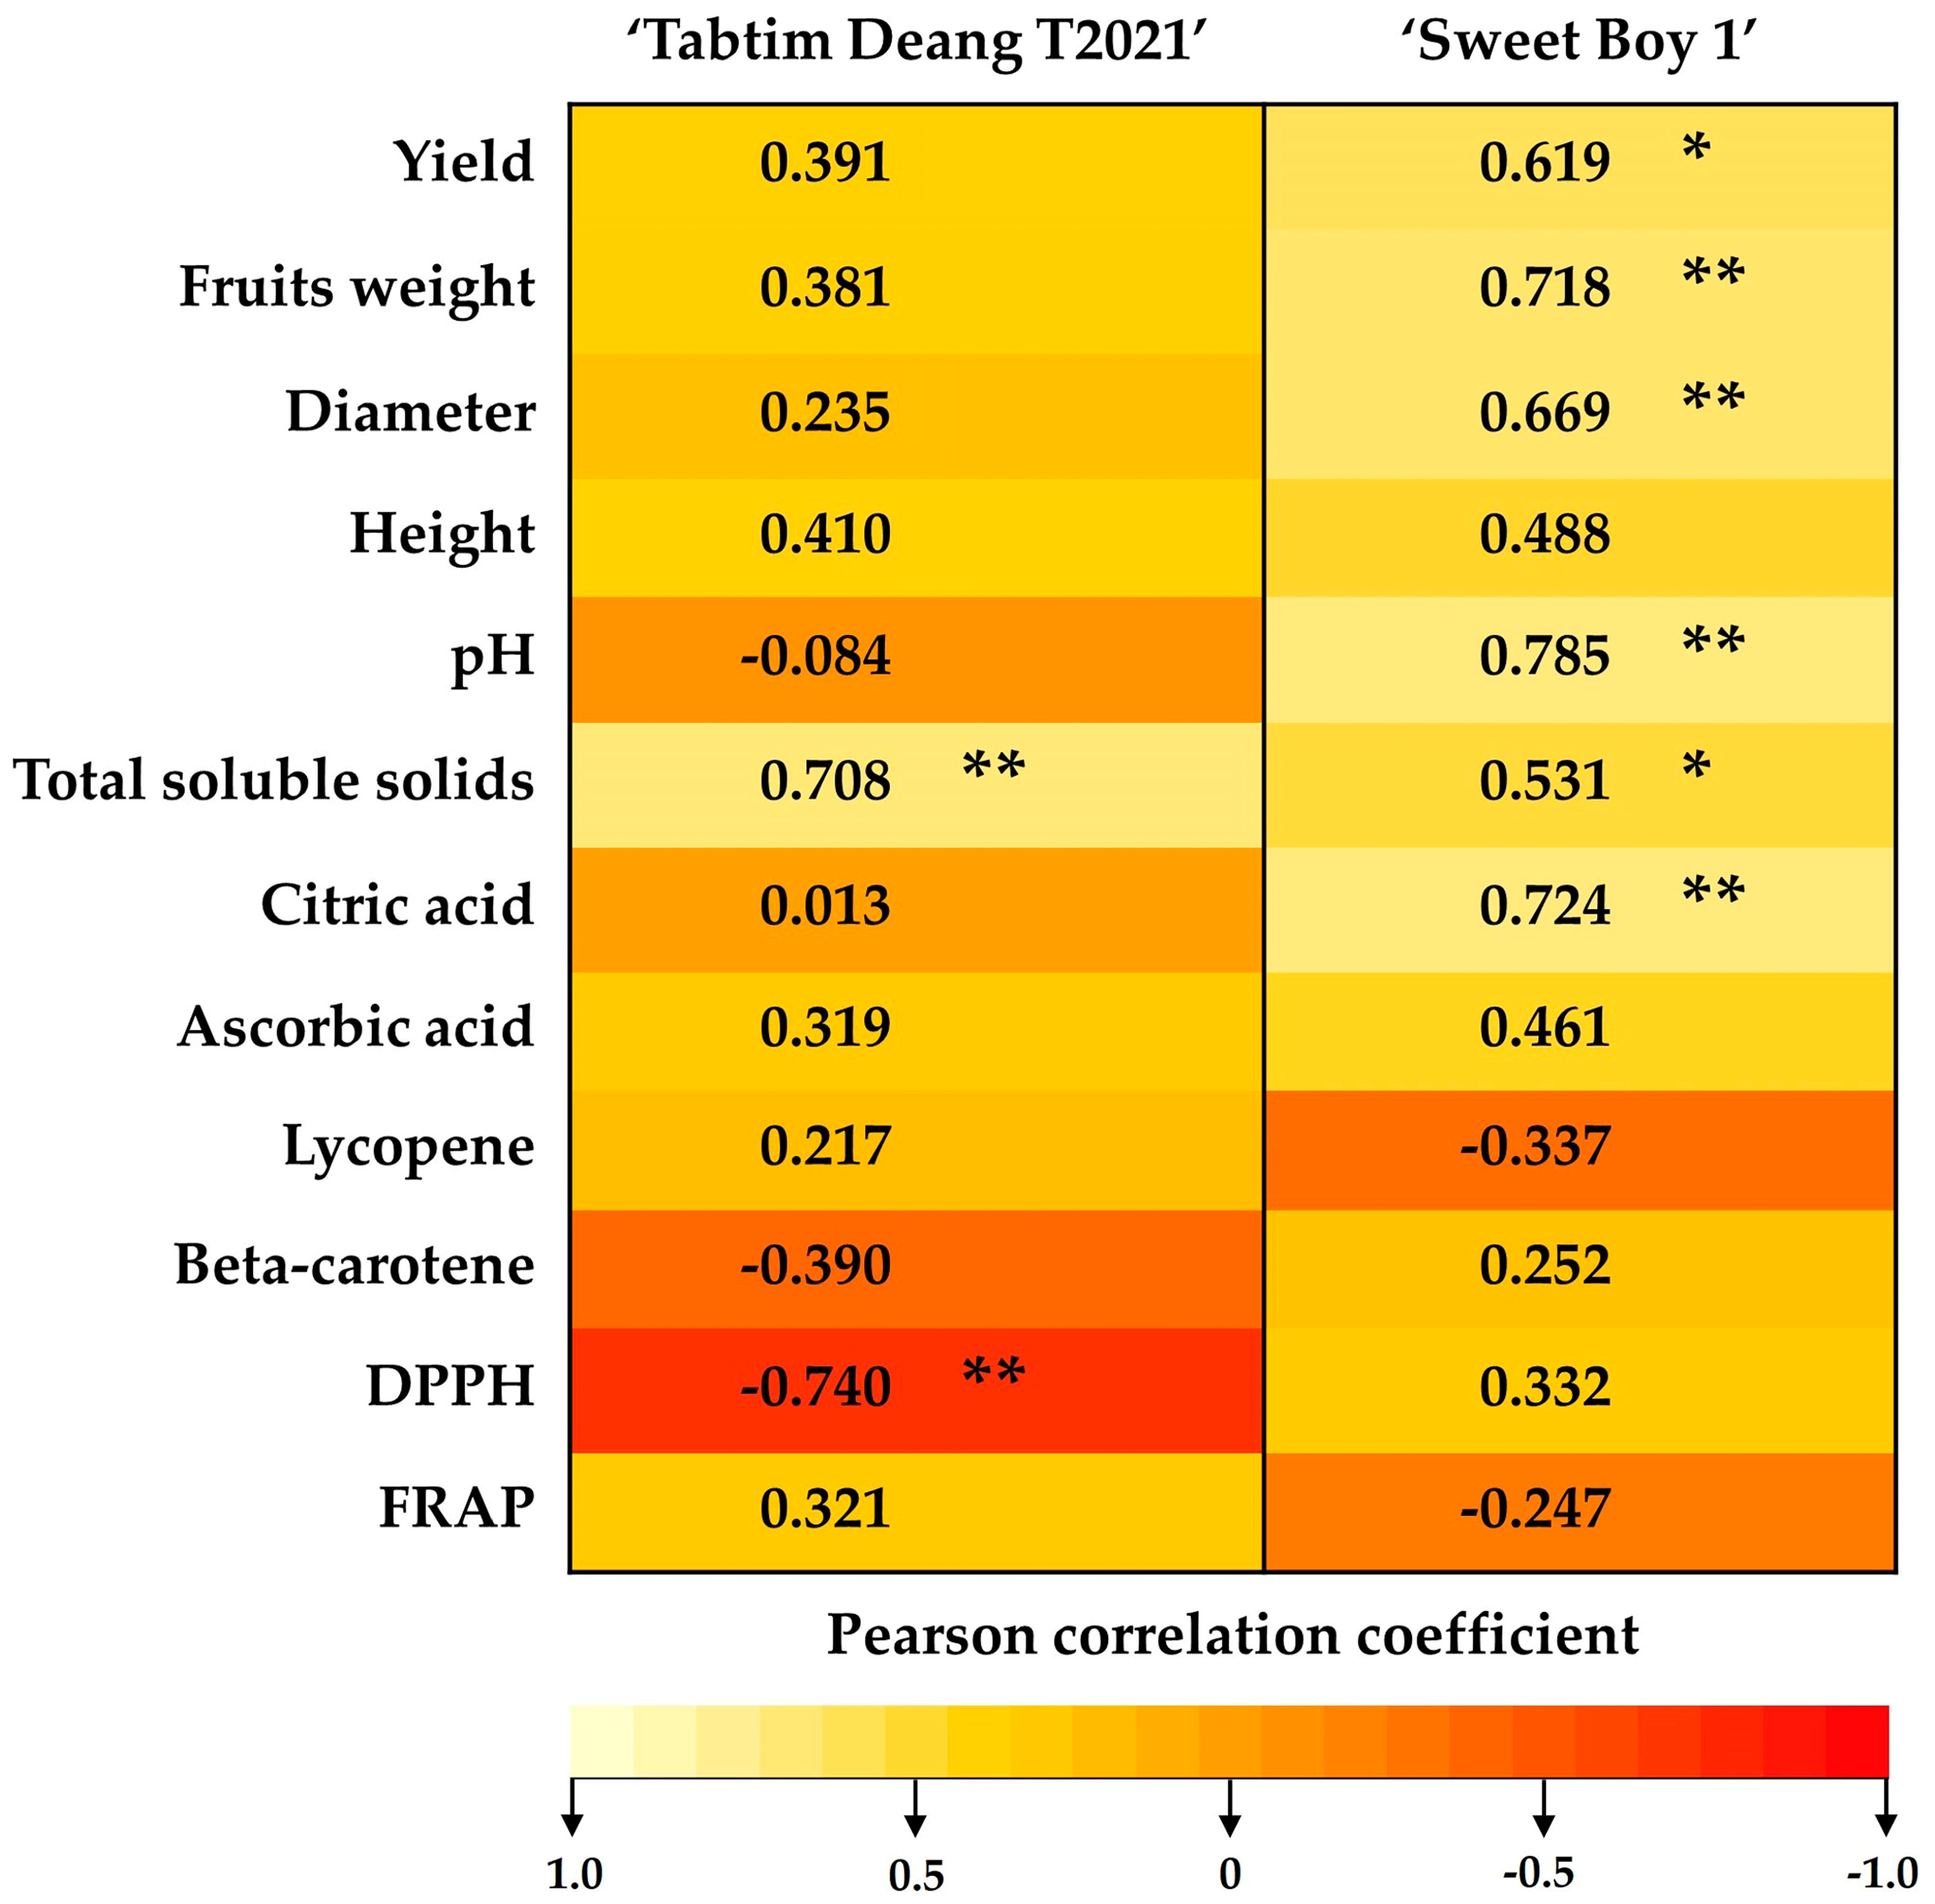
The correlation analysis results are presented in
Figure 3. The cherry tomato varieties under study exhibited different responses. In the ‘Sweet Boy 1’ variety, the yield, fruit weight, and diameter were significantly positively correlated with the K content (r = 0.619); in comparison, no such correlation was observed in the ‘Tabtim Deang T2021’ variety. Plant height in both cherry tomato varieties were not significantly correlated with the KNO₃ content. The pH value showed a significant positive correlation with the K content in ‘Sweet Boy 1’ (r = 0.785); however, this was not true for ‘Tabtim Deang T2021’. Total soluble solids in both varieties were significantly positively correlated with the K content in ‘Tabtim Deang T2021’ (r = 0.708) and ‘Sweet Boy 1’ (r = 0.531). Additionally, the citric acid content was positively correlated with the K content in ‘Sweet Boy 1’ (r = 0.724). There were no significant correlations between the K content and the levels of lycopene or beta-carotene in both varieties. However, the antioxidant activity was generally not significantly correlated with the K content except for DPPH activity in the ‘Tabtim Deang T2021’ variety, which exhibited a significant negative correlation with the K content (r = -0.740).
4. Discussion
The above results indicate that reducing the KNO₃ content in the nutrient solution had a significant impact on yield, fruit weight, and fruit size, primarily due to potassium's critical role in various physiological processes within plants. K is a vital element for photosynthesis, a process essential for plant growth and energy production [46-47]. Additionally, K is integral to physiological processes that involve water, such as stomatal regulation, the translocation of photo-assimilates, enzyme activation, and heliotropic leaf movements [
48]. K deficiency can severely suppress the biosynthesis and activity of Rubisco, a crucial enzyme for carbon dioxide fixation during photosynthesis. This deficiency directly affects plant growth and yield [49-50]. In their study, Tsukagoshi et al. [
37] observed that K deficiency in the cherry-type tomato (
Solanum lycopersicum L.) 'Carol 10' led to reduced dry weight of leaves and stems, decreased yield, and a lower number of fruits, ultimately resulting in diminished overall plant growth. The antagonistic effect of K on Mg is stronger than that of Mg on K in root absorption and transport within plants tissues may be antagonistic or synergistic because Mg
2+ and K
+ cations play important roles in maintaining cellular pH balance, and K
+, a major osmolyte in vacuoles, is essential for stomatal opening [
51].
Our results demonstrate that reducing KNO₃ in the nutrient solution significantly influenced plant nutrient uptake, particularly affecting the Ca in the tomato fruits. K, as the most abundant cation in plants, plays a critical role in maintaining the osmotic potential of plant cells, which is essential for mitigating stress. Low K levels can trigger stress responses, leading to alterations in ion transport and accumulation. Elevated Ca levels may function as secondary messengers in stress signaling pathways [
52]. These mechanisms are vital for managing nutrient imbalances in crops and refining plant nutrition strategies. However, K uptake is also influenced by plant-specific factors, including genetic makeup and developmental stages, such as the vegetative and reproductive phases [
53].
Specifically, in the ‘Tabtim Deang T2021’ cultivar, a decrease in KNO₃ led to lower Fe (
Figure 2H) and higher B (
Figure 2L) concentrations. The uptake of Ca can interfere with Fe absorption. These elements may compete with Fe for uptake or affect root exudates that solubilize Fe [54-55]. In the cultivar ‘Sweet Boy 1’, the reduction in KNO₃ in the nutrient solution led to a decrease in the S concentration (
Figure 1F) and an increase in the Zn and B concentration, as observed in
Figure 2K,L. S and N are essential nutrients interconnected in plant metabolic pathways [56-57]. S is critical for the synthesis of specific amino acids and vitamins and for allowing plants to absorb nutrients, increasing the Zn content in plant tissues [
58]. Zn and K also exhibited a significant synergetic relationship in soil and plants by influencing the uptake of both nutrients. The interaction between K and Zn has a synergistic effect on the uptake of different nutrients by plants [
59]. However, decreasing the KNO₃ content also reduces N and P availability, which can impact sulfur metabolism in the plant. While reduced K levels can enhance Zn uptake, this state may also have implications for the nutrient balance in the plant [60-61].
Our results indicate that K is a key activator of numerous vital enzymes involved in processes such as protein synthesis, sugar transport, N and carbon (C) metabolism, and photosynthesis. It plays a significant role in yield formation and quality enhancement [
27,
62]. Hermans et al. [
63] demonstrated that inorganic compounds such as sugars and amino acids accumulate in plants with low K levels. In their study, Al-Moshileh et al. [
64] highlighted potassium's involvement in the regulation of stomatal conductance through the opening and closing of guard cells, which also influences photosynthesis. These functions can indirectly impact sugar production and accumulation in fruits. Takahashi et al. [
37] further reported that K restriction for less than ten weeks in pot culture with fertigation did not significantly affect the mean fruit weight, soluble sugar content, and titratable acidity in blueberry fruits, indicating that low K conditions can be managed without compromising these fruit quality parameters.
However, low K levels adversely affect the synthesis and accumulation of lycopene and beta-carotene in tomato fruits due to potassium's critical role in activating enzymes involved in photosynthesis, protein synthesis, and carbohydrate metabolism [65-66]. Efficient enzyme activity is essential for the synthesis of secondary metabolites, such as carotenoids. K also influences the development and function of chloroplasts, which are key sites for carotenoid biosynthesis, including beta-carotene, an important compound for photosynthesis and photoprotection [67-68]. Moreover, K may play a role in the synthesis of lycopene, as it potentially acts as an activator of enzymes responsible for converting beta-carotene to lycopene in tomato fruits [26,69-70].
K affects the antioxidant activity in plants by influencing factors such as the phenolic composition, flavonoid content, and plant health. In the study by [
71], foliar (potassium sulfate) spray influenced the biochemical profile of the total fig fruit and achenes by increasing the expression of phenolic compounds, which was correlated with the strong antioxidant potential of figs. In Marlin et al.’s study [
72], the authors’ results indicate that application of N and K fertilizer improved the polyphenol content and antioxidant activities such as DPPH radical scavenging activity and ferric ion reducing antioxidant power in
Eleutherine palmifolia. The results of our study could prove useful in improving the health of kidney patients by maximizing the diet quality for CKD patients.
5. Conclusions
Our results demonstrate that both ‘Tabtim Deang T2021’ and ‘Sweet Boy 1’ cherry tomato plants cultivated with a 1.5 mM KNO₃ nutrient solution exhibited a successful reduction in K content in their fruits without the induction of significant K deficiency symptoms. This reduction was achieved without adversely affecting the fresh weight, fruit quality, and antioxidant activity. The successful decrease in K levels observed in both cherry tomato varieties have significant implications for dietary management, particularly for patients with kidney disease, offering potential health benefits by providing low-K fruits. Even those without health problems can consume such fruits while benefiting from the same level of nutrients. Further research is needed to investigate the role of plant growth hormones in enhancing the development and yield of cherry tomatoes cultivated under low K conditions in hydroponic systems because of the production sustainability of low K (fruits and vegetables) for CKD patients, the optimizing plant growth under limited K availability is essential.
Author Contributions
Conceptualization, K.M., A.S., R.K., S.A., and P.K.; validation, K.M., A.S., and R.K.; formal analysis, K.M., A.S., and R.K.; investigation, K.M., A.S., and R.K.; data curation, K.M.; writing—original draft preparation, K.M.; writing—review and editing, K.M., A.S., R.K., S.A., and P.K.; visualization, K.M.; supervision, A.S. and R.K; funding acquisition, A.S. and S.A. All authors have read and agreed to the published version of the manuscript.
Funding
This research was supported by Khon Kaen University under the Chronic Kidney Disease Northeast Thailand Research Project (CKDNET. 2018).
Data Availability Statement
The original contributions presented in this study are included in the article; further inquiries can be directed toward the corresponding author.
Acknowledgments
We would like to extend our sincere thanks to the Faculty of Agriculture, Khon Kaen University, for providing access to their laboratory facilities, equipment, and greenhouse for our research. Your support was invaluable to the success of this research. The authors would like to especially thank the AMS Medical Laboratory, Faculty of Associated Medical Sciences, Khon Kaen University, for providing the facilities and support necessary to conduct the FRAP and DPPH assay analyses. This research was financially supported by Khon Kaen University through the Chronic Kidney Disease Northeast Thailand Research Project (CKDNET, 2018). We gratefully acknowledge this funding and support.
Conflicts of Interest
The authors declare no conflicts of interest.
References
- Martí, R.; Roselló, S.; Cebolla-Cornejo, J. 2016. Tomato As a Source of Carotenoids and Polyphenols Targeted to Cancer Prevention. Cancers (Basel) 2016, 8, 58-86. [CrossRef]
- Raiola, A.; Rigano, M.M.; Calafiore, R.; Frusciante, L.; Barone, A. Enhancing the Health-Promoting Effects of Tomato Fruit for Biofortified Food. Mediat Inflamm. 2014, 1, 139873. [CrossRef]
- Bügel, S. Vitamin K and Bone Health. Proc. Nutr. Soc. 2003. 62, 839 – 843.
- Fekete, K.; Berti, C.; Trovato, M.; Lohner, S.; Dullemeijer, C.; Souverein, O.W.; Cetin I.; Decsi. T. Effect of Folate Intake on Health Outcomes in Pregnancy: A Systematic Review and Meta-analysis on Birth Weight, Placental Weight, and Length of Gestation. Nutr. J. 2012, 11, 75. [CrossRef]
- Story, E. N., R. E. Kopec, S. J. Schwartz and G. K. Harris. An Update on The Health Effects of Tomato Lycopene. Annu. Rev. Food Sci. Technol. 2010, 1, 189 - 210. [CrossRef]
- Burton-Freeman, B; Reimars, K. Tomato Consumption and Health: Emerging Benefits. Am. J. Lifestyle. Med. 2011, 5, 182-191.
- Tomatoes, Red, Ripe, Raw, Year-Round Average. U.S. Department of Agriculture. USDA. 2019, Available online: https://fdc.nal.usda.gov/fdc-app.html#/food-details/170457/nutrients. (accessed on 11 October 2023).
- St-Jules, D.E.; Goldfarb, D.S.; Sevick. M.A. Nutrient Non-Equivalence: Does Restricting High-Potassium Plant Foods Help to Prevent Hyperkalemia in Hemodialysis Patients. J. Ren. Nutr. 2016, 26, 282-287. [CrossRef]
- Yamada, S; Inaba. M. Potassium Metabolism and Management in Patients with CKD. Nutr. 2021, 13, 1751. [CrossRef]
- Ceccanti, C.; Guidi, L; D’Alessandro, C.; Cupisti. A. Potassium Bioaccessibility in Uncooked and Cooked Plant Foods: Results from A Static in Vitro Digestion Methodology. Toxins (Basel). 2022. 14: 668. [CrossRef]
- Ogawa, A.; Taguchi, S.; Kawashima, C. A Cultivation Method of Spinach with A Low Potassium Content for Patients on Dialysis (In Japanese with English Abstract). Jpn. J. Crop. Sci. 2007, 76, 232-237.
- Amtmann, A.; Hammond, J.P.; Armengaud, P.; White, P.J. Nutrient Sensing and Signaling in Plants: Potassium and Phosphorus. Adv. Bot. Res. 2005, 43, 209-257.
- Ogawa, A.; Yamauchi, A. Root Osmotic Adjustment Under Osmotic Stress in Maize Seedlings 2. Mode of Accumulation of Several Solutes for Osmotic Adjustment in Root. Plant. Prod. Sci. 2006, 9, 39 - 46.
- Fageria, N.K.; Baligar, V.C.; Jones, C.A. Growth and Mineral Nutrient of Field Crops. 3rd ed., CRC Press, New York. 2011, pp 199-200.
- White, P.J.; Karley, A.J. Potassium Cell Biology of Metals and Nutrients. Berlin: Springer, 2010, 199-224.
- Pujos, A.; Morard, P. Effects of Potassium Deficiency on Tomato Growth and Mineral Nutrition at The Early Production Stage. Plant. Soil. 1997, 189, 189–196. [CrossRef]
- Chen, S.; Yan, Z.; Chen, Q. Estimating the Potential to Reduce Potassium Surplus in Intensive Vegetable Fields of China. Nutr. Cycl. Agroecosys. 2017, 107, 265 - 277. [CrossRef]
- Zhu, Q.; Ozores-Hampton, M.; Li, Y.; Morgan, K.; Lu, Y. Potassium Rages Affected Potassium Uptake and Use Efficiency in Drip-Irrigated Tomato. J. Agron. 2017, 109, 2945-2956.
- Liu, K.; Zhang, T.; Tan, C.; Astatkie, T. Responses of Fruit Yield and Quality of Processing Tomato to Drip-Irrigation and Fertilizers Phosphorus and Potassium. Agron. J. 2011, 103, 1339 - 1345. [CrossRef]
- Voogt, W.; Sonneveld, C. Nutrient Management in Closed Growing Systems for Greenhouse Production. In: Plant Production in Closed Ecosystems Automation, Culture and Environment. Kluwer Academic Press Dordrecht. 1996, 83 - 102.
- Huett, D.O.; Dettmann, E.B. Effect of Nitrogen on Growth, Fruit Quality and Nutrient Uptake of Tomatoes Grown in Sand Culture. Aust. J. Exp. Agric. 1988, 28, 391-399. [CrossRef]
- Chapagain, B.P.; Wiesman, Z. Effect of Nutri-Vant-Pea K Foliar Spray on Plant Development, Yield, and Fruit Quality in Greenhouse Tomatoes. Sci. Horti. 2004, 102, 177-188.
- Hartz, T.K.; Johnstone, P.R.; Francis, D.M.; Miyao, E.M. Processing Tomato Yield and Fruit Quality Improved with Potassium Fertigation. Hort. Sci. 2005, 40, 1862-1867. [CrossRef]
- Besford, R.T.; Maw, G.A. Effect of Potassium Nutrition on Some Enzymes of The Tomato Plant. Ann. Bot. 1976, 40, 461-471. [CrossRef]
- Mengel, K.; Kirkby, E.A. Principles of Plant Nutrition. International Potash Institute. Berne. 1987, pp 588-594.
- Madakadze, R.M.; Kwaramba, J. Effect of Pre-Harvest Factors on Quality of Vegetables Produced in The Tropics; Vegetables: Growing Environment and Quality of Produce. 1 - 36. In: Dris, R. and Jain, S.M. Eds. Production Practices and Quality Assessment of Food Crops, Vol. 1. Preharvest Practice. Kluwer Academic Publishers, The Netherlands. 2004,.
- Marschner, H. Marschner’s Mineral Nutrition of Higher Plants. Cambridge, MA: Academic Press. 2012,.
- Liu, X. Effect of Low-Potassium Nutrition on The Quality and Potassium Content of Leafy Vegetables. Master’s Thesis, South China Agricultural University, Guangzhou, China. 2016,.
- Ogawa, A.; Eguchi, T.; Toyofuku, K. Cultivation Methods for Leafy Vegetables and Tomatoes with Low Potassium Content for Dialysis Patients. Environ. Control. Biol. 2012, 50, 407-414. [CrossRef]
- Asao, T.; Asaduzzaman, M.; Mondal, M. F.; Tokura, M.; Adachi, F.; Ueno, M.; Kawaguchi, M.; Yano, S.; Ban, T. Impact of Reduced Potassium Nitrate Concentration in Nutrient Solution on The Growth, Yield Fruit Quality of Melon in Hydroponics. Sci. Hortic. 2013, 164, 221-231.
- Ogawa, A.; Fujita, S.; Toyofuku, K. A Cultivation Method for Lettuce and Spinach with High Levels of Vitamin C Using Potassium Restriction. Environ. Control Biol. 2014, 52, 95–99. [CrossRef]
- Mondal, M.F.; Asaduzzaman, M.; Ueno, M.; Kawaguchi, M.; Yano, S.; Ban, T.; Asao, T. Reduction of Potassium (K) Content in Strawberry Fruits Though KNO3 Management of Hydroponic. Hort. 2017, 86, 26-36.
- Zhang, G.; Johkan, M.; Hohjo, M.; Tsukagoshi, S.; Maruo, T. Plant Growth and Photosynthesis Response to Low Potassium Conditions in Three Lettuce (Lactuca Sativa) Types. Hortic. J. 2017, 86, 229–237. [CrossRef]
- Asaduzzaman, M.; Talukder, M.R.; Tanaka, H.; Ueno, M.; Kawaguchi, M.; Yano, S.; Ban, T.; Asao, T. Production of Low-Potassium Content Melon Through Hydroponic Nutrient Management Using Perlite Substrate. Front. Plant Sci. 2018, 9, 1382. [CrossRef]
- Okada, H.; Abedin, T.; Yamamoto, A.; Hayashi, T.; Hosokawa, M. Production of Low-Potassium Onions Based on Mineral Absorption Patterns During Growth and Development. Sci. Hortic. 2020, 267,109252. [CrossRef]
- Takahashi, S.; Che, J.; Horiuchi, N.; Cho, H.Y.; Onwona-Agyeman, S.; Kojima, K.; Yamada, M.; Ogiwara, I. Production of Low-Potassium Fruit of Potted and Fertigated Southern. Highbush Blueberry (Vaccinium Corymbosum L. Interspecific Hybrid). Hortic. J. 2021, 90, 161–171. [CrossRef]
- Tsukagoshi, S.; Aoki, M.; Johkan, M.; Hohjo, M.; Maruo, T.A. Quantitative Management of Potassium Supply for Hydroponic Production of Low-Potassium Cherry-Type Tomato Fruit for Chronic Kidney Disease Patients. J. Horti. 2021, 7, 87. [CrossRef]
- Son, Y.J.; Park, J.E.; Kim, J.; Yoo, G.; Lee, T.S.; Nho, C.W. Production of Low Potassium Kale with Increased Glucosinolate Content from Vertical Farming as A Novel Dietary Option for Renal Dysfunction Patients. Food Chem. 2021, 339, 128092. [CrossRef]
- Renna, M.; Castellino, M.; Leoni, B.; Paradiso, V.; Santamaria, P. Microgreens Production with Low Potassium Content for Patients with Impaired Kidney Function. Nutri. 2018, 10, 675. [CrossRef]
- Gordon, A.; Barrett, D.M. Standardization of A Rapid Spectrophotometric Method for Lycopene Analysis. Acta. Hortic. 2007, 758, 111-128.
- AOAC. Official Methods of Analysis. 16th ed., 5th Revision, Association of Official Analytical Chemists, Washington DC. 1999,.
- Allen, S.E. Chemical Analysis of Ecological Materials. 2nd ed., Blackwell Scientific Publications, Oxford and London. 1989,.
- Brand-Williams, W.; Cuvelier. M.E.; Berset, C. Use of A Free Radical Method to Evaluate Antioxidant Activity. Lebensm. Wiss. Technol. 1995, 28, 25 – 30. [CrossRef]
- Benzie, I.; Strain, J. The Ferric Reducing Ability of Plasma (FRAP) As A Measure of “Antioxidant Power: The FRAP Assay”. Anal. Biochem. 1996, 239, 70-76.
- Setyorini, D.; Sugito, Y.; Aini, N.; Yudho Tyasmoro, S. Lycopene, Beta-Carotene and Productivity of Tomato Varieties at Different Shade Levels Under Medium Land of Indonesia. J. Appl. Hortic. 2018, 20, 92-96. [CrossRef]
- Mengel, K. Potassium. In: Barker, A.V.; Pilbeam, D.J. Eds., Handbook of Plant Nutrition, 1st Ed. Taylor & Francis, London, UK. 2007, pp. 91 – 120.
- Jákli, B.; Tavakol, E.; Tränkner, M.; Senbayram, M.; Dittert, K. Quantitative Limitations to Photosynthesis in K Deficient Sunflower and Their Implications on Water-Use Efficiency. J. Plant Physiol. 2017, 209, 20–30. [CrossRef]
- Hasanuzzaman, M.; Borhannuddin Bhuyan, M.H.M.; Nahar, K.; Shahadat Hossain, Md.; Al Mahmud, J.; Shahadat Hossen, Md.; Masud, A.A.C.; Moumita; Fujita, M. Potassium: A Vital Regulator of Plant Responses and Tolerance to Abiotic Stresses. Agron. 8, 2018, 31. [CrossRef]
- Szczerba, M.W.; Britto, D.T.; Kronzucker, H.J. K+ Transport in Plants: Physiology and Molecular Biology. J. Plant. Physiol. 2009, 166, 447- 466. [CrossRef]
- Sardans, J.; Peñuelas, J. Potassium Control of Plant Functions: Ecological and Agricultural Implications. Plants. 2021, 10, 419. [CrossRef]
- Xie, K.; Cakmak, I.; Wang, S.; Zhang, F.; Guo, S. Synergistic and antagonistic interactions between potassium and. [CrossRef]
- magnesium in higher plants. Crop. J. 2021, 9, 249-256.
- Wang, X.; Ling, H.; Zhu, B.; Jiang, Z. Plant Calcium Signaling in Response to Potassium Deficiency. Int. J. Mol. Sci. 2018, 19, 3456. [CrossRef]
- Rengel, Z.; Damon, P.M.; Cakmak, I. Crops and Genotypes Differ in Efficiency of Potassium Uptake and Use. Physiol. Plant. 2008, 133, 624 - 636. [CrossRef]
- Ma, W.; Tang, S.; Dengzeng, Z.; Zhang, D.; Zhang, T; Ma, X. Root Exudates Contribute to Belowground Ecosystem Hotspots. A Review. Front. Microbiol. 2022, 13, 937940-937958. [CrossRef]
- Wang, T.; Chen, X.; Ju, C.; Wang, C. Calcium Signaling in Plant Mineral Nutrient: From Uptake to Transport. Plant Comm. 2023, 4, 1000678.
- Barker, V.A.; Pilbeam, J.D. Handbook of Plant Nutrition. CRC Press, Taylor and Francis Group, Boca Raton, FL. 2007,.
- Narayan, O.P.; Kumar, P.; Yadav, B.; Dua, M.; Johri, A.K. Plant. Signal. Behav. 2023, 18, e2030082-11.
- Bashir, A.; Khan, Q.U.; Alem, A.; Hendi, A.A.; Zaman, U.; Khan, S.U.; Rehman, K.U.; Khan, A.A.; Ullah, I.; Anwar, Y. Zinc and Potassium Fertilizer Synergizes Plant Nutrient Availability and Affects Growth, Yield, and Quality of Wheat Genotypes. Plants. 2023, 12, 2241. [CrossRef]
- Chaudhary, D.G.; Chaudhary, S.R.; Chaudhary, M.M.; Mor, V.B. Interaction Effect of Potassium and Zinc on Yield and Nutrient Uptake of Forage Maize (Zea Mays L.) Grown on Loamy Sand Soil. Int. J. Chem. Stud. 2017, 5, 1737-1739.
- Brosnan, J.T.; Brosnan, M.E. The Sulfur-Containing Amino Acids: An Overview. J. Nutr. 2006, 136, 1636S-1640S. [CrossRef]
- Arif, M.; Tasneem, M.; Bashir, F.; Yaseen G.; Anwar, A. Evaluation of Different Levels of Potassium and Zinc Fertilizer on The Growth and Yield of Wheat. Int. J. Biosen Bioelectron. 2017, 3, 242-246.
- Oosterhuis, D.; Loka, D.; Kawakami, E.; Pettigrew, W. The Physiology of Potassium in Crop Production. Adv. Agron. 2014, 126, 203–234. [CrossRef]
- Hermans, C.; Hammond, J.P.; White, P.J.; Verbruggen, N. How Do Plants Respond to Nutrient Shortage by Biomass Allocation? Trends Plant Sci. 2006, 11, 610–617.
- Al-Moshileh, A.M.; Errebhi M.A.; Obiadalla-Ali. H.A. Effect of Potassium Fertilization on Tomato and Cucumber Plants Under Greenhouse Conditions. Biosci. Res. 2017, 14, 68-74.
- Wang, Y.; Wu, W.H. Potassium Transport and Signaling in Higher Plants. Annu. Rev. Plant. Biol. 2013, 64, 451-476. [CrossRef]
- Cui, J.; Tcherkez, G. Potassium Dependency of Enzymes in Plant Primary Metabolism. Plant Physi. Biochem. 2021, 166, 522-530. [CrossRef]
- Tränker, M.; Tavakol, A.; Jákli, B. Functioning of Potassium and Magnesium in Photosynthesis, Photosynthate Translocation and Photoprotection. Physiol. Plant. 2018, 163, 414–431.
- Sun, T.; Rao, S.; Zhou, X.; Li, L. Plant Carotenoids: Recent Advances and Future Perspectives. Mol. Hortic. 2022, 2, 1-21. [CrossRef]
- Bramley, P.M. Regulation of Carotenoid Formation During Tomato Fruit Ripening and Development. J. Exp. Bot. 2002, 53, 2107-2113. [CrossRef]
- Frusciante, L.; Carli, P.; Ercolano, M.R.; Pernicr, R.; Matteo, A.D.; Fogliano, V; Pellegrini. N. Antioxidant Nutrient Quality of Tomato. Mol. Nutr. Food Res. 2007, 51, 609-617.
- Gaaliche, B.; Ladhari, A.; Zarrelli, A.; Ben, M.M. Impact of Foliar Potassium Fertilization on Biochemical Composition and Antioxidant Activity of Fig (Ficus Carica L.). Sci. Hortic. (Amsterdam). 2019, 253, 111-119. [CrossRef]
- Marlin, M.; Simarmata, M.; Salamah, U.; Nurcholis. W. Effect of Nitrogen and Potassium Application on Growth, Total Phenolic, Flavonoid Contents, and Antioxidant Activity of Eleutherine Palmifolia. AIMS Agric. Food. 2022, 7, 580–593. [CrossRef]
Figure 1.
Changes in the ion concentrations of nitrogen (A), phosphorus (B), potassium (C), calcium (D), magnesium (E), and sulfur (F) in cherry tomatoes upon harvest (expressed on a dry-weight basis) under KNO3-reduced nutrient solution. NS: not significant, **, ***. Different letters indicate significance according to the results of Tukey’s multiple comparisons test (p < 0.01 and p < 0.001). The error bars represent the standard deviation of the mean. K1 treatment is the control solution of 3.0 mM KNO3, K2 treatment is 1.5 mM KNO3, K3 treatment is 0.75 mM KNO3, K4 treatment is 0.50 mM KNO3, and K5 treatment is 0.375 mM KNO3.
Figure 2.
Change in the ion concentrations of iron (G), manganese (H), copper (I), zinc (J), and boron (K) (dry-weight basis) of cherry tomatoes upon harvest under KNO3-reduced nutrient solution. NS: not significant, *, **, ***. Different letters indicate significance according to the results of Tukey’s multiple comparisons test (p < 0.05, p < 0.01, and p < 0.001). The error bars represent the standard deviation of the mean. K1 treatment is the control solution of 3.0 mM KNO3, K2 treatment is 1.5 mM KNO3, K3 treatment is 0.75 mM KNO3, K4 treatment is 0.50 mM KNO3, and K5 treatment is 0.375 mM KNO3.
Figure 3.
Correlation between potassium content, yield, quality of fruit, and antioxidant activity. *, ** Pearson’s correlation coefficient test with two levels of significance (p < 0.05 and p < 0.01).
Figure 3.
Correlation between potassium content, yield, quality of fruit, and antioxidant activity. *, ** Pearson’s correlation coefficient test with two levels of significance (p < 0.05 and p < 0.01).
Table 1.
The yield, fruit weight, and fruit size of cherry tomatoes upon harvest as affected by potassium nitrate-restricted treatment.
Table 1.
The yield, fruit weight, and fruit size of cherry tomatoes upon harvest as affected by potassium nitrate-restricted treatment.
| Varieties |
Treatment |
Yield |
Fruit weight |
Fruit size (mm) |
| (kg/plant) |
(g/fruit) |
Diameter |
Height |
| Tabtim deang T2021 |
K1 |
2.18 ± 0.27 a |
10.70 ± 1.36 ab |
24.01 ± 1.74 ab |
32.75 ± 2.02 |
| |
K2 |
2.24 ± 0.39 a |
11.55 ± 1.24 a |
24.94 ± 1.21 ab |
33.48 ± 1.56 |
| |
K3 |
1.90 ± 0.18 ab |
11.31 ± 1.62 a |
25.20 ± 0.89 a |
33.44 ± 3.32 |
| |
K4 |
1.85 ± 0.29 ab |
10.55 ± 1.26 ab |
24.24 ± 1.21 ab |
32.66 ± 1.81 |
| |
K5 |
1.50 ± 0.16 b |
10.02 ± 1.89 b |
23.83 ± 1.92 b |
32.08 ± 2.62 |
| |
F-test |
*** |
*** |
** |
NS |
| |
CV (%) |
15.32 |
5.66 |
2.23 |
1.79 |
| Sweet boy 1 |
K1 |
2.42 ± 0.39 a |
10.44 ± 1.04 a |
25.93 ± 2.27 a |
30.27 ± 2.47 |
| |
K2 |
2.17 ± 0.31 ab |
10.00 ± 1.24 a |
25.08 ± 1.08 ab |
29.42 ± 1.26 |
| |
K3 |
1.97 ± 0.44 ab |
9.71 ± 1.33 ab |
25.54 ± 1.12 a |
29.58 ± 1.24 |
| |
K4 |
1.70 ± 0.28 b |
8.70 ± 1.19 b |
24.72 ± 1.89 b |
30.05 ± 1.98 |
| |
K5 |
1.65 ± 0.11 b |
8.67 ± 1.10 b |
23.94 ± 1.22 b |
27.78 ± 1.38 |
| |
F-test |
** |
*** |
** |
NS |
| |
CV (%) |
16.42 |
7.4 |
2.73 |
3.39 |
Table 2.
The quality of fruit parameters of cherry tomatoes upon harvest as affected by KNO3-reduced treatment.
Table 2.
The quality of fruit parameters of cherry tomatoes upon harvest as affected by KNO3-reduced treatment.
| Treatment |
pH |
TSS |
Citric acid |
Ascorbic acid |
Lycopene |
Beta-carotene |
| |
(%Brix) |
(g/gFW) |
(mg/gFW) |
( µg/gFW) |
( µg/gFW) |
| Tabtim Deang T2021 |
K1 |
4.27 ± 0.09 |
5.53 ± 0.07 a |
6.56 ± 0.55 |
0.32 ± 0.02 |
43.05 ± 6.04 |
18.08 ± 2.53 |
| K2 |
4.22 ± 0.10 |
5.31 ± 0.28 a |
6.33 ± 0.74 |
0.31 ± 0.02 |
41.90 ± 5.00 |
17.90 ± 2.15 |
| K3 |
4.17 ± 0.09 |
4.43 ± 0.12 b |
6.46 ± 0.60 |
0.31 ± 0.02 |
41.87 ± 8.26 |
18.69 ± 2.39 |
| K4 |
4.28 ± 0.12 |
4.18 ± 0.02 b |
6.36 ± 0.50 |
0.30 ± 0.02 |
38.78 ± 5.91 |
18.03 ± 2.66 |
| K5 |
4.18 ± 0.16 |
4.29 ± 0.44 b |
6.09 ± 0.48 |
0.31 ± 0.03 |
36.00 ± 2.67 |
17.92 ± 2.31 |
| F-test |
NS |
*** |
NS |
NS |
NS |
NS |
| CV (%) |
1.18 |
13.13 |
2.79 |
1.45 |
8.09 |
1.88 |
| Sweet Boy 1 |
K1 |
4.34 ± 0.06 a |
7.19 ± 0.23 a |
7.74 ± 0.48 a |
0.46 ± 0.02 a |
Non detected |
9.09 ± 2.15 |
| K2 |
4.26 ± 0.05 ab |
6.17 ± 0.38 b |
7.21 ± 0.54 ab |
0.45 ± 0.02 a |
8.67 ± 1.66 |
| K3 |
4.21 ± 0.07 b |
6.01 ± 0.58 b |
7.01 ± 0.33 b |
0.45 ± 0.02 ab |
8.58 ± 1.67 |
| K4 |
4.17 ± 0.09 b |
6.00 ± 0.61 b |
6.55 ± 0.33 bc |
0.44 ± 0.02 ab |
8.13 ± 1.54 |
| K5 |
4.15 ± 0.07 b |
5.99 ± 0.32 b |
6.11 ± 0.26 c |
0.42 ± 0.01 b |
7.71 ± 1.45 |
| F-test |
*** |
*** |
*** |
*** |
|
NS |
| CV (%) |
1.77 |
8.28 |
9.02 |
3.34 |
|
7.41 |
Table 3.
The antioxidant activity of cherry tomatoes upon harvest as affected by KNO3-reduced treatment.
Table 3.
The antioxidant activity of cherry tomatoes upon harvest as affected by KNO3-reduced treatment.
| Variety |
Treatment |
DPPH |
FRAP |
| Tabtim Deang T2021 |
K1 |
0.053 ± 0.003 b |
1.488 ± 0.009 |
| |
K2 |
0.062 ± 0.002 ab |
1.488 ± 0.005 |
| |
K3 |
0.082 ± 0.015 a |
1.485 ± 0.010 |
| |
K4 |
0.077 ± 0.001 a |
1.481 ± 0.004 |
| |
K5 |
0.082 ± 0.012 a |
1.480 ± 0.015 |
| |
F-test |
** |
NS |
| |
CV (%) |
0.24 |
18.68 |
| Sweet Boy 1 |
K1 |
0.080 ± 0.010 |
1.483 ± 0.008 |
| |
K2 |
0.082 ± 0.008 |
1.485 ± 0.004 |
| |
K3 |
0.089 ± 0.026 |
1.478 ± 0.010 |
| |
K4 |
0.065 ± 0.003 |
1.484 ± 0.008 |
| |
K5 |
0.070 ± 0.017 |
1.493 ± 0.001 |
| |
F-test |
NS |
NS |
| |
CV (%) |
0.36 |
12.24 |
|
Disclaimer/Publisher’s Note: The statements, opinions and data contained in all publications are solely those of the individual author(s) and contributor(s) and not of MDPI and/or the editor(s). MDPI and/or the editor(s) disclaim responsibility for any injury to people or property resulting from any ideas, methods, instructions or products referred to in the content. |
© 2024 by the authors. Licensee MDPI, Basel, Switzerland. This article is an open access article distributed under the terms and conditions of the Creative Commons Attribution (CC BY) license (http://creativecommons.org/licenses/by/4.0/).