Submitted:
05 October 2024
Posted:
07 October 2024
You are already at the latest version
Abstract
Histia rhodope is an oligophagous pest that only feeds on Bischofia polycarpa. Recently, frequent outbreaks of H. rhodope have greatly impacted the urban landscape and people’s life. The taxonomic status and diffusion trend of H. rhodope were studied based on its mitogenome sequence and the MaxEnt model. The mitogenome stucture of H. rhodope has certain conserved character. The species of lepidopteran moths in each superfamily and family were monophyletic. The genetic distance between H. rhodope and Eterusia aedea was the closest (0.09). By 2050, the suitable habitat area of H. rhodope is expected to increase (71.63 × 10⁴ km2). The centroid changes of the distribution of H. rhodope shifted from Anhui to Hubei province (distance shifted: 255.71 km). Climate factor like annual mean temperature, mean temperature of driest quarter, precipitation seasonality, and precipitation of coldest quarter affected the distribution of H. rhodope, and the suitable habitat of the host plant of biotic factor is the potential invasion area for its further spread. Our results revealed the taxonomic status of H. rhodope across lepidopteran moths, emphasized the risk of its spread and the important role of host plant, provided valuable molecular and ecological data for managing and monitoring H. rhodope.
Keywords:
oligophagous pest
; mitogenome
; phylogeny
; host plant
; MaxEnt
; suitable habitat
1. Introduction
The urban diurnal moth, Histia rhodope Cramer (Lepidoptera: Zygaenidae), is one of the most destructive defoliators, widely distributed in the central and southern provinces of China [1]. H. rhodope is an oligophagous pest that mainly feeds on urban landscaping and the street tree (Bischofia polycarpa) often causing serious damage. The moth may eat up all the leaves of the host plant, leaving only bare branches and leaf veins, which greatly effects the photosynthesis of the host plants, thus affecting the normal growth and development of B. polycarpa [2]. The larvae of H. rhodope fall from the tree by spinning silk, which also greatly disturbing the urban landscape and human activities in the city [3,4].
The phylogenetic relationship of the family Zygaenoidea, to which the moth belongs, is in constant change, and its phylogenetic relationship with other moth groups is controversial; therefore, the group is of great interest to lepidopteran researchers and evolutionary biologists [5]. With advances in DNA sequencing and whole mitochondrial genome sequencing, vast quantities of mitochondrial genome sequences of Lepidoptera species have been obtained [6,7,8], and the evolutionary relationships across groups have been analyzed [9,10,11,12]. The mitochondrial genome is characterized by a simple structure, maternal inheritance, rapid evolutionary rate, and small molecular weight. The mitochondrial genome has been widely used as a molecular marker to study insect population genetics and phylogeny [13,14]. However, data for only two mitochondrial genomes of Zygaenoidea are available and these have not been systematically analyzed in detail [15,16]. Therefore, the phylogenetic status and phylogenetic relationship between H. rhodope and other lepidopteran moths must be evaluated urgently.
With excellent wood quality, beautiful tree appearance and wide use and distribution, B. polycarpa is the backbone tree for landscaping in many cities in China [2]. However, H. rhodope is gradually deteriorating its host plant B. polycarpa, H. rhodope was found in Zaozhuang (Shandong province), Luoyang (Henan province), and other places [17], and is expected to spread further. Therefore, it is necessary to study its distribution and spread [3]. The prediction of suitable areas for species distribution is an important research field in ecology, and the distribution model is an important tool to study suitable areas for species geographical distribution [18]. As the most commonly used species distribution model, the maximum entropy (MaxEnt) model has the characteristics of simple operation, short running time, high accuracy, and stability of prediction results [19,20,21]. Because the MaxEnt model has good simulation performance even with sparse species distribution data [22,23], it has been used to predict suitable areas for various pests [24,25]. In summary, based on mitochondrial genome data and the MaxEnt model, this study analyzed the taxonomic status of the H. rhodope, their distribution in different suitable areas at present and in 2050, and the main environment factors affecting their geographical distribution. In view of the fact that its host as a street tree mainly through government planning and human planting, we coupling analysis the current distribution of B. polycarpa in different suitable areas with the moth H. rhodope. These will provide molecular and ecological data for the prevention and control of this urban pest.
2. Materials and Methods
2.1. Sampling and Mitochondrial Genome Sequencing Analysis
H. rhodope was collected from the campus of Yancheng Teachers University, Jiangsu Province (120.20°E; 33.38°N), and stored in the Insect Laboratory of School of Wetlands. The collected live adult insects were put into anhydrous ethanol, and brought back to the laboratory stored in a refrigerator at −20 °C for DNA extraction. DNA extraction kit (Promega Corporation, Madison, WI, USA) was used to extract the total DNA from the chest muscle tissue of H. rhodope. NanoDrop 2000 and Quantus Fluorometer (Thermo Fisher Scientific, Wilmington, DE, USA) were used to detect DNA purity (OD260/OD280 ratio) and concentration, respectively. The degree of DNA degradation and the presence of DNA and protein contamination were analyzed by agarose gel electrophoresis. The DNA samples were randomly interrupted by Covaris M220 ultrasonic instrument (Covaris, Woburn, MA, USA) after passing the test, and then the whole library was prepared by terminal repair, sequencing joint addition, purification and other steps. After the library was constructed, Qubit 3.0 and Qseq100 were used for preliminary quantification and detection, and then Q-PCR was used to accurately quantify the effective concentration of the library (concentration > 3nM) to ensure the quality of the library. After qualified library quality detection, different libraries are pooled to flowcell, and cBOT clusters are sequenced using Illumina (HiSeq X, Majorbio Bio-pharm Technology, Shanghai, China) high-quality sequencing platform, and obtained 4 Gb of base data. Using Trimmomatic (http://www.usadellab.org/cms/?page=trimmomatic) software to shear of raw data , filter the low quality of sequencing reads, and then use the SPAdes [26] to assemble the cleaned data. The mitoZ program [27] was used to assemble and annotate the individual genes of the mitogenome, and the sequence was then submitted to GenBank (PQ221018).
2.2. Analysis of the Characteristics, Genetic Distances, and Phylogenetic Relationships of the Mitochondrial Genome
MEGA 7.0.26 software (MEGA Software, Paris, France) was used to calculate the nucleotide composition of the mitogenome, the content of C, G, A, and T bases, GC skew and AT skew, and codon usage of amino acid [28,29]. The tRNA genes were predicted secondary structures by tRNAscan-SE v2.0 (https://lowelab.ucsc.edu/tRNAscan-SE/) and MITOS WebSever (http://mitos.bioinf.uni-leipzig.de/) two online software [30,31]. To measure genetic distances between H. rhodope and other lepidopteran moths, we used the mitochondrial genome of H. rhodope and the mitogenomes of 64 lepidopteran moths from the NCBI database (Supplementary Table S1). Based on the Kimura 2-parameter model, the genetic distance between species was calculated after sequence alignment using MEGA v7.0.26 [32,33].
To clarify the taxonomic position of H. rhodope across the order Lepidoptera in a broader evolutionary condition, we constructed a maximum likelihood tree and a Bayesian inference tree by analyzing 65 mitochondrial genomes from 65 lepidopteran species (Supplementary Table S1), Papilio slateri and Luehdorfia chinensis were used as outgroups. IQ-TREE software (version 2.2.0) was used for maximum likelihood analysis: the software automatically selected the optimal model as GTR+F+I+R5, and the node support rate of the phylogenetic tree was evaluated by bootstrapping-test confidence (the number of runs was set to 1 000) [34]. The Bayesian phylogenetic tree was constructed using MrBayes 3.2.2 [35], and the operation parameters were set as follows: Operations for running 4 Markov Chain Monte Carlo (MCMC) simultaneously, the operation number was set to 5,000,000 generations, sampling every 1 000 generaitions, abandoning the results of the first 25% of the data, when the mean stantard deviation of the splitting frequency is less than 0.01, the stationarity was reached, and most consistent trees are obtained [36,37].
2.3. Collection and Processing of Distribution Data
The geographical distribution of H. rhodope and B. polycarpa in China was predicted using data from the following sources: (1) the literature and news reports and field investigations and collection. We conducted a field survey of areas where the adult and larva species of H. rhodope are distributed (Figure 1:A), obtaining 102 distribution sites (Supplementary Table S2). We also obtained 243 distribution sites of host plants B. polycarpa (Supplementary Table S3), mainly from two parts, including GBIF (Global Biodiversity Information Facility: https://www.gbif.org/) database and field investigation. The research data are stored in School of Wetlands, Yancheng Teachers University. Buffer analysis in ArcGIS v10.4.1 was used to screen the distribution data [38]. Buffer radius was set to 10 km. Finally, distribution data for 83 H. rhodope and 158 B. polycarpa were obtained after deleting 19 and 85 overfitting data, the data distribution condition were shown in the Figure 1: B.
Environmental factors were obtained from the WorldClim database and included 19 environmental factors, of which 11 are temperature related and 5 are rainfall related [39]. The data of environmental factors were based on global meteorological records with spatial resolution of 2.5 arc-minutes. The details of environmental factors are listed in Supplementary Table S4. To improve the simulation accuracy of the model and avoid the transition fitting of the model, 19 environmental factors were extracted to the geographical distribution points of H. rhodope by ArcGIS. The data were exported for Pearson’s correlation analysis using SPSS 25 software [40]. If the absolute value of the correlation coefficient was >0.90 and significantly correlated, the factors with low contribution rate are eliminated [41].
2.4. Optimization and Construction of MaxEnt
The software of MaxEnt v10.4.1 was used to predict the geographical distribution of H. rhodope and B. polycarpa. The distribution and dominant environmental data obtained for H. rhodope by screening were added to MaxEnt software, and the parameters were set [39]. For training data, 75% of the distribution points were randomly selected. For test data, 25% of the distribution points were selected. The validation and prediction models were constructed for the training data and test data, respectively. The Jackknife test was selected to determine the weight of each variable, and the response curve of environmental variables selected was created. The output format was “Logistic,” with repeated training run set to “10,” maximum number of interactions set to “5000,” and repetition mode set to “Subsample” [25]. Area value under receiver operating characteristic curve (ROC curve) was used to evaluate the simulation results of the model. According to a series of different dichotomies, the curve is drawn with false positive rate and true positive rate as the horizontal and vertical coordinates, respectively [42].
2.5. Analysis of Potential Distribution
The output result of the MaxEnt model was the probability of existence of H. rhodope and B. polycarpa in China, and the data was in ASCII format. First, a format conversion tool (ArcGIS ArcToolbox) was used to convert the data into Raster format, and the results were displayed in ArcGIS [38]. Then, the probability of distribution map of the moth and its host plant in China was obtained by using the “extraction and analysis” function. The “Reclassify” function was used to classify distribution value grades and the corresponding distribution ranges, which were represented by different colors. The classification criteria were as follows: unsuitable areas (probability < 0.05); lowly suitable habitat (0.05 ≤ probability of existence < 0.33); and moderately suitable habitat (0.33 ≤ probability of existence < 0.66). An area with probability of existence ≥ 0.66 was considered a highly suitable habitat. ArcGIS was used to calculate the ratio of the number of grids in each suitable habitat to the total number of the grids, and the distribution area of H. rhodope and B. polycarpa was calculated based on their grid proportion to the land area of China [25]. Prediction results were converted into binary files with a threshold of MTSPS using SDM Toolbox in ArcGIS. The SDM Toolbos of “Distribution Changes Between Binary SDMs” and “Centroid Changes (Lines)” were used to determine centroid changes of H. rhodope [43].
3. Results
3.1. Mitochondrial Genome Characteristics of H. rhodope
The complete length of the mitochondrial genome for H. rhodope was 15,201 bp, consisting of 37 regions, including 13 protein genes (PCGs), 22 tRNAs, 2 rRNAs, and 1 non-coding control region (Figure 2). There were 15 gene spacer regions between adjacent mitogenomes (158 bp), with the longest interval between trnH and ND5 (51 bp); 7 overlapping genes (39 bp), with the longest between trnL1 and rrnL (21 bp); and 14 regions with no overlap or interval (Supplementary Table S5). The mitogenome contained 39.81%, 38.64%, 13.41%, and 8.14% of A, T, C, and G, respectively. The content of A + T was 78.45% and that of G + C was 21.55%. The AT-skew value was 0.01% and the GC-skew value was 0.24%, indicating that the percentage of base A and C was higher than that of T and G (Supplementary Table S6).
The arrangement of the PCGs (ND2 – COI – COII – ATP8 – ATP6 – COIII – ND3 – ND5 – ND4 – ND4L – ND6 – CYTB – ND1) for H. rhodope is common in Lepidoptera. In terms of codon use, ND1 takes GTG as the start codon, and the remaining PCGs take ATN as the start codon. Except for COII and ND4, which use T and TA as stop codons, respectively, other PCGs use TAA (Supplementary Table S5). Consistently, TAA or TAG are commonly used as stop codons in insect mitogenomes. Leu and Ile (count > 400) were the most used amino acids in PCGs, whereas Arg, Cys, and Gln were the least used (count < 60) (Figure 3). CUA, UUU, and AUU (count > 300) had a relatively high frequency in amino acids, whereas GCG and ACG had the lowest frequency. Consistent results were obtained for Dendrolimus punctatus [38], reflecting the AT bias of nucleotide composition. Among the 22 tRNA genes in the mitogenome, 21 can form conventional clover structures, whereas tRNASer(AGN) cannot form typical tRNA cloverleaf structures due to the absence of the D-arm (dihydrouridine arms). There were 31 base mismatches in the secondary structure of tRNA, including 22 G–U mismatches, 7 U–U mismatches, and 1 C–A and G–A mismatch each (Supplementary Figure S1). These mismatches conform to the oscillating pairing principle and play an important role in maintaining the stability of tRNA secondary structures.
3.2. Phylogenetic Relationship and Genetic Distance between H. rhodope and Lepidopteran Moths
Using L. chinensis and P. slateri as outgroups, the Bayesian tree and maximum likelihood model were constructed based on the whole mitochondrial genomes of 65 lepidopteran moths to study the phylogenetic relationship between H. rhodope and other moths (Figure 4). H. rhodope and Eterusia aedea were the most closely related in Zygaenidae, and Zygaenidae were the most closely related to Limacodidae, both of which belong to Zygaenoidea. Zygaenoidea was closely related to Cossoidea and Thyridoidea, with a kinship of Zygaenoidea + (Cossoidea + Thyridoidea). The phylogenetic trees constructed using different methods were similar in structure (Supplementary Figure S2) and supported the monophyletism of lepidopteran moths in each family and superfamily. The posterior probabilities of the phylogenetic trees constructed based on Bayesian construction were >0.91. The phylogenetic relationships of each superfamily were: Gelechioidea + (((((Bombycoidea + Lasiocampoidea) + Geometroidea) + Notuoidea) + Pyraloidea) + (((Hesperioidea + Yponomeutoidea) + Tortricoidea) + (Zygaenoidea + (Cossoidea + Thyridoidea)))). Genetic distances between the moths based on complete mitogenome sequences was consistent with their phylogenetic relationships. E. aedea had the shortest genetic distance to H. rhodope (0.090), and thus the closely related species, whereas Leucoptera malifoliella had the greatest distance to H. rhodope (0.272) (Supplementary Table S7).
3.3. Screening of Key Environmental Factors and Suitable Area Predictions
The contribution rates of 19 environmental factors simulated based on the MaxEnt model were selected and combined with the results obtained by Spearman correlation analysis (Supplementary Table S8). Finally, six major environmental factors were selected as follows: annual mean temperature (bio1), mean temperature of driest quarter (bio9), mean temperature of coldest quarter (bio11), precipitation seasonality (bio15), precipitation of warmest quarter (bio18), and precipitation of coldest quarter (bio19). The accumulate contribution percent of the six major environmental factors was 88.5% (Supplementary Table S4).
The Jackknife simulation calculated the scores for “without variable,” "with only variable," and "with all variables,” reflecting the contribution of environmental factors to distribution gain. For “without variable,” the scores of annual mean temperature (bio1), mean temperature of driest quarter (bio9), precipitation seasonality (bio15), and precipitation of coldest quarter (bio19) were higher than the scores of mean temperature of coldest quarter (bio9) and precipitation of warmest quarter (bio11), with little difference under test gain, regularized training gain, and AUC. These findings indicated that the four environmental factors contributed the most to the distribution of H. rhodope and were the dominant environmental factors affecting the geographical distribution of H. rhodope (Figure 5).
3.4. Forecasting Suitable Distribution of H. rhodope in Current Year and 2050
The reliability of the MaxEnt model prodiction results was tested by ROC curve analysis based on six major environmental factors and 83 fitted distribution data. After 10 repetitions, the AUC values predicted for current and 2050 population distribution of H. rhodope were 0.995 and 0.994, respectively, (i.e., >0.9) (Supplementary Figure S3). The predicted results reached an excellent level, indicating that MaxEnt model built in the study was reliable in predicting the suitable distribution areas of H. rhodope.
Based on the dominant environmental factors and their geographical distribution data, MaxEnt model was constructed, which was divided into four grades: unsuitable habitat, lowly suitable habitat, moderately suitable habitat, and highly suitable habitat. Finally, the current and 2050 suitable habitat distribution map of H. rhodope was obtained. The results showed that H. rhodope was mainly distributed in the southern provinces of China (Figure 6). The total area of distribution was 147.09 × 10⁴ km2. The areas of highly suitable habitat, moderately suitable habitat, and lowly suitable habitat were 27.46 × 10⁴, 44.60 × 10⁴, and 75.03 × 10⁴ km2, respectively (Figure 7). However, the distribution area of H. rhodope had a significant trend of diffusion. In 2050, the total area was 219.74 × 10⁴ km2. The areas of highly suitable habitat, moderately suitable habitat, and lowly suitable habitats were 87.44 × 10⁴, 61.02 × 10⁴, and 71.28 × 10⁴ km2, respectively.
3.5. Centroid migration and current host plant B. polycarpa distribution of H. rhodope
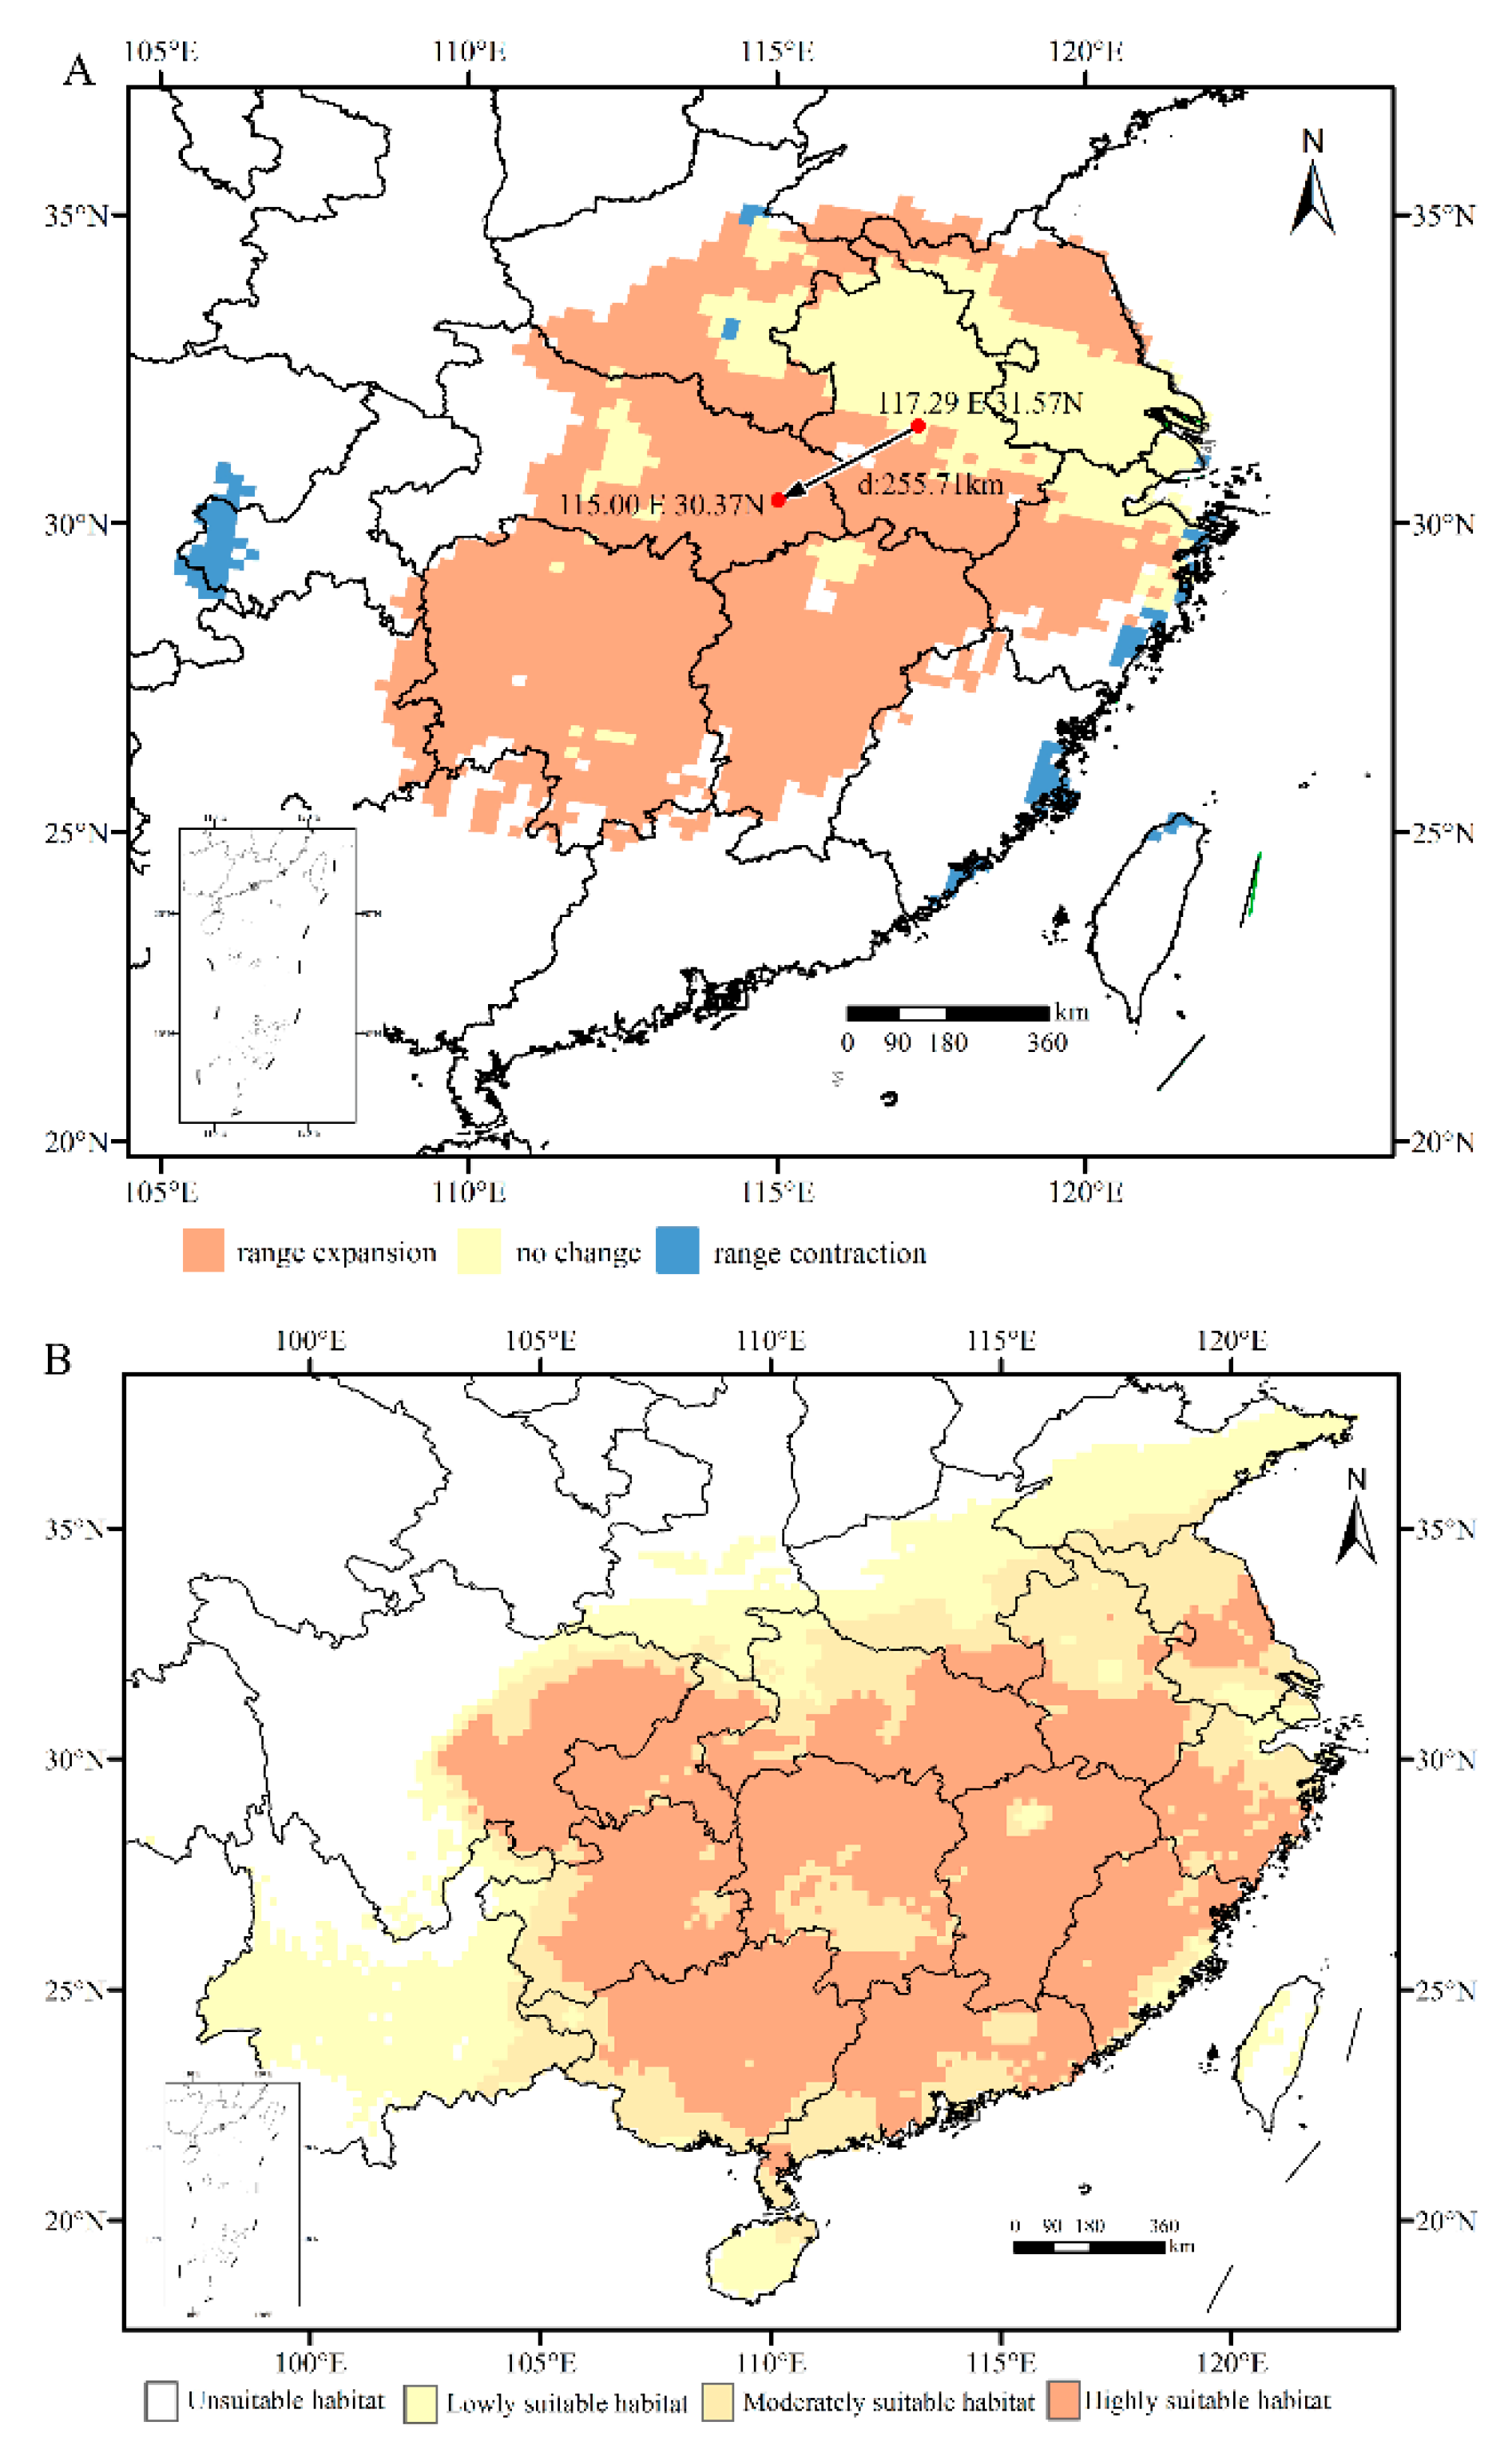
In 2050, the area of range expansion of H. rhodope was 71.63 × 10⁴ km2, and the area of range contraction was 3.62 × 10⁴ km2. The centroids of the distribution regions of the species were 117.29°E, 31.57°N and 115.00°E, 30.37°N in the current year and 2050, respectively. The centroid locations shifted from Anhui Province to Hubei province, and the centroid transfer distance was 255.71 km (Figure 8:A). The current distribution prediction results of B. polycarpa, the host plant of H. rhodope, showed that the AUC value was 0.990 (Supplementary Figure S4), and the distribution habitat area of B. polycarpa was mainly distributed in southern China (Figure 8:B), and the distribution area of high, moderate and low suitable habitat were 119.97 × 10⁴, 55.37 × 10⁴, and 57.15 × 10⁴ km2, respectively. The host distribution area can basically cover the current and 2050 suitable areas of H. rhodope.
4. Discussion
In this study, we got the whole mitochondrial genome of H. rhodope, revealing the conservation of the mitogenome structure. The arrangement of protein genes in the mitogenome of H. rhodope indicated the same pattern as reported for other lepidopteran insects, among which the arrangement of trnM-trnI-trnQ is typical of Lepidoptera [10]. The base content of mitochondrial genome was A > T > C > G, the content of A + T was 78.45 %, and the content of A + T was much higher than the content of G + C, consistent with other Lepidoptera species, such as Leucinodes orbonalis [44], Neptis thisbe, and Athyma zeroca [45]. Except for ND1 in the PCG of H. rhodope, which has GTG as its start codon, all other genes had ATN as their start codon. In insects, the start codon exhibits diversity, including quadruplet codons (ATTA, ATAA, and TTAG) and sextuplet codons (TATTAG and TTTTAG) [46,47,48]. Most genes used TAA as stop codon. COII and ND4 used T and TA, respectively. These incomplete stop codons can be converted into TAA through post-transcriptional processing [8]. With the exception of tRNASer (AGN), which lacks the D-arm, the other 21 tRNAs are classical cloverleaf structures. These are also found in other insect groups [6,13,14]. The mismatch in their structure is dominated by G–U, which possibly occurs because mitochondrial genomes lack recombination. The mismatch can be corrected by RNA editing, which did not hinder tRNA transport [8,10]. The conservation of the mitochondrial genome of H. rhodope indicates that it is suitable to solve the phylogenetic relationship of higher order species, such as family and order.
In this study, phylogenetic trees were constructed for 65 moths species from 21 families and 12 superfamilies. The phylogenetic trees strongly supported the monophyly of species of each familyand superfamily in Lepidoptera. Only two families, Zygaenidae and Limacodidae, were only involved in the superfamily Zygaenoidea, However, the morphological analysis of five families showed that limacodid clades included in Aididae, Dalceridae, Megalopygidae, and Limacodidae, but not Zygaenidae [49], and other molecular studies were gardually clarifying the study [50,51], as the mitochondrial genomes of other families, such as Megalopygidae, Dalceridae, and Cyclotornidae, have yet to be sequenced, which will further elucidate the phylogenetic relationships across families in Zygaenoidea. The phylogenetic relationship between Cossoidea, Thyridoidea, and Zygaenoidea follows Zygaenoidea +(Cossoidea +Thyridoidea); however, Lu et al. [52] hypothesized that Zygaenoidea and Cossoidea are sister groups and that the result was unstable, which might be related to the lack of mitogenome data on Thyridoidea. In general, the phylogenetic relationships of each family established in this study were consisted with the findings of Timmermans et al. [53] and Liu et al. [54]. The definition and internal phylogeny of Zygaenoidea remain in flux, and the phylogenetic relationships across lepidopteran moth species must be further resolved. The mitochondrial genome data of Lepidoptera and other lower genera are limited, and representative species of each family cannot be widely selected for analysis, resulting in unbalanced data sets. However, each tree building method has its application scope and conditions, which affect the topology of the final phylogenetic tree. Therefore, to obtain a more comprehensive and reliable phylogenetic relationship, a large number of molecular data representative of species are needed [8].
Nineteen environmental factors are commonly used by the MaxEnt model to predict the geographical distribution of H. rhodope, of which many environmental factors have problems of multiple linear repetition and autocorrelation [55]. This redundant information may affect the precision and conclusion of the prediction results. Therefore, during modeling, this study first performed correlation analysis on the environmental factors based on the geographical distribution sites of H. rhodope and eliminated redundant information. Using the method of Guo et al. [56] as reference, combined with the results of importance of environmental factors and contribution rate to H. rhodope distribution as criteria for evaluating environmental factors, environmental factors with a small contribution to H. rhodope distribution were eliminated. Finally, four predominant environmental factors were identified as follows: annual mean temperature, mean temperature of driest, precipitation seasonality, and precipitation of coldest quarter. In most of its distribution areas of China, H. rhodope occurs four generations a year, and the old larvae form cocoons in bark cracks, ground leaves or wall corners to overwinter. Yang et al. [3] studied its overwintering overcooling point and found that the cold tolerance of H. rhodope has seasonal changes, and the changes of biochemical substances in the larvae are related to the changes of temperature and humidity in winter. Therefore, the changes of these environmental factors may have a significant impact on the outbreak degree of H. rhodope in the next year, and the extent of the impact needs to be further studied.
In addition to the influence of external environmental factors, especially as an oligophagous insect, the availability of host plants may play a greater role in the geographical distribution of B. polycarpa. As an important street tree species in China, the planting distribution of B. polycarpa is mainly affected by the government's lanscape species selection and artificial planting. Therefore, we only studied the distribution of its current suitable areas, and its distribution area basically covered the current and 2050 suitable areas of H. rhodope. The distribution area of the current suitable area, especially the highly suitable habitat, is significantly lower than the distribution area in 2050, which is mainly related to the limited species distribution data we used. In some areas, there may be less harm and less reported, resulting in a gap between these data and the actual distribution data. However, the distribution data of host plants are easier to obtain, so using the distribution data of B. polycarpa to analyze the potential prediction range of H. rhodope, especially for this oligophagous pest, can better analyze its spread trend. The area of total suitable habitat and highly suitable habitat of B. polycarpa under current condition are larger than that of H. rhodope under 2050 climate condition, respectively. Besides, the forecast results for the year 2050 show that the area of highly suitable habitat for H. rhodope will increase by 59.98 × 10⁴ km2 compared to the current area of highly suitatble habitat. The areas of Hubei, Hunan, and Jiangxi provinces will increase significantly, indicating that the moth will cause further harm. The centroid locations for the distribution regions of H. rhodope in the current year and 2050 were 117.29°E, 31.57°N and 115.00°E, 30.37°N, respectively. The centroid locations shifted from Anhui Province to Hubei province, and the centroid transfer distance was 255.71 km. In this year, the cities of Wuhan and Xiangyang in Hubei province have frequently reported that H. rhodope has caused trouble to pedestrians, and has gradually aroused great attention of landscaping and greening industry personnel. With global warming, the environmental temperature is gradually approaching the optimal level for pest development. The severity of pest damage is expected to increase, reducing the thermal constraints of population dynamics [57]. In addition, the distribution of this moth is influenced by its own flight ability, human factors, geographical barrier, and species interaction [11,58,59,60], the way in which these factors are added to model predictions needs to be further studied. In summary, the forecast results for 2050 confirmed its further spread trend, and we also believed that the current distribution range of its host plants is also the potential invasive distribution of this urban pest, because B. polycarpa is not only the most important food source of the moth, but also the main habitat of its older larvae during the overwintering stage [61]. Ultimately, these results will facilitate a more accurate assessment of the risk of the spread and outbreak of this pest, thereby improving our early prevention and response capabilities.
5. Conclusions
In conclusion, this study conducted sequencing and feature analysis of the mitogenome of H. rhodope, clarified the conservative features of gene arrangement, codon usage, and tRNA structure characteristics; By analyzing the genetic distance and phylogenetic relationship between H. rhodope and other lepidopteran moths, the taxonomic status of the species was preliminarily determined; The maximum entropy model was used to predict the distribution of the suitable habitat of H. rhodope and its host B. polycarpa, and mastered the diffusion trend and the dominant environmental factors (Annual mean temperature, mean temperature of driest quarter, precipitation seasonality, and precipitation of coldest quarter ) affecting the distribution of H. rhodope. The distribution of the suitable area of the host plant B. polycarpa is the main biological factor affecting the distribution of the suitable area of the oligophagous insect H. rhodope, and also the potential invasion area for the further spread of this urban pest. This study enriched insect mitogenome data, clarified the risk of further spread, and emphasized the importance of host plants in predicting the distribution of pests, providing reference and data support for the control and monitoring of this oligophagous urban pest.
Supplementary Materials
The following supporting information can be downloaded at the website of this paper posted on Preprints.org, Figure S1: Secondary structures for tRNA genes from the mtDNA of Histia rhodope; Figure S2: Phylogenetic tree inferred from the mitogenomes of lepidopteran moths using maximum likelihood method; Figure S3: ROC curve and AUC value of Histia rhodope generated using the MaxEnt model during the climate conditions of the current year (left) and 2050 (right). Figure S4: ROC curve and AUC value of Bischofia polycarpa generated using the MaxEnt model during the climate conditions of the current year. Table S1: List of sample information of the mitogenomes of 65 published moth species of Lepidoptera; Table S2: Original distribution data of Histia rhodope; Table S3: Table S3 Original distribution data of Bischofia polycarpa; Table S4: Information on the 19 environmental factors; Table S5: Origanization of the mitochondrial genome of Histia rhodope; Table S6: Base composition of the mitochondrial genomes of Histia rhodope; Table S7: Genetic distance between lepidopteran moths; Table S8: Correlation of environmental factors based on the geographic distribution of Histia rhodope.
Author Contributions
Conceptualization, H.D. and X.K.; methodology, H.D. and J.S.; software, H.D. and J.S.; validation, H.D. and J.S.; formal analysis, H.D. and J.S.; investigation, H.D., W.L., and Z.Y.; resources, H.D. and J.S.; data curation, H.D., W.L., and Z.Y.; writing-original draft, H.D. and J.S.; writing–review and editing, J.S., H.D. and X.K.; visualization, H.D.; supervision, D.Z.; project administration, D.Z.; funding acquisition, D.Z.; All authors have read and agreed to the published version of the manuscript.
Funding
This work was funded by the National Natural Science Foundation of China (32070526).
Data Availability Statement
The data is contained within the article.
Conflicts of Interest
The authors declare no conflict of interest.
References
- Huang, B.K. A study on the bionomic characteristics and control of the Bischofia burnet Histia rhodope Cramer. J. Fujian Agric. Coll. 1980, 1, 61–79. [Google Scholar]
- Yang, H.B.; Dong, J.F.; Sun, Y.L.; Hu, Z.J.; Lv, Q.H.; Li, D.X. Antennal transcriptome analysis and expression profiles of putative chemosensory soluble proteins in Histia rhodope Cramer (Lepidoptera: Zygaenidae). Comp. Biochem. Phys. D. 2020, 33, 100654. [Google Scholar] [CrossRef] [PubMed]
- Yang, H.B.; Hu, Z.J.; Dong, J.F.; Zhu, P.H.; Li, D.X. Changes in the cold hardiness of overwintering larvae of Histia rhodope (Lepidoptera: Zygaenidae). Acta. Entomol. Sin. 2019, 62, 979–986. [Google Scholar]
- Yang, H.; Dong, J.; Sun, Y.L.; Hu, Z.; Lu, Q.H.; Li, D. Identification and expression profiles of candidate chemosensory receptors in Histia rhodope (Lepidoptera: Zygaenidae). PeerJ 2020, 8, e10035. [Google Scholar] [CrossRef]
- Mitter, C.; Davis, D.R.; Cummings, M.P. Phylogeny and Evolution of Lepidoptera. Annu. Rev. Entomol. 2017, 62, 265–283. [Google Scholar] [CrossRef]
- Pang, S.Y.; Zhang, Q.W.; Liang, L.L.; Qin, Y.T.; Li, S.; Bian, X. Comparative Mitogenomics and Phylogenetic Implications for Nine Species of the Subfamily Meconematinae (Orthoptera: Tettigoniidae). Insects 2024, 15, 413. [Google Scholar] [CrossRef] [PubMed]
- Shah, B.; Hassan, M.A.; Xie, B.Q.; Wu, K.Q.; Naveed, H.; Yan, M.; Dietrich, C.; Duan, Y.N. Mitogenomic Analysis and Phylogenetic Implications for the Deltocephaline Tribe chiasmini (Hemiptera: Cicadellidae: Deltocephalinae). Insects 2024, 15, 253. [Google Scholar] [CrossRef]
- Du, H.C.; Fang, J.X.; Shi, X.; Zhang, S.F.; Liu, F.; Yu, C.M.; Zhang, Z.; Kong, X.B. Comparative analysis of eight mitogenomes of bark beetles and their phylogenetic implicaitons. Insects 2021, 12, 949. [Google Scholar] [CrossRef]
- Li, X.Y.; Yan, L.P.; Pape, T.; Gao, Y.Y.; Zhang, D. Evolutionary insight into bot flies (Insecta: Diptera: Oestridae) from comparative analysis of the mitochondrial genomes. Int. J. Biol. Macromol. 2020, 149, 371–380. [Google Scholar] [CrossRef]
- Du, H.C.; Wang, Y.; Fang, J.X.; Zhang, Z.Y.; Zhang, S.F.; Liu, F.; Zhang, Z.; Kong, X.B. Sequencing and analysis of the complete mitochondrial genome of Dendrolimus punctatus (Lepidoptera: Lasiocampidae). Sci. Silvae Sin. 2019, 12, 16–172. [Google Scholar]
- Du, H.C.; Liu, M.; Zhang, S.F.; Liu, F.; Zhang, Z.; Kong, X.B. Lineage divergence of Dendrolimus punctatus in Southern China based on mitochondrial genome. Front. Genet. 2020, 11, 65. [Google Scholar] [CrossRef] [PubMed]
- Du, Z.Y.; Hasegawa, H.; Cooley, J.R.; Simon, C.; Yoshimura, J.; Cai, W.Z.; Li, H. Mitochondrial genomics reveals shared phylogeographic patterns and demographic history among three periodical cicada species groups. Mol. Biol. Evol. 2019, 36, 1187–1200. [Google Scholar] [CrossRef] [PubMed]
- Su, C.Y.; Zhu, D.H.; Abe, Y.; Ide, T.; Liu, Z.W. The complete mitochondrial genome and gene rearrangements in a gall wasp species, Dryocosmus liui (Hymenoptera: Cynipoidea: Cynipidae). PeerJ 2023, 11, e15865. [Google Scholar] [CrossRef]
- Li, F.P.; Zhang, Y.; Zhong, T.; Heng, X.; Ao, T.C.; Gu, Z.F.; Wang, A.M.; Liu, C.S.; Yang, Y. The Complete Mitochondrial Genomes of Two Rock Scallops (Bivalvia: Spondylidae) Indicate Extensive Gene Rearrangements and Adaptive Evolution Compared with Pectinidae. Int. J. Mol. Sci. 2023, 24, 13844. [Google Scholar] [CrossRef]
- Tang, M.; Tan, M.; Meng, G.; Yang, S.; Su, X.; Liu, S.; Song, W.; Li, Y.; Wu, Q.; Zhang, A.; et al. Multiplex sequencing of pooled mitochondrial genomes- a crucial step toward biodiversity analysis using mito-metagenomics. Nucleic Acids Res. 2014, 42, e166. [Google Scholar] [CrossRef]
- Qin, Z.P.; Song, G.J.; Liu, P.; Li, G.P.; Liang, X.; Wang, H.T. Test on chemical control of Histia rhodope. Shandong For. Sci. Technol. 2018, 5, 78–80. [Google Scholar]
- Peng, S.Y.; Jia, W.R.; Huang, Z.J.; Wang, Y.C.; Li, Y.; Huang, Z.R.; Zhang, Y.F.; Zhang, X.; Ding, J.H.; Geng, X.X.; Li, J. Complete mitochondrial genome of Histia rhodope Cramer (Lepidoptera: Zygaenidae). Mitochondrial DNA B. 2017, 2, 636–637. [Google Scholar] [CrossRef]
- Booth, T.H.; Nix, H.A.; Busby, J.R.; Huchinson, M.F. Bioclim: the first species distribution modeling package, its early applicationsand relevance to most current MaxEnt studies. Divers. Distrib. 2014, 20, 1–9. [Google Scholar] [CrossRef]
- Li, Y, Johnson AJ, Gao L, Wu CX, Hulcr J. Two new invasive Ips bark beetles (Coleoptera: Curculiionidae) in mainland China and their potential distribution in Asia. Pest Manag. Sci. 4008.
- Wang, Y.J.; Zhao, R.; Zhou, X.Y.; Zhang, X.L.; Zhao, G.H.; Zhang, F.G. Agastache rugosa Prediction of potential distribution areas and priority protected areas of based on Maxent model and Marxan model. Front. Plant Sci. 2023, 14, 1200796. [Google Scholar] [CrossRef]
- Elith, J.; Graham, C.H.; Anderson, R.P.; Dudík, M.; Ferrier, S.; Guisan, A.; Hijmans, R.J.; Huettmann, F.; Leathwick, J.R.; Lehmann, A.; et al. Novel methods improve prediction of species’ distributions from occurrence data. Ecography 2006, 29, 129–151. [Google Scholar] [CrossRef]
- Phillips, S.J.; Miroslav, D. Modeling of species distributions with Maxent: new extensions a comprehensive evaluation. Ecography 2008, 31, 161–175. [Google Scholar] [CrossRef]
- Waldock, C.; Stuart-Smith, R.D.; Albouy, C.; Cheung, W.L.; Edgar, G.J.; Mouillot, D.; Tjiputra, J.; Pellissier, L. A quantitative review of abundance-based species distribution models. Ecography 2022, 1, 2022. [Google Scholar] [CrossRef]
- Lin, S.L.; Yao, D.D.; Jiang, H.X.; Qin, J.; Feng, Z. Predicting current and future potential distributions of the greater bandicoot rat (Bandicota indica) under climate change conditions. Pest Manag. Sci. 2024, 80, 80,734–743. [Google Scholar] [CrossRef] [PubMed]
- Zhang, G.L.; Liu, S.; Xu, C.Q.; Wei, H.S.; Guo, K.; Xu, R.; Qiao, H.L.; Lu, P.F. Prediction of Potential Distribution of Carposina coreana in China under the Current and Future Climate Change. Insect 2024, 15, 411. [Google Scholar] [CrossRef] [PubMed]
- Dmitry, A.; Anton, K.; McLean, J.S.; Pevzner, P.A. HYBRIDSPADES: An algorithm for hybrid assembly of short and long reads. Bioinformatics 2016, 7, 1009–1015. [Google Scholar]
- Meng, G.; Li, Y.; Yang, C.; Liu, S. MitoZ: A toolkit for animal mitochondrial genome assembly, annotation and visualization. Nucleic Acids Res. 2019, 47, e63. [Google Scholar] [CrossRef]
- Kumar, S.K. MEGA5: Molecular evolutionary genetics analysis version 7.0 for bigger datasets. Mol. Biol. Evol. 2016, 33, 1870–1874. [Google Scholar] [CrossRef]
- Perna, N.T.; Kocher, T.D. Patterns of nucleotide composition at fourfold degenerate sites of animal mitochondrial genomes. J. Mol. Evol. 1995, 41, 353–358. [Google Scholar] [CrossRef]
- Lowe, T.M.; Chan, P.P. tRNAscan-SE On-line: Integrating search and context for analysis of transfer RNA genes. Nucleic Acids Res. 2016, 44, 54–57. [Google Scholar] [CrossRef] [PubMed]
- Bernt, M.; Donath, A.; Jühling, F.; Externbrink, F.; Florentz, C.; Fritzsch, G.; Pütz, J.; Middendorf, M.; Stadler, P.F. MITOS: Improved de novo metazoan mitochondrial genome annotation. Mol. Phylogenet. Evol. 2013, 69, 313–319. [Google Scholar] [CrossRef]
- Tamura, K.; Stecher, G.; Peterson, D.; Filipski, A.; Kumar, S. MEGA6: Molecular evolutionary genetics analysis version 6.0. Mol. Biol. Evol. 2013, 30, 2725–2729. [Google Scholar] [CrossRef]
- Kumar, S.; Stecher, G.; Tamura, K. MEGA7: Molecular Evolutionary Genetics Analysis version 7.0 for bigger datasets. Mol. Biol. Evol. 2016, 33, 1870–1874. [Google Scholar] [CrossRef] [PubMed]
- Minh, B.Q.; Schmidt, H.A.; Chernomor, O.; Schrempf, D.; Woodhams, M.D.; Von Haeseler, A.; IQ-TREE, R.L. 2: New models and efficient methods for phylogenetic inference in the genomic era. Mol. Biol. Evol. 2020, 37, 1530–1534. [Google Scholar] [CrossRef]
- Ronquist, F.; Huelsenbeck, J.P. MrBayes 3: Bayesian phylogenetic inference under mixed models. Bioinformatics 2003, 19, 1572–1574. [Google Scholar] [CrossRef] [PubMed]
- Clary, D.O.; Wolstenholme, D.R. The ribosomal RNA genes of Drosophila mitochondrial DNA. Nucleic Acids Res. 1985, 13, 4029–4045. [Google Scholar] [CrossRef]
- Huelsenbeck, J.P.; Ronquist, F.; Nielsen, R.; Bollback, J.P. Bayesian inference of phylogeny and its impact on evolutionary biology. Science 2001, 294, 2310–2314. [Google Scholar] [CrossRef]
- Ji, W.; Gao, G.; Wei, J.F. Potential global distribution of Daktulosphaira vitifoliae under climate change based on MaxEnt. Insects 2021, 12, 347. [Google Scholar] [CrossRef] [PubMed]
- Hijmans, R.J.; Cameron, S.E.; Parra, J.L.; Jones, P.G.; Jarvis, A. Very high resolution interpolated climate surfaces for global land areas. Int. J. Climatol. 2005, 25, 1965–1978. [Google Scholar] [CrossRef]
- Muscarella, R.; Galante, P.J.; Soley-Guardia, M.; Boria, R.A.; Kass, J.M.; Uriarte, M.; ENMeval, R.A. An R package for conducting spatially independent evaluations and estimating optimal model complexity for MAXENT ecological niche models. Methods Ecol. Evol. 2014, 12261, 1198–1205. [Google Scholar] [CrossRef]
- Li, J.; Deng, C.; Duan, G.; Wang, Z.; Zhang, Y.; Fan, G. Potentially suitable habitats of Daodi goji berry in China under climate change. Front. Plant Sci. 2024, 14, 1279019. [Google Scholar] [CrossRef]
- Peterson, A.; Soberón, J.; Pearson, R.; Anderson, R.; Martínezmeyer, E.; Nakamura, M.; Araújo, M. Ecological Niches and Geographic Distributions; Princeton University Press: Princeton, NJ, USA, 2011. [Google Scholar]
- Song, Z.K.; Fan, G.H.; Deng, C.R.; Duan, G.Z.; Li, J.L. Predicting the Distribution of Neoceratitis asiatica (Diptera: Tephritidae), a Primary Pest of Goji Berry in China, under Climate Change. Insects 2024, 15, 558. [Google Scholar] [CrossRef] [PubMed]
- Despabiladeras, J.B.; Bautista, M.A.M. Complete Mitochondrial Genome of the Eggplant Fruit and Shoot Borer, Leucinodes orbonalis Guenée (Lepidoptera: Crambidae), and Comparison with Other Pyraloid Moths. Insects 2024, 4, 220. [Google Scholar] [CrossRef] [PubMed]
- Liu, N.; Fang, L.J.; Zhang, Y.L. The Complete Mitochondrial Genomes of Four Species in the Subfamily Limenitidinae (Lepidoptera, Nymphalidae) and a Phylogenetic Analysis. Insects 2022, 13, 16. [Google Scholar] [CrossRef] [PubMed]
- Kim, I.; Lee, E.M.; Seol, K.Y.; Yun, E.Y.; Lee, Y.B.; Hwang, J.S.; Jin, B.R. The mitochondrial genome of the Korean hairstreak, Coreana raphaelis (Lepidoptera: Lycaenidae). Insect Mol. Biol. 2006, 15, 217–225. [Google Scholar] [CrossRef]
- Wilson, K.; Cahill, V.; Ballment, E.; Benzie, J. The complete sequence of themitochondrial genome of the crustacean Penaeus monodom: Are malacostracancrustaceans more closely related to insects than to branchiopods? Mol. Biol. Evol. 2000, 17, 863–874. [Google Scholar] [CrossRef]
- Spanos, L.; Koutroumbas, G.; Kotsyfakis, M.; Louis, C. The mitochondrial genome of the mediterranean fruit fly, Ceratitis capitata. Insect Mol. Biol. 2000, 9, 139–144. [Google Scholar] [CrossRef]
- Epstein, M.E. Revision and phylogeny of the Limacodid-group families, with evolutionary studies on slug caterpillars (Lepidoptera: Zygaenoidea). Smithson. Contrib. Zool. 1996. 582, 1–102.
- Mutanen, M.; Wahlberg, N.; Kaila, L. Comprehensive gene and taxon coverage elucidates radiation patterns in moths and butterflies. Proc. R. Soc. B 2010, 277, 2839–2848. [Google Scholar] [CrossRef]
- Regier, J.C.; Mitter, C.; Zwick, A.; Bazinet, A.L.; Cummings, M.P.; et al. A large-scale, higher-level, molecular phylogenetic study of the insect order Lepidoptera (moths and butterflies). PLOS ONE 2013, 8, e58568. [Google Scholar] [CrossRef]
- Lu, B.; Yonghen, Z.; Xing, G.; Yuefang, G.; Youben, Y. The complete mitochondrial genome of Etersia aedea (Lepidoptera, Zygaenidae) and comparison with other zygaenid moth. Genomic 2019, 11, 1043–1052. [Google Scholar]
- Timmermans, M.J.T.N.; Lees, D.C.; Simonsen, T.J. Towards a mitogenomic phylogeny of Lepidoptera using next generation sequence technology. Mol. Phylogenet. Evol. 2014, 79, 169–178. [Google Scholar] [CrossRef] [PubMed]
- Liu, Q.N.; Xin, Z.Z.; Bian, D.D.; Chai, X.Y.; Zhou, C.L.; Tang, B.P. The first complete mitonchondrial genome for the subfamily Limacodidae and implications for the higher phylogeny of Lepidoptera. Sci. Rep-uk. 2016, 6, 35878. [Google Scholar] [CrossRef] [PubMed]
- Wang, S.Y.; Lu, Y.Y.; Han, M.Y.; Li, L.L.; He, P.; Shi, A.; Bai, M. Using MaxEnt model to predict the potential distribution of three potentially invasive scarab beetles in China. Insects 2023, 14, 239. [Google Scholar] [CrossRef]
- Guo, Y.; Li, X.; Zhao, Z.; Nawaz, Z. Predicting the impacts of climate change, soils and vegetation types on the geographic distribution of Polyporus umbellatus in China. Sci. Total Environ. 2019, 648, 1–11. [Google Scholar] [CrossRef]
- Skendžić, S.; Zovko, M.; Živković, I.P.; Lešić, V.; Lemić, D. The impact of climate change on agricultural insect pests. Insects 2021, 12, 440. [Google Scholar] [CrossRef]
- Du, H.C.; Fang, J.X.; Shi, X.; Yu, C.M.; Deng, M.; Zhang, S.F.; Liu, F.; Zhang, Z.; Han, F.Z.; Kong, X.B. ; Insights into the Divergence of Chinese Ips Bark Beetles during Evolutionary Adaptation. Biology 2022, 11, 384. [Google Scholar] [CrossRef]
- Aidoo, O.F.; Souza, P.G.C.; Silva, R.S.; Santana, P.A.; Picano, M.C.; Kyerematen, R.; Sètamou, M.; Ekesi, S.; Borgemeister, C. Climate-induced range shifts of invasive species (Diaphorina citri Kuwayama). Pest. Manag. Sci. 2022, 78, 2534–2549. [Google Scholar] [CrossRef] [PubMed]
- Berzitis, E.A.; Minigan, J.N.; Hallett, R.H.; Newman, J.A. Climate and host plant availability impact the future distribution of the bean leaf beetle (Cerotoma trifurcata). Glob. Change Biol. 2014, 20, 2778–2792. [Google Scholar] [CrossRef]
- Dang, Y.Q.; Zhang, Y.L.; Wang, X.Y.; Xin, B.; Quinn, N.F.; Duan, J.J. Retrospective analysis of factors afecting the distribution of an invasive wood-boring insect using native range data: the importance of host plants. J. Pest Sci. 2021, 94, 981–990. [Google Scholar] [CrossRef]
Figure 1.
The Larva and adult of Histia rhodope (A), and geographical distribution of H. rhodope and its host plant Bischofia polycarpa (B).
Figure 1.
The Larva and adult of Histia rhodope (A), and geographical distribution of H. rhodope and its host plant Bischofia polycarpa (B).
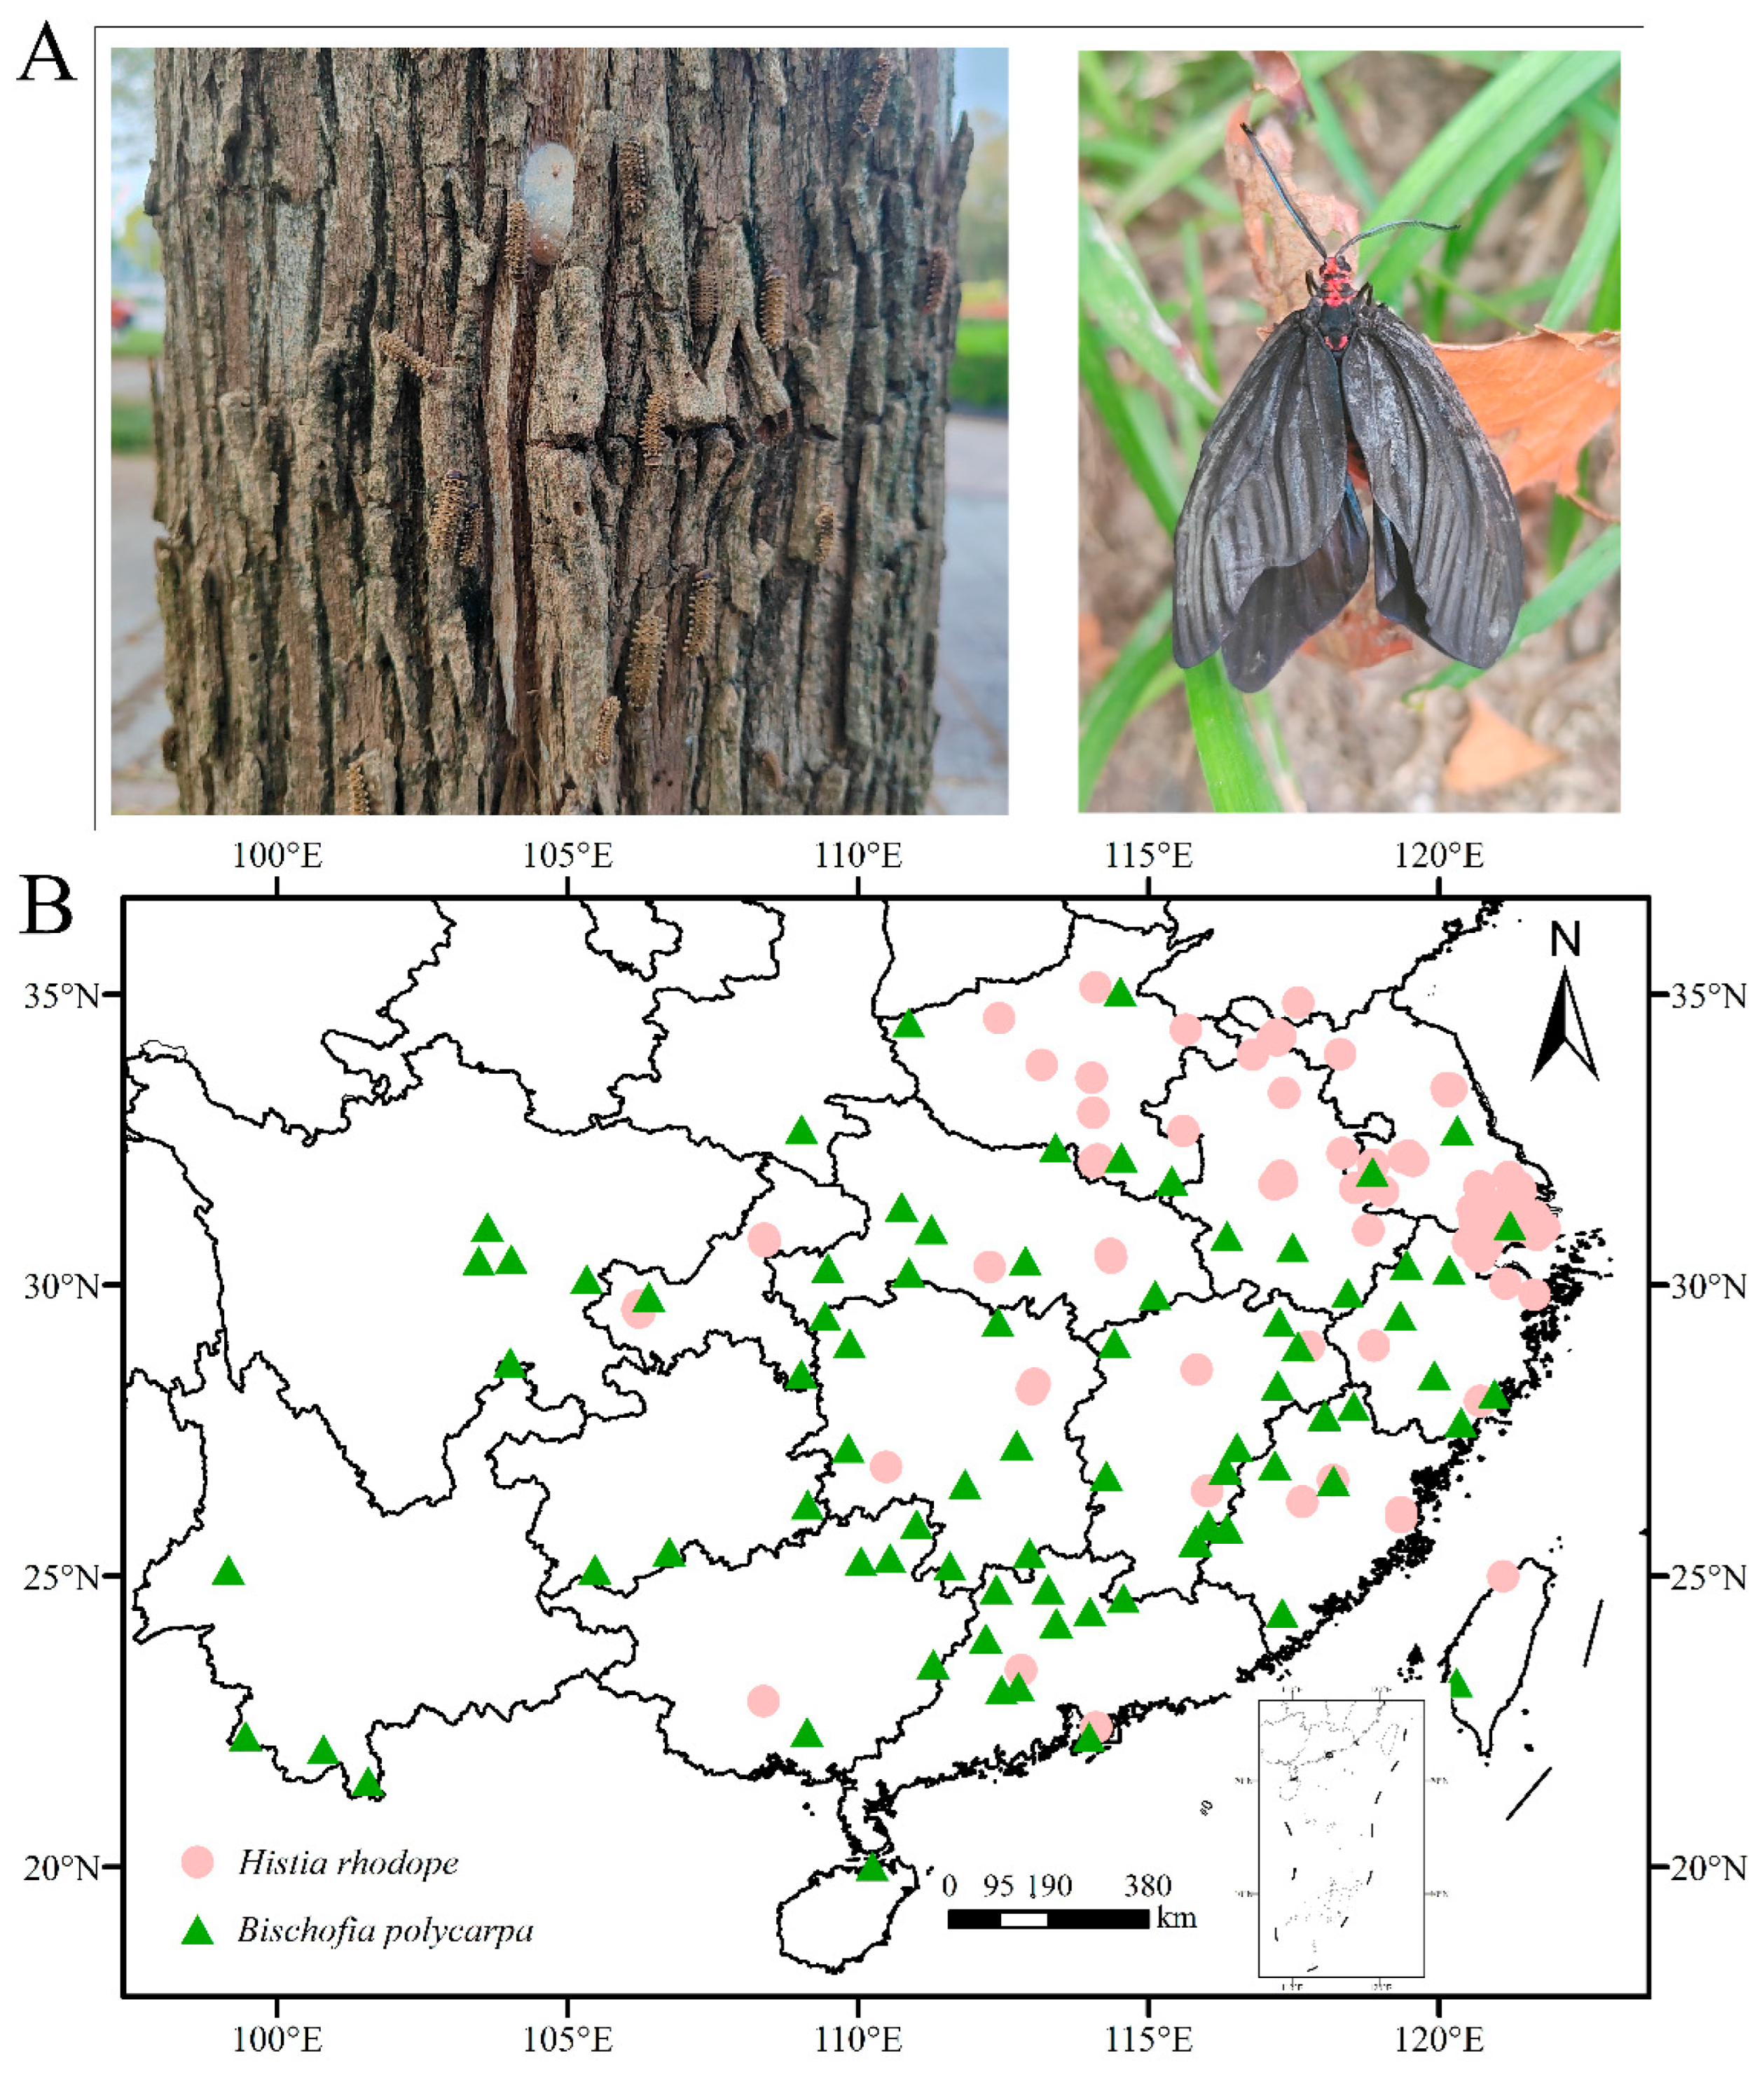
Figure 2.
Figure 2. The circle map of the complete mitogenome of Histia rhodope. The purple peaks indicated the deviation in GC-skew, and black peaks indicated the deviation of GC% divergence.
Figure 2.
Figure 2. The circle map of the complete mitogenome of Histia rhodope. The purple peaks indicated the deviation in GC-skew, and black peaks indicated the deviation of GC% divergence.
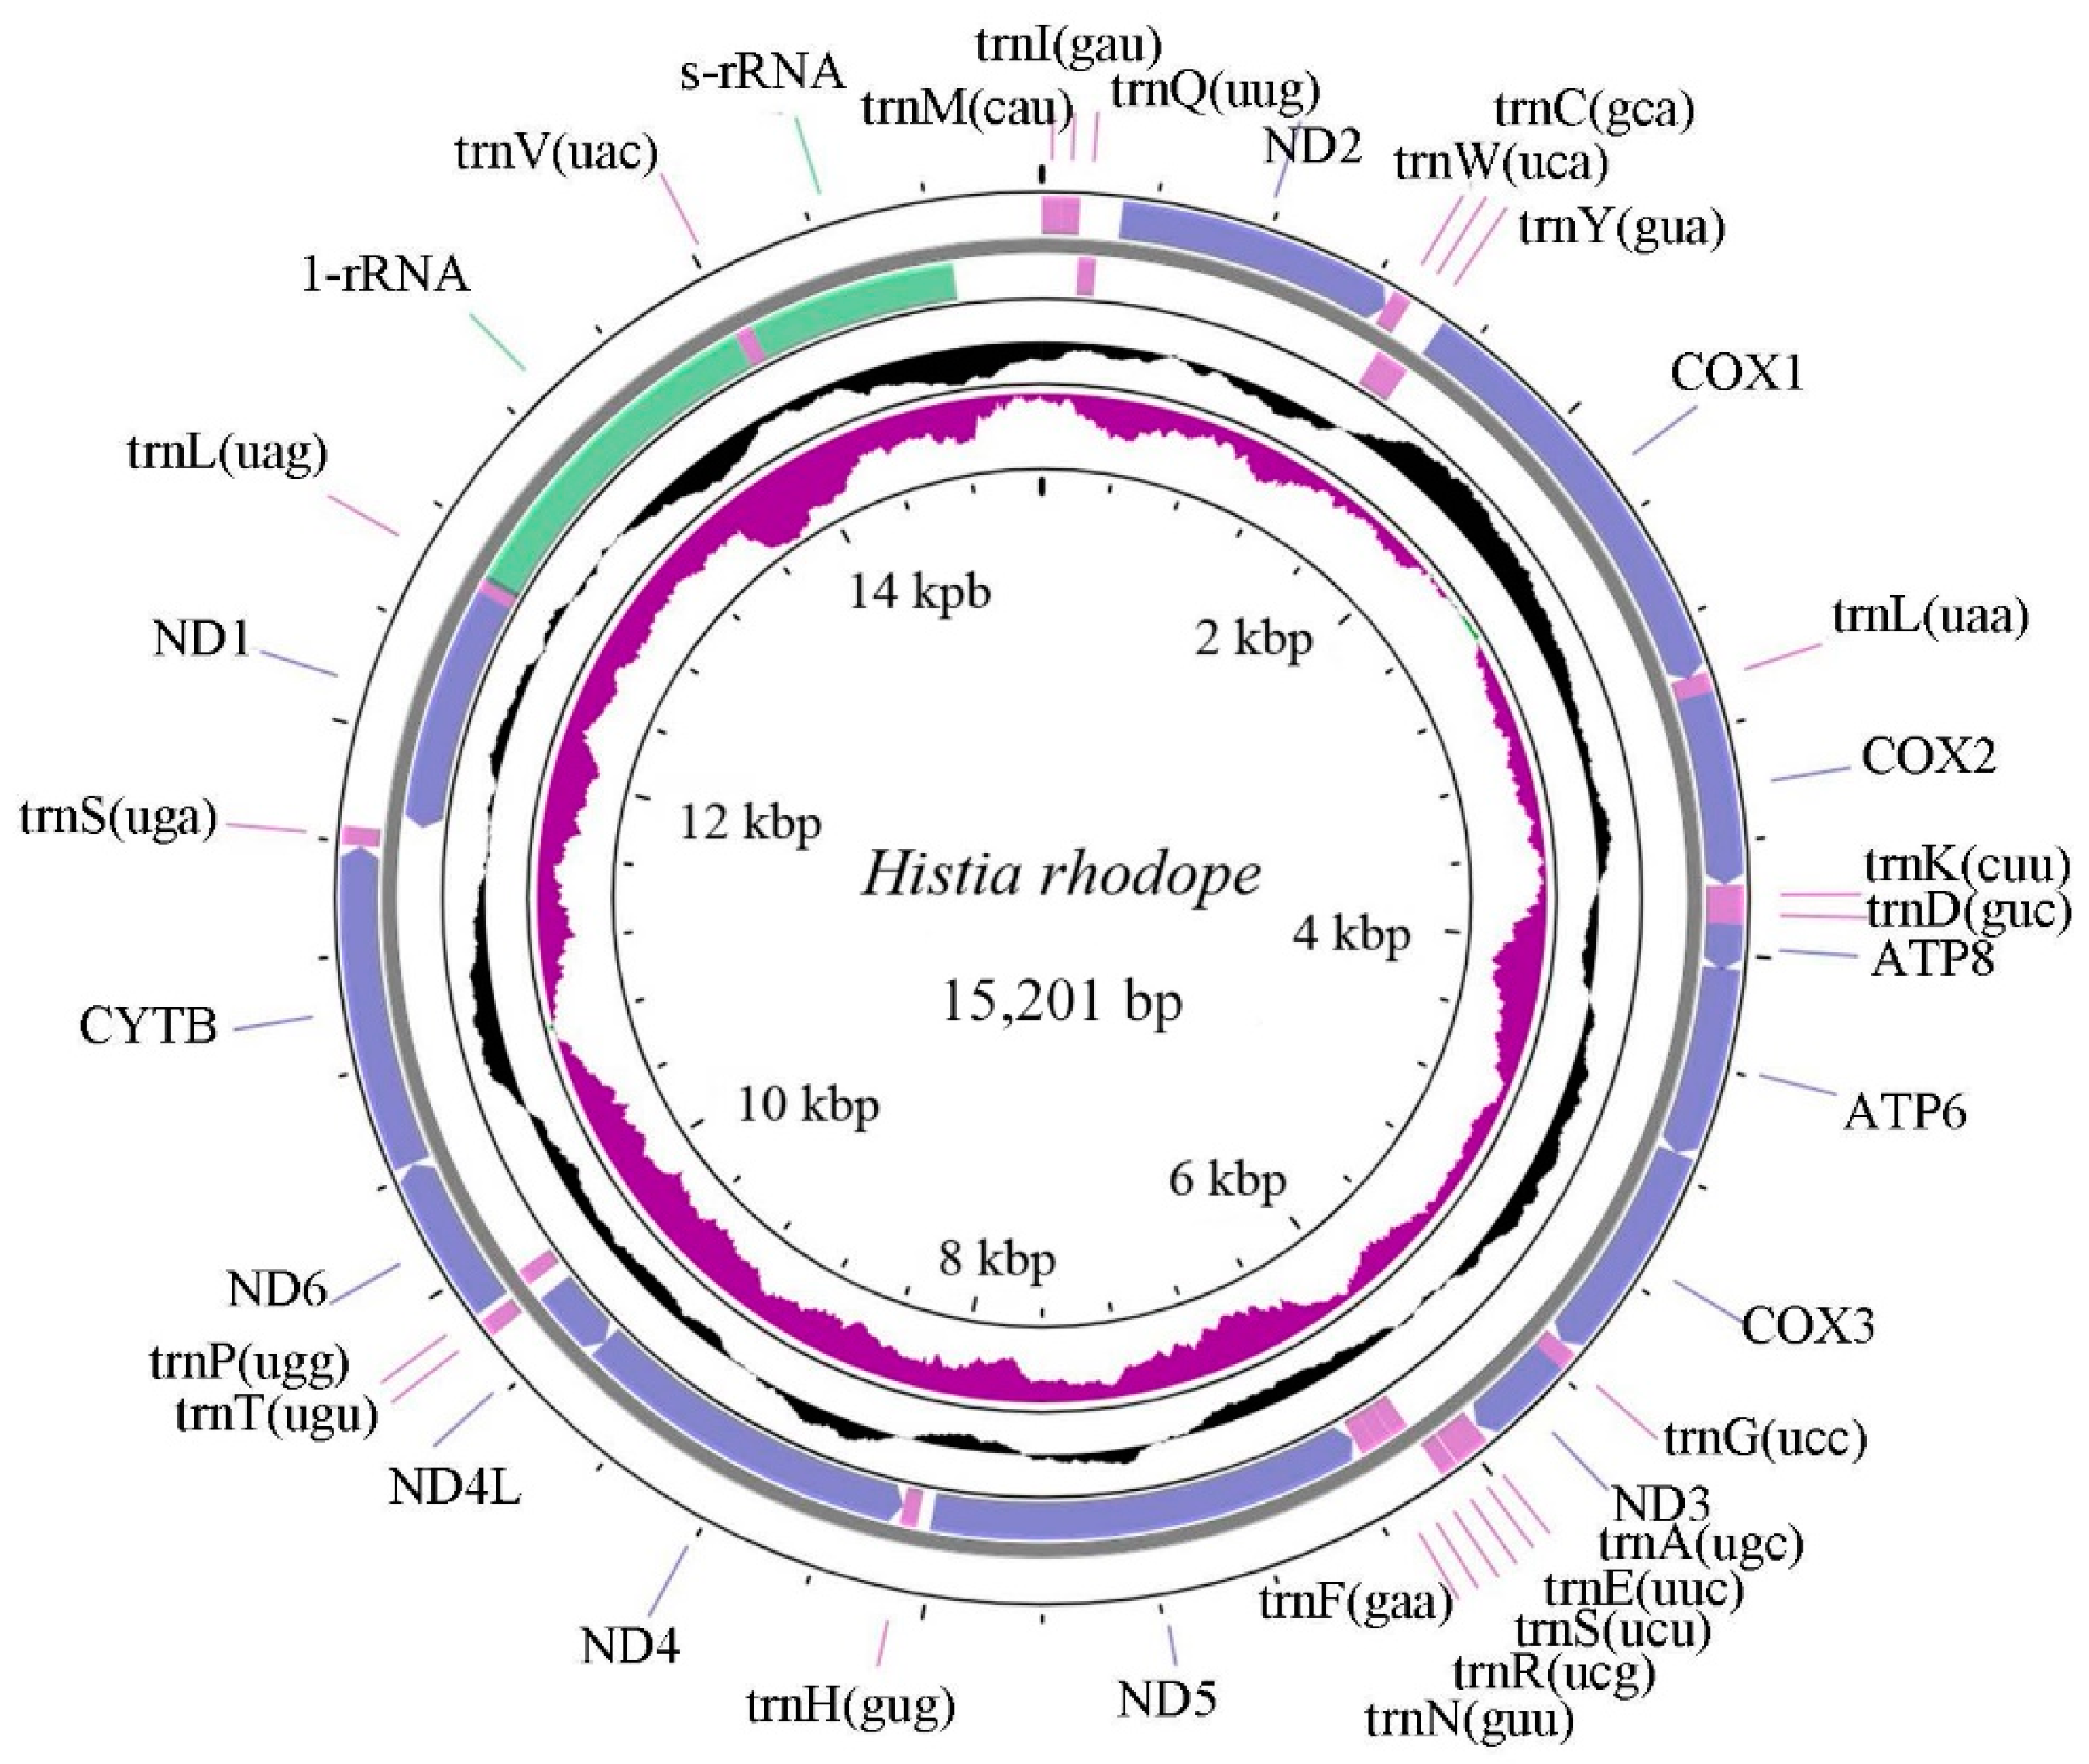
Figure 3.
Figure 3. Codon usage of amino acid in Histia rhodope mitogenome. Codon families in different color were provided on the horizontal axis, and codon usage were provided on the vertical axis.
Figure 3.
Figure 3. Codon usage of amino acid in Histia rhodope mitogenome. Codon families in different color were provided on the horizontal axis, and codon usage were provided on the vertical axis.
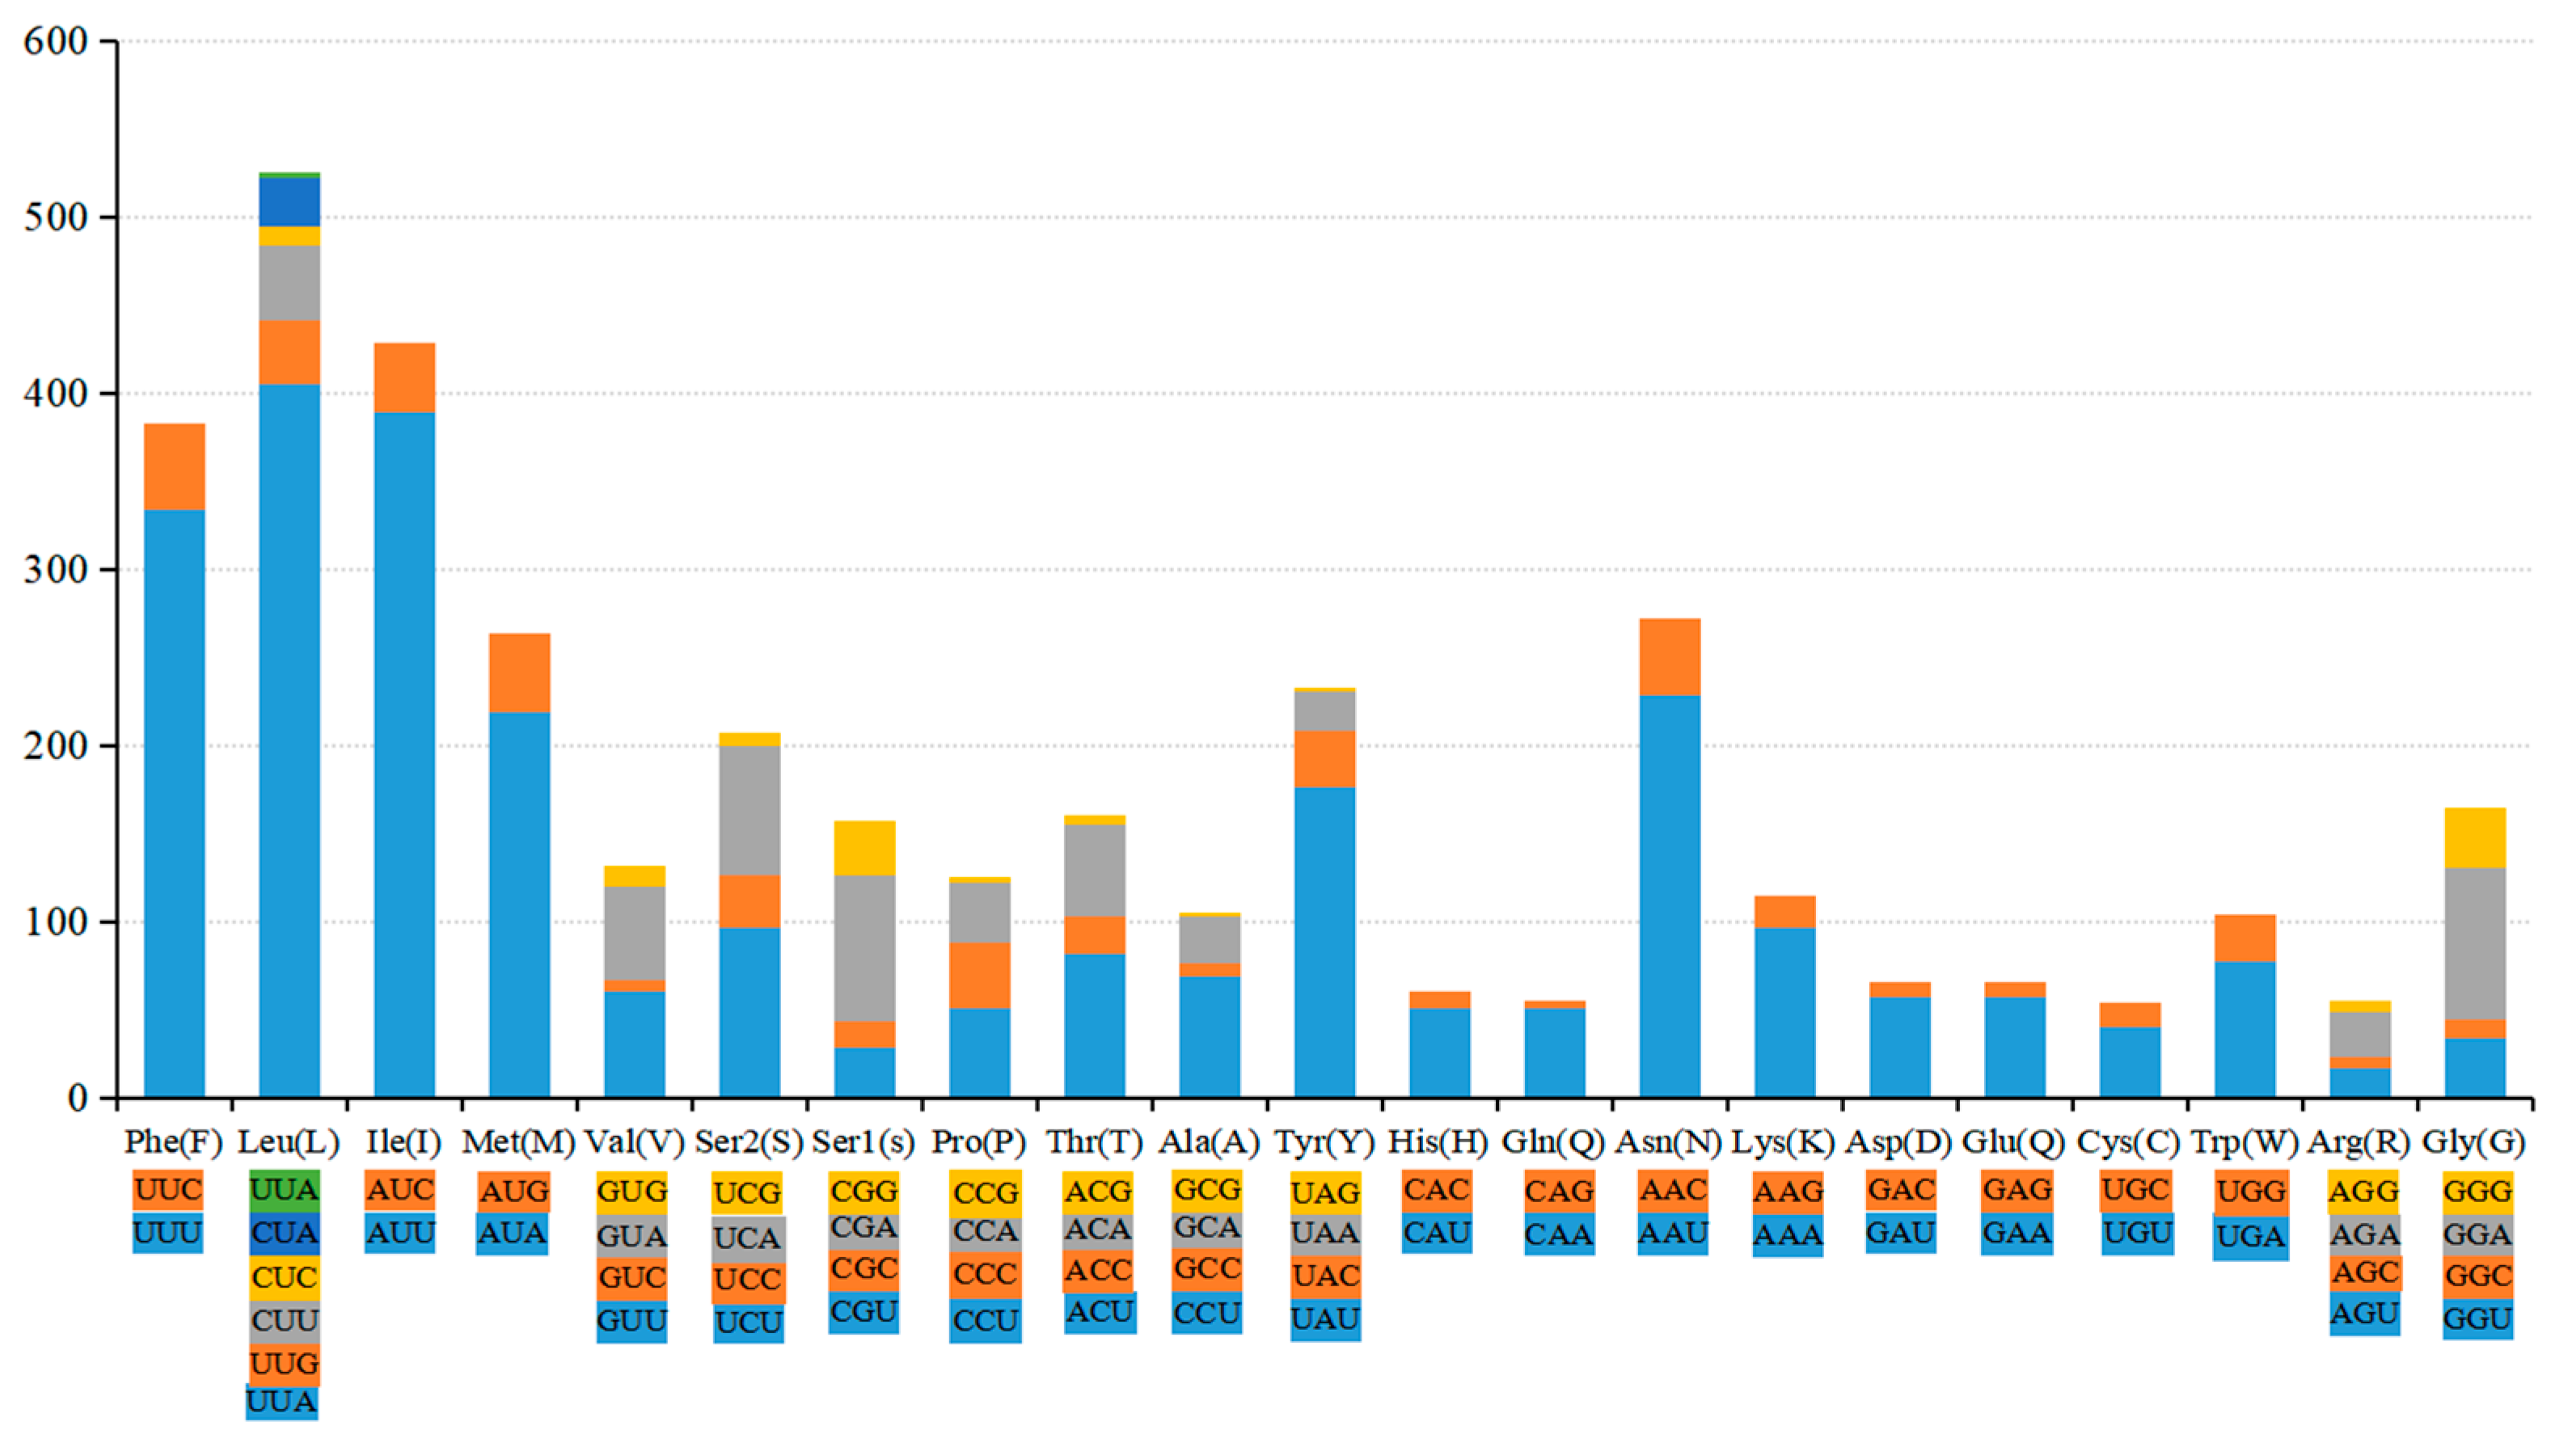
Figure 4.
Figure 4. Phylogenetic tree constructed by the mitogenomes from lepidopteran moths using BI (Bayesian inference). Numbers at the nodes were Bayesian posterior probabilities for the BI tree, and different colored clades indicate different families.
Figure 4.
Figure 4. Phylogenetic tree constructed by the mitogenomes from lepidopteran moths using BI (Bayesian inference). Numbers at the nodes were Bayesian posterior probabilities for the BI tree, and different colored clades indicate different families.
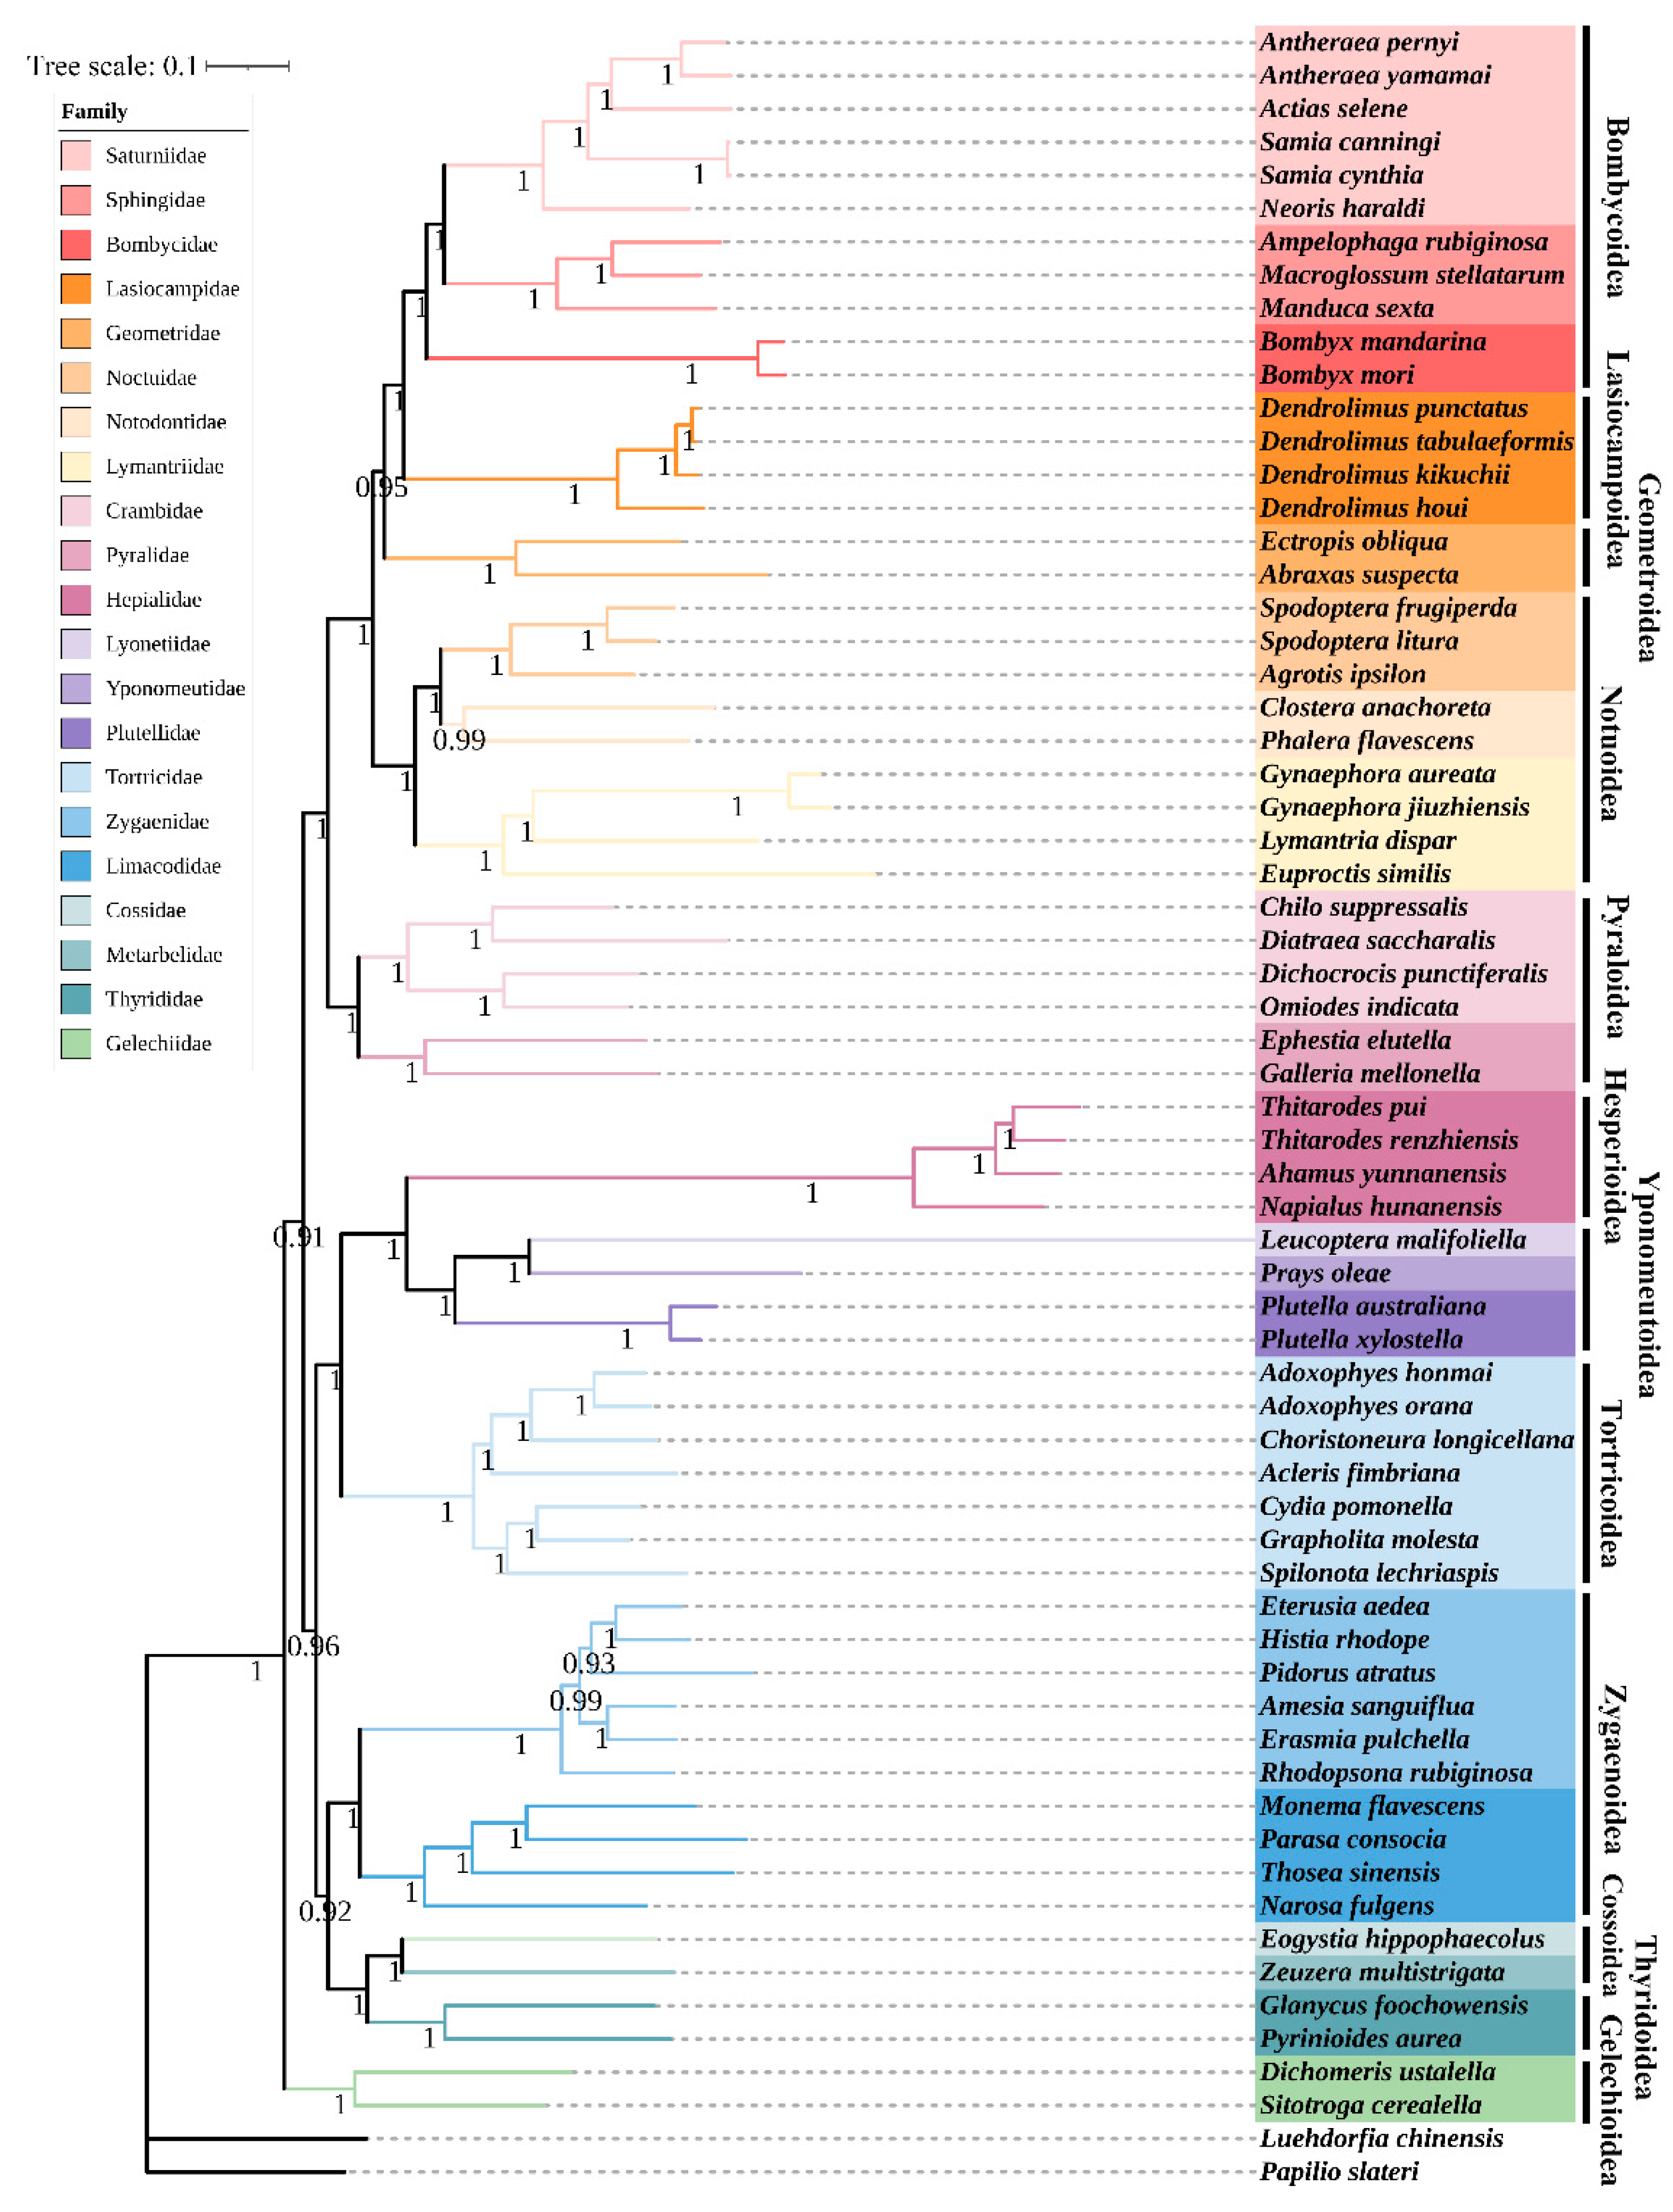
Figure 5.
Jackknife test gain of environmental factors for predicting potential geographical distribution of Histia rhodope.
Figure 5.
Jackknife test gain of environmental factors for predicting potential geographical distribution of Histia rhodope.
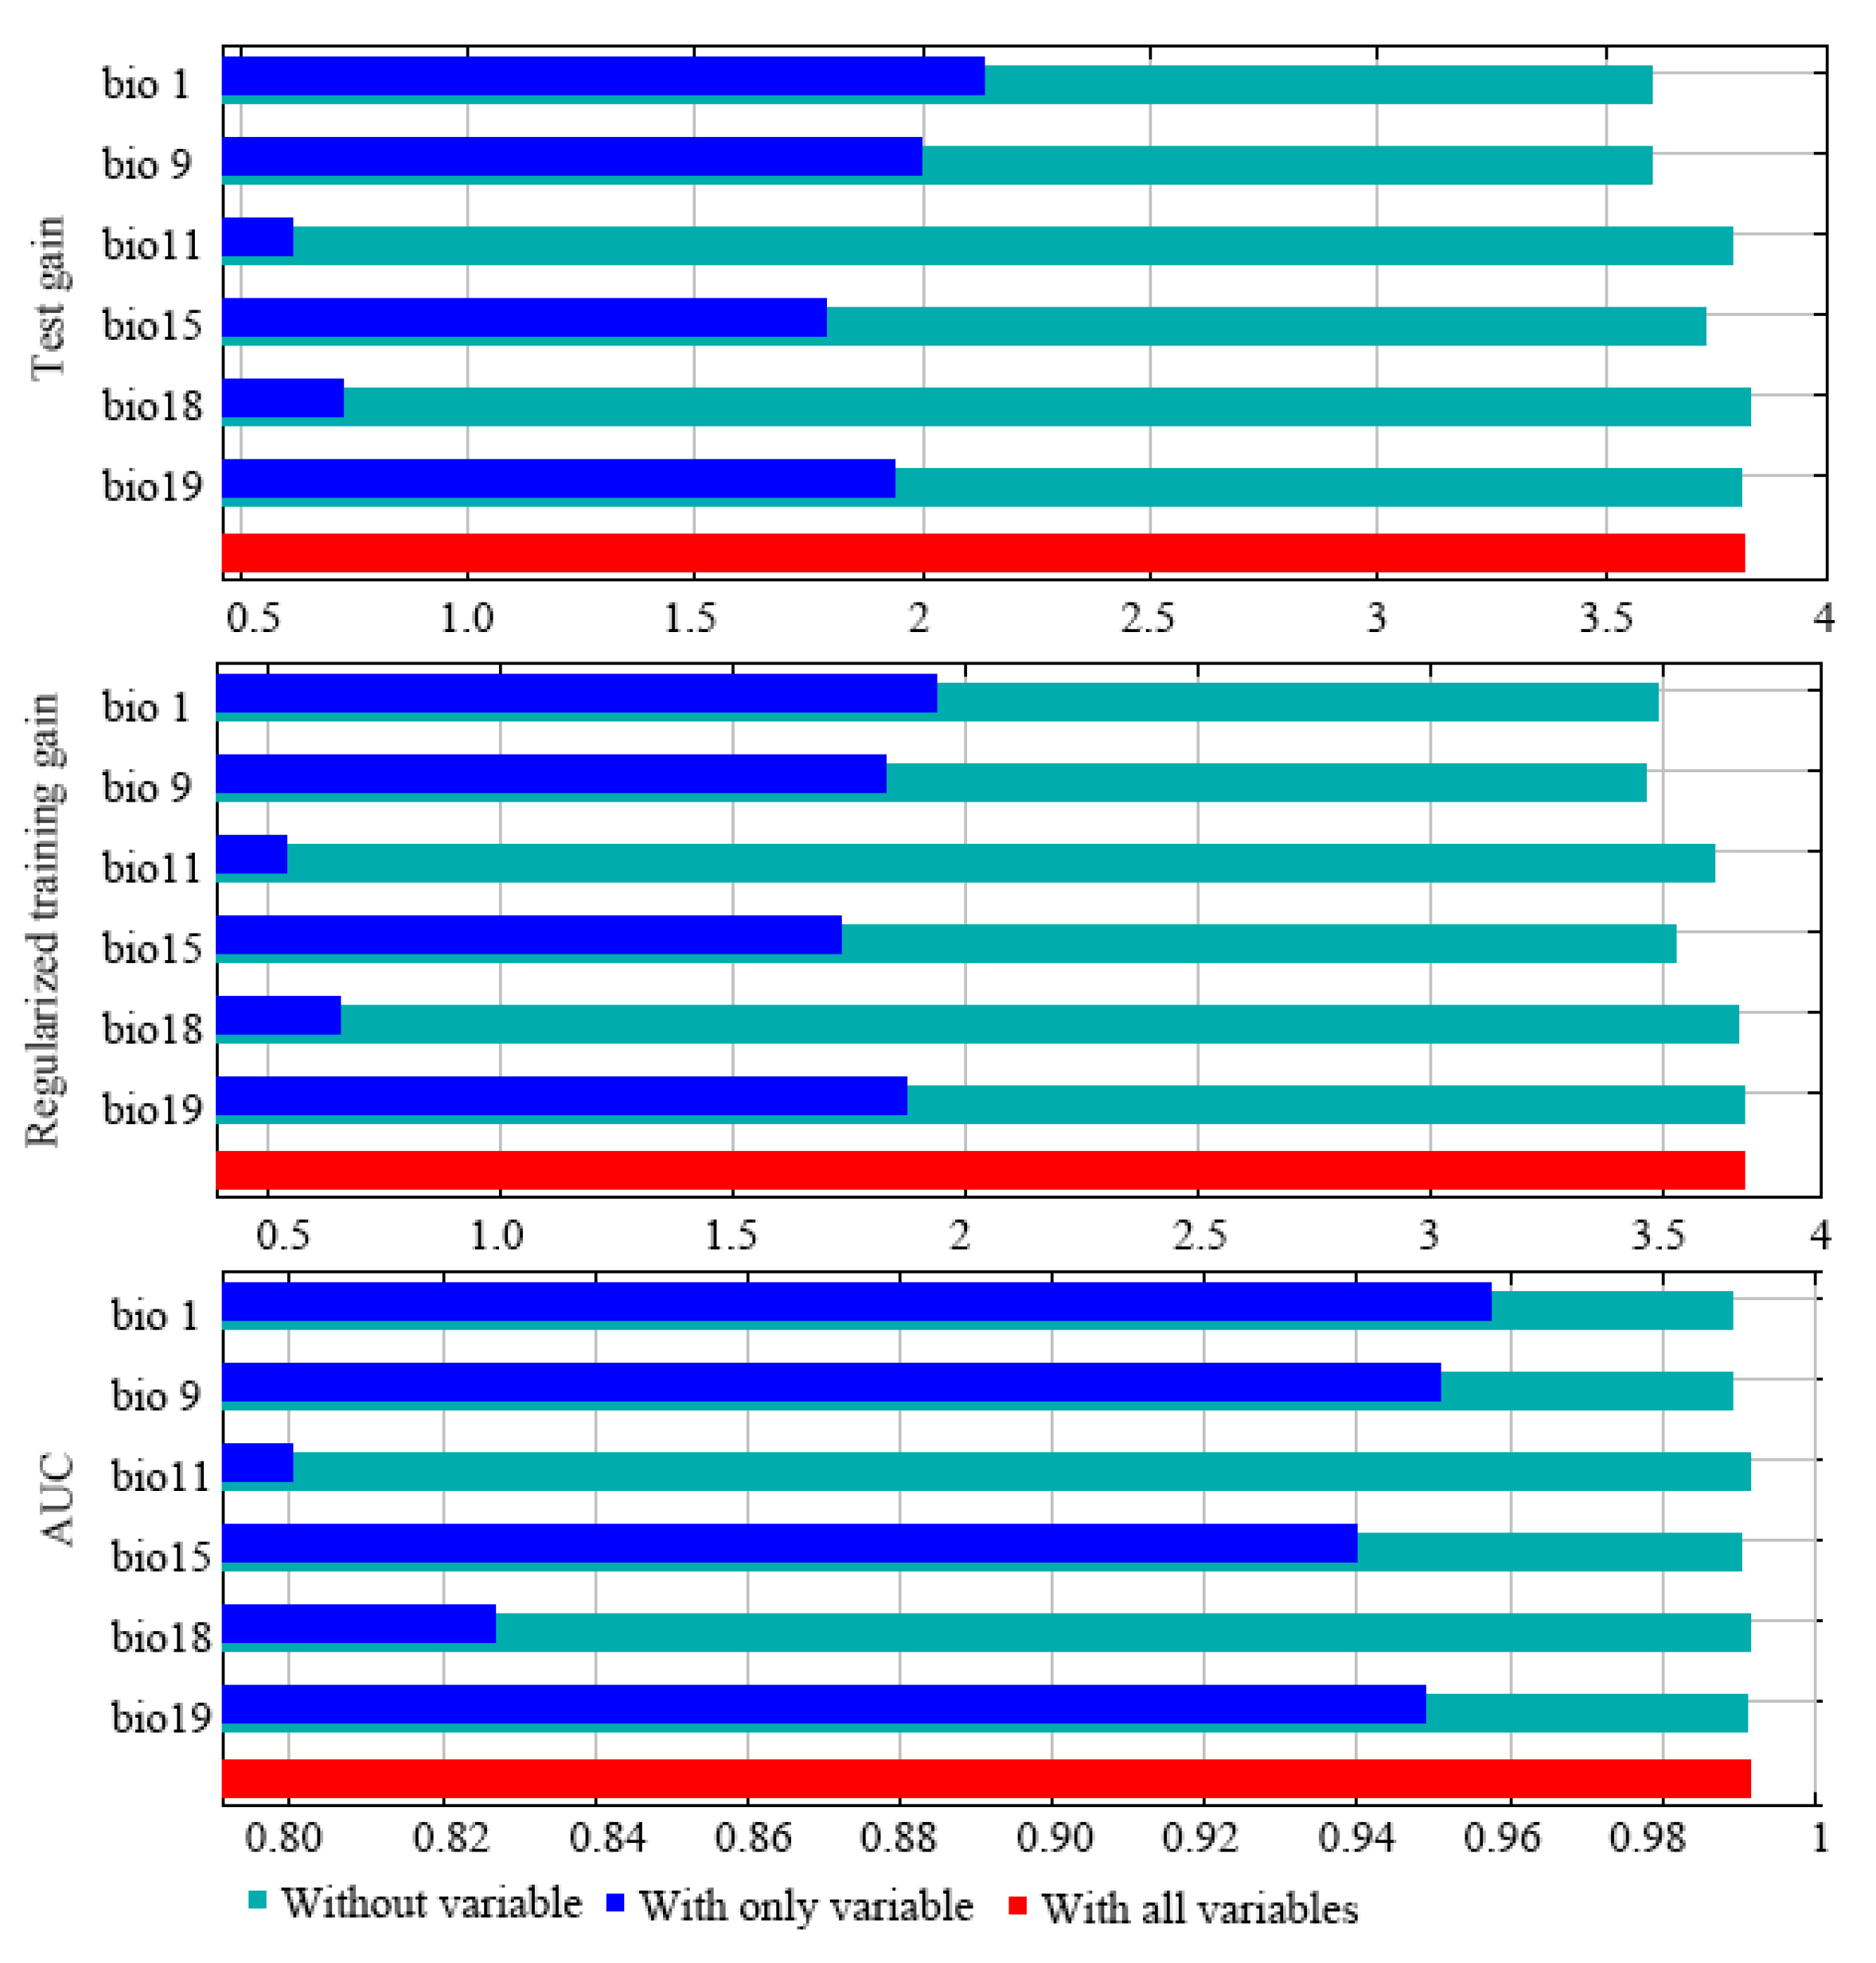
Figure 6.
Potential distribution of Histia rhodope in different habitat areas of China under current year and 2050 climatic conditions (inspection number: GS(2024) 0650).
Figure 6.
Potential distribution of Histia rhodope in different habitat areas of China under current year and 2050 climatic conditions (inspection number: GS(2024) 0650).
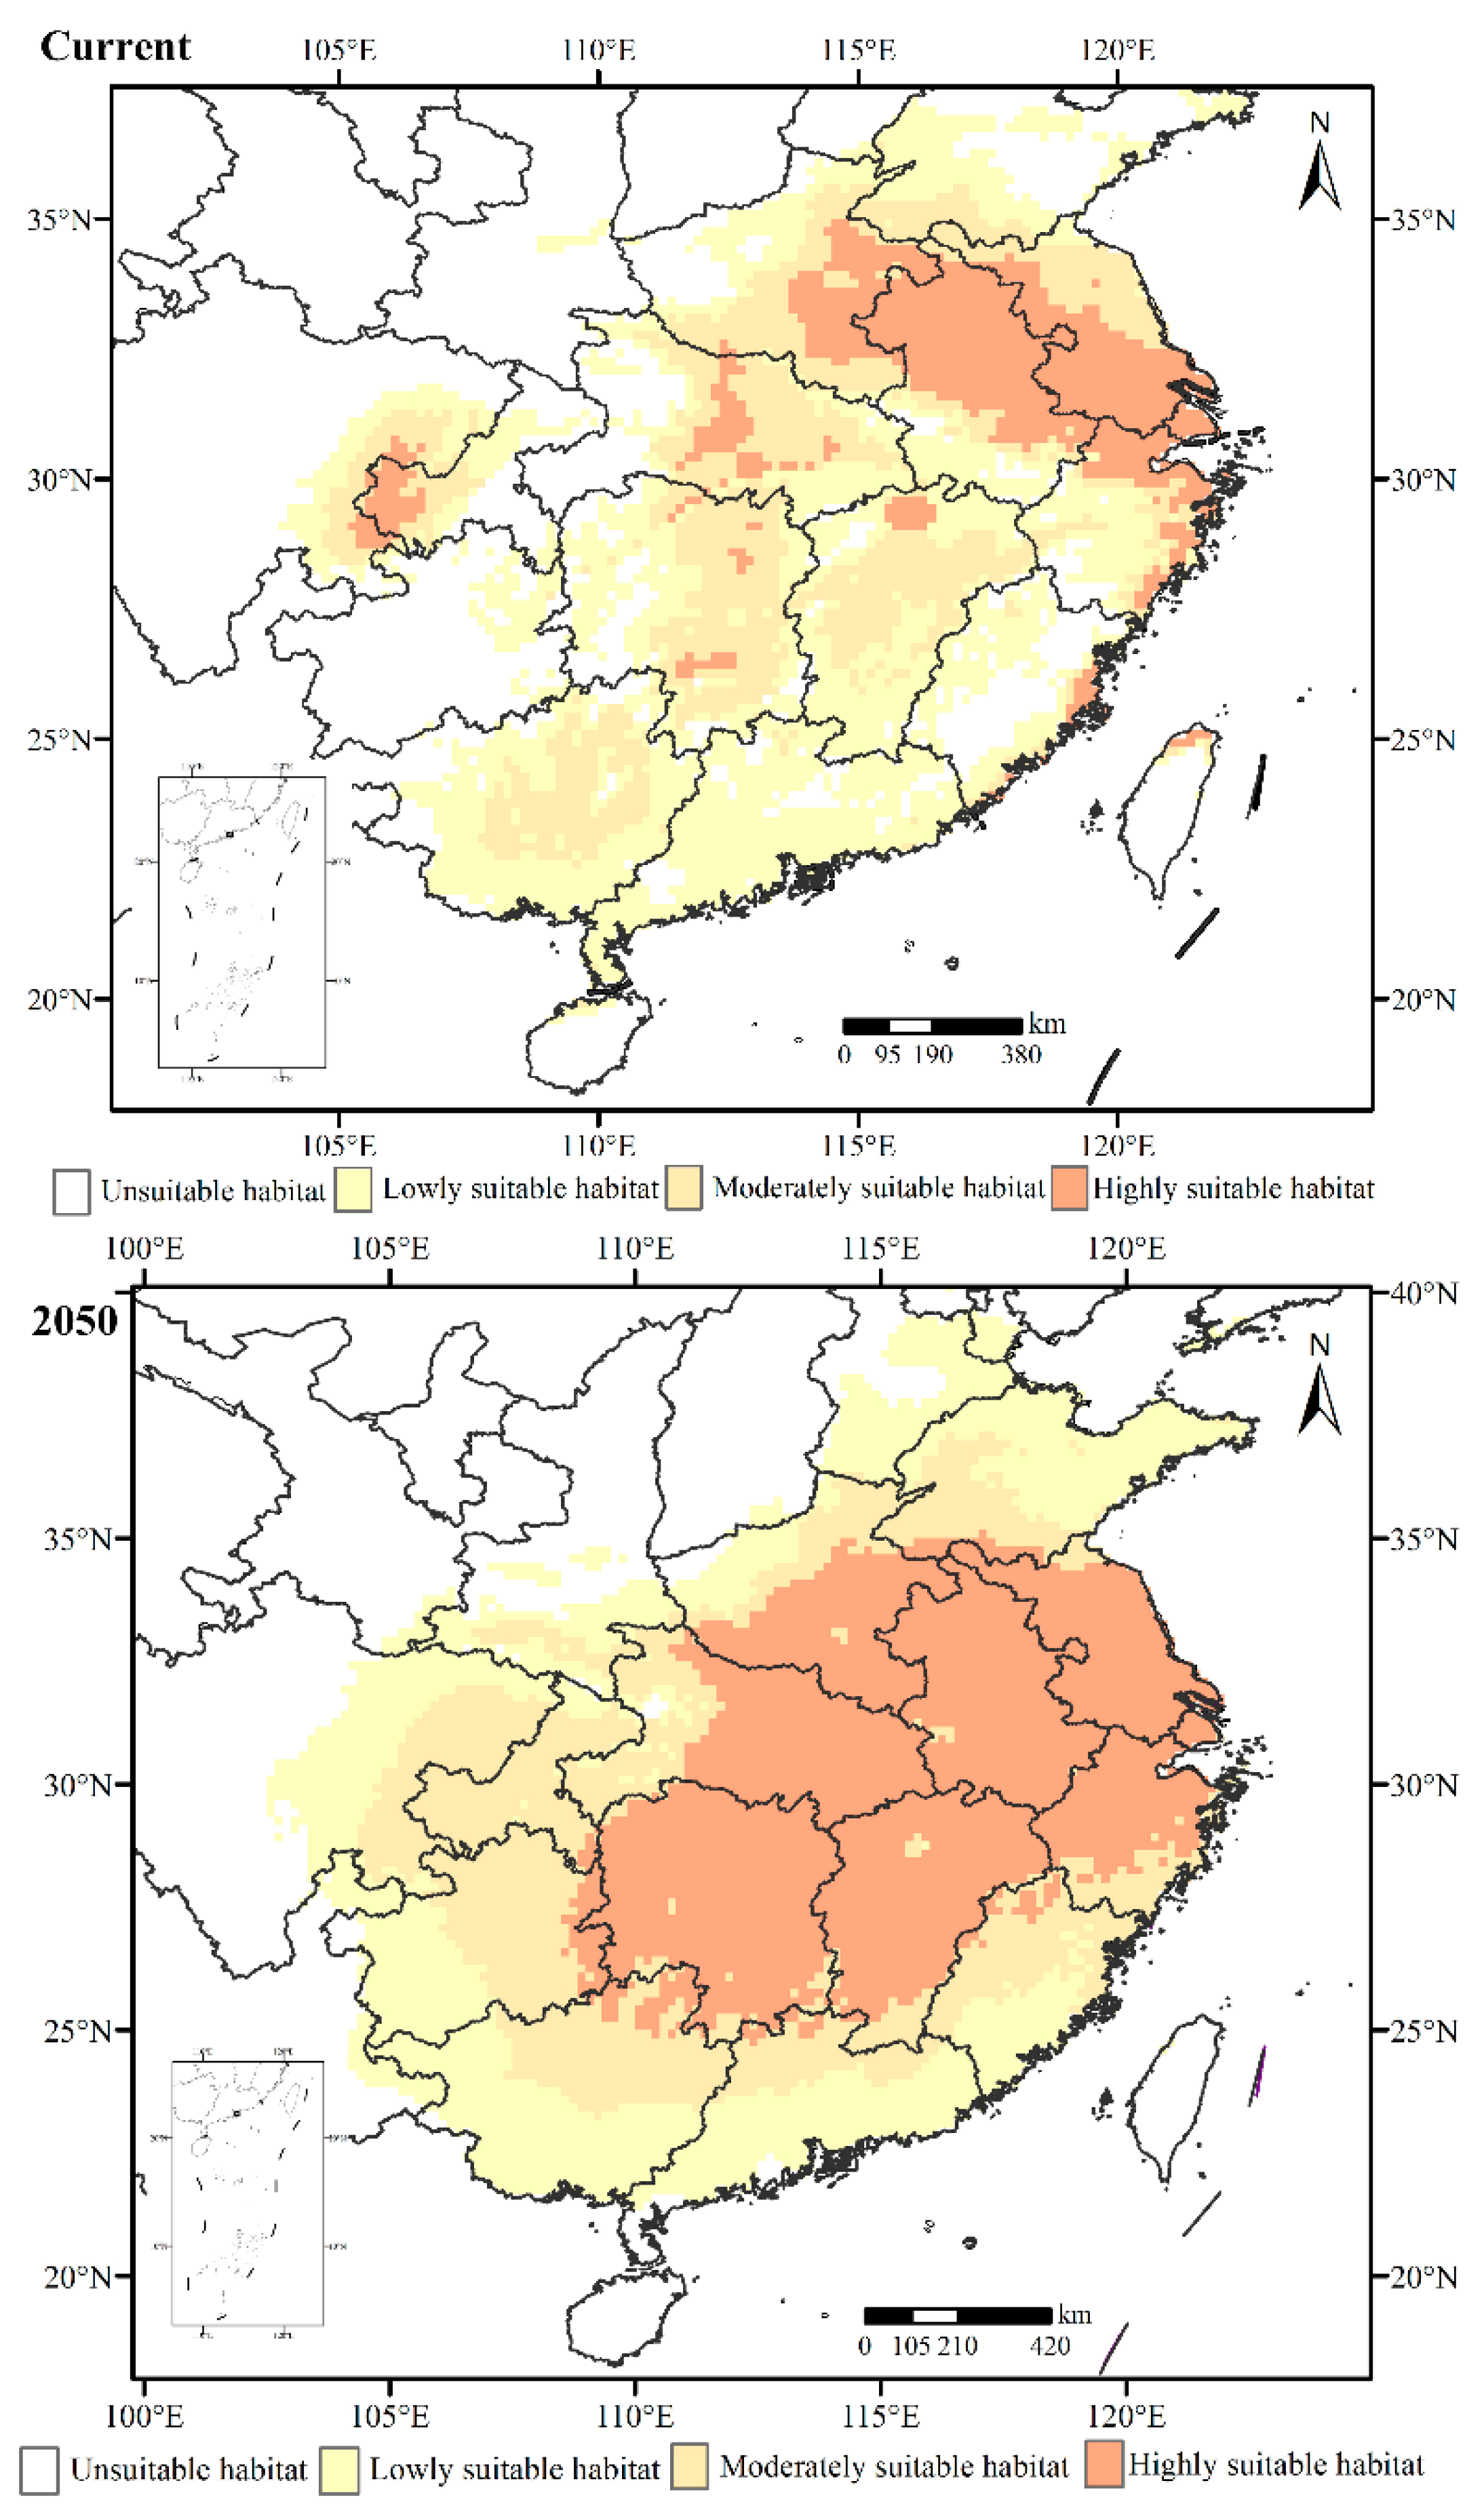
Figure 7.
Histogram of predicted suitable habitat area changes based on the MaxEnt model.
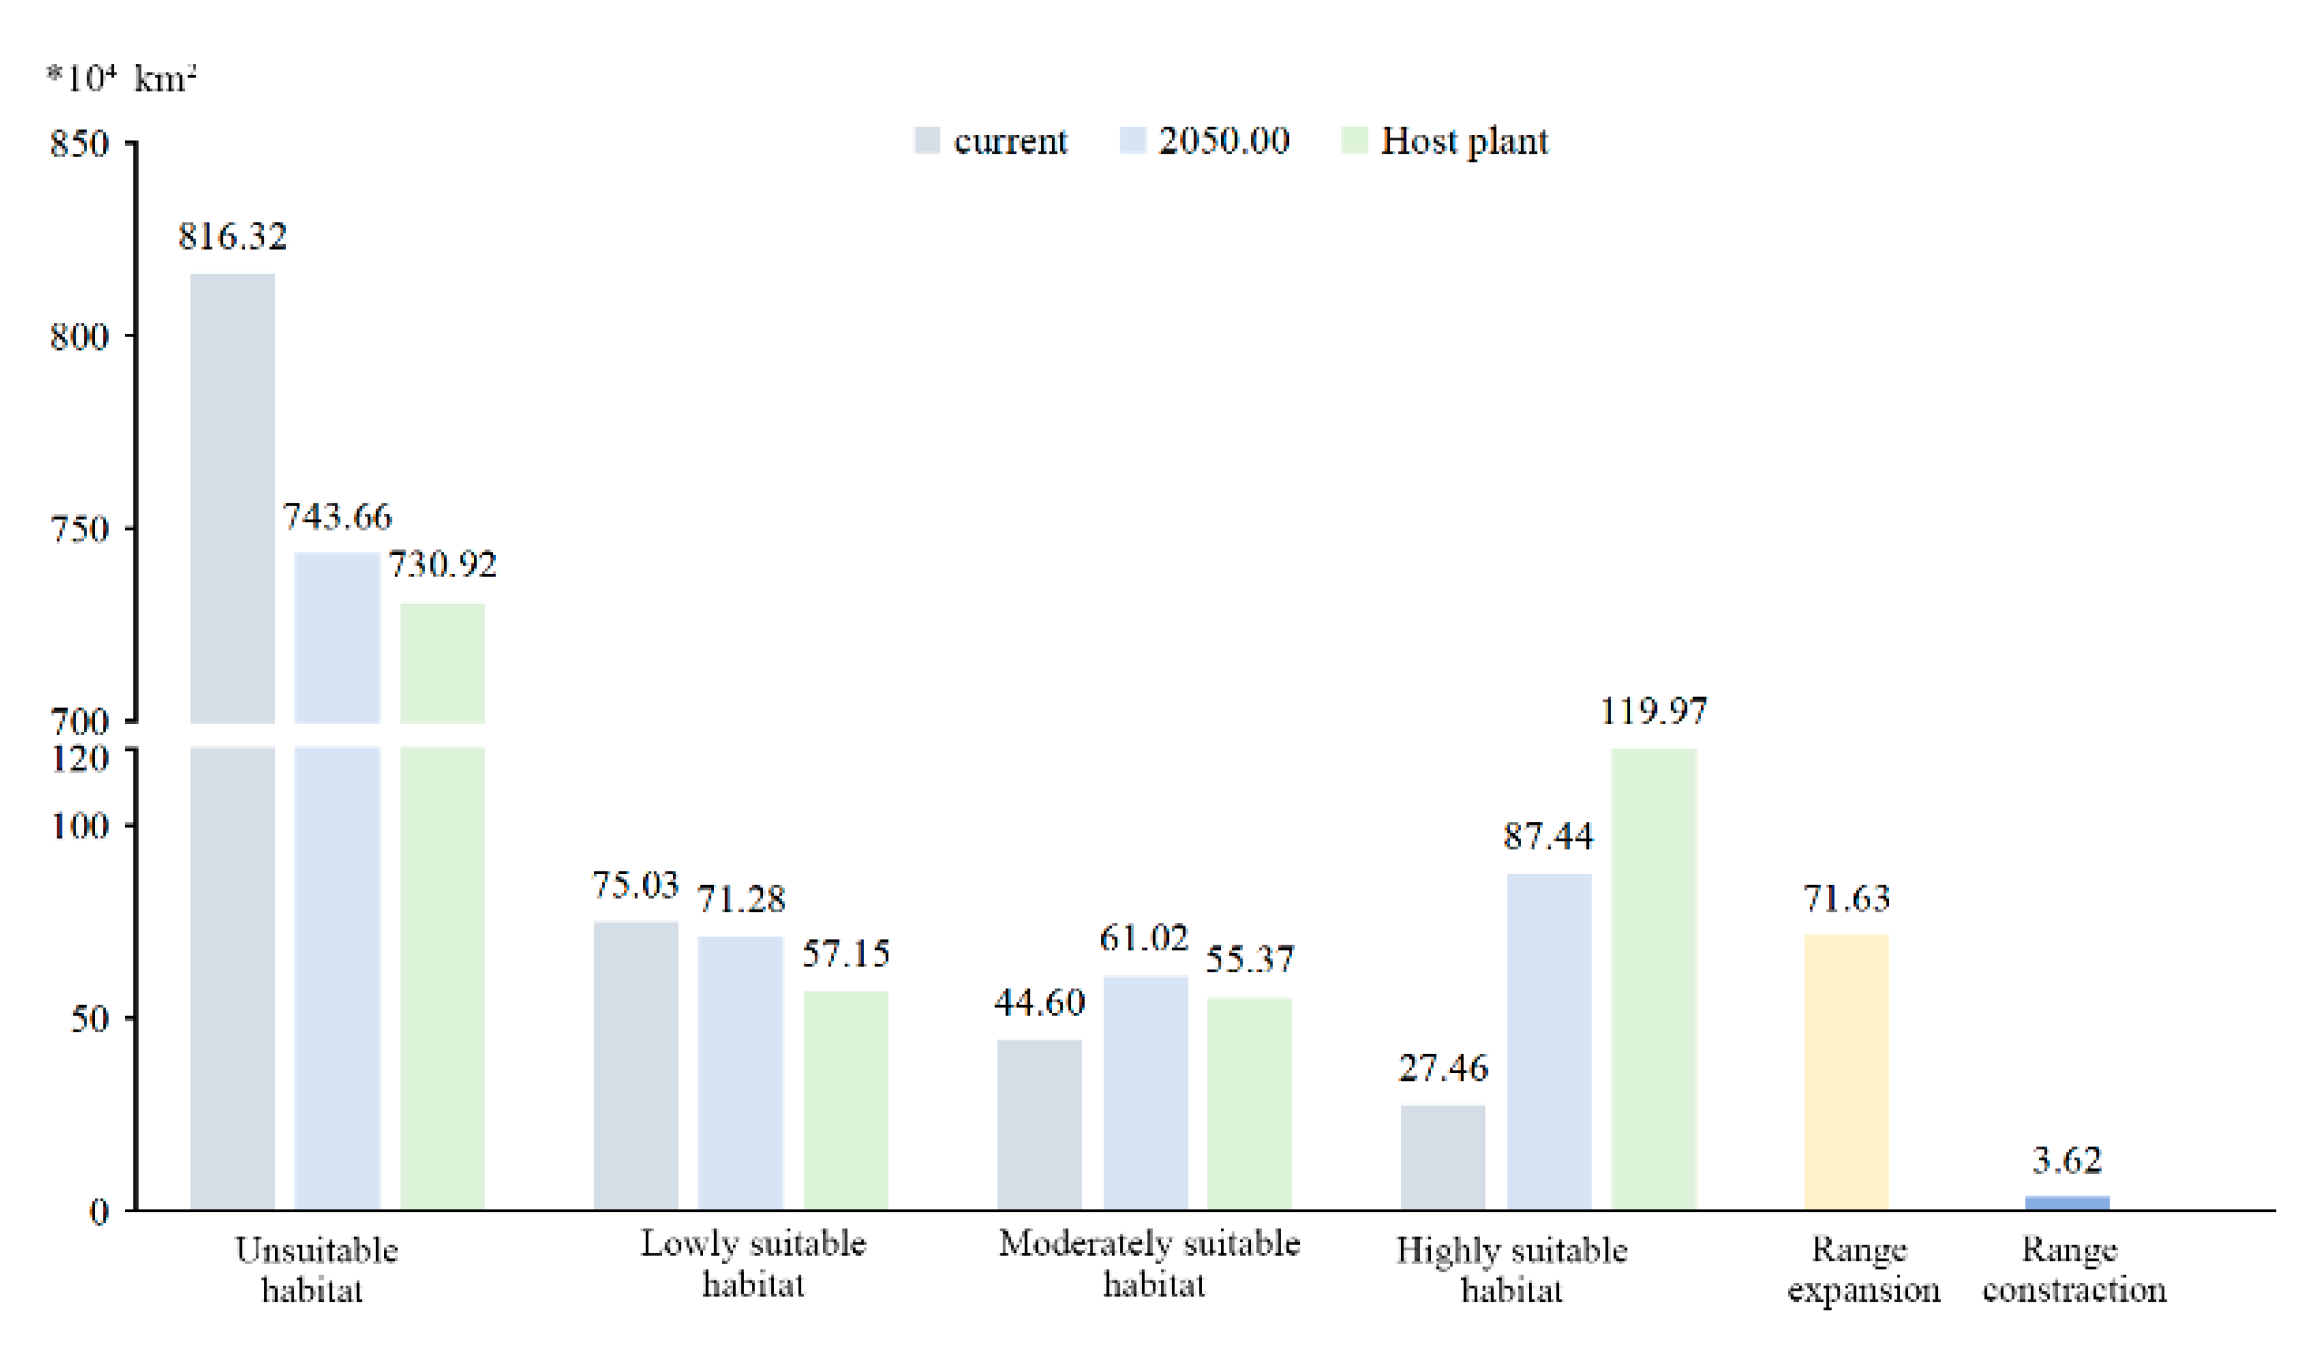
Figure 8.
Centroid migration of Histia rhodope habitat suitability areas (A) and its host plant distribution (B). (inspection number: GS(2024) 0650).
Figure 8.
Centroid migration of Histia rhodope habitat suitability areas (A) and its host plant distribution (B). (inspection number: GS(2024) 0650).
Disclaimer/Publisher’s Note: The statements, opinions and data contained in all publications are solely those of the individual author(s) and contributor(s) and not of MDPI and/or the editor(s). MDPI and/or the editor(s) disclaim responsibility for any injury to people or property resulting from any ideas, methods, instructions or products referred to in the content. |
© 2024 by the authors. Licensee MDPI, Basel, Switzerland. This article is an open access article distributed under the terms and conditions of the Creative Commons Attribution (CC BY) license (http://creativecommons.org/licenses/by/4.0/).
Copyright: This open access article is published under a Creative Commons CC BY 4.0 license, which permit the free download, distribution, and reuse, provided that the author and preprint are cited in any reuse.


