
Submitted:
01 October 2024
Posted:
02 October 2024
You are already at the latest version
Abstract
Computer vision technology for automatic recognition and geometric characterization of carbon fibers was proposed in this paper. A two-stage pipeline was used, in the first stage the fundamental neural network model of segmentation SAM(Segment Anything Model) was used, in the second stage the segmentation results were improved by using a trained neural network model DeepLabv3+. Both manually labeled carbon fiber images and generated synthetic images were used for training. It is shown that additional use of synthetic data in training of neural network models improves the quality of segmentation by IoU and Pix Acc metrics from 0.943 and 0.949 to 0.953 and 0.959, i.e. by 1% on average. The total processing time averaged 0.95 seconds for a single fiber image. Based on the segmentation results, an automatic calculation of geometric characteristics and statistics that can be used to evaluate material properties was realized.
Keywords:
carbon short-fibers
; virtual training
; image segmentation
; instance segmentation
; semantic segmentation
; DeepLabv3+
; SAM
; Hough technique
1. Introduction
Modern short-reinforced composite materials have the following advantages: high strength characteristics, low specific weight, and ease of manufacture and processing [1,2]. These materials are used in many industrial sectors [3]. The peculiarity of such materials is the presence of fibers, which significantly affect the mechanical characteristics of future products [4]. Among the most commonly used methods to produce short-reinforced materials are extrusion and injection molding, which use chopped or milled fibers with a low aspect ratio [5].
The macroscopic mechanical properties of fiber-reinforced composite materials depend on the microscopic characteristics of fibers [6, 7], such as their aspect ratio [8, 9], orientation, and distribution in the product [10]. Fiber’s aspect ratio is included in material models used for the design of short fiber reinforced structures [11]. During extrusion and injection, fibers experience shear stresses, resulting in fiber damage and fiber length reduction [12]. The critical fiber length, defined as the minimum length at which a fiber can sustain a load on its ultimate strength, is used to assess fiber failure. Several models are available for estimating the critical fiber length [13,14,15]. In paper [16], fiber modeling was performed, and the effective response of the composite and average stresses on the fibers were obtained. It has been shown in [17] that the high aspect ratio of reinforced carbon fibers significantly affects the tensile, flexural, dynamic mechanical properties, thermal deflection temperature, and impact strength of reinforced composites. These models are based on an integral approximation of the mechanical characteristics of a composite in a cell of representative volume and include a solution to the orientation tensor closure problem [18]. The paper [19] presents results on the estimation of an effective viscoelastic stiffness module with controlled accuracy for short fiber composites with spheroidal and spherocylindrical inclusions. The elastic field of an ellipsoidal inclusion was described by Eshelby [20]. The mechanical characteristics of a unidirectional composite were obtained using the Mori-Tanaka model [18], and anisotropy is accounted by Advani-Tucker averaging [21].
The experimental evaluation of the microstructure of composites requires the recognition of fiber patterns in optical and electron microscope images and in spatial microtomographic images. Obtaining two-dimensional images using microscopy requires simpler equipment than using computer microtomography; however, it is a more difficult task to recognize fiber patterns because of their possible layering on top of each other [22 - 26].
To generate a material model for reinforced polymers, it is necessary to extract a sample of the geometric characteristics of the fibers; this process is performed by analyzing images captured by electron microscopes. The quality of data practically depends on the visual ability of the researcher, and the speed of data acquisition is based on the researcher’s measurement skills. We propose to replace this task in people using a neural network using deep learning techniques applied to computer vision.
In previous research [27, 28], the use of image segmentation (specifically instance segmentation) was proposed using the Mask R-CNN neural network [29, 30], which was trained with artificial images that simulated images obtained by scanning electron microscopy. An API of the NX CAD program (in C language) was developed for the creation of cylinders (simulating short fibers) in random arrangements on a solid color background (see Figure 1).
The network demonstrated good performance in fiber detection in areas where there was no large accumulation of fibers, and the performance decreased as the accumulation of in-stances increased. The network demonstrated good performance in short-fiber detection in images with low numbers of fibers (from 5 to 20 fibers per image). At the time of testing the network trained on real images of short carbon fiber samples, Mask R-CNN could detect the fibers in images in which there was not a large number of fibers, and the fibers did not overlap (see Figure 2a). On the other hand, in images with a high fiber concentration, Mask R-CNN did not demonstrate good performance (see Figure 2b).
To solve the problem of fiber detection, especially in assemblies with a large number of overlapping parts, the use of a two-stage image segmentation technique was proposed. The first stage requires the application of a semantic segmentation technique to identify the regions of different labels in the image. In the second stage, the instance segmentation technique is used to identify objects by labeling each label individually [31]. For the first stage, DeepLabv3+ [32] or PVT [33] neural networks are recommended, while for the second stage, the use of SAM [34] or SEEM [35] neural networks is recommended [31]. The combination of these two techniques, particularly using the DeepLabv3+ and SAM architectures, achieved significant improvements in mask prediction [31, 36, 37]. Traditionally, highly specialized segmentation tasks are often solved by fine-tuning basic models such as SAM [38]. However, it requires significant computational and time costs.
In the present work, we propose the detection of short carbon fibers using an image segmentation technique in two stages, particularly with the use of the DeepLabv3+ and SAM architectures. As in our previous research, we continue to use artificial images for the training of neural networks, in addition to real images captured using a scanning electron microscope.
2. Materials and Methods
2.1. Methodology
The technology proposed by the authors for the automatic segmentation of carbon short fibers in scanning electron microscopy images consists of two main stages:
- Semantic segmentation of the original scanning electron microscope image to separate the fibers and the background.
- Segmentation of individual fiber instances in the image with the background removed after the first stage.
In the first stage, background images and fibers are separated using the DeepLabV3+ neural network, and in the second stage, instance segmentation is applied using the Segment Anything Model (SAM) network. In addition to selecting the SAM architecture for the second stage, the Hough transformation method was used. The choice of the Hough transformation is based on the fact that the carbon fibers in the image are straight segments; the search for such objects is a characteristic task of this method [39]. To train neural networks, it is proposed to use artificial images and real images captured using a scanning electron microscope.
2.2. Creation of Real Images of Carbon-Short Fibers
To create real images, fibers separated from the binder in the process of degradation of a carbon-filled structural 30% mass short reinforced composite material based on polyamide-6 in a muffle furnace at heating for 20 min at 900°C in a nitrogen atmosphere were used, with the rate of increase and decrease in temperature equal to 5°C/min (see Figure 3 and 4), according to the technical process tested in the work [40]. To test the performance of the image recognition technique for different types of fibers, images of short glass fibers were obtained in the same muffle furnace by degradation of the 30% mass glass-fiber poliamide-6 composite material in a nitrogen atmosphere for 1 h at a temperature of 550°C, with the same rate of increase and decrease in temperature equal to 5°C/min. The heating of the samples by the muffle furnace ensured the destruction of the binder, and the work in the nitrogen atmosphere protected the fibers from oxidation with oxygen from the air. As a result, short fiber samples were obtained while preserving their geometric characteristics for further study. The muffle furnace temperature was selected for each fiber type to ensure that the binder would degrade, while the fibers remained intact.
To capture images that help identify short fibers, the following requirements are suggested:
- The arrangement of the fibers in a thin layer, preferably single, so that the underlying substrate is visible. The multilayer arrangement of fibers does not allow reliable separation of one fiber from another, especially when considering multiple superpositions of fibers with each other.
- The fibers were examined on a well-polished background. The presence of background roughness caused, for example by rough machining or sanding can sometimes cause false positives in subsequent image segmentation (see Figure 5).
- The magnification of the electron microscope should ensure the capture of four to six medium lengths of fibers, which on the one hand ensures reliable measurement of their length and on the other hand does not cause large deviations due to the effect of incorrect measurement of the length of fibers extending beyond the boundaries of the frame (see Figure 6).
2.3. Labeling of Images
Image labeling is designed using the instance segmentation technique. Semantic and instance segmentation consider correct detection of all objects in an image and precise segmenting of each instance. Therefore, it combines object detection, object localization, and object classification. In other words, this type of segmentation gives a clear distinction between each object classified as similar instances.
For a neural network to achieve object recognition using the instance segmentation technique, it is necessary that the images used for training are linked to a file that indicates the corresponding annotations of each instance. For this purpose, we used the LabelMe program [41]. LabelMe is an open-source image annotation tool. LabelMe allows you to create annotations using polygons for computer vision datasets for object detection, classification, and segmentation.
The fiber labeling of two real images is shown in Figure 7.
2.4. Creation of Virtual Images of Carbon-Short Fibers and Labeling of Virtual Images
For the virtual creation of assembly images of the short carbon fibers, Siemens NX CAD software was used. The software contains tools that simulate the texture and effects of light and shadow as visualized in real images captured by electron microscopy.
NX Open is a collection of APIs for developing applications for NX. The APIs were implemented in a C programing environment for creating .dll files which are executed in NX to create images to obtain our virtual dataset.
The virtual dataset comprises a series of images, simulating randomly disperse fibers on a metallic plate, and a .json file corresponding to each image in which the coordinates of the fibers within the picture are stored. Algorithm 1 shows the procedure used to create artificial images in NX.
| Algorithm 1. Algorithm for the creation of artificial images of short carbon fibers. | |
| Input: Ncyl, Nimg, Pxsize, Llow, Lup, Lleft, Lright, lmin, lmax, Dmin, Dmax, Fjson | |
| Output: Simg, Sjson | |
| 1 | Define the XY plane as the visualization plane; |
| 2 | Set the image size Pxsize x Pxsize pixels; |
| 3 | Delimit the cylinder insertion area (Acyl) of the images with the corners (Lleft, Lup) and (Lright, Llow); |
| 4 | for i = 1 to Nimg do |
| 5 | for j = 1 to Ncyl do |
| 6 | Choose the center of the cylinder randomly delimiting the insertion area; |
| 7 | Determine the cylinder length randomly in the range [lmin, lmax]; |
| 8 | Determine the cylinder diameter randomly in the range [Dmin, Dmax]; |
| 9 | Randomly determine the angle of rotation with respect to the axis normal to the XY plane; |
| 10 | Randomly determine the angle of rotation with respect to an axis belonging to the XY plane and perpendicular to the longitudinal axis of the cylinder; |
| 11 | Build, position and rotate the cylinder Cj; |
| 12 | Projecting the cylinder onto the XY plane; |
| 13 | if projection ∊ Acyl then |
| 14 | Save coordinates of the projection in Fjson,i; |
| 15 | else |
| 16 | Remove cylinder Cj; |
| 17 | Determine colors of the cylinders, texture of the background and lighting of the image Ii; |
| 18 | Ii → Simg; |
| 19 | Fjson,i → Sjson; |
| 20 | return Output |
The virtual images were created starting with a few cylinders in each image and gradually adding more cylinders until obtaining a similar image as the real images. The origin and direction of the cylinders are uniformly distributed. The length of the fibers was modeled using a normal distribution with a mean of 150 mm and a standard deviation of 50 mm; the diameter was a constant value of 6 mm.
The illumination of the fibers is in gray tones; therefore, in artificial images, the background color is a textured gray image, while the cylinders are black (see Figure 8). The resulting .png image is accompanied by a .json file that contains the information required to generate the masks for each short fiber. This file can be read using a mask generator, such as the LABELME application. The process of generating 100 random images with their annotations took 2 min on a computer with i5-3470 CPU with 16 Gb RAM and GeForce GTX 750.
2.5. Neural Network Architectures Tested
In this paper, we propose a two-stage pipeline that combines SAM and DeepLabV3+ to provide the generalizability and accuracy of the foundational SAM model and the ability to train quickly on a small amount of DeepLabV3+ data. Figure 9 shows the general data processing flowchart.
The first main component of the pipeline is DeepLabV3+ [32] is a powerful semantic segmentation model, known for its accurate pixel-by-pixel image segmentation skills. It combines a reliable object extraction tool, such as ResNet 50 or ResNet101 with an efficient decoder. This architecture does an excellent job of capturing both local and global contextual information, which makes it suitable for tasks where precise object boundaries and fine details are important. An important component is the Atrous Spatial Pyramid Pooling (ASPP) module, which uses several advanced convolutions to collect data at multiple scales. The decoder further enhances the output by combining high-level semantic functions with precise spatial data. High-precision segmentation in various applications is realized by combining the understanding of context and location.
The main components of DeepLabV3+ are an encoder, an ASPP module, a decoder, and a compression and excitation mechanism (SE) (see Figure 10).
The choice of this architecture was due to the sufficiently high segmentation accuracy for small training samples (no more than a thousand images).
The second main component is Segment Anything Model (SAM) [34], which is an image segmentation model developed by Meta AI. The proposed model can identify the precise location of either specific objects in an image or every object in an image. SAM was released in April 2023. SAM is a cutting-edge image segmentation model that provides prompt and accurate segmentation and unparalleled versatility for image analysis tasks. SAM’s advanced design allows it to adapt to new image distributions and tasks without prior knowledge, a feature known as zero-shot transfer. Trained on the expansive SA-1B dataset, which contains more than 1 billion masks spread over 11 million carefully curated images, SAM demonstrated impressive zero-shot performance, surpassing previously fully supervised results in many cases. A new model, SAM2 [42], was also tested; however, for our task, it did not demonstrate significant improvement. The result is significantly influenced by the settings of the neural network models. We did not use fine-tuning SAM because the memory and computing resource requirements were significantly higher than those of the proposed pipeline.
The complexing of masks from SAM and DeepLabV3+ obtain the final segmentation result, which is used to calculate statistical characteristics of fibers.
To compare the segmentation accuracy, separate models of SAM, DeepLabV3+, Mask R-CNN were used. The Hough method was used as a classical method for comparison.
The Hough transform [39] is a feature extraction technique used in image analysis, computer vision, and digital image processing. The purpose of this technique is to find imperfect instances of objects within a certain class of shapes by a voting procedure. This voting procedure is carried out in a parameter space from which object candidates are obtained as local maxima in a so-called accumulator space that is explicitly constructed by the algorithm for computing the Hough transform. The classical Hough transform was concerned with identifying lines in the image; however, later, the Hough transform was extended to identifying the positions of arbitrary shapes, most commonly circles or ellipses.
An additional task in the proposed pipeline is to recognize metadata in electron microscope images. An example of such metadata is shown in Figure 12. The Tesseract-OCR model was used to implement this component. Recognition of image metadata allows us to work with different scales and universally process data at different magnifications using the development pipeline.
2.6. Performance Metrics
To assess the segmentation performance, we employed two commonly used metrics: Intersection over Union (IoU ) [43] and Pixel accuracy (PixAcc.) [44].
The IoU metric is defined as follows:
where P is the predicted segmentation mask, T is the ground-truth mask, and the cardinality is the number of pixels. An IoU of 1 corresponds to a perfect prediction, that is, a pixel-perfect overlap between the predicted segmentation mask and the ground truth.
The PixAcc. metric represents the proportion of correctly labeled pixels (TP) among all possible pixels (n). This is simply calculated as follows:
A proper distribution of each class is essential for obtaining accurate pixel accuracy. When one class occupies a disproportionately large number of pixels, pixel accuracy results may be unreliable.
3. Results
3.1. Database
As part of this study, 37 real images of fibers were captured on a scanning electron microscope, which were then subjected to rotation and symmetry operations (90°, 180°, 270°), achieving 7 extra images for each image taken. Therefore, a set of 296 real images was obtained (see Figure 13).
In addition, 500 artificial images were created. In each image we tried to reproduce the background of the real images with a density of 15 to 20 fibers per image (see Figure 14).
3.2. Training and Evaluation of Neural Networks
The first series of experiments was conducted to investigate the effectiveness of using synthesized images for DeepLabV3+ training in the semantic segmentation stage. To realize this, the dataset was redistributed in three versions: the real images dataset (RID), the artificial images dataset (AID), and hybrid images dataset (HID, with 796 images). Each dataset was divided into 3 parts: training, validation, and testing sets at ratios of 75%, 15%, and 10%, respectively. Table 1 lists the metrics obtained using the different databases.
Figure 15 shows the performance of DeepLabv3+ after having been trained with the different databases. For this test, a real image unrelated to the images that make up the database was used.
It was found that the additional use of synthesized images improved the metrics by an average of 1%. It should also be noted an interesting result that when training the model exclusively on synthesized data, the segmentation ability of real fibers reached 85.1% and 85.4% according to the IoU and Pix Acc metrics, respectively. This result provides optimism for the additional use of synthetic data in conditions of an extremely small or missing set of real images, especially with increased modeling accuracy.
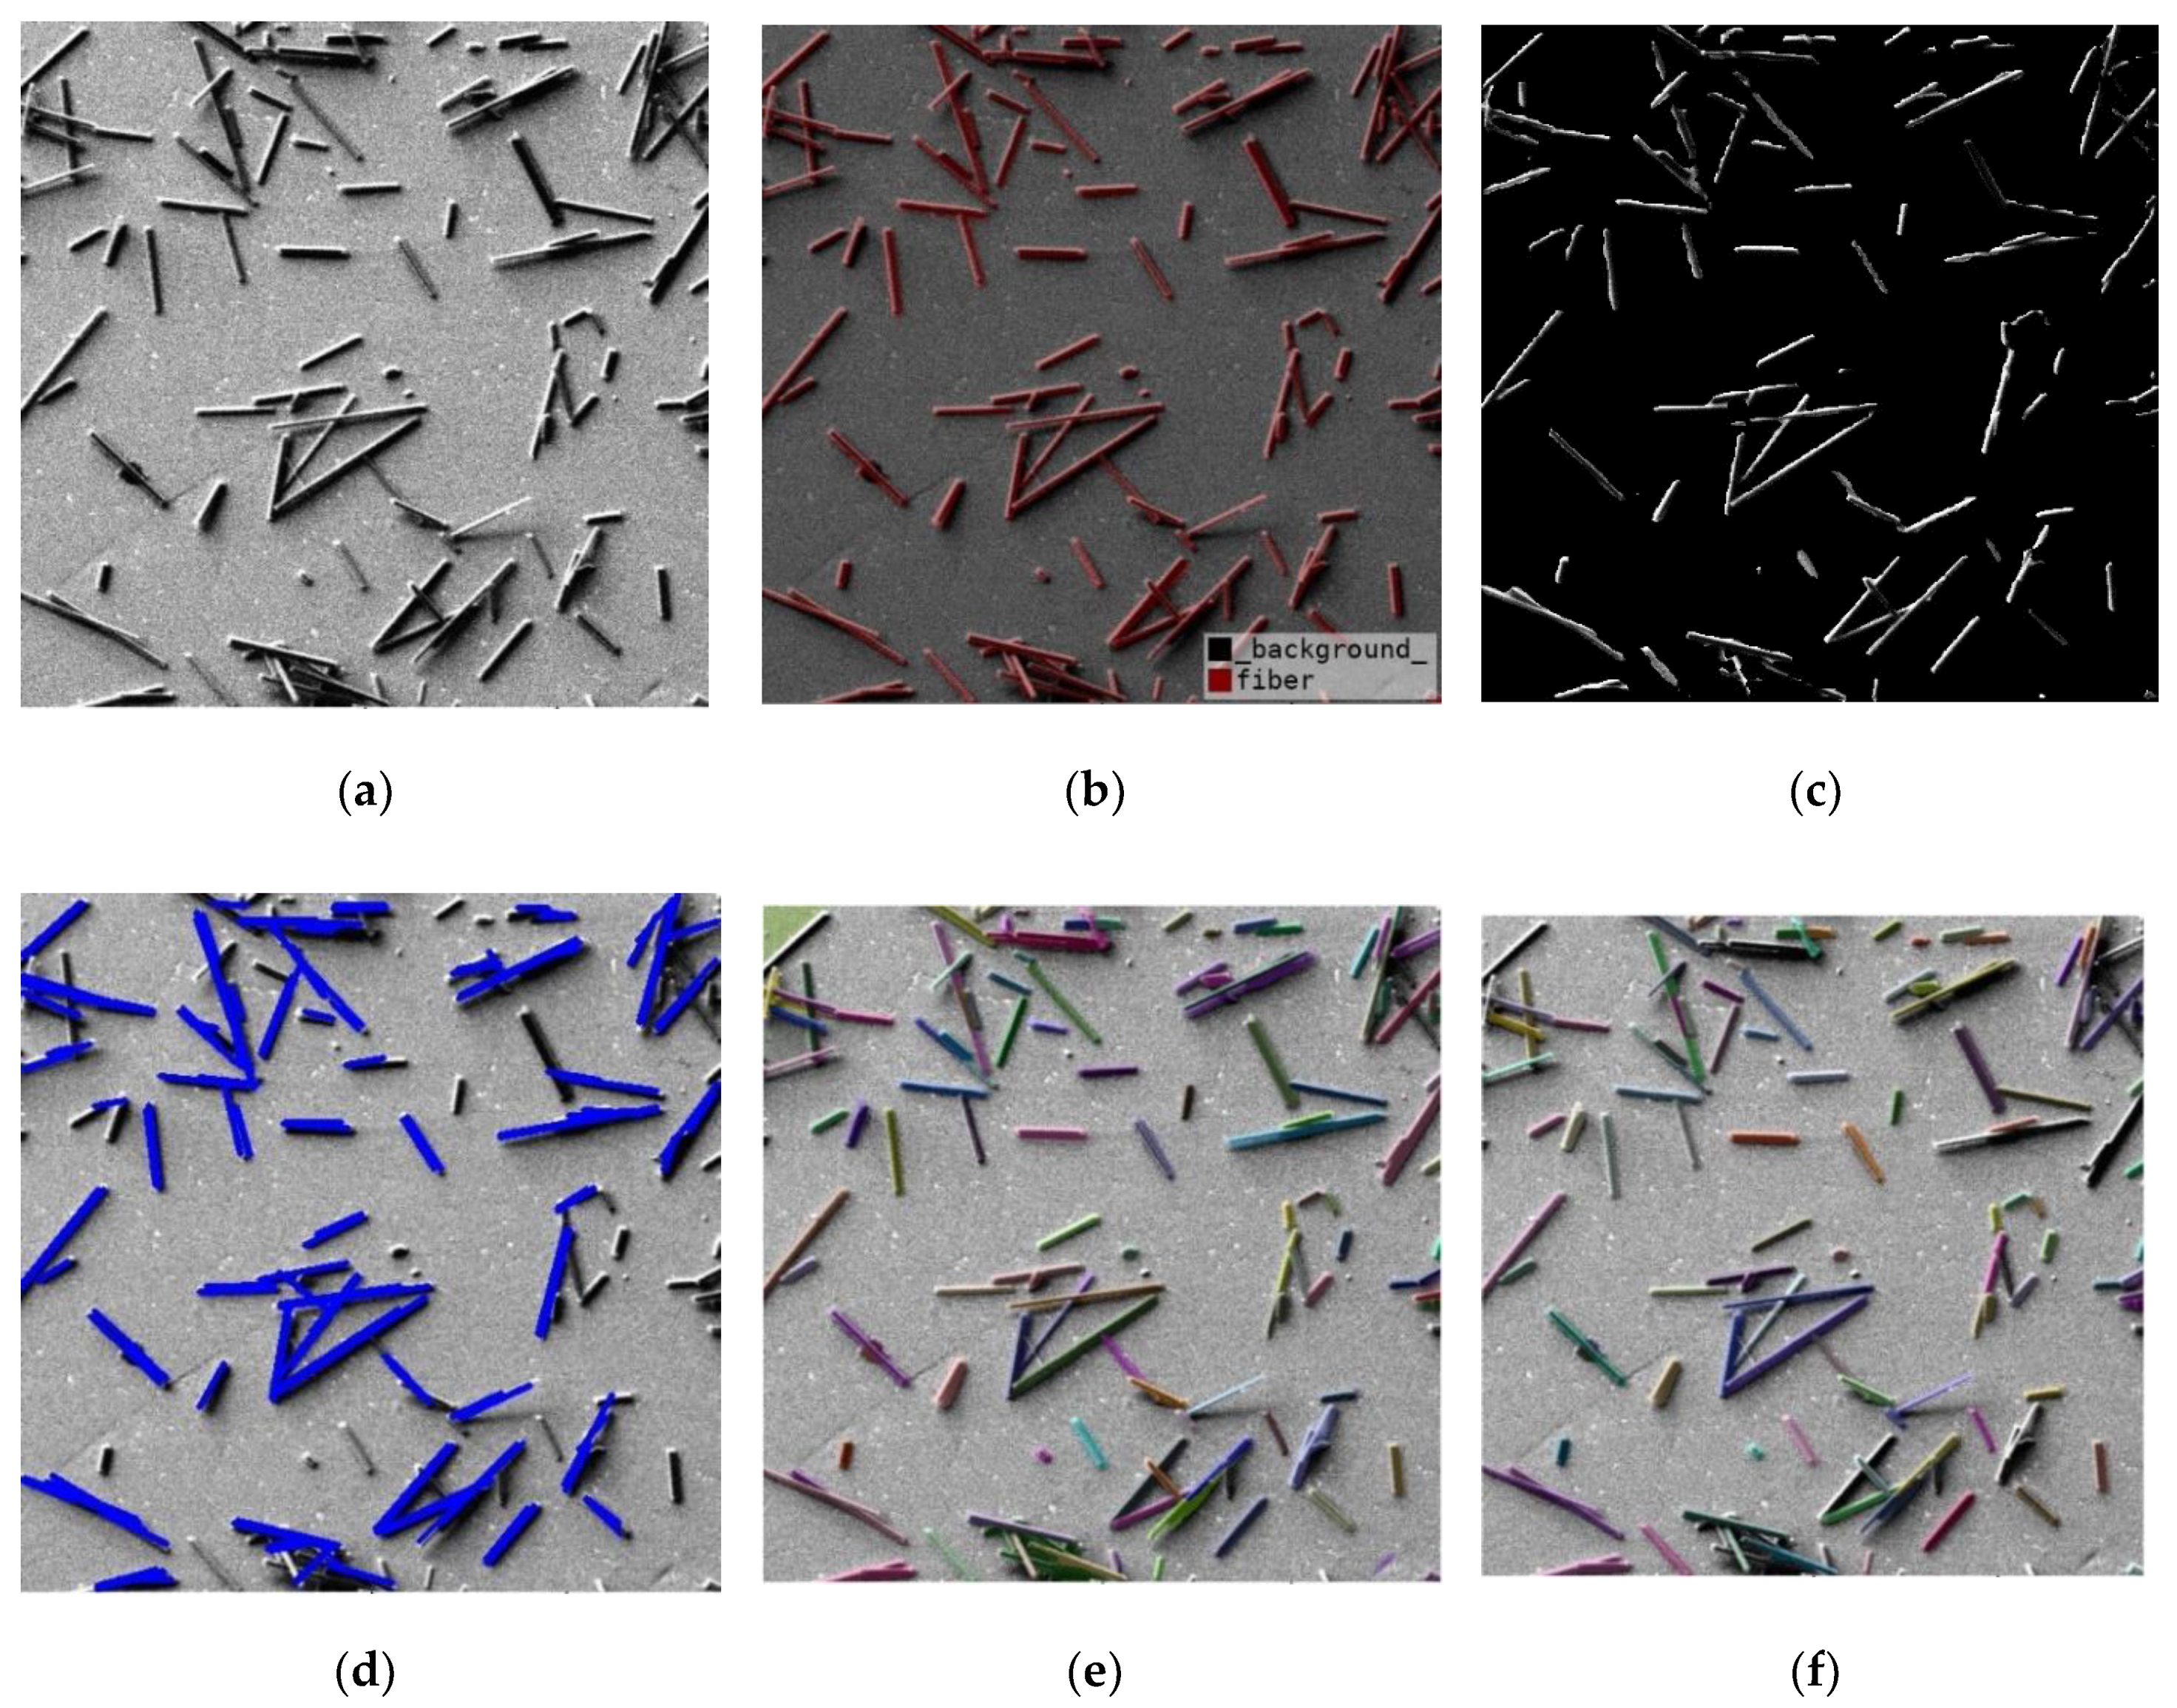
A second series of experiments was conducted with the HID to determine the effectiveness of the entire automatic segmentation methodology. The following architectures were compared: DeepLabv3+/SAM, DeepLabv3+/Hough, SAM (see Figure 16). For the SAM model, the post-processing parameters of the training sample were selected by grid search as follows:
- points_per_side = 30,
- pred_iou_thresh = 0.86,
- stability_score_thresh = 0.89,
- crop_n_layers = 1,
- crop_n_points_downscale_factor = 5,
- min_mask_region_area = 50.
Figure 16.
Qualitative comparison (a) Input image (b) Manual segmentation (c) DeepLabv3+ (d) DeepLabv3+/Hough, (e) SAM, (f) DeepLabv3+/SAM.
Figure 16.
Qualitative comparison (a) Input image (b) Manual segmentation (c) DeepLabv3+ (d) DeepLabv3+/Hough, (e) SAM, (f) DeepLabv3+/SAM.
The results of the metrics for each architecture are shown in Table 2. Table 2 also shows the result of the metrics of the Mask R-CNN architecture which was used in [27].
The obtained results demonstrate that the pure SAM model gives quite a lot of false positives, which is a direct consequence of the universality of the model. Pre-segmentation using DeepLabV3+ eliminates most of the false positives of the SAM model and significantly improves metrics due to this. DeepLabV3+/Hough demonstrated average results due to the insufficiently accurate transition from the found lines to the segments of individual fiber instances. The average total processing time was 0.95 s for a single fiber image.
Experiments were also conducted with measurements of the geometric parameters of the fibers: quantity, length, and thickness, and the ratio of length to thickness. Figure 17 shows histograms of the distributions of length, thickness, and length-to-thickness ratios for fibers with automatic and manual segmentation. To calculate the statistics, 10 real fiber images were used without augmentation. The average total processing time was 0.95 s for a single fiber image. The training time of the model was less than 30 min on Nvidia 4090 RTX.
To test the generalizability of the proposed pipeline and the possible bias due to the use of synthetic data, images of glass fibers were collected separately. Glass fibers differ in texture and background from carbon fiber images. The qualitative segmentation results obtained by the proposed pipeline and fiber length determination are shown in Figure 18. For comparison, glass fibers were measured manually using electron microscope software (see Figure 19). Figure 20 illustrates the capabilities of a pipeline under the challenging conditions of intersecting fibers, high fiber density, and large amounts of foreign matter.
4. Conclusions
A two-stage pipeline for automatically recognizing and determining the geometric characteristics of carbon fibers is proposed. In the first stage, the fundamental neural network model of segmentation SAM (Segment Anything Model) was used, and in the second stage, the segmentation results were improved using the DeepLabv3+ neural network model. The use of synthetic data for training improved the segmentation quality for the IoU and Pix Acc metrics from 0.943 and 0.949 to 0.953 and 0.959, i.e., an average of 1%. The average total processing time was 0.95 s for a single fiber image. An automatic calculation of geometric features and statistics that can be used to evaluate material properties was realized.
The primary contributions of this paper are summarized as follows:
1. The two-stage pipeline combining SAM and DeepLabV3+ provides the generalizability and accuracy of the foundational SAM model and the ability to train quickly on a small amount of data in the DeepLabV3+ model.
2. End-to-end technology for processing images of electron microscope fibers, from images with metadata to statistics of the distribution of geometric characteristics of fibers.
3. Method to generate synthetic data for additional training of neural networks for fiber segmentation.
The developed pipeline allows us to significantly reduce the time required for fiber length evaluation in scanning electron microscope images, thereby increasing the accuracy of statistical data collection due to the multiple increase in the amount of processed experimental material. It can also be useful in other industrial applications when processing such images.
Author Contributions
Conceptualization, E.K., E.M., J.G.Q.P. and A.G.; methodology, E.K., E.M., A.S., J.G.Q.P. and A.G.; software, E.M. and J.G.Q.P.; validation, E.K. and E.M.; formal analysis, E.K. and E.M.; investigation, E.M. and JGQP; resources, A.G., A.S.; data curation, E.K. and J.G.Q.P.; writing—original draft preparation, E.M., V.Ch. and J.G.Q.P.; writing—review and editing, E.K., E.M., A.S., J.G.Q.P. and A.G.; visualization, E.K. and V.Ch.; supervision, E.K. and A.G.; project administration, A.G.; funding acquisition, A.G. All authors have read and agreed to the published version of the manuscript.
Funding
This research was founded by Russian Science Foundation, grant number 23-21-00512.
Data Availability Statement
In order to have access to more information about the database used in this research, you can contact by correspondence with the corresponding author.
Acknowledgments
Authors thank Roman Shafigulin for help in samples degradation in muffle furnace. Authors thank Anastasiia Kurkina for helping in some image annotation.
Conflicts of Interest
The authors declare no conflicts of interest. The funders had no role in the design of the study; in the collection, analyses, or interpretation of data; in the writing of the manuscript; or in the decision to publish the results.
References
- Matthews, F.L.; Rawlings R.D. Composite Materials: Engineering and Science. Woodhead Publishing Series in Composites Science and Engineering, Elsevier, 1999, 480 p.
- Erzen, B.; Karataş, M.; Aydoğmuş, E. Research on fiber reinforced composite materials and production technologies. 2024.
- Ozbakkaloglu, T., Chen, J.-F., Smith, S. T., & Dai, J.-G. Applications of Fiber Reinforced Polymer Composites. International Journal of Polymer Science, 2016.
- Erden, S.; Ho, K. Fiber reinforced composites. 2017.
- Karsli, N.G; Aytac, A; Deniz V. Effects of initial fiber length and fiber length distribution on the properties of carbon-fiber-reinforced-polypropylene composites. Journal of Reinforced Plastics and Composites, 2012; 31(15):1053-1060.
- Cai, H.; Ye, J.; Wang, Y.; Shi, Y.; Saafi, M. Microscopic failure characteristics and critical length of short glass fiber reinforced composites, Composites Part B: Engineering, Volume 266, 2023, 110973.
- Yu, S; Hwang, J.Y.; Hong, S.H. 3D microstructural characterization and mechanical properties determination of short basalt fiber-reinforced polyamide 6, composites. Composites Part B 2020; 187:107839.
- Ye, J.; Qiu, Y.; He, Y.; Ma, J.; Zhang, X.; Huang, C. Studying the nonlinear properties and strain-rate sensitivity of SiC short fiber-reinforced Al matrix composites. Sci Eng Compos Mater 2017; 24:521–9.
- Dean, A.; Grbic, N.; Rolfes, R.; Behrens, B. Macro-mechanical modeling and experimental validation of anisotropic, pressure- and temperature-dependent behavior of short fiber composites. Compos Struct 2019; 211:630–43.
- Yu, S.; Hwang, Y.H.; Lee, K.T.; Kim, S.O.; Hwang, J.Y.; Hong, S.H. Outstanding strengthening and toughening behavior of 3D-printed fiber-reinforced composites designed by biomimetic interfacial heterogeneity. Adv Sci 2022; 9:2103561.
- Kurkin, E.; Espinosa Barcenas, O.U.; Kishov, E.; Lukyanov, O. Topology Optimization and Efficiency Evaluation of Short-Fiber-Reinforced Composite Structures Considering Anisotropy. Computation 2024, 12, 35. [CrossRef]
- Bondy, M.; Pinter, P.; Altenhof, W. Experimental characterization and modelling of the elastic properties of direct compounded compression molded carbon fibre/polyamide 6 long fibre thermoplastic, Materials & Design, Volume 122, 2017, P. 184-196.
- Kelly, A; Tyson, W.R. Tensile properties of fibre-reinforced metals: copper/tungsten and copper/molybdenum. J Mech Phys Solid 1965; 13:329–50.
- Bader, M.G.; Bowyer, W.H. An improved method of production for high strength fibre-reinforced thermoplastics, Composites. 4, 1973, p. 150–156.
- Thomason, J.L. Interfacial strength in thermoplastic composites - At last an industry friendly measurement method?, Compos. Part A Appl. Sci. Manuf. 33, 2002, 1283–1288.
- Jain, A.; Lomov, S. V.; Mohamed Fouad Hosni Mohamed Abdin, Y.; Van Paepegem, W.;Straesser, S.;Verpoest, I. Model for partially debonded inclusions in the framework of mean-field homogenization. In Proceedings of the 11th International Conference on Textile Composites (TexComp-11), 2013.
- Hwang, D.; Cho, D. Fiber aspect ratio effect on mechanical and thermal properties of carbon fiber/ABS composites via extrusion and long fiber thermoplastic processes, Journal of Industrial and Engineering Chemistry, Volume 80, 2019, P. 335-344.
- Mori, T.; Tanaka, K. Average Stress in Matrix and Average Elastic Energy of Materials with Misfitting Inclusions. Acta Metallurgica. 1973, 21, 571–574.
- Gusev, A.A. Finite element estimates of viscoelastic stiffness of short glass fiber reinforced composites. Composite Structures. 2017, 171, 53-62.
- Eshelby J.D. The determination of the elastic field of an ellipsoidal inclusion, and related problems // Proc R Soc Lond A Math Phys Sci. 1957. Vol. 241, № 1226. P. 376–396.
- Advani, S.G.; Tucker III, C.L. The use of tensors to describe and predict fiber orientation in short fiber composites. Journal of Rheology. 1987, 31(8), 751-784.
- Emerson, M.J.; Jespersen, K.M.; Dahl, A.B.; Conradsen, K.; Mikkelsen, L.P. Individual fibre segmentation from 3D X-ray computed tomography for characterising the fibre orientation in unidirectional composite materials. Composites Part A: Applied Science and Manufacturing. 2017, 97, 83-92.
- Mishurova, T.; Rachmatulin, N.; Fontana, P.; Oesch, T.; Bruno, G.; Radi, E.; Sevostianov, I. Evaluation of the probability density of inhomogeneous fiber orientations by computed tomography and its application to the calculation of the effective properties of a fiber-reinforced composite. International Journal of Engineering Science. 2018, 122, 14-29.
- Pinter, P.; Dietrich, S.; Bertram, B.; Kehrer, L.; Elsner, P.; Weidenmann, K.A. (2018). Comparison and error estimation of 3D fibre orientation analysis of computed tomography image data for fibre reinforced composites. NDT & E International. 2018, 95, 26-35.
- Nciri, M.; Notta-Cuvier, D.; Lauro, F.; Chaari, F.; Maalej, Y.; Zouari, B. Modelling and characterisation of dynamic behaviour of short-fibre-reinforced composites. Composite Structures. 2017, 160, 516-528.
- Belmonte, E.; De Monte, M.; Riedel, T.; Quaresimin, M. Local microstructure and stress distributions at the crack initiation site in a short fiber reinforced polyamide under fatigue loading. Polymer testing. 2016, 54, 250-259.
- Quijada-Pioquinto J.G., Kurkin E.I., Minaev E.Y. and Gavrilov A.V. Technique of the identification, quantification and measurement of carbon short-fibers in SEM images using the instance segmentation, IX International Conference on Information Technology and Nanotechnology (ITNT), Samara, Russian Federation, 2023. [CrossRef]
- Lukyanov, O.E.; Kurkin, E.I.; Espinosa Barcenas, O.; Quijada Pioquinto, J. Developing a dataset for training of a convolutional neural network for the short-carbon fibers identification. In 20th international Conference “Aviation and Cosmonautics” (AviaSpace-2021). Moscow, Russian Federation, 22-26 November 2021.
- He, K.; Gkioxari, G.; Dollár, P.; Girshick, R. (2017). Mask R-CNN. In Proceedings of the IEEE international conference on computer vision.
- Padma, E.; Ronith, D.N.V.; Sai Charan E.V. Mask RCNN: Object detection approach using machine learning techniques. Journal of Engineering Sciences. 2022, 13(3), 488-498.
- Nanni, L.; Fusaro, D.; Fantozzi, C.; Pretto, A. Improving existing segmentators performance with zero-shot segmentators. Entropy. 2023, 25(11), 1502.
- Chen, L.C.; Zhu, Y.; Papandreou, G.; Schroff, F.; Adam, H. Encoder-decoder with atrous separable convolution for semantic image segmentation. In Proceedings of the European conference on computer vision (ECCV). Munich, Germany, 8-14 September 2018.
- Wang, W.; Xie, E.; Li, X.; Fan, D.P.; Song, K.; Liang, D.; Lu, T.; Luo, P.; Shao, L. PVT v2: Improved baselines with pyramid vision transformer. Computer Vision Media. 2022, 8, 415-424.
- Kirillov, A.; Mintun, E.; Ravi, N.; Mao, H.; Rolland, C.; Gustafson, L.; Xiao, T.; Whitehead, S.; Berg, A.C.; Lo, W.Y.; Dollar, P.; Girshick, R. Segment anything. In Proceedings of the IEEE/CVF International Conference on Computer Vision. Paris, France, 2-6 October 2023.
- Zou, X.; Yang, J.; Zhang, H.; Li, F.; Li, L.; Wang, J.; Gao, J.; Lee, Y.J. Segment everything everywhere all at once. In Advances in Neural Information Processing Systems 36 (NeurIPS 2023). 2024. New Orleans, USA, 10-16 December 2023.
- Liu, R.; He, D. Semantic segmentation based on Deeplabv3+ and attention mechanism. In 2021 IEEE 4th Advanced Information Management, Communicates, Electronic and Automation Control Conference (IMCEC). Chongqing, China, 19 July 2021.
- Luo, H.; Lu, Y. DeepLabv3-SAM: a novel image segmentation method for rail transportation. In 2023 3rd International Conference on Electronic Information Engineering and Computer Communication (EIECC). Wuhan, China, 22-24 December 2023.
- Xie W. et al. Sam fewshot finetuning for anatomical segmentation in medical images //Proceedings of the IEEE/CVF Winter Conference on Applications of Computer Vision, 2024, P. 3253-3261.
- Illingworth, J., & Kittler, J. A survey of the Hough transform. Computer vision, graphics, and image processing. 1988, 44(1), 87-116.
- Kurkin, E.; Spirina, M.; Espinosa Barcenas, O.U.; Kurkina, E. Calibration of the PA6 Short-Fiber Reinforced Material Model for 10% to 30% Carbon Mass Fraction Mechanical Characteristic Prediction. Polymers 2022, 14, 1781.
- Wada, K. et al. Labelme: Image Polygonal Annotation with Python [Computer software], 2021. [CrossRef]
- Ravi, N., Gabeur, V., Hu, Y. T., Hu, R., Ryali, C., Ma, T., ... & Feichtenhofer, C. Sam 2: Segment anything in images and videos, 2024. arXiv preprint arXiv:2408.00714.
- Rahman, M.A.; Wang, Y. Optimizing intersection-over-union in deep neural networks for image segmentation. In International symposium on visual computing, Springer, Cham. 2016.
- Nawaz, M.; Uvaliyev, A.; Bibi, K.; Wei, H.; Abaxi, S.M.D.; Masood, A.; Yuan, W. (2023). Unravelling the complexity of Optical Coherence Tomography image segmentation using machine and deep learning techniques: A review. Computerized Medical Imaging and Graphics. 2023, 108, 102269.
Figure 1.
Examples of the artificial images used to train the Mask R-CNN neural network [26].
Figure 1.
Examples of the artificial images used to train the Mask R-CNN neural network [26].
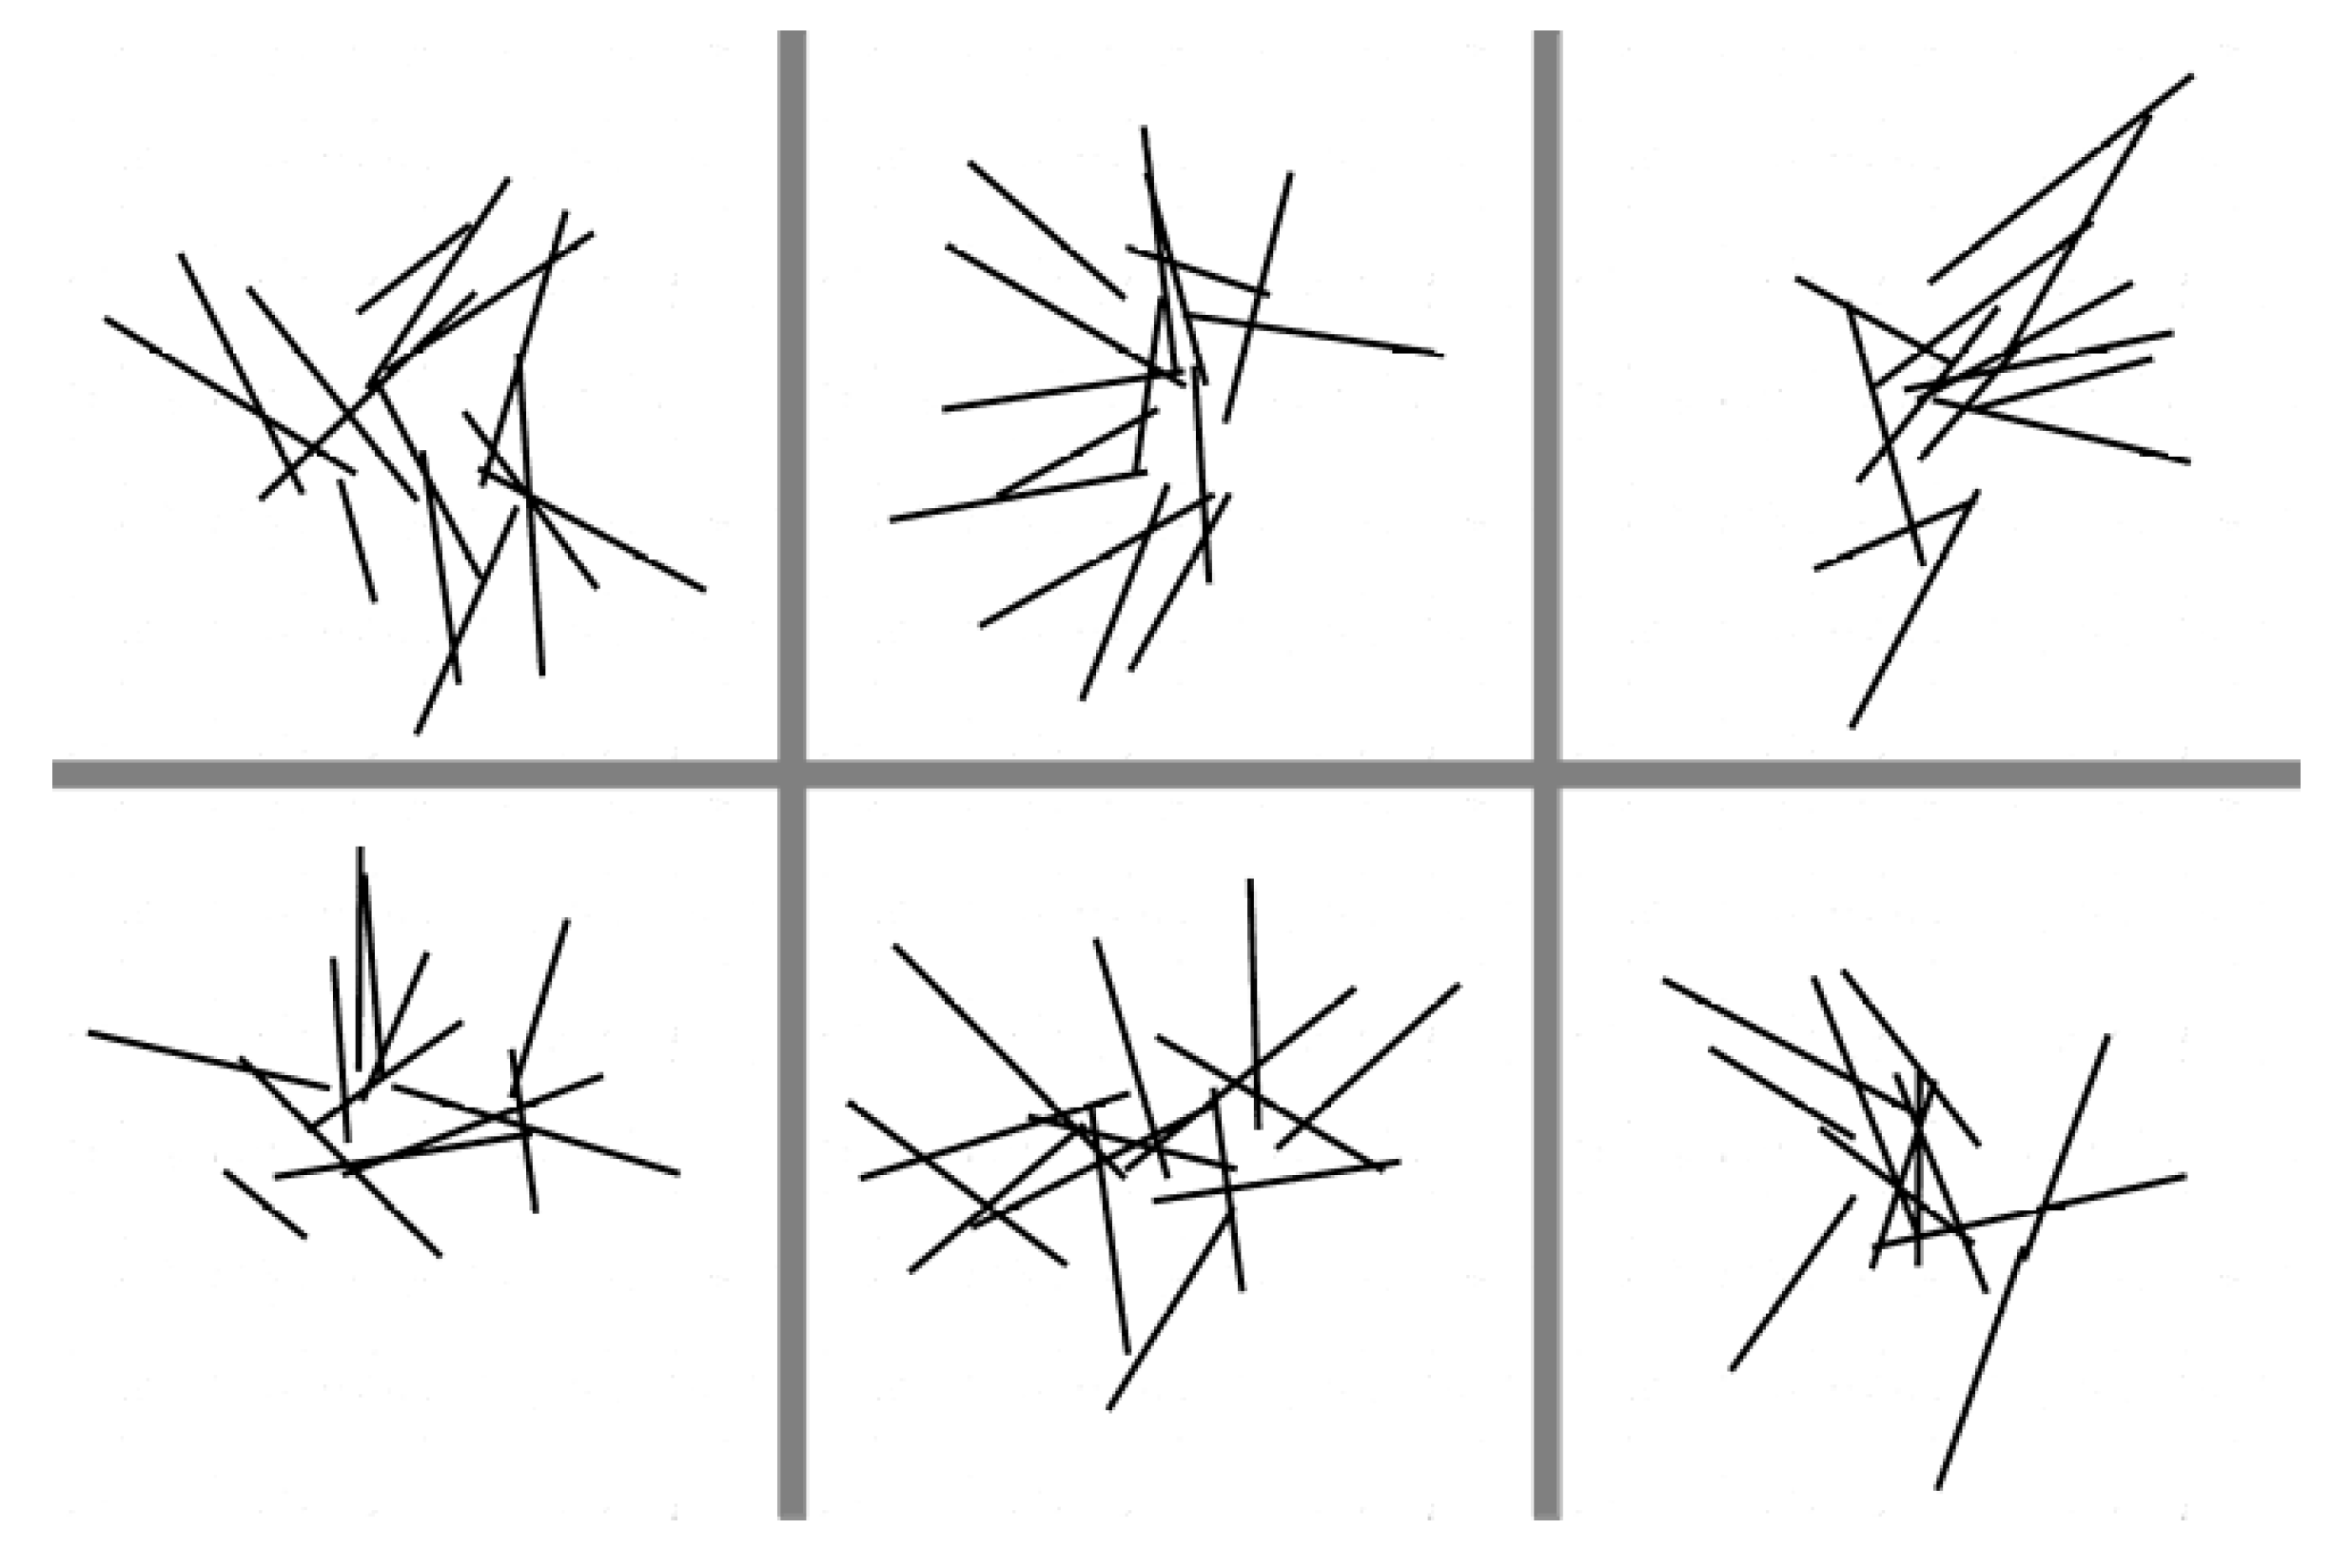
Figure 2.
Examples of the performance of Mask R-CNN when detecting short fibers in: (a) an image with few fibers, and (b) in an image with more fibers and overlapping sets.
Figure 2.
Examples of the performance of Mask R-CNN when detecting short fibers in: (a) an image with few fibers, and (b) in an image with more fibers and overlapping sets.
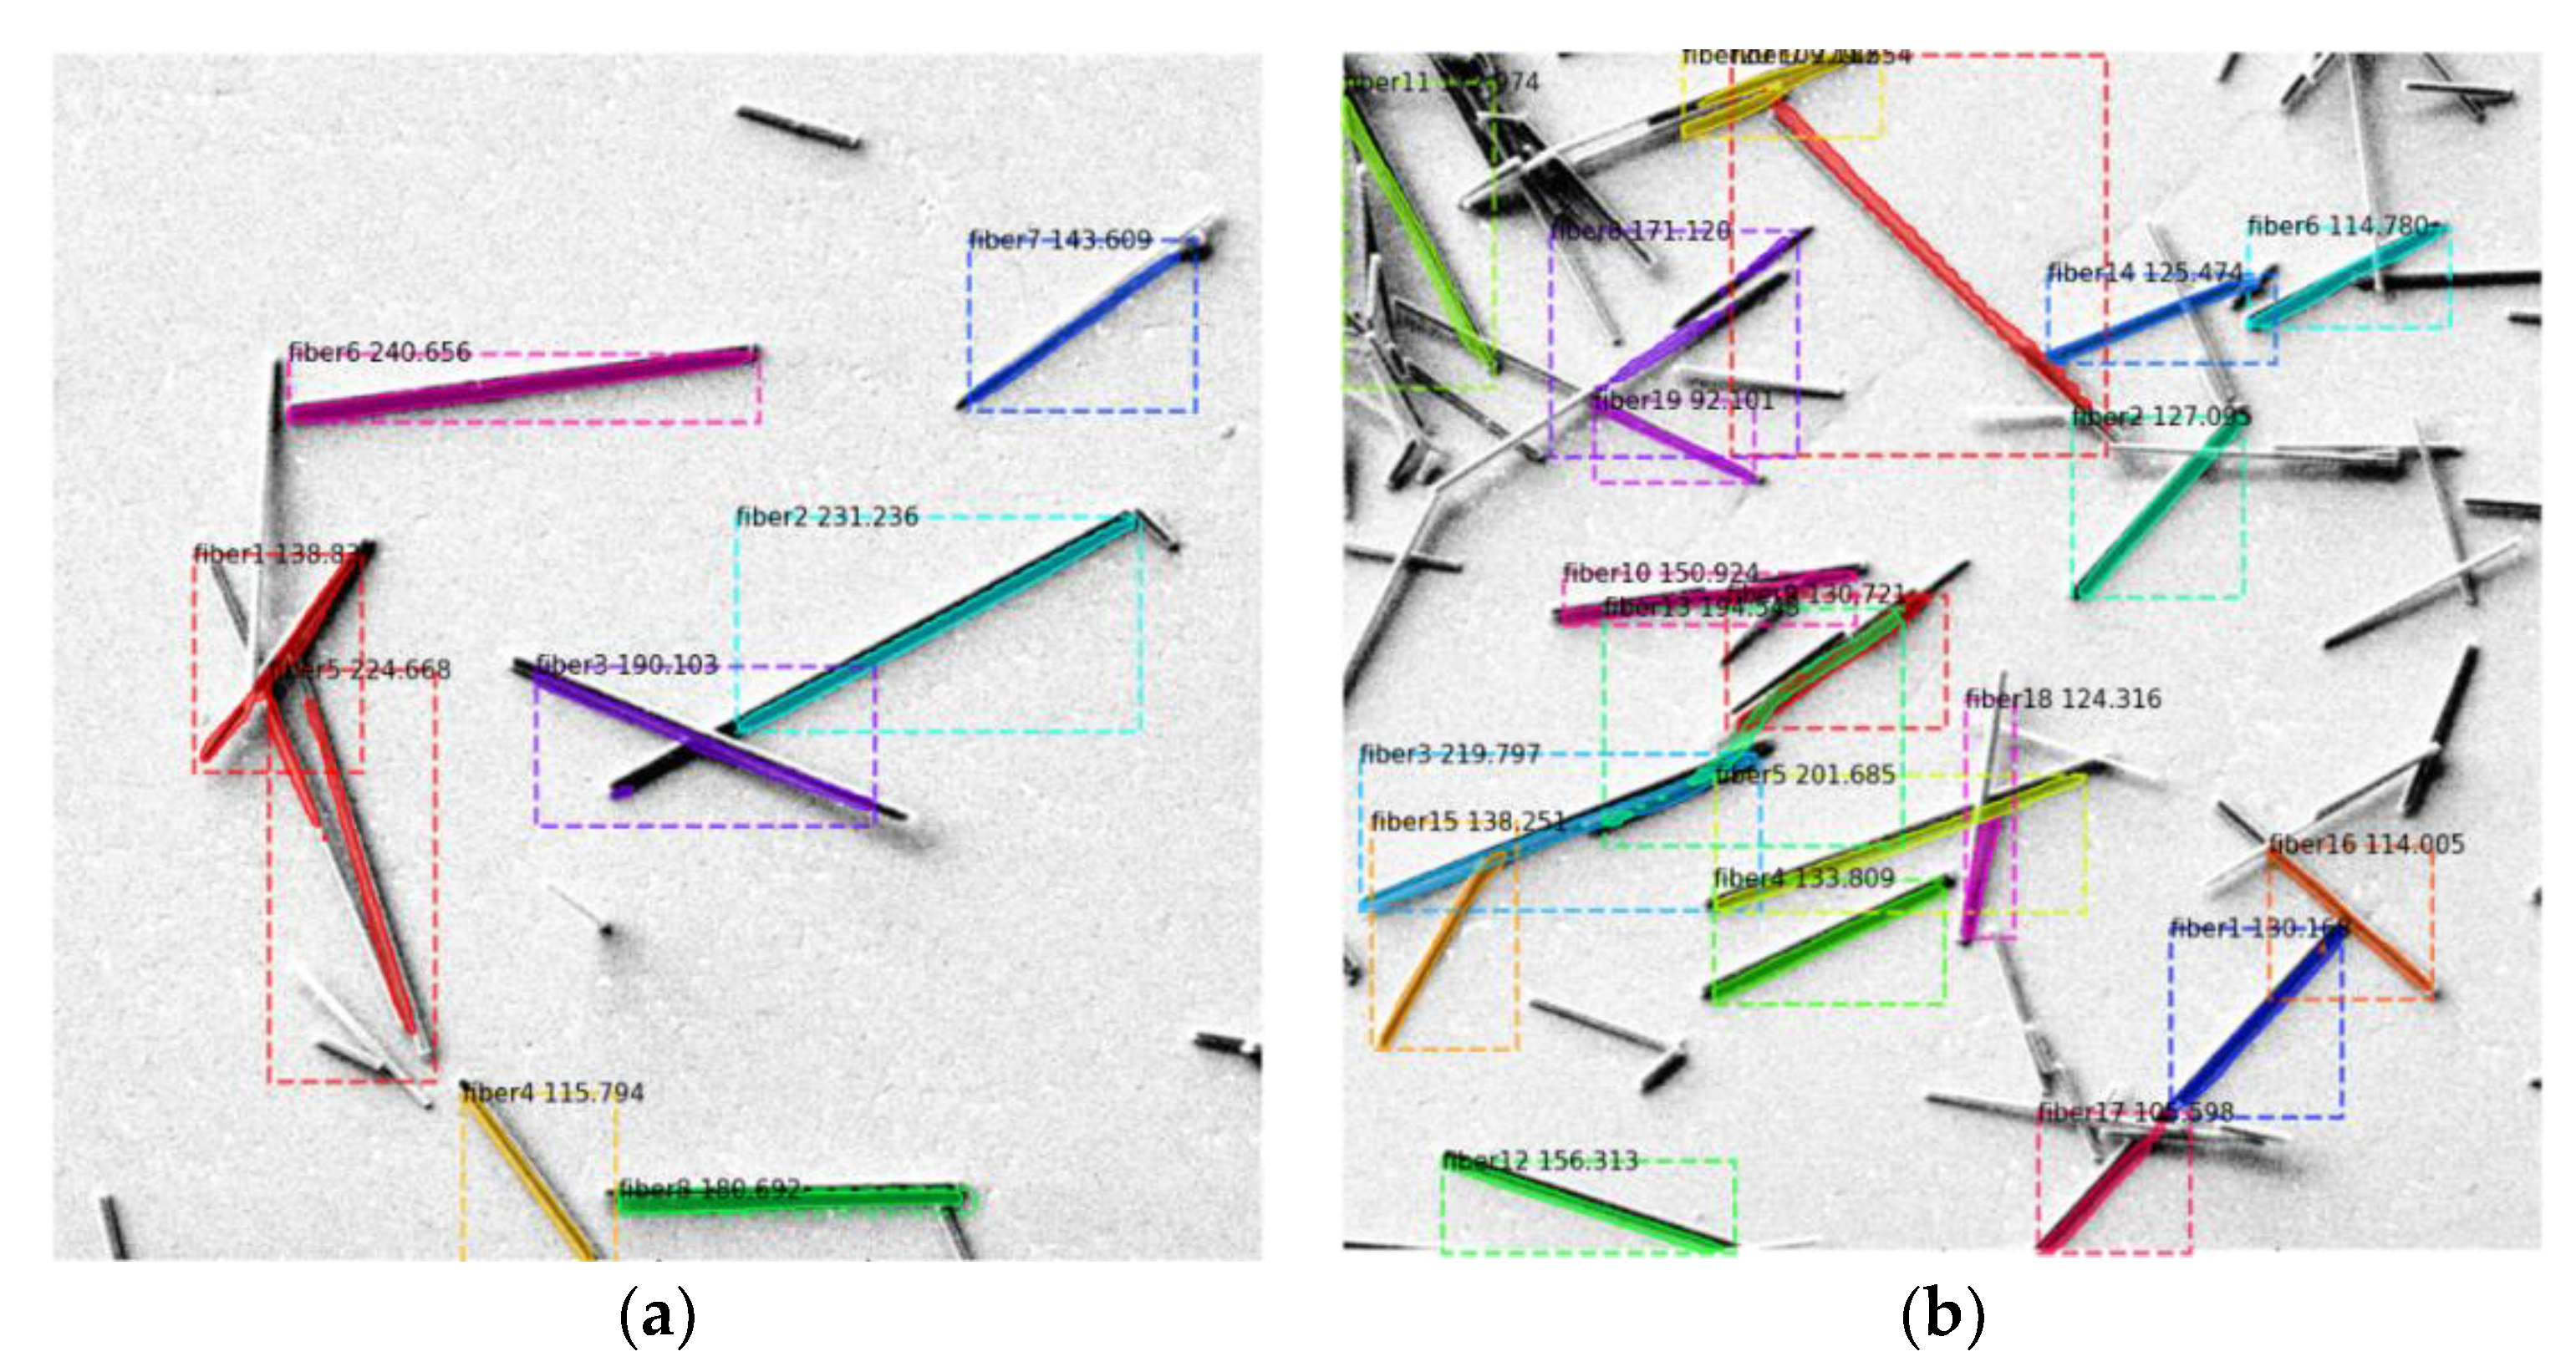
Figure 3.
Heating of composite material in a muffle furnace.
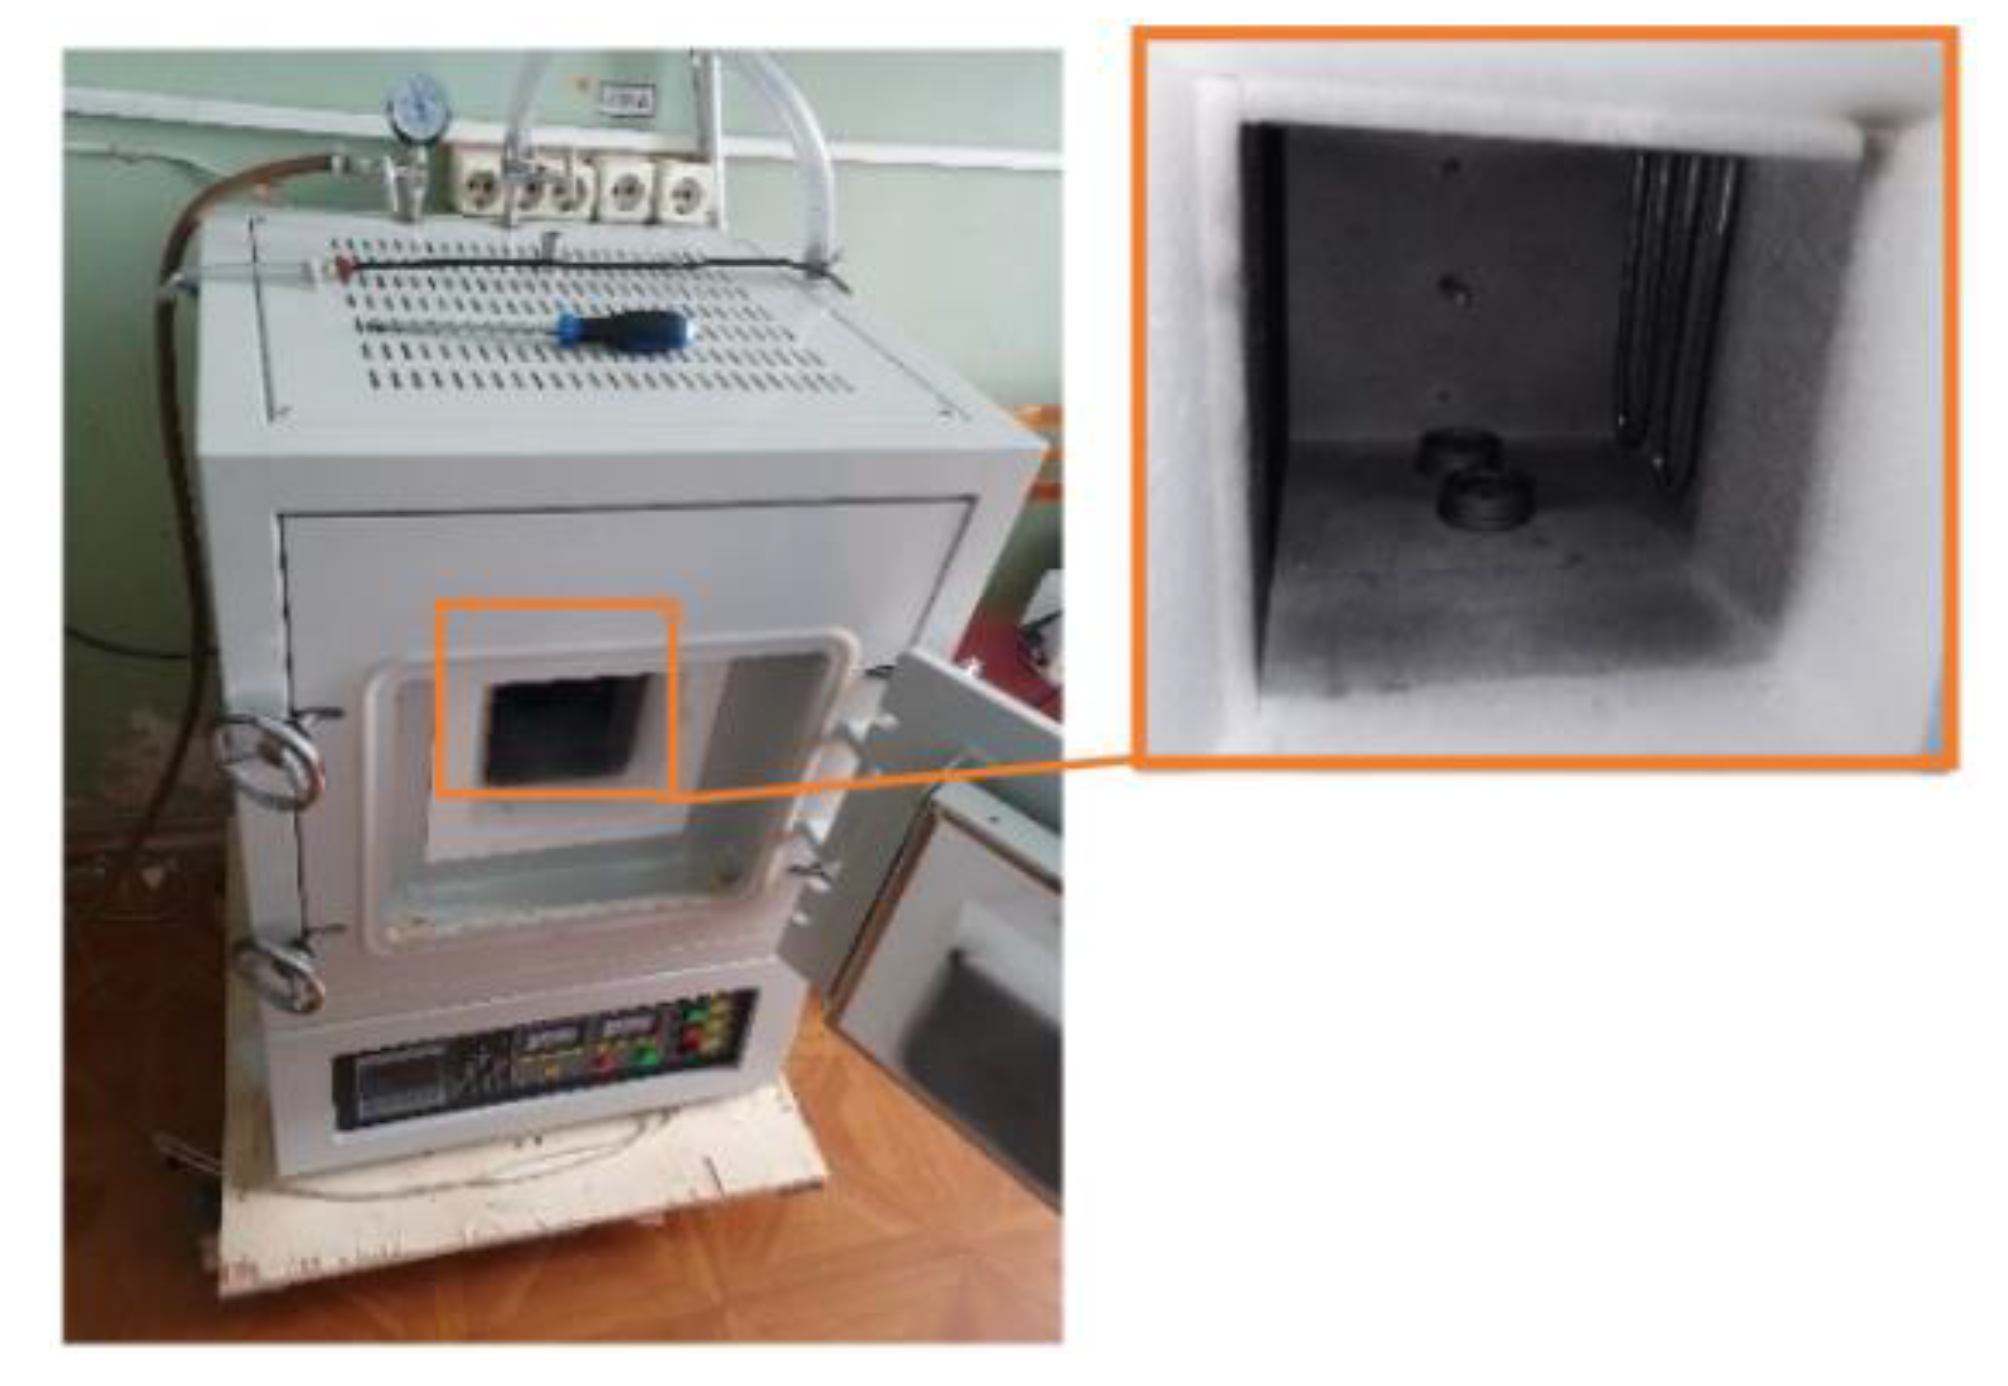
Figure 4.
Sample subjected to heating by muffle furnace.
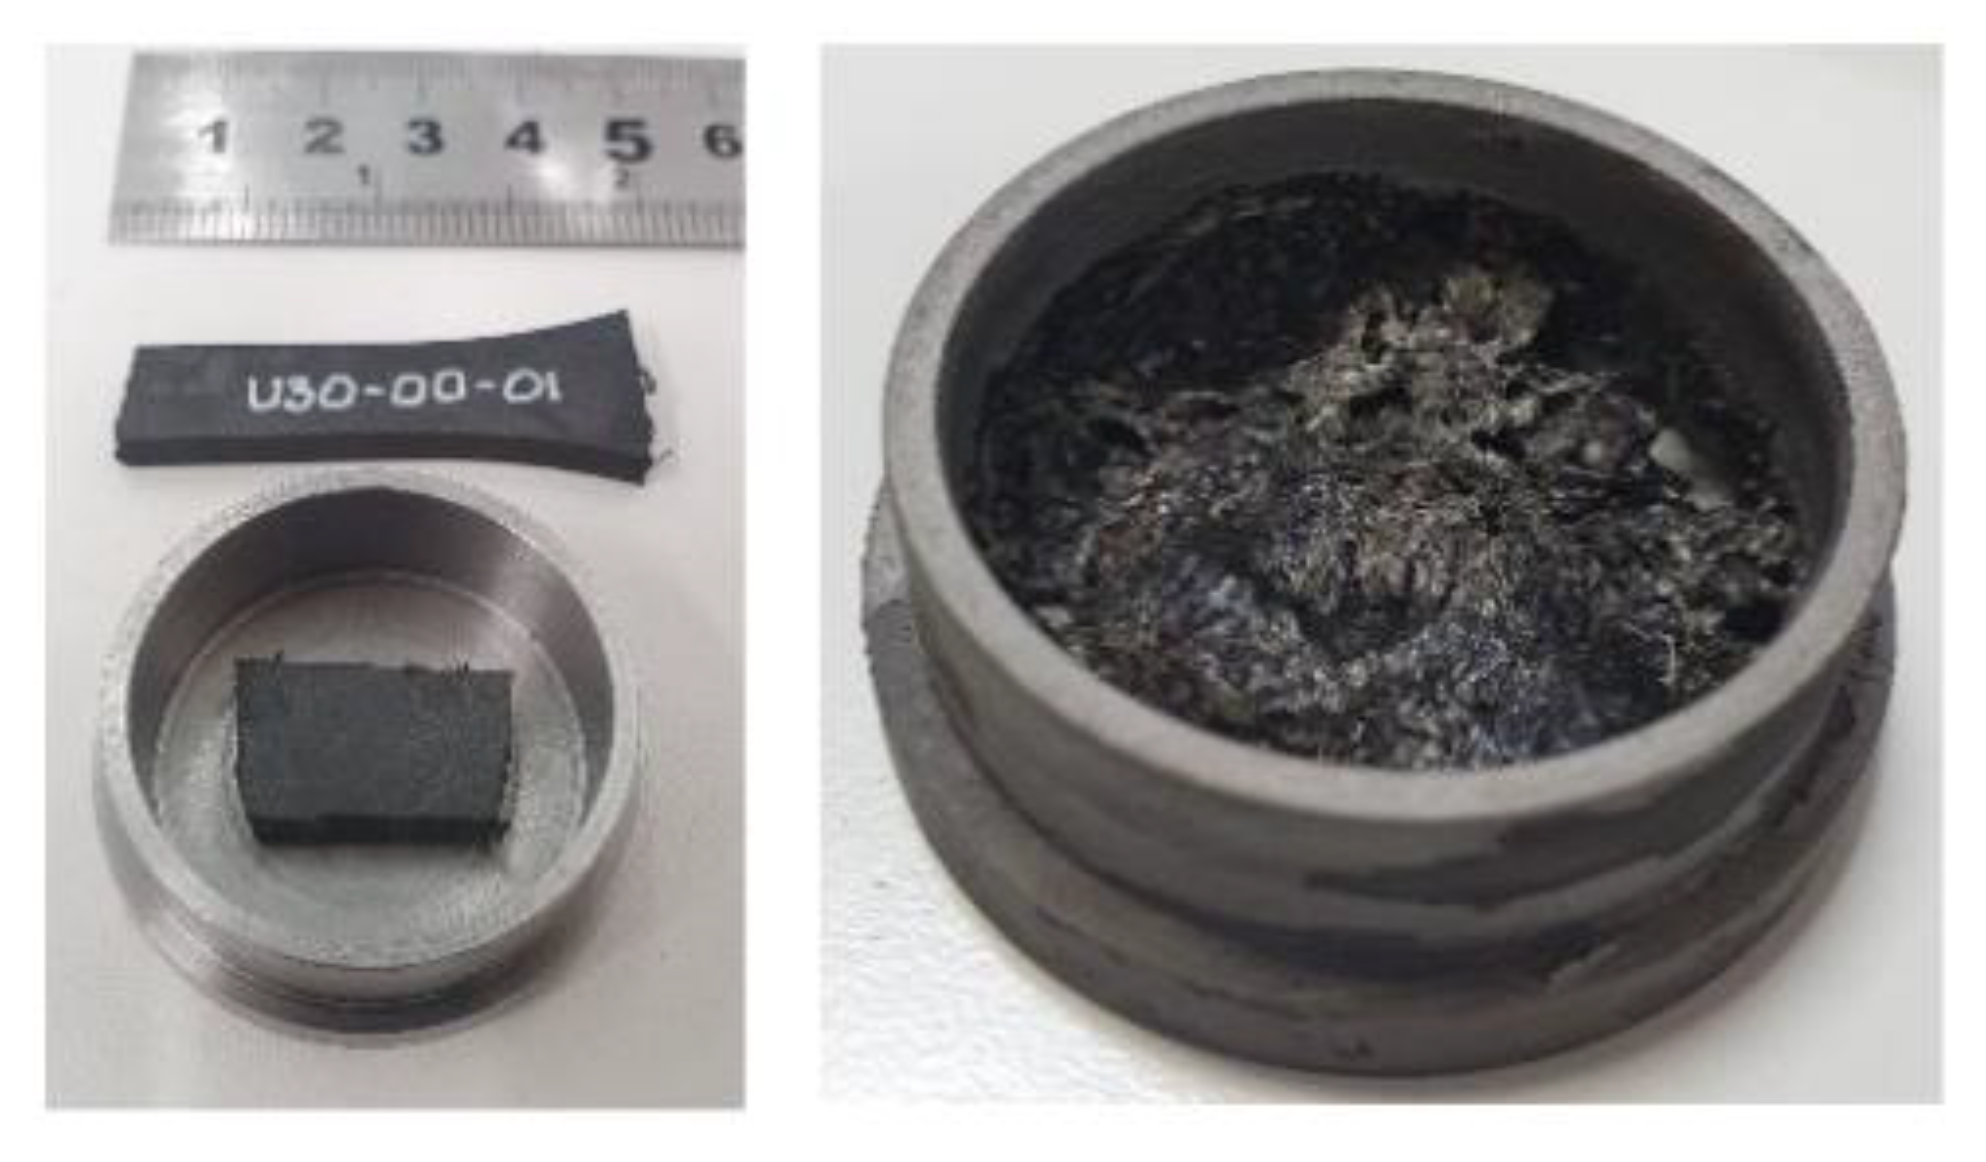
Figure 5.
Obtaining images of short fibers with the help of the Tescan Vega scanning electron microscope.
Figure 5.
Obtaining images of short fibers with the help of the Tescan Vega scanning electron microscope.
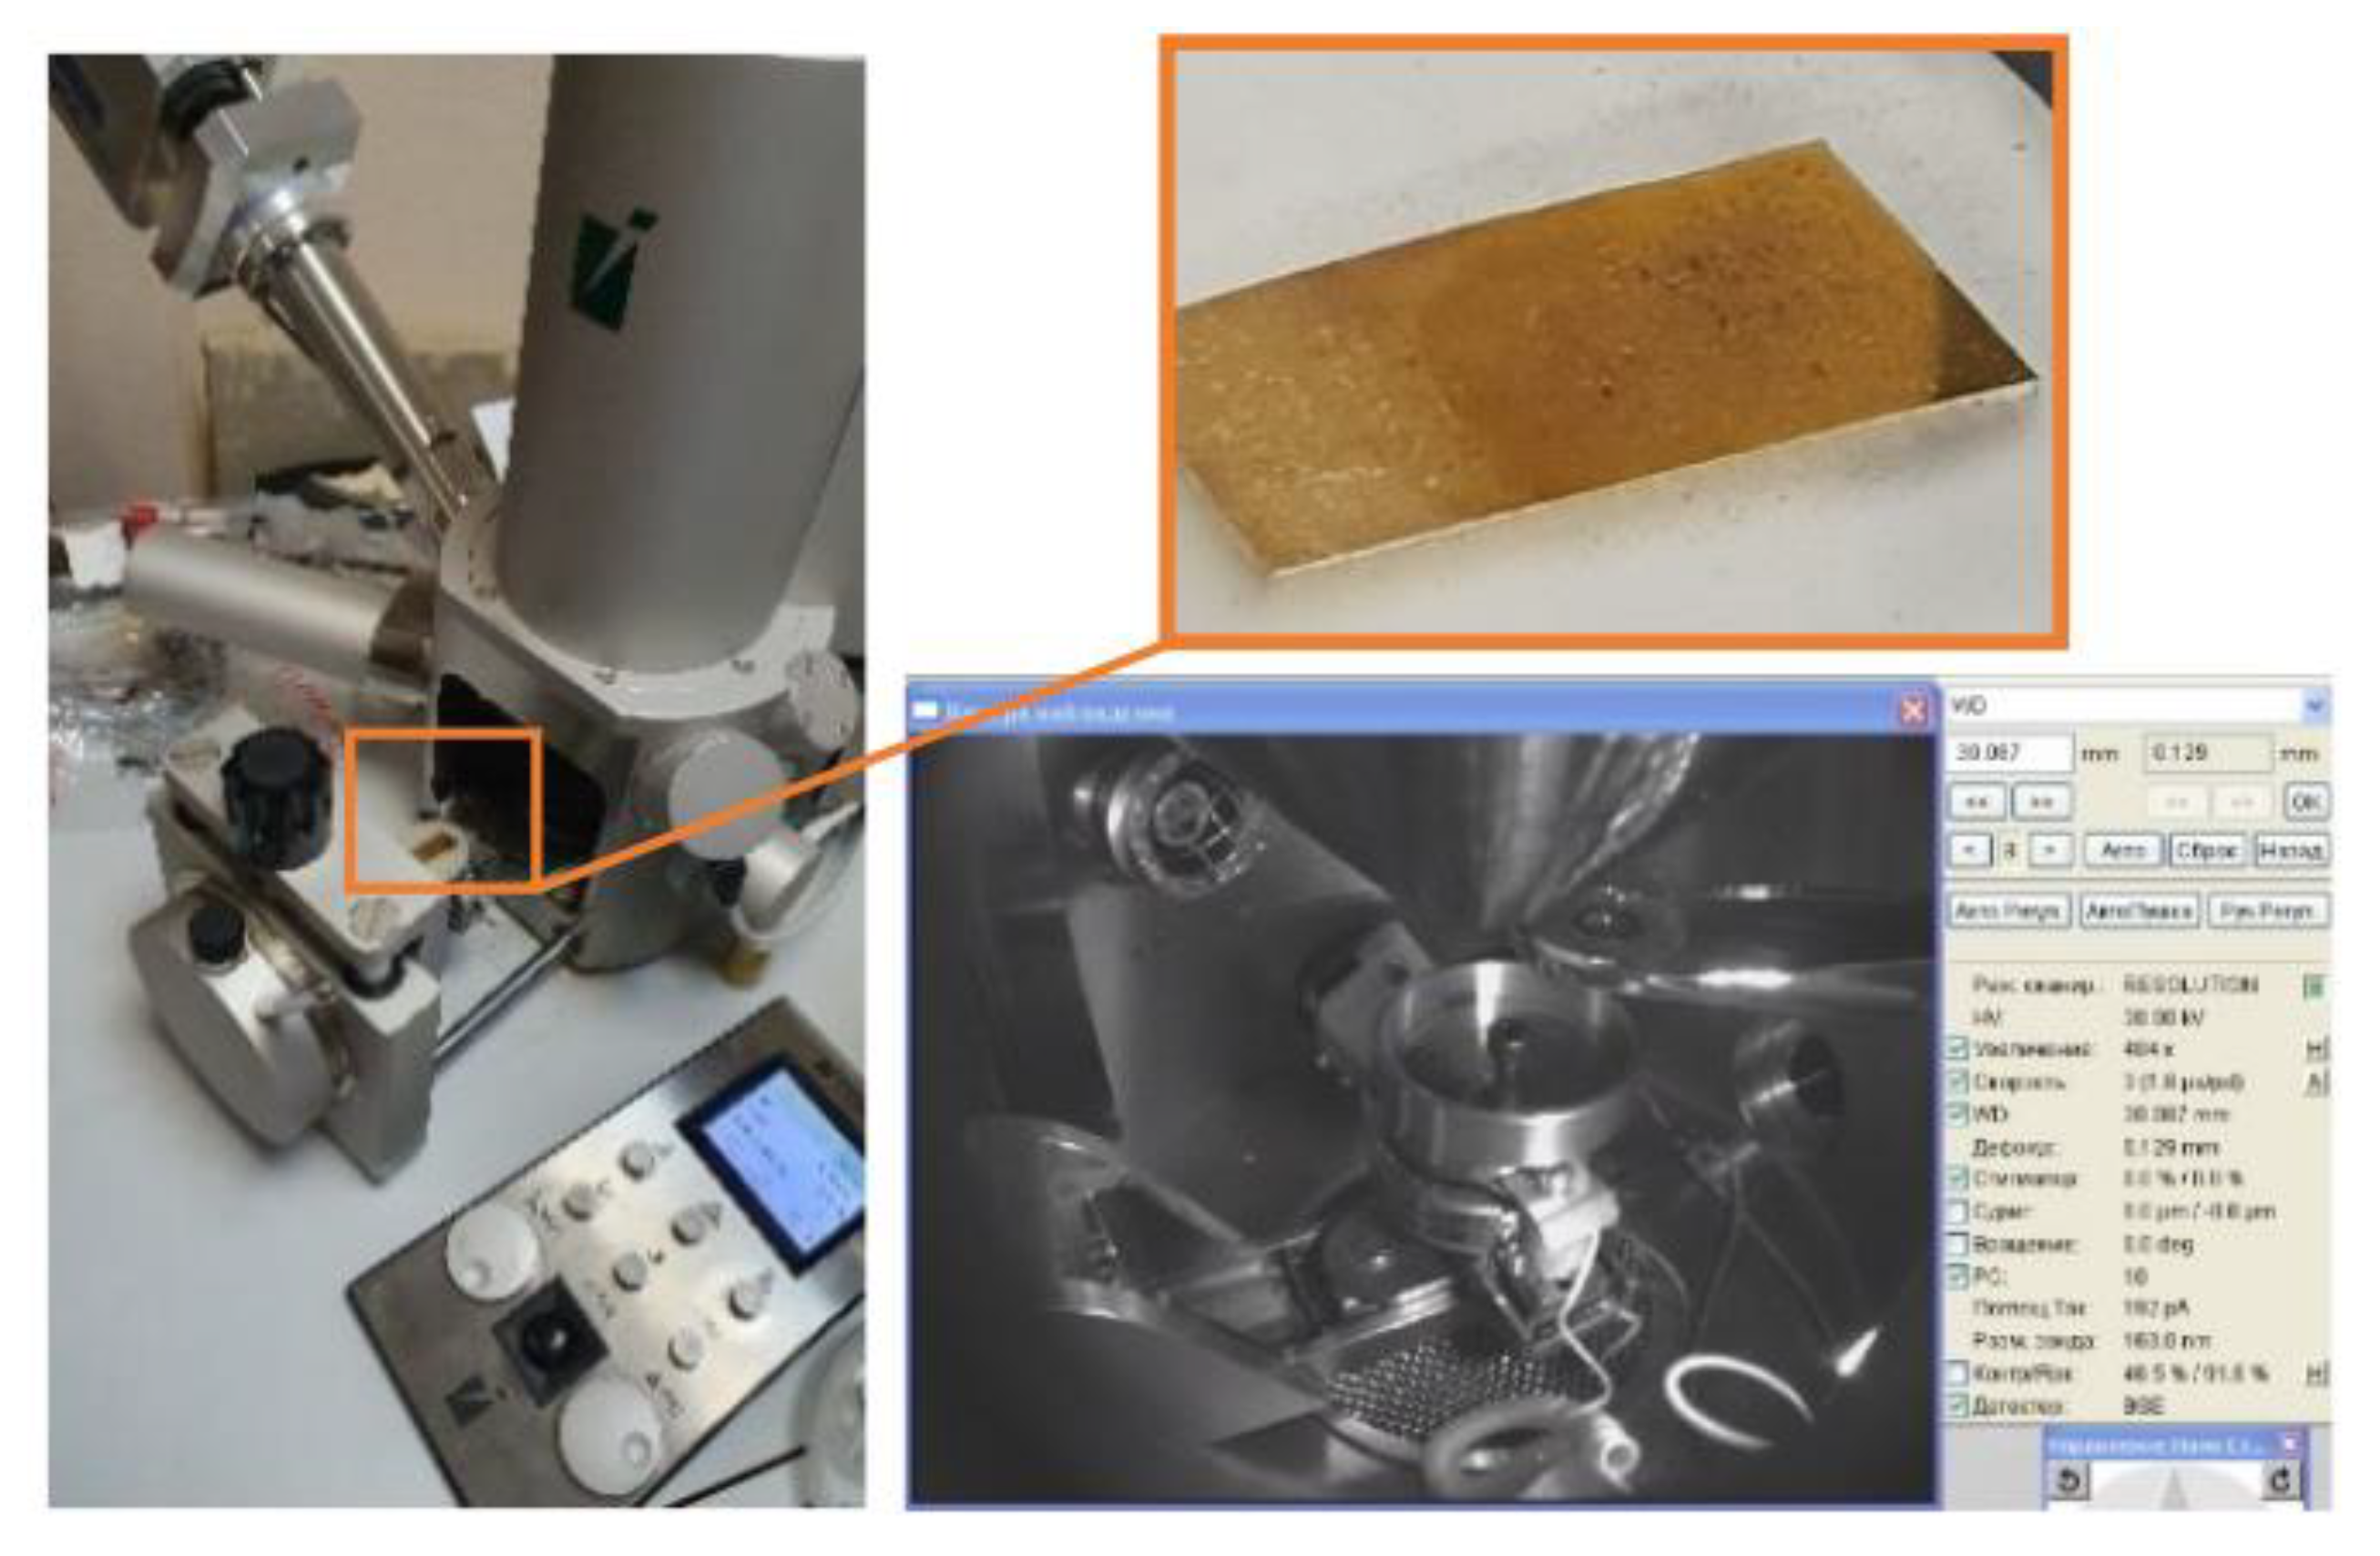
Figure 6.
Examples of images taken with the Tescan Vega scanning electron microscope.
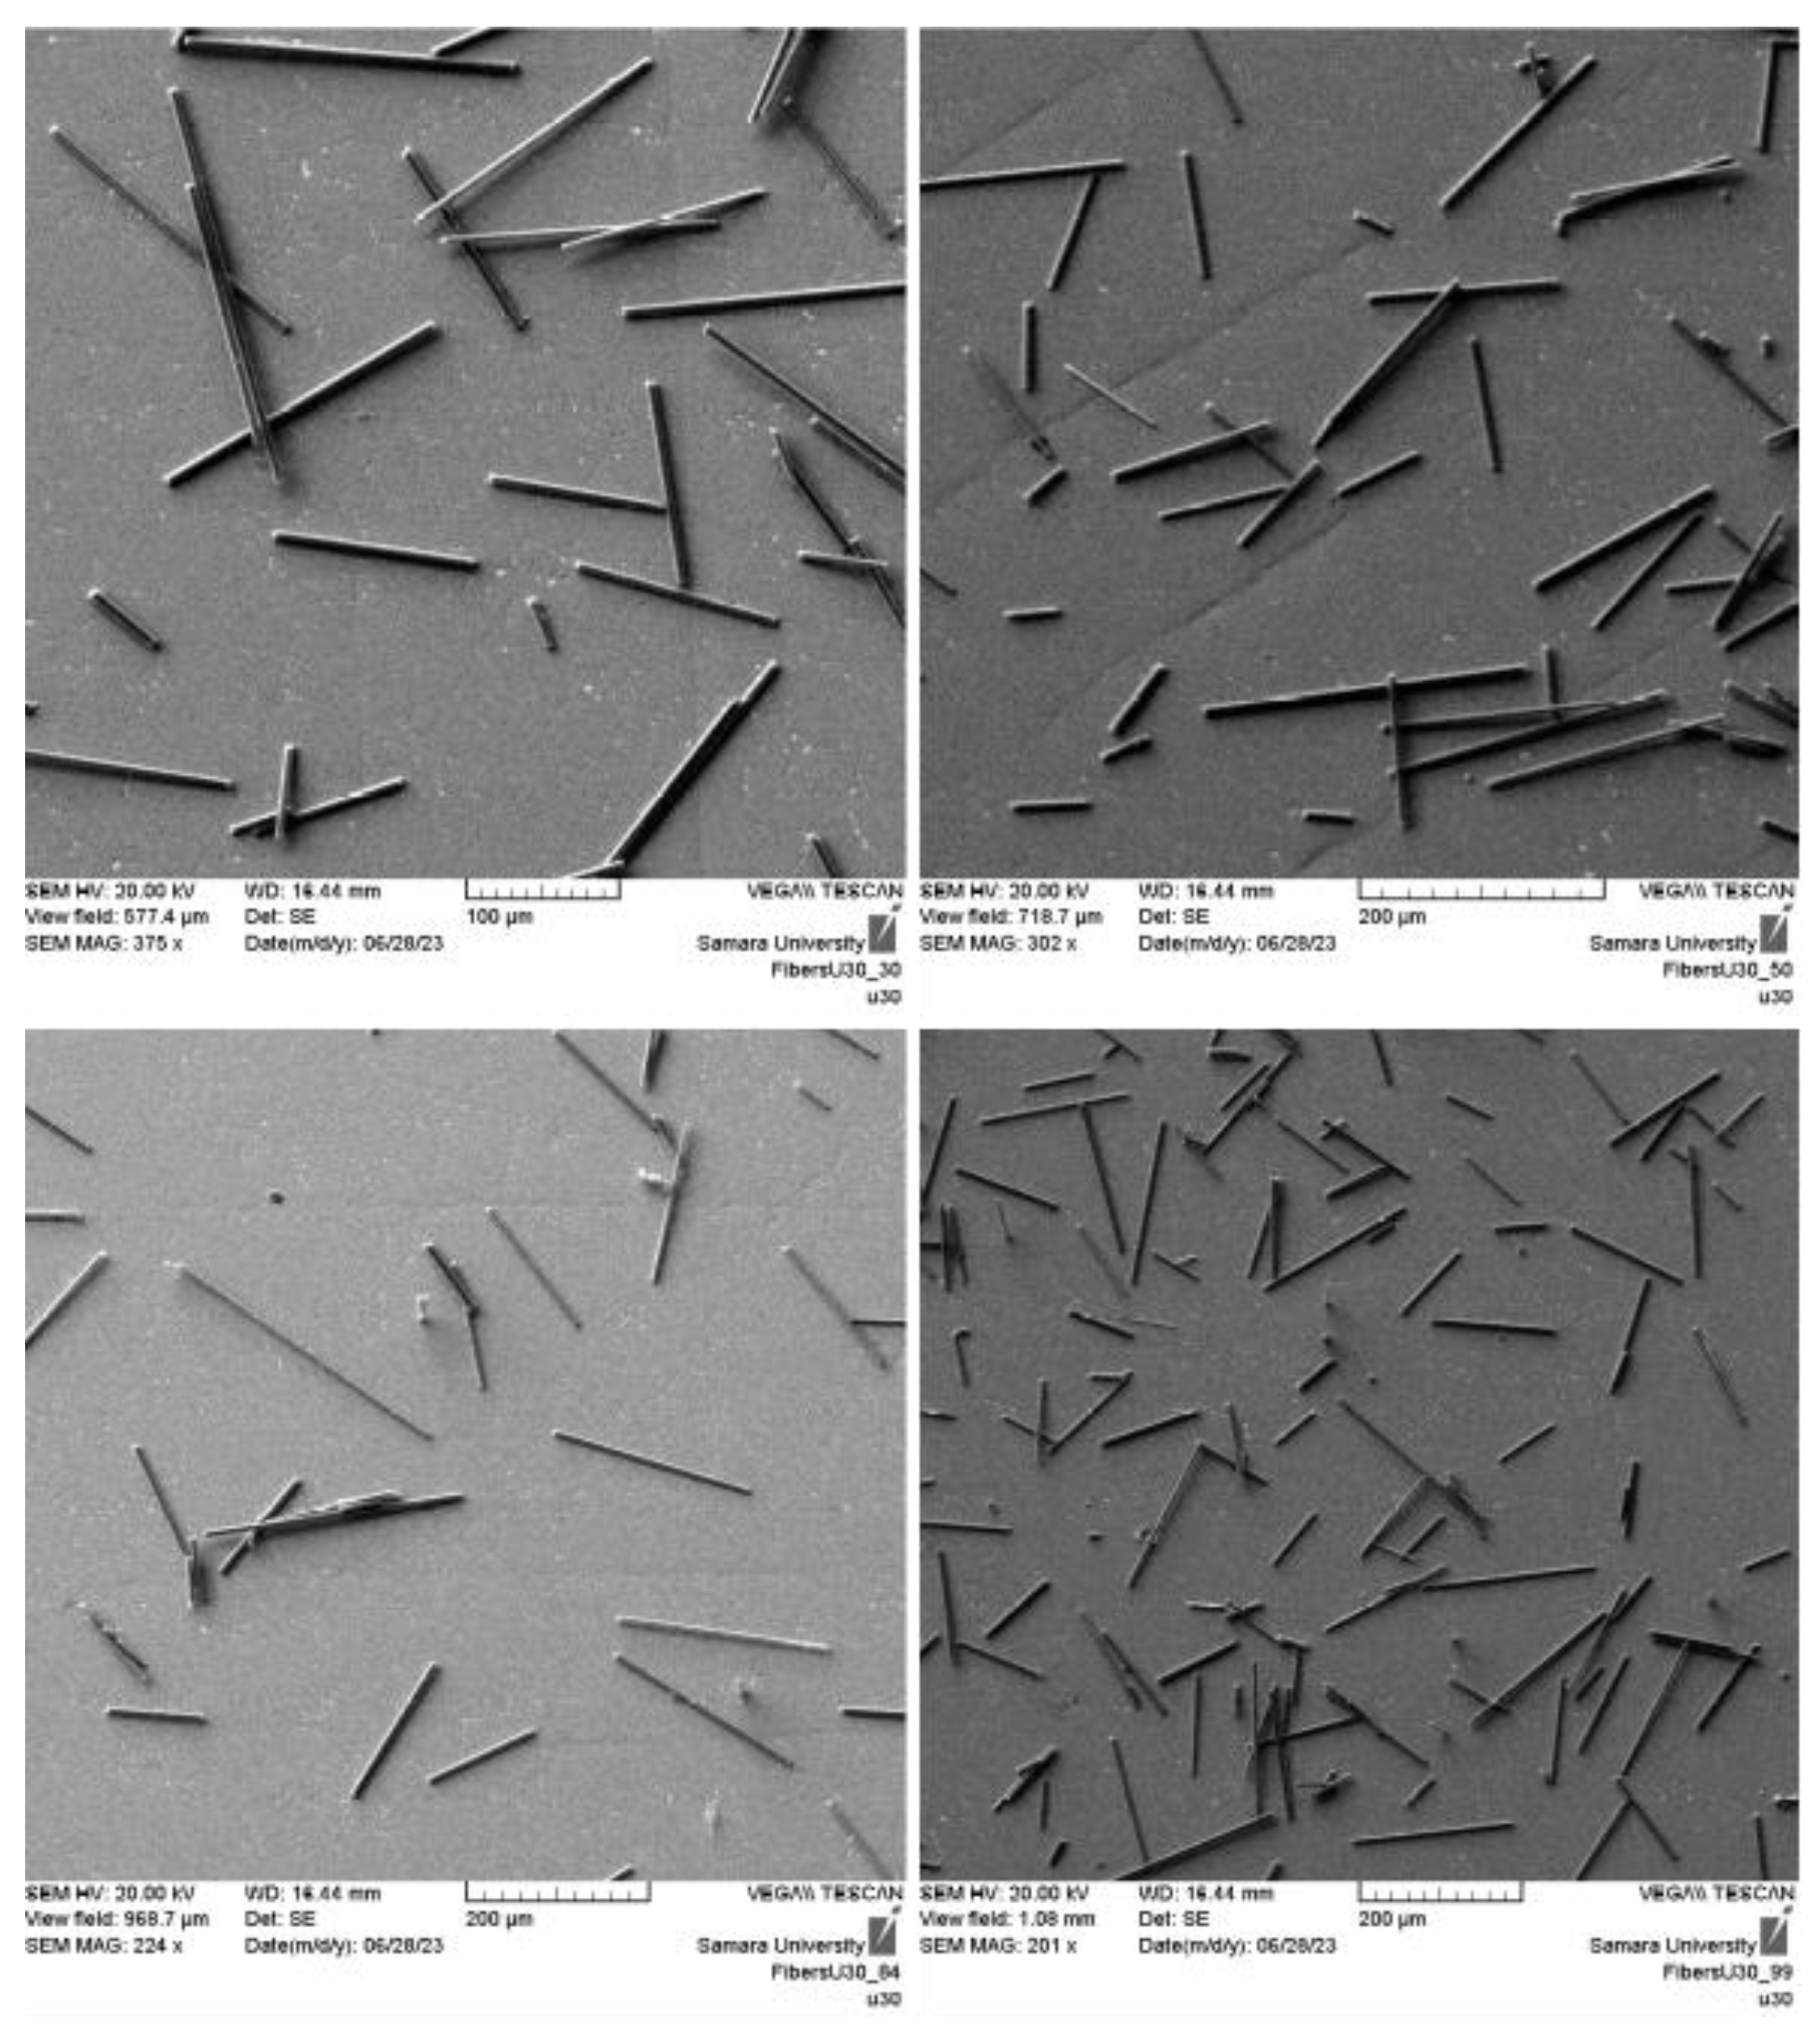
Figure 7.
This is a figure. Schemes follow the same formatting.
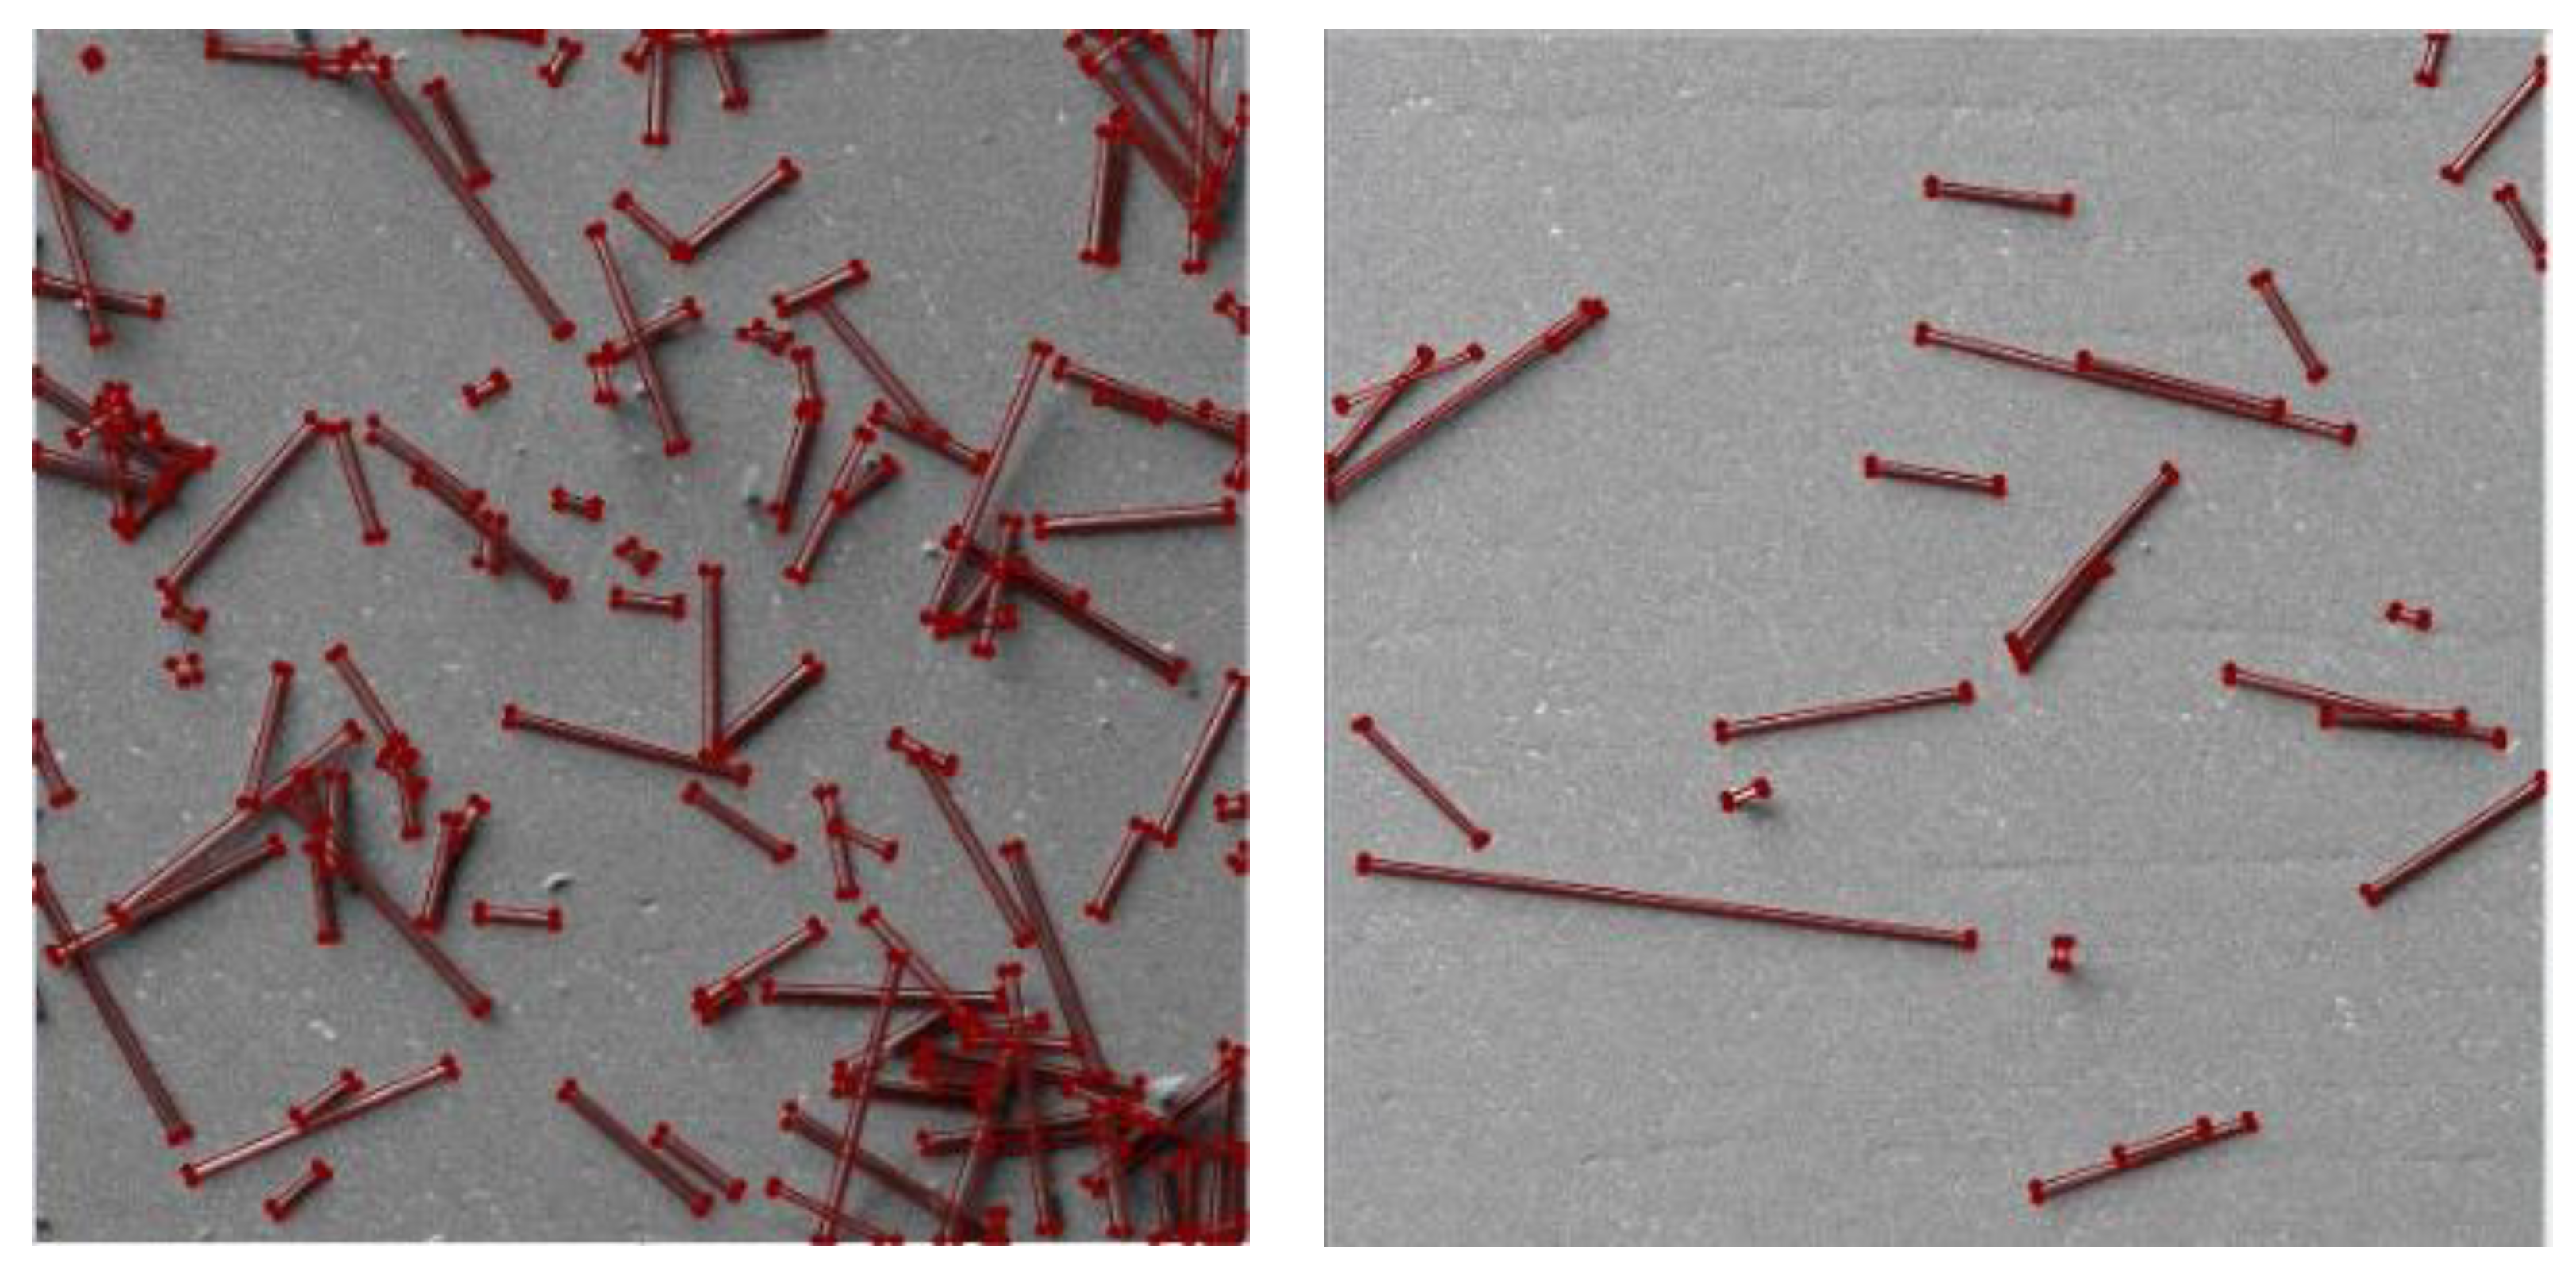
Figure 8.
An example of an image created by the NX API.
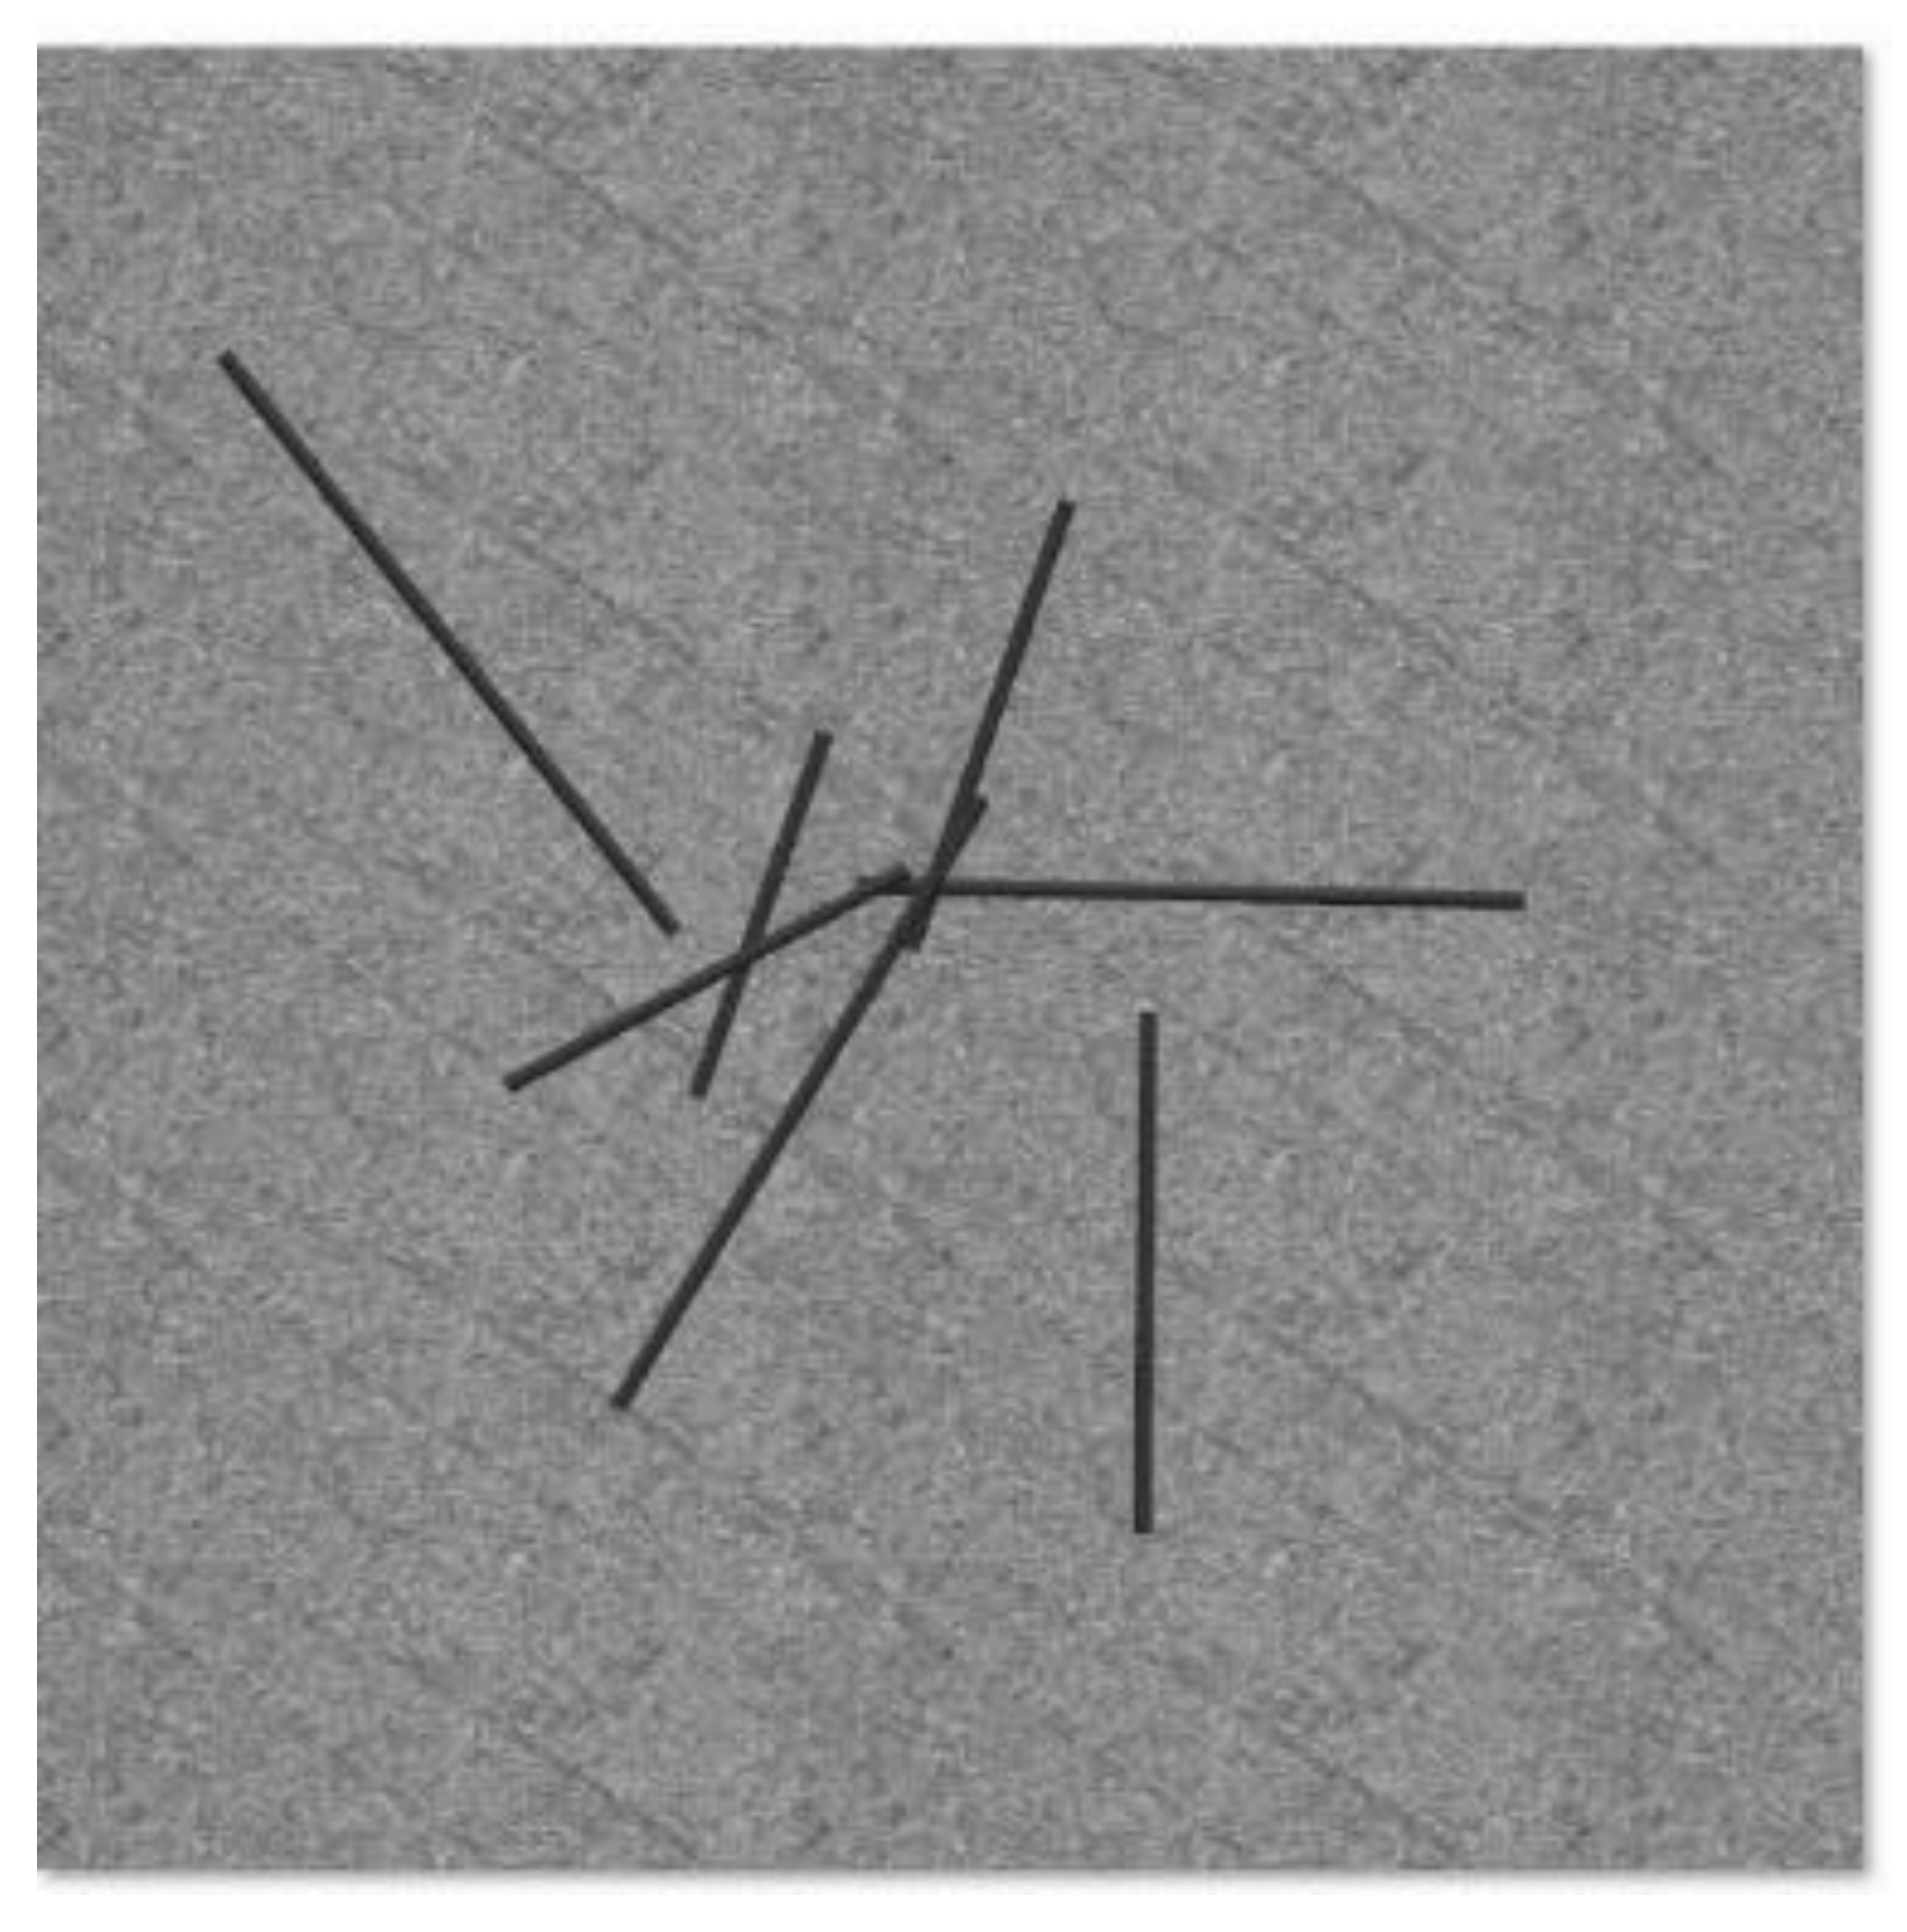
Figure 9.
Proposed two-stage pipeline combining SAM and DeepLabV3+.
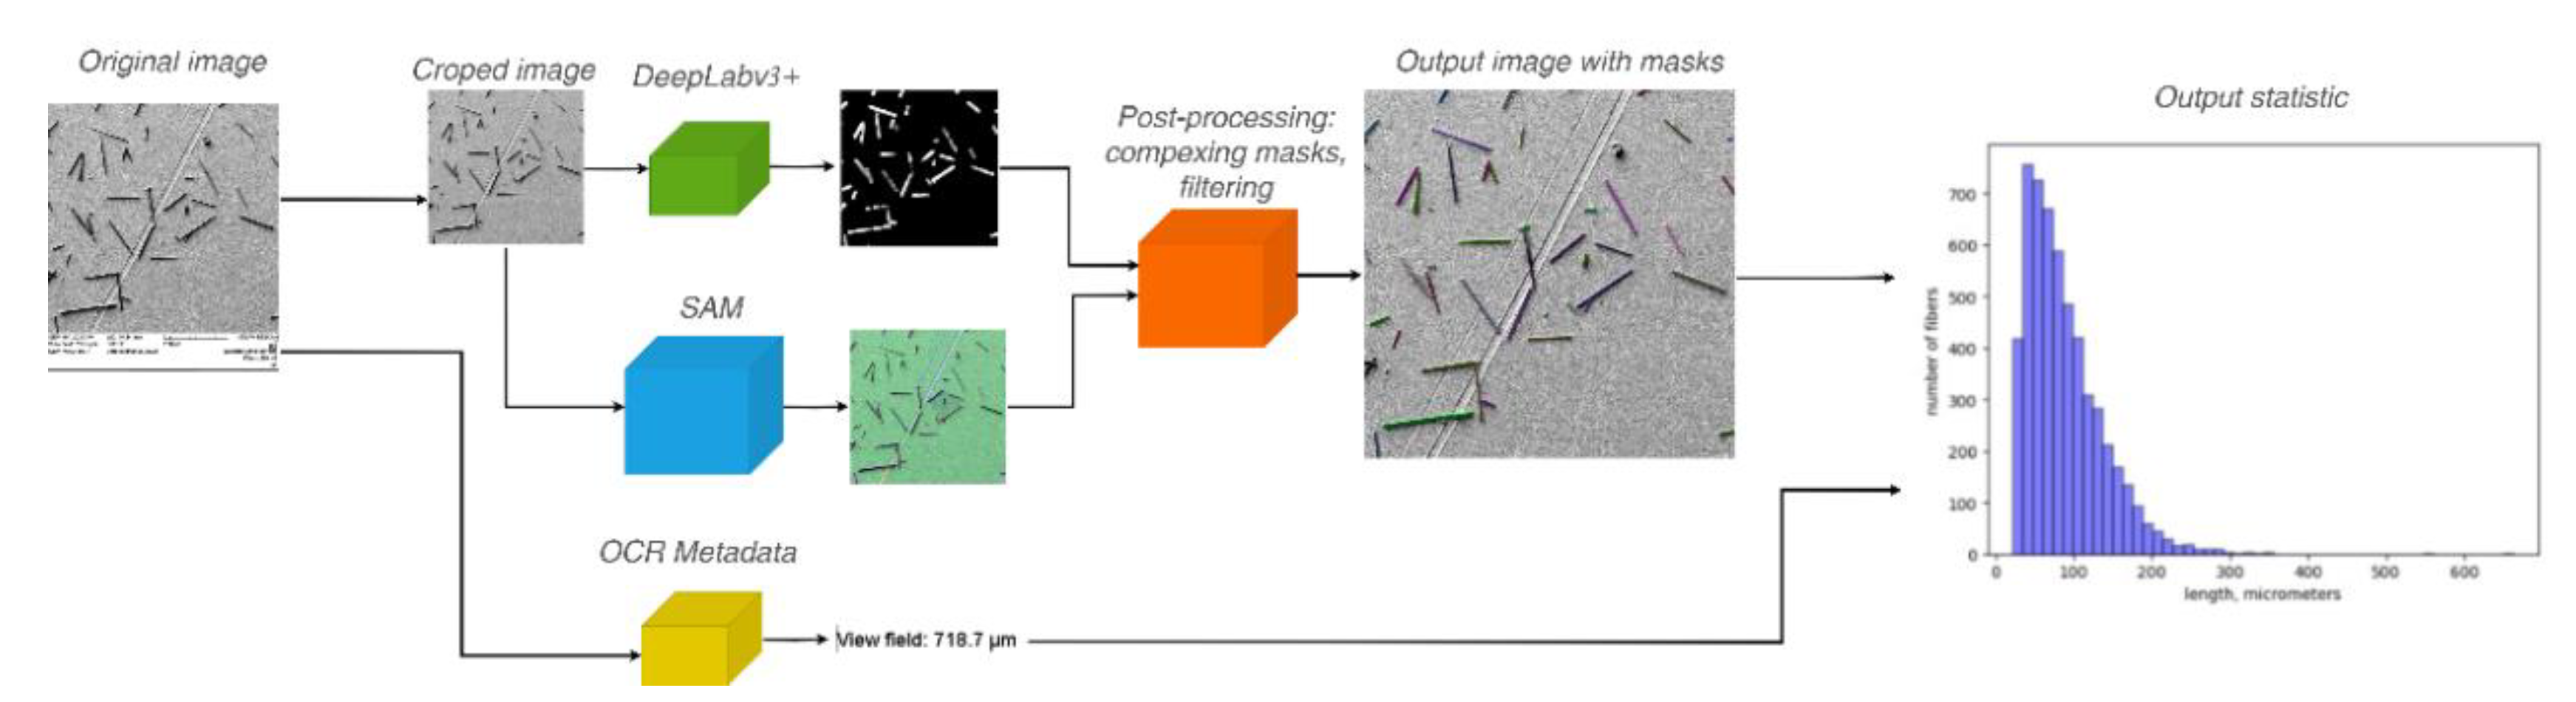
Figure 10.
DeepLabV3+ architecture.
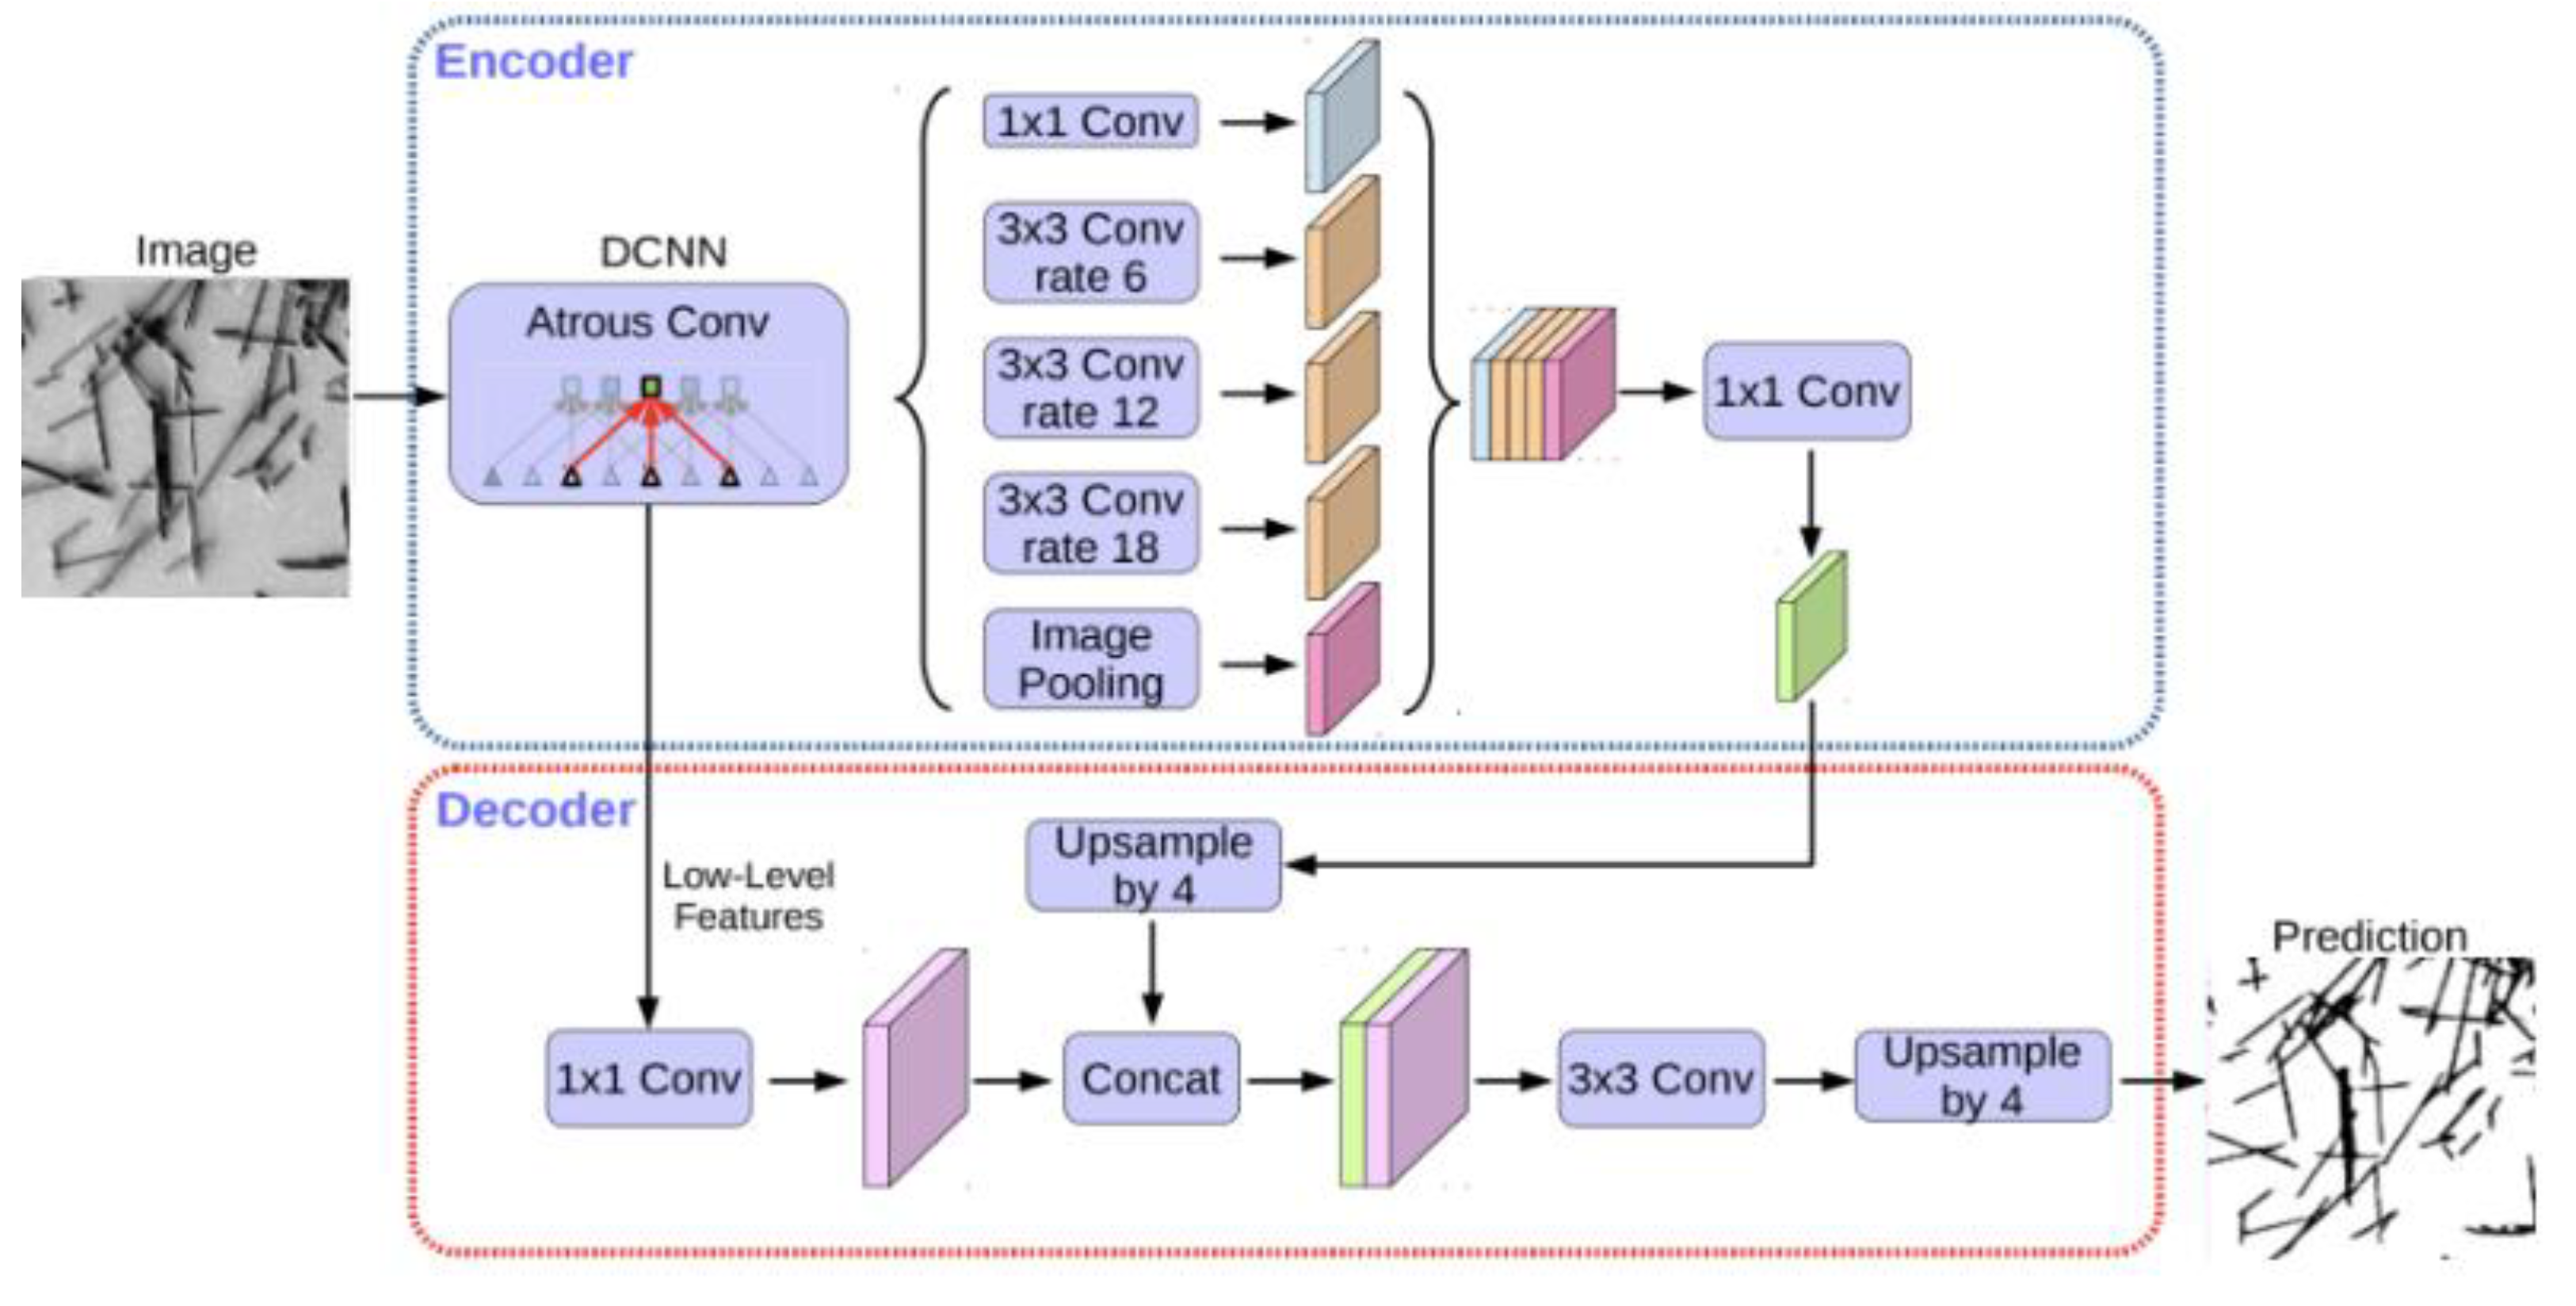
Figure 11.
SAM architecture.
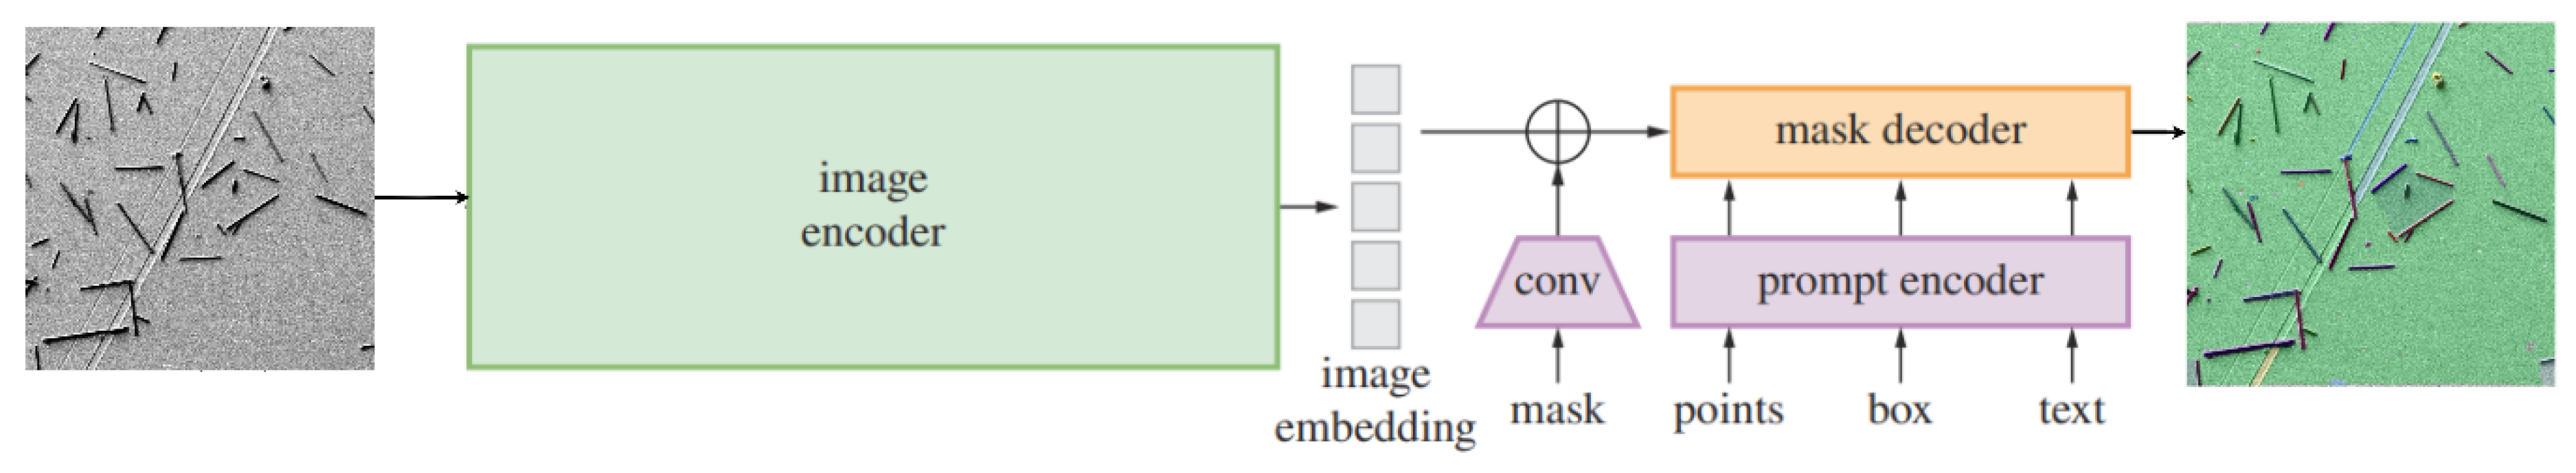
Figure 12.
Example of metadata.
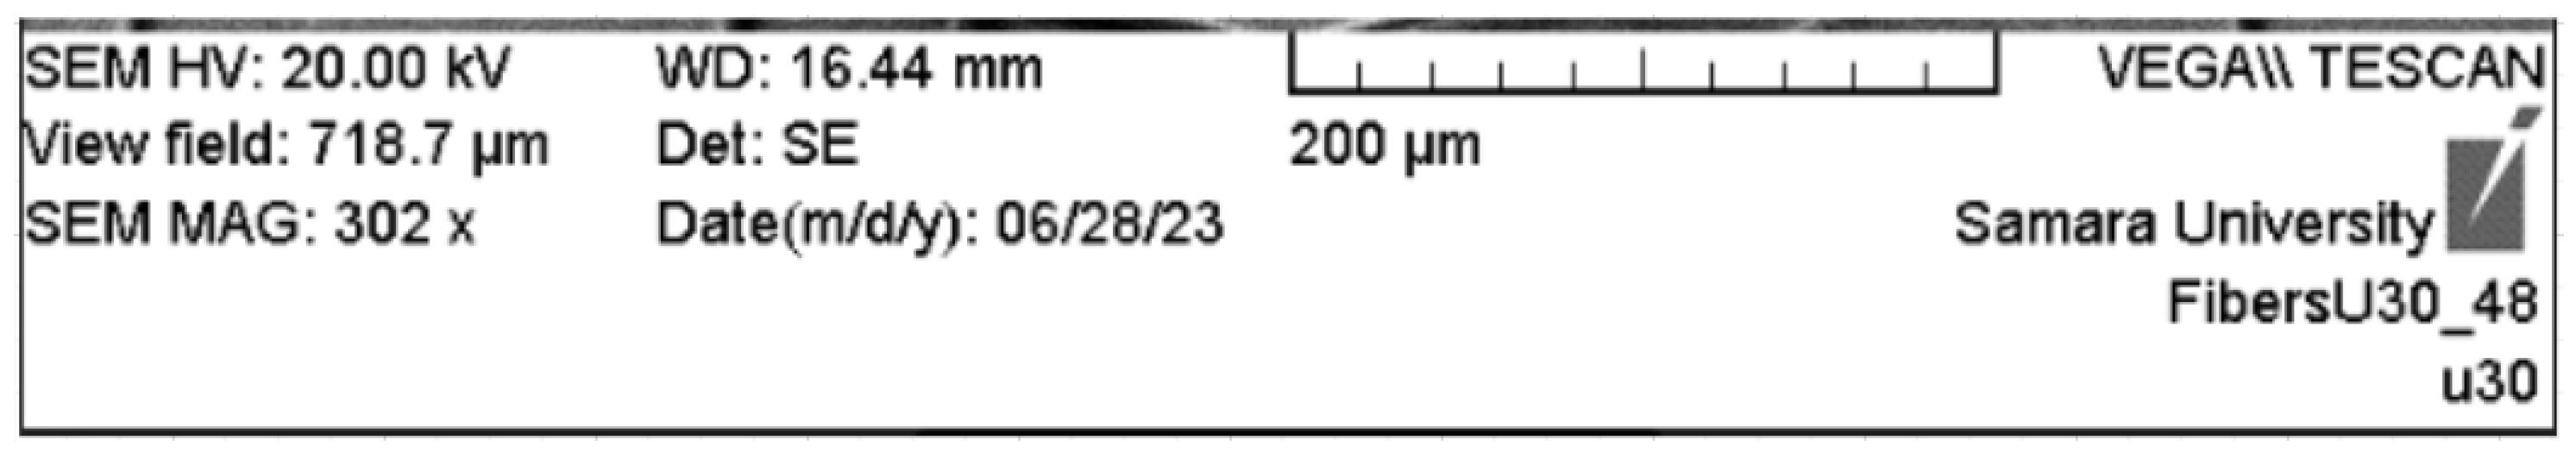
Figure 13.
Sample of the database of real images.
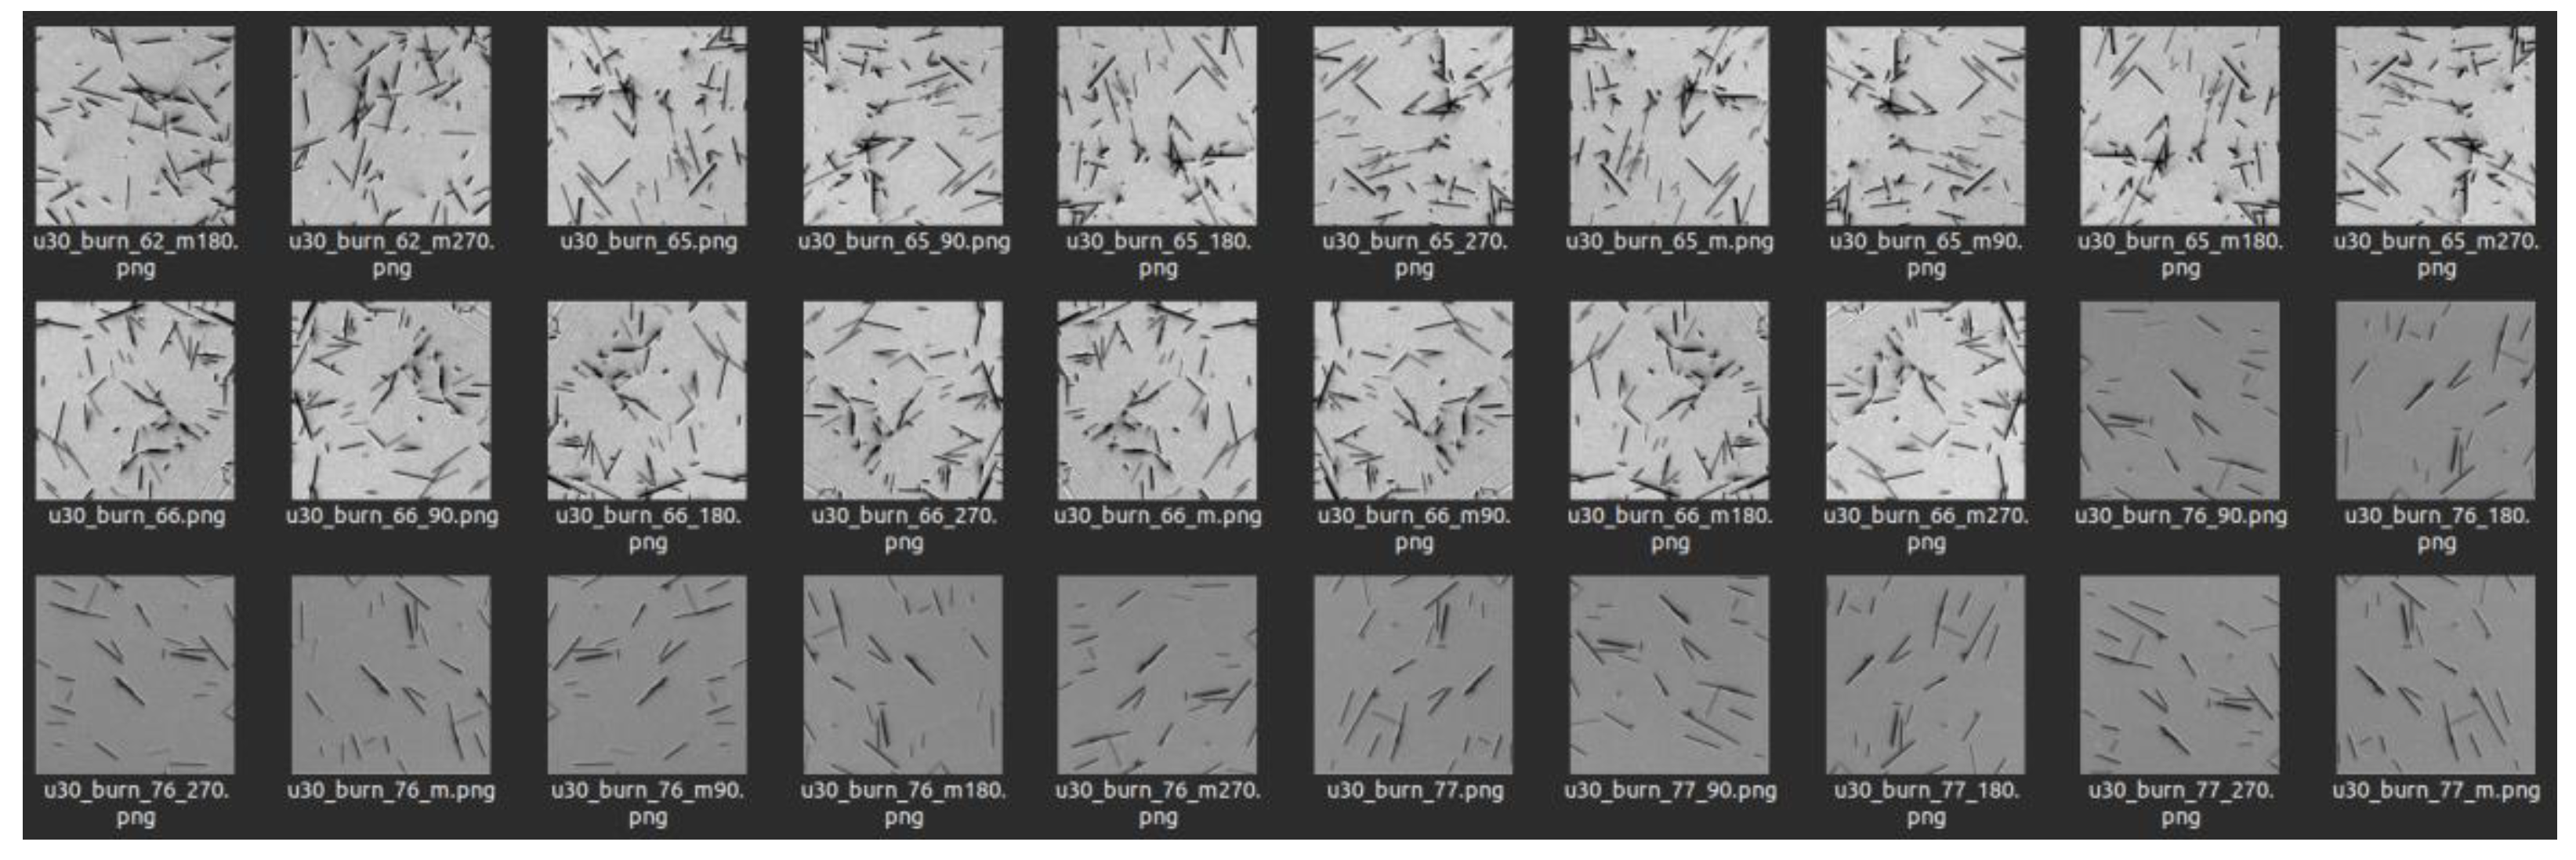
Figure 14.
Sample of the database of artificial images.
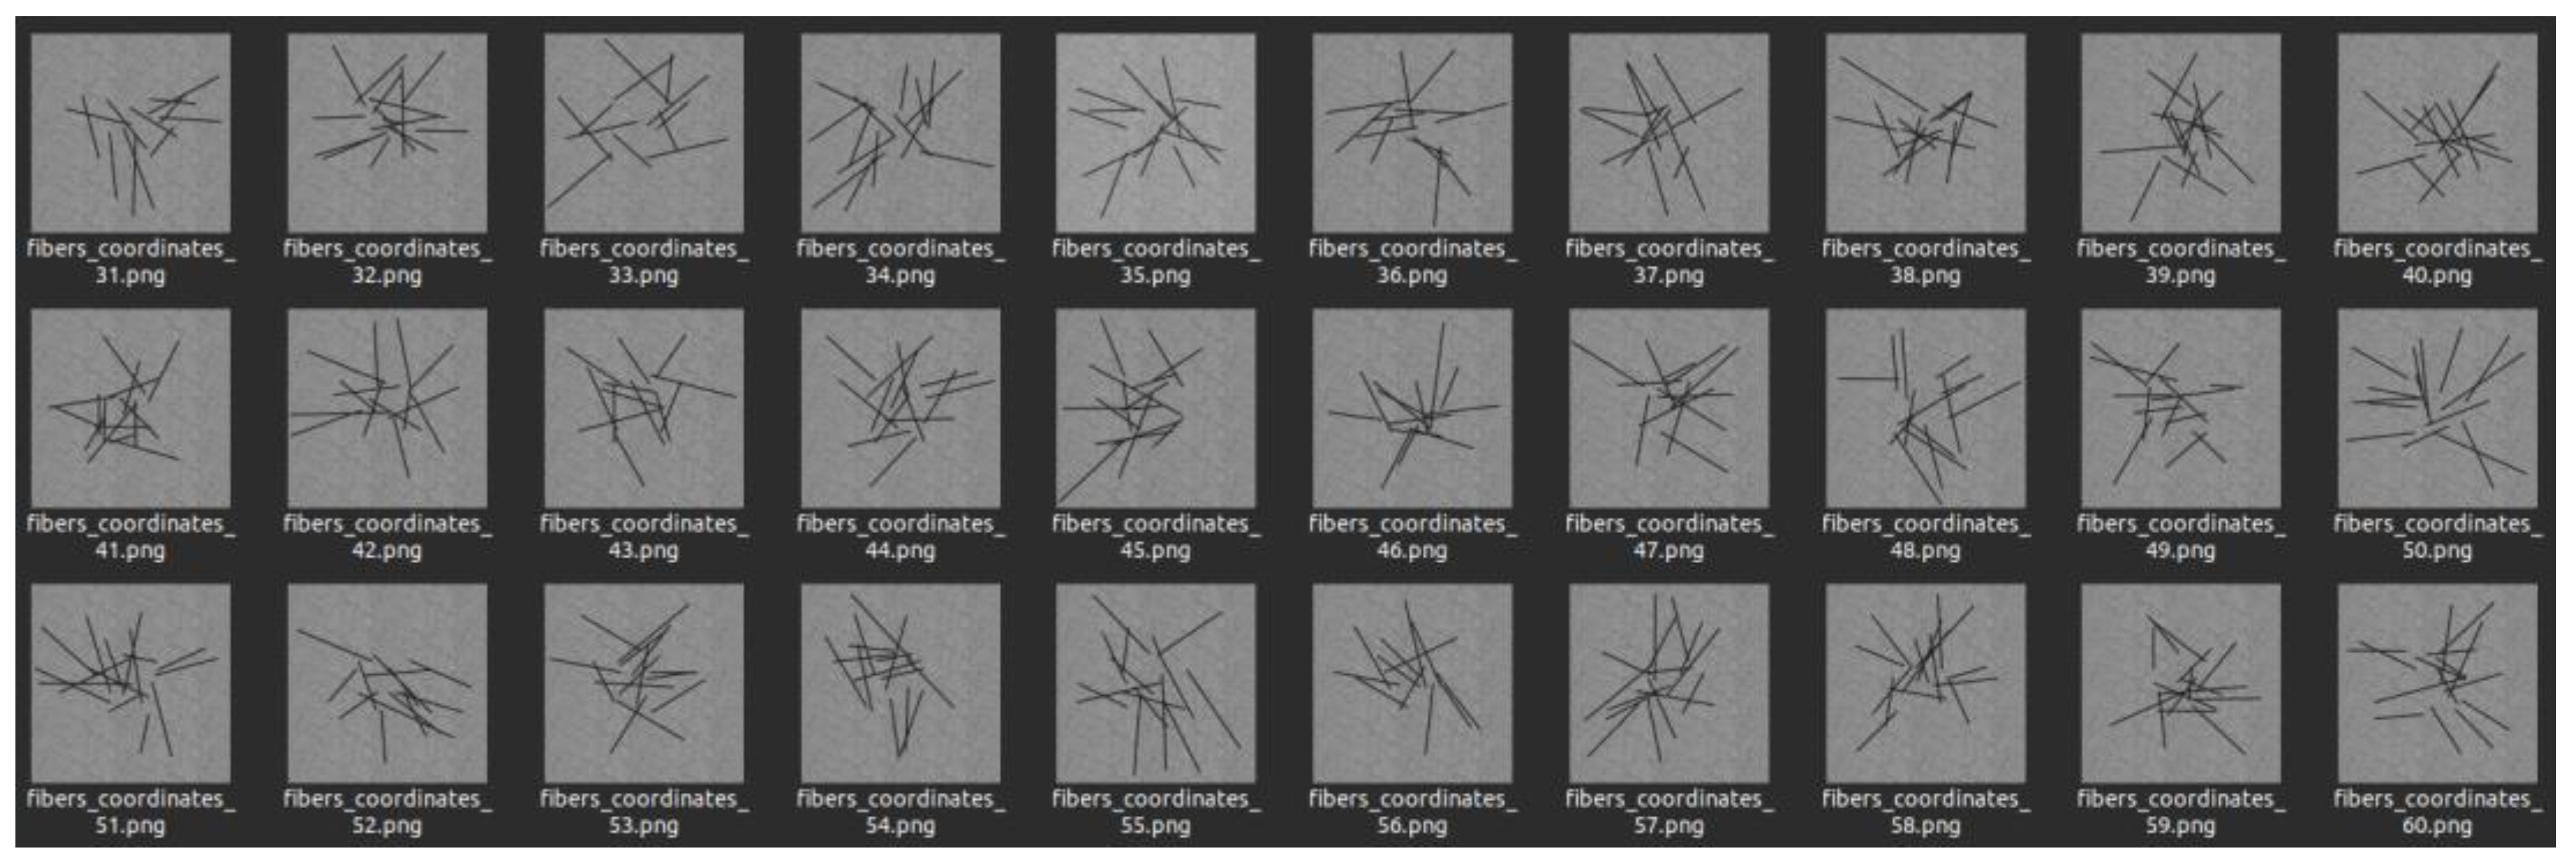
Figure 15.
Examples of the creation of the masks of the labels fiber and background, with DeepLabv3+ trained with different datasets.
Figure 15.
Examples of the creation of the masks of the labels fiber and background, with DeepLabv3+ trained with different datasets.
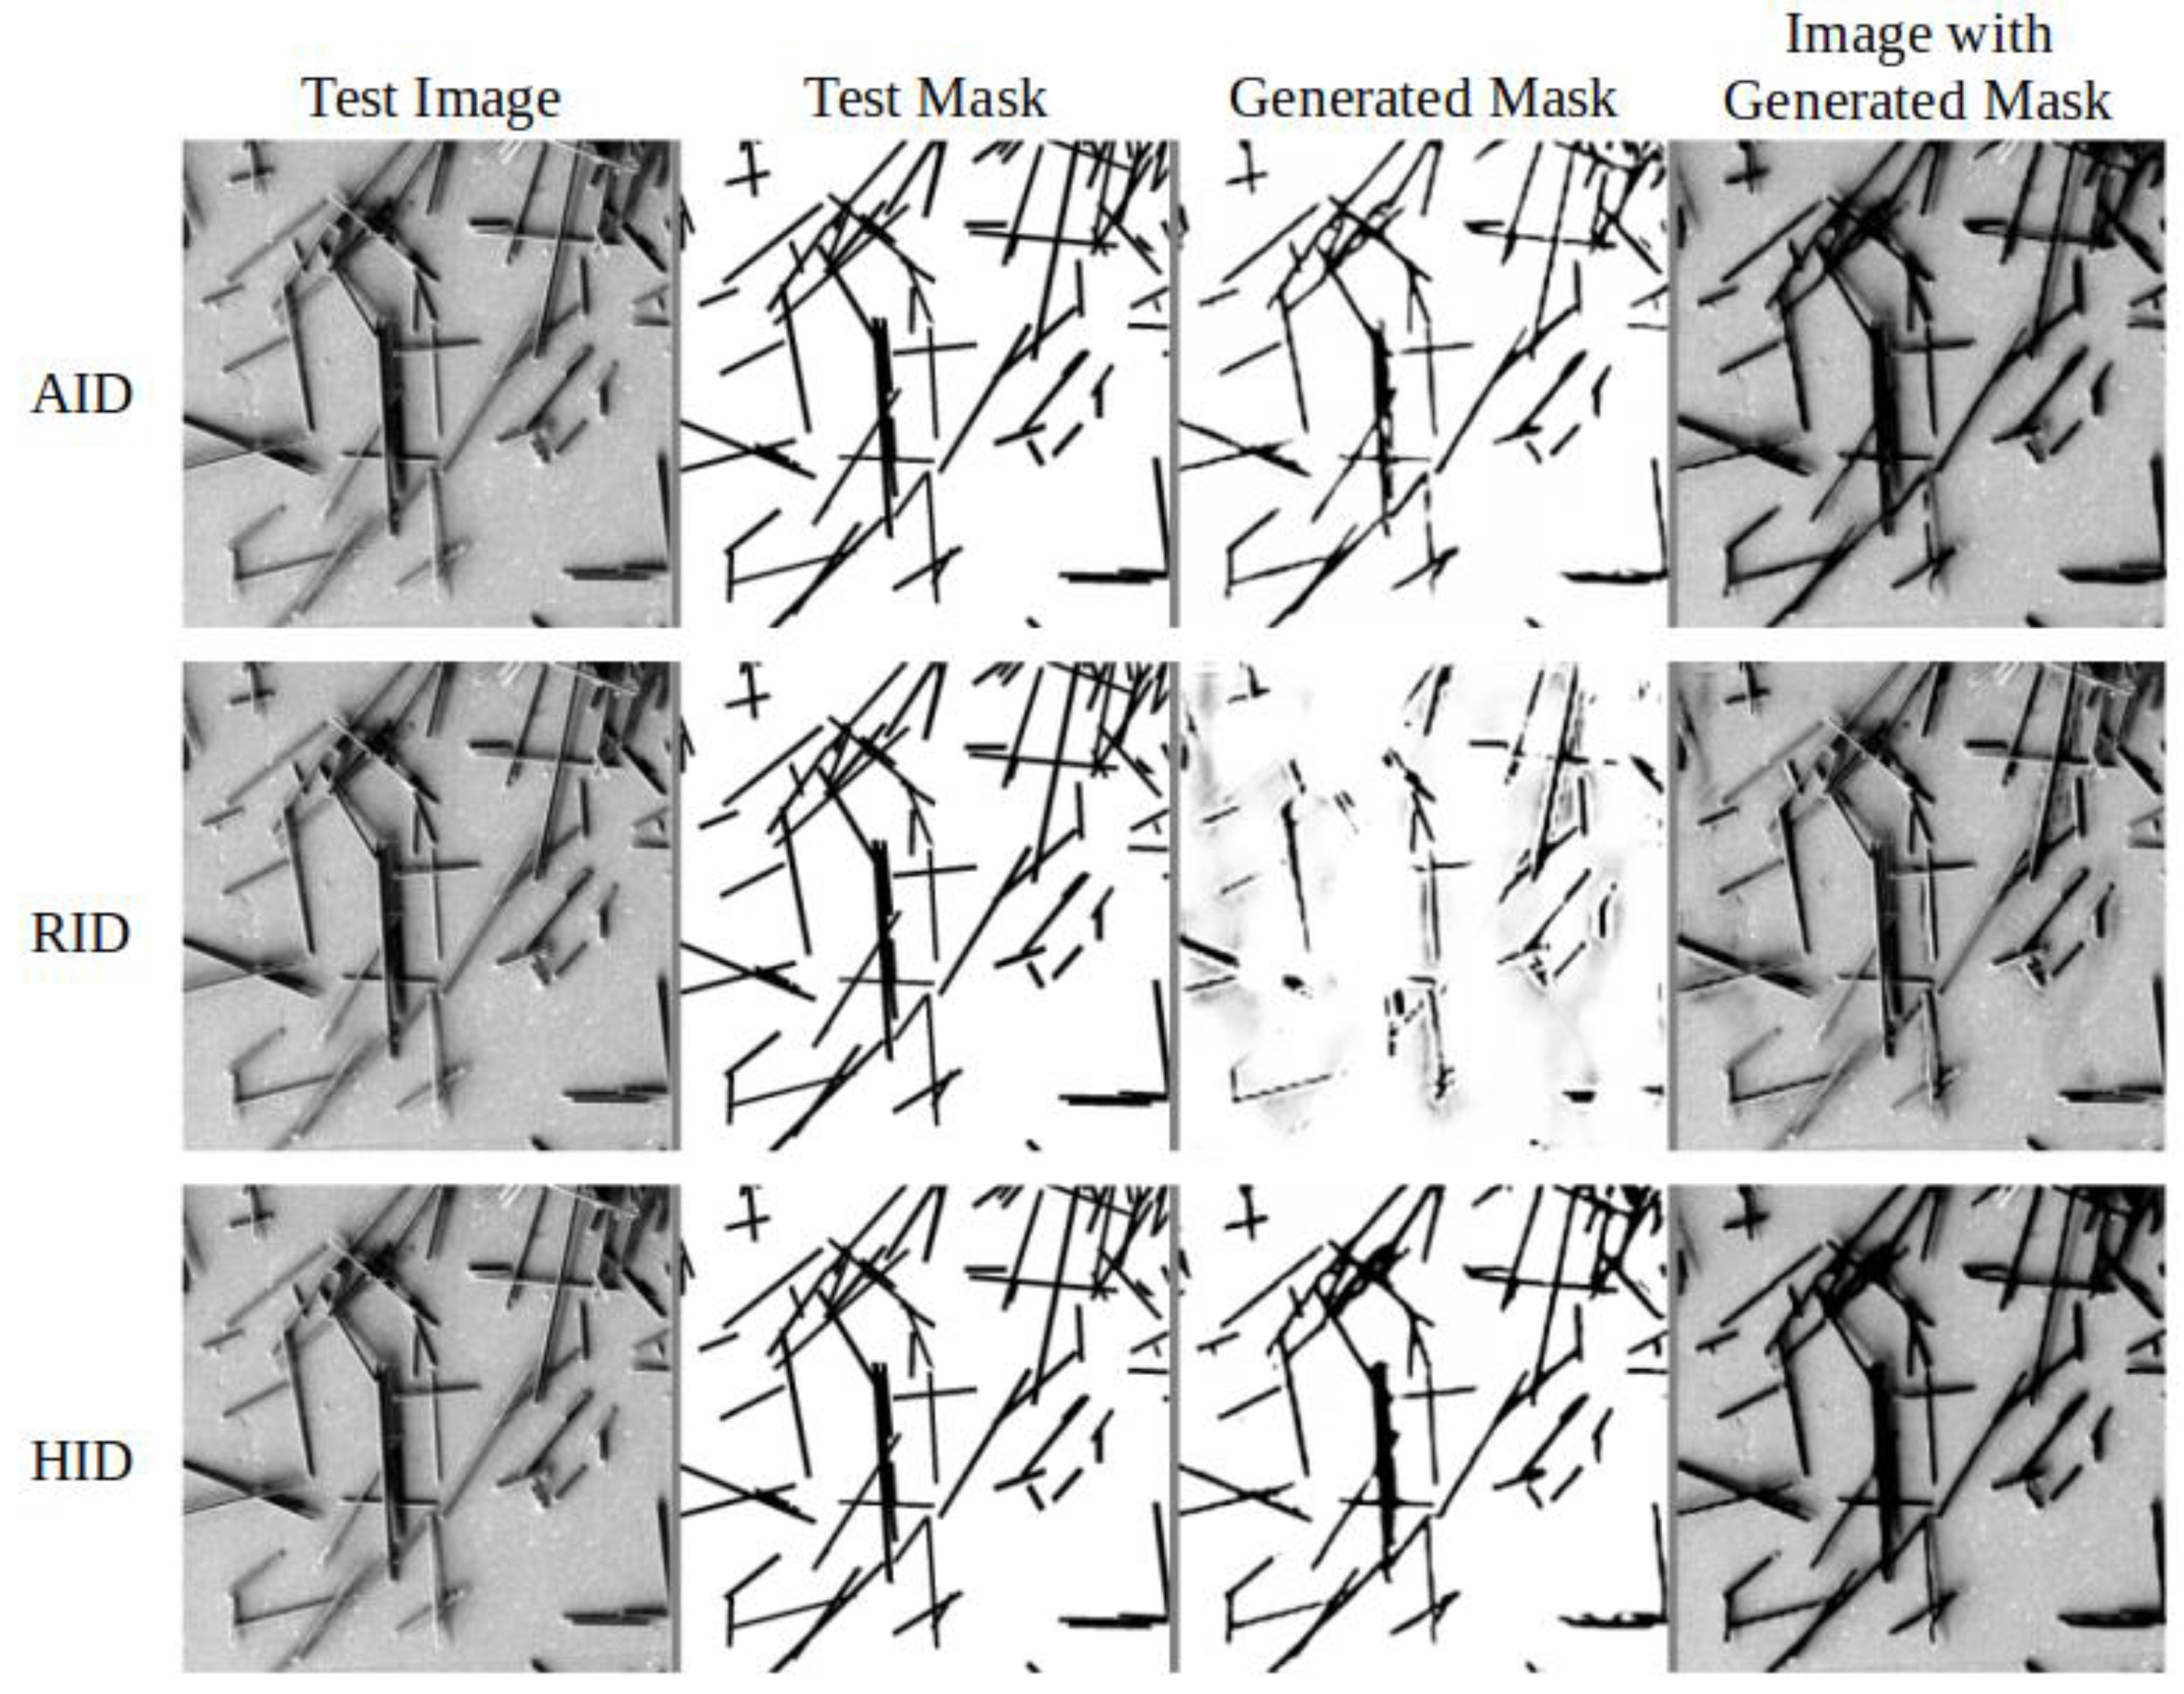
Figure 17.
Histograms of the distribution of lengths, thicknesses and length-to-thickness ratios blue - automatic segmentation, green - manual segmentation.
Figure 17.
Histograms of the distribution of lengths, thicknesses and length-to-thickness ratios blue - automatic segmentation, green - manual segmentation.
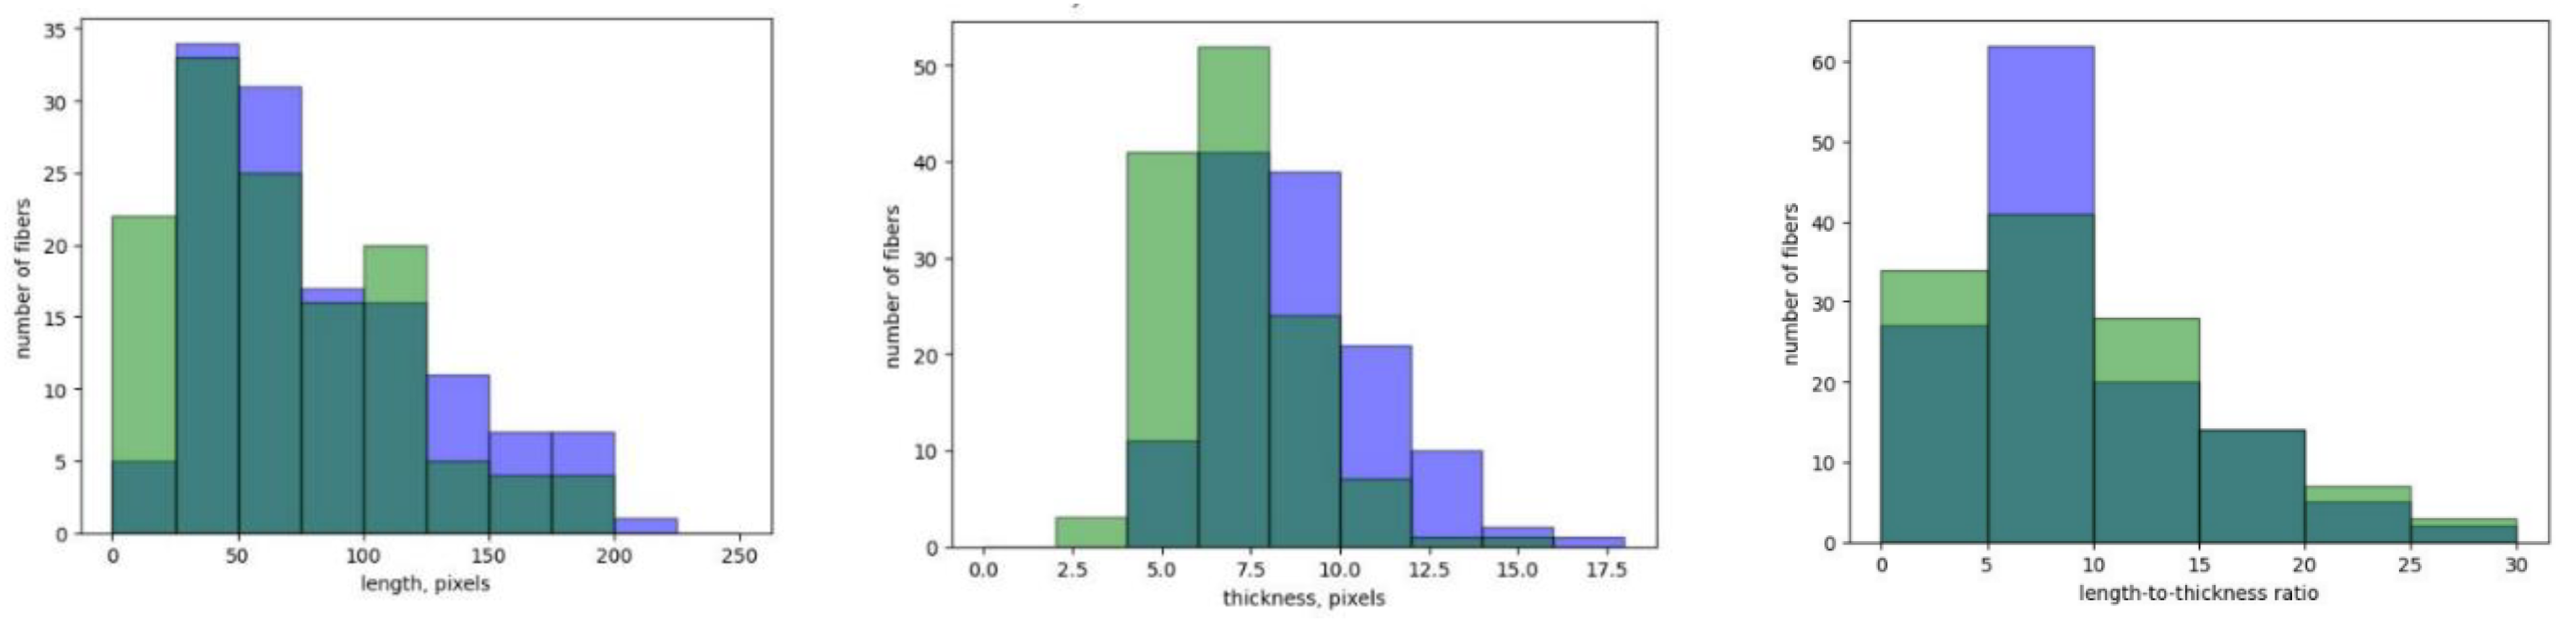
Figure 18.
Glass fibers automatic segmentation with fiber lengths detection in mircometrs.
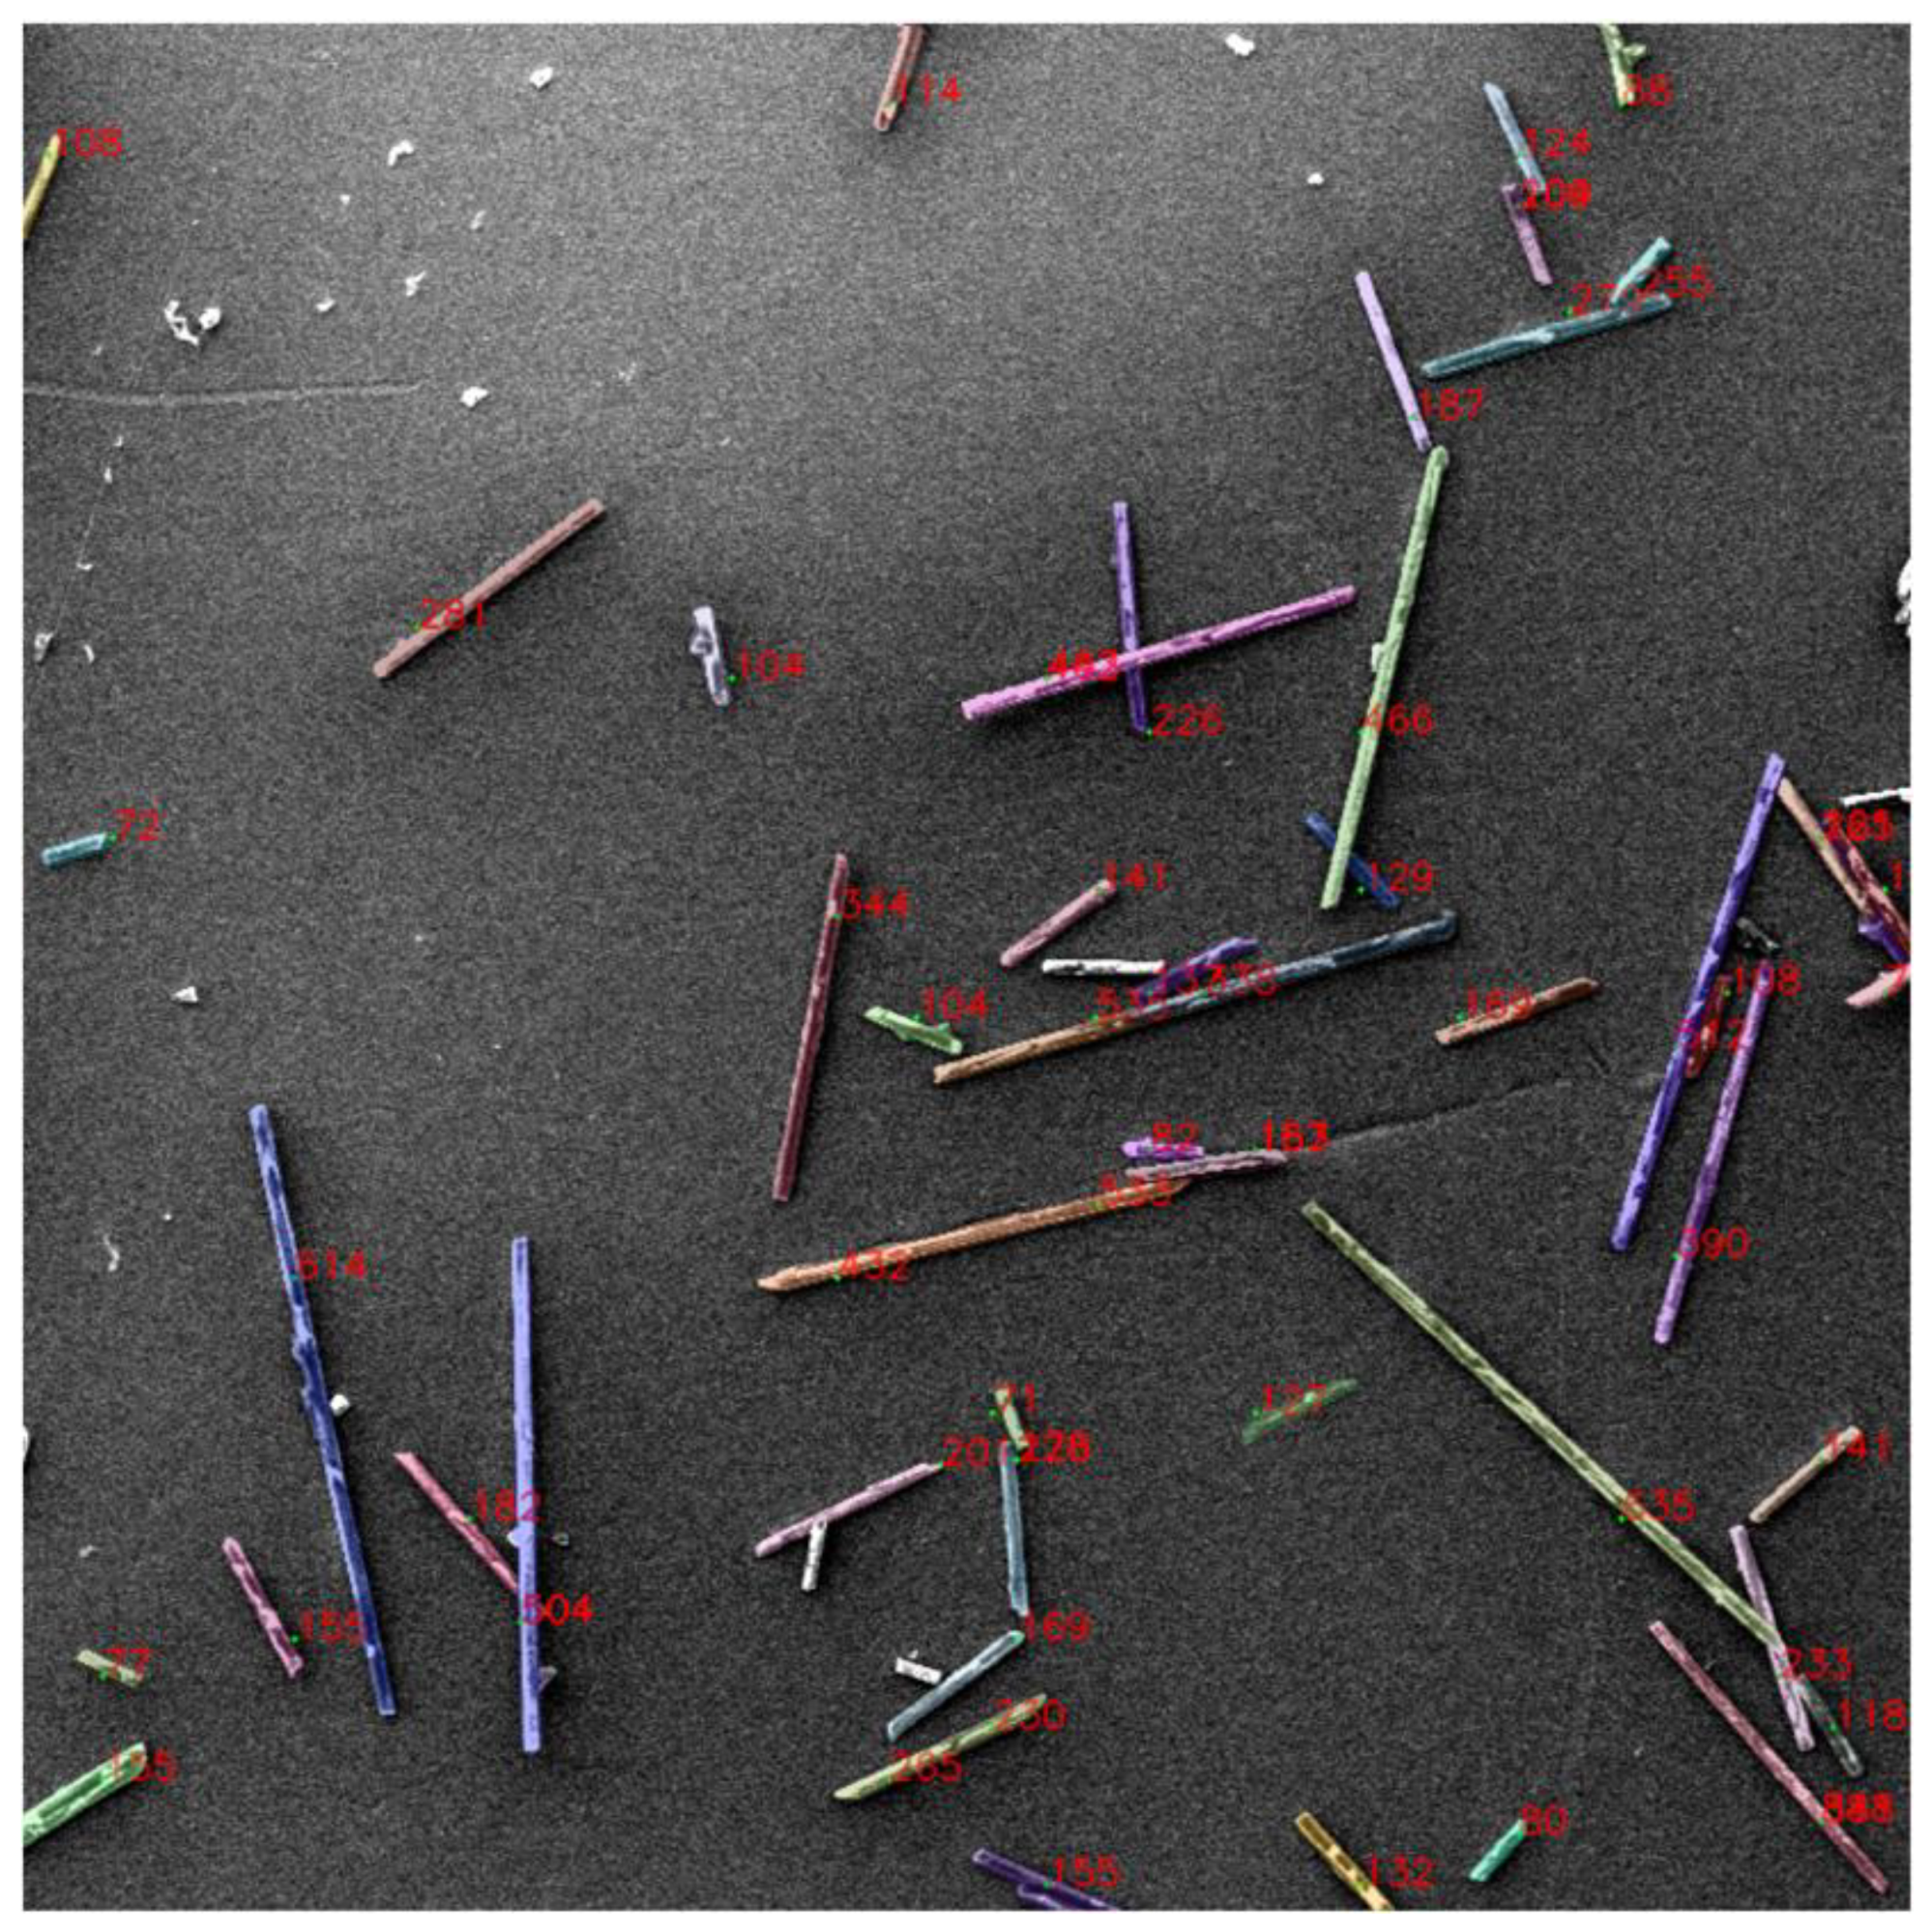
Figure 19.
Glass fibers manual measurments.
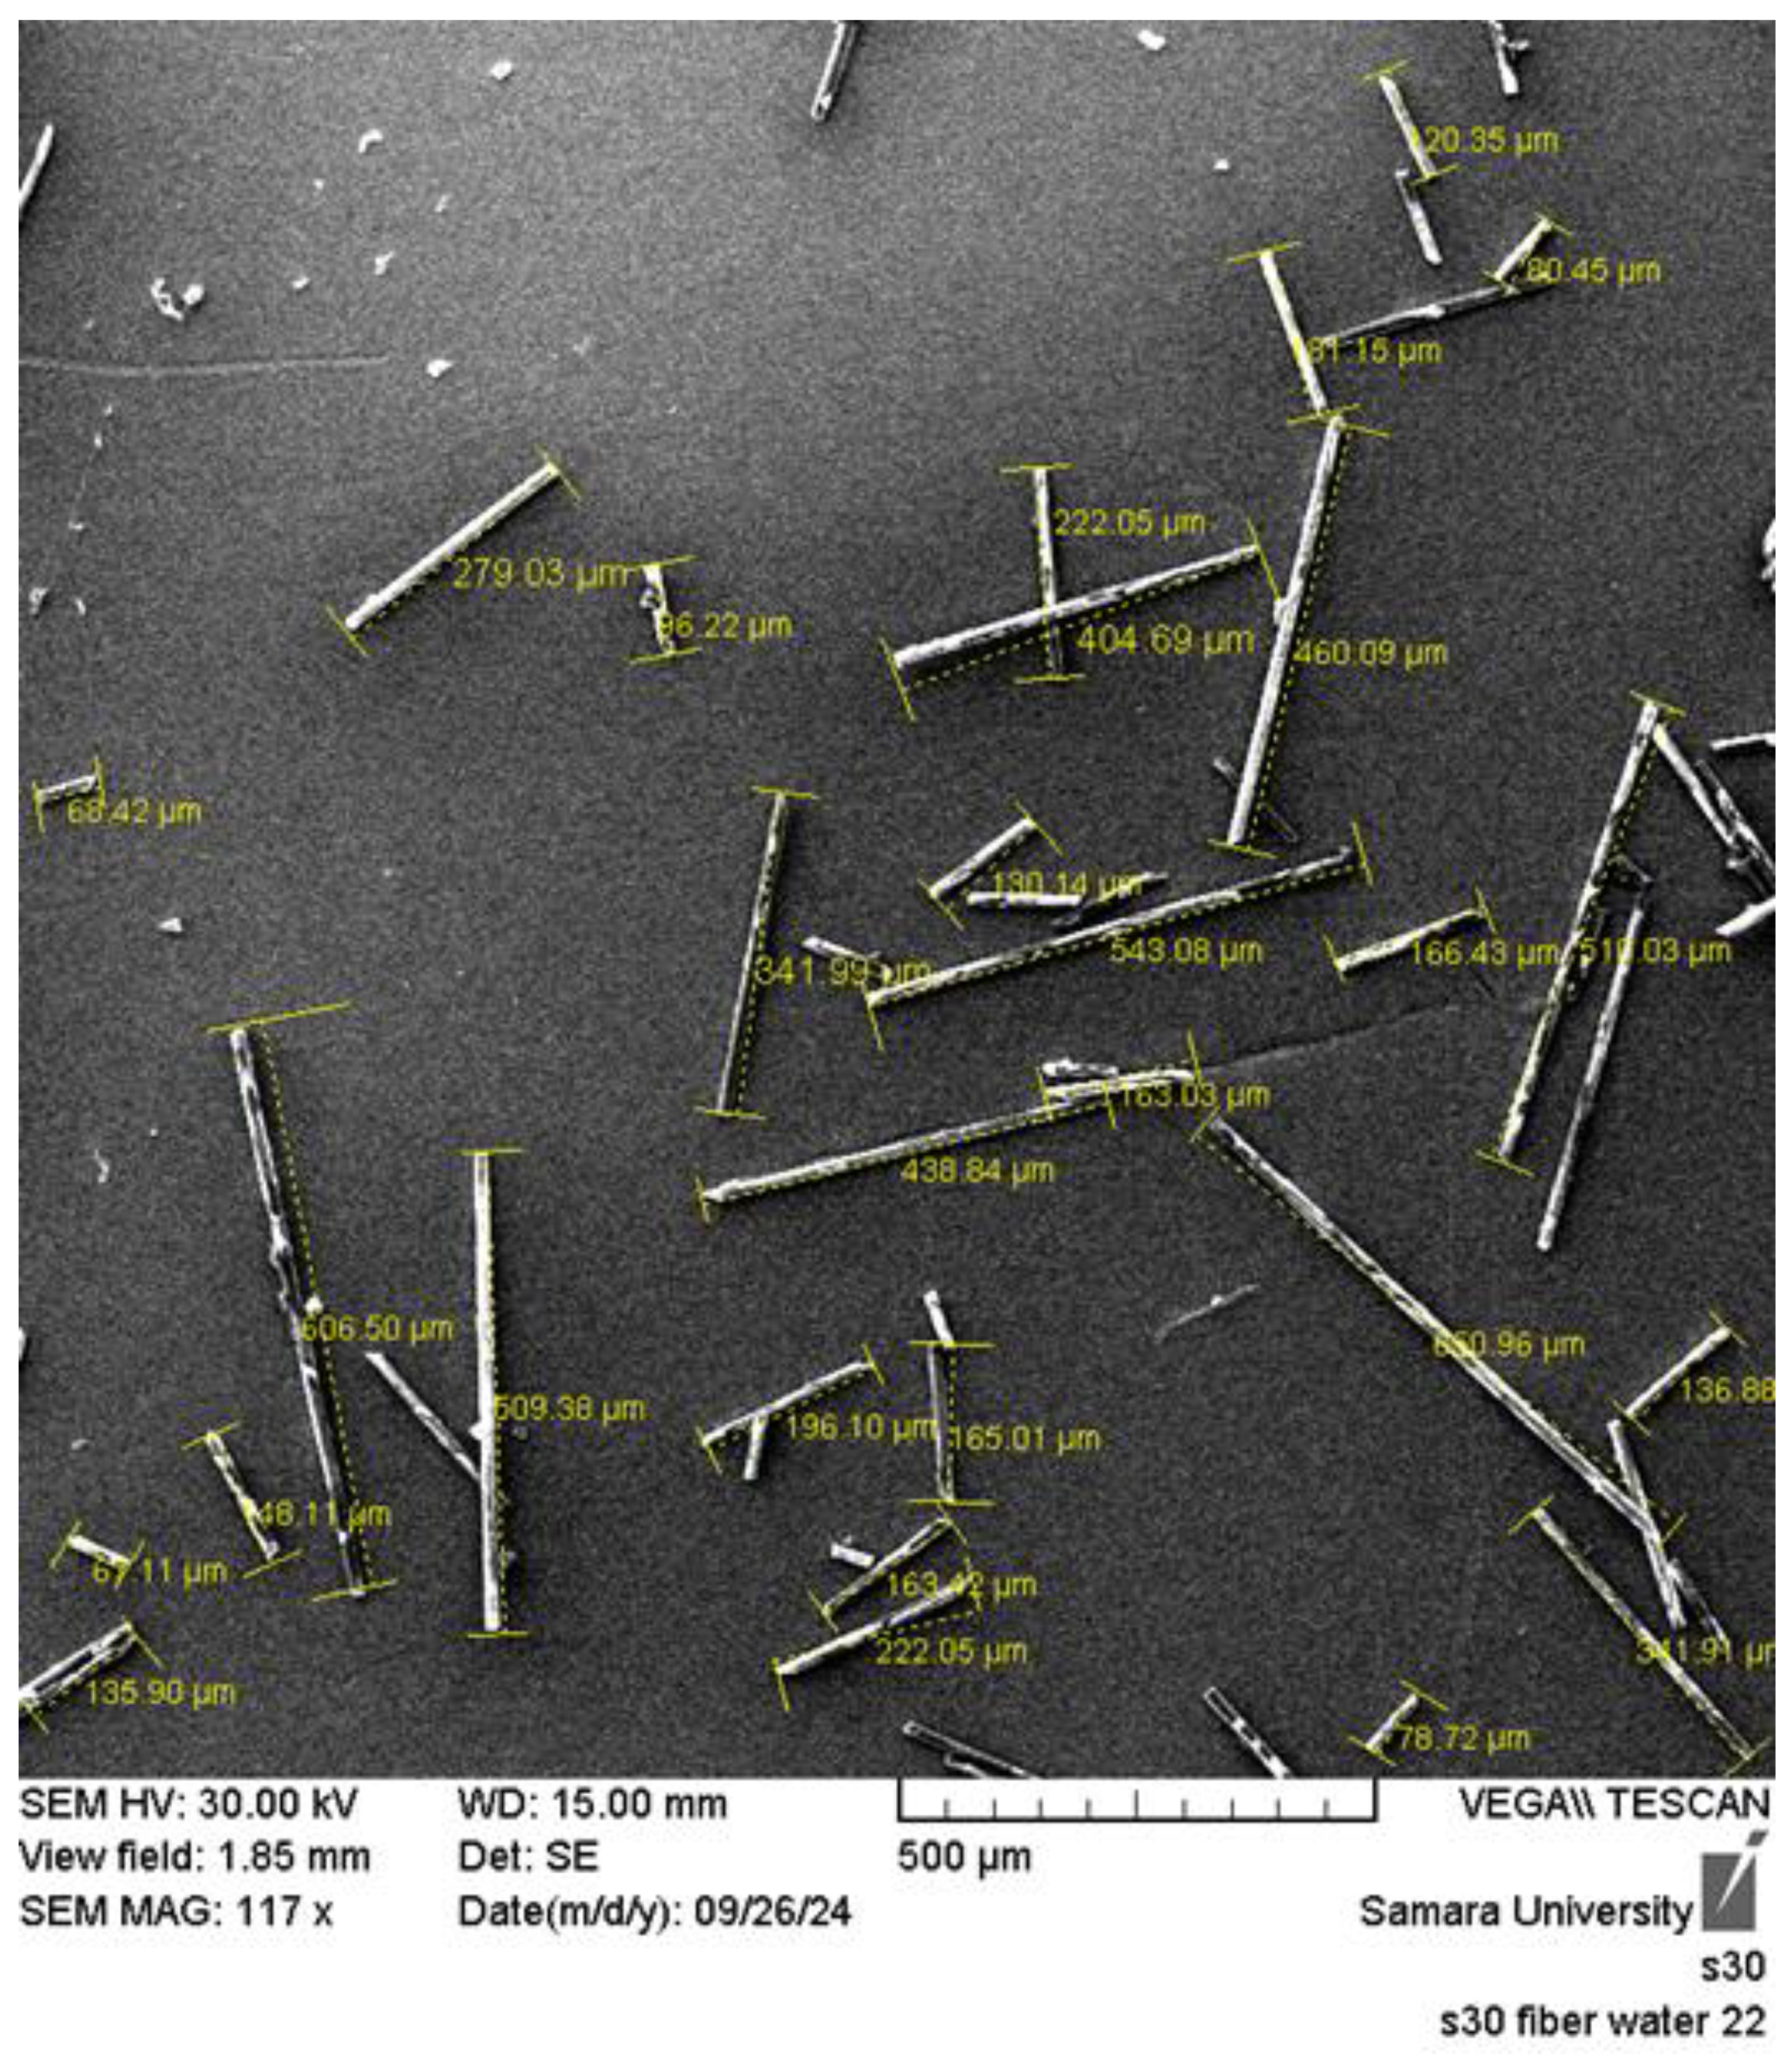
Figure 20.
Challenging conditions for fiber segmentation (a) intersecting fibers (b) high fiber density (c) large amounts of foreign matter.
Figure 20.
Challenging conditions for fiber segmentation (a) intersecting fibers (b) high fiber density (c) large amounts of foreign matter.
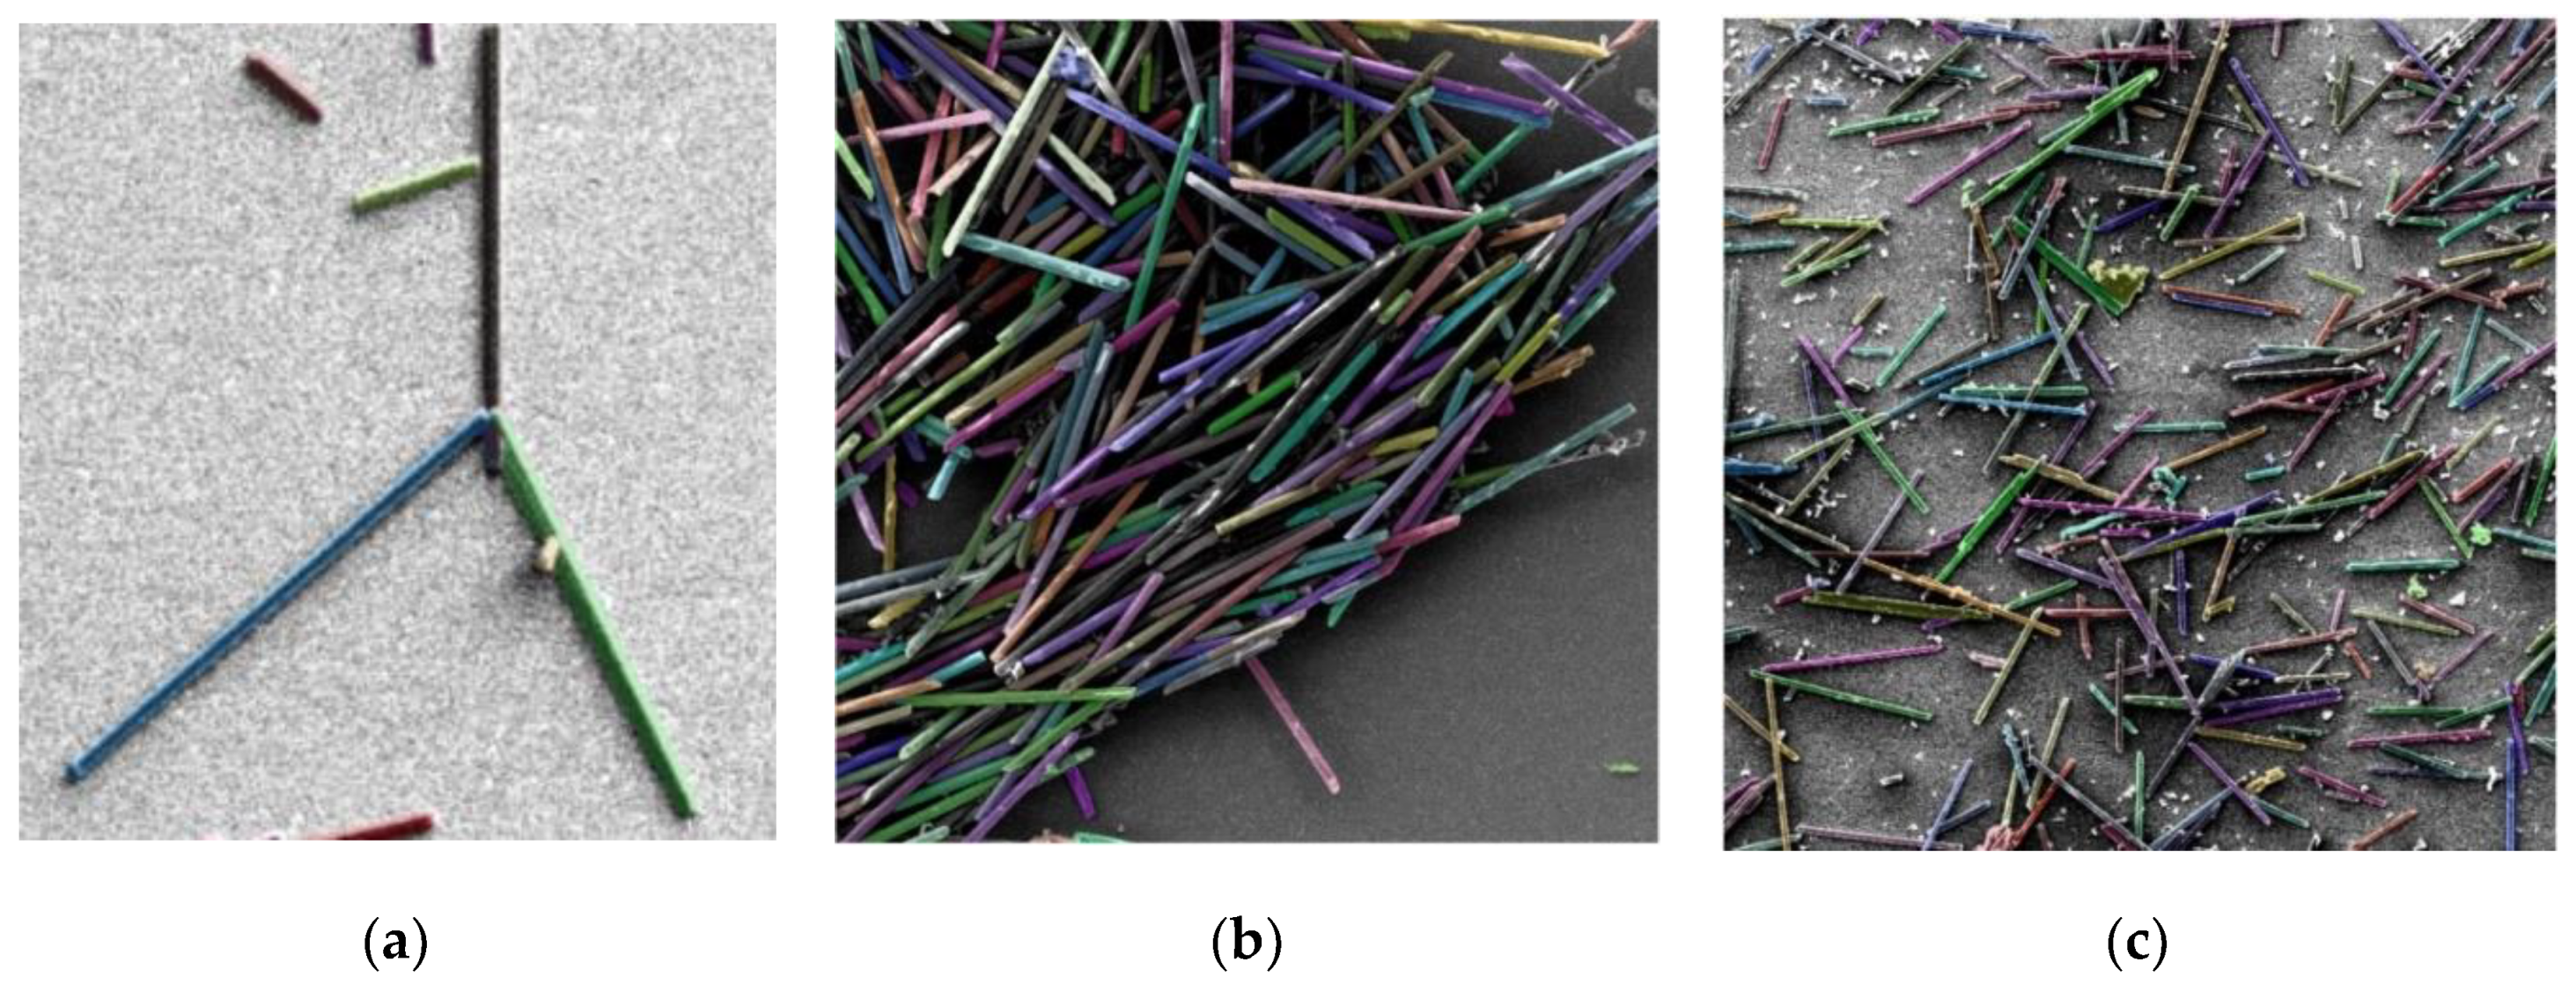

Table 1.
Evaluation of the different data sets with DeepLabV3+.
| Method | IoU | Pix Acc |
|---|---|---|
| DeepLabv3+ (RID) | 0.943 | 0.949 |
| DeepLabv3+ (AID) | 0.851 | 0.854 |
| DeepLabv3+ (HID) | 0.953 | 0.959 |
Table 2.
Evaluation of the different data sets with DeepLabV3+.
| Architecture | IoU | Pix Acc |
| DeepLabv3+/Hough | 0.915 | 0.911 |
| SAM | 0.873 | 0.877 |
| DeepLabv3+/SAM | 0.953 | 0.959 |
| Mask R-CNN | 0.723 | 0.724 |
| SAM2 | 0.877 | 0.879 |
Disclaimer/Publisher’s Note: The statements, opinions and data contained in all publications are solely those of the individual author(s) and contributor(s) and not of MDPI and/or the editor(s). MDPI and/or the editor(s) disclaim responsibility for any injury to people or property resulting from any ideas, methods, instructions or products referred to in the content. |
© 2024 by the authors. Licensee MDPI, Basel, Switzerland. This article is an open access article distributed under the terms and conditions of the Creative Commons Attribution (CC BY) license (https://creativecommons.org/licenses/by/4.0/).
Copyright: This open access article is published under a Creative Commons CC BY 4.0 license, which permit the free download, distribution, and reuse, provided that the author and preprint are cited in any reuse.


