
Submitted:
01 October 2024
Posted:
02 October 2024
You are already at the latest version
Abstract
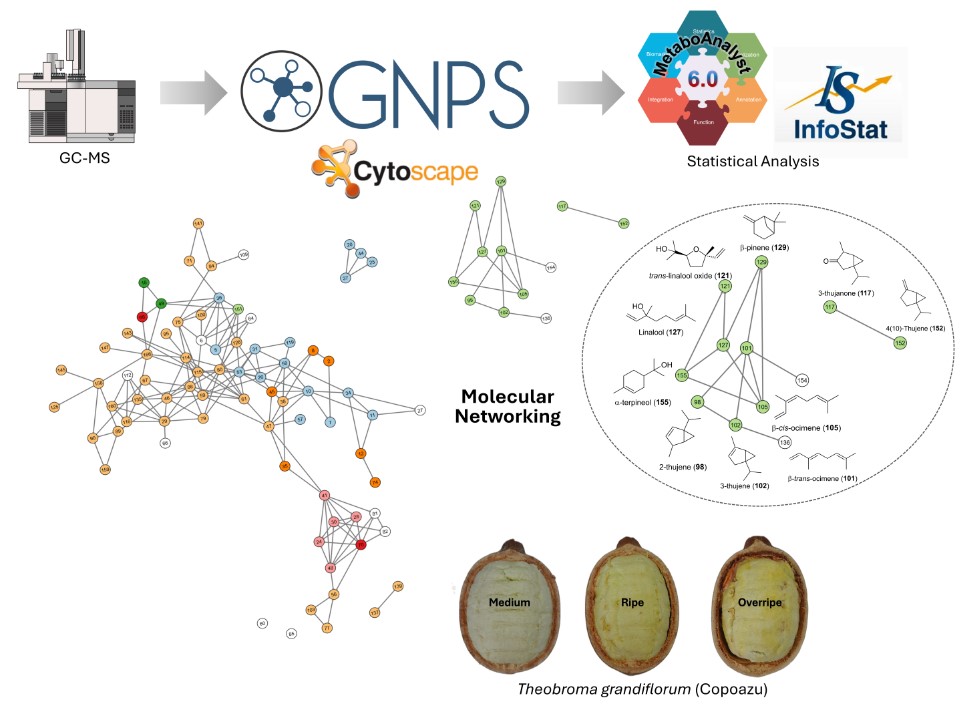
Theobroma grandiflorum (copoazu) is a plant native to South America that is cultivated in countries within the Amazon region. Its phytochemical composition imparts characteristic organoleptic properties, making it an exotic fruit. In this study, headspace solid-phase microextraction (HS-SPME) combined with gas chromatography-mass spectrometry (GC-MS) was employed to identify the volatile organic compounds (VOCs) produced by copoazu. Initially, optimal sample pretreatment conditions were determined using a design of experiments (DoE) approach. Analysis of the volatile profiles enabled the identification of 103 copoazu VOCs during three ripening stages. 97 VOCs were classified based on their chemical compound families using spectral correlation analysis in different libraries and databases, as well as their molecular networks. Additionally, a volatilomic analysis was conducted to study the variation in VOCs in the three ripening stages of copoazu. Through molecular network analysis, it was determined that the VOCs emitted by the fruit are correlated with the interconversion of compounds, which is observed when studying the metabolic pathways. The results provide a detailed analysis of the copoazu volatilome and will provide insight into the organoleptic characteristics of this Amazonian fruit. Esters and terpenes such as α-terpineol, β-pinene, linalool, 2-methylbutyl butanoate, 3-methylbut-2-enoic acid, 2-methylpentyl ester, ethyl 4-methylpentanoate, vinyl acetate, isobutyl hexanoate among others were found as potential biomarkers in the copoazu ripening process.
Keywords:
Theobroma grandiflorum
; HS-SPME
; GC-MS
; Volatilomics
; Molecular Networking
1. Introduction
The Amazon region is the foremost reservoir of plant genetic resources globally, boasting numerous Theobroma species under intensive cultivation [1]. Theobroma grandiflorum (copoazu) has garnered considerable attention in both domestic and international markets owing to its significant bioeconomic, biotechnological, and horticultural potential [2]. Copoazu cultivation spans Colombia, Bolivia, Peru, Ecuador, and Brazil [3,4]. The Amazon is the primary production hub, yielding approximately 20,000 tons per year, with pulp production accounting for 3400 tons [4]. Notably, copoazu cultivation in Colombia is concentrated in Amazonas, Caquetá, Putumayo, and Guaviare, with fruit butter exports to Brazil being predominantly utilized in the cosmetic industry [5].
Copoazu fruit is characterized by its excellent texture, flavor, and aroma, and its economic significance lies in the utilization of its pulp, seeds, and peel [6]. It is attributed to its therapeutic potential owing to its nutritional and bioactive properties that are beneficial to human health, thereby garnering interest in the food, cosmetic, and pharmaceutical industries. The pulp is mucilaginous and ranges in color from white to cream or creamy yellow. It is marketed fresh or processed and is used in the production of food products such as jams, ice creams, juices, and yogurt [3]. It also contains a high proportion of starch, pectin, polysaccharides, and dietary fiber, primarily insoluble fiber, which enhances the sensory and textural parameters of dairy products [7]. The seeds contain significant levels of fat and fatty acids, such as oleic, linoleic, and stearic acids, which are important in the diet [8]; hence, an analog of chocolate called "cupulate" or "cupulado" is produced [2,9].
Volatile organic compounds (VOCs) serve as crucial quality indicators and commercial attributes that dictate the acceptability of fruits and their derived products, given their role in shaping organoleptic characteristics such as flavor and aroma [10]. Throughout the ripening process, VOCs are regulated and synthesized by various metabolic pathways, rendering the ripening stage a pivotal determinant of fruit sensory traits [11]. A profound understanding of the volatile profile during ripening facilitates the examination of industrially relevant compounds [12], thereby elevating the value of the fruit and its derivatives as functional food items. Research on copoazu VOCs predominantly highlights esters, trailed by terpenes and alcohols, notably ethyl butanoate, ethyl hexanoate, and linalool [13]. Diverse extraction techniques such as vacuum distillation, solid-phase extraction, and liquid-liquid extraction have been employed for such analyses [13,14,15,16,17]. Nonetheless, most of these methods require multiple steps, contaminating reagents, and long analysis times. Conversely, solid phase microextraction (SPME) in headspace (HS) mode circumvents solvent usage, offering heightened sensitivity, selectivity, versatility, and cost-effectiveness. By using HS-SPME, extraction, concentration, desorption, and sampling are integrated, improving the complex sample pretreatment procedures that affect the efficient determination of VOCs [18,19].
In the optimization of key factors in HS-SPME, such as extraction time and temperature, salting-out, sample quantity, equilibration time, and temperature, the one-factor-at-a-time (OFAT) approach is typically employed [20]. However, this method has certain drawbacks: it requires numerous experiments, it cannot discern interactions between factors, and it often fails to achieve a global optimal response. Design of Experiments (DoE) is a multivariate statistical approach used to identify the effects of individual and interactive variables, facilitating the simultaneous determination of optimal parameter settings for each factor while minimizing time and cost expenditures in analyses [21,22,23]. Response Surface Methodology (RSM) is commonly employed to visualize optimal values, enabling the identification of process weaknesses and assessment of relationships between factors and responses [24,25]
Gas chromatography coupled to mass spectrometry (GC-MS) is an automated, versatile, robust, and reproducible analytical technique that is extensively employed to analyze VOCs across diverse matrices. However, processing a large amount of multidimensional data generated by GC-MS analysis can be cumbersome. Therefore, it is crucial to employ multivariate statistical methods to gain a deeper understanding of the volatile profile of a sample and condense the vast volumes of generated data. Volatilomics is an area of omics sciences tasked with studying the biochemistry of plants, fruits, and microorganisms by analyzing the composition of VOCs to understand the eco-physiological, environmental, and genetic aspects through the study of metabolic networks [26].
This study represents a groundbreaking effort in the comprehensive analysis of VOCs in copoazu using HS-SPME-GC-MS combined with DoE optimization and a volatilomics approach. To our knowledge, this is the first instance where a multivariate statistical method has been applied to optimize HS-SPME conditions specifically for the analysis of copoazu VOCs, with a particular focus on the fruit ripening stages. This novel approach not only enhances the extraction and analysis of VOCs but also provides new insights into the metabolic changes that occur during fruit ripening. Our findings contribute significantly to the existing knowledge by offering a detailed volatile profile of copoazu, which can elevate its value in various industries, such as food, cosmetics, and pharmaceuticals.
2. Materiales and Methods
2.1. Chemicals and Materials
Divinylbenzene/carbon wide-range/polydimethylsiloxane (DVB/CWR/PDMS) 80 µm × 10 mm fiber (Agilent, Switzerland) and a manual SPME holder (Supelco, USA) were used for the HS-SPME-GC-MS analysis. Liquid nitrogen was obtained using a Philips System (Netherlands). Sodium chloride from Sigma-Aldrich. The standards used for the identification of VOCs were a Terpene mixture 1, 21 components, and 2,500 µg/mL in hexane (DR. EHRENSTORFER, USA) and Fragrance Allergen Mix A1 (Supelco, Switzerland). HPLC grade formic acid ≥ 98% (LiChropur, Germany) and methanol ≥ 99,9 % (Honeywell, Seelze, Germany) were used as mobile phase and extractant solution preparation for HPLC analysis. Ultrapure water was obtained using a Heal Force Smart Mini System (Shanghai, China).
2.2. Copoazu Collection and Processing
Copoazu fruits were purchased at local market in Paujil, Caquetá, Colombia, (1°37'01.9" N' 75°17'49." W). Fruits at three stages of maturity (medium, ripe, and overripe) were stored at room temperature and transported to the laboratory. The pulp was separated from the peel and seeds, followed by freezing at -80°C. Subsequently, half of the pulp was stored in hermetically sealed bags, while the other half was preserved in borosilicate glass jars for subsequent lyophilization.
2.3. VOCs Analysis and Optimization
2.3.1. Analysis of Volatile Metabolites Using HS-SPME-GC-MS
Briefly, 750 mg of copoazu pulp previously ground with liquid nitrogen was weighed and added to a 20 mL headspace vial. Then, the headspace glass vial was tightly capped with a silicon septum and pre-equilibrated for 6 min at 60 °C on an oil bath. An 80 µm × 10 mm DVB/CWR/PDMS fiber was then driven into the headspace vial to extract the volatile metabolites for 30 min under the temperature of 60 °C. The fiber was then desorbed at 250 °C for 5 min in the injection port of the GC-MS in the splitless injection mode, following conditions previously reported [27].
VOCs were separated on a capillary GC column composed of 5% Phenyl/95% Dimethyl Polysiloxane (30 m × 0.25 mm × 0.25 μm) from SGE brand (Austin, TX, USA) and analyzed by using a Gas Chromatograph HP 6890 Series equipped with an Agilent Mass Selective Detector 5973 (Agilent Technologies, Palo Alto, CA, USA). The heating ramp was optimized for analyses as described below, starting at 35 °C for 0.5 min, then increased at 1 °C/min to 40 °C, raised to 60 °C at 1.5 °C/min, finally ramped at 5 °C/min to 120 °C, and held for 1 min. The carrier gas was performed with high-purity helium (99.999%) and, the flow rate was set at 1.3 mL/min. The mass spectrometer was operated under the following conditions: ionization mode, electronic ionization; ion source temperature, 230 °C; electron energy, 70 eV; the quadrupole mass range, 30–300 amu; the transmission line temperature, 230 °C; detector voltage, 1.4 kV; quadrupole temperature, 150 °C. The VOCs were tentatively identified based on a comparison of the mass spectra of all detected metabolites with those in NIST 17.0, and GNPS libraries. Additionally, the terpene mixture (Terpene mixture1, 21 components, 2,500 µg/mL in hexane and the allergen mix (Fragrance Allergen Mix A1) were used at a concentration of 600 ppm. The peak area normalization method for relative quantitative calculation was used to calculate the relative percentage content of each compound in copoazu samples in three ripening stages.
2.3.2. Optimization of Analysis Conditions using Desing of Experiments
For the optimization of copoazu VOCs extraction, a 2 × 3 factorial design was employed, incorporating the exposure time of SPME fiber (15, 30, and 45 min) and exposure temperature of SPME fiber (40, 60, and 80 °C) as variables. Optimal conditions were assessed using the relative area of peaks present in the three maturity states of the copoazu pulp as the response variable. The experimental design was conducted using the statistical software Minitab (version 19.1) [23]. Table S1 presents the randomized conditions generated by the program, along with the corresponding number of experiments carried out.
Figure 1.
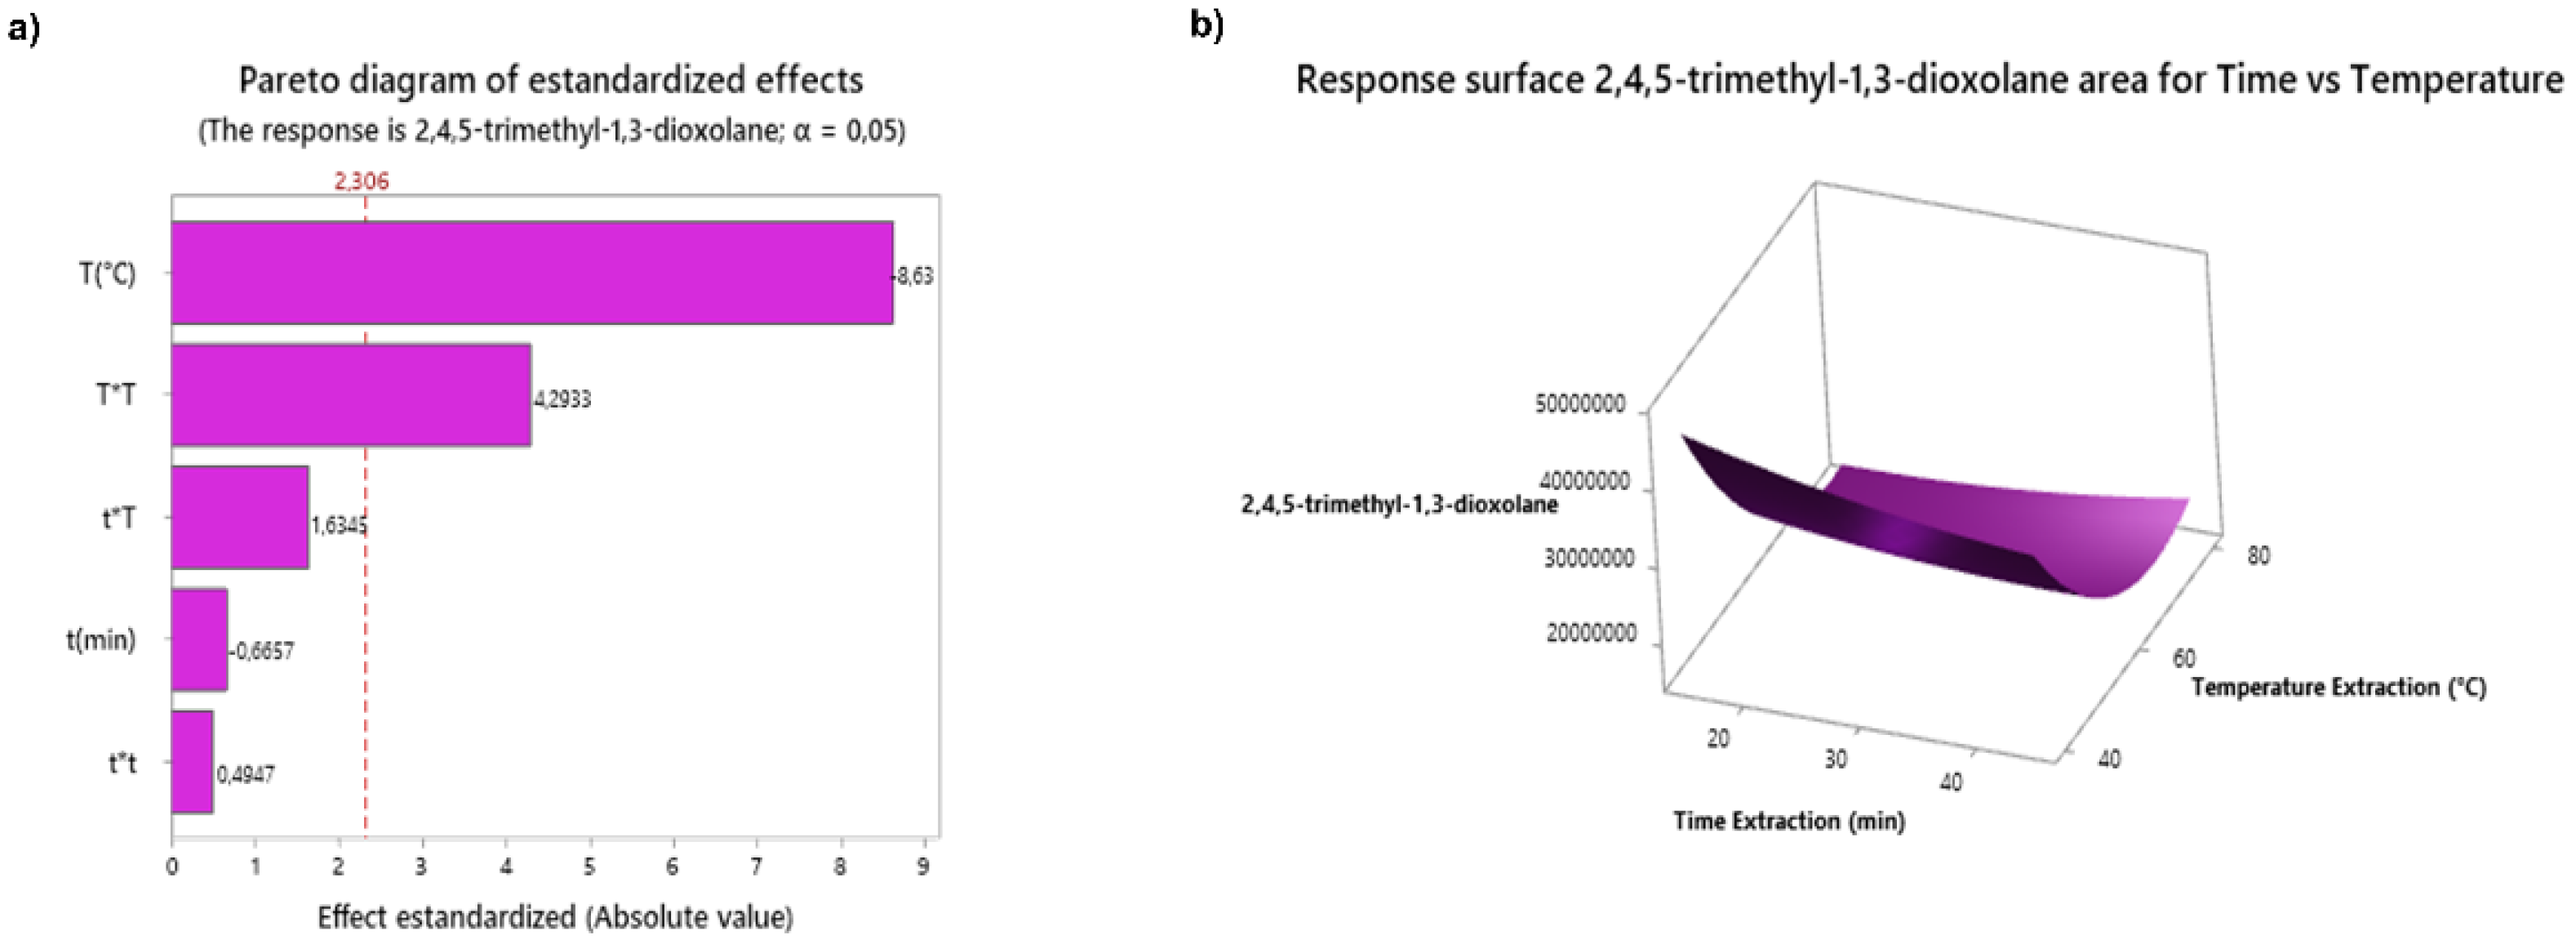
a) Pareto diagram of standardized effects of 2,4,5-trimethyl-1,3-dioxolane. b) Response surface plot of the area of 2,4,5-trimethyl-1,3-dioxolane for the extraction time vs. temperature. b) depicts the response surface plot of the area of 2,4,5-trimethyl-1,3-dioxolane as a function of extraction time and temperature. The compound area reached optimal values at 15 min and at 40°C, with an increasing trend at temperatures below 60°C. The same behavior was observed in the response surface plot of the areas of isoamyl alcohol, ethyl 2-methylbutanoate, and isoamyl acetate as a function of the extraction time and temperature (Fig. S3b, S5b, and S6b). Hexanal reached the optimal temperature and time values across the entire studied interval (40-80°C) and (15-45 minutes), respectively, with a trend of increasing up to 30 min and 60°C and then decreasing (Fig. S4b). The optimal conditions depended on the compound. Therefore, based on the response optimization of the five VOCs, the optimal extraction time and temperature were determined to be 27 min and 40°C, respectively.
Figure 1.
a) Pareto diagram of standardized effects of 2,4,5-trimethyl-1,3-dioxolane. b) Response surface plot of the area of 2,4,5-trimethyl-1,3-dioxolane for the extraction time vs. temperature. b) depicts the response surface plot of the area of 2,4,5-trimethyl-1,3-dioxolane as a function of extraction time and temperature. The compound area reached optimal values at 15 min and at 40°C, with an increasing trend at temperatures below 60°C. The same behavior was observed in the response surface plot of the areas of isoamyl alcohol, ethyl 2-methylbutanoate, and isoamyl acetate as a function of the extraction time and temperature (Fig. S3b, S5b, and S6b). Hexanal reached the optimal temperature and time values across the entire studied interval (40-80°C) and (15-45 minutes), respectively, with a trend of increasing up to 30 min and 60°C and then decreasing (Fig. S4b). The optimal conditions depended on the compound. Therefore, based on the response optimization of the five VOCs, the optimal extraction time and temperature were determined to be 27 min and 40°C, respectively.
2.3.3. Quality Control
To ensure the accuracy of the analysis and proper interpretation of the results, appropriate quality control (QC) must be carried out. During the sample preparation, QC was performed in the following manner: blank column analysis for monitoring carry-over and blank sample analysis for monitoring the memory effect on SPME fibers. Column and fiber blanks were performed prior to metabolite analysis and intermediate fiber blanks were performed during and after the analysis sequence.
2.4. Data Treatment, Metabolite Annotation and Molecular Networking
GC-MS data were first collected on the Agilent MSD Chemstation software (.D) and were translated using the Agilent GC MSD translator. Data underwent conversion to mzML format using ProteoWizard’s msConvert software (version 3.0) [28] and were uploaded to MassIVE (https://massive.ucsd.edu). The data were processed using MSHub deconvolution workflow [29] to generate a spectrum file (.mgf) and a quantification table (.csv). These files were directly used as input for GNPS’s molecular-library search-GC workflow.
The processed data were exported to Agilent MassHunter Quantitative software for integration purposes. Also, the data was filtered for reproducibility and presence by estimating the coefficient of variation (CV) of the intensity of the signals in the samples. Molecular characteristics with CV > 30% were excluded from further analysis. Data with complete absence or presence within each group were retained for subsequent analysis. The data obtained was then normalized using autoscaling, and a correction factor was performed using each sample's exact weight for statistical analysis [30].
An unsupervised principal component analysis (PCA) was performed to verify the reproducibility of the analytical platforms and sample distribution. To select statistically significant molecular characteristics throughout the different maturation stages, both univariate (UVA) and multivariate (MVA) statistical analyses were conducted. MetaboAnalyst 6.0 server was used for these analyses [31].
The metabolite annotation process was performed using different criteria such as searches in online databases, molecular ion, isotopic distribution, retention time (RT), MS spectra, fragmentation pathways, and metabolite standards. The annotation confidence levels were reported between 0 and 4 [32]. For the ID levels, 0 corresponds to an unambiguous 3D structure; 1 to a confident 2D structure or reference standard match; 2 to a likely structure or coincidence with literature spectra; 3 to a possible structure, confirmation with molecular formula; and 4 to an unknown feature or a basic match with libraries.
The databases and libraries employed for metabolite annotation were GNPS (Global Natural Products Social Molecular Networking, version 30; https://gnps.ucsd.edu; [29] and NIST (National Institute of Standards and Technology, library 2.2 version 2014). In this study, the FlavorDB database (https://cosylab.iiitd.edu.in/flavordb/) [33]was used to identify molecules with a known flavor profile.
Regarding GNPS libraries, a molecular network was created with the Library Search/Molecular Networking GC workflow at GNPS A spectrum similarity cosine score of <0.70, and at least 6 matched peaks were used to generate molecular networks using GNPS (version 30). Further, edges between two nodes were kept in the network if and only if each of the nodes appeared in each other’s respective top 10 most similar nodes. Finally, the maximum size of a molecular family was set to 100, and the lowest-scoring edges were removed from molecular families until the molecular family size was below this threshold. Also, VOCs were annotated by GNPS library search using a balance score of 65% to guarantee that only spectra with high quality were searched against the library (considered high confidence matches, <65%) [34].
2.5. Characterization of Copoazu Maturation Stages
2.5.1. pH and Total Soluble Solids (TSS)
Fruit pH was determined by dissolving 1 g of pulp in 5 mL of distilled water using a potentiometer (PHS-3BW Microprocessor/mV/Temperature Meter, China). Total soluble solids (TSS) in the pulp juice were assessed using a refractometer (Eloptron, Schmidt + Haensch, Germany). Each assay was conducted in triplicate for each fruit maturation state.
2.5.2. ATR-FTIR Analysis
The lyophilized and pulverized pulp was directly placed on the attenuated total reflectance (ATR) crystal of a Fourier transform infrared spectroscopy (FTIR) instrument (IR Tracer-100, SHIMADZU, Madison. USA) equipped with LabSolutions software. Spectra were recorded in the range of 400-4000 cm-1. Both the background and sample were scanned 32 times at a resolution of 8 cm-1. Before each sample analysis, air was used as background [37].
2.5.3. Carotenoids Analysis by HPLC-DAD
Carotenoids were extracted using 250 mg of previously lyophilized copoazu pulp and 4 ml of methanol:formic acid solution (99:1; v/v), taken ultrasonicated (Bransonic 1510R-MT) for 20 min, and centrifuged (Thermo, Centra CL3) for 10 min at 3500 rpm. The supernatant was evaporated to dryness. A stock solution of 10.000 ppm dried extract was prepared with methanol, filtered through a 0.45 µm PTFE membrane, and analyzed into HPLC using an ultrahigh-performance liquid chromatographer Dionex UltiMate 3000 equipped with diode array detection (DAD). Raw data was acquired and processed using the Xcalibur 4.3 software. Both equipment and software are Thermo Scientific (San Jose, CA, USA). The chromatographic separation was performed using conditions previously published [38] at 30°C. Thus, 10 µL for sample was injected on a YMC-C30 column (150 x 4.6 mm i.d., 3 µm particle size; YMC America, Inc., Devens, MA, USA) protected with a SecurityGuard Cartridge Phenomenex C18 (4 x 2 mm, 3 µm particle size) pre-column. The mobile phase consists of 400 mg/L of ammonium acetate dissolved in a solvent mix of methanol:methyl tert-butyl ether:water (80:18:2 v/v/v, for solution A and 8:89:3 v/v/v, for solution B) with a total running time of 40 min. DAD was performed over the entire UV–vis range (240–600 nm), and the characteristic absorbances of the carotenoids were extracted at 450 nm.
2.5.4. Statistical Analysis for the Characterization of Maturation States of Copoazu
For the univariate analysis, the experiments were carried out in duplicate. Results are presented as mean ± Standard Deviation (SD). Data obtained were subjected to analysis of variance (ANOVA) employing the software InfoStat (version 2020). Multiple comparisons of means (p-value ≤ 0.05) were performed using generalized linear mixed model analysis (GLMM); as a post hoc test, the LSD-Fisher test was performed [39]
3. Results and Discussion
3.1. Analysis of Volatile Metabolites Using HS-SPME-GC-MS
To enhance the sensitivity and selectivity of HS-SPME for VOCs, various parameters were initially evaluated during sample pretreatment. The assessed parameters included maceration with liquid nitrogen, freezing at -80°C, lyophilization, salting-out effect with a 30% NaCl solution (w/v), and ultrasound treatment. The sample macerated with liquid nitrogen significantly affected the chromatographic peak area, exhibiting a 37% increase in the relative peak area compared with the other treatments (Fig S1a). The volatile compounds reported in Table 1: linalool (127), ethyl hexanoate (89), 2-methylpentanoic anhydride (68), and 2-methyl-3-buten-2-ol (5), were significantly different (p < 0.05) across all treatments, with a higher relative area observed with nitrogen maceration (Fig S1b). The enhanced resolution and increased number of chromatographic peaks were associated with the augmented surface area of the matrix [40]. Additionally, liquid nitrogen freezes the sample, preventing loss or enzymatic degradation of VOCs during maceration [41]. Contrary to expectations, lyophilization not only sublimated water but also removed VOCs from the copoazu pulp, resulting in decreased sensitivity in chromatographic analysis. Using salting-out, the sensitivity may increase or decrease depending on the biological matrix characteristics and salt concentration [42]. A decrease in the relative areas of the peaks in the copoazu chromatogram was observed in this study. Likewise, prolonged treatment of the sample involving the use of an ultrasound bath could generate the loss of VOCs, leading to a decrease in the peaks of the metabolites analyzed [43]. Because of the decreased analytical sensitivity when lyophilization and salting-out were employed, neither step was included in the sample preparation for VOC analyses in this study.
To increase chromatographic sensitivity, different quantities of copoazu pulp previously macerated with liquid nitrogen were evaluated, including 150, 300, 600, 900, and 1200 mg. Fig S2 illustrates the variation in the relative areas of the 11 representative chromatographic peaks with respect to sample quantity. The relative area of linalool increased to 900 mg and decreased at 1200 mg, whereas the areas of the other compounds did not vary significantly. Based on the above, 750 mg was established as the optimal mass amount, because increasing the sample amount above 900 mg tends to reduce and suppress the volatilization of VOCs, preventing adsorption on SPME; similar behavior has been reported in the analysis of melon samples [44]. Additionally, equilibrium times of 6, 12, and 18 min before fiber exposure to the sample were compared, and no statistically significant effect was observed with increasing time. Thus, 6 min was selected as the optimal equilibrium time.
3.2. DoE
The extraction time and exposure temperature conditions were optimized using DoE. For the modeling of the 3D graphs, the relative areas of the five compounds present in the three ripening stages of copoazu were chosen as the response variables: 2,4,5-trimethyl-1,3-dioxolane, isoamyl alcohol, hexanal, ethyl 2-methylbutanoate, and isoamyl acetate. Additionally, a Pareto diagram of standardized effects was generated for each of the mentioned compounds (Fig 1a), revealing that for 2,4,5-trimethyl-1,3-dioxolane, temperature (T) (40-80°C) and temperature × temperature (T*T) had a significant effect on the response variable (p < 0.05), whereas the time factor (t) and the time-temperature interaction (t*T) had no significant effect. Moreover, temperature and time had negative effects, indicating that a decrease in these values increased the compound area. The same behavior was observed for isoamyl alcohol, ethyl 2-methylbutanoate, and isoamyl acetate (Fig S2a, S4a, and S5a, respectively). In contrast, for hexanal (Figure S3a), none of the factors had a significant effect.
3.3. Maturation State Indices
The fruit maturation states were established according to the results of physicochemical analyses, which showed an increase in pH and SST values as the maturation state progressed (Table S2). Similar results have been reported for bananas, mangoes, papaya, and blueberries [45,46]. However, pH did not increase significantly.
3.3.1. Characterization of Copoazu Maturation States by ATR-FTIR
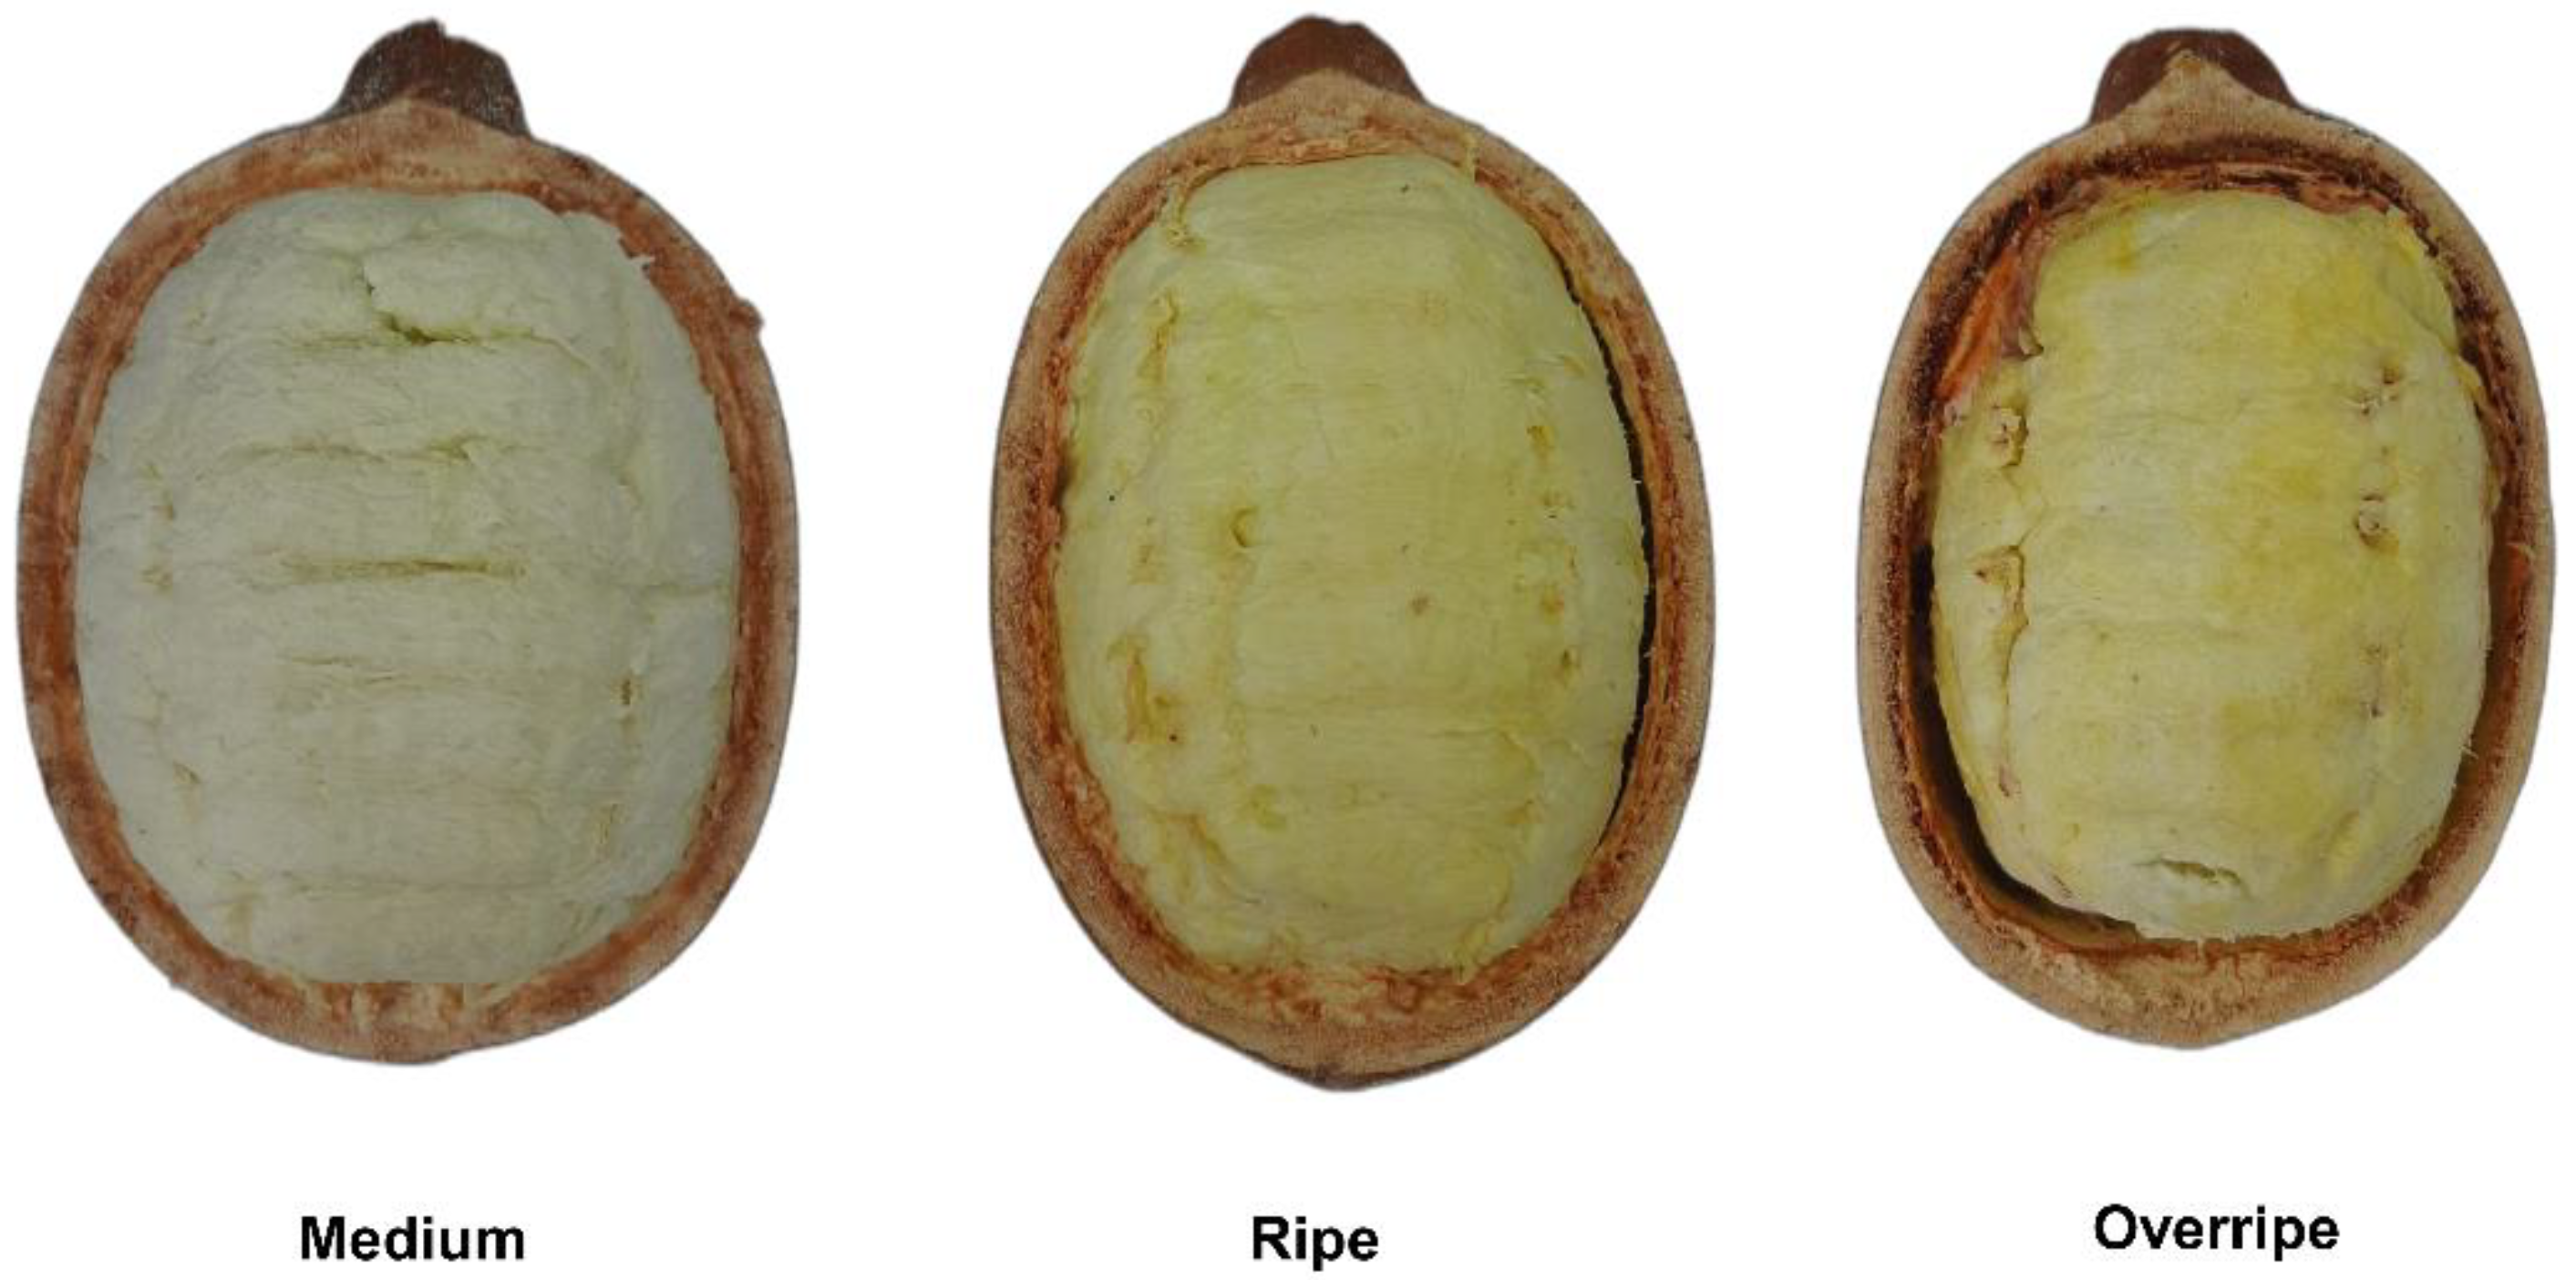
Fig. S7 of the overlaid FTIR spectra of the three studied maturation states is similar; however, depending on the copoazu development stage, some bands increase in intensity while others disappear. The absorption band at 1589.34 cm-1 increases as the maturation state progressed. This is attributed to carotenoid compounds owing to C-C stretching in highly conjugated double-bond systems [47]. The increased intensity of the band coincided with an increase in carotenoid content, wich is responsible for the pale-yellow color of the pulp of the ripe copoazu (Fig. 2). Conversely, the bands at 1226.73 and 1712.79 cm-1 decrease with copoazu maturation. Bands corresponding to the stretching vibrations of the C-C(O)–C and (C=O...H) bonds are related to compounds of the cell wall formed by polysaccharides, such as cutin, phenolic compounds, and pectin [48,49]. During maturation, polysaccharides degrade, intensifying the organoleptic properties of fruits [50].
Figure 2.
Ripening stages of copoazu. Longitudinal cut of the fruit. .
3.3.2. Carotenoid Analysis by HPLC-DAD
Carotenoids are responsible for the yellow, orange, and red coloration of fruits and microorganisms [51,52]. To explain the characteristic color of the very ripe copoazu pulp, screening was performed using HPLC. Carotenoid identification was carried out by analyzing the absorbances in the UV-visible region, retention times observed on a C30 column, and comparison with spectral data from the literature [53,54]. Table S3 lists the tentative identification of seven copoazu carotenoids, mostly xanthophylls (zeaxanthin, lutein, luteoxanthin, antheraxanthin, neoxanthin, β-carotene, and (all-E)-lutein 3’-O-palmitate), as the major compound with a retention time of 4.48 min [55,56] (Fig. S8).
3.4. Volatilomics and Molecular Networking Analysis
A total of 103 VOCs in copoazu at the three ripening stages were analyzed. The identified compounds included 17 alcohols and polyols, 13 monoterpenoids, three ethers, six 1,3-dioxanes and 1,3-dioxalanes, two dicarboxylic acid derivatives, 42 esters, ten carbonyl compounds (aldehydes, ketones, and acyloins), four other compounds, and six unknowns (Table 1). Using the NIST and GNPS libraries, molecular ions, isotopic distribution, retention time, and fragmentation patterns were used to identify VOCs. GNPS addresses the challenges of analyzing electronic ionization (EI) data through advanced computational methods, such as unsupervised non-negative matrix factorization, facilitating effective deconvolution and co-analysis of large datasets [29]. In addition, terpenoid standards (STD) were used, and the confidence level was assigned according to the identification criteria described in Section 2.4. These results are in agreement with those previously reported for copoazu [13,14,15,17]. However, to date, no comparative studies have been reported on the volatile profile of copoazu at different stages of maturation.
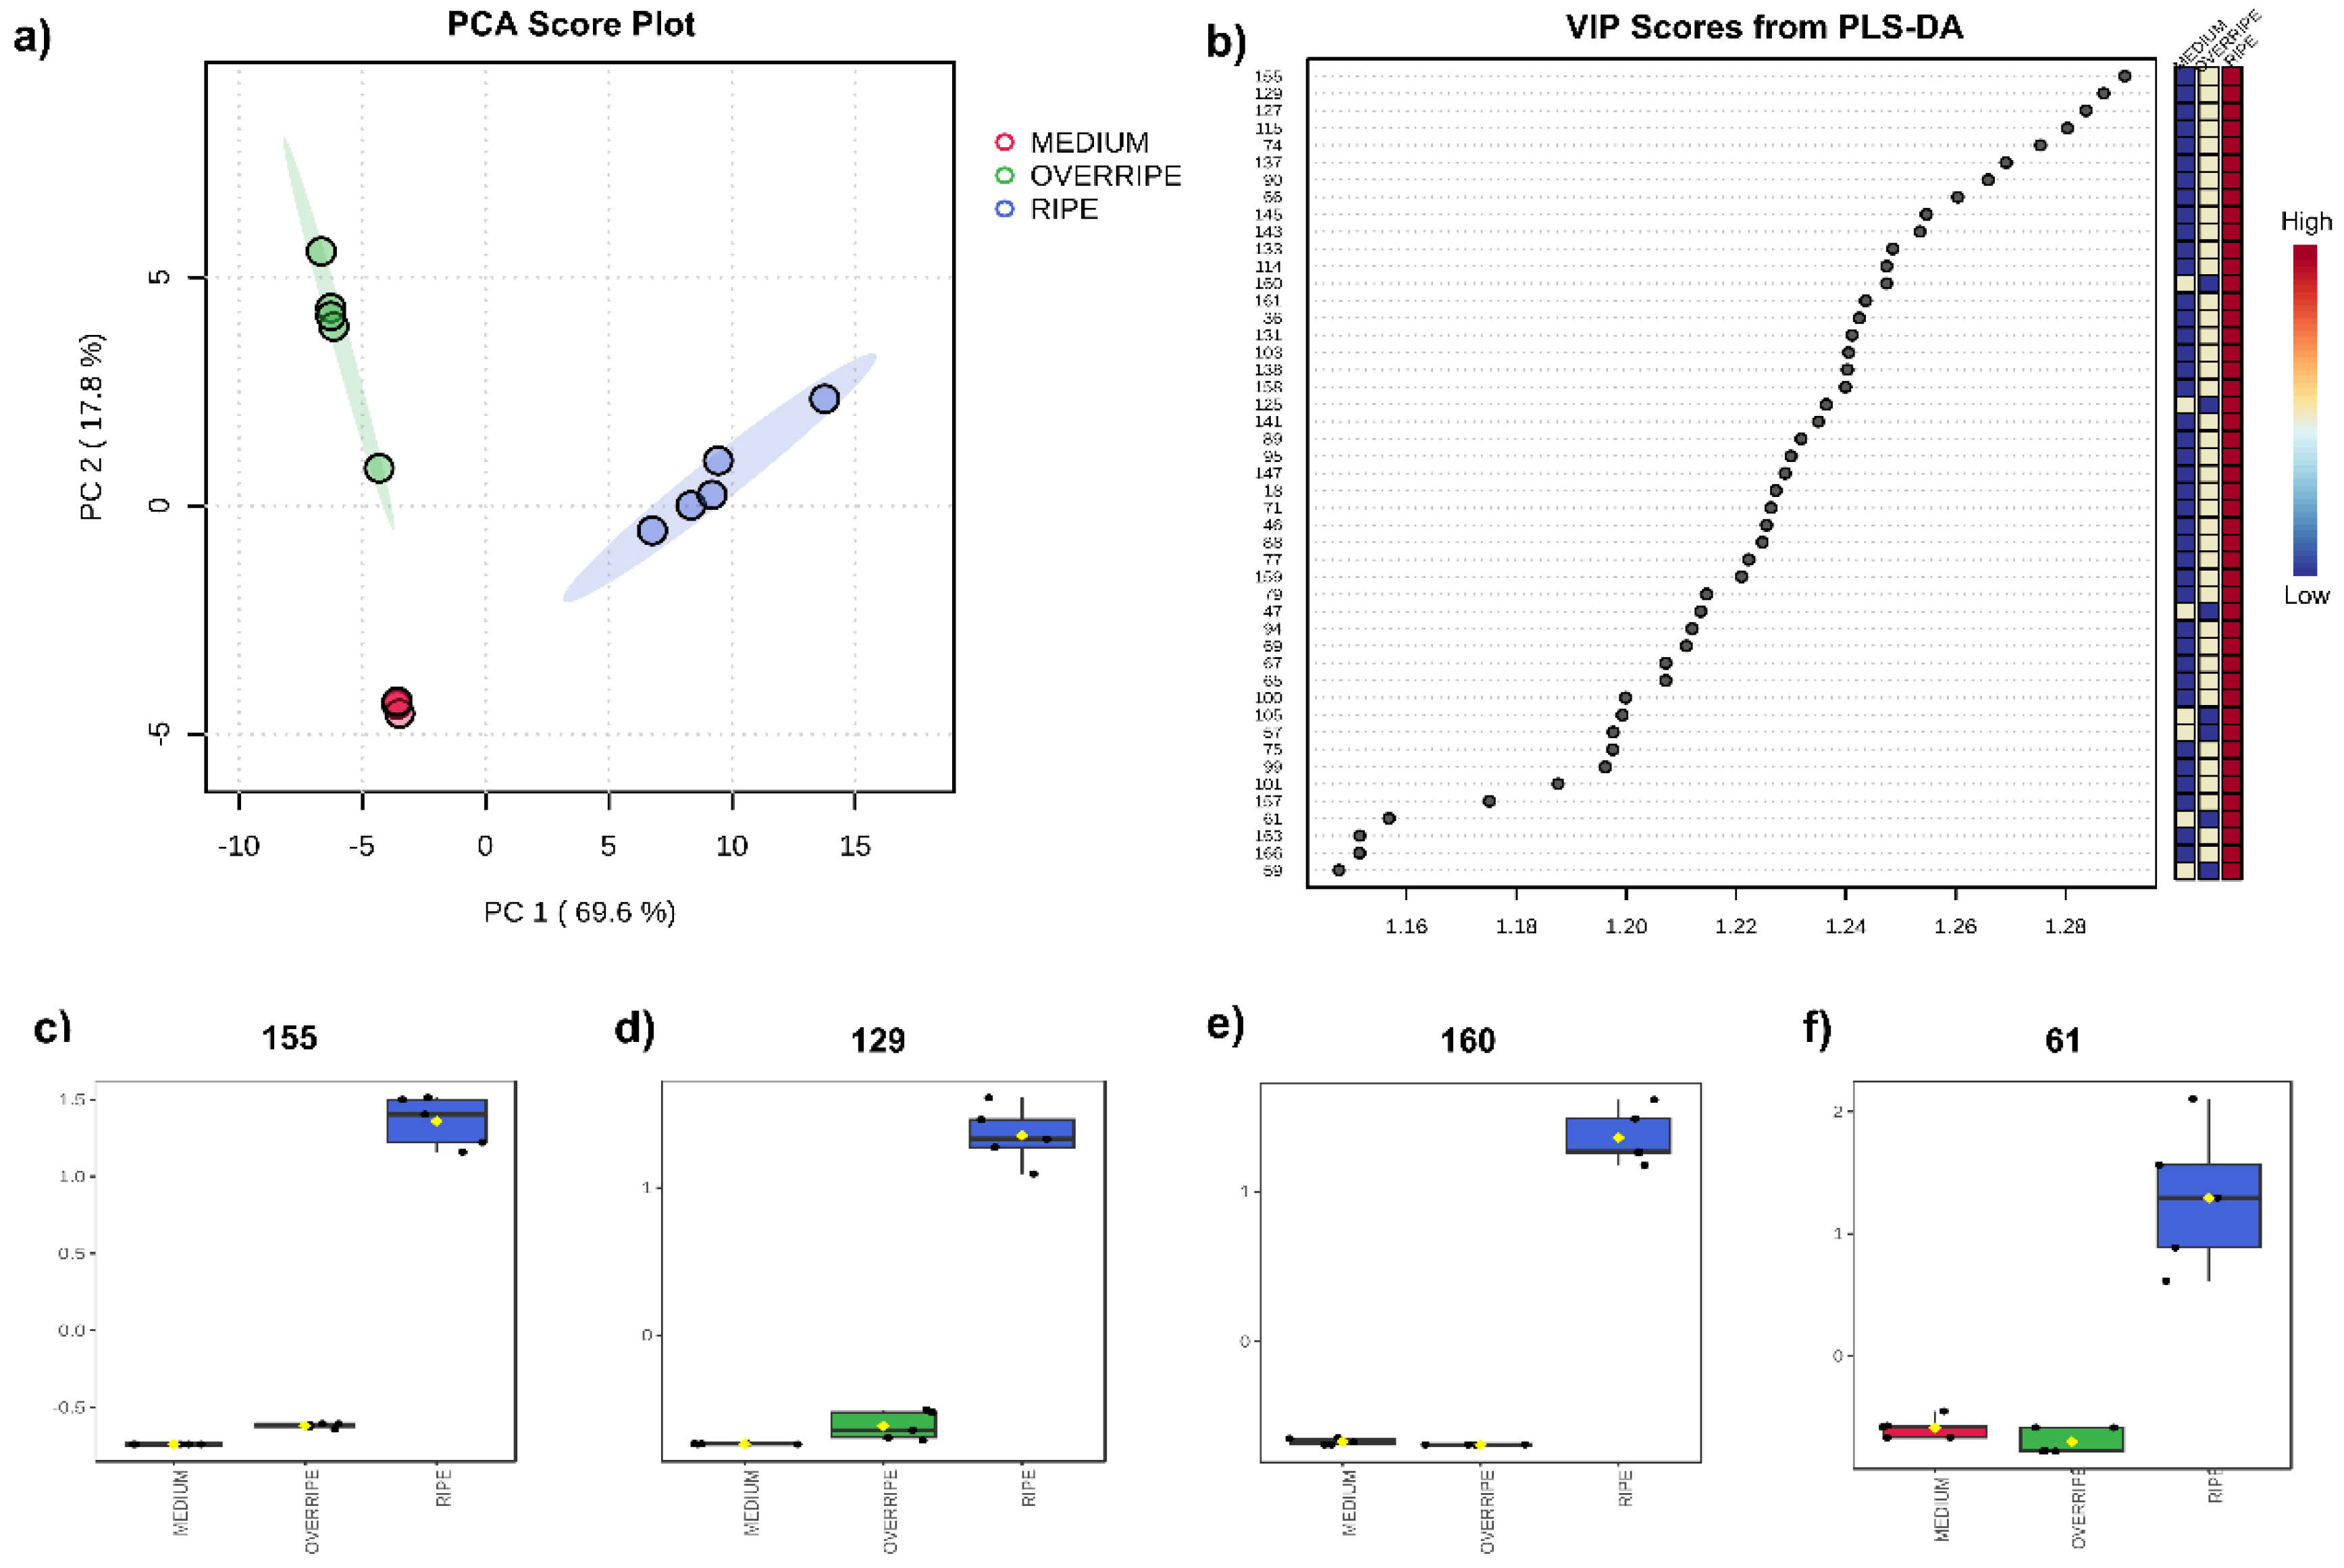
A volatilomic study was conducted to analyze the variation in VOCs and their correlation in the three ripening stages of copoazu. The study included multivariate statistical analysis and molecular networking to correlate the compounds. Principal component analysis (PCA) was conducted to differentiate the volatile profiles during the maturation stages of copoazu. Fig. 3A shows that components (PC1 and PC2) accounted for 87.4% of the variance in the data. Furthermore, analysis revealed three distinct clusters, each corresponding to a specific ripening stage. These clusters demonstrate a significant variation in the volatile profile of Amazonian fruits based on the stage of ripening.
The VIP scores (Fig. 3B) displayed 47 significant VOCs that allowed differentiation of the three maturation stages with a VIP > 1. The VOCs were found in high concentrations in the ripe stage, middle concentrations in the overripe stage, and low concentrations in the medium stage. However, the compounds ethylene glycol butyrate (160), propyl hexanoate (125), butyl acetate (47), β-cis-ocimene (105), 2,2-dimethylvaleric acid (57), 2-methylbutyl acetate (61), and isoamyl acetate (59) were produced in the medium state, reached a maximum concentration in the ripe state, and then decreased in concentration in the overripe state. It is also noticeable that esters and terpenes, such as α-terpineol (155), β-pinene (129), and linalool (127), predominate with VIP > 1.28, followed by 2-methylbutyl butanoate (115), 3-methylbut-2-enoic acid, 2-methylpentyl ester (137), ethyl 4-methylpentanoate (90), vinyl acetate (66), and isobutyl hexanoate (145) with VIP > 1.26. These results would demonstrate that these compounds have potential as biomarkers for the maturation process of copoazu. Some of these compounds, such as linalool, α-terpineol, butyl acetate, and isoamyl acetate, have already been identified in previous studies [13]; however, this is the first time they have been identified as biomarkers of maturation stage in copoazú using the VIP score graph.
Figure 3.
(A) PCA score plot for the three maturation stages. (b) VIP score plots derived from the PLS-DA analysis, displaying the discriminant features at the three maturation stages, with PLS-DA cross-validation parameters R2= 0.95332 and Q2 = 0.90824, indicating good predictive capability. (c-f) Box plots from the ANOVA of the normalized molecular features α-Terpineol (155), β-Pinene (129), ethylene glycol dibutyrate (160), and 2-methylbutyl acetate (61), respectively.
In the ripe stage, some of the VOCs with the highest concentration (relative peak area) that, according to PCA, distinguish this stage from the others two are: ethyl butanoate (46), butyl acetate (47), prenyl acetate (71), butyl 2-methylbutanoate (77), butyl butanoate (88), ethyl hexanoate (89), isopentyl 2-methylpropanoate (114), 3-methylbut-2-en-1-yl pivalate (141), propyl hexanoate (125), and 2-ethylphenyl acetate (163). These VOCs highlight that the flavor is attributed to short-chain esters with distinct fruity and sweet flavor profiles [33]. Although terpenoids are present at lower concentrations, they are notable differentiators for this maturation stage. Specifically, β-trans-ocimene (105) contributes citrus and floral notes, while β-pinene (129) imparts green and woody flavors. In the overripe stage, the VOCs with the highest concentration that distinguish this stage from others are predominantly alcohols. The odor notes among these compounds—2-methyl-3-buten-2-ol (5), isobutyl alcohol (7), 1-penten-3-ol (11), 3-pentanol (14), 2-methylbutanol (27), 1-pentanol (31), 2,3-butanediol (44), 3-ethoxy-3-methyl-2-butanone (62), pentan-2-yl propyl carbonate (116), and 2-ethyl-1-hexanol (119)—including oily, herbal, fruity, and sweet profiles [33]. Additionally, the terpenoids 3-thujanone (117), terpinen-4-ol (151), and 4(10)-thujene (152) share notes of spice, woody, and turpentine [33], further contributing to the distinct aroma profile of the overripe state. In the medium stage, the most concentrated VOCs are isoamyl alcohol (26), hexanal (45), and 2-methyl-1-butanol (27) with flavor notes of fruity and alcoholic nuances. This study demonstrates the influence of ripening stages on the organoleptic properties of copoazu and provides insights into the potential market acceptability of the fruit.
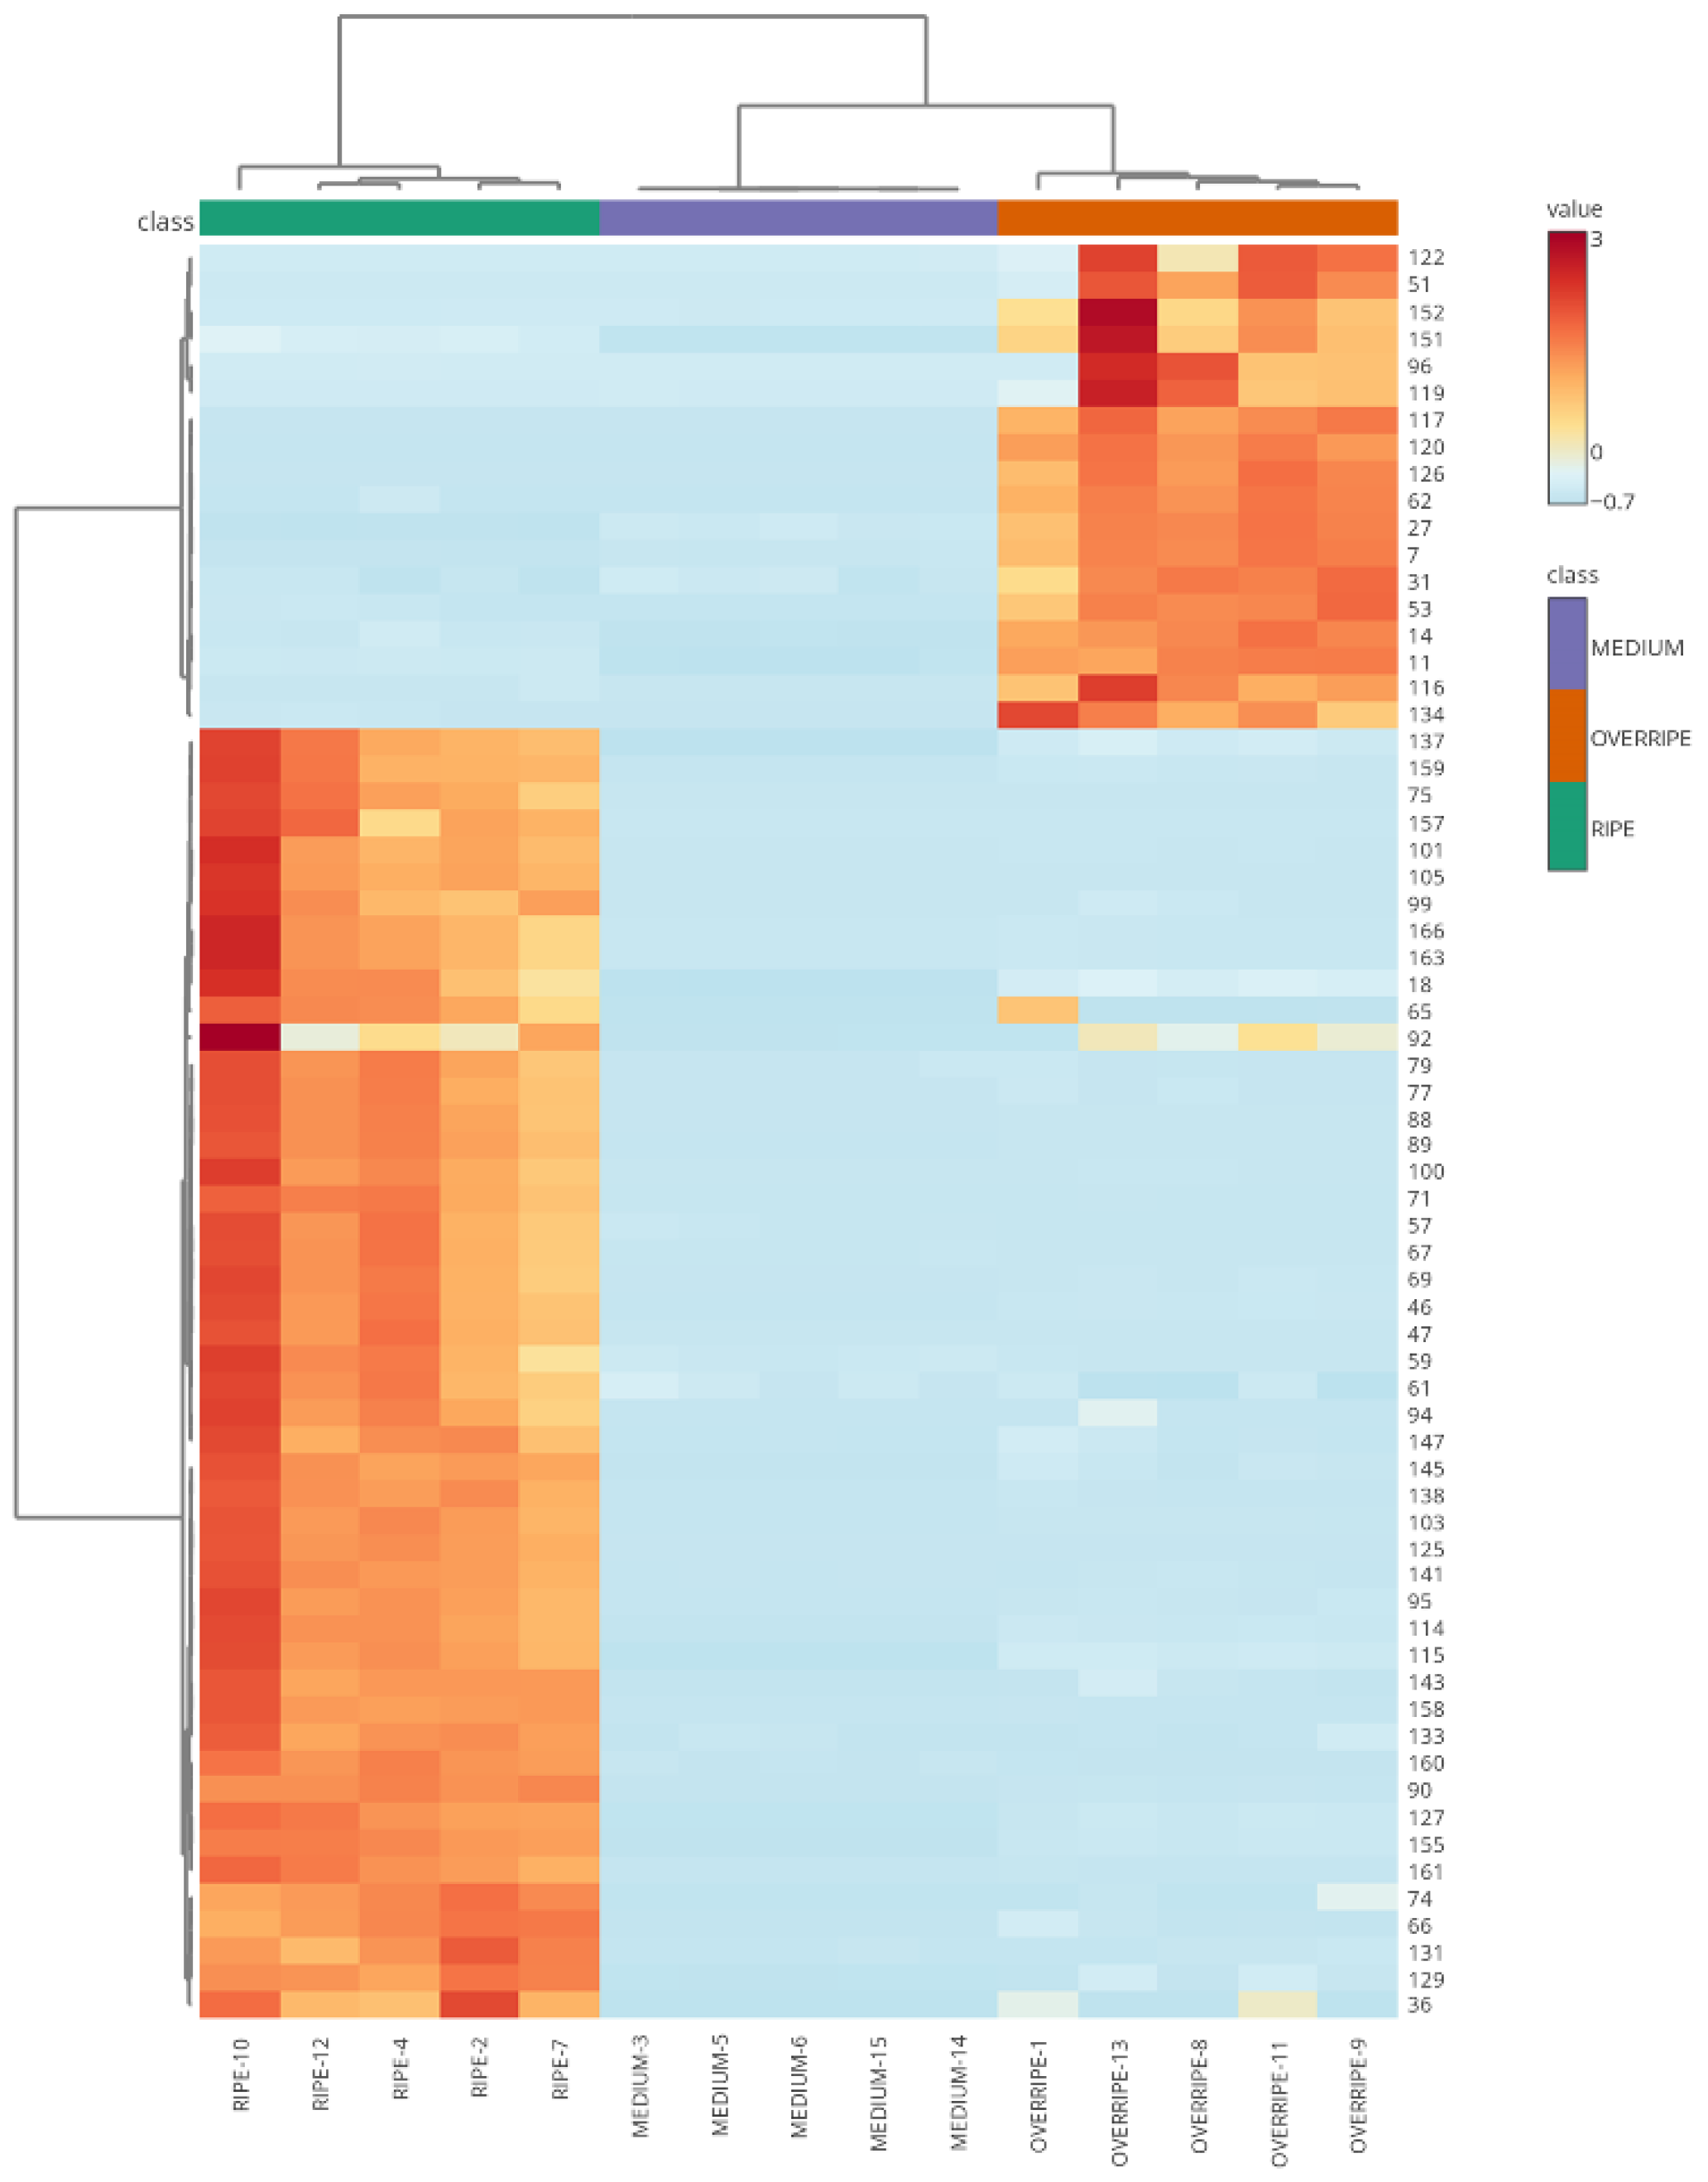
The heatmap in Fig. 4 shows the similarities of the copoazu samples as a function of the concentrations of the 66 significant VOCs (p-value> 0.05) at different stages of maturation. According to the graph, fruits in the medium and overripe stages of ripening share more similarities, which makes them cluster. On the other hand, ripe fruits had a greater Euclidean distance, indicating a different composition of VOCs compared to the other ripening stages. During medium maturation, late stages of the biosynthetic metabolic pathways of VOCs may occur, that is, volatiles continue to be produced, whose principal function is to protect the growing organ against pathogens and predators [57]. Additionally, compounds present in the medium stage can act as precursors of molecules biosynthesized in the ripe stage, such as isoamyl alcohol, a precursor in the biosynthesis of esters such as isoamyl acetate [58]. In the overripe stage, alcohols such as 1,3-butanediol (20), isoamyl alcohol (119), 2-methylbutanol (27), 2-methylpropan-1-ol (7), 1-pentanol (31), 2-ethyl-1-butanol (53), 3-pentanol (14) and 1-penten-3-ol (11) were predominant. This observation is consistent with the report by Klie et al. [59] that ethylene alters fruit metabolism, leading to a climacteric respiratory rise that promotes the biosynthesis of alcoholic substrates that are later used to form esters. In addition, fruits emit alcohol in response to the stress caused by microorganisms or fermentation. For instance, when caimarone grapes metabolize sugars and aliphatic acids, such as tartaric, citric, and malic acids, they generate 2,3-butanediol isomers that have fruity notes or a bread/banana aroma, depending on their levo or meso stereochemistry [60]. In contrast, the ripe stage of copoazu has a higher content of VOCs, particularly esters, which contribute significantly to its characteristic odor. Esterified compounds have been reported to be the most representative of the mature stage in strawberries [61] and purple passion fruit [62]. That is, in the mature stage of the copoazu, VOCs peaked at harvest. Esters can be divided into two groups: carboxylic acid derivatives such as isoamyl acetate (59), 2-methylbutyl acetate (61), prenyl acetate (71), ethyl butyrate (46), pentyl isobutyrate (95) and fatty acid derivatives such as butyl acetate (47), ethyl hexanoate (89), butyl hexanoate (158), isoamyl hexanoate (166), butyl butanoate (88), butyl 2-methylbutyrate (77), among others. Several of these esters are attributed to fruity, sweet, pineapple, apple, pear, and banana odors [63]. In addition, terpenes such as β-trans-ocimene (101), β-cis-ocimene (105), and D-Limonene (99) were detected in the ripe stage, whereas 3-thujanone (117) and terpinene-4-ol (151) were found in the overripe stage. According to Nagegowda et al. [64], terpenes undergo different enzymatic modifications, resulting in their vast chemical diversity. Also, Souza et al. [12] suggested that variation in the volatile profile is related to the biosynthesis of terpenoids, which depends on the biosynthesis and cleavage of carotenoids.
Figure 4.
Heatmap analysis of metabolite features associated with VOCs in copoazu. Variation and clustering of the three stages of fruit ripening according to the abundance of detected metabolites. The color spectrum ranging from red to blue indicates the range of high to low signal intensities for each metabolite.
Finally, a molecular network of the volatile profile was constructed (Fig. 5) to understand the biochemistry of VOCs in copoazu fruit during the three stages of maturation. The network consisted of clusters of compounds that were structurally related to spectral similarity. The network is composed mainly of seven families of compounds: esters (light green), alcohols and polyols (blue), monoterpenoids (green), dioxanes and dioxolanes (pink), carbonyl compounds (aldehydes, ketones, and acyloins) (light orange), and dicarboxylic acids and derivatives (red). These compounds are produced through various metabolic routes; fruits undergo biosynthesis to produce and emit regulated VOCs during development and ripening. For example, aldehydes (2, 8, 45), alcohols (7, 10, 26), and straight-chain esters (89, 125, 158) are derived from fatty acids and amino acids. They have a fresh and fruity aroma and are formed during the ripening period associated with a climacteric increase in respiration [65]. In contrast, branched-chain esters (90, 95, 145) are produced by isoleucine metabolism [66]. C6 and C9 aldehydes are formed via the lipoxygenase-hydroperoxide pathway, in which enzymes oxidize polyunsaturated fatty acids. Hexanal (45) is produced when the substrate is linoleic acid, [67].
A study conducted by Liu et al. [66] identified VOCs present in three varieties of apples during fruit development and found that hexanal (45) decreased as the fruits ripened. This decrease is related to ester biosynthesis, because alcohol dehydrogenase reduces aldehydes in the fatty acid and isoleucine degradation pathways to their corresponding alcohols, which are metabolized to esters by the action of alcohol acetyltransferases [68]. The wide variety of esters found in copoazu can be explained by the esterification of linear, branched, or aromatic alcohols with acyl-CoA, which is produced by the oxidative decarboxylation of pyruvate, giving rise to acetyl-CoA. Acyl-CoA produces ethyl esters, whereas acetyl-CoA generates acetate esters [69].
Figure 5.
Molecular network from volatilomic profile of the copoazu in three ripening stages.In the molecular network, the biochemical correlation of the compound families is evidenced by the observation that the aldehydes butanal (2) and 3-methylbutanal (8) are precursors of the alcohols butan-1-ol (10) and 3-methylbutanol (26), and the esters resulting from metabolism, such as butyl acetate (38). In contrast, in the network dioxane/dioxolane groups are formed by metabolites such as 2,4,5-trimethyl-1,3-dioxolane isomers (24, 28, 30) and 2,4-dimethyl-1,3-dioxane (41). According to Yu et al. [70], this compound is formed by the condensation between acetaldehyde and 2,3-butanediol or ethanol.
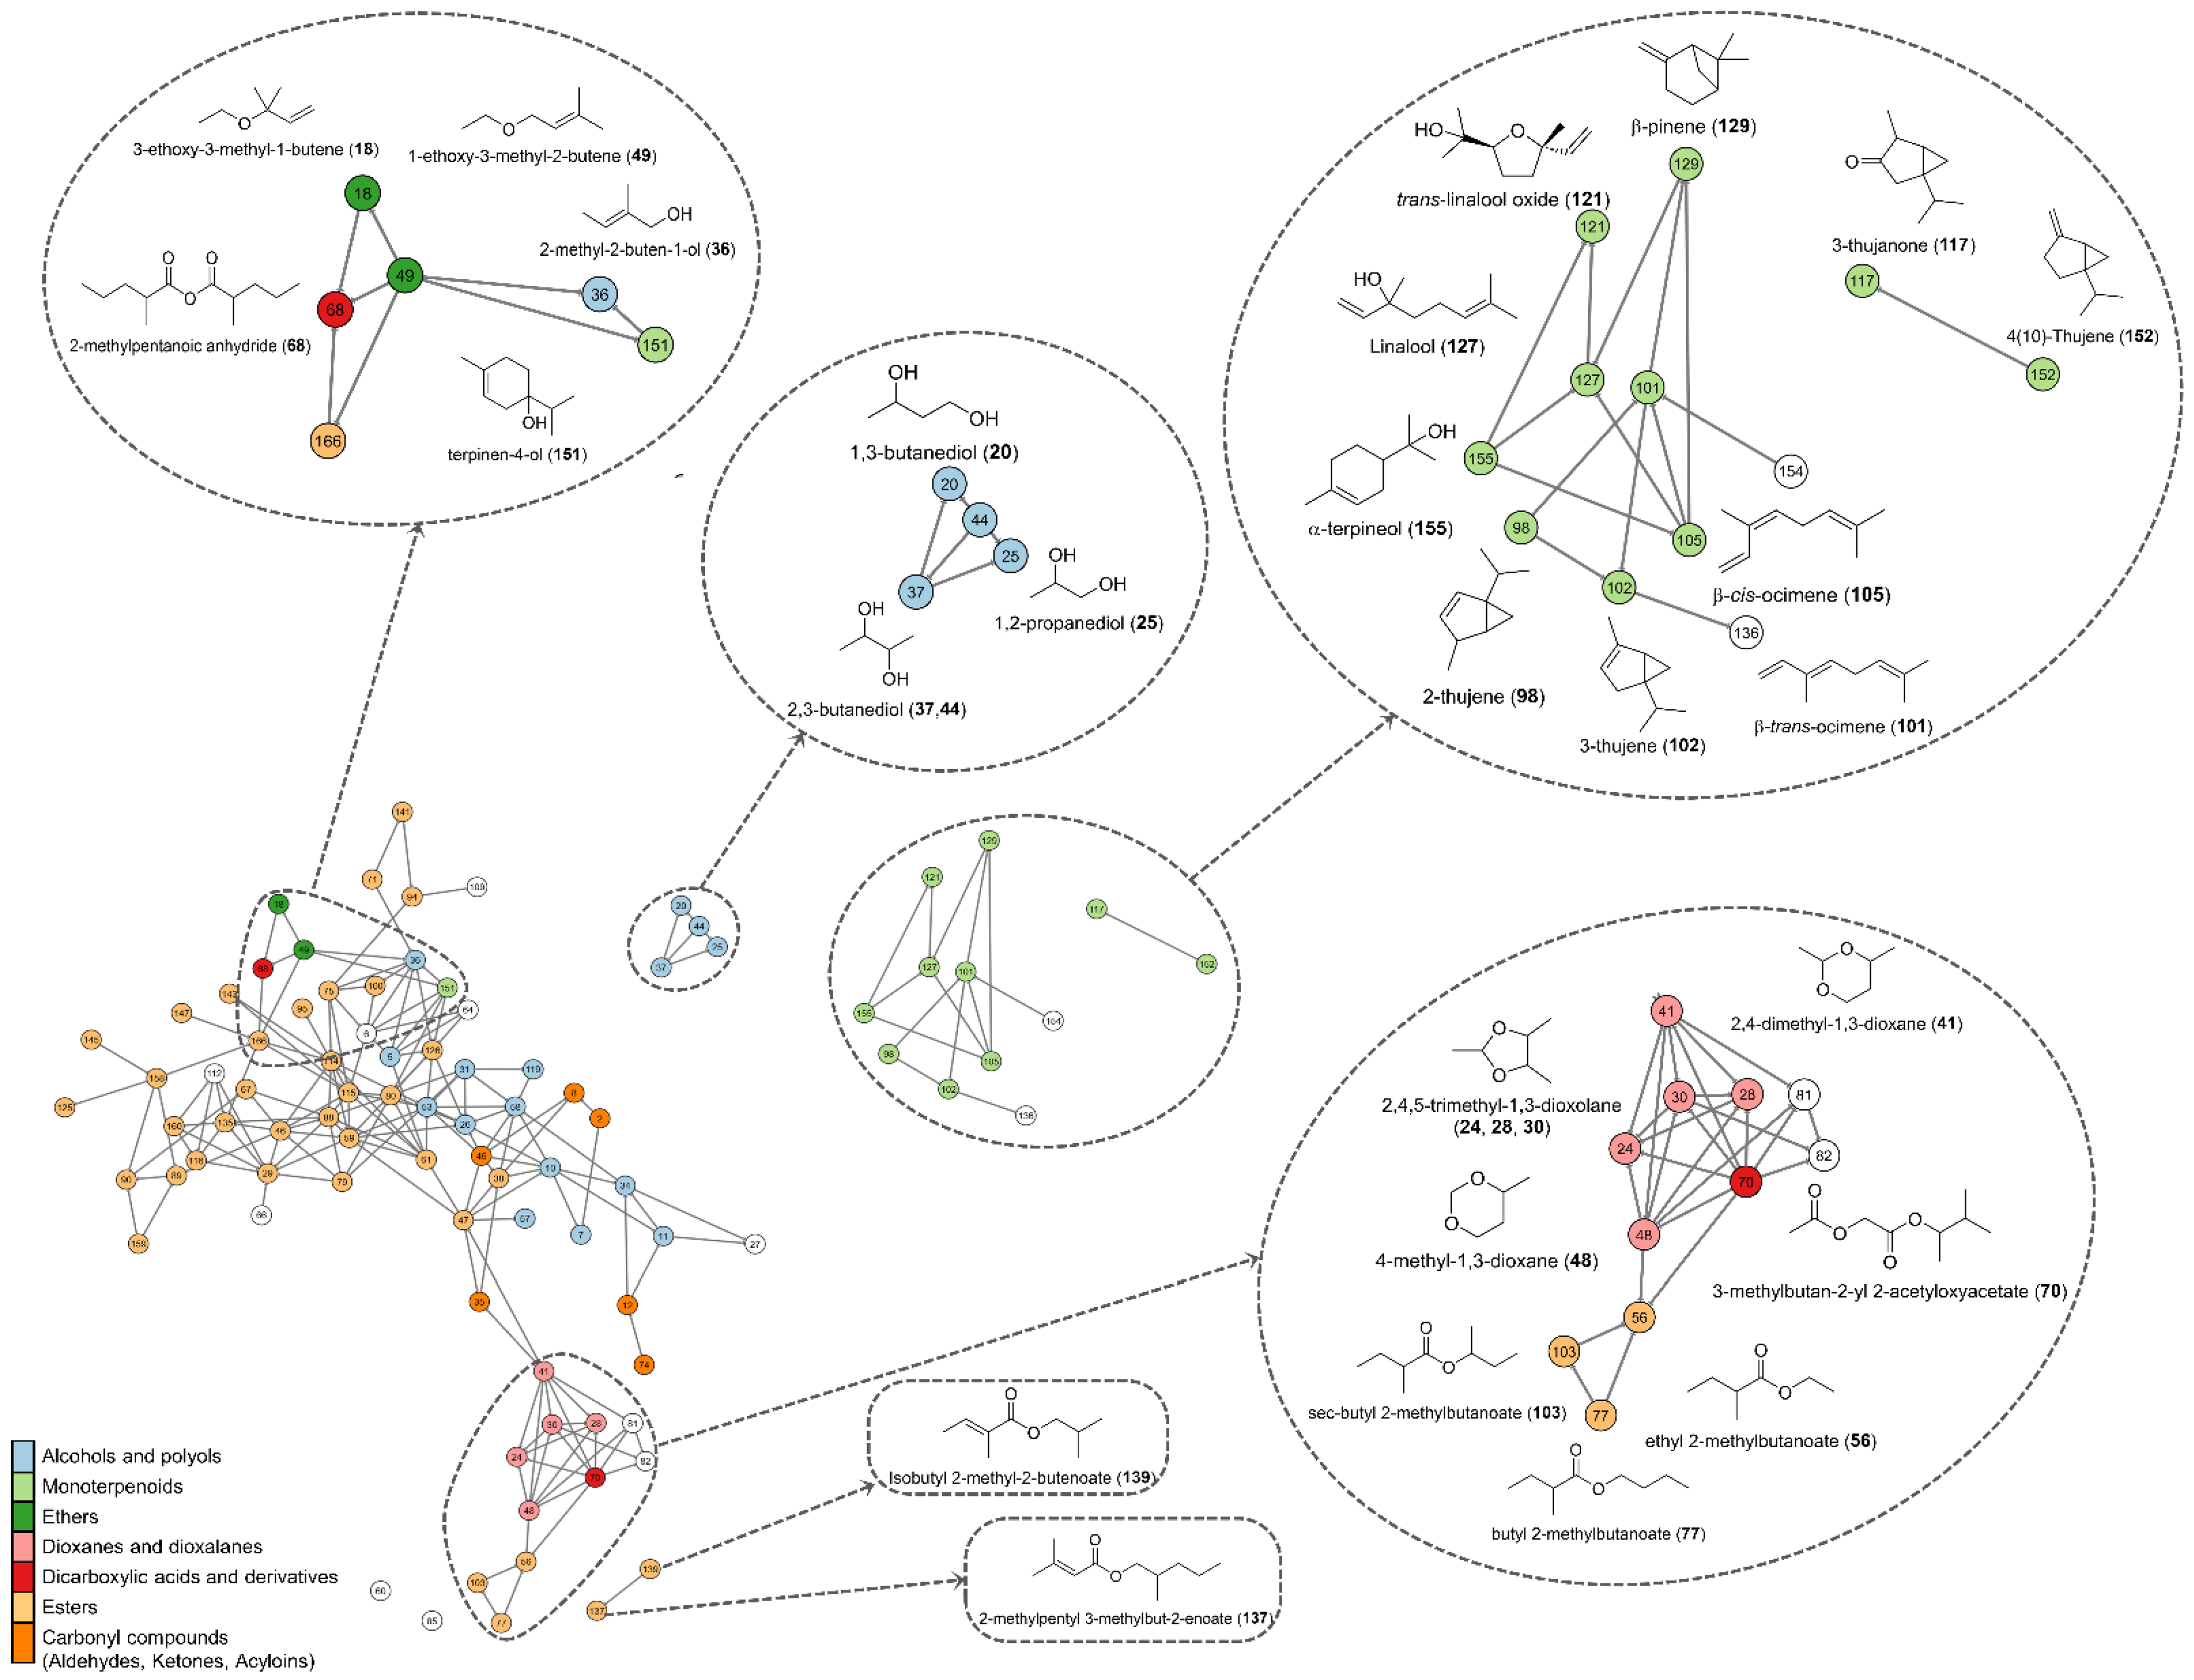
The correlation between color due to carotenoids and variation in volatile terpenes could be associated with the 2-c-methylerythritol 4-phosphate (MEP) pathway that produces both families of compounds [67]. In this case, the increase in the percentage of terpenes in the ripening stage coincided with the results obtained in the ATR-FTIR spectroscopic analysis, in which spectral bands characteristic of carotenoids were found, in addition to the characterization of these compounds by HPLC. Furthermore, in the molecular network, a well-defined cluster of monoterpenoids (127, 129, 155, 101, etc.) and trans-linalool oxide (121) was observed, separated from the main cluster, possibly correlated with the increase in the ripening state of copoazu.
The aromatic composition of fruits also depends on several factors, such as: climatology, edaphology, time of harvest, pre- and post-harvest treatments, variety, phenological stage of the fruit [71], storage, fruit condition (whole, sliced, wet, dry), type of analysis (field or laboratory), [19] and VOC extraction technique. Some studies have reported the influence of similar factors on the volatile profiles of sweet pepper [72] and highbush blueberry [73]. Therefore, although most of the VOCs reported in the copoazu were identified, these results could also vary owing to the previously discussed variables. In addition, it was confirmed that the volatile profile of copoazu depended on the maturation stage.
4. Conclusions
This study presents a comprehensive analysis of the volatilome of Theobroma grandiflorum at three different maturation stages (medium, ripe, and overripe), using HS-SPME-GC-MS analysis and molecular networks. Additionally, the use of DoE for optimizing sample preparation and SPME conditions helped develop a simple extraction process, improving the sensitivity of VOC analysis. The conditions for the extraction of VOCs were achieved using 750 mg of the sample macerated with liquid nitrogen and an SPME fiber equilibration time of 6 min. In addition, by DoE, the optimal extraction time and temperature were determined to be 27 min and 40 °C, respectively.
The 103 VOCs exhibited variable abundances throughout the different maturation stages. The volatile profiles were analyzed using multivariate analyses, such as PCA and PLS-DA, which enabled the identification of specific VOCs that could serve as potential biomarkers for monitoring the ripening process of copoazu. Notable VOCs include α-terpineol, β-pinene, linalool, 2-methylbutyl butanoate, 3-methylbut-2-enoic acid, 2-methylpentyl ester, ethyl 4-methylpentanoate, vinyl acetate, and isobutyl hexanoate. Additionally, the ripe stage has emerged as a transitional stage in VOC production, with a potential biomarker showing a decrease in abundance in the overripe stage and absence in the medium stage due to the presence of precursors. Compounds that differentiated the odor of copoazu at different stages of maturation were identified. In the mature stage, the fruity, sweet, citric, and floral odors are attributed to esters and terpenes, whereas in the overripe stage, the alcohols are related to the herbal, woody, and turpentine odors.
On the other hand, the molecular network analysis enabled the visualization of structural relationships between various groups of volatile compounds, including esters, alcohols, monoterpenoids, and carbonyl compounds. The molecular network of VOCs evidenced the chemical similarities observed in the different families of compounds that correlated due to their biosynthetic pathways. The findings of this study provide a solid foundation for future studies. Further exploration of the biosynthetic mechanisms underlying VOCs production and the application of biomarker monitoring to optimize copoazu harvesting and processing are possible prospective applications in the food industry.
Supplementary Materials
The following supporting information can be downloaded at the website of this paper posted on Preprints.org.
Funding
This research was funded by the Sistema General de Regalías and MINCIENCIAS, grant number BPIN 2020000100031. Also, Universidad de la Amazonia, Universidad de los Andes, and Universidad del Valle.
CRediT authorship contribution statement
Mayrin Valencia: Methodology, Investigation, Formal analysis, Data curation. Mónica Pérez-Beltrán: Investigation, Formal analysis, Data curation. Gerson-Dirceu López: Writing – original draft, Writing – review & editing, Methodology, Conceptualization, Supervision. Chiara Carazzone: Writing – review & editing, Methodology, Funding acquisition, Conceptualization, Supervision. Paula Galeano: Writing – original draft, Writing – review & editing, Methodology, Funding acquisition, Conceptualization, Supervision.
Declaration of competing interest
The authors declare that they have no known competing financial interests or personal relationships that could have appeared to influence the work reported in this paper.
Data availability statement
All data from this research are available in this paper and supplementary material including the web links for the MSHub/GNPS jobs generated can be found in: https://gnps.ucsd.edu/ProteoSAFe/status.jsp?task=c047070e264a497984029f6890f194c3, https://gnps.ucsd.edu/ProteoSAFe/status.jsp?task=e865a49261d948cdae02d41081b6f2e8.
Acknowledgments
We would like to thank Dorrestein's lab and Mabel Gonzalez for their assistance in running the GNPS analysis. Furthermore, we acknowledge the support of Laura Ibarra during the analysis of VOCs at the Chemistry Department of Universidad de los Andes.
References
- E. Lagneaux, F. E. Lagneaux, F. Andreotti, C.M. Neher, Cacao, copoazu and macambo: Exploring Theobroma diversity in smallholder agroforestry systems of the Peruvian Amazon, Agroforestry Systems 95 (2021) 1359–1368. [CrossRef]
- V.A.C. de Abreu, R. V.A.C. de Abreu, R. Moysés Alves, S.R. Silva, J.A. Ferro, D.S. Domingues, V.F.O. Miranda, A.M. Varani, Comparative analyses of Theobroma cacao and T. grandiflorum mitogenomes reveal conserved gene content embedded within complex and plastic structures, Gene 849 (2023) 146904. [CrossRef]
- A.L.F. Pereira, V.K.G. A.L.F. Pereira, V.K.G. Abreu, S. Rodrigues, Cupuassu—Theobroma grandiflorum, Exotic Fruits Reference Guide (2018) 159–162. [CrossRef]
- D. Albuquerque da Silva, A. D. Albuquerque da Silva, A. Manoel da Cruz Rodrigues, A. Oliveira dos Santos, R. Salvador-Reyes, L.H. Meller da Silva, Physicochemical and technological properties of pracaxi oil, cupuassu fat and palm stearin blends enzymatically interesterified for food applications, LWT 184 (2023) 114961. [CrossRef]
- L.L. Orduz-Díaz, K. L.L. Orduz-Díaz, K. Lozano-Garzón, W. Quintero-Mendoza, R. Díaz, J.E.C. Cardona-Jaramillo, M.P. Carrillo, D.C. Guerrero, M.S. Hernández, Effect of Fermentation and Extraction Techniques on the Physicochemical Composition of Copoazú Butter (Theobroma grandiflorum) as an Ingredient for the Cosmetic Industry, Cosmetics 2024, Vol. 11, Page 77 11 (2024) 77. [CrossRef]
- T.F.S. Curimbaba, L.D. T.F.S. Curimbaba, L.D. Almeida-Junior, A.S. Chagas, A.E.V. Quaglio, A.M. Herculano, L.C. Di Stasi, Prebiotic, antioxidant and anti-inflammatory properties of edible Amazon fruits, Food Biosci 36 (2020) 100599. [CrossRef]
- M.P. Costa, M.L.G. M.P. Costa, M.L.G. Monteiro, B.S. Frasao, V.L.M. Silva, B.L. Rodrigues, C.C.J. Chiappini, C.A. Conte-Junior, Consumer perception, health information, and instrumental parameters of cupuassu (Theobroma grandiflorum) goat milk yogurts, J Dairy Sci 100 (2017) 157–168. [CrossRef]
- P.D. de Oliveira, D.A. P.D. de Oliveira, D.A. da Silva, W.P. Pires, C.V. Bezerra, L.H.M. da Silva, A.M. da Cruz Rodrigues, Enzymatic interesterification effect on the physicochemical and technological properties of cupuassu seed fat and inaja pulp oil blends, Food Research International 145 (2021) 110384. [CrossRef]
- S. Melo, J. S. Melo, J. Weltman, A. de Oliveira, J. Herman, P. Efraim, Cupuassu from bean to bar: Sensory and hedonic characterization of a chocolate-like product, Food Research International 155 (2022) 111039. [CrossRef]
- Y. Chen, X. Y. Chen, X. Wu, X. Wang, Y. Yuan, K. Qi, S. Zhang, H. Yin, PusALDH1 gene confers high levels of volatile aroma accumulation in both pear and tomato fruits, J Plant Physiol 290 (2023) 154101. [CrossRef]
- X. Chen, B. X. Chen, B. Fedrizzi, P.A. Kilmartin, S.Y. Quek, Development of volatile organic compounds and their glycosylated precursors in tamarillo (Solanum betaceum Cav.) during fruit ripening: A prediction of biochemical pathway, Food Chem 339 (2021) 128046. [CrossRef]
- F. das C. do A. SOUZA, E.P. F. das C. do A. SOUZA, E.P. SILVA, J.P.L. AGUIAR, Vitamin characterization and volatile composition of camu-camu (Myrciaria dubia (HBK) McVaugh, Myrtaceae) at different maturation stages, Food Science and Technology 41 (2021) 961–966. [CrossRef]
- C.E. Quijano, J.A. C.E. Quijano, J.A. Pino, Volatile compounds of copoazú (Theobroma grandiflorum Schumann) fruit, Food Chem 104 (2007) 1123–1126. [CrossRef]
- R. Boulanger, J. R. Boulanger, J. Crouzet, Free and bound flavour components of Amazonian fruits: 3-glycosidically bound components of cupuacu, Food Chem 70 (2000). [CrossRef]
- C. Cabral, D.J. C. Cabral, D.J. Charles, J.E. Simon, Volatile Fruit Constituents of Theobroma grandiflorum, 1991. [CrossRef]
- F. Augusto, A.L.P. F. Augusto, A.L.P. Valente, E. dos Santos Tada, S.R. Rivellino, Screening of Brazilian fruit aromas using solid-phase microextraction–gas chromatography–mass spectrometry, J Chromatogr A 873 (2000) 117–127. [CrossRef]
- M.R.B. Franco, T. M.R.B. Franco, T. Shibamoto, Volatile Composition of Some Brazilian Fruits: Umbu-caja (Spondias citherea), Camu-camu (Myrciaria dubia), Araça-boi (Eugenia stipitata), and Cupuaçu (Theobroma grandiflorum), J Agric Food Chem 48 (2000) 1263–1265. [CrossRef]
- J. Xie, X. J. Xie, X. Li, W. Li, H. Ding, J. Yin, S. Bie, F. Li, C. Tian, L. Han, W. Yang, X. Song, H. Yu, Z. Li, Characterization of the key volatile organic components of different parts of fresh and dried perilla frutescens based on headspace-gas chromatography-ion mobility spectrometry and headspace solid phase microextraction-gas chromatography-mass spectrometry, Arabian Journal of Chemistry 16 (2023) 104867. [CrossRef]
- C. Carazzone, J.P.G. C. Carazzone, J.P.G. Rodríguez, M. Gonzalez, G.-D. López, Volatilomics of Natural Products: Whispers from Nature, in: X. Zhan (Ed.), Metabolomics, IntechOpen, Rijeka, 2021: p. Ch. 4. [CrossRef]
- M. Marinaki, I. M. Marinaki, I. Sampsonidis, A. Lioupi, P. Arapitsas, N. Thomaidis, K. Zinoviadou, G. Theodoridis, Development of two-level Design of Experiments for the optimization of a HS-SPME-GC-MS method to study Greek monovarietal PDO and PGI wines, Talanta 253 (2023) 123987. [CrossRef]
- H. Ebrahimi, R. H. Ebrahimi, R. Leardi, M. Jalali-Heravi, Experimental design in analytical chemistry -Part I: Theory, J AOAC Int 97 (2014) 3–11. [CrossRef]
- R.S. Nunes, G.T.M. R.S. Nunes, G.T.M. Xavier, A.L. Urzedo, P.S. Fadini, M. Romeiro, T.G.S. Guimarães, G. Labuto, W.A. Carvalho, Cleaner production of iron-coated quartz sand composites for efficient phosphorus adsorption in sanitary wastewater: A design of experiments (DoE) approach, Sustain Chem Pharm 35 (2023) 101206. [CrossRef]
- P.G. Galeano, B.H. P.G. Galeano, B.H. Zimmermann, C. Carazzone, Hydrophilic interaction liquid chromatography coupled to mass spectrometry and multivariate analysis of the de novo pyrimidine pathway metabolites, Biomolecules 9 (2019). [CrossRef]
- M. Gorbounov, J. M. Gorbounov, J. Taylor, B. Petrovic, S. Masoudi Soltani, To DoE or not to DoE? A Technical Review on & Roadmap for Optimisation of Carbonaceous Adsorbents and Adsorption Processes, S Afr J Chem Eng 41 (2022) 111–128. [CrossRef]
- W.-H. Chen, M. W.-H. Chen, M. Carrera Uribe, E.E. Kwon, K.-Y.A. Lin, Y.-K. Park, L. Ding, L.H. Saw, A comprehensive review of thermoelectric generation optimization by statistical approach: Taguchi method, analysis of variance (ANOVA), and response surface methodology (RSM), Renewable and Sustainable Energy Reviews 169 (2022) 112917. [CrossRef]
- Baena, L.M. Londoño, G. Taborda, Volatilome study of the feijoa fruit [Acca sellowiana (O. Berg) Burret.] with headspace solid phase microextraction and gas chromatography coupled with mass spectrometry, Food Chem 328 (2020) 127109. [CrossRef]
- Lua. Vazquez, Maria. Celeiro, Meruyert. Sergazina, Thierry. Dagnac, Maria. Llompart, Optimization of a miniaturized solid-phase microextraction method followed by gas chromatography mass spectrometry for the determination of twenty four volatile and semivolatile compounds in honey from Galicia (NW Spain) and foreign countries, Sustain Chem Pharm 21 (2021) 100451. [CrossRef]
- M.C. Chambers, B. M.C. Chambers, B. MacLean, R. Burke, D. Amodei, D.L. Ruderman, S. Neumann, L. Gatto, B. Fischer, B. Pratt, J. Egertson, K. Hoff, D. Kessner, N. Tasman, N. Shulman, B. Frewen, T.A. Baker, M.Y. Brusniak, C. Paulse, D. Creasy, L. Flashner, K. Kani, C. Moulding, S.L. Seymour, L.M. Nuwaysir, B. Lefebvre, F. Kuhlmann, J. Roark, P. Rainer, S. Detlev, T. Hemenway, A. Huhmer, J. Langridge, B. Connolly, T. Chadick, K. Holly, J. Eckels, E.W. Deutsch, R.L. Moritz, J.E. Katz, D.B. Agus, M. MacCoss, D.L. Tabb, P. Mallick, A cross-platform toolkit for mass spectrometry and proteomics, Nature Biotechnology 2012 30:10 30 (2012) 918–920. [CrossRef]
- A.A. Aksenov, I. A.A. Aksenov, I. Laponogov, Z. Zhang, S.L.F. Doran, I. Belluomo, D. Veselkov, W. Bittremieux, L.F. Nothias, M. Nothias-Esposito, K.N. Maloney, B.B. Misra, A. V. Melnik, A. Smirnov, X. Du, K.L. Jones, K. Dorrestein, M. Panitchpakdi, M. Ernst, J.J.J. van der Hooft, M. Gonzalez, C. Carazzone, A. Amézquita, C. Callewaert, J.T. Morton, R.A. Quinn, A. Bouslimani, A.A. Orio, D. Petras, A.M. Smania, S.P. Couvillion, M.C. Burnet, C.D. Nicora, E. Zink, T.O. Metz, V. Artaev, E. Humston-Fulmer, R. Gregor, M.M. Meijler, I. Mizrahi, S. Eyal, B. Anderson, R. Dutton, R. Lugan, P. Le Boulch, Y. Guitton, S. Prevost, A. Poirier, G. Dervilly, B. Le Bizec, A. Fait, N.S. Persi, C. Song, K. Gashu, R. Coras, M. Guma, J. Manasson, J.U. Scher, D.K. Barupal, S. Alseekh, A.R. Fernie, R. Mirnezami, V. Vasiliou, R. Schmid, R.S. Borisov, L.N. Kulikova, R. Knight, M. Wang, G.B. Hanna, P.C. Dorrestein, K. Veselkov, Auto-deconvolution and molecular networking of gas chromatography–mass spectrometry data, Nature Biotechnology 2020 39:2 39 (2020) 169–173. [CrossRef]
- A.J. Hackstadt, A.M. A.J. Hackstadt, A.M. Hess, Filtering for increased power for microarray data analysis, BMC Bioinformatics 10 (2009) 1–12. [CrossRef]
- J. Xia, N. J. Xia, N. Psychogios, N. Young, D.S. Wishart, MetaboAnalyst: a web server for metabolomic data analysis and interpretation, Nucleic Acids Res 37 (2009) W652–W660. [CrossRef]
- Blaženović, T. Kind, J. Ji, O. Fiehn, Software Tools and Approaches for Compound Identification of LC-MS/MS Data in Metabolomics, Metabolites 8 (2018). [CrossRef]
- N. Garg, A. N. Garg, A. Sethupathy, R. Tuwani, R. Nk, S. Dokania, A. Iyer, A. Gupta, S. Agrawal, N. Singh, S. Shukla, K. Kathuria, R. Badhwar, R. Kanji, A. Jain, A. Kaur, R. Nagpal, G. Bagler, FlavorDB: a database of flavor molecules, Nucleic Acids Res 46 (2018). [CrossRef]
- J. Liu, J.-A. J. Liu, J.-A. Clarke, S. McCann, N.K. Hillier, K. Tahlan, Analysis of Streptomyces Volatilomes Using Global Molecular Networking Reveals the Presence of Metabolites with Diverse Biological Activities, Microbiol Spectr 10 (2022). [CrossRef]
- P. Shannon, A. P. Shannon, A. Markiel, O. Ozier, N.S. Baliga, J.T. Wang, D. Ramage, N. Amin, B. Schwikowski, T. Ideker, Cytoscape: A Software Environment for Integrated Models of Biomolecular Interaction Networks, Genome Res 13 (2003) 2498–2504. [CrossRef]
- Y. Djoumbou Feunang, R. Y. Djoumbou Feunang, R. Eisner, C. Knox, L. Chepelev, J. Hastings, G. Owen, E. Fahy, C. Steinbeck, S. Subramanian, E. Bolton, R. Greiner, D.S. Wishart, ClassyFire: automated chemical classification with a comprehensive, computable taxonomy, J Cheminform 8 (2016) 1–20. [CrossRef]
- W. Lan, C.M.G.C. W. Lan, C.M.G.C. Renard, B. Jaillais, A. Leca, S. Bureau, Fresh, freeze-dried or cell wall samples: Which is the most appropriate to determine chemical, structural and rheological variations during apple processing using ATR-FTIR spectroscopy?, Food Chem 330 (2020) 127357. [CrossRef]
- L. Zamudio, E. L. Zamudio, E. Suesca, G.D. López, C. Carazzone, M. Manrique, C. Leidy, Staphylococcus aureus Modulates Carotenoid and Phospholipid Content in Response to Oxygen-Restricted Growth Conditions, Triggering Changes in Membrane Biophysical Properties, Int J Mol Sci 24 (2023) 14906. [CrossRef]
- C.E. Agbangba, E. C.E. Agbangba, E. Sacla Aide, H. Honfo, R. Glèlè Kakai, On the use of post-hoc tests in environmental and biological sciences: A critical review, Heliyon 10 (2024) e25131. [CrossRef]
- H. Singh, M. H. Singh, M. Meghwal, P.K. Prabhakar, N. Kumar, Grinding characteristics and energy consumption in cryogenic and ambient grinding of ajwain seeds at varied moisture contents, Powder Technol 405 (2022) 117531. [CrossRef]
- M. Gonzalez, P. M. Gonzalez, P. Palacios-Rodriguez, J. Hernandez-Restrepo, M. González-Santoro, A. Amézquita, A.E. Brunetti, C. Carazzone, First characterization of toxic alkaloids and volatile organic compounds (VOCs) in the cryptic dendrobatid Silverstoneia punctiventris, Front Zool 18 (2021) 1–15. [CrossRef]
- J. Pawliszyn, Theory of Solid-Phase Microextraction, in: J. Pawliszyn (Ed.), Handbook of Solid Phase Microextraction, Elsevier, Oxford, 2012: pp. 13–59. [CrossRef]
- R. Tahergorabi, S.V. R. Tahergorabi, S.V. Hosseini, Nutraceutical and Functional Food Components, in: Galanakis Charis (Ed.), segunda, Elsevier, Chania, 2017: pp. 5–384. [CrossRef]
- R. Metrani, G.K. R. Metrani, G.K. Jayaprakasha, B.S. Patil, Optimization of Experimental Parameters and Chemometrics Approach to Identify Potential Volatile Markers in Seven Cucumis melo Varieties Using HS–SPME–GC–MS, Food Anal Methods 15 (2022) 607–624. [CrossRef]
- S. Siriamornpun, N. S. Siriamornpun, N. Kaewseejan, Quality, bioactive compounds and antioxidant capacity of selected climacteric fruits with relation to their maturity, Sci Hortic 221 (2017) 33–42. [CrossRef]
- J. Shi, Y. J. Shi, Y. Xiao, C. Jia, H. Zhang, Z. Gan, X. Li, M. Yang, Y. Yin, G. Zhang, J. Hao, Y. Wei, G. Jia, A. Sun, Q. Wang, Physiological and biochemical changes during fruit maturation and ripening in highbush blueberry (Vaccinium corymbosum L.), Food Chem 410 (2023) 135299. [CrossRef]
- L.S. Macarena, J.A.C. L.S. Macarena, J.A.C. María, M.D. Antonio, Olive fruit growth and ripening as seen by vibrational spectroscopy, J Agric Food Chem 58 (2010) 82–87. [CrossRef]
- M. González, A. M. González, A. Domínguez, M.J. Ayora, Hyperspectral FTIR imaging of olive fruit for understanding ripening processes, Postharvest Biol Technol 145 (2018) 74–82. [CrossRef]
- P. Skolik, C.L.M. P. Skolik, C.L.M. Morais, F.L. Martin, M.R. McAinsh, Determination of developmental and ripening stages of whole tomato fruit using portable infrared spectroscopy and Chemometrics, BMC Plant Biol 19 (2019). [CrossRef]
- John, J. Yang, J. Liu, Y. Jiang, B. Yang, The structure changes of water-soluble polysaccharides in papaya during ripening, Int J Biol Macromol 115 (2018) 152–156. [CrossRef]
- A.M. Naranjo, J. A.M. Naranjo, J. Quintero, G.L. Ciro, M.J. Barona, J. de C. Contreras, Characterization of the antioxidant activity, carotenoid profile by HPLC-MS of exotic colombian fruits (goldenberry and purple passion fruit) and optimization of antioxidant activity of this fruit blend, Heliyon 9 (2023) e17819. [CrossRef]
- G.D. López, G. G.D. López, G. Álvarez-Rivera, C. Carazzone, E. Ibáñez, C. Leidy, A. Cifuentes, Bacterial Carotenoids: Extraction, Characterization, and Applications, Crit Rev Anal Chem 53 (2023) 1239–1262. [CrossRef]
- L. Etzbach, A. L. Etzbach, A. Pfeiffer, F. Weber, A. Schieber, Characterization of carotenoid profiles in goldenberry (Physalis peruviana L.) fruits at various ripening stages and in different plant tissues by HPLC-DAD-APCI-MSn, Food Chem 245 (2018) 508–517. [CrossRef]
- R. Schex, V.M. R. Schex, V.M. Lieb, V.M. Jiménez, P. Esquivel, R.M. Schweiggert, R. Carle, C.B. Steingass, HPLC-DAD-APCI/ESI-MSn analysis of carotenoids and α-tocopherol in Costa Rican Acrocomia aculeata fruits of varying maturity stages, Food Research International 105 (2018) 645–653. [CrossRef]
- J. Fang, Y. J. Fang, Y. Guo, W. Yin, L. Zhang, G. Li, J. Ma, L. Xu, Y. Xiong, L. Liu, W. Zhang, Z. Chen, Neoxanthin alleviates the chronic renal failure-induced aging and fibrosis by regulating inflammatory process, Int Immunopharmacol 114 (2023) 109429. [CrossRef]
- R.K. Saini, S.H. R.K. Saini, S.H. Moon, E. Gansukh, Y.S. Keum, An efficient one-step scheme for the purification of major xanthophyll carotenoids from lettuce, and assessment of their comparative anticancer potential, Food Chem 266 (2018) 56–65. [CrossRef]
- Aragüez, V. Valpuesta, Metabolic engineering of aroma components in fruits, Biotechnol J 8 (2013) 1144–1158. [CrossRef]
- H. Seo, R.J. H. Seo, R.J. Giannone, Y.H. Yang, C.T. Trinh, Proteome reallocation enables the selective de novo biosynthesis of non-linear, branched-chain acetate esters, Metab Eng 73 (2022) 38–49. [CrossRef]
- S. Klie, S. S. Klie, S. Osorio, T. Tohge, M.F. Drincovich, A. Fait, J.J. Giovannoni, A.R. Fernie, Z. Nikoloski, Conserved changes in the dynamics of metabolic processes during fruit development and ripening across species, Plant Physiol 164 (2014) 55–68. [CrossRef]
- J.C. Barrios, D.C. J.C. Barrios, D.C. Sinuco, A.L. Morales, Compuestos volátiles libres y enlazados glicosídicamente en la pulpa de la uva Caimarona (Pourouma cecropiifolia Mart.), Acta Amazon 40 (2010) 189–198. [CrossRef]
- S.M. Padilla-Jiménez, M.V. S.M. Padilla-Jiménez, M.V. Angoa-Pérez, H.G. Mena-Violante, G. Oyoque-Salcedo, J.L. Montañez-Soto, E. Oregel-Zamudio, Identification of Organic Volatile Markers Associated with Aroma during Maturation of Strawberry Fruits, Molecules 2021, Vol. 26, Page 504 26 (2021) 504. [CrossRef]
- C. Li, M. C. Li, M. Xin, L. Li, X. He, P. Yi, Y. Tang, J. Li, F. Zheng, G. Liu, J. Sheng, Z. Li, J. sun, Characterization of the aromatic profile of purple passion fruit (Passiflora edulis Sims) during ripening by HS-SPME-GC/MS and RNA sequencing, Food Chem 355 (2021) 129685. [CrossRef]
- Ferenczi, N. Sugimoto, R.M. Beaudry, Emission Patterns of Esters and Their Precursors Throughout Ripening and Senescence in ‘Redchief Delicious’ Apple Fruit and Implications Regarding Biosynthesis and Aroma Perception, Journal of the American Society for Horticultural Science 146 (2021) 297–328. [CrossRef]
- D.A. Nagegowda, P. D.A. Nagegowda, P. Gupta, Advances in biosynthesis, regulation, and metabolic engineering of plant specialized terpenoids, Plant Science 294 (2020) 110457. [CrossRef]
- N.A.M. Eskin, E. N.A.M. Eskin, E. Hoehn, Fruits and Vegetables, in: Biochemistry of Foods, Elsevier Inc., 2013: pp. 49–126. [CrossRef]
- X. Liu, N. X. Liu, N. Hao, R. Feng, Z. Meng, Y. Li, Z. Zhao, Transcriptome and metabolite profiling analyses provide insight into volatile compounds of the apple cultivar ‘Ruixue’ and its parents during fruit development, BMC Plant Biol 21 (2021) 1–16. [CrossRef]
- Granell, J.L. Rambla, Biosynthesis of Volatile Compounds, in: Graham B. Seymour, Mervin Poole, James J. Giovannoni, Gregory A. Tucker (Eds.), The Molecular Biology and Biochemistry of Fruit Ripening, 2013: pp. 135–161. [CrossRef]
- R. Yue, Z. R. Yue, Z. Zhang, Q. Shi, X. Duan, C. Wen, B. Shen, X. Li, Identification of the key genes contributing to the LOX-HPL volatile aldehyde biosynthesis pathway in jujube fruit, Int J Biol Macromol 222 (2022) 285–294. [CrossRef]
- C.L. Loviso, D. C.L. Loviso, D. Libkind, Síntesis y regulación de compuestos del aroma y el sabor derivados de la levadura en la cerveza: ésteres, Rev Argent Microbiol 50 (2018) 436–446. [CrossRef]
- A.N. Yu, Y.N. A.N. Yu, Y.N. Yang, Y. Yang, M. Liang, F.P. Zheng, B.G. Sun, Free and Bound Aroma Compounds of Turnjujube (Hovenia acerba Lindl.) during Low Temperature Storage, Foods 9 (2020). [CrossRef]
- S. Mostafa, Y. S. Mostafa, Y. Wang, W. Zeng, B. Jin, Floral Scents and Fruit Aromas: Functions, Compositions, Biosynthesis, and Regulation, Front Plant Sci 13 (2022) 860157. [CrossRef]
- R. Guilherme, N. R. Guilherme, N. Rodrigues, Í.M.G. Marx, L.G. Dias, A.C.A. Veloso, A.C. Ramos, A.M. Peres, J.A. Pereira, Sweet peppers discrimination according to agronomic production mode and maturation stage using a chemical-sensory approach and an electronic tongue, Microchemical Journal 157 (2020). [CrossRef]
- J. Shi, Y. J. Shi, Y. Xiao, C. Jia, H. Zhang, Z. Gan, X. Li, M. Yang, Y. Yin, G. Zhang, J. Hao, Y. Wei, G. Jia, A. Sun, Q. Wang, Physiological and biochemical changes during fruit maturation and ripening in highbush blueberry (Vaccinium corymbosum L.), Food Chem 410 (2023) 135299. [CrossRef]

Table 1.
VOCs identified in the copoazu in three ripening stages.
| GNPS Scan number | tR | Metabolite | Formula | Confidence Level | Identification | ClassyFire (SubClass) | |
|---|---|---|---|---|---|---|---|
| Alcohols and polyols | 5 | 2,3 | 2-methylbut-3-en-2-ol | C5H10O | 3 | NIST | Alcohols and polyols |
| 7 | 2,47 | isobutylalcohol | C4H10O | 2 | GNPS, NIST | Alcohols and polyols | |
| 10 | 2,93 | butan-1-ol | C4H10O | 2 | GNPS, NIST | Alcohols and polyols | |
| 11 | 3,22 | 1-penten-3-ol | C5H10O | 2 | GNPS, NIST | Alcohols and polyols | |
| 14 | 3,53 | 3-pentanol | C5H12O | 2 | GNPS, NIST | Alcohols and polyols | |
| 20 | 3,74 | 1,3-butanediol | C4H10O2 | 3 | GNPS | Alcohols and polyols | |
| 25 | 4,26 | 1,2-Propanediol | C3H8O2 | 3 | GNPS | Alcohols and polyols | |
| 26 | 4,35 | Isoamyl alcohol | C5H12O | 2 | GNPS, NIST | Alcohols and polyols | |
| 27 | 4,44 | 2-methylbutanol | C5H12O | 2 | GNPS, NIST | Alcohols and polyols | |
| 31 | 5,41 | 1-pentanol | C5H12O | 3 | NIST | Alcohols and polyols | |
| 34 | 5,53 | 2-penten-1-ol | C5H10O | 2 | GNPS, NIST | Alcohols and polyols | |
| 36 | 5,68 | 2-methyl-2-buten-1-ol | C5H10O | 2 | GNPS, NIST | Alcohols and polyols | |
| 37 | 5,79 | 2,3-butanediol (Isomer I) | C4H10O2 | 2 | GNPS, NIST | Alcohols and polyols | |
| 44 | 6,27 | 2,3-butanediol (Isomer II) | C4H10O2 | 3 | GNPS | Alcohols and polyols | |
| 53 | 8,58 | 2-ethyl-1-butanol | C6H14O | 2 | GNPS, NIST | Alcohols and polyols | |
| 58 | 10,25 | 1-hexanol | C6H14O | 2 | GNPS, NIST | Fatty alcohols | |
| 119 | 24,12 | 2-ethyl-1-hexanol | C8H18O | 4 | GNPS | Alcohols and polyols | |
| Monoterpenoids | 87 | 19,18 | β-myrcene | C10H16 | 1 | NIST, STD | Monoterpenoids |
| 98 | 21,45 | 2-thujene | C10H16 | 2 | GNPS, NIST | Monoterpenoids | |
| 99 | 21,45 | Limonene | C10H16 | 1 | GNPS, NIST, STD | Monoterpenoids | |
| 101 | 22,27 | β-trans-ocimene | C10H16 | 1 | GNPS, NIST, STD | Monoterpenoids | |
| 102 | 22,33 | 3-thujene | C10H16 | 2 | GNPS, NIST | Monoterpenoids | |
| 105 | 22,82 | β-cis-ocimene | C10H16 | 1 | GNPS, NIST, STD | Monoterpenoids | |
| 117 | 23,98 | 3-thujanone | C10H16O | 3 | GNPS | Monoterpenoids | |
| 121 | 24,68 | trans-linalool oxide | C10H18O2 | 2 | GNPS, NIST | Tetrahydrofurans | |
| 127 | 25,35 | linalool | C10H18O | 1 | GNPS, NIST, STD | Monoterpenoids | |
| 129 | 25,44 | β-pinene | C10H16 | 3 | GNPS | Monoterpenoids | |
| 151 | 28,25 | terpinen-4-ol | C10H18O | 3 | NIST | Monoterpenoids | |
| 152 | 28,3 | 4(10)-Thujene | C12H20O | 3 | GNPS | Monoterpenoids | |
| 155 | 28,75 | α-terpineol | C10H18O | 1 | GNPS, NIST, STD | Monoterpenoids | |
| Ethers | 18 | 3,65 | 3-ethoxy-3-methyl-1-butene | C7H14O | 3 | NIST | Ethers |
| 49 | 7,75 | 1-ethoxy-3-methyl-2-butene | C7H14O | 2 | GNPS, NIST | Ethers | |
| 64 | 11,3 | 1-butene, 3-butoxy-2-methyl- | C9H18O | 4 | NIST | Ethers | |
| 1,3-dioxanes and 1,3-dioxalanes | 24 | 4,15 | 2,4,5-trimethyl-1,3-dioxolane (Isomer I) | C6H12O2 | 2 | GNPS, NIST | 1,3-dioxolanes |
| 28 | 4,88 | 2,4,5-trimethyl-1,3-dioxolane (Isomer II) | C6H12O2 | 2 | GNPS, NIST | 1,3-dioxolanes | |
| 30 | 5,33 | 2,4,5-trimethyl-1,3-dioxolane (Isomer III) | C6H12O2 | 2 | GNPS, NIST | 1,3-dioxolanes | |
| 41 | 6,12 | 2,4-dimethyl-1,3-dioxane | C6H12O2 | 2 | GNPS, NIST | 1,3-dioxanes | |
| 48 | 7,57 | 4-methyl-1,3-dioxane | C5H10O2 | 2 | GNPS, NIST | 1,3-dioxanes | |
| 54 | 8,96 | 2,4,6-trimethyl-1,3-dioxane | C7H14O2 | 3 | NIST | 1,3-dioxanes | |
| Dicarboxylic acids derivatives | 68 | 12,17 | 2-methylpentanoic anhydride | C12H22O3 | 2 | GNPS, NIST | Dicarboxylic acids and derivatives |
| 70 | 13,38 | 3-methylbutan-2-yl 2-acetyloxyacetate | C9H16O4 | 3 | GNPS | Dicarboxylic acids and derivatives | |
| Esters | 29 | 5,1 | ethyl isobutanoate | C6H12O2 | 2 | GNPS, NIST | Carboxylic acid derivatives |
| 38 | 5,91 | butyl acetate | C6H12O2 | 2 | GNPS, NIST | Carboxylic acid derivatives | |
| 46 | 6,64 | ethyl butanoate | C6H12O2 | 2 | GNPS, NIST | Carboxylic acid derivatives | |
| 47 | 7,25 | butyl acetate | C6H12O2 | 2 | GNPS, NIST | Fatty acid esters | |
| 56 | 9,07 | ethyl 2-methylbutanoate | C7H14O2 | 2 | GNPS, NIST | Fatty acid esters | |
| 59 | 10,67 | isoamyl acetate | C7H14O2 | 2 | GNPS, NIST | Carboxylic acid derivatives | |
| 61 | 10,83 | 2-methylbutyl acetate | C7H14O2 | 2 | GNPS, NIST | Carboxylic acid derivatives | |
| 66 | 11,72 | vinyl acetate | C4H6O2 | 3 | GNPS | Fatty acid esters | |
| 67 | 12,07 | propyl butanoate | C7H14O2 | 2 | GNPS, NIST | Fatty acid esters | |
| 69 | 12,26 | ethyl pentanoate | C7H14O2 | 3 | GNPS | Fatty acid esters | |
| 71 | 13,87 | prenyl acetate | C7H12O2 | 2 | GNPS, NIST | Carboxylic acid derivatives | |
| 77 | 15,34 | butyl 2-methylbutanoate | C9H18O2 | 2 | GNPS, NIST | Fatty acid esters | |
| 75 | 15,34 | pentyl butanoate | C9H18O2 | 3 | GNPS | Fatty acid esters | |
| 79 | 16,16 | butyl isobutanoate | C8H16O2 | 2 | GNPS, NIST | Carboxylic acid derivatives | |
| 80 | 16,33 | isobutyl 2-ethylbutanoate | C8H16O2 | 2 | GNPS, NIST | Fatty acid esters | |
| 86 | 18,92 | ethyl 5-hexenoate | C8H14O2 | 2 | GNPS, NIST | Fatty acid esters | |
| 88 | 19,62 | butyl butanoate | C8H16O2 | 2 | GNPS, NIST | Fatty acid esters | |
| 89 | 19,95 | ethyl hexanoate | C8H16O2 | 2 | GNPS, NIST | Fatty acid esters | |
| 90 | 20,07 | ethyl isohexanoate | C8H16O2 | 2 | GNPS, NIST | Fatty acid esters | |
| 92 | 20,38 | methyl (E)-2-butenoate | C5H8O2 | 3 | GNPS | Fatty acid esters | |
| 94 | 20,67 | ethyl-4-hexenoate | C8H14O2 | 2 | GNPS, NIST | Fatty acid esters | |
| 95 | 20,8 | isomyl Isobutanoate | C9H18O2 | 3 | GNPS | Carboxylic acid derivatives | |
| 100 | 22,1 | 4-pentenyl butanoate | C9H16O2 | 3 | GNPS | Fatty acid esters | |
| 103 | 22,53 | sec-butyl 2-methylbutanoate | C9H18O2 | 3 | GNPS, NIST | Fatty acid esters | |
| 114 | 23,3 | isopentyl 2-methylpropanoate | C9H18O2 | 2 | GNPS, NIST | Fatty acid esters | |
| 115 | 23,43 | 2-methylbutyl butanoate | C9H18O2 | 2 | GNPS, NIST | Fatty acid esters | |
| 116 | 23,56 | pentan-2-yl propyl carbonate | C9H18O3 | 3 | GNPS | Carbonic acid diesters | |
| 125 | 25,2 | propyl hexanoate | C9H18O2 | 2 | GNPS, NIST | Fatty acid esters | |
| 126 | 25,3 | (E)-2-hexenyl butanoate | C9H18O2 | 4 | GNPS | Fatty acid esters | |
| 137 | 26,26 | 2-methylpentyl 3-methylbut-2-enoate | C11H20O2 | 3 | GNPS | Fatty acid esters | |
| 139 | 26,77 | isobutyl 2-methyl-2-butenoate | C9H16O2 | 3 | GNPS | Fatty acid esters | |
| 141 | 27,05 | 3-methylbut-2-en-1-yl pivalate | C10H18O2 | 2 | GNPS, NIST | Carboxylic acid derivatives | |
| 143 | 27,38 | 4-Methylpentyl butanoate | C26H54 | 3 | GNPS | Fatty acid esters | |
| 145 | 27,44 | isobutyl hexanoate | C10H20O2 | 2 | GNPS, NIST | Fatty acid esters | |
| 147 | 27,76 | 3-methyl-2-butenyl hexanoate | C11H20O2 | 3 | GNPS | Fatty acid esters | |
| 157 | 28,81 | ethyl 4-octenoate | C10H18O2 | 3 | NIST | Fatty acid esters | |
| 158 | 28,88 | butyl hexanoate | C10H20O2 | 2 | GNPS, NIST | Fatty acid esters | |
| 159 | 29,11 | ethyl octanoate | C10H20O2 | 2 | GNPS, NIST | Fatty acid esters | |
| 160 | 30,24 | ethylene glycol dibutyrate | C10H18O4 | 2 | GNPS, NIST | Fatty acid esters | |
| 161 | 30,56 | ethyl 2-phenylacetate | C10H12O2 | 2 | GNPS, NIST | Benzene and substituted derivatives | |
| 163 | 30,6 | 2-ethylphenyl acetate | C10H12O2 | 2 | GNPS, NIST | Phenol esters | |
| 166 | 30,81 | isopentyl hexanoate | C11H22O2 | 2 | GNPS, NIST | Fatty acid esters | |
| Carbonyl compounds (aldehydes, ketones and acyloins) | 2 | 2,15 | butanal | C4H8O | 3 | NIST | Carbonyl compounds |
| 8 | 2,78 | 3-methylbutanal | C5H10O | 2 | GNPS, NIST | Carbonyl compounds | |
| 12 | 3,46 | pentan-3-one | C5H10O | 3 | NIST | Carbonyl compounds | |
| 35 | 5,6 | 3-methylpentan-2-one | C6H12O | 2 | GNPS, NIST | Carbonyl compounds | |
| 45 | 6,5 | hexanal | C6H12O | 3 | GNPS | Carbonyl compounds | |
| 62 | 11,16 | 3-ethoxy-3-methyl-2-butanone | C7H14O2 | 2 | GNPS, NIST | Carbonyl compounds | |
| 74 | 15,11 | 5-hydroxy-2,7-dimethyl-4-octanone | C10H20O2 | 3 | GNPS | Carbonyl compounds | |
| 84 | 18,77 | 6-methyl-5-hepten-2-one | C8H14O | 2 | GNPS, NIST | Carbonyl compounds | |
| 131 | 25,49 | nonanal | C9H18O | 3 | NIST | Carbonyl compounds | |
| 133 | 25,53 | 2-methylbutanal | C5H10O | 3 | GNPS | Carbonyl compounds | |
| Other compounds | 57 | 9,27 | 2,2-dimethylvaleric acid | C7H14O2 | 3 | GNPS | Fatty acids and conjugates |
| 63 | 11,2 | styrene | C8H8 | 3 | GNPS | Styrenes | |
| 109 | 23 | 2,6-octadiene, 2,7-dimethyl- | C10H18 | 2 | GNPS, NIST | Branched unsaturated hydrocarbons | |
| 138 | 26,53 | 1,3-Cyclopentadiene, 1,2,3,4,5-pentamethyl | C10H16 | 2 | GNPS, NIST | Unsaturated hydrocarbons | |
| Unkowms | 33 | 5,41 | unknown | - | 4 | - | |
| 43 | 6,27 | unknown | - | 4 | - | ||
| 51 | 7,8 | unknown | - | 4 | - | ||
| 65 | 11,3 | unknown | - | 4 | - | ||
| 120 | 24,68 | unknown | - | 4 | - | ||
| 122 | 25,16 | unknown | - | 4 | - |
Disclaimer/Publisher’s Note: The statements, opinions and data contained in all publications are solely those of the individual author(s) and contributor(s) and not of MDPI and/or the editor(s). MDPI and/or the editor(s) disclaim responsibility for any injury to people or property resulting from any ideas, methods, instructions or products referred to in the content. |
© 2024 by the authors. Licensee MDPI, Basel, Switzerland. This article is an open access article distributed under the terms and conditions of the Creative Commons Attribution (CC BY) license (http://creativecommons.org/licenses/by/4.0/).
Copyright: This open access article is published under a Creative Commons CC BY 4.0 license, which permit the free download, distribution, and reuse, provided that the author and preprint are cited in any reuse.


