
Submitted:
29 September 2024
Posted:
30 September 2024
You are already at the latest version
Abstract
This study aims to evaluate the potential of machine learning algorithms (Random Forest and Support Vector Machine) in predicting the open porosity of a general-use industrial mortar applied to different substrates based on the characteristics of both the mortar and substrates. For this purpose, an experimental database comprising 1592 samples of industrial mortar applied to five different substrates (hollowed ceramic brick, solid ceramic brick, concrete block, concrete slab, and lightweight concrete block) was generated by an experimental program. The samples were characterized by bulk density, open porosity, capillary water absorption coefficient, drying index, and compressive strength. This database was then used to train and test the machine learning algorithms to predict the open porosity of the mortar. The results indicate that it is possible to predict the open porosity of the mortar with good prediction accuracy and that both Random Forest (RF) and Support Vector Machine (SVM) algorithms (RF =0.880; SVM = 0.896) are suitable for this task. Regarding the main characteristics that influence the open porosity of the mortar, bulk density and the open porosity of the substrate are significant factors. Furthermore, the study employs a straightforward methodology with a machine learning no-code platform, enhancing the replicability of its findings for future research and practical implementations.
Keywords:
random forest
; support vector machine
; industrial mortar
; substrate
; prediction
1. Introduction
The construction sector in the European Union (EU) generates over 35% of the region’s total waste and requires vast amounts of resources, accounting for about 50% of all extracted material [1]. This significant demand influences production and drives research to optimize existing materials and develop new products [2]. Machine learning is a data-driven approach that uses statistical concepts to create a mathematical model with existing information, making decisions about future data [3].
With the increase in data generation in material characterization, data science has emerged with tools that enable the exploration, mining, and processing of large information sets [4].
The predictive capability in material characterization reduces decision-making risks and identifies failures and successes [4], helping to predict the lifespan of a material, and can minimize damage progression, for example, in terms of maintenance costs [5].
One of machine learning’s key advantages is its support for the decision-making process due to its predictive nature and classification power. On the other hand, one of the main disadvantages is the need for a large volume of data to train the algorithms. Based on the learning process, machine learning can generally be divided into three major categories: supervised, unsupervised, and reinforcement learning [6,7].
Supervised learning is the primary type used in civil engineering problems [5,8,9], where algorithms are trained on labeled datasets. This approach is effective for tackling regression and classification tasks. The main difference between these two lies in the response variable: for classification, the response variable is categorical, aiming to identify patterns; for regression problems, the response variable is numerical, targeting to estimate a regression function [10,11]. Figure 1 illustrates the main supervised learning algorithms for regression and classification problems [6,7,12]. In general, building machine learning algorithms involves randomly dividing the database into training, validation, and testing sets [6,9].
On the contrary, unsupervised learning algorithms are trained on unlabeled datasets. In reinforcement learning, the least common method, the algorithm is trained through trial and error [6,7].
Research has demonstrated various applications of machine learning in the context of mortars. Tran and Hoang [13] proposed a hybrid machine-learning model based on least squares support vector regression optimized by the flower pollination algorithm to estimate the growth time of algae on the mortar surface. Despite satisfactory results, the controlled conditions obtained in the laboratory limit the generalization and applicability of the prediction. Van Mullem et al. [14] segmented images using classification machine-learning algorithms. This study aimed to determine the propagation of the healing agent in self-healing concrete and mortar using the Trainable Weka Segmentation plugin.
Morsali et al. [15] employed decision tree algorithms to delineate the boundaries of a good design space, highlighting the influence of the bricks’ appearance and the thickness of the horizontal mortar joint on the assembly’s performance. Sevim et al. [16] developed a model to predict the compressive strength of mortar samples with different properties using artificial neural networks and Fuzzy inference algorithms. They employed eight fly ashes in the research. Asteris et al. [2] studied the applicability of machine learning algorithms such as Support Vector Machine, Random Forest, Decision Tree, AdaBoost, and K-nearest Neighbors, finding higher accuracy with AdaBoost and Random Forest for analyzing the compressive strength of mortars. Oey et al. [17] also utilized decision tree algorithms to predict the compressive strength of cementitious systems, evaluating the effects of Portland cement characteristics on the properties and performance of cement pastes and mortars.
Despite the promising applications of machine learning in mortars, research remains scarce compared to other scientific areas, but can be seen an evolution of the interest in the theme (Figure 2) by analyzing the documents published by year in Scopus with the research key (TITLE (mortar) AND TITLE-ABS-KEY (“Machine learning) AND (LIMIT-TO (DOCTYPE, “ar”)).
The widespread use of machine learning algorithms in mortars underscores the necessity of a thorough understanding of the material, which allows for predicting behaviors and properties. Standardized tests characterize mortars in the laboratory, but these tests do not account for the interaction with substrates, as they are carried out in metal molds that do not interact with the material.
Some authors have been studying the interaction of mortar with the substrate after its application, revealing that the substrates significantly influence the specific performance of the mortar. Carasek [18] evaluated the support/mortar bonds with different moisture contents and mortars, concluding that these factors influence adhesion. To achieve this, the author performed pull-off tests and made observations using a stereomicroscope and a scanning electron microscope.
Kazmierczak et al. [19] used three types of supports and one mortar, concluding that the type of support affects the pore distribution and mortar adhesion. Torres et al. [20] used three supports (brick, concrete, and acrylic), three types of mortars (cement mortar, aerial lime mortar, and pre-dosed cement mortar), with one mix type for each mortar, and evaluated parameters such as open porosity, capillary water absorption, vapor permeability, dynamic modulus of elasticity, and compressive strength. The characteristics of the mortars detached from the supports were compared with those of the mortars molded and hardened in laboratory molds to analyze the influence of the support. This comparison revealed that various experimental factors significantly influence the mortars’ characteristics after their application to the supports. Matias et al. [21] studied the influence of the substrate on the porosimetry of hardened mortars, noticing that substrate properties induce changes in pore size, distribution, and apparent density. Bellei et al. [22] studied the effect of hollowed ceramic brick substrates on cement mortar with fine sand and regular sand, concluding that the substrate influences the bulk density and compressive strength of the mortar, leading to an increase of compressive strength when compared with the characterization carried out on laboratory molds.
Thus, the substrate significantly influences the characteristics of the applied mortar, and the substrate characteristics must be considered combined with the mortar formulation.
This study aims to evaluate the potential of machine learning algorithms to predict mortars’ open porosity, considering the characteristics of the substrates. This paves the way for a better understanding of how the substrate can influence mortar performance, leading to the design of more tailored mortars that suit specific purposes and substrates. The study employs an easy-to-follow methodology using a machine learning no-code platform, making the findings more replicable for further research and practical applications.
2. Materials and Methods
This study aims to predict the open porosity of an industrial mortar applied to different substrates (lightweight concrete block, concrete block, concrete slab, hollow ceramic brick, and solid ceramic brick) based on mortar’s bulk density, water absorption by capillarity, drying index, compression strength, and substrate characteristics (bulk density, open porosity, and water absorption by capillarity). The study’s development used the Orange software [23].
The selected pre-dosed cement-based mortar is suitable for various substrates, indoor and outdoor use, can be applied manually or by spraying, and includes cement, aggregates, admixtures, and synthetic fibers. The mortar used has the following characteristics, according to the manufacturer’s technical specifications based on EN 998-1 [24]:
- Bulk density of the hardened product: 1400 to 1500 kg/m3;
- Compressive strength: > 1.35 N/mm2;
- Adherence: ≥ 0.25 N/mm2;
- Water vapor permeability (µ): ≤ 35;
- Water absorption EN 998 [24] classification: Wc0.
The product’s technical data sheet does not disclose the proportions of the mortar components or the chemical composition of the binder. However, the manufacturer advises using between 4 to 5 liters of water for each 25 kg bag of mortar. In the experimental campaign, 4.5 liters of water were used for every 25 kg of mortar.
2.1. Test Procedures
2.1.1. Physical Tests Used and the Standards Applied
The bulk density (BD) and open porosity (OP) were determined in accordance with standard EN 1936 [25].
The capillary water absorption coefficient (Aw) was determined in accordance with ISO 15148 [26], with the necessary adaptations to the dimensions of the samples. The samples were waterproofed on their side faces to ensure a unidirectional flow. The samples were removed from the water, weighed, and replaced again after 5 minutes, 10 minutes, 20 minutes, 30 minutes, 1 hour, 1 hour and 30 minutes, 2 hours, 4 hours, 8 hours, 24 hours, 48 hours, and 72 hours.
The drying index test (DI) was carried out using Standard EN 16322 [27] and recommendation No. II.5 of RILEM [28]. The saturated samples, except the upper face, had their faces waterproofed and were placed in a climatic chamber at 23 °C± 2 °C and relative humidity of 50 °C ± 5 °C.
For the compressive strength it was used the procedures of standard EN 1015-11 [29].
2.2. Database
The database was obtained experimentally using a general industrial cement mortar. This mortar was applied and detached from the substrates after a 28-day curing period for characterization. The authors have used this characterization methodology in previous works [30,31,32,33].
The substrates used were hollowed ceramic brick (HCB), solid ceramic brick (SCB), concrete slab (CS), concrete block (CB), and lightweight concrete block (LCB).
The constructed database contains 1592 samples. The data was homogenized for this composition by removing outliers and missing values. The outliers were identified and removed using the Pierce method [34].
2.3. Machine Learning Algorithms for Predicting Mortar Open Porosity
Machine learning algorithms were used to predict the open porosity of the applied mortar. The algorithms selected for the study were Random Forest (RF) and Support Vector Machine (SVM). These algorithms were chosen for their wide use and effectiveness in regression tasks.
The Random Forest (RF) algorithm, developed by Breiman [35] in 2001, can be defined as an ensemble of structured decision trees (classification and/or regression). Each tree grows according to a randomly selected subset of the training set, with replacement (i.e., bagging). This means that the selected sample is not eliminated from the dataset, so some samples may be selected multiple times while others may not be selected at all in a new set. The replacement improves accuracy by reducing the variance of classification errors [2]. In RF, each prediction of an individual regression tree is averaged to produce the final result [36].
The Support Vector Machine (SVM), developed by Cortes and Vapnik [37], can handle classification and regression problems [38]. SVM is an effective pattern recognition tool suitable for cases with small sample sizes [39]. In this method, a hyperplane, the decision boundary, must be defined. When there is a set of objects belonging to different classes, a decision plane is needed to separate them [38]. Support vectors modify the original low-dimensional input data into high-dimensional output data through nonlinear transformation. This transformation allows for identifying non-linear separation features that could not be recognized in a low-dimensional space [39]. In this system, the support vectors are the points closest to the ideal hyperplane [2].
2.3. Evaluation Metrics
An efficient technique for performance evaluation is cross-validation (k-fold). Cross-validation randomly divides the database into K parts and trains the model K times using one part as a test and the remaining parts for training [10]. It is essential to compare different algorithms to find the most suitable one for the problem [6]. A 10-fold cross-validation technique was used with the Test and Score widget [40].
The trained model evaluates the algorithm’s performance using the test data set [5]. Then, predictions can be made using a new dataset. This study randomly divided the database into 20% for testing and 80% for algorithm training.
- MAE (Mean Absolute Error)
- MSE (Mean Squared Error)
- RMSE (Root Mean Squared Error)
- R² (Coefficient of Determination)
Where:
is the predicted value
is the real value
* is the mean of the true values
Figure 3 shows the model scheme created in Orange. In this schema, the used widgets are visible: Data Sampler (which randomly divides the database in a chosen proportion: 20% for testing and 80% for training), RF and SVM (the algorithms used), Test and Score (used for cross-validation), Prediction (used for predicting porosity), and Feature Importance (used to evaluate the importance of features in the prediction).
3. Results and Discussion
As stated, two machine-learning algorithms were used to predict open porosity for an industrial cement-based mortar. According to the data, 1274 samples were used for simulation.
Table 1 (substrates characterization) and 2 (applied mortars characterization) show the mean and standard deviation separated by variables and characteristics to assist in visualizing and understanding the database used.
The results indicate that the characterization values for ceramic substrates (HCB and SCB) and concrete substrates (CS and CB) are of a similar order of magnitude. In contrast, the lightweight concrete block (LCB) shows approximately 60% lower bulk density, and 29% higher open porosity compared to the other concrete substrates. This same pattern observed in the substrate characterization is also reflected in the applied mortar.
Concerning constructing the machine learning models, eighty percent of the data were used to train the models, and twenty percent were used to predict the mortar’s open porosity. The widget Data Sampler randomly divided the data. The widget Test and Score was used to evaluate the training using a cross-validation technique, and the Predictions widget was used to evaluate the algorithm performance. Table 3 shows the training results.
The database was randomly divided in the indicated proportion ten times to construct the evaluation metrics for testing the models. Table 4 shows the results obtained, the mean value for SVM, and Table 5 for RF.
The R2 of RF and SVM models were generally almost the same (0.904 and 0.908 for the training data, respectively). SVM performance was also slightly better than RF for the test data (0.896 and 0.880, respectively).
The Feature Importance widget was used to evaluate each feature’s contribution to the model. This widget explains regression models by using a trained model and reference data as input; the method calculates each feature’s contribution to the prediction by assessing the increase in the model’s prediction error after permuting the feature’s values, thereby disrupting the relationship between the feature and the target. [23]. Figure 4 and Figure 5 show the results for the RF and SVM algorithms, the bar indicates the mean with the standard deviation after five permutations.
Both algorithms indicate that the substrate’s features (bulk density and open porosity) are the most significant factors influencing the mortar’s open porosity.
Kazmierczak et al. [19], Carasek [18], and the authors observed the tendency of the substrate’s porosity to influence the mortar’s characteristics and reinforced the theory of active pores. However, the substrate’s porosity not only influences the mortar’s adhesion to the substrate but also determines the physical and mechanical behavior of the applied mortar, characteristics that depend on the mortar’s porosity.
Concerning the R2 obtained with the ML models, Asteris et al. [2] used the same algorithms (SVM and RF) to predict the compressive strength of cement mortars, obtaining 0.420 for SVM and 0.944 for RF using the testing set. Sevim et al. [16] also predicted the compressive strength of cementitious composite with fly ash but used different algorithms, such as artificial neural networks (ANN), and presented 0.894 for R2 in the testing set.
In our case, we obtained R2 values ranging from 0.8890 to 0.9088, indicating that the model accurately predicts the open porosity of cement-based industrial mortar based on the substrate, showing a good match between the performance of the two MLAs and the database size.
5. Conclusions
As previous studies have demonstrated, open porosity changes according to substrate characteristics. Therefore, it is important to tailor mortars to account for the substrate where they will be applied.
This study aimed to evaluate the machine learning algorithms used to predict the open porosity of mortar applied to different substrates.
The machine learning algorithms demonstrated good prediction accuracy (R2) (SVM = 0.896; RF =0.880), although the support Vector Machine algorithm performed slightly better than the Random Forest.
This analysis revealed that the substrates’ bulk density and open porosity are important features that influence the mortar’s open porosity.
For future work, it is planned to extent the database to other industrial mortars and substrates to enhance the algorithms’ robustness and permit the model generalization.
Author Contributions
Rafael Travincas: Conceptualization, Methodology, Writing – Original draft, Review, Formal analysis, investigation. Maria Paula Mendes: Conceptualization, Methodology, Writing – Review, investigation, Supervision. Isabel Torres: Writing – Review, Supervision. Inês Flores-Colen: Writing – Review, Supervision.
Funding
This research was funded by FEDER through the POCI program (Programa Operacional Competitividade e Internacionalizac.o) and FCT (Foundation for Science and Technology), grant number POCI-01-0145-FEDER-032223, PTDC/ECI-EGC/32223/2017. The authors are also grateful for the Foundation for Science and Technology’s support through funding UIDB/04625/2020 from the research unit CERIS (doi: 10.54499/UIDB/04625/2020). The funding from Foundation for Science and Technology, through grant number UI/BD/151151/2021, is also acknowledged. Maria Paula Mendes acknowledges FCT for strategic funding of CERENA (UIDB/04028/2020).
Institutional Review Board Statement
Not applicable.
Informed Consent Statement
Not applicable.
Data Availability Statement
Data will be made available on request.
Acknowledgments
The authors would like to thank Itecons and the CERIS and CERENA research units from IST for all the support they provided.
Conflicts of Interest
The authors declare no conflicts of interest.
References
- Buildings and construction - European Commission. Available online: https://single-market-economy.ec.europa.eu/industry/sustainability/buildings-and-construction_en (accessed on 3 July 2024).
- Asteris, P.G.; Koopialipoor, M.; Armaghani, D.J.; Kotsonis, E.A.; Lourenço, P.B. Prediction of cement-based mortars compressive strength using machine learning techniques. Neural Computing and Applications 2021, 1–33. [Google Scholar] [CrossRef]
- Saha, S.K.; Pradhan, S.; Barai, S.V. Use of machine learning based technique to X-ray microtomographic images of concrete for phase segmentation at meso-scale. Construction and Building Materials 2020, 249, 118744. [Google Scholar] [CrossRef]
- Koumoulos, E.P.; Paraskevoudis, K.; Charitidis, C.A. Constituents phase reconstruction through applied machine learning in nanoindentation mapping data of mortar surface. Journal of Composites Science 2019, 3, 63. [Google Scholar] [CrossRef]
- Mishra, M. Machine learning techniques for structural health monitoring of heritage buildings: A state-of-the- art review and case studies. Journal of Cultural Heritage 2020. [Google Scholar] [CrossRef]
- Thai, H.T. Machine learning for structural engineering: A state-of-the-art review. Structures 2022, 38, 448–491. [Google Scholar] [CrossRef]
- Nunez, I.; Marani, A.; Flah, M.; Nehdi, M.L. Estimating compressive strength of modern concrete mixtures using computational intelligence: A systematic review. Construction and Building Materials 2021, 3, 125–279. [Google Scholar] [CrossRef]
- Xu, Y.; Zhou, Y.; Sekula, P.; Ding, L. Machine learning in construction: From shallow to deep learning. Developments in the built environment 2021, 6, 100045. [Google Scholar] [CrossRef]
- Chaabene, W.B.; Flah, M.; Nehdi, M.L. Machine learning prediction of mechanical properties of concrete: Critical review. Construction and Building Materials 2020, 260, 119889. [Google Scholar] [CrossRef]
- Sun, H.; Burton, H.V.; Huang, H. Machine learning applications for building structural design and performance assessment: State-of-the-art review. Journal of Building Engineering 2021, 33, 101816. [Google Scholar] [CrossRef]
- Izbicki, R.; dos Santos, T.M. (2020). Machine learning: A Statistical approach (In portuguese). Rafael Izbicki editora.
- Jain, P.; Coogan, S.C.; Subramanian, S.G.; Crowley, M.; Taylor, S.; Flannigan, M.D. A review of machine learning applications in wildfire. Science and Management. Environmental Reviews 2020, 28, 478–505. [Google Scholar] [CrossRef]
- Tran, T.H.; Hoang, N.D. Estimation of algal colonization growth on mortar surface using a hybridization of machine learning and metaheuristic optimization. Sādhanā 2017, 42, 929–939. [Google Scholar] [CrossRef]
- Van Mullem, T.; Anglani, G.; Dudek, M.; Vanoutrive, H.; Bumanis, G.; Litina, C.; De Belie, N. Addressing the need for standardization of test methods for self-healing concrete: an inter-laboratory study on concrete with macrocapsules. Science and Technology of Advanced Materials 2020, 21, 661–682. [Google Scholar] [CrossRef] [PubMed]
- Morsali, S.; Qian, D.; Minary-Jolandan, M. Designing bioinspired brick-and-mortar composites using machine learning and statistical learning. Communications Materials 2020, 1, 1–11. [Google Scholar] [CrossRef]
- Sevim, U.K.; Bilgic, H.H.; Cansiz, O.F.; Ozturk, M.; Atis, C.D. Compressive strength prediction models for cementitious composites with fly ash using machine learning techniques. Construction and Building Materials 2021, 271, 121584. [Google Scholar] [CrossRef]
- Oey, T.; Jones, S.; Bullard, J.W.; Sant, G. Machine learning can predict setting behavior and strength evolution of hydrating cement systems. Journal of the American Ceramic Society 2020, 103, 480–490. [Google Scholar] [CrossRef]
- Carasek, H. (1996) Mechanisms and factors involved in the adhesion of Portland cement-based mortars applied to porous substrates (In Portuguese), PhD Thesis, Escola Politécnica, Universidade de São Paulo, Brazil.
- Kazmierczak, C.; Brezezinski, D.E.; Collatto, D. Influence of base characteristics on tensile strength and pore distribution of a mortar. Estudos tecnológicos (In Portuguese). 2007, 3, 47–58. [Google Scholar]
- Torres, I.; Veiga, R.; Freitas, V. Influence of substrate characteristics on behavior of applied mortar. Journal of Materials in Civil Engineering 2018, 30, 04018254. [Google Scholar] [CrossRef]
- Matias, G.; Torres, I.; Bellei, P.; Flores-Colen, I.; Silveira, D.; Travincas, R. Influence of the substrate in the porosimetry of hardened mortars. International Conference Construction, Energy, Environment e Sustainability. Coimbra, Portugal, 2021.
- Bellei, P.; Torres, I.; Flores-Colen, I.; Travincas, R.; Silveira, D. (2021). – Study of cement mortars with different particle size sands after application to ceramic brick substrate. International Conference Construction, Energy, Environment e Sustainability. Coimbra, Portugal.
- Demsar, J.; Curk, T.; Erjavec, A.; Gorup, C.; Hocevar, T.; Milutinovic, M.; Mozina, M.; Polajnar, M.; Toplak, M.; Staric, A.; Stajdohar, M.; Umek, L.; Zagar, L.; Zbontar, J.; Zitnik, M.; Zupan, B. Orange: Data Mining Toolbox in Python. Journal of Machine Learning Research 2013, 14, 2349–2353. [Google Scholar]
- CEN (2010). Specification for mortar for mansonry. Part 1: Rendering and plastering mortar. EN 998-1.
- CEN (2008). Natural Stone Test Methods - Determination of Real Density and Apparent Density and of Total and Open porosity. EN 1936:2008, European Committee for Standardization, Brussels, 2008.
- CEN (2002), Hygrothermal Performance of Building Materials and Products – Determination of Water Absorption Coefficient by Partial Immersion, European Committee for Standardization, Brussels, 2002. ISO 15148.
- CEN (2013). Conservation of Cultural Heritage: Test Methods: Determination of Drying properties. EN 16322, European Committee for Standardization, Brussels, 2013.
- RILEM Test No. II.5 - Evaporation Curve. (1980) RILEM 25-PEM, Provisional recommendations. These recommand’es pour mesurer l’alt´eration des pierres et ´evaluer l’´efficacit´e des methods de traitement, Mat´eriaux et Construction 13 (1980) Nº75.
- CEN (2008). Methods of Test for Mortar for Masonry - Part 19: Determination of Water Vapor Permeability of Hardened Rendering and Plastering Mortars. EN 1015- 19:2008, European Committee of Standardization, Brussels, 2008.
- Gouveia, J.P.M. Analysis of the Behavior of Mortars after Application on substrates (In Portuguese). Master Thesis, University of Coimbra, Coimbra, Portugal, 2021. [Google Scholar]
- Soares, K.M.P. (2021). The influence of traditional supports on the behavior of lime mortars (In portuguese). Master Thesis, Universidade de Coimbra, Coimbra, Portugal.
- Travincas, R.; Silveira, D.; Bellei, P.; Gouveia, J.; Matias, G.; Torres, I.; Flores-Colen, I. Performance and Accelerated Ageing of an Industrial Hydraulic Lime Mortar Applied on Different Substrates. Coatings 2024, 14, 819. [Google Scholar] [CrossRef]
- Travincas, R.; Torres, I.; Flores-Colen, I.; Francisco, M.; Bellei, P. The influence of the substrate type on the performance of an industrial cement mortar for general use. Journal of Building Engineering 2023, 73, 106784. [Google Scholar] [CrossRef]
- Ross, S.M. Peirce’s criterion for the elimination of suspect experimental data. Journal of engineering technology 2003, 20, 38–41. [Google Scholar]
- Breiman, L. Random forests. Machine learning 2001, 45, 5–32. [Google Scholar] [CrossRef]
- THastie, R. Tibshirani, J. Friedman. The Elements of Statistical Learning; Springer: Berlin, Heidelberg, New York, 2001. [Google Scholar] [CrossRef]
- Cortes, C.; Vapnik, V. Support-vector networks. Mach Learn 1995, 20, 273–297. [Google Scholar] [CrossRef]
- Ray, S. (2019). A quick review of machine learning algorithms. In 2019 International conference on machine learning, big data, cloud and parallel computing (COMITCon)(pp. 35-39). IEEE.
- Mishra, M.; Bhatia, A.S.; Maity, D. Support vector machine for determining the compressive strength of brick-mortar masonry using NDT data fusion (case study: Kharagpur, India). SN Applied Sciences 2019, 1, 1–11. [Google Scholar] [CrossRef]
- Gladshiya, V.B.; Sharmila, D.K. Analyzing the risk factors and predicting the learning ability of students during pandemic and comparing machine learning algorithms using Orange tool. Turkish Journal of Physiotherapy and Rehabilitation 2021, 32, 1411–1418. [Google Scholar]
Figure 1.
Supervised learning algorithm.
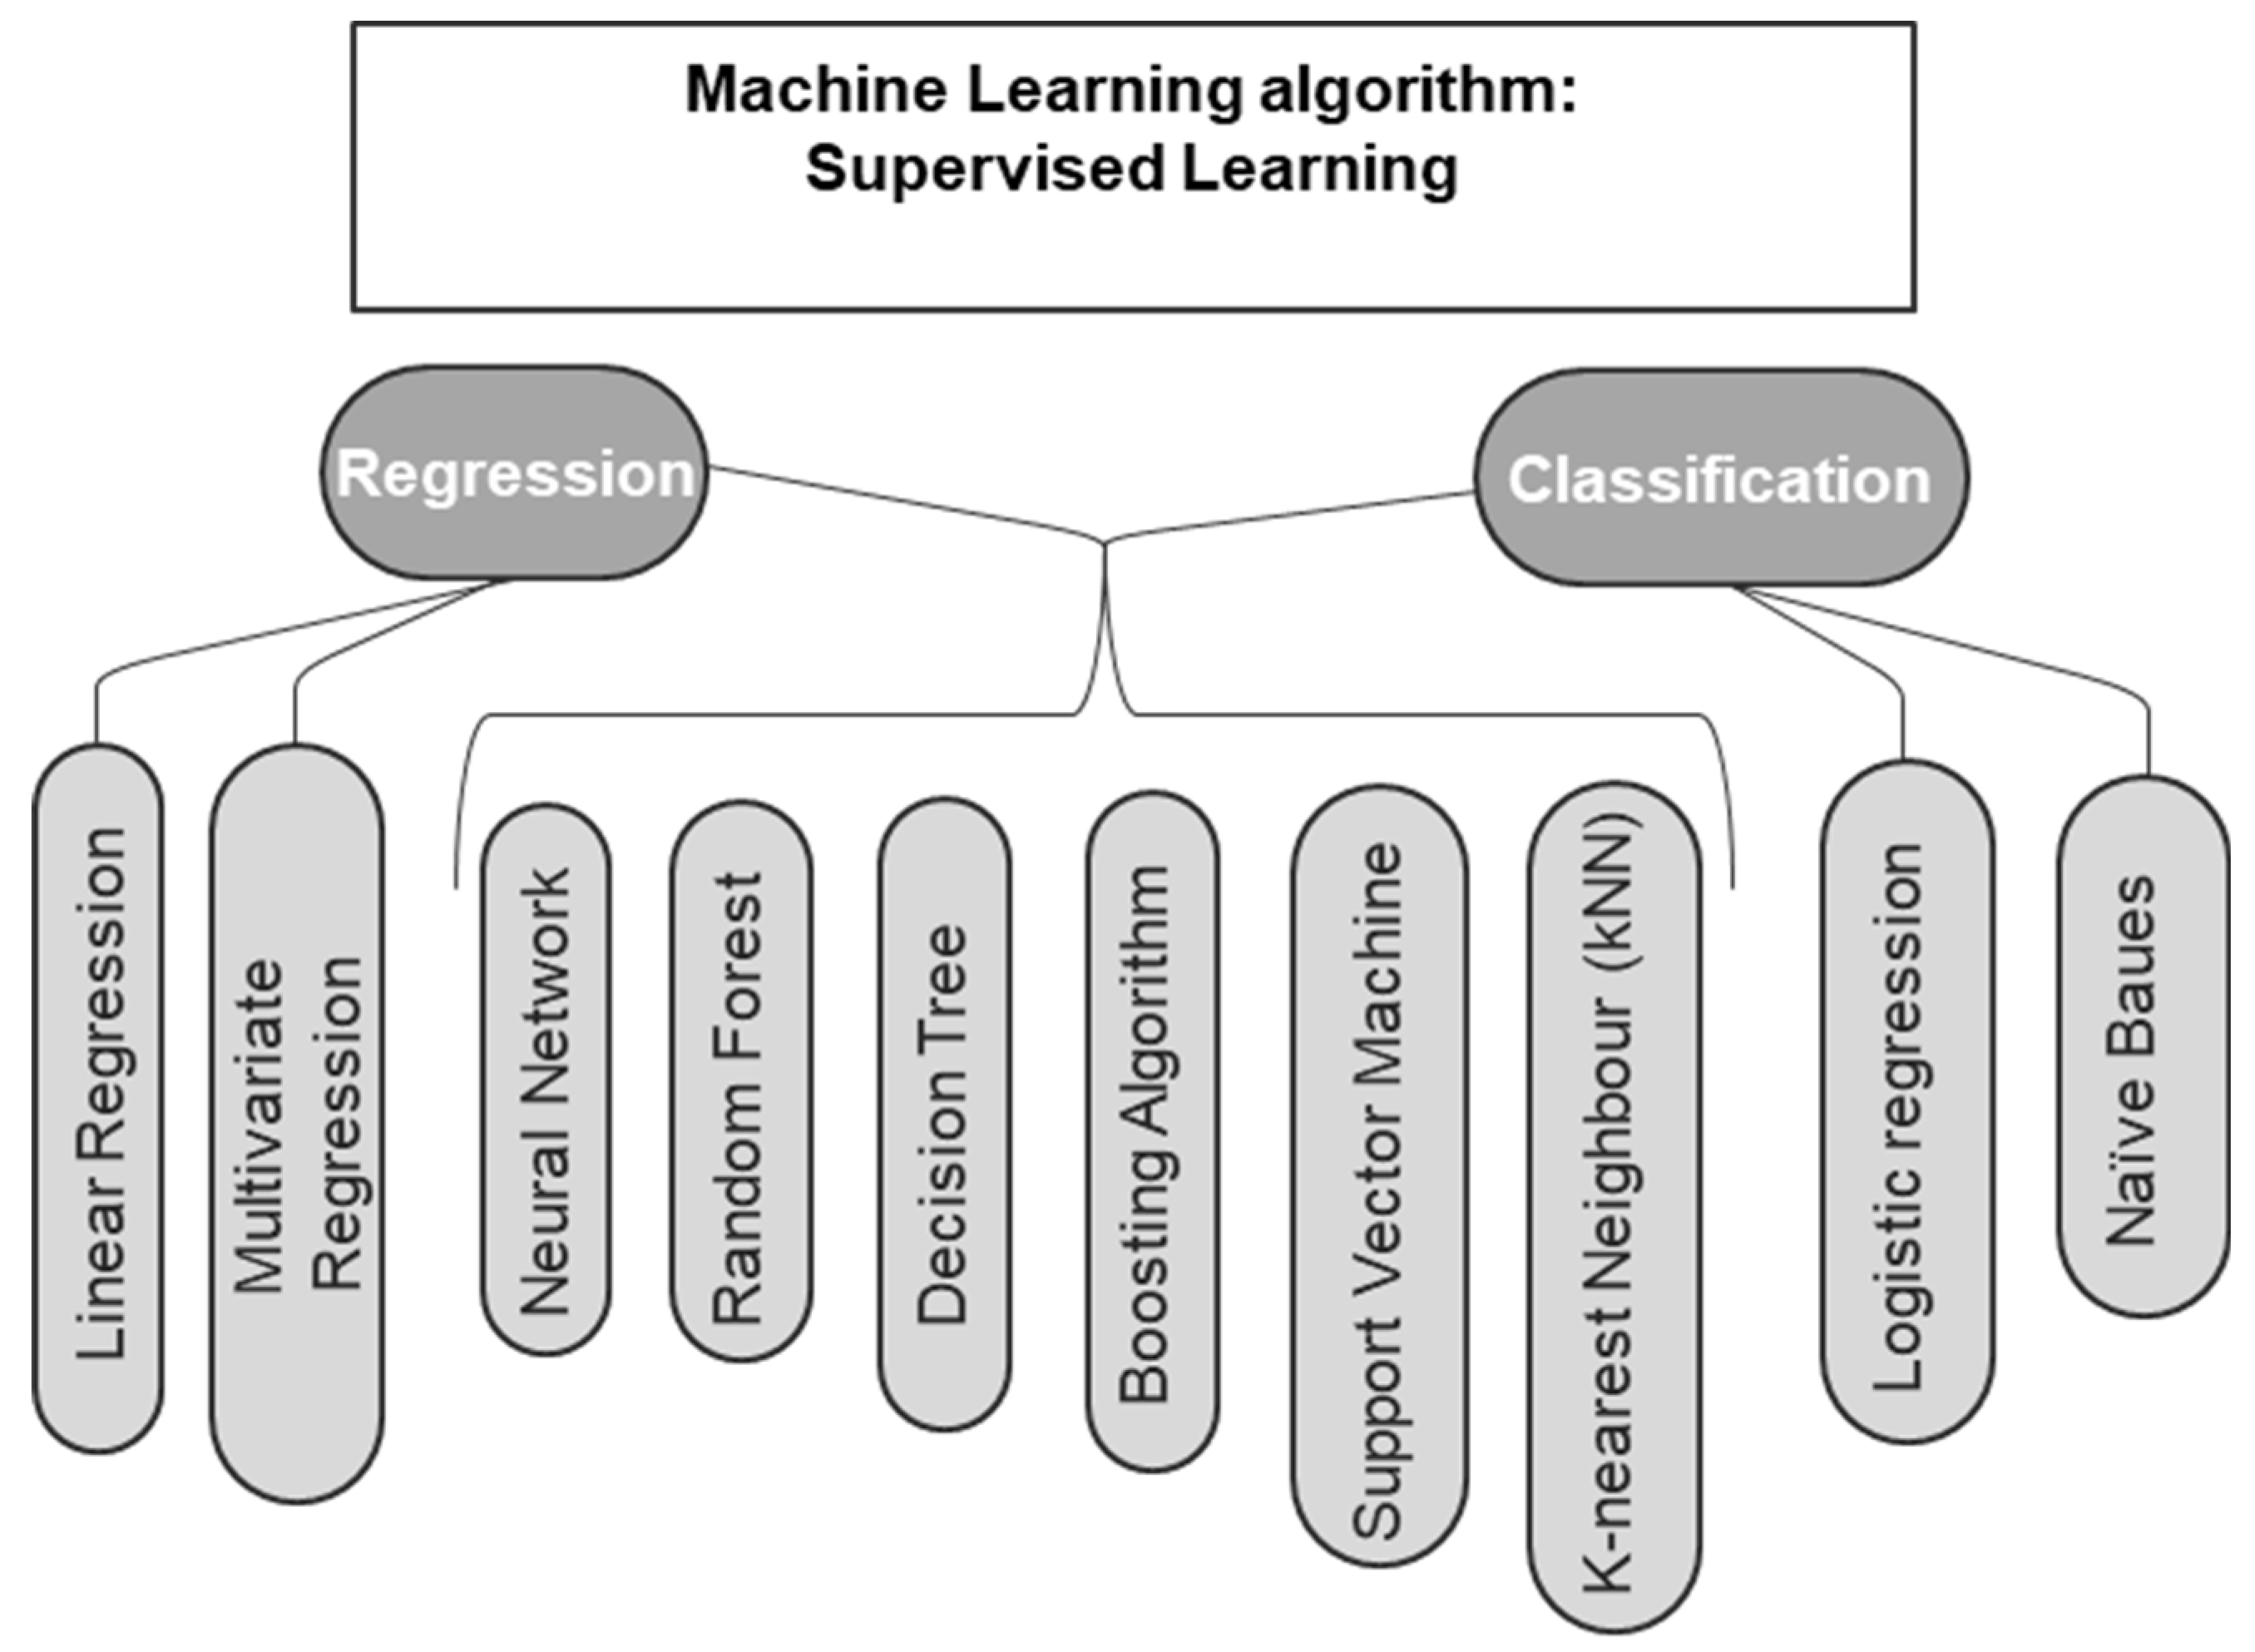
Figure 2.
Articles published by year.
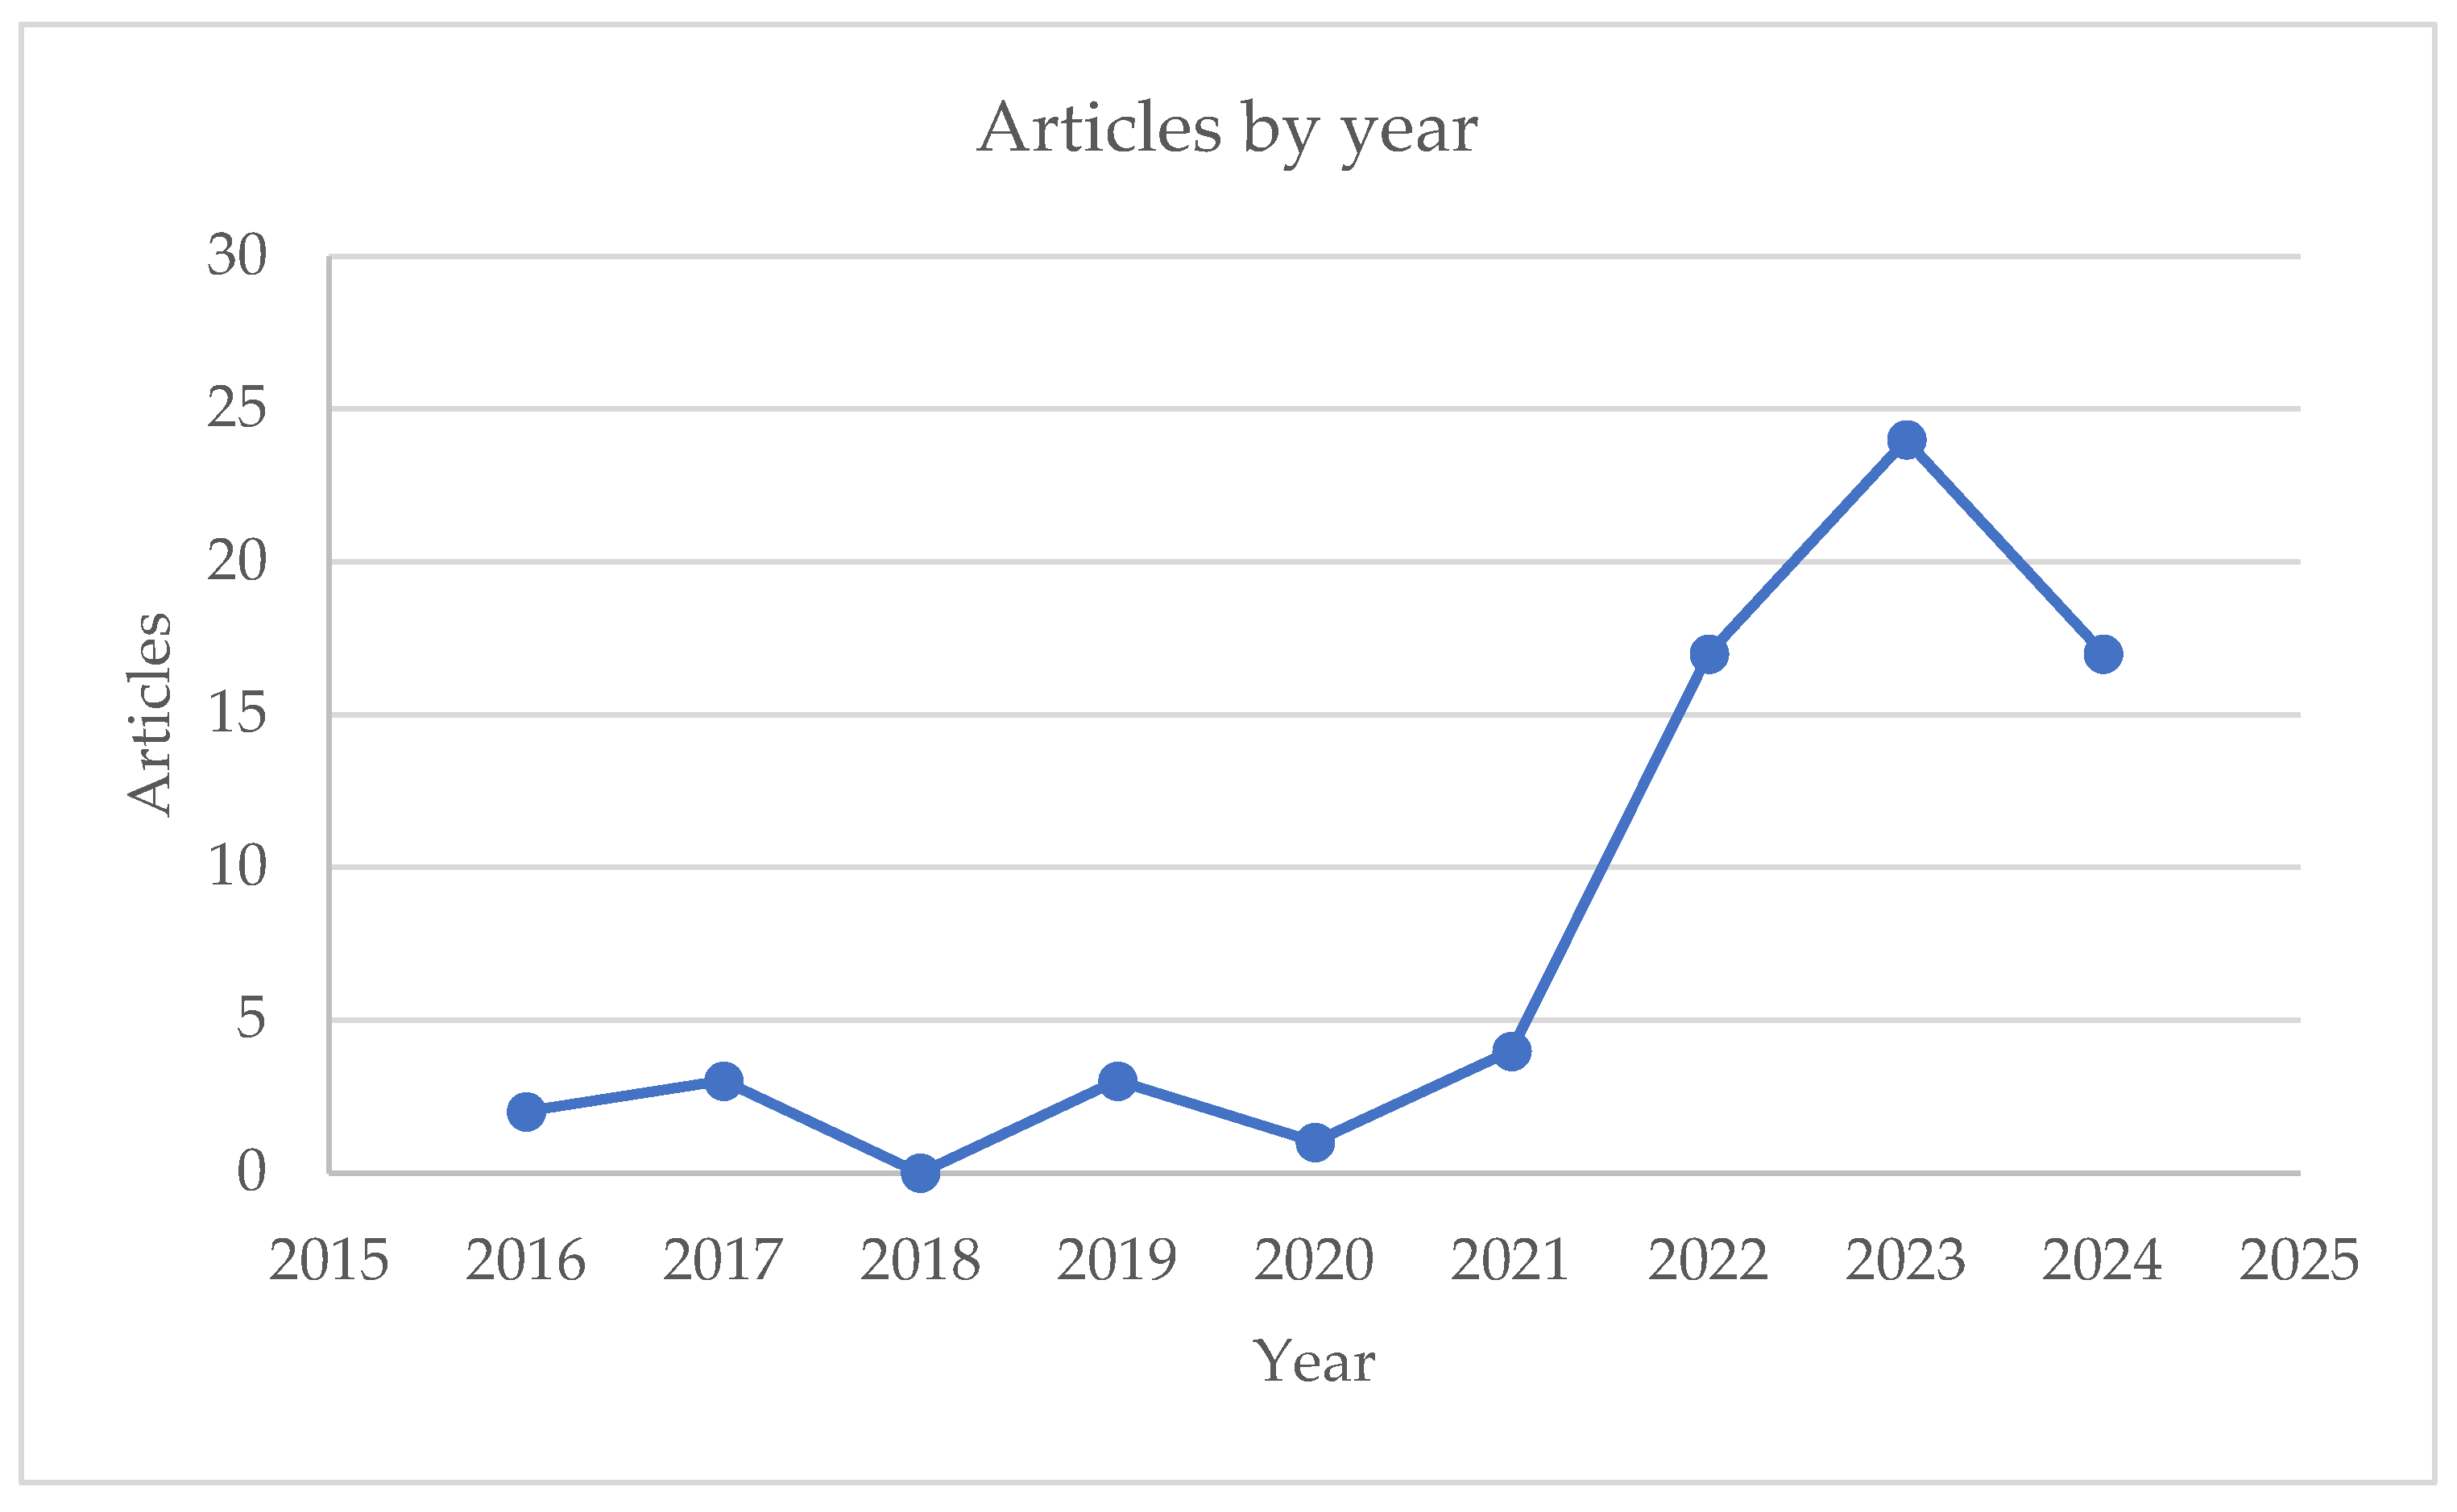
Figure 3.
Machine learning scheme on Orange Software.
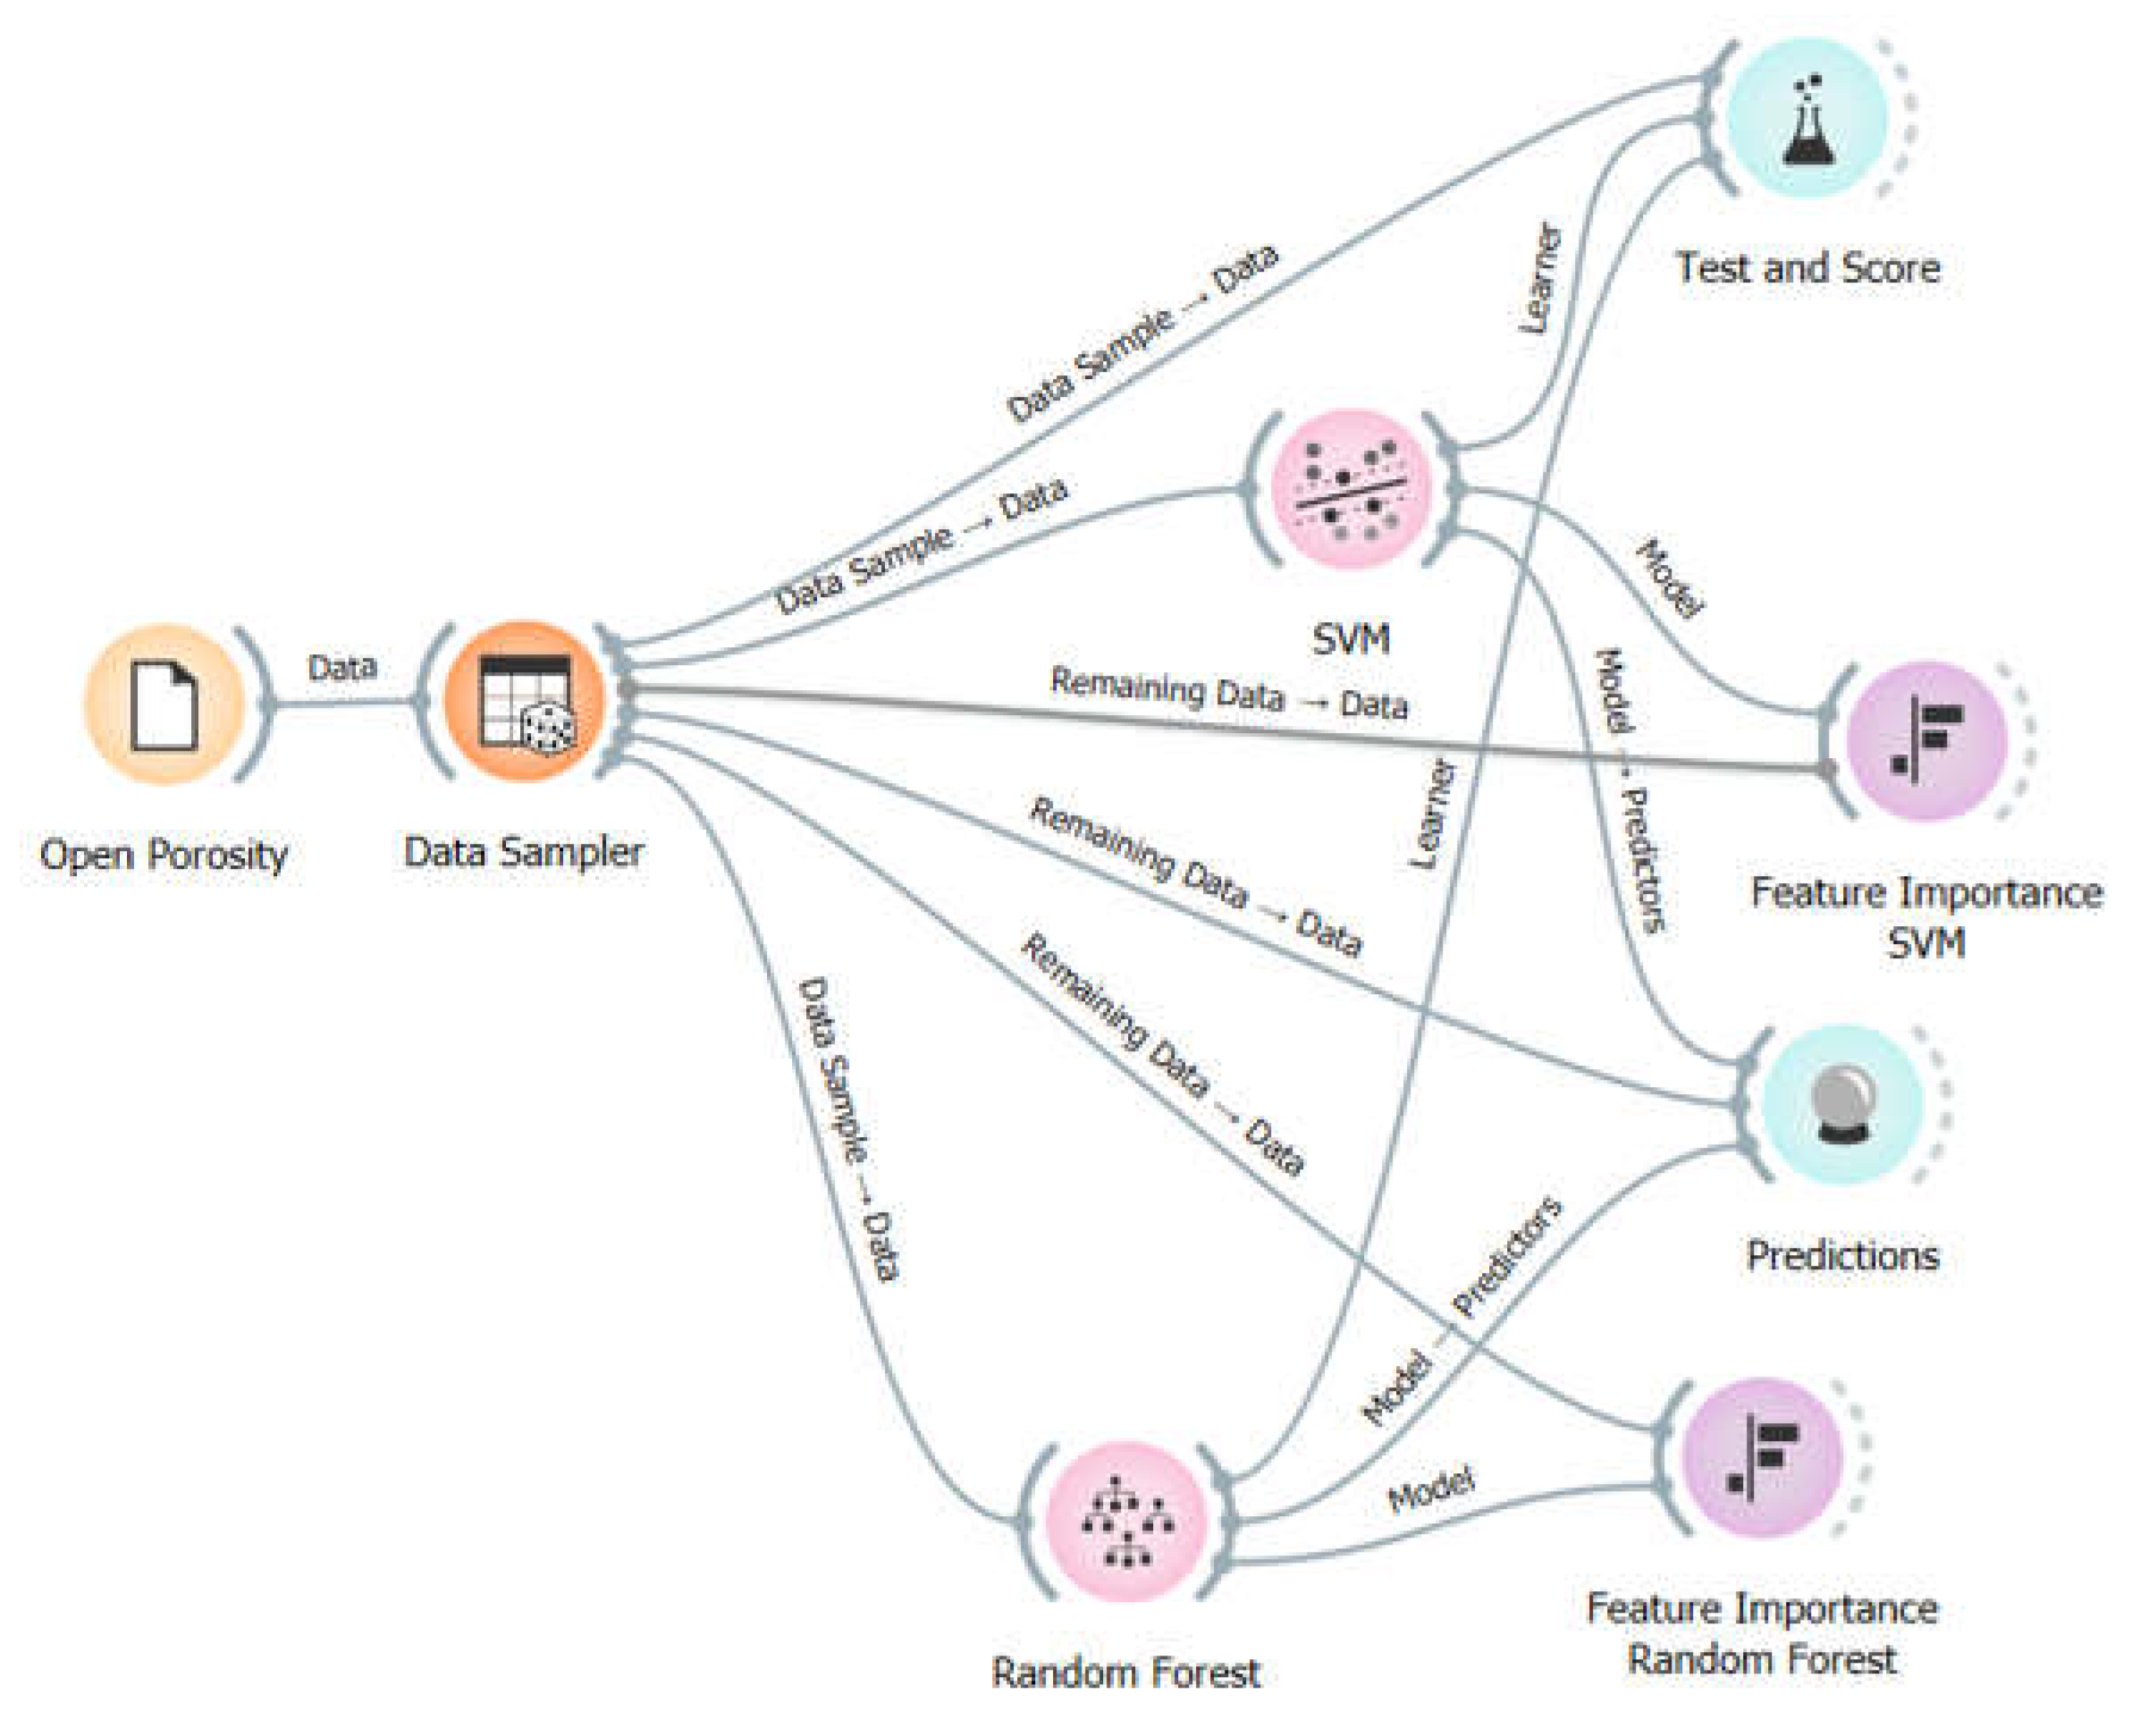
Figure 4.
RF Feature Importance (obtained from Orange software).
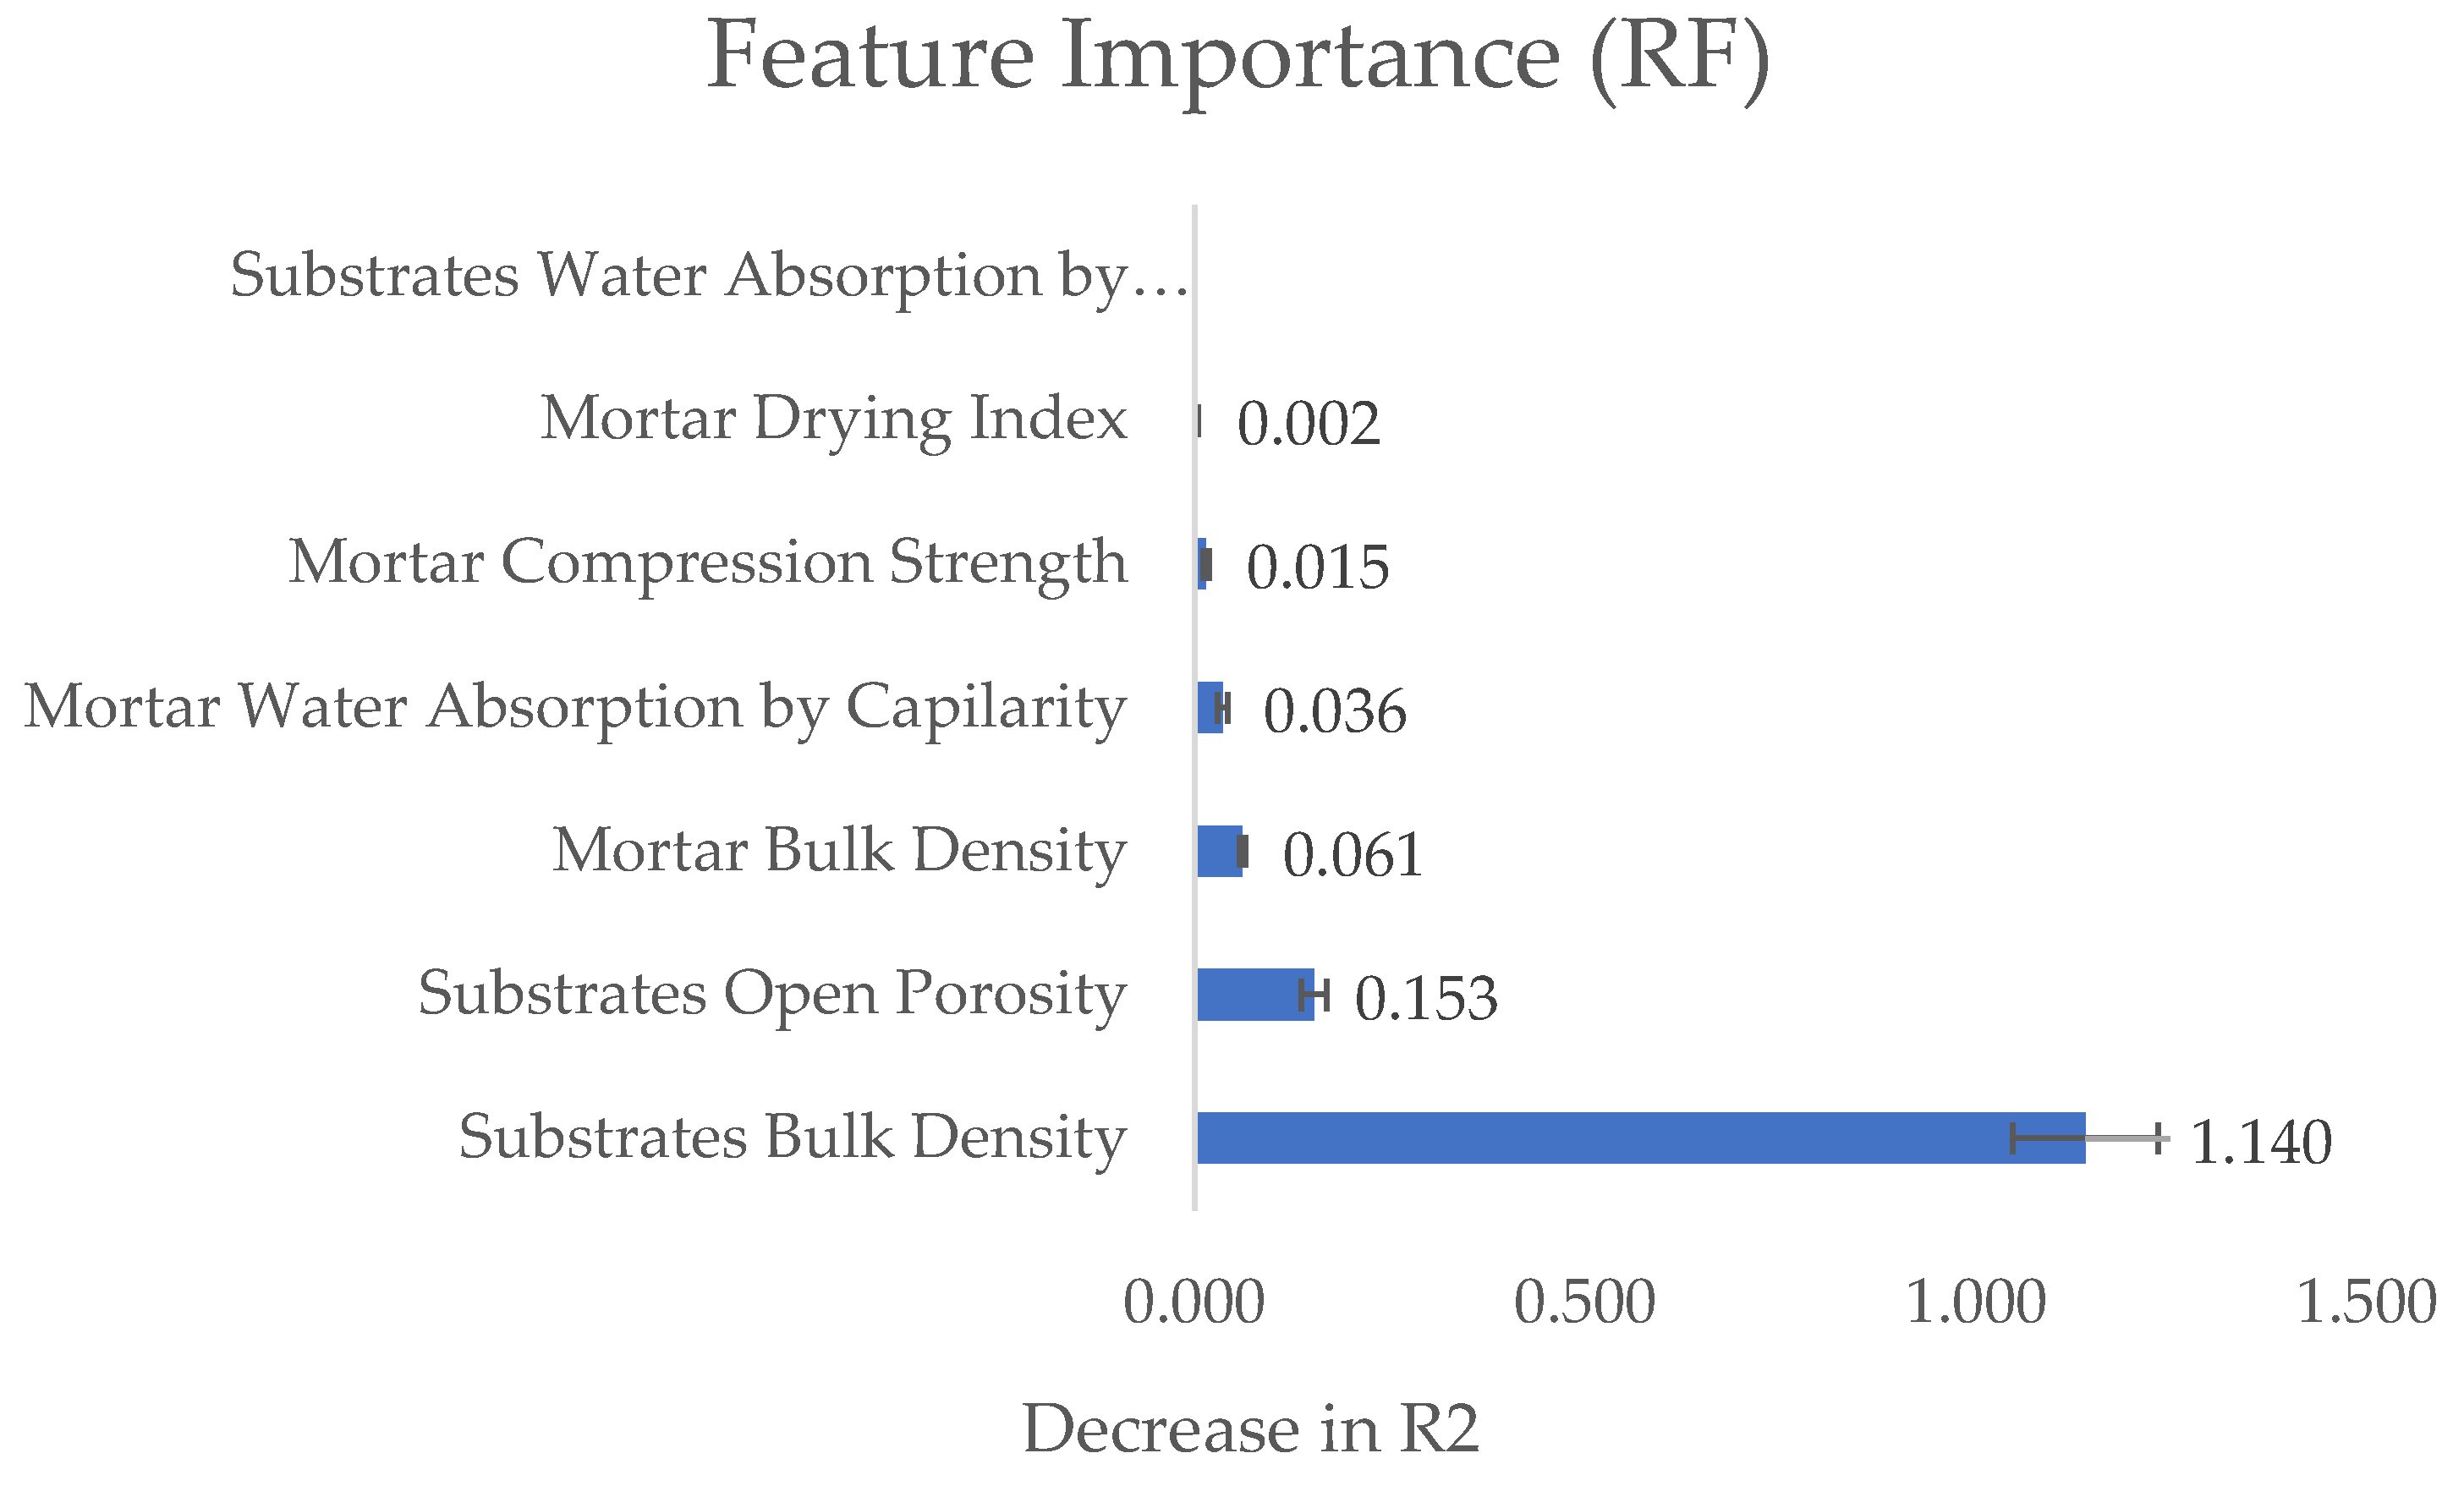
Figure 5.
SVM feature importance (obtained from Orange software).
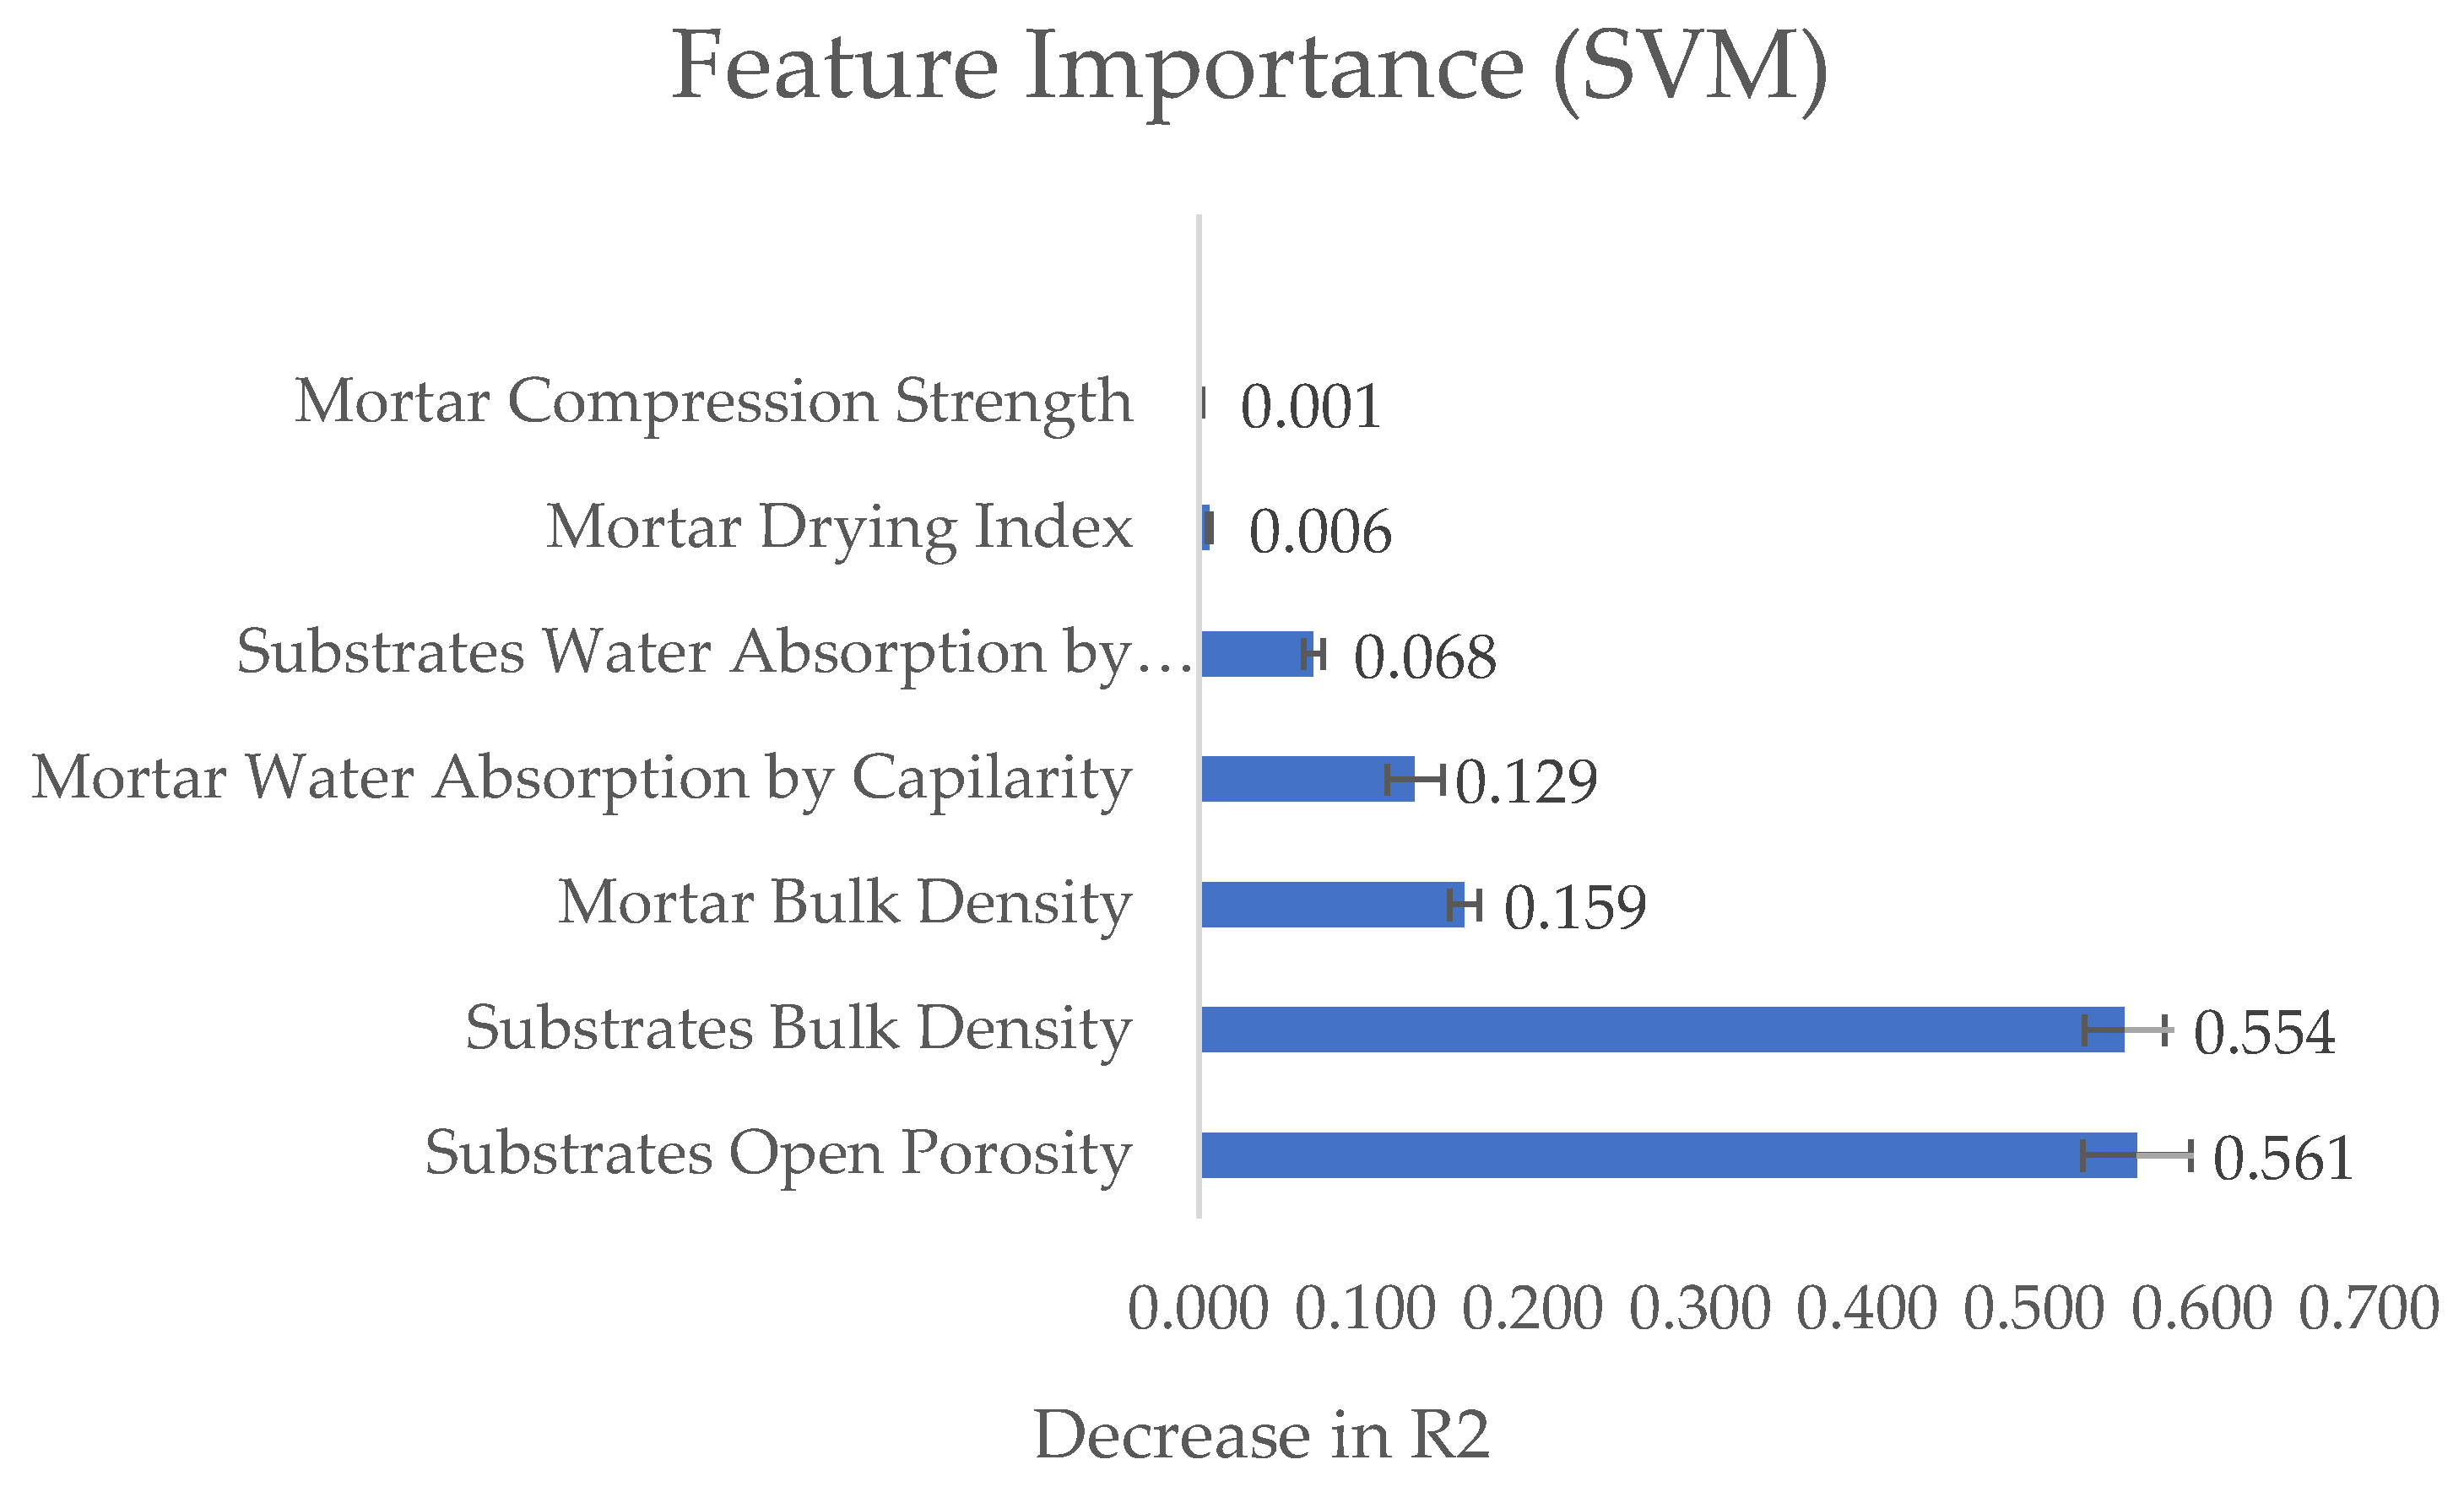

Table 1.
Substrates characterization.
| Substrates | Bulk Density (kg/m3) | Open Porosity (%) | Aw (kg/(m2.s0.5) | |
|---|---|---|---|---|
| Mean | CS | 2224±9 | 11.5±0.4 | 0.023±0.003 |
| CB | 2113±21 | 14.5±1.0 | 0.332±0.003 | |
| LCB | 1319±72 | 16.8±1.4 | 0.308±0.021 | |
| HCB | 2071±13 | 16.5±1.5 | 0.037±0.004 | |
| SCB | 2059±2 | 18.3±0.3 | 0.104±0.023 | |
| Min / Max | CS | 2216/ 2241 | 10.9 / 11.8 | 0.013 / 0.026 |
| CB | 2084/ 2138 | 13.3 / 15.6 | 0.326 / 0.336 | |
| LCB | 1194 / 1401 | 15.1 / 18.3 | 0.289 / 0.348 | |
| HCB | 2051 / 2082 | 15.1 / 18.7 | 0.031 / 0.042 | |
| SCB | 2002 / 2096 | 17.0 / 19.3 | 0.066 / 0.134 | |
CS-substrate concrete slab; CB-concrete block; LCB-lightweight concrete block; SCB-solid ceramic brick; HCB-hollow ceramic brick; ±standard deviation.
Table 2.
Mortars characterization.
| Mortar | Bulk Density (kg/m3) | Open Porosity (%) | Aw (kg/(m2.s0.5) | Drying Index | CS (MPa) | |
|---|---|---|---|---|---|---|
| Mean | MHCB | 1574±14 | 22.1±0.9 | 0.18±0.02 | 0.138±0.012 | 4.96±0.70 |
| MSCB | 1570±13 | 22.5±0.6 | 0.26±0.03 | 0.123±0.008 | 6.27±0.66 | |
| MCP | 1528±17 | 25.8±1.0 | 0.16±0.02 | 0.135±0.012 | 3.94±0.51 | |
| MCB | 1540±23 | 25.3±1.3 | 0.17±0.03 | 0.155±0.014 | 3.97±0.44 | |
| MLCB | 1475±18 | 30.3±0.6 | 0.31±0.02 | 0.117±0.008 | 3.99±0.35 | |
| Min / Max | MHCB | 1551 / 1606 | 20.1 / 24.0 | 0.13 / 0.24 | 0.112 / 0.160 | 3.5 / 6.4 |
| MSCB | 1533 / 1607 | 21.1 / 23.4 | 0.20 / 0.32 | 0.104 / 0.148 | 4.6 / 7.5 | |
| MCP | 1499 / 1566 | 23.6 / 28.3 | 0.13 / 0.20 | 0.115 / 0.160 | 2.9 / 4.9 | |
| MCB | 1496 / 1590 | 23.3 / 27.9 | 0.12 / 0.24 | 0.131 / 0.189 | 3.1 / 4.9 | |
| MLCB | 1441 / 1518 | 29.3 / 31.5 | 0.26 / 0.35 | 0.104 / 0.133 | 3.2 / 4.7 | |
MCP-mortar applied to concrete Slab; MCB-mortar applied to concrete block; MLCB-mortar applied to lightweight concrete block; MHCB: mortar applied to hollow ceramic brick; MSCB mortar applied to solid ceramic brick; ±standard deviation.
Table 3.
Training results.
| ML Models | Training Set | |||
|---|---|---|---|---|
| MSE | RMSE | MAE | R2 | |
| Support Vector Machine | 0.865 | 0.930 | 0.731 | 0.908 |
| Random Forest | 0.901 | 0.949 | 0.735 | 0.904 |
MAE (Mean Absolute Error); MSE (Mean Squared Error); RMSE (Root Mean Squared Error); (equation 8); R² (Coefficient of Determination).
Table 4.
Test results for Support Vector Machine (SVM).
| Runs | MSE | RMSE | MAE | R2 |
|---|---|---|---|---|
| 1 | 1.101 | 1.049 | 0.796 | 0.889 |
| 2 | 1.117 | 1.057 | 0.793 | 0.870 |
| 3 | 0.954 | 0.771 | 0.587 | 0.942 |
| 4 | 0.953 | 0.976 | 0.814 | 0.907 |
| 5 | 1.011 | 1.005 | 0.816 | 0.868 |
| 6 | 0.810 | 0.900 | 0.690 | 0.909 |
| 7 | 0.914 | 0.956 | 0.749 | 0.897 |
| 8 | 1.045 | 1.022 | 0.748 | 0.905 |
| 9 | 1.121 | 1.059 | 0.814 | 0.880 |
| 10 | 0.839 | 0.916 | 0.748 | 0.894 |
| Mean | 0.987±0.112 | 0.971±0.090 | 0.756±0.072 | 0.896±0.022 |
MAE (Mean Absolute Error); MSE (Mean Squared Error); RMSE (Root Mean Squared Error), Equation 8; R² (Coefficient of Determination); ±standard deviation.
Table 5.
Test results for Random Forest (RF).
| Runs | MSE | RMSE | MAE | R2 |
|---|---|---|---|---|
| 1 | 1.080 | 1.039 | 0.834 | 0.891 |
| 2 | 0.933 | 0.966 | 0.663 | 0.891 |
| 3 | 0.930 | 0.964 | 0.745 | 0.909 |
| 4 | 0.845 | 0.919 | 0.734 | 0.918 |
| 5 | 1.136 | 1.066 | 0.824 | 0.852 |
| 6 | 1.643 | 1.282 | 0.942 | 0.815 |
| 7 | 1.082 | 1.040 | 0.840 | 0.878 |
| 8 | 1.184 | 1.088 | 0.841 | 0.892 |
| 9 | 1.235 | 1.111 | 0.860 | 0.868 |
| 10 | 0.942 | 0.971 | 0.769 | 0.881 |
| Mean | 1.101±0.228 | 1.045±0.104 | 0.805±0.079 | 0.880±0.029 |
MAE (Mean Absolute Error); MSE (Mean Squared Error); RMSE (Root Mean Squared Error), Equation 8; R² (Coefficient of Determination); ±standard deviation.
Disclaimer/Publisher’s Note: The statements, opinions and data contained in all publications are solely those of the individual author(s) and contributor(s) and not of MDPI and/or the editor(s). MDPI and/or the editor(s) disclaim responsibility for any injury to people or property resulting from any ideas, methods, instructions or products referred to in the content. |
© 2024 by the authors. Licensee MDPI, Basel, Switzerland. This article is an open access article distributed under the terms and conditions of the Creative Commons Attribution (CC BY) license (http://creativecommons.org/licenses/by/4.0/).
Copyright: This open access article is published under a Creative Commons CC BY 4.0 license, which permit the free download, distribution, and reuse, provided that the author and preprint are cited in any reuse.


