
Submitted:
29 September 2024
Posted:
30 September 2024
You are already at the latest version
Abstract
This numerical study investigates the impact of reaction temperature, molar ratio of CH4:CO2, and catalyst porosity (p) on H2 yield and H2 selectivity during biogas dry reforming over a Ni/Cr catalyst. Using COMSOL Multiphysics, we conducted detailed simulations to elucidate the underlying reaction characteristics. Our findings reveal that increasing p significantly enhances H2 production and H2 selectivity, while simultaneously reducing CO selectivity. This effect is attributed to the improved mass transfer within the catalyst bed, leading to more efficient reactant conversion and product formation. Additionally, we observed a strong correlation between higher reaction temperatures and increased H2 yield and H2 selectivity, confirming the endothermic nature of the reforming process. By optimizing these operational parameters, our results suggest that Ni/Cr catalysts can be effectively employed for the sustainable production of H2 from biogas.
Keywords:
biogas dry reforming
; Ni/Cr catalyst
; numerical simulation
; reaction characteristics
; catalyst porosity
; H2 production
1. Introduction
The production of H2 as a clean energy carrier has attracted considerable attention in recent years because of its potential to address climate change and decrease reliance on fossil fuels. Among the different methods for generating H2, biogas dry reforming (BDR) stands out as a promising approach to utilize a renewable feedstock and create a valuable product. A biogas is a fuel consisting of CH4 (55 vol% - 75 vol%) and CO2 (25 vol% - 45 vol%) [1] generally. It is produced from fermentation by the action of anaerobic microorganisms on raw materials, e.g. garbage, livestock excretion, and sewage sludge. 1.46 EJ of produced biogas was obtained around the world in 2020 [2]. It was five times larger than that production in 2020 [2]. We can expect the amount of produced biogas will increase more and more in the near future. Consequently, this study thinks a biogas is a promising source to produce H2.
While a biogas is commonly utilized as a fuel for gas engines and micro gas turbines [3], its lower heating value due to a significant CO2 content can limit power generation efficiency. To overcome this limitation, the authors propose a synergistic system integrating BDR reactor with a solid oxide fuel cell (SOFC) [4,5,6]. CO, which is by-product from BDR, as well as H2 can be used as a fuel for SOFC. This approach allows for the valorization of biogas dry converting its CO2 and CH4 components into valuable syngas, which can then be efficiently utilized as a fuel in the SOFC. Consequently, this study thinks this system can be used for a wider operation application compared to the existing system.
Many researchers on biogas dry reforming (BDR) have been reported [7,8,9,10,11,12,13,14,15,16,17]. To decide the performance of BDR reactor, this study thinks the selection of catalyst is important. According to the literature survey, Ni-based catalysts have emerged as promising candidates due to their high superiority performance in converting biogas into valuable syngas for BDR [7,8,9,10,11,12,13,14,15,16,17]. Researches have investigated various Ni-based catalysts, including Ni/Co/TiO2, Ni-promoted pyrochlore, Ni/Al/LDH with Mg and Zn, and Ni-Ce/TiO2-ZrO2, Ni/Ru etc. to optimize BDR performance. These studies have demonstrated the influence of catalyst composition, reaction temperature, and molar ratio of CH4:CO2 on conversion rates, H2 yield, and product selectivity. While Ni-based catalyst has shown promising results, challenges such as catalyst deactivation, carbon formation, and H2/CO ratio control remain to be addressed. Recent advancements in catalyst design and process engineering have aimed to mitigate these issues and enhance the overall efficiency of BDR. For example, the incorporation of promoters or supports can improve catalyst stability and selectivity, while advanced reactor configurations can optimize heat and mass transfer.
At 900 ℃, Ni/Co/TiO2 catalyst performed CH4 conversion of 87.13 %, CO2 conversion of 92.6 % and H2 production of 41.1 % [7]. In this study [7], the optimum ratio of Ni and Cr was 7 wt% and 4 wt%, respectively. Ni with hollow silica spheres performed CH4 conversion of 94.4 % and CO2 conversion of 95 % [8]. Ni-promoted pyrochlore showed that the highest CH4 conversion and CO2 conversion were obtained in case of CH4:CO2 = 1.1 and 1.85:1, respectively [9]. BDR experiment was carried out using a Ni/Al/LDH with Mg and Zn in case of CH4:CO2:N2 = 1.5:1:7.5 at the temperature range from 500 ℃ to 700 ℃ [10]. This catalyst performed CH4 conversion of 73 %, CO2 conversion of 90 % and H2/CO ratio of approximately 2. Ni-Ce/TiO2-ZrO2 performed the highest CH4 conversion of approximately 98 % at 750 ℃ and the highest H2/CO ratio of approximately 0.71 and 800 ℃ [11]. Ni/Ru catalyst was investigated, exhibiting the performance that CH4 and CO2 conversions were 70 % and 78 %, respectively at 750 ℃ [12]. In case of CH4 rich condition, i.e. CH4:CO2 = 2:1, low Ni loading (2.5 wt%) modified with Gd, Sc or La showed the highest CH4 conversion of 49 %, the highest CO2 conversion of 95 % and the highest H2/CO ratio of 1.0 at 750 ℃ [13]. Kaviani et al investigated the effect of Ni loading on the performance of Ni/SiO2/SiO2 core-shell for BDR [14]. As a result, when Ni content increased from 2.5 wt % to 15 wt%, the Ni loading of 15 wt% performed the highest CH4 conversion of 75 %, the highest CO2 conversion of 90 % and the highest H2/CO ratio of 0.9. Ni-SiO2 sandwiched core-shell catalyst performed the highest CH4 conversion of 71.5 % and CO2 conversion of 91.5 % in case of CH4:CO2 = 1.5:1 at 700 ℃ [15]. SiO2 layer in sandwiched catalyst prevented the agglomeration of metal particles and minimized carbon deposition. Ni/LnOx (Ln = La, Ce, Sm or Pr) – type catalyst was developed for the investigation of the characteristics of BDR [16]. As a result, CH4 and CO2 conversions increased with the increase in reaction temperature from 600 ℃ to 750 ℃ irrespective of catalyst type, while the temperature change of H2/CO ratio depended on catalyst type. According to the review paper on Ni-based catalyst [17], CH4 and CO2 conversions increased with the increase in reaction temperature from 300 ℃ up to 1000 ℃ irrespective of the molar ratio of CH4:CO2. On the other hand, H2/CO ratio decreased with the increase in reaction temperature from 300 ℃ to 500 ℃ and kept the constant value, i.e. approximately 0 over 500 ℃.
Though several Ni alloy catalysts have been investigated, few Ni/Cr were reported except for experimental studies using membrane reactor, which was carried out by the authors of this paper [18,19]. These previous studies reported that Ni/Cr exhibited the better performance compared to Ni catalyst due to preventing a carbon deposition [18,19]. H2 yield obtained by Ni/Cr catalyst was approximately 10 – 100 times as large as that of Ni catalyst, which depended on experimental condition. H2 yield increased with the increase in temperature from 400 ℃ to 600 ℃ irrespective of molar ratio of CH4:CO2. The highest H2 yield which was 12.8 % was obtained using Ni/Cr in case of CH4:CO2 = 1.5:1 at 600 ℃ and the differential pressure between the reaction chamber and the sweep chamber of 0.010 MPa without sweep gas. In addition, CO selectivity is much larger than H2 selectivity within the temperature range from 400 ℃ to 600 ℃, which was over 90 %. According to the previous studies [18,19], it was thought that not only dry reforming (DR) but also the other reactions conducted. However, the numerical analysis on the characteristics of Ni/Cr alloy catalyst used for BDR including the other reactions has not been investigated, which means that the reaction mechanisms has not been clarified. In addition, a catalyst porosity (εp) which influences the performance of catalyst as well as reactor has not been investigated numerically and experimentally.
While Ni/Cr catalyst has shown a promising performance in previous experimental studies for BDR [18,19], its reaction mechanisms and the influence of εp on performance remain unclear. Therefore, this study aims to address these knowledge gaps through the numerical simulation using CFD software COMSOL Multiphysics. By investigating the impact of reaction temperature, molar ratio of CH4:CO2, and εp, the study seeks to elucidate the reaction characteristics and optimize H2 yield in BDR using Ni/Cr catalyst. Since there are more previous studies using COMSOL Multiphysics for numerical analysis on BDR and reports the reaction characteristics as well as heat and mass transfer [20,21,22,23], we have adopted COMSOL Multiphysics for the numerical analysis in this study. To investigate the impact of reaction temperature, molar ratio of CH4:CO2 and εp on the characteristics of BDR including the other reactions, the following reactions are considered:
<Dry reforming (DR)>
CH4 + CO2 ↔ 2H2 + 2CO + 247 kJ/mol
<Steam reforming (SR)>
CH4 + H2O ↔ CO + 3H2 + 206 kJ/mol
<Reverse water gas shift reaction (RWGS)>
CO2 + H2 ↔ CO + H2O + 41 kJ/mol
<Methanation reaction (MR)>
CO2 + 4H2 ↔ CH4 + 2H2O - 165.0 kJ/mol
<Methane decomposition reaction (MDR)>
CH4 ↔ C + 2H2 + 74 kJ/mol
<Boudouard reaction (BD)>
2CO ↔ C + CO2 - 172 kJ/mol
In this study, the reaction temperature is changed to 400 ℃, 500 ℃, 600 ℃ and 700 ℃. The molar ratio of CH4:CO2 is also changed as 1.5:1, 1:1 and 1:1.5. εp is also changed as 0.95, 0.7, 0.4 and 0.1.
2. Numerical Simulation of BDR over Ni/Cr Catalyst
2.1. A Mathematical Formulation
The numerical simulation conducted by a multi-physics software, COMSOL Multiphysics, ver. 6.2. In COMSOL Multiphysics, users could select or customize various partial differential equations and combine them to achieve direct coupled multi-physics field analysis easily [24]. The COMSOL Multyphysics has a simulation function codes. The following governing equations are involved in COMSOL Multiphysics.
The equations of mass conservation in porous material can be defined, as following:
where is a velocity vector [m/s], κ is a permeability [m2], μ is a viscosity [Pa・s], p is a pressure [Pa], ρ is a density [kg/m3], g is a gravitational acceleration [m2/s], D is a height [m] and Qm is a mass source term [kg/(m3・s)].
The equation of momentum conservation in porous material can be defined by Brinkmann equation, as following:
where εp is a porosity [-], is a unit vector [-] and is a force vector [kg/(m3・s)].
The equation of mass transfer in porous material can be defined by Maxell-Stefan
equation, as following:
where , is a mass ratio of chemical i and k, respectively [-], is a Fick’s diffusion coefficient of effective multi components [m2/s], is a thermal diffusion coefficient [kg/(m・s)] and is a reaction rate of chemical species [mol/(m3・s)].
The equations of heat transfer in porous material can be defined, as following:
where f is a physical quantity on fluid [-], Cp is the constant pressure specific heat [J/(kg・K)], is a thermal flux vector [W/m2], Q is a thermal source [W/m3], Qp is a thermal source due to pressure loss [W/m3], Qvd is a thermal source due to viscosity dissipation [W/m3] and keff is an effective thermal conductivity [W/(m・K)].
2.2. 3D Numerical Modeling of BDR
Figure 1 illustrates the overview of 3D model. Figure 2 illustrates the front view of 3D model. The 3D model simulates the experimental apparatus of reaction chamber used for the previous experimental studies carried out by the authors [18,19]. Though the biogas dry reforming experiment was carried out using membrane reactor in the previous studies [18,19], this study focuses on the reaction chamber only without H2 separation to clarify the reaction characteristics of biogas dry reforming including the other reactions. The dimension of 3D model is 40 mm × 40 mm × 100 mm. The both inlet and outlet area is 6 mm × 6 mm.
2.3. Kinetic Modeling of BDR
This study considers the reaction shown by Equations (1) – (5) for the numerical simulation. Reaction rates of these equations are defined as follows [25,26,27]:
<Dry reforming (DR)>
where , , , .
<Steam reforming (SR)>
where , , , , , .
<Reverse water gas shift reaction (RWGS)>
where, .
<Methanation reaction (MR)>
where , , ,
, , .
<Methane decomposition reaction (MDR)>
where , , , .
<Boudouard reaction (BD)>
where , , , . In addition, is a kinetic rate (n = 1, 2, 3, 4, 4, 6) [mol/(kg・s)], is a kinetic constant (n = 1, 2, 3, 4, 5, 6) [mol/(kg・s)], is a particle pressure of chemical species i [Pa], is an equilibrium constant (n = 1, 2, 3, 4, 5, 6) [-] and is an absorption equilibrium constants of chemical species i [-].
2.4. Numerical Simulation Parameters and Conditions for BDR
In this study, the molar ratio of CH4:CO2 is changed by 1.5:1, 1:1 and 1:1.5. The initial reaction temperature is changed by 400 ℃, 500 ℃, 600 ℃ and 700 ℃. Ni/Cr alloy is assumed to be the catalyst, which was used for the previous experimental studies [18,19].
The weight ratio of Cr to the whole weight of Ni/Cr alloy is 20 wt%. The porosity, permeability, constant pressure specific heat and thermal conductivity of Ni/Cr alloy catalysts are estimated considering the weight ratio of Cr. εp is changed by 0.95, 0.7, 0.4 and 0.1. Table 1 lists the main physical properties and parameters for the numerical simulation in this study.
In this study, the following assumptions are set:
- (i)
- Catalyst is a porous material. The porosity, permeability, constant pressure specific heat and thermal conductivity and isotropic.
- (ii)
- Wall temperature is isothermal.
- (iii)
- Gas is a Newton fluid and an ideal gas.
- (iv)
- Wall of reactor excluding inlet and outlet is no-slip.
- (v)
- The pressure of outlet is atmosphere (gauge pressure = 0 Pa).
- (vi)
- The temperature of inflow gas is same as the initial reaction temperature.
- (vii)
- The produced carbon is treated as a gas.
2.5. Evaluaion Factors and Reaction Pathways in BDR
In this study, the following evaluation factors are considered:
CH4 conversion = [%] (20)
where is a molar concentration of CH4 at the inlet [mol], is a molar concentration of CH4 at the outlet [mol].
CO2 conversion = [%] (21)
where is a molar concentration of CO2 at the inlet [mol], is a molar concentration of CO2 at the outlet [mol].
H2 yield = [%] (22)
where is a molar concentration of H2 at the outlet [mol].
H2 selectivity = [%] (23)
where is a molar concentration of CO at the outlet [mol].
CO selectivity = [%] (24)
3. Results and Discussion
3.1. Impact of Catalyst Porosity on Reaction, Heat, and Mass Transfer Phenomena in BDR
Figure 3, Figure 4, Figure 5 and Figure 6. Illustrate the 3D distributions of molar concentrations (CH4, CO2, H2, CO2, H2O and C), temperature, gas pressure, and gas velocity within the reactor. To exemplify the numerical simulation results, Figure 3 and Figure 5 present the data for the CH4:CO2 ratio of 1.5:1 at 600 ℃ with εp of 0.95, while Figure 4 and Figure 6 show the corresponding data for the same conditions but with a lower εp of 0.1.
As depicted in Figure 3 and Figure 4, the molar concentrations of CH4 and CO2 (reactants) decrease progressively along the gas flow from the inlet to the outlet, regardless of εp. In the initial section (0 mm≤y≤20 mm), the molar concentrations of CH4 and CO2 exhibit a radial gradient, with higher values near the center and lower values near the wall. However, this radial distribution becomes less pronounced or disappears in the downstream region (30 mm≤y≤100 mm). This behavior can be attributed to the high gas velocity near the inlet, which promotes preferential axial flow and limits radial diffusion. As the gas progresses through the reactor, the diffusion becomes more significant, leading to a more uniform distribution. In addition, the molar concentrations of H2, CO, H2O and C, which are products, increase along the gas flow direction from the inlet to the outlet, regardless of εp. Conversely, the temperature profiles depicted in Figure 5 and Figure 6 demonstrate a decrease from the initial reaction temperature of 600 ℃, except near the inlet and the outlet regions. This temperature reduction is attributed to the endothermic nature of reactions described by Equations (1) – (6). These observations validate the accuracy of the simulated reaction model. Furthermore, the gas velocity is notably higher near the inlet and the outlet compared to the central reaction of the reactor. This is due to the larger cross sectional area in these regions. However, away from the inlet and the outlet, the gas velocity stabilizes as a result of sufficient gas diffusion towards the reactor walls.
As illustrated in Figure 3 and Figure 4, a higher εp leads to lower molar concentrations of CH4 and CO2 and conversely, higher molar concentrations of H2, CO, H2O and C. This enhancement in product formation and reactant consumption can be attributed to the improved mass transfer within the porous catalyst structure at higher εp values. The enhanced diffusivity within the catalyst facilitates reactant diffusion to active sites and product diffusion away from the catalyst surface, thereby promoting the reaction kinetics. Further analysis of Figure 5 and Figure 6 reveals that the temperature for εp = 0.95 is lower than that for εp = 0.1. This observation can be attributed to the enhanced diffusion within the catalyst bed at higher porosities, facilitating the progress of the endothermic reactions (Equations (1), (2), (3) and (5)). Additionally, the pressure near the inlet is lower for εp = 0.95 compared to εp = 0.1, which is directly related to the increased catalyst permeability at higher porosities as indicated in Table 1.
Figure 7, Figure 8, Figure 9 and Figure 10 illustrate the influence of εp on the distribution of molar concentrations along the reactor centerline for CH4:CO2 = 1.5:1 at various reaction temperature (400 ℃, 500 ℃, 600 ℃ and 700 ℃). εp is changed by 0.95, 0.7, 0.4 and 0.1. The results demonstrate that increasing εp leads to a decrease in the molar concentrations of CH4 and CO2, while simultaneously enhancing the concentrations of H2, CO, H2O and C. This enhancement is attributed to the improved mass diffusion within the porous catalyst structure, facilitating the progress of the reforming reactions. Moreover, elevating the reaction temperature promotes the formation of H2 and CO, as evidenced by the increased molar concentrations of these species. The enhanced performance of DR, SR, RWGS and MR, as described by Equations (1) – (4), at higher reaction temperature contributes to the observed H2 and CO production.
Figure 11 quantitatively evaluates the influence of εp on the distribution of molar concentration ratios for each gas along the reactor centerline under the condition of CH4:CO2 = 1.5:1 at 600 ℃. The analysis reveals that the impact of εp on the molar concentration distribution becomes more pronounced as εp increases, regardless of the gas species. Notably, the effect of εp on the products species (H2, CO, H2O and C) is more significant near the inlet (y = 20 m), while the influence on the reactant species (CH4 and CO2) is more pronounced near the outlet (y > 60 m). This observation can be attributed to the gradual consumption of CH4 and CO2 through the various reaction (Equations (1) – (5)) along the gas flow. The enhanced diffusivity within the porous catalyst at higher εp values contributes to the more significant impact on reactant concentrations near the outlet.
Figure 12 illustrates the influence of εp on the distribution of temperature for CH4:CO2 = 1.5:1 at 600 ℃. As depicted in the figure, a larger temperature drop is observed near the inlet (y = 20 m) with increasing εp. This phenomenon is attributed to the dominance of the endothermic reactions represented by Equations (1), (2), (2) and (5), which absorbs heat from the surrounding, leading to a localized temperature decrease.
3.2. Influence of Molar Ratio of CH4:CO2 on BDR over Ni/Cr Catalyst
Figure 13 and Figure 14 compare the distribution of molar concentration for different molar ratios of CH4:CO2 at 400 ℃ and 700 ℃, respectively with εp = 0.95. The results indicate that the highest molar concentrations of CH4 and CO2 are achieved at CH4:CO2 = 1.5:1 and 1:1.5, respectively, regardless of the reaction temperature. This is primarily attributed to the higher inflow rates associated with these ratios. Additionally, the highest molar concentration of H2 and CO2 are consistently observed at CH4:CO2 = 1:1 irrespective of reaction temperature, aligning with the theoretical molar ratio for DR.
Regarding H2O production, the highest molar concentration of H2O is obtained for CH4:CO2 = 1:1.5 at 700 ℃. This is due to the favorable conditions for MR, which consumes CO2 to produce H2O. In contrast, at 400 ℃, the highest H2O concentration occurs at CH4:CO2 = 1:1 and 1:1.5. Under these conditions, RWGS, which also produces H2O, is more favored due to its exothermic nature. The lower molar concentration of H2O at 400 ℃ for CH4:CO2 = 1.5:1 can be attributed to the reduced availability of CO2 for RWGS. Moreover, the molar concentration of C is lower at 700 ℃ compared to 400 ℃, suggesting a decreased contribution of BD at higher temperatures.
3.3. Comparison of Numerical Simulation and Experimental Results for BDR
To comprehensively evaluate the performance of BDR including the other reactions, this study employs the evaluation merits defined by Equations (20) – (24). Table 2 presents a comparative analysis of CH4 conversion, CO2 conversion, H2 yield, H2 selectivity and CO selectivity for various εp at CH4:CO2 = 1.5:1 and the reaction temperature of 600 ℃.
As shown in Table 2, increasing εp leads to enhanced CH4 conversion, CO2 conversion, H2 yield and H2 selectivity. Conversely, CO selectivity decreases with rising εp. The improved performance can be attributed to enhanced mass diffusion within the porous catalyst structure. This facilitates the progress of the reaction, particularly those consuming CH4 and CO2 as reactants.
Table 3 presents a comparative analysis of CH4 conversion, CO2 conversion, H2 yield, H2 selectivity and CO selectivity among various reaction temperatures for CH4:CO2 = 1.5:1 and εp = 0.95. Table 4 provides a similar comparison based on experimental data for εp 0.95 obtained from the previous experimental study conducted by the authors using membrane reactor [18]. Due to the experimental limitations, data for 700 ℃ were not available in the experimental study [18]. The data presented in Table 4 correspond to the specific condition of 0 MPa of pressure difference between the reaction chamber and the sweep chamber, without the use of a sweep gas. This condition aligns with the numerical simulation setup, which does not consider H2 separation.
As expected from the endothermic nature of H2 production reactions (Equations (1), (2) and (5)), Table 3 and Table 4 reveal a positive correlation between the reaction temperature and both H2 yield and H2 selectivity. However, a discrepancy exists between the numerical simulation results (Table 3) and the experimental data (Table 4). While the simulation predicts the positive CO2 conversion and high CO selectivity, the experimental results indicate the negative CO2 conversion and a very high CO selectivity. This suggests that additional reactions beyond those included in the current model (Equations (1) – (6)) might be occurring in the experiment. To reconcile this discrepancy, a re-evaluation of the reaction scheme employed in the numerical simulations is planned for future investigations.
Furthermore, the previous experimental study by the authors utilized a membrane reactor for H2 separation [18]. The current simulations do not account for reactions involving H2 separation. Therefore, a future work will explore the development of numerical simulations specially tailored to BDR in a membrane reactor setting.
4. Conclusion
This study employed numerical simulations using COMSOL Multiphysics to elucidate the reaction characteristics of a Ni/Cr catalyst employed for BDR. By systematically varying reaction temperature, molar ratio of CH4:CO2, and εp, the study aimed to comprehensively understand the impact of these parameters on the BDR process. The findings of this investigation are summarized as follows:
- The results indicate that increasing εp leads to a decrease in the molar concentrations of CH4 and CO2, while simultaneously enhancing the molar concentrations of H2, CO, H2O and C. This enhancement is attributed to the improved mass diffusion within the porous catalyst structure, while facilitates the progress of the reforming reactions.
- A positive correlation is observed between the reaction temperature and the molar concentrations of H2 and CO. The enhancement of H2 and CO production is attributed to the promotion of DR, SR, RWGS and MR at elevated reaction temperatures.
- The results indicate that the influence of εp on the distribution of molar concentration of all gases increases with rising εp. Notably, the impact of εp on the product species (H2, CO, H2O and C) is more pronounced near the inlet (y = 20 m), whereas the effect of εp on reactant species (CH4 and CO2) is more significant near the outlet (y > 60 m).
- A more pronounced temperature drop near the inlet (y = 20 m) is observed with increasing εp. This phenomenon is attributed to the dominance of the endothermic reactions in this region, which absorb heat from the surroundings, leading to a localized temperature decrease.
- The highest molar concentration of H2 and CO2 are consistently obtained for CH4:CO2 = 1:1, regardless of the reaction temperature. This finding aligns with the theoretical stoichiometry of DR, where equal molar amounts of CH4 and CO2 are converted to H2 and CO2. Therefore, the optimal CH4:CO2 for maximizing product yields in BDR is 1:1.
- The highest molar concentration of H2O is observed at 700 ℃ for CH4:CO2 = 1:1.5, whereas the highest molar concentration of H2O at 400 ℃ occurred with CH4:CO2 = 1:1 and 1:1.5. Additionally, the molar concentration of C is found to be lower at 700 ℃ compared to 400 ℃, suggesting a reduced contribution of BD at higher reaction temperatures.
- The results indicate that increasing εp leads to higher CH4 conversion, CO2 conversion, H2 yield and H2 selectivity. Conversely, CO selectivity decreases with increasing εp. Furthermore, both numerical simulations’ and experiments’ data demonstrate a positive correlation between the reaction temperature and H2 yield and H2 selectivity. This enhancement is attributed to the endothermic nature of the reactions producing H2, which are favored at higher reaction temperatures.
Author Contributions
Conceptualization and writing—original draft preparation, A.N.; methodology and software, S.Y. and R.I.; data curation, M.I. and T.H.; writing—review and editing, M.L.K.
Funding
This research was funded by KRI cooperation.
Data Availability Statement
The authors agree to share the data of the article published in this journal.
Conflicts of Interest
The authors declare no conflicts of interest.
References
- Kalai, D.Y.; Stangeland, K.; Jin, R.; Tucho, W.M.; Yu, Z. Biogas dry reforming for syngas production on La promoted hydrotalcitederived Ni catalyst. International Journal of Hydrogen Energy. 2018, 43, 19438–19450. [Google Scholar] [CrossRef]
- 2. World Bioenergy Association. Available online: https:worldbioenergy.org/global-bienergy-statistics (accessed on 19 September 2024).
- The Japan Gas Association. Available online: https://www.gas.or.jp/gas-life/biogas/ (accessed on 19 September 2024).
- Nishimura, A.; Takada, T.; Ohata, S.; Kolhe, M.L. Biogas dry reforming for hydrogen through membrane reactor utilizing negative pressure. fuels. 2021, 2, 194–209. [Google Scholar] [CrossRef]
- Nishimura, A.; Hayashi, Y.; Ito, S.; Kolhe, M.L. Performance analysis of hydrogen production for a solid oxide fuel cell system using a biogas dry reforming membrane reactor with Ni and Ni/Cr catalysts. fuels. 2023, 4, 295–313. [Google Scholar] [CrossRef]
- Nishimura, A.; Sato, R.; Hu, E. An energy production system powered by solar heat with biogas dry reforming reactor and solar heat with biogas dry reforming reactor and solid oxide fuel cell. Smart Grid and Renewable Energy. 2023, 14, 85–106. [Google Scholar] [CrossRef]
- Sharma, H.; Dhir, A. Hydrogen augmentation of biogas through dry reforming over bimetallic nickel-cobalt catalysts supported on titania. Fuel. 2020, 279. [Google Scholar] [CrossRef]
- Yusuf, M.; Farooqi, A.S.; Keong, L.K.; Hellgardt, K.; Abdullah, B. Contemporary trends in composite Ni-based catalysts for CO2 reforming of methane. Chemical Engineering Science. 2021, 229. [Google Scholar] [CrossRef]
- Sache, E.L.; Moreno, A.A.; Reina, T.R. Biogas conversion to syngas using advanced Ni-promoted pyrochlore catalysts: effect of the CH4/CO2 ratio. Frontiers in Chemistry. 2021, 9. [Google Scholar] [CrossRef]
- Rosset, M.; Feris, L.A.; Perez-Lopez, O.W. Biogas dry reforming using Ni-Al-LDH catalysts reconstructed with Mg and Zn. International Journal of Hydrogen Energy. 2021, 46, 20359–20376. [Google Scholar] [CrossRef]
- Shah, M.; Modal, P. Optimization of CO2 reforming of methane process for the syngas production over Ni-Ce/TiO2-ZrO2 catalyst using the Taguchi method. International Journal of Hydrogen Energy. 2021, 46, 22799–22812. [Google Scholar] [CrossRef]
- Moreno, A.A.; Ramirez-Reina, T.; Ivanoya, S.; Roger, A.C.; Centeno, M.A.; Odriozola, J.A. Bimetallic Ni-Ru and Ni-Re catalysts for dry reforming of methane: understanding the synergies of the selected promoters. Frontiers in Chemistry. [CrossRef]
- Ha, Q.L.M.; Atia, H.; Kreyenschulte, C.; Lund, H.; Bartling, S.; Lisak, G.; Wohlrab, S.; Armbruster, U. Effects of modifier (Gd, Sc, La) addition on the stability of low Ni content catalyst for dry reforming of model biogas. Fuel. 2022, 312. [Google Scholar] [CrossRef]
- Kaviani, M.; Rezaei, M.; Alavi, S.M.; Akbari, E. High coke resistance Ni-SiO2@SiO2 core-shell catalyst for biogas dry reforming: effects of Ni loading and calcination temperature. Fuel. 2022, 330. [Google Scholar] [CrossRef]
- Kaviani, M.; Rezaei, M.; Alavi, S.M.; Akbari, E. Biogas dry reforming over nickel-silica sandwiched core-shell catalysts with various shell thicknesses. Fuel. 2024, 355. [Google Scholar] [CrossRef]
- Georgiadis, A.G.; Siakavelas, G.I.; Tsiotsias, A.I.; Charisiou, N.D.; Ehrhardt, B.; Wang, W.; Sebastian, V.; Hinder, S.J.; Baker, M.A.; Mascotto, S.; Goula, M.A. Biogas dry reforming over Ni/LnOx-type catalysts (Ln = La, Ce, Sm or Pr). International Journal of Hydrogen Energy. 2023, 48, 19953–19971. [Google Scholar] [CrossRef]
- Chava, R.; Varma, D.B.A; Roy, B.; Appari, S. Recent advances and perspectives of perovskite-derived Ni-based catalysts for CO2 reforming of biogas. Journal of CO2 Utilization. 2022, 65. [Google Scholar] [CrossRef]
- Nishimura, A.; Hayashi, Y.; Ito, S.; Kolhe, M.L. Performance analysis of hydrogen production for a solid oxide fuel cell system using a biogas dry reforming membrane reactor with Ni and Ni/Cr catalysts. fuels. 2023, 4, 295–313. [Google Scholar] [CrossRef]
- Nishimura, A.; Ichikawa, M.; Yamada, S.; Ichii, R. The characteristics of a Ni/Cu/Ru catalyst for a biogas dry reforming membrane reactor using a Pd/Cu membrane and a comparison of it with a Ni/Cr catalyst. hydrogen. 2024, 5, 414–435. [Google Scholar] [CrossRef]
- Lee, S.; Lim, H. The power of molten salt in methane dry reforming: conceptual design with a CFD study. Chemical Engineering and Processing- Process Intensification. [CrossRef]
- Lee, S.; Lim, H. The effect of changing the number of membranes in methane carbon dioxide reforming: a CFD study. Journal of Industrial and Engineering Chemistry. 2020, 87, 110–119. [Google Scholar] [CrossRef]
- Ghasemzadeh, K.; Ghahremani, M.; Amiri, T.Y.; Basile, A. Performance evaluation of Pd-Ag membrane reactor in glyceol steam reforming process: development of the CFD model. International Journal of Hydrogen Energy. 2019, 44, 1000–1009. [Google Scholar] [CrossRef]
- Lee, B.; Lee, S.; Lim, H. Numerical modeling studies for a methane dry reforming in a membrane reactor. Journal of Nature Gas Science and Engineering. 2016, 34, 1251–1261. [Google Scholar] [CrossRef]
- Nishimura, A.; Mishima, D.; Ito, S.; Konbu, T.; Hu, E. Impact of separator thickness on relationship between temperature distribution and mass & current density distribution in single HT-PEMFC. Thermal Science and Engineering. 2023, 6. [Google Scholar] [CrossRef]
- Lee, S.; Lim, H. The power of molten salt in methane dry reforming: conceptual design with a CFD study. Chemical Engineering and Processing. 2020, 159. [Google Scholar] [CrossRef]
- Amini, A.; Sedaghat, M.H.; Jamshidi, S.; Shariati, A.; Rahimpour, M.R. A comprehensive CFD simulation of an industrial-scale side-fired steam methane reformer to enhance hydrogen production. Chemical Engineering and Processing. 2023, 184. [Google Scholar] [CrossRef]
- Benguerbaa, Y.; Virginieb, M.; Dumas, C. Computational fluid dynamics study of the dry reforming of methane over Ni/Al2O3 catalyst in membrane reactor – coke deposition. Kinetic and Catalysis. 2017, 58, 345–355. [Google Scholar] [CrossRef]
Figure 1.
3D model structure of numerical simulation in this study (left: full scale, right: actual numerical simulation scale).
Figure 1.
3D model structure of numerical simulation in this study (left: full scale, right: actual numerical simulation scale).
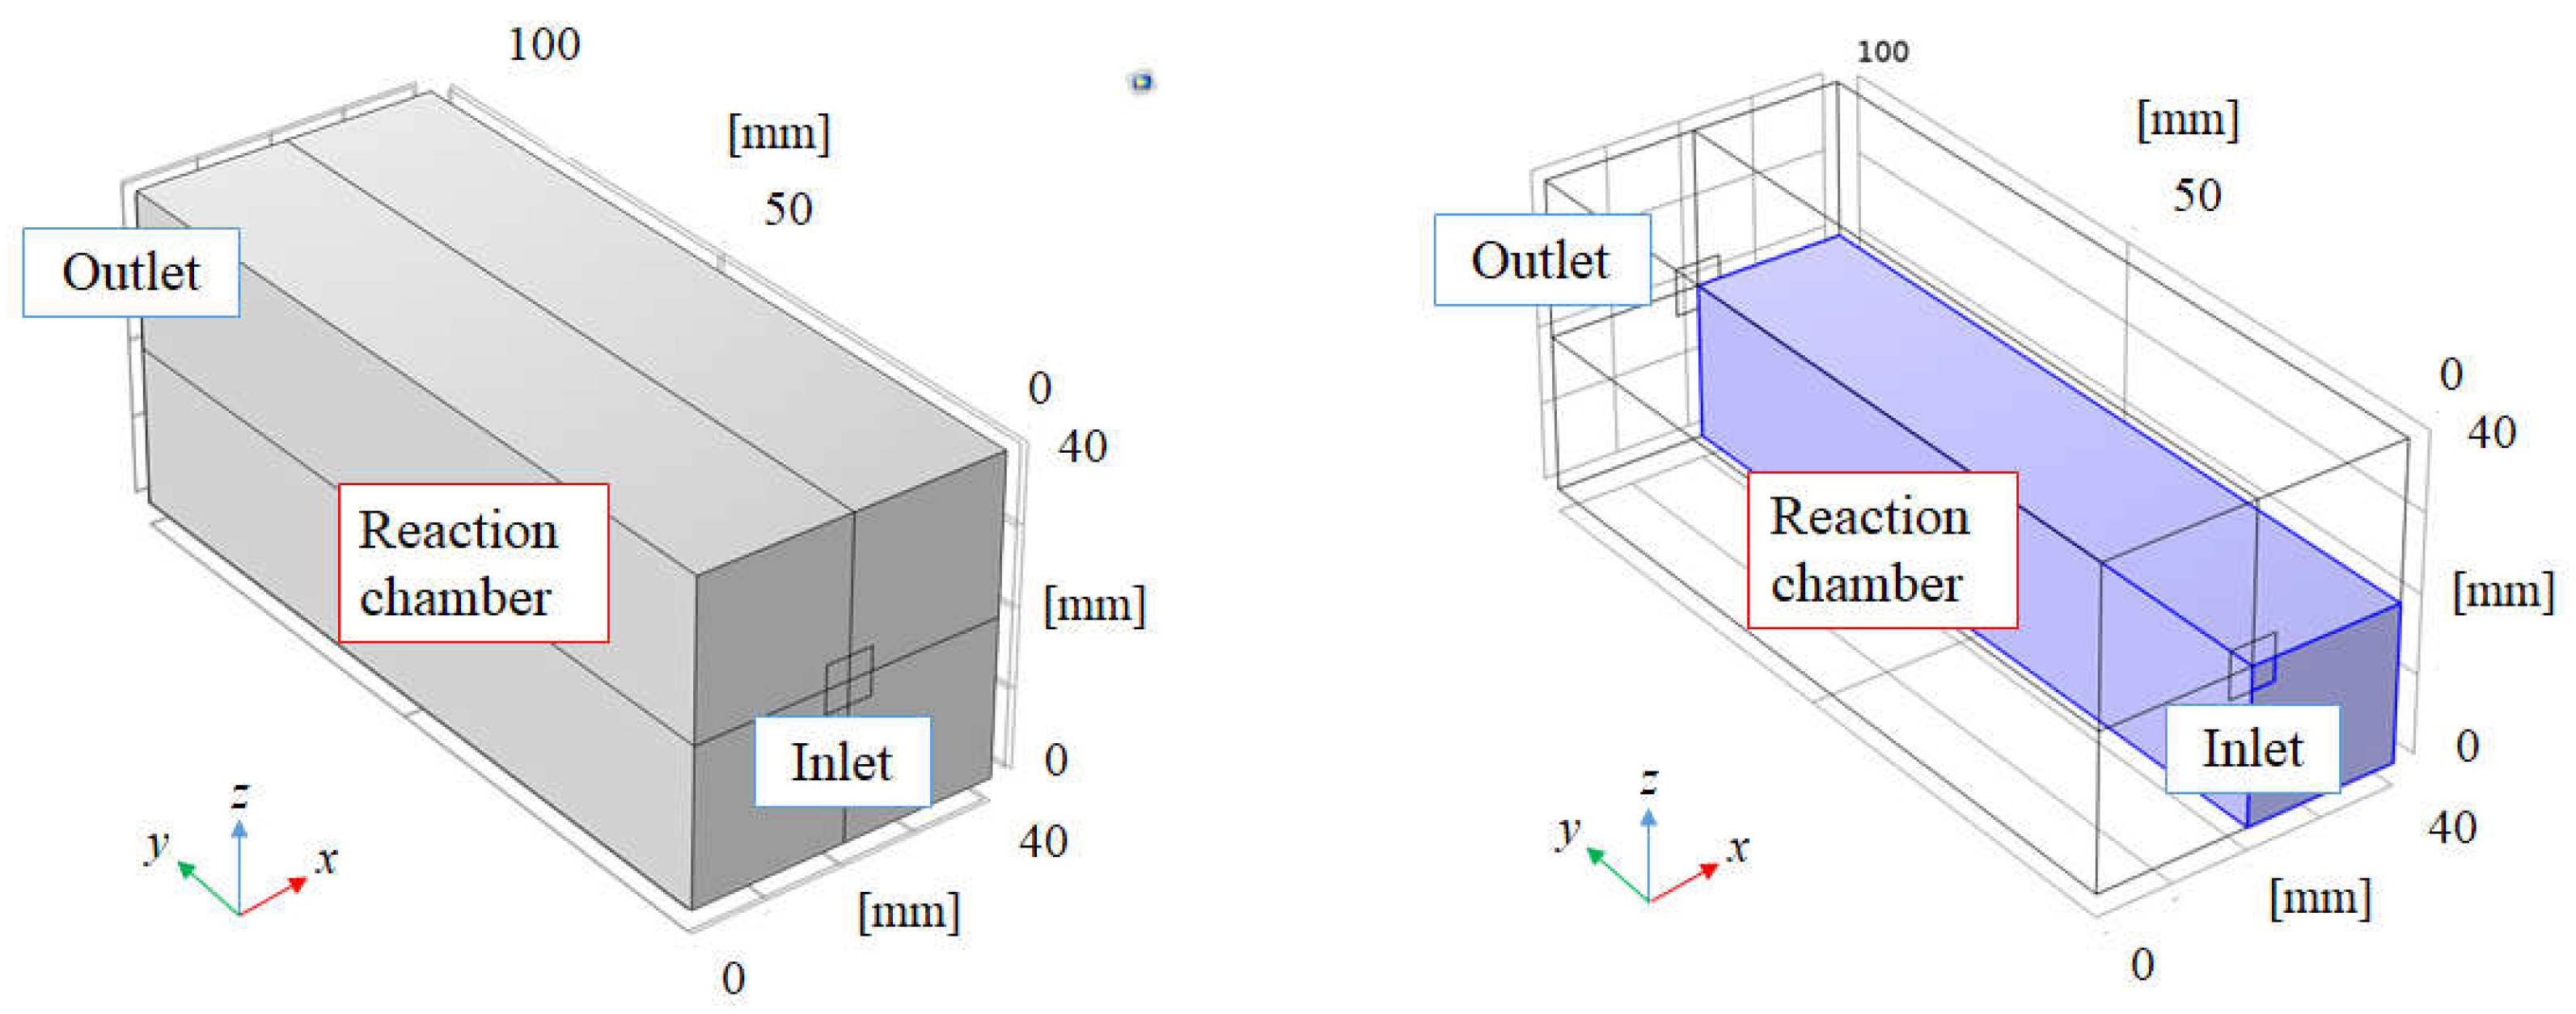
Figure 2.
Front view of 3D model (left: full scale, right: actual numerical simulation scale).
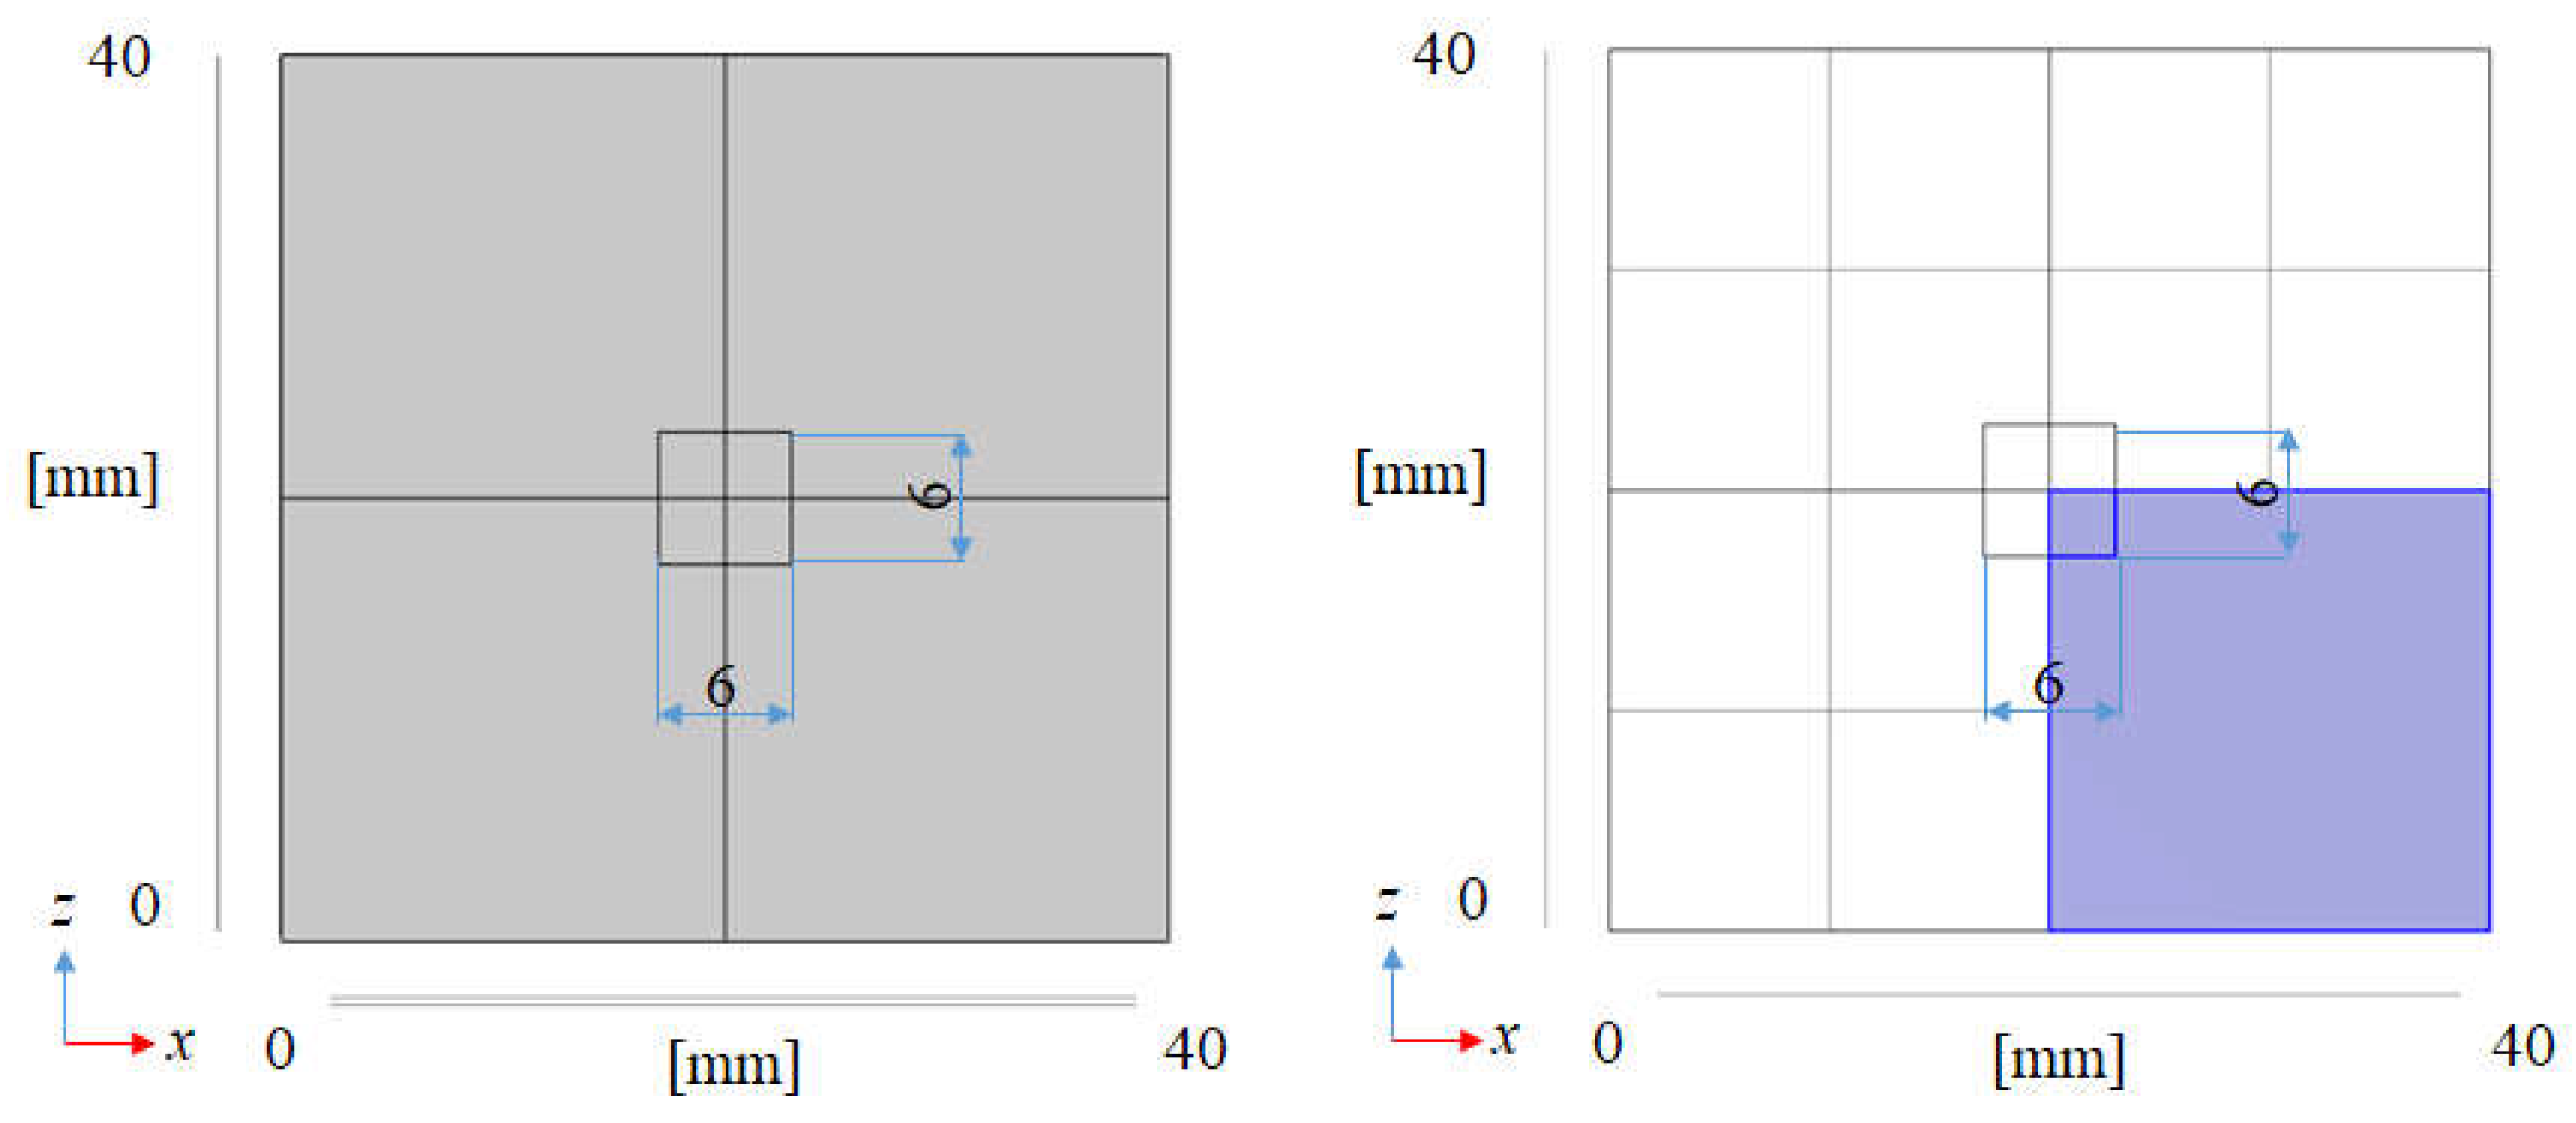
Figure 3.
3D distribution of molar concentrations of CH4, CO2, H2, CO, H2O and C in reactor (εp = 0.95).
Figure 3.
3D distribution of molar concentrations of CH4, CO2, H2, CO, H2O and C in reactor (εp = 0.95).
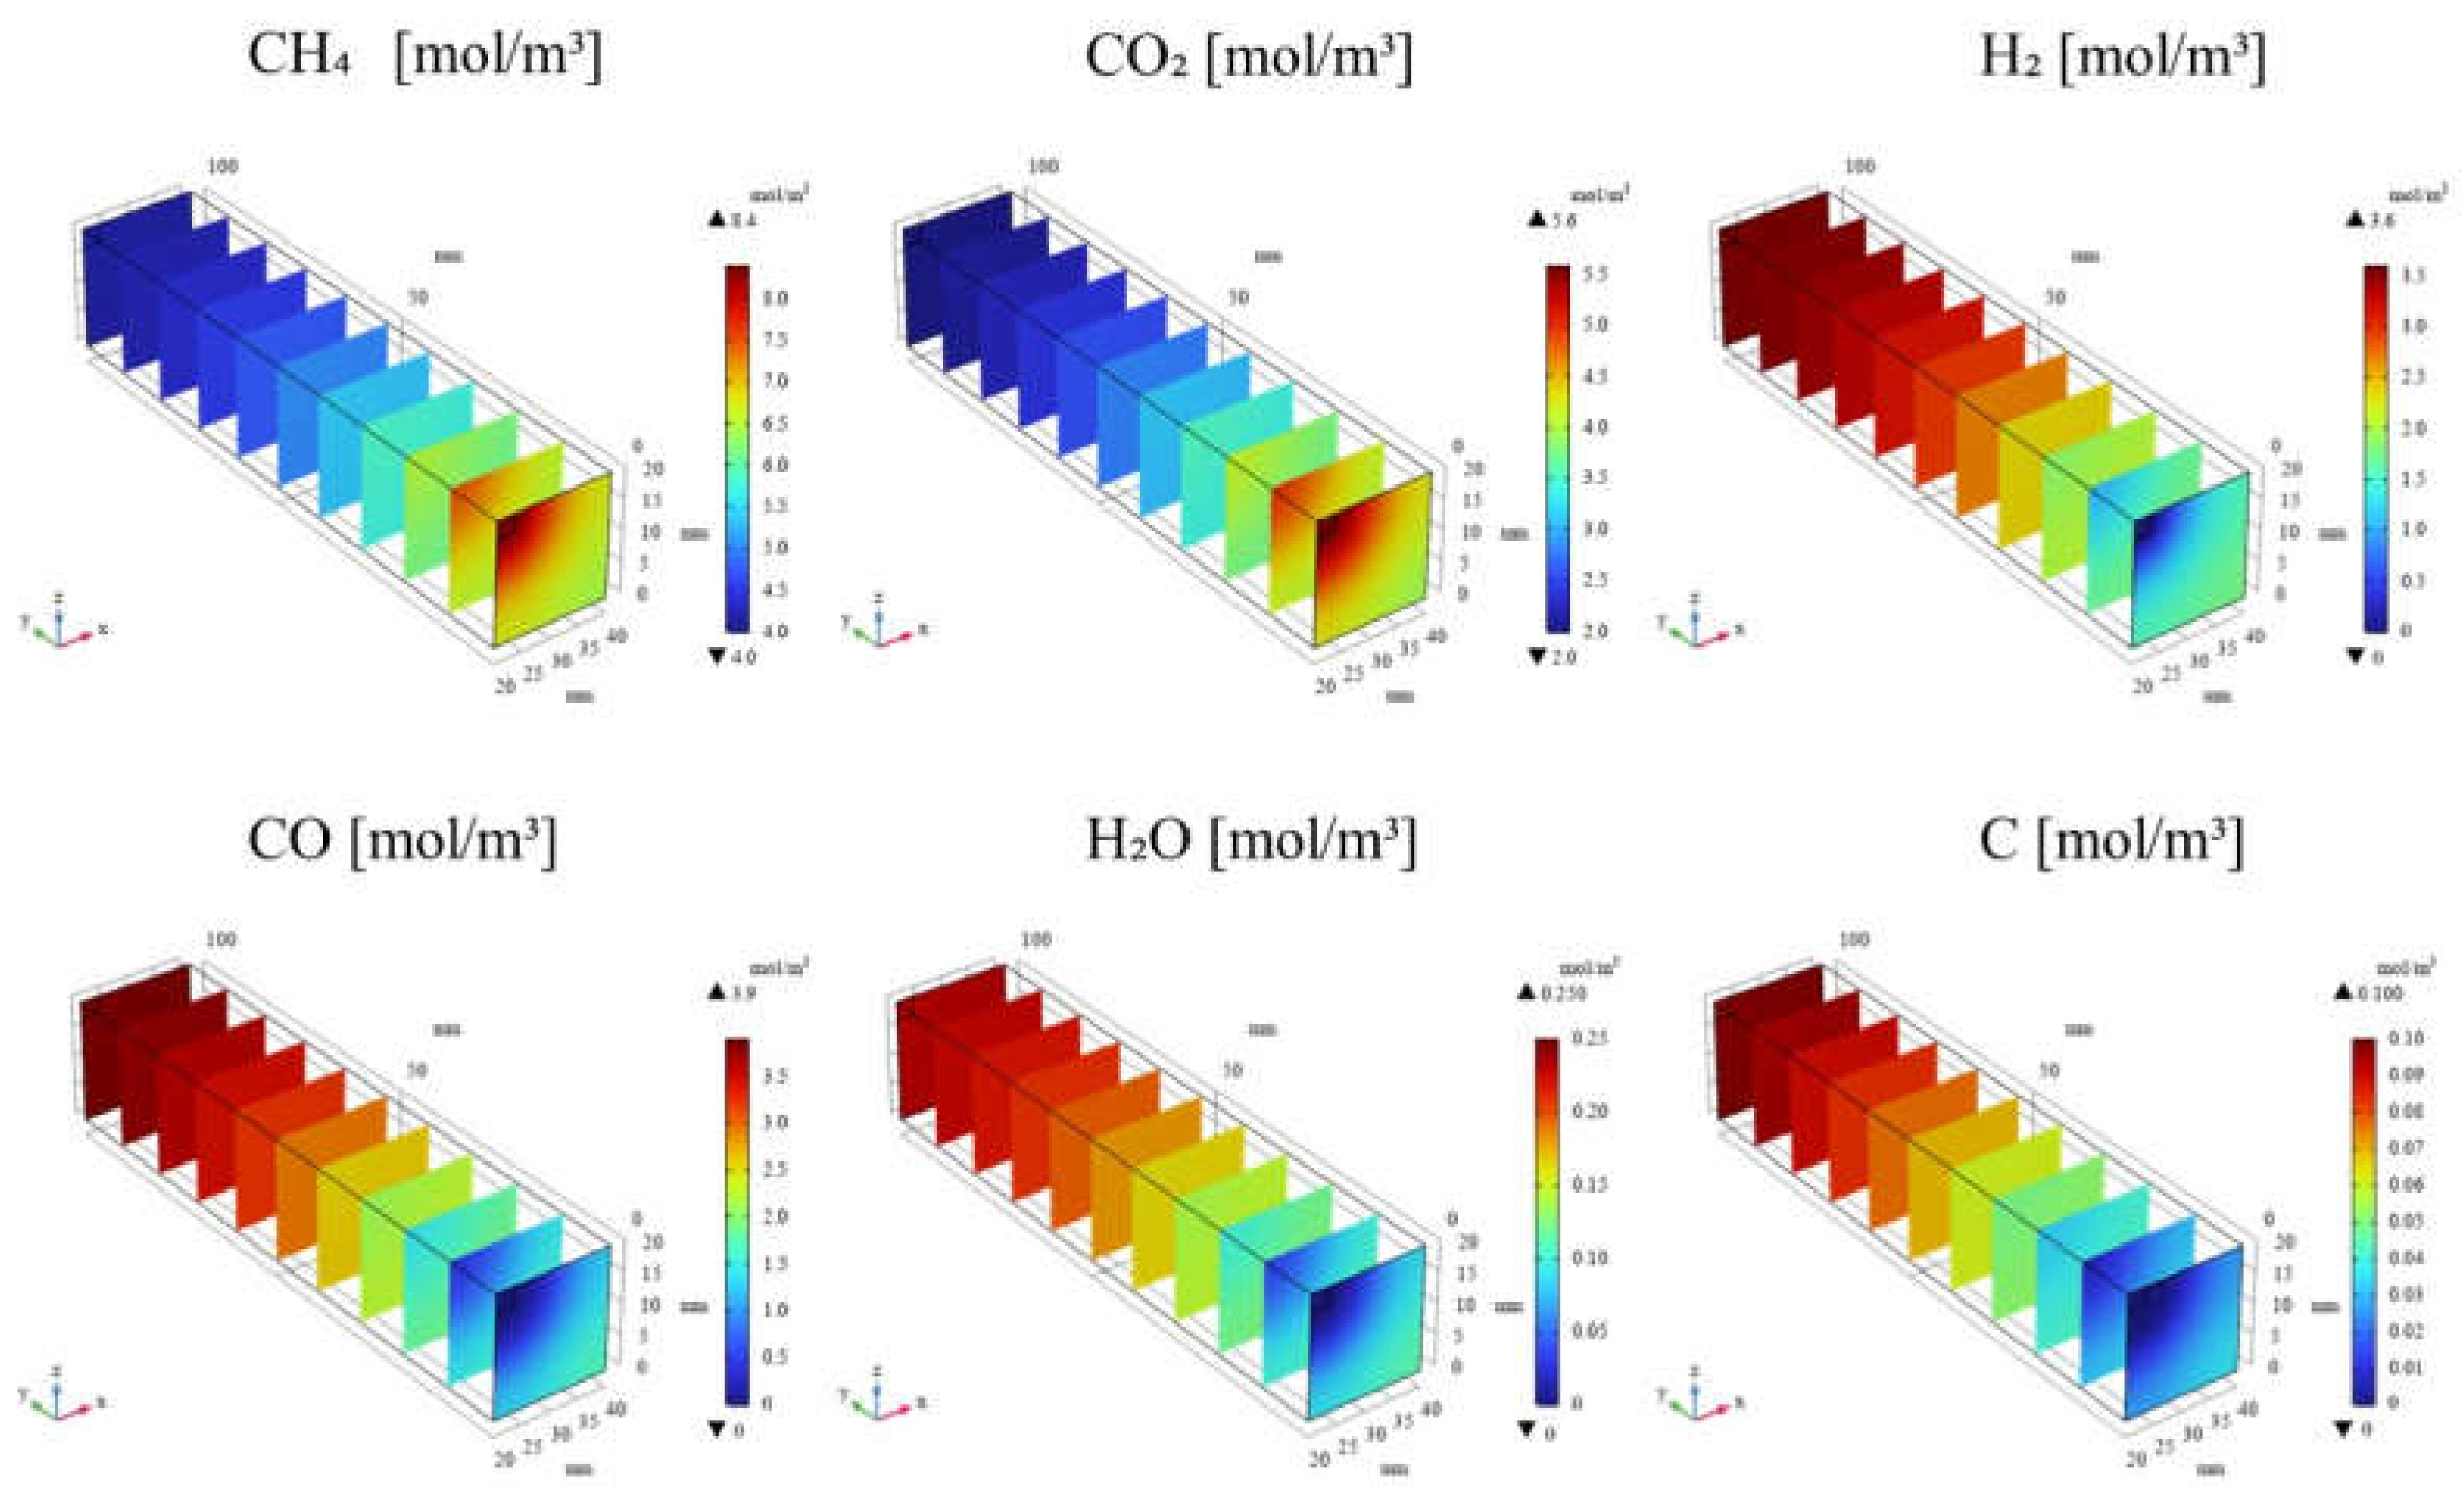
Figure 4.
3D distribution of molar concentrations of CH4, CO2, H2, CO, H2O and C in reactor (εp = 0.1).
Figure 4.
3D distribution of molar concentrations of CH4, CO2, H2, CO, H2O and C in reactor (εp = 0.1).
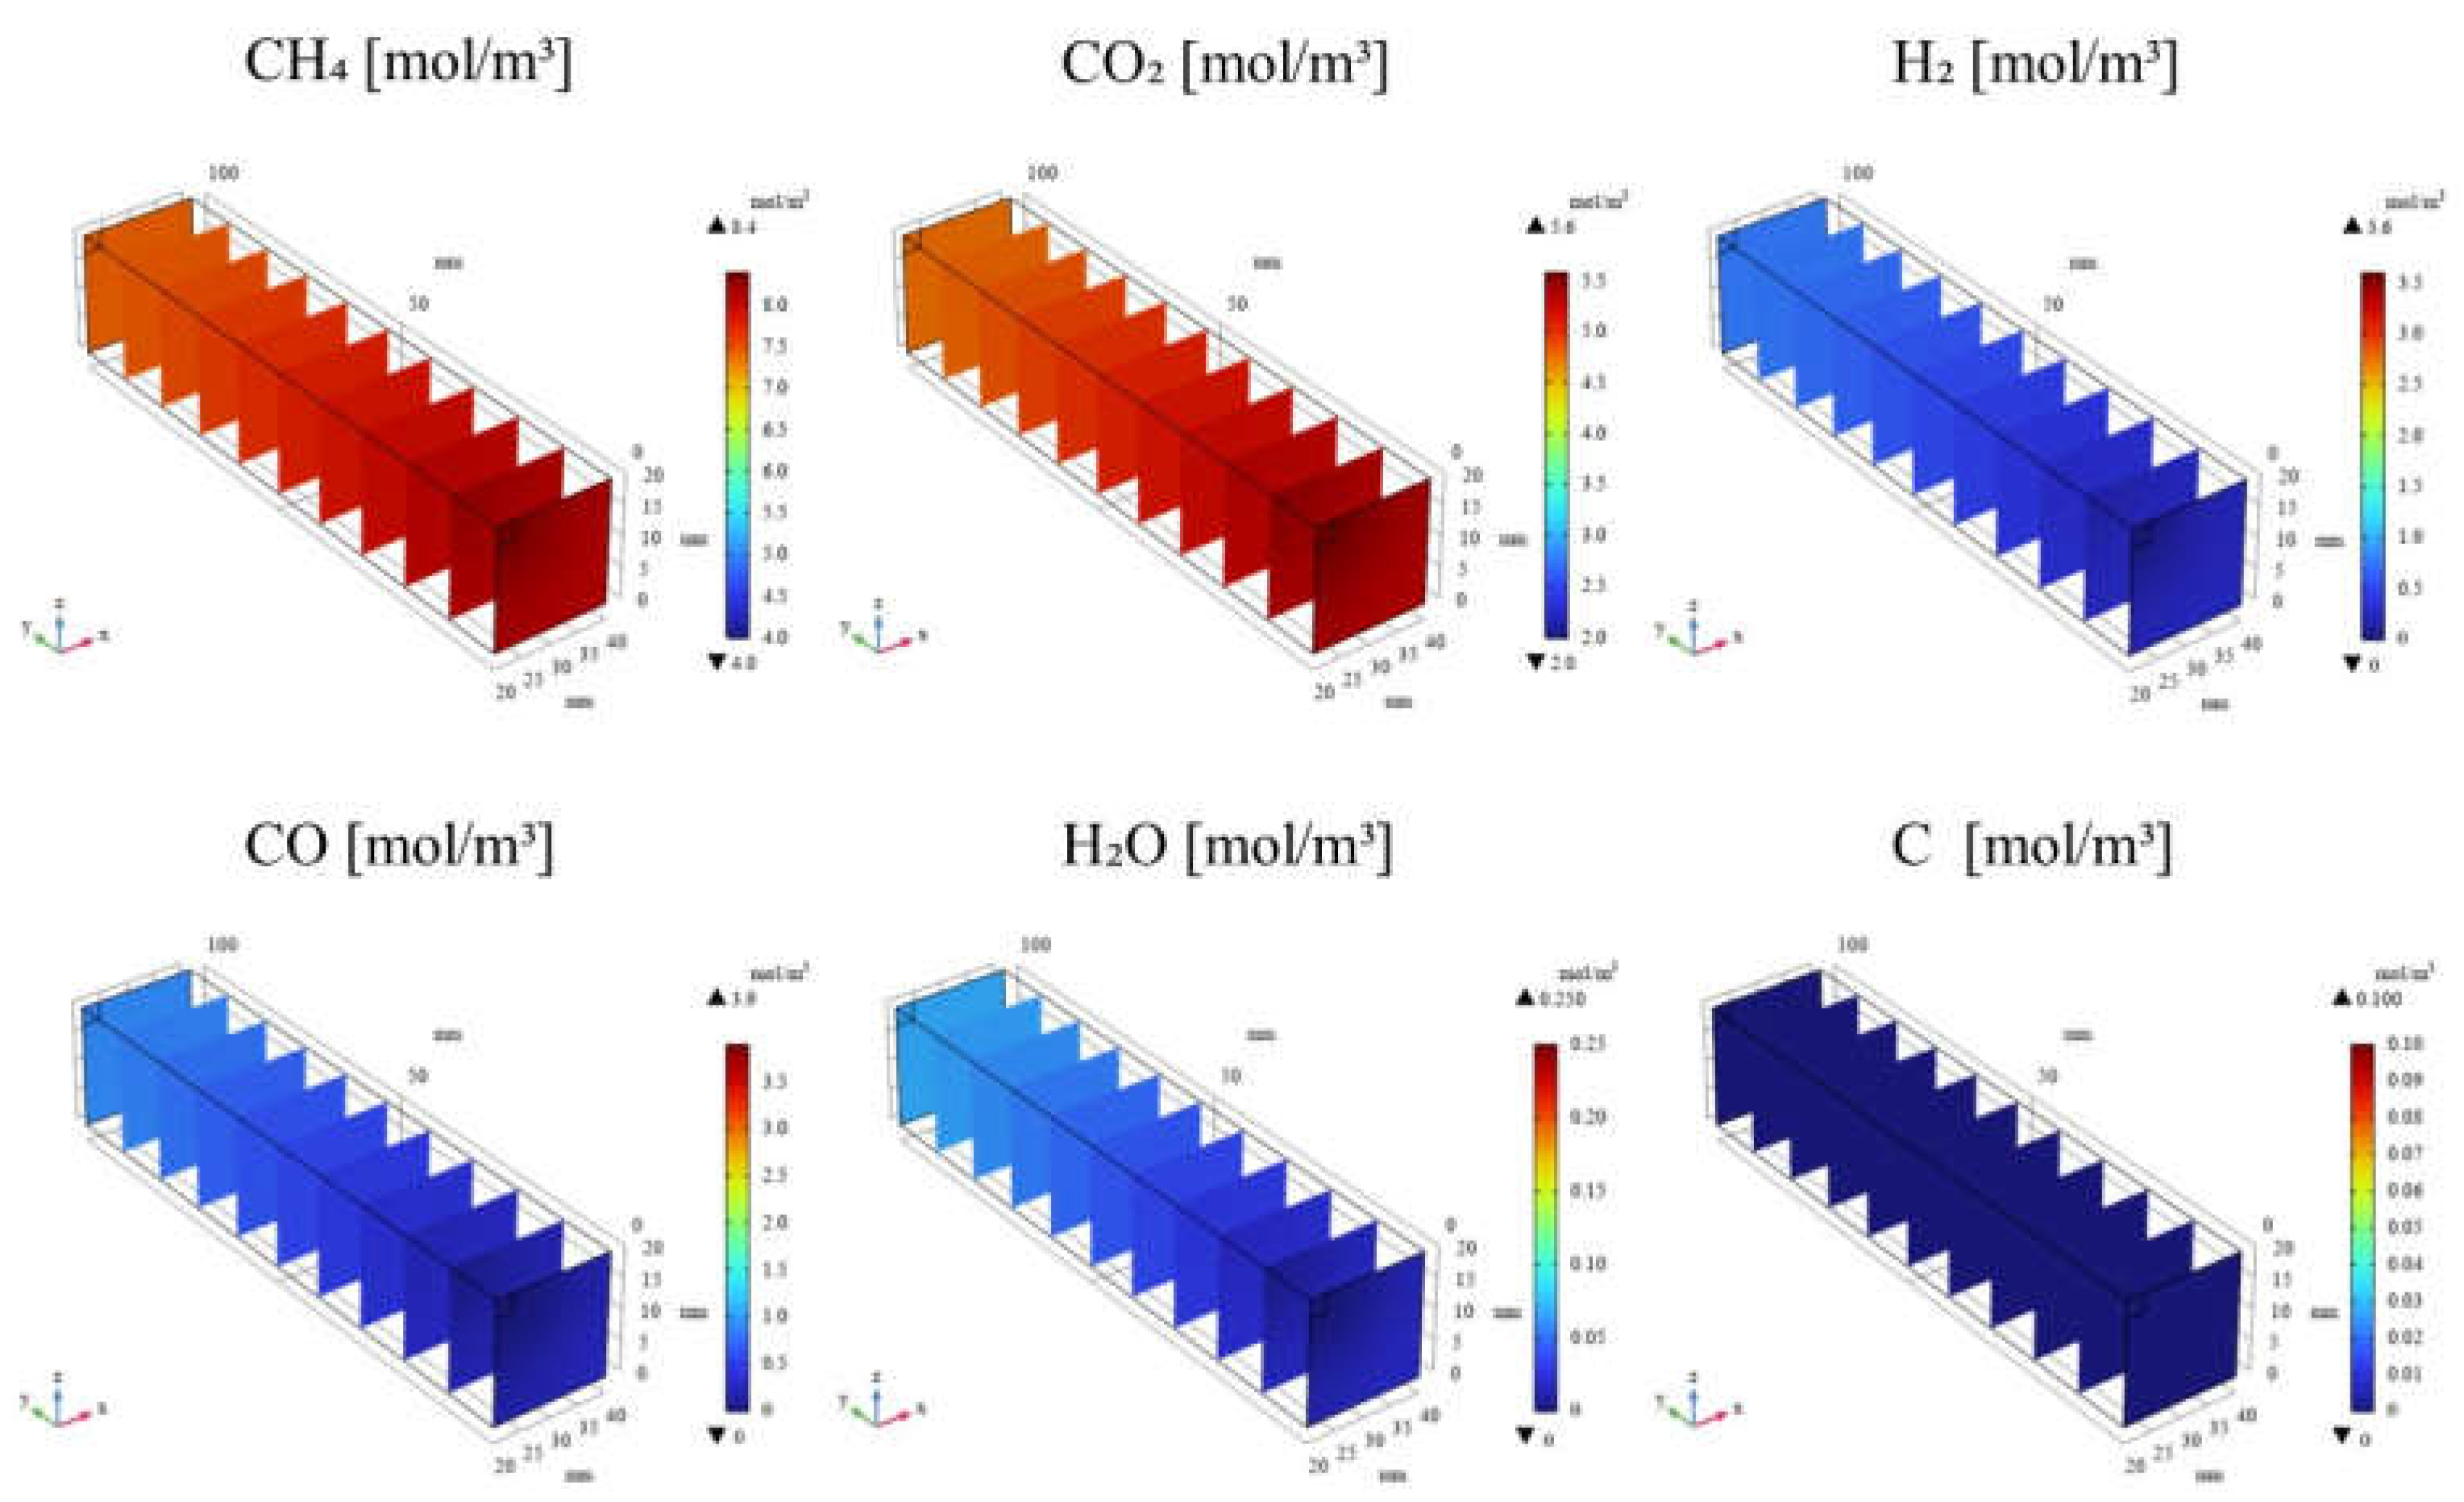
Figure 5.
3D distribution of temperature, gas pressure and gas velocity in reactor (εp = 0.95).
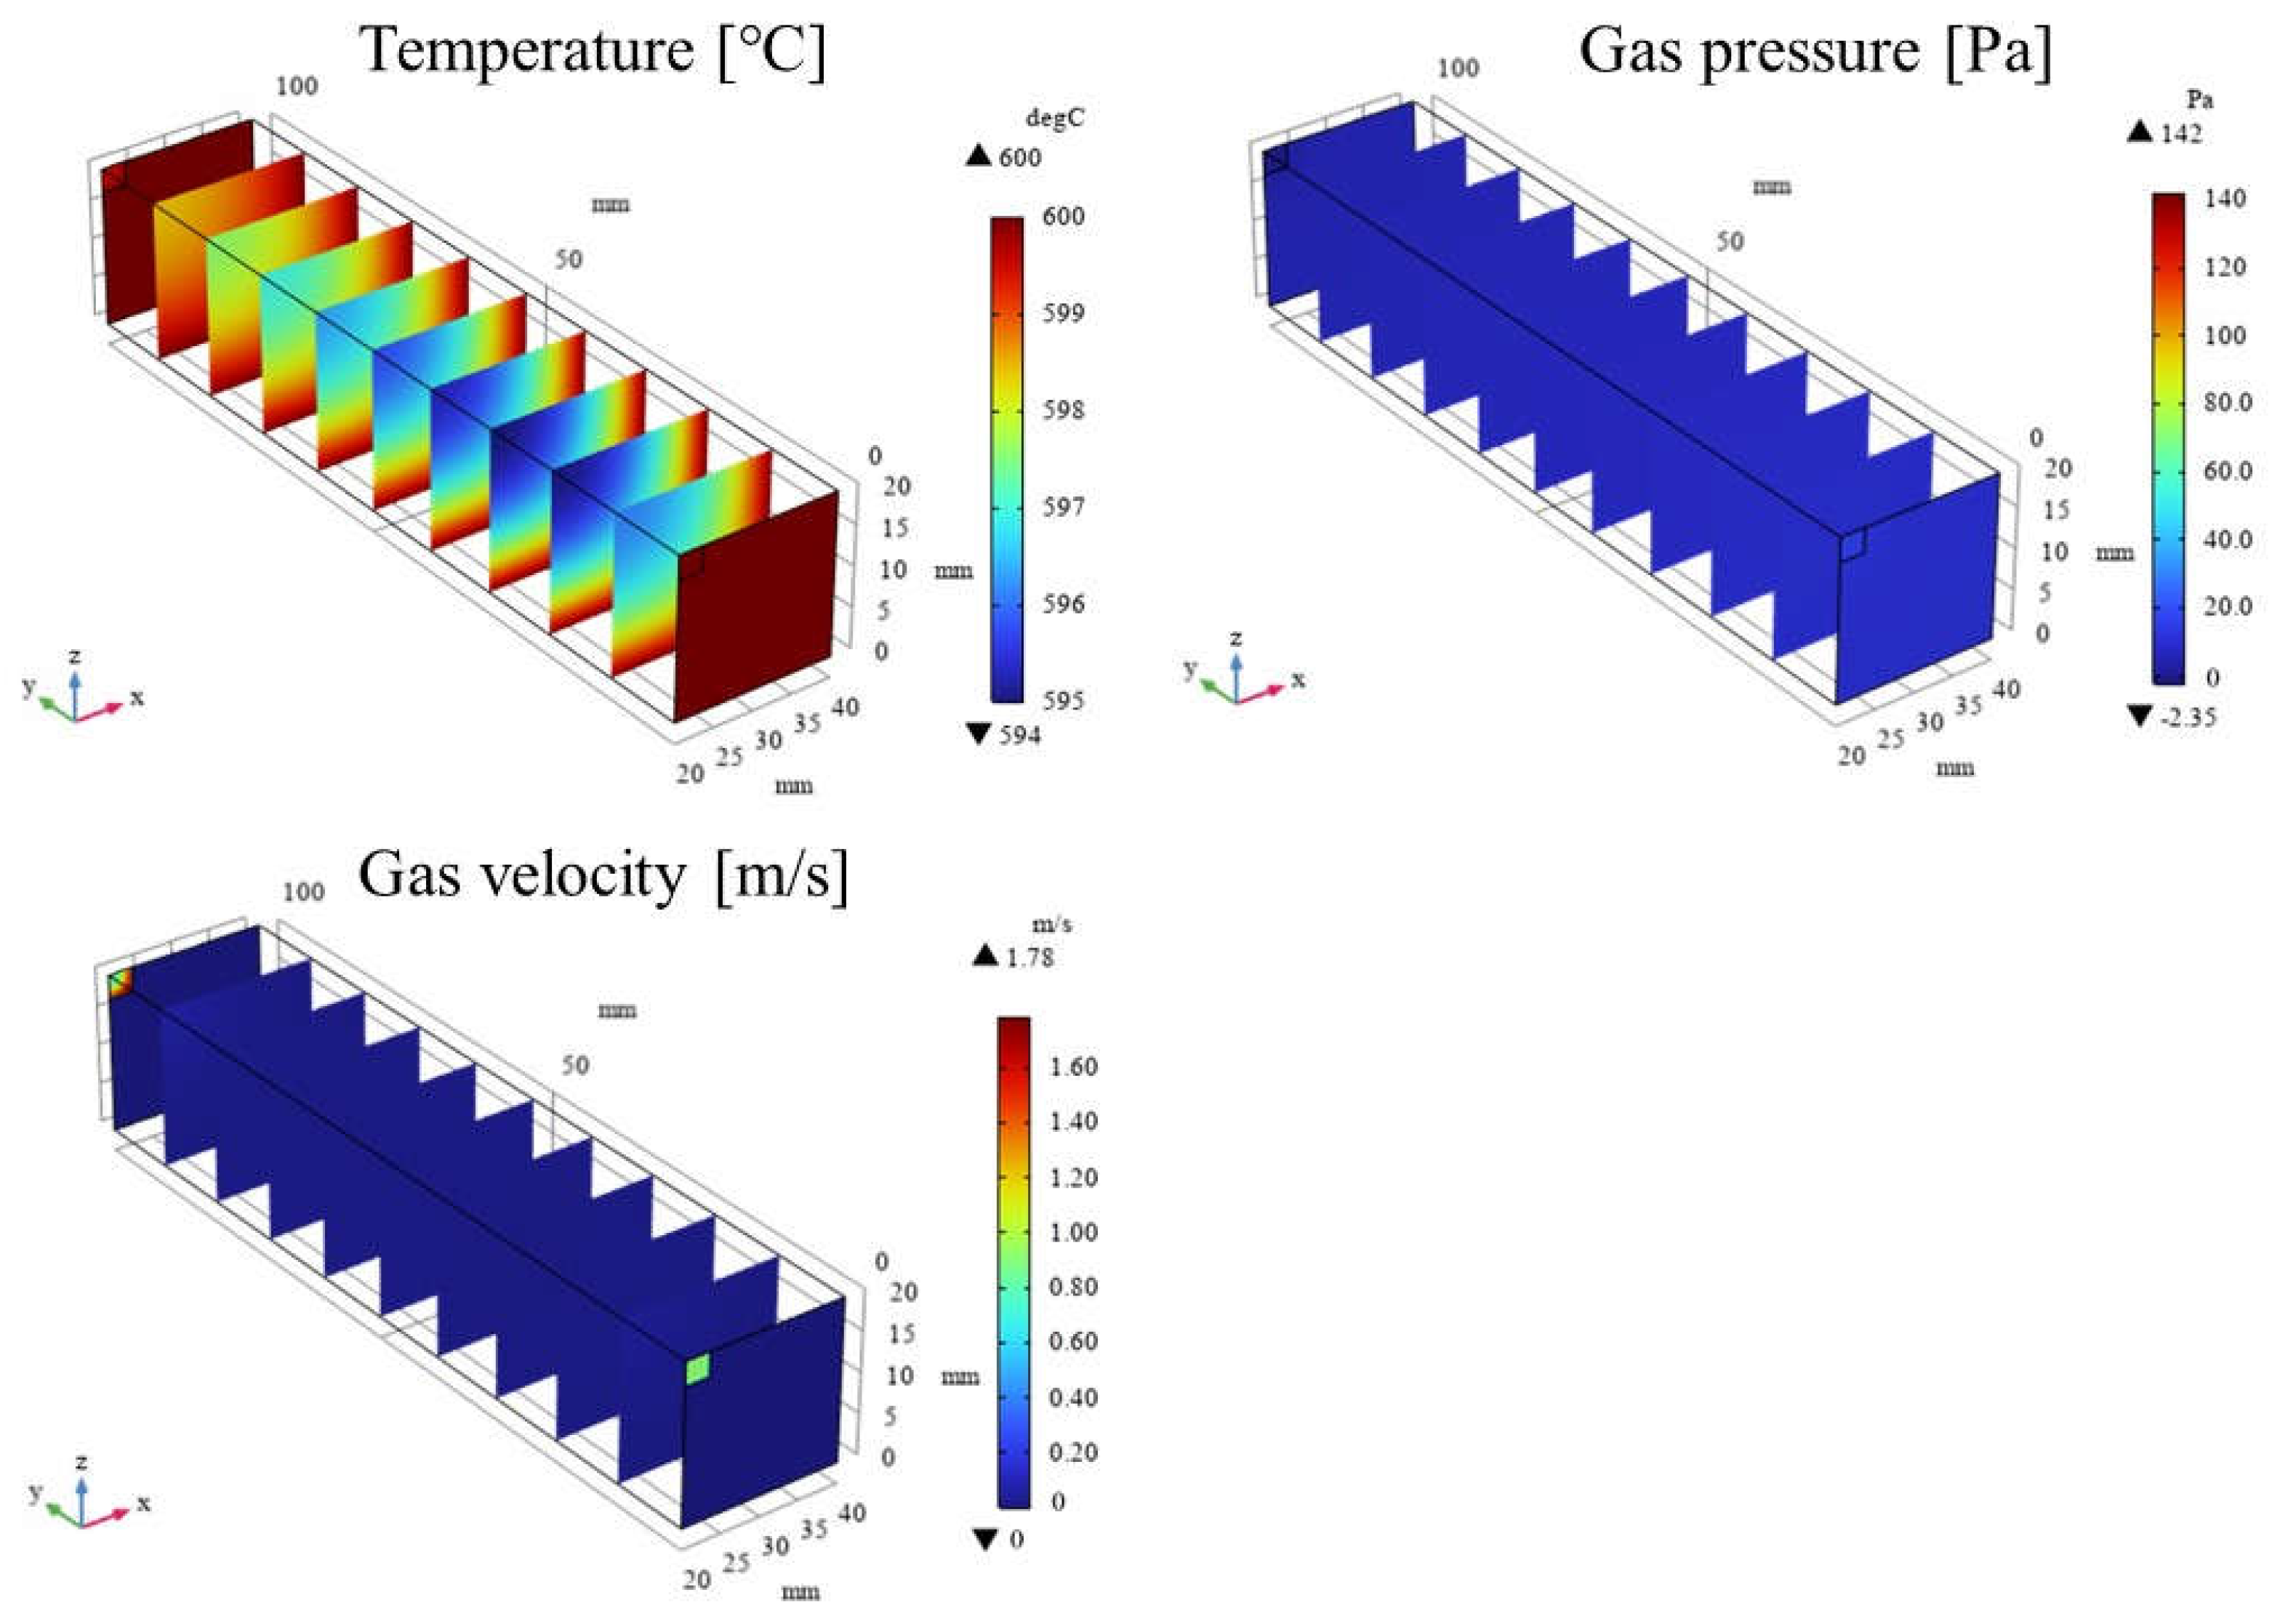
Figure 6.
3D distribution of temperature, gas pressure and gas velocity in reactor (εp = 0.1).
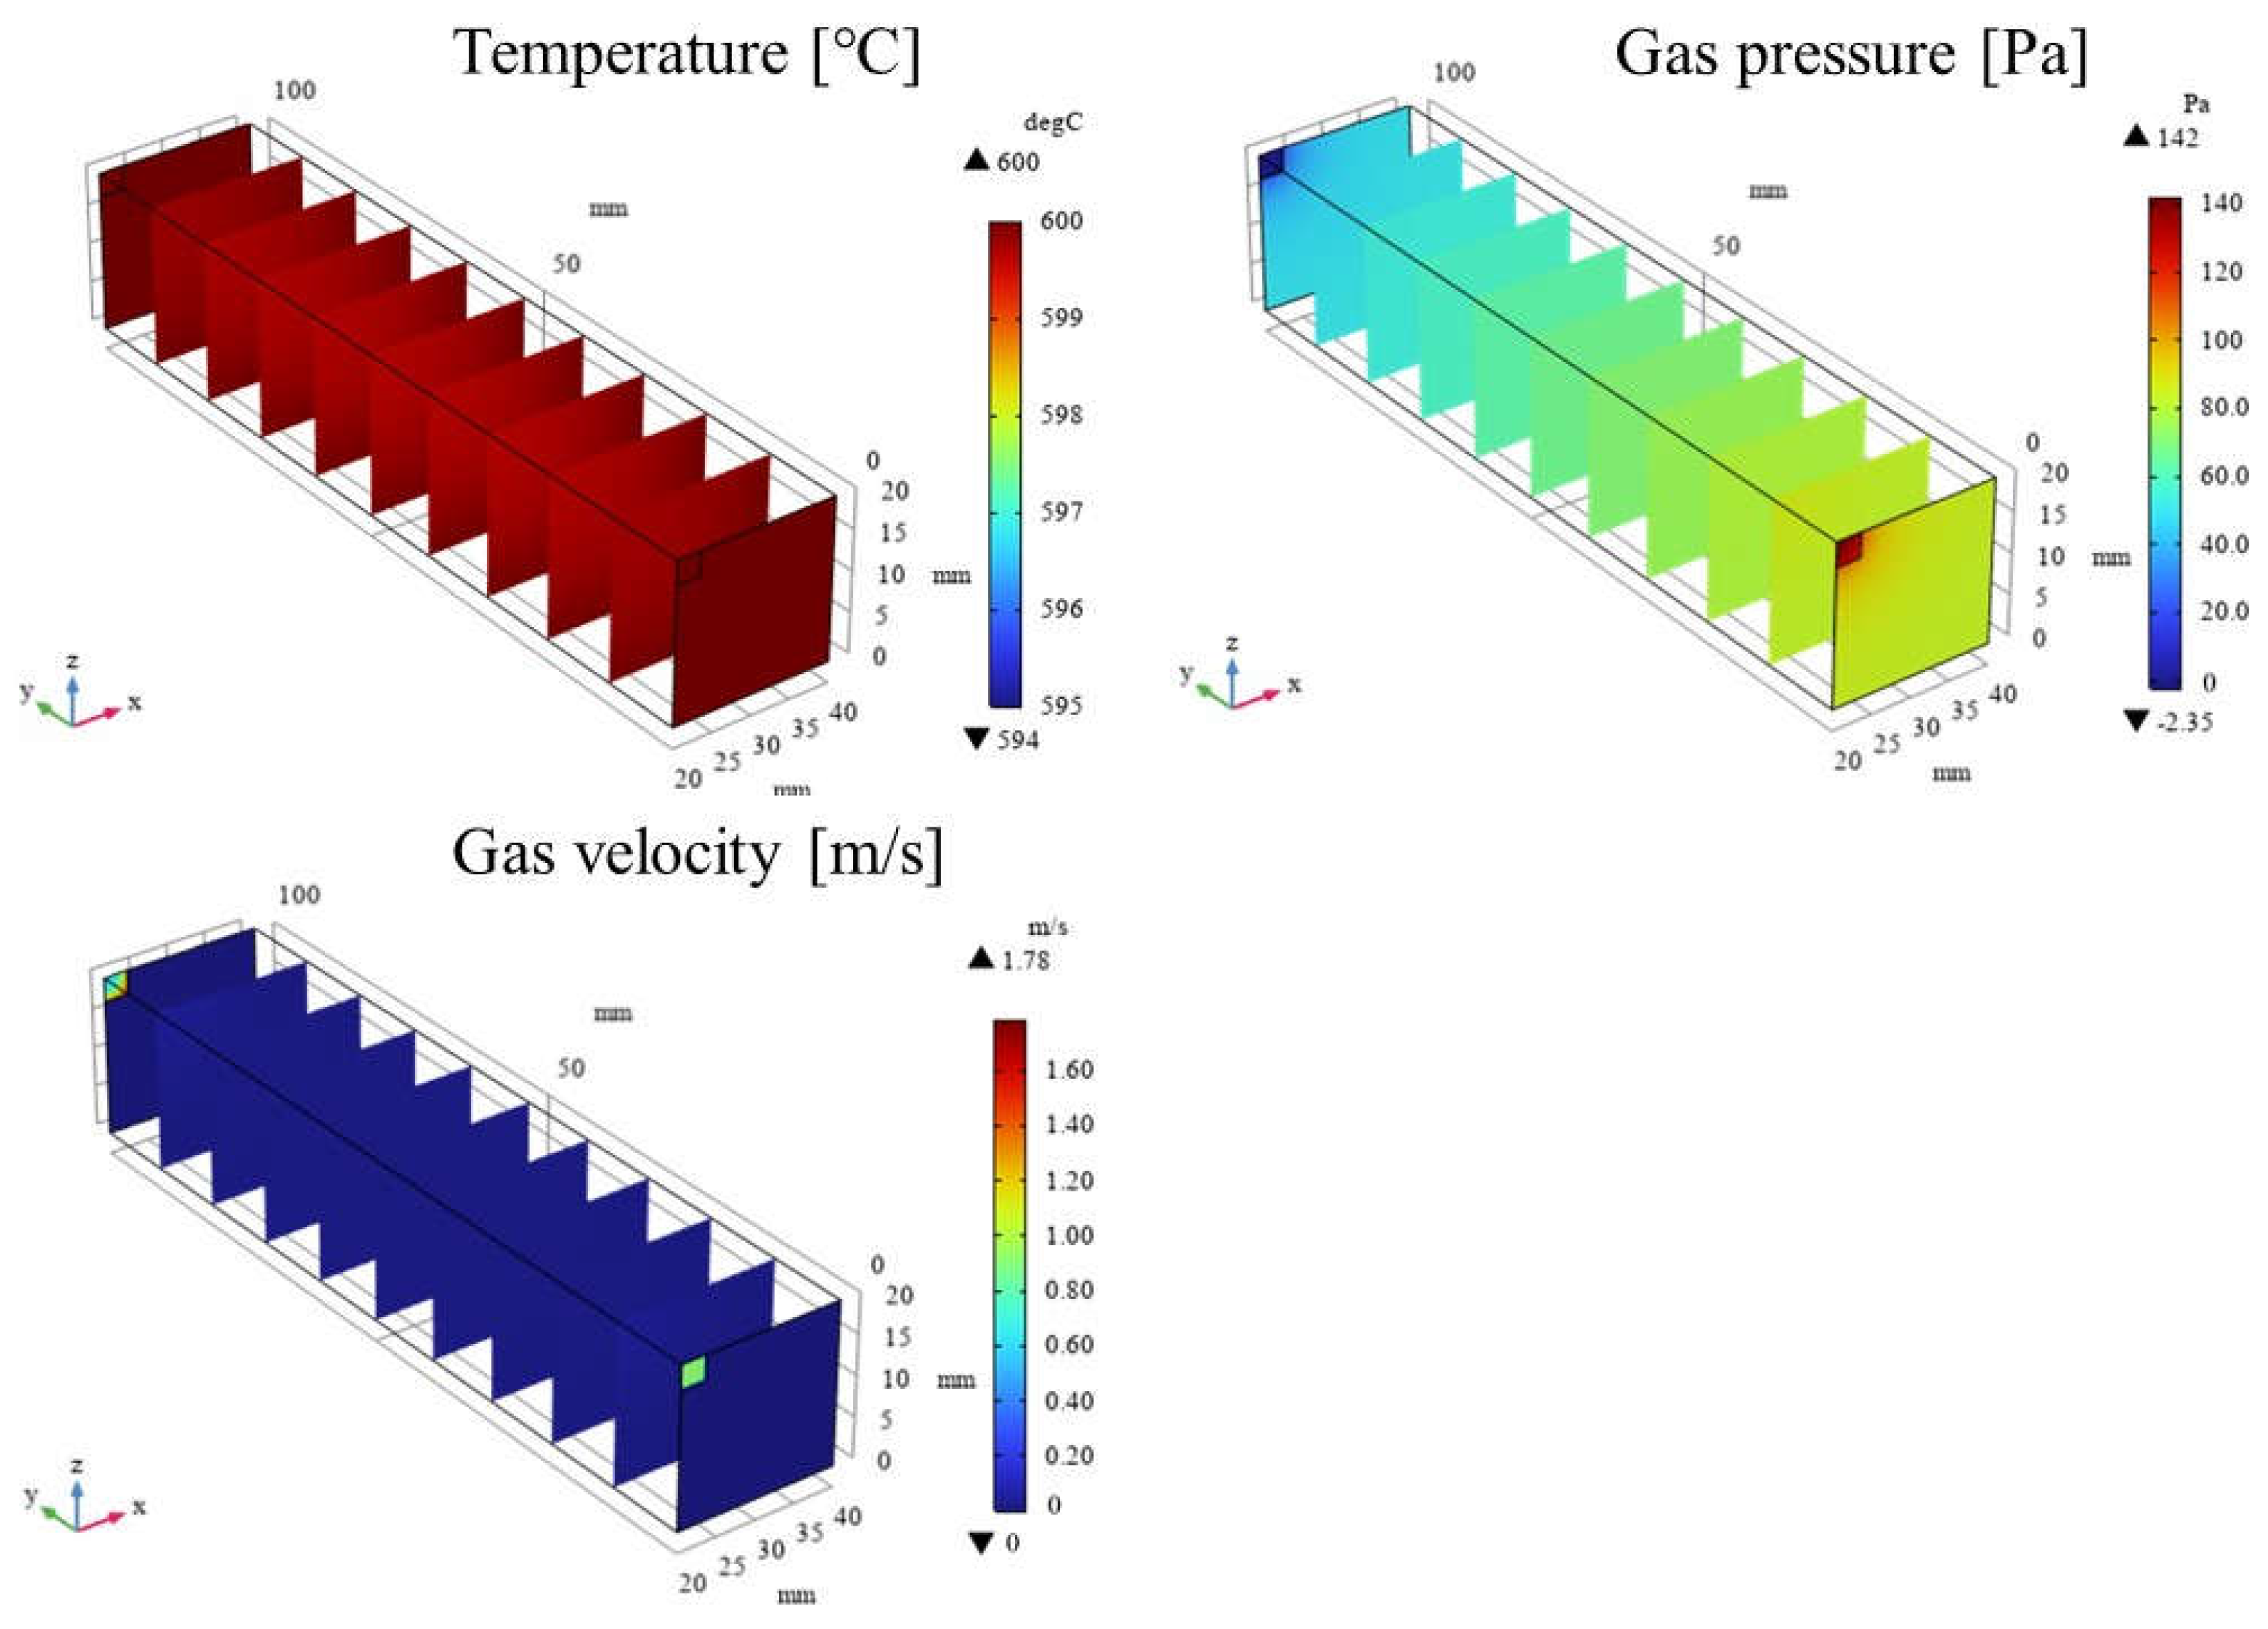
Figure 7.
Impact of εp on the distribution of molar concentrations of CH4, CO2, H2, CO, H2O and C in case of CH4:CO2 = 1.5:1 at 400 ℃.
Figure 7.
Impact of εp on the distribution of molar concentrations of CH4, CO2, H2, CO, H2O and C in case of CH4:CO2 = 1.5:1 at 400 ℃.
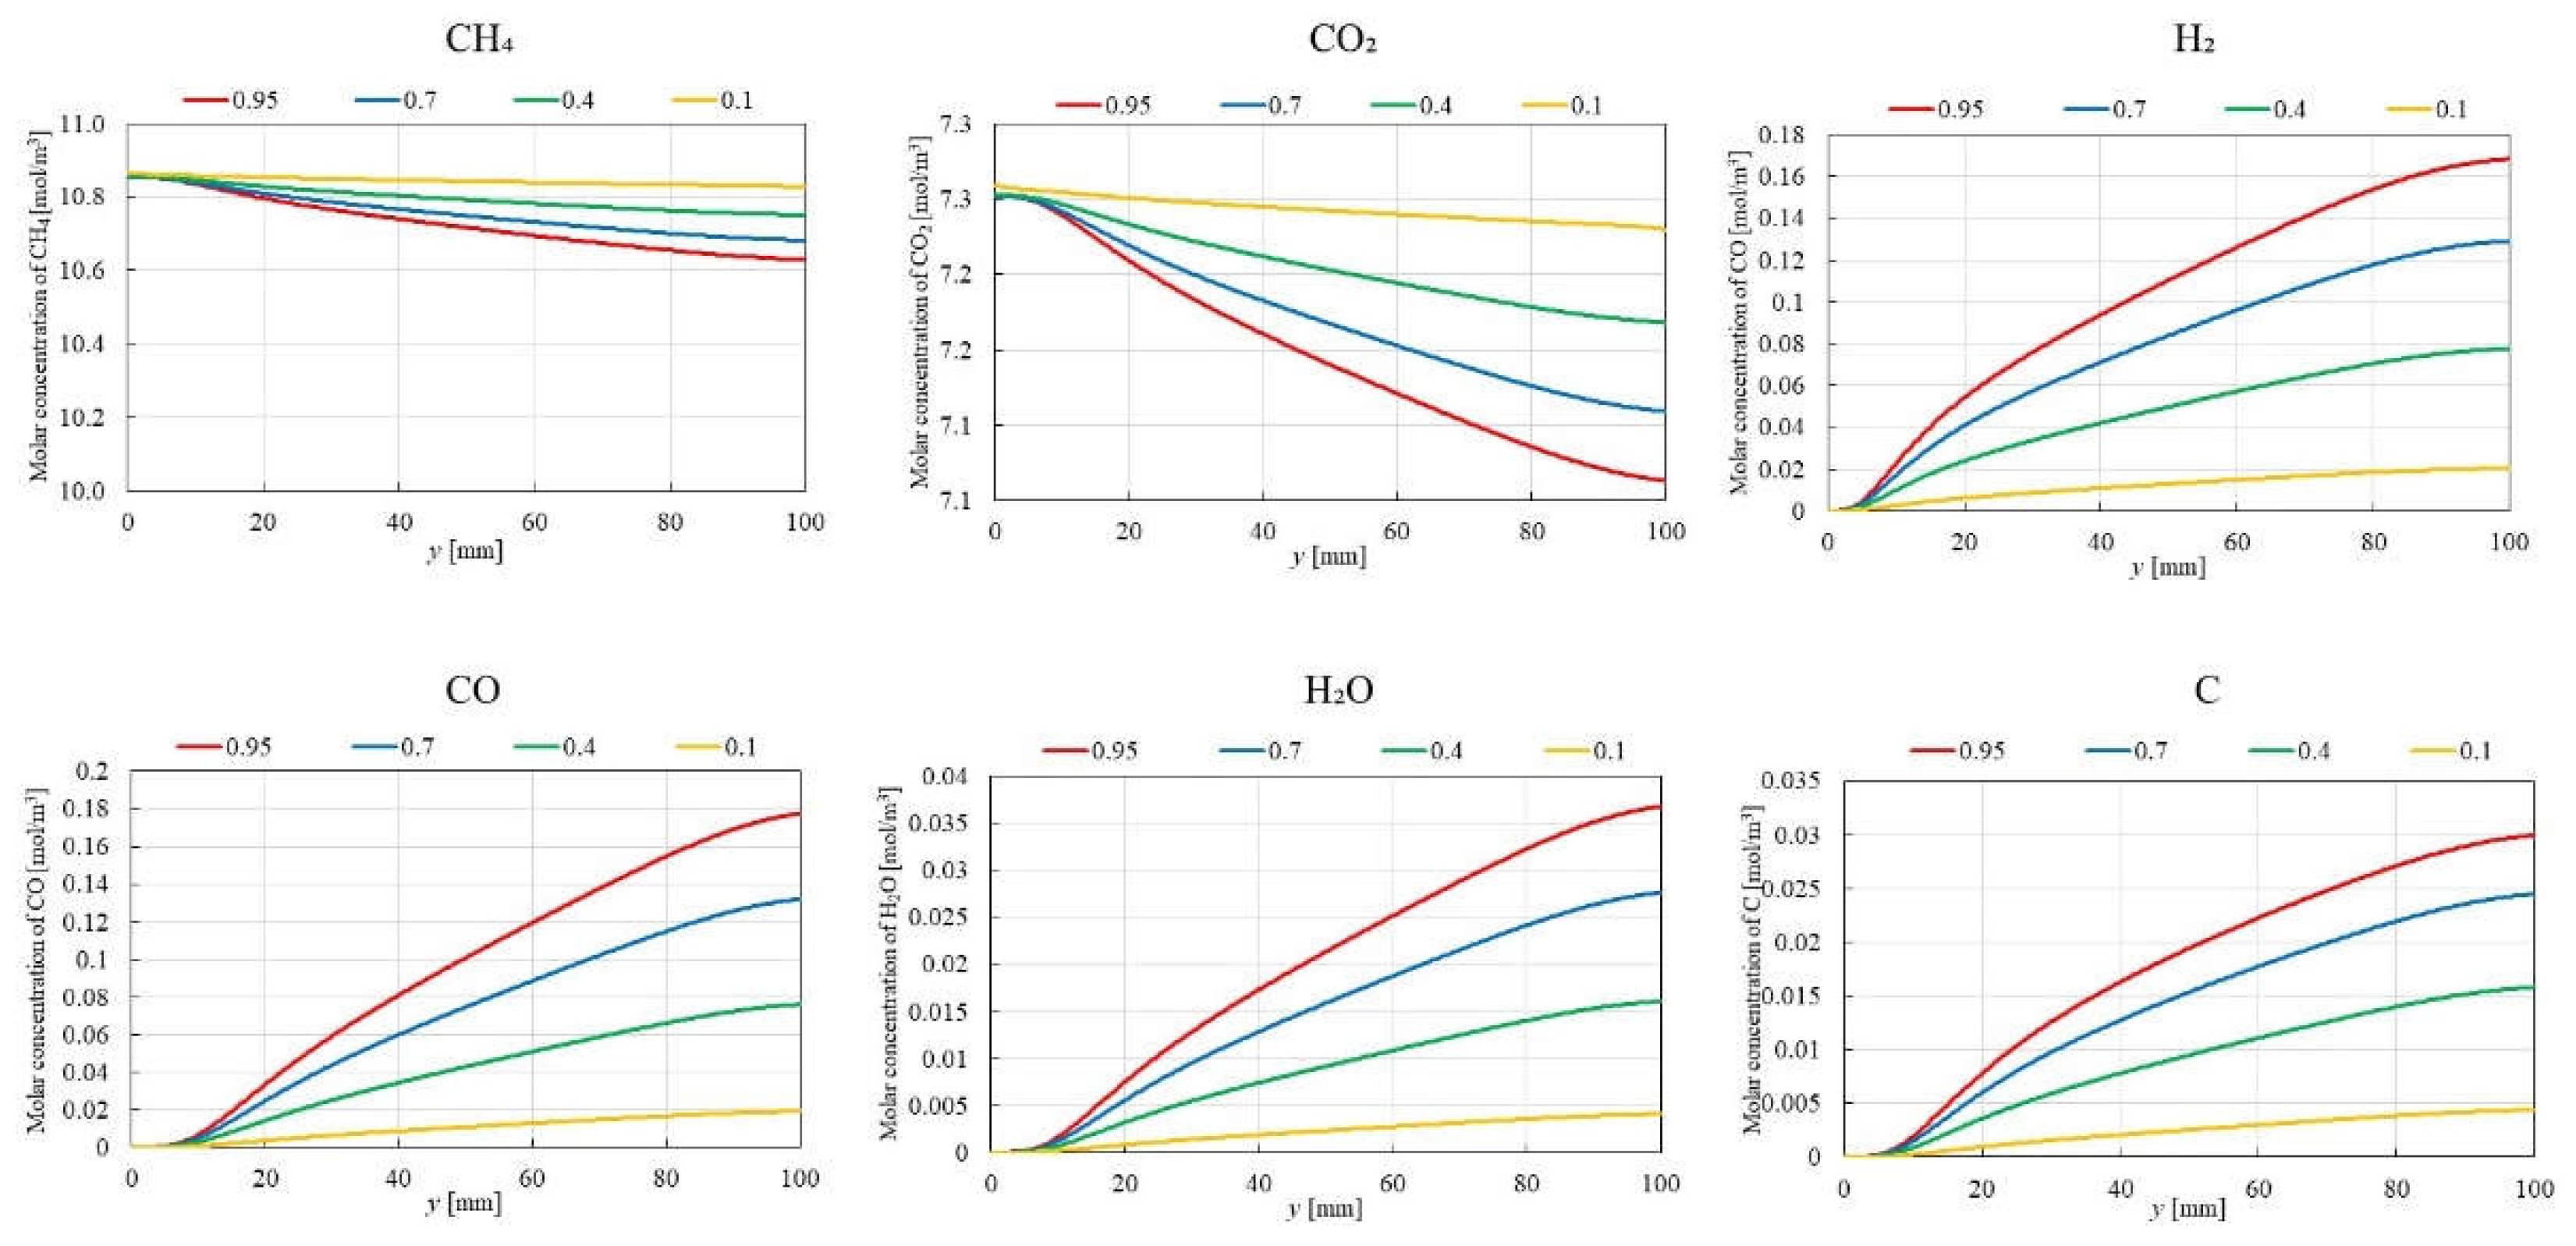
Figure 8.
Impact of εp on the distribution of molar concentrations of CH4, CO2, H2, CO, H2O and C in case of CH4:CO2 = 1.5:1 at 500 ℃.
Figure 8.
Impact of εp on the distribution of molar concentrations of CH4, CO2, H2, CO, H2O and C in case of CH4:CO2 = 1.5:1 at 500 ℃.
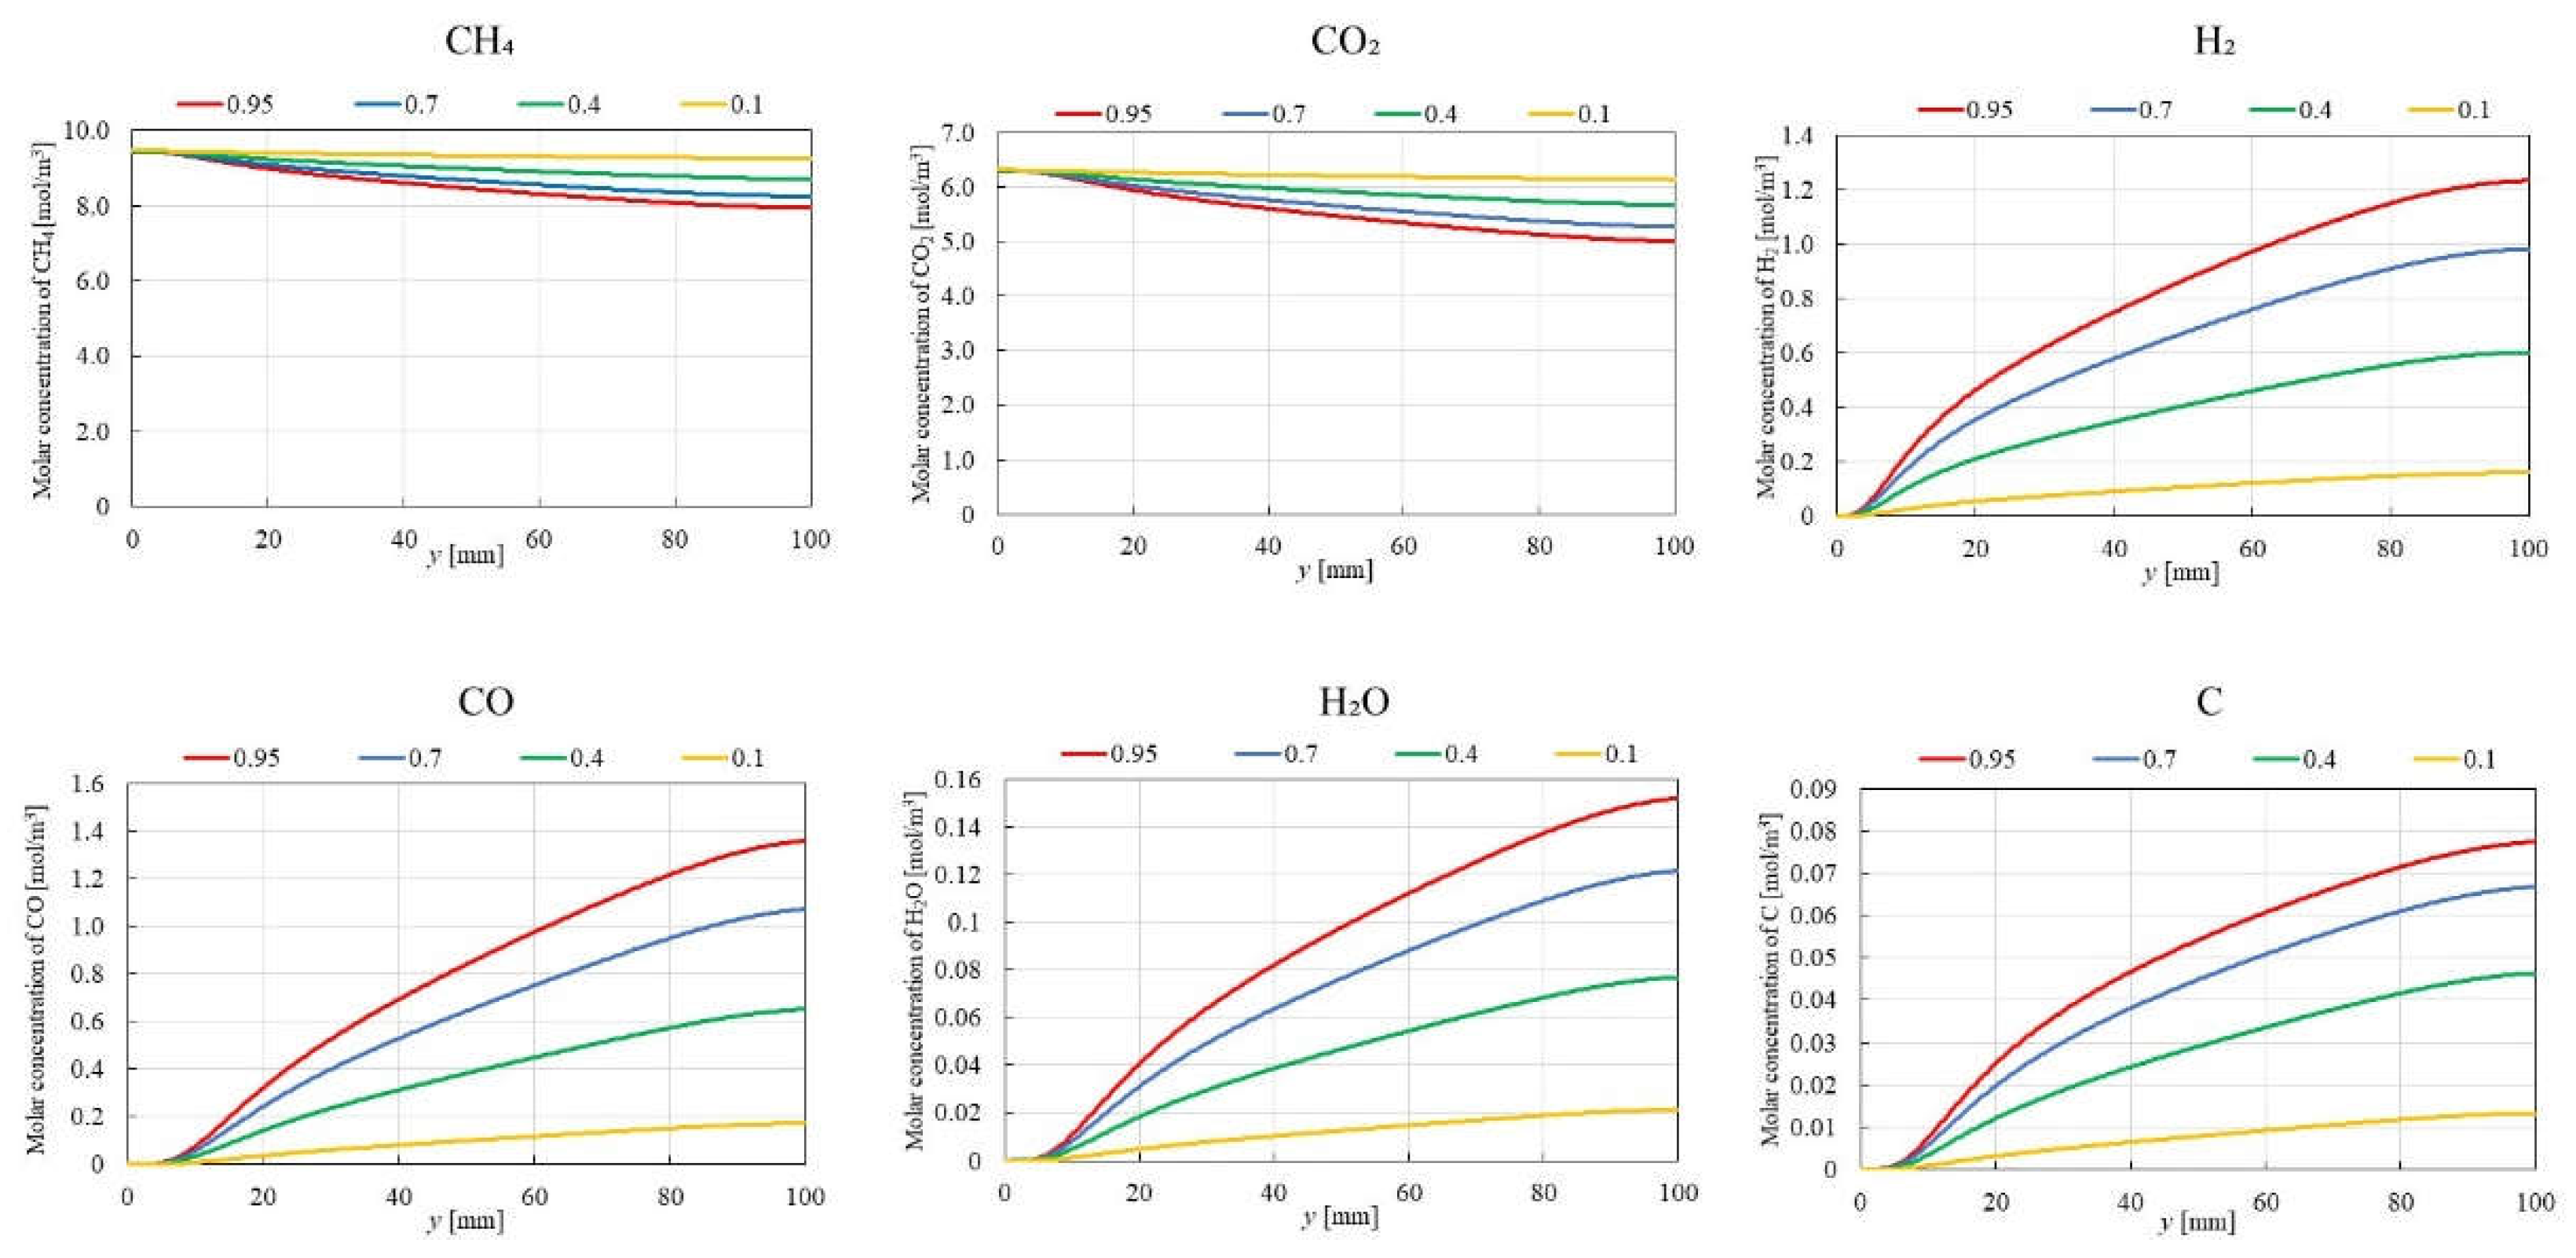
Figure 9.
Impact of εp on the distribution of molar concentrations of CH4, CO2, H2, CO, H2O and C in case of CH4:CO2 = 1.5:1 at 600 ℃.
Figure 9.
Impact of εp on the distribution of molar concentrations of CH4, CO2, H2, CO, H2O and C in case of CH4:CO2 = 1.5:1 at 600 ℃.
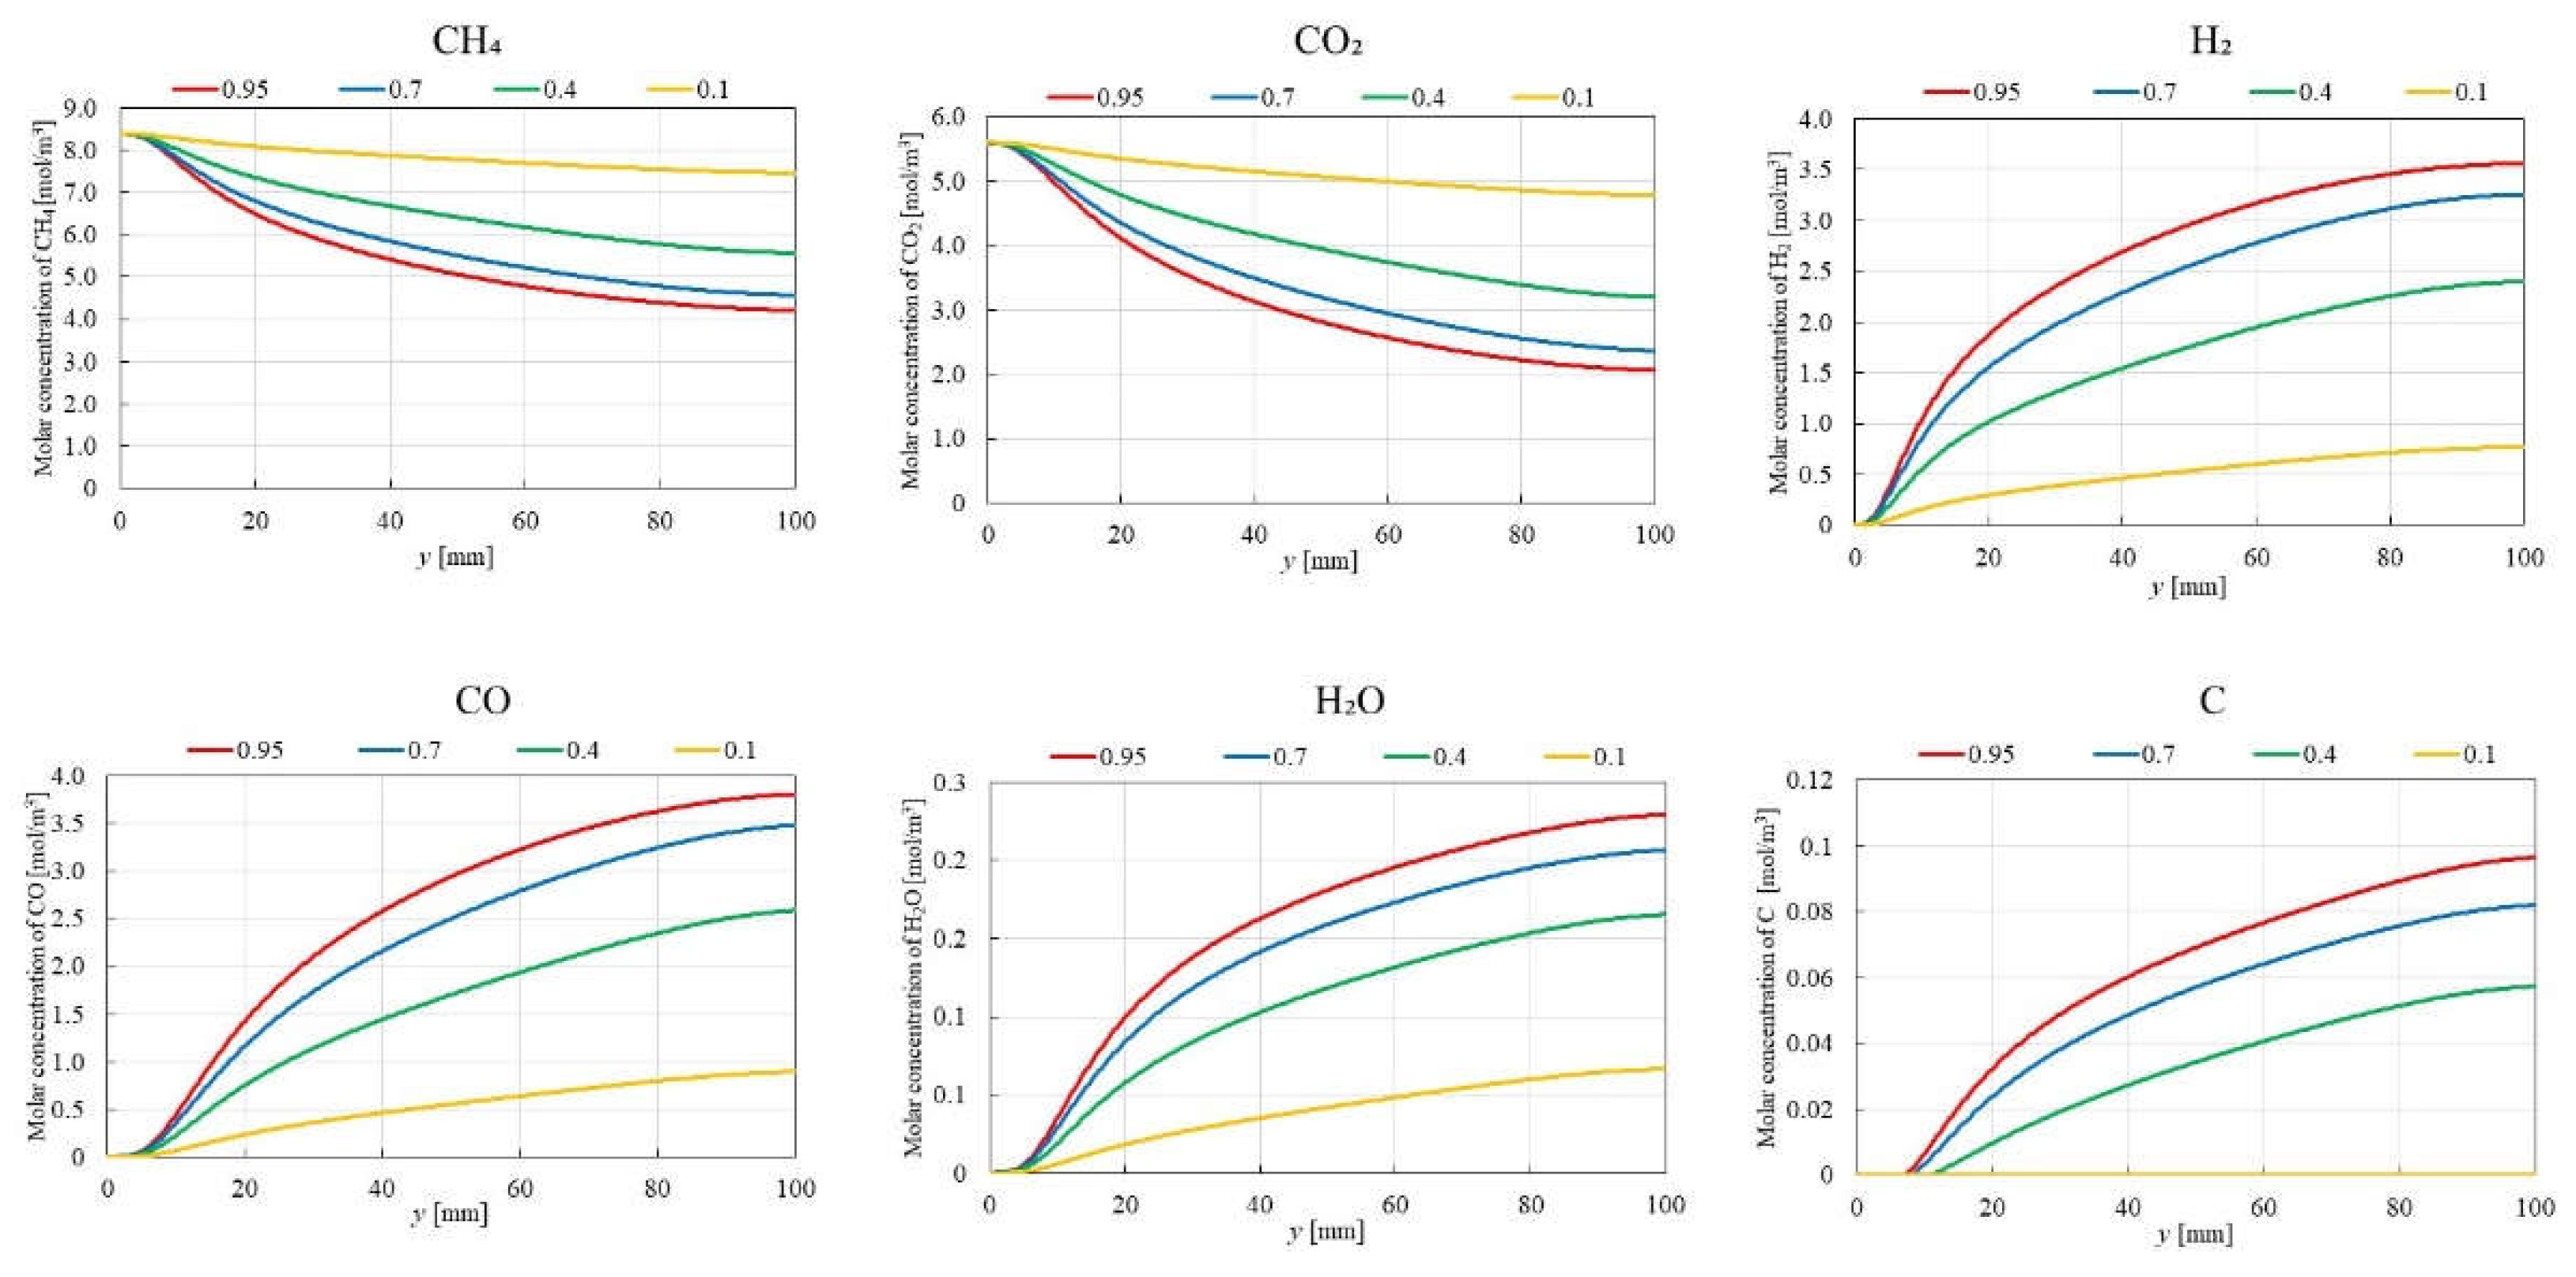
Figure 10.
Impact of εp on the distribution of molar concentrations of CH4, CO2, H2, CO, H2O and C in case of CH4:CO2 = 1.5:1 at 700 ℃.
Figure 10.
Impact of εp on the distribution of molar concentrations of CH4, CO2, H2, CO, H2O and C in case of CH4:CO2 = 1.5:1 at 700 ℃.
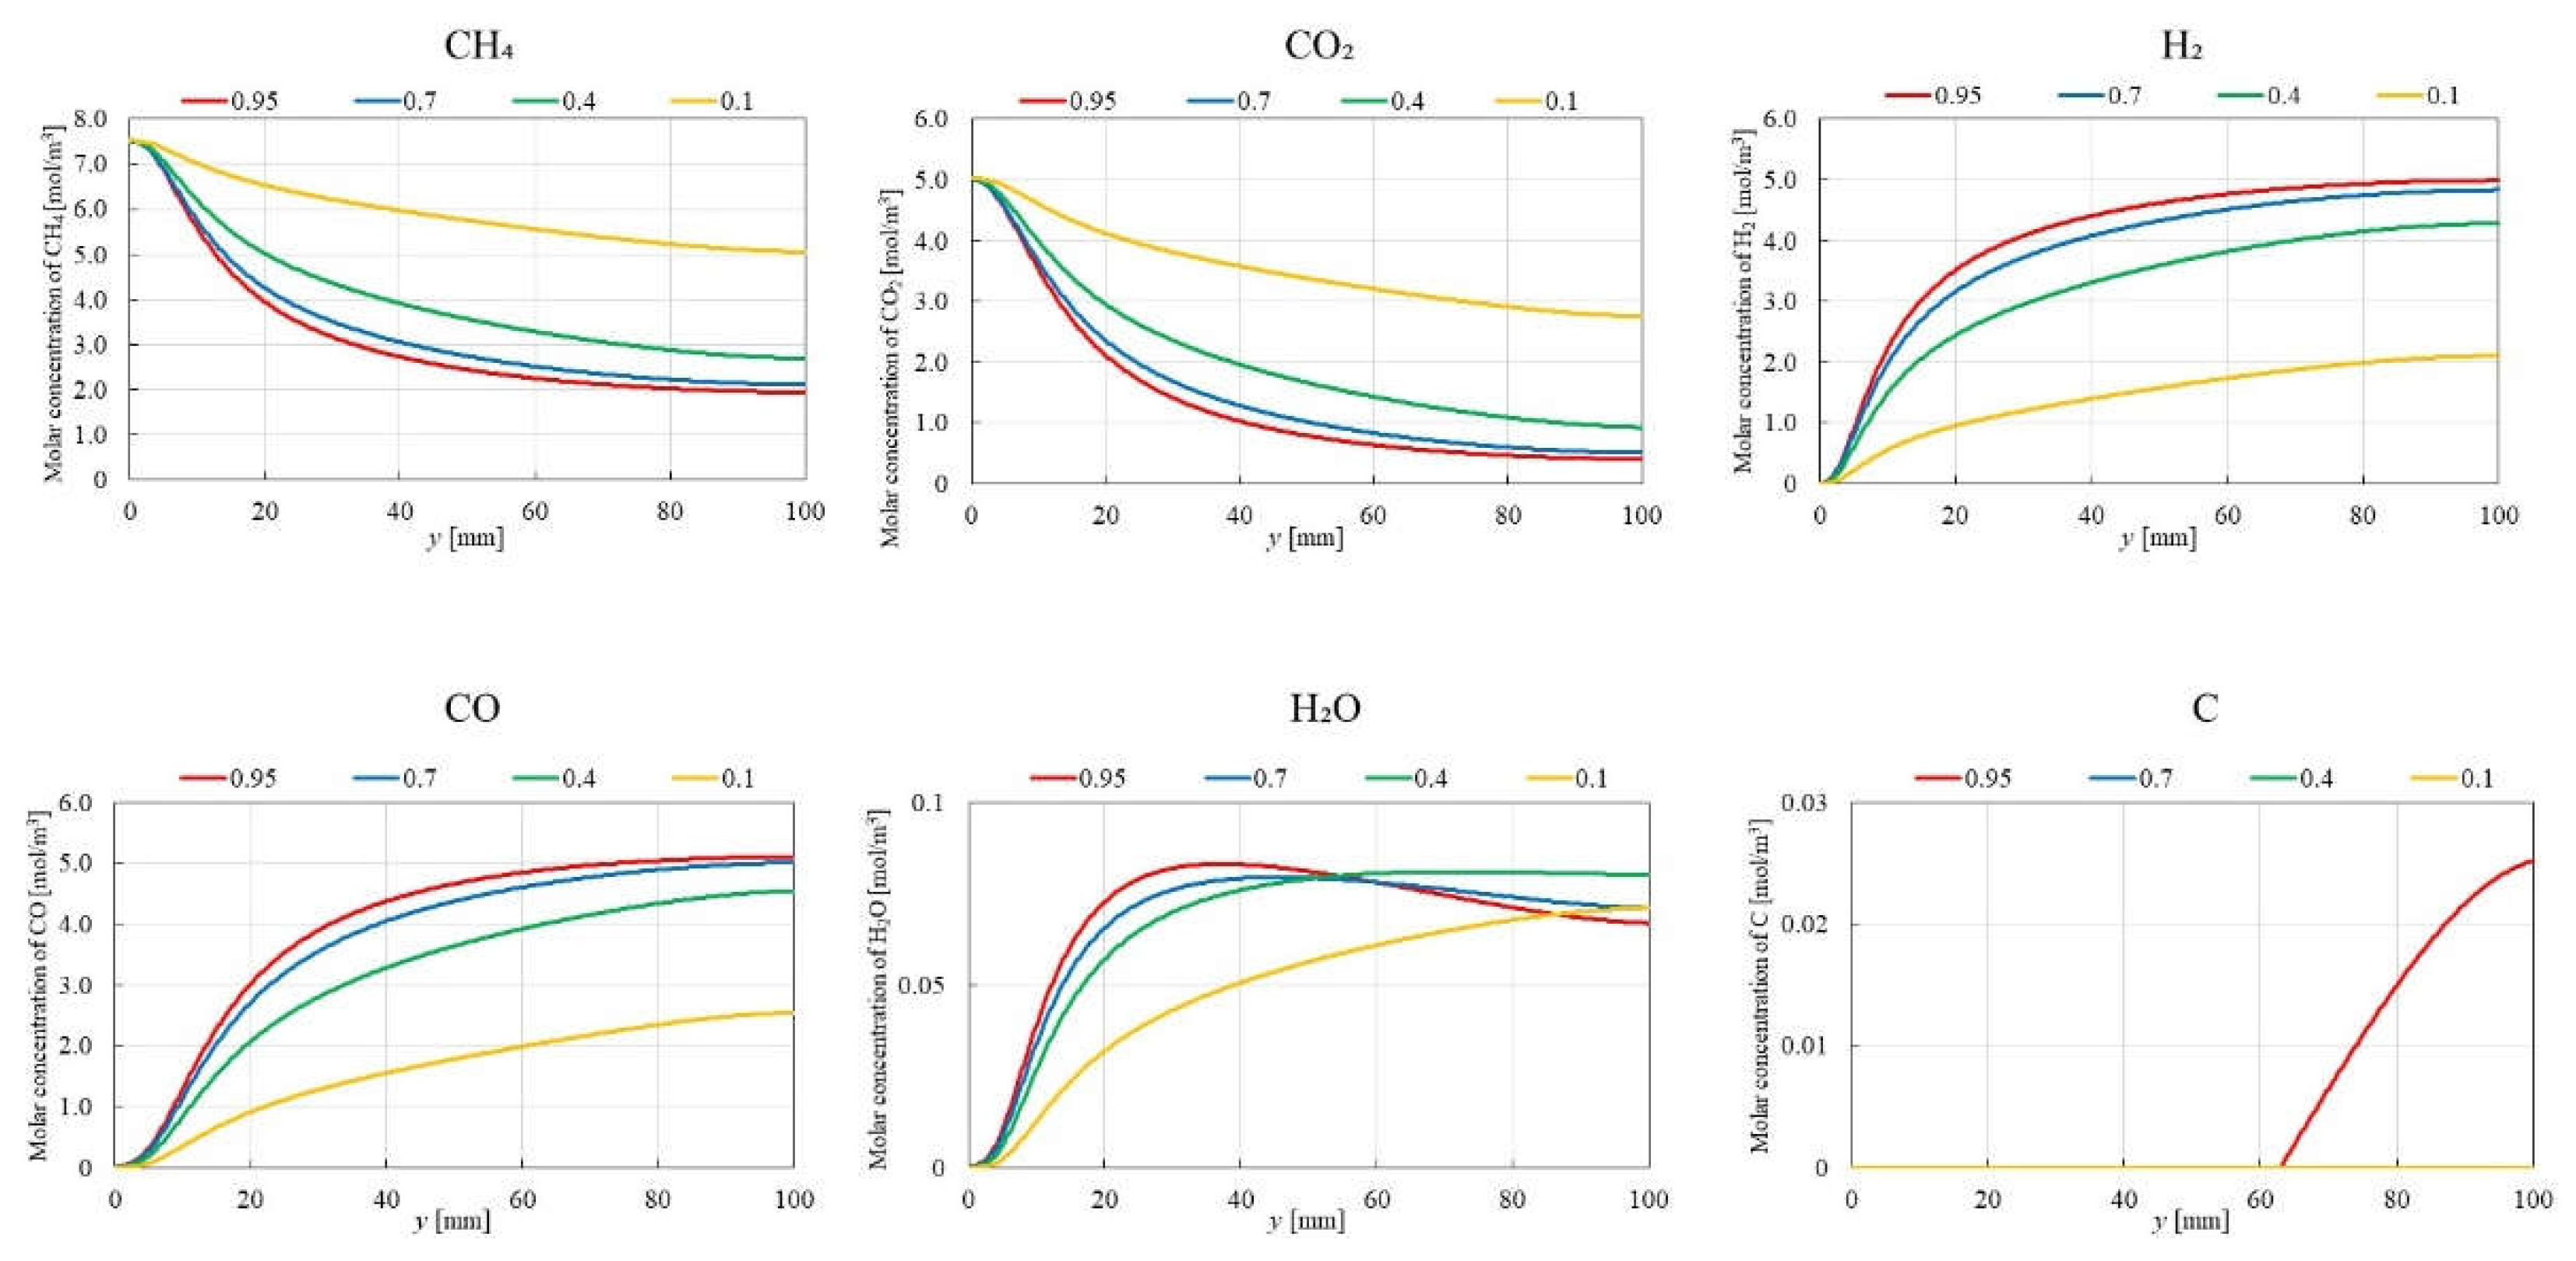
Figure 11.
Impact of εp on the distributions of molar concentration of each gas in case of CH4:CO2 = 1.5:1 at 600 ℃.
Figure 11.
Impact of εp on the distributions of molar concentration of each gas in case of CH4:CO2 = 1.5:1 at 600 ℃.
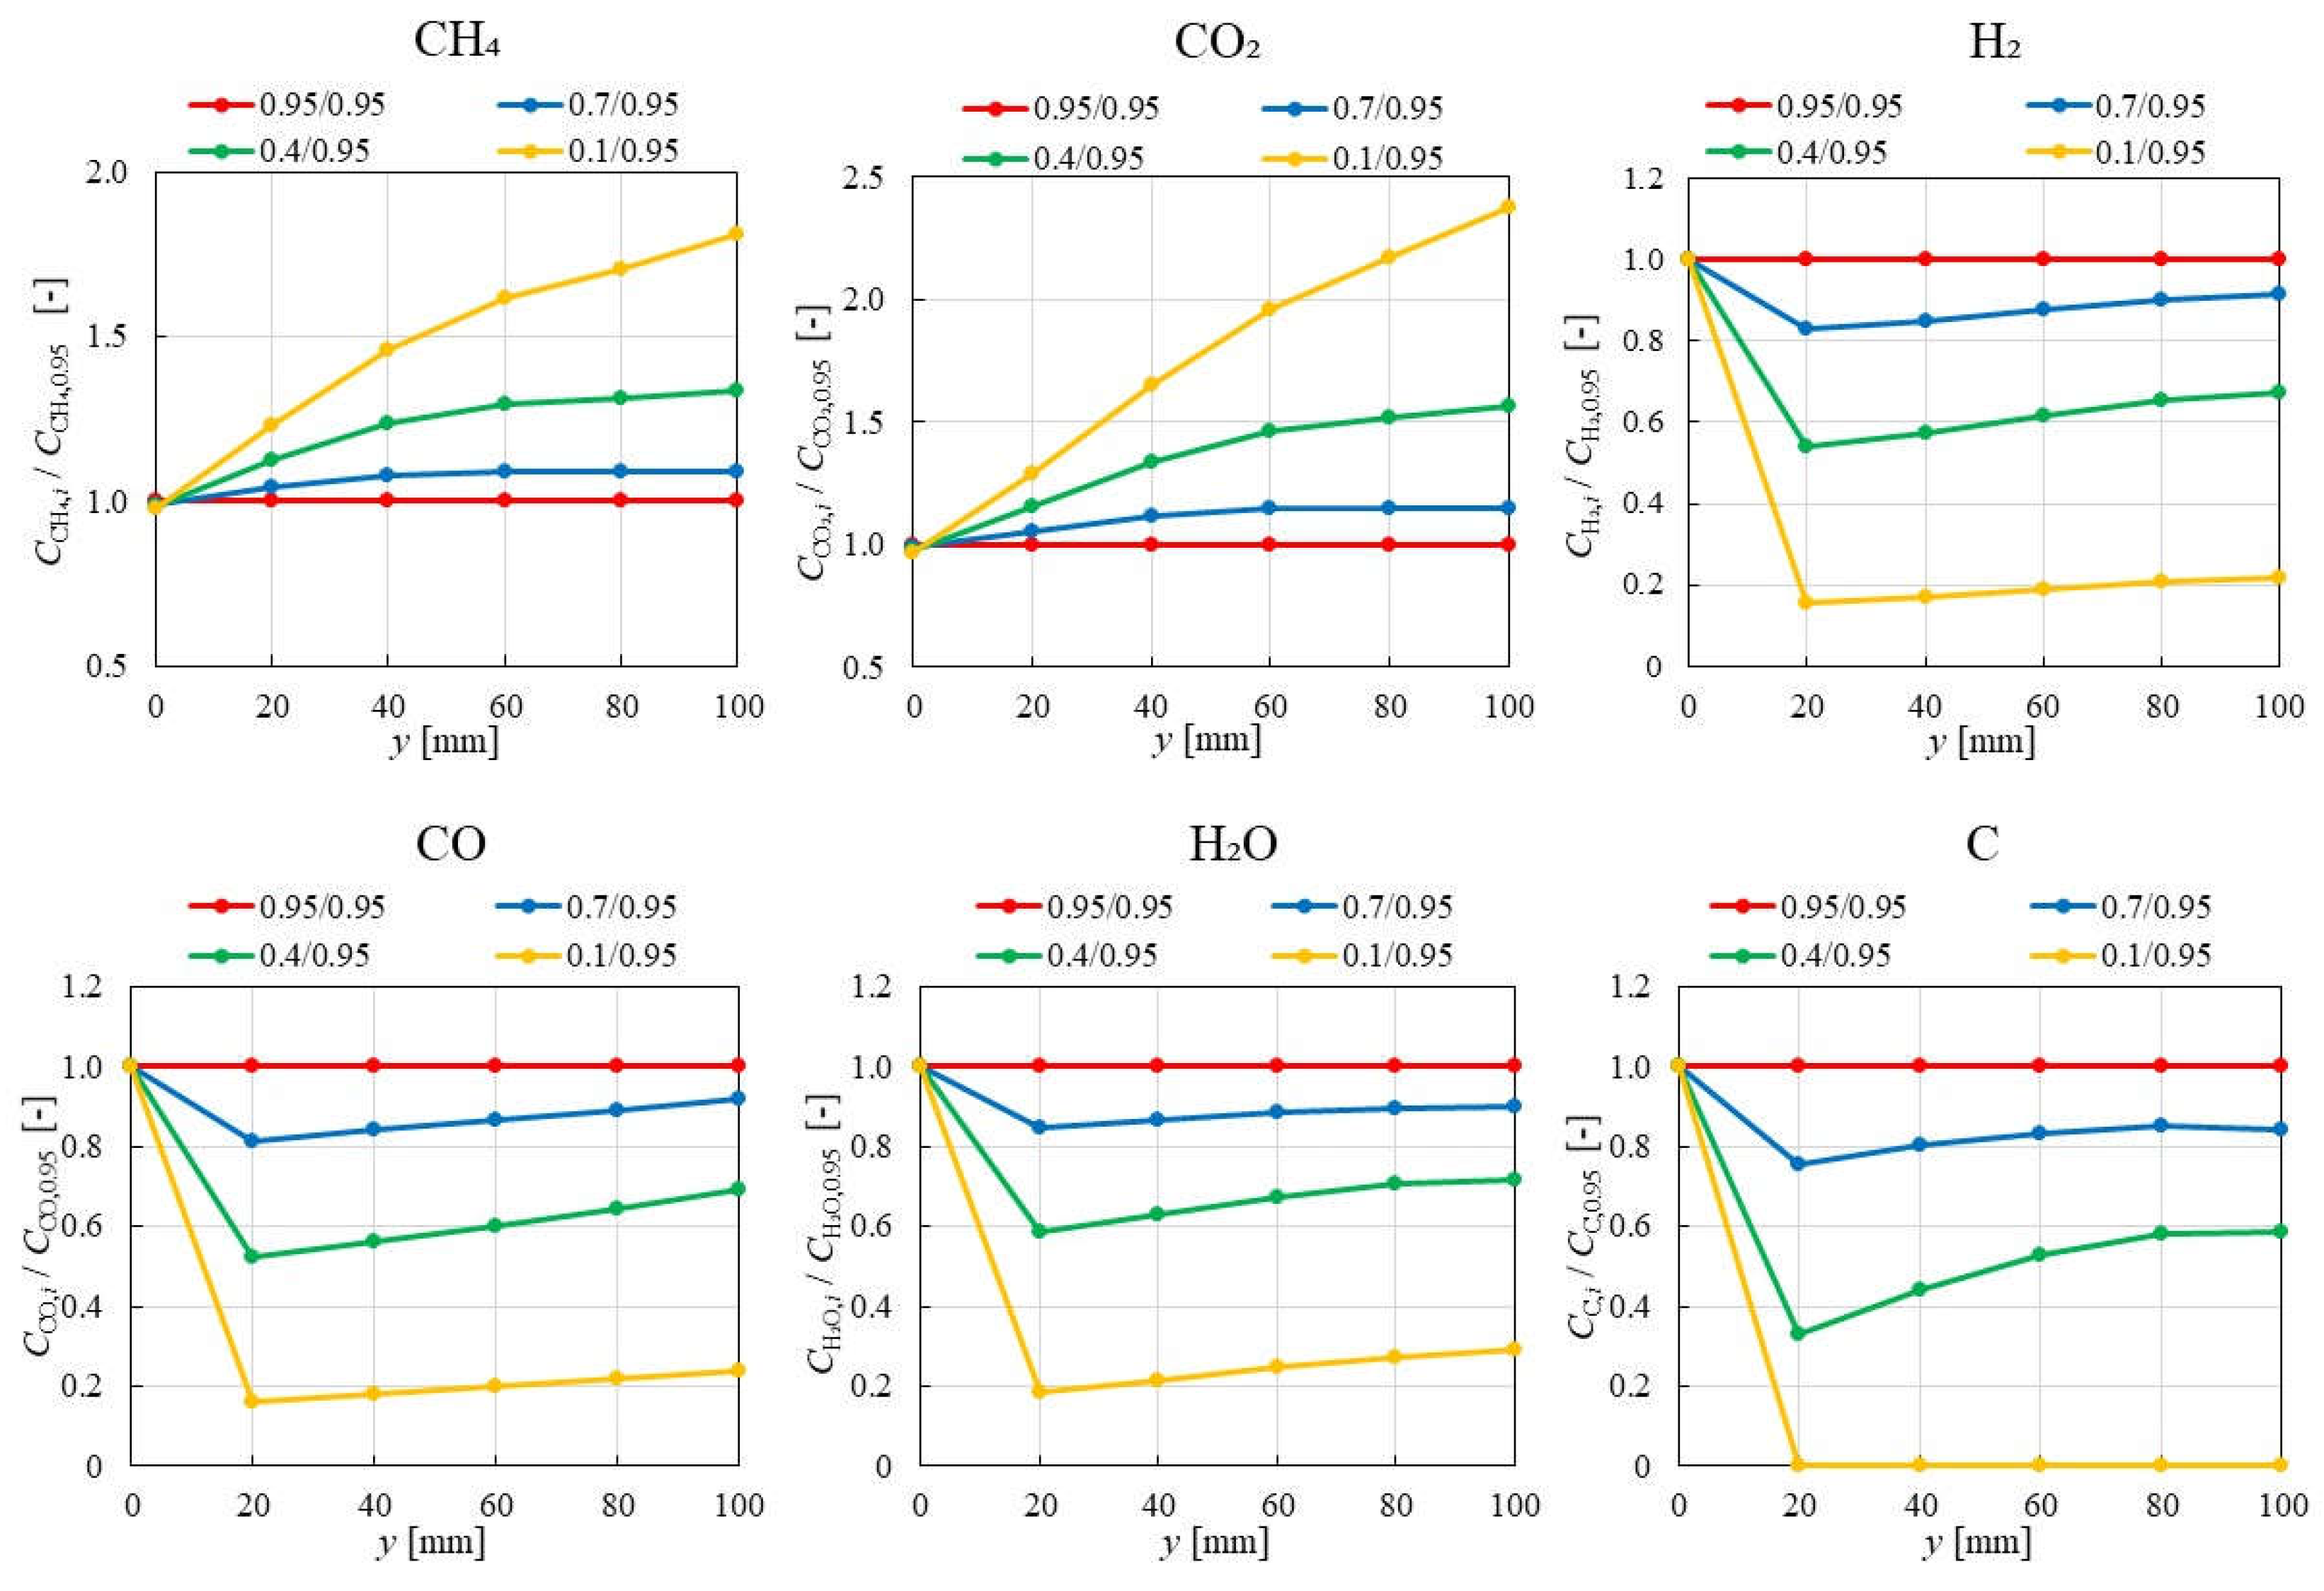
Figure 12.
Impact of εp on the distribution of temperature in case of CH4:CO2 = 1.5:1 at 600 ℃.
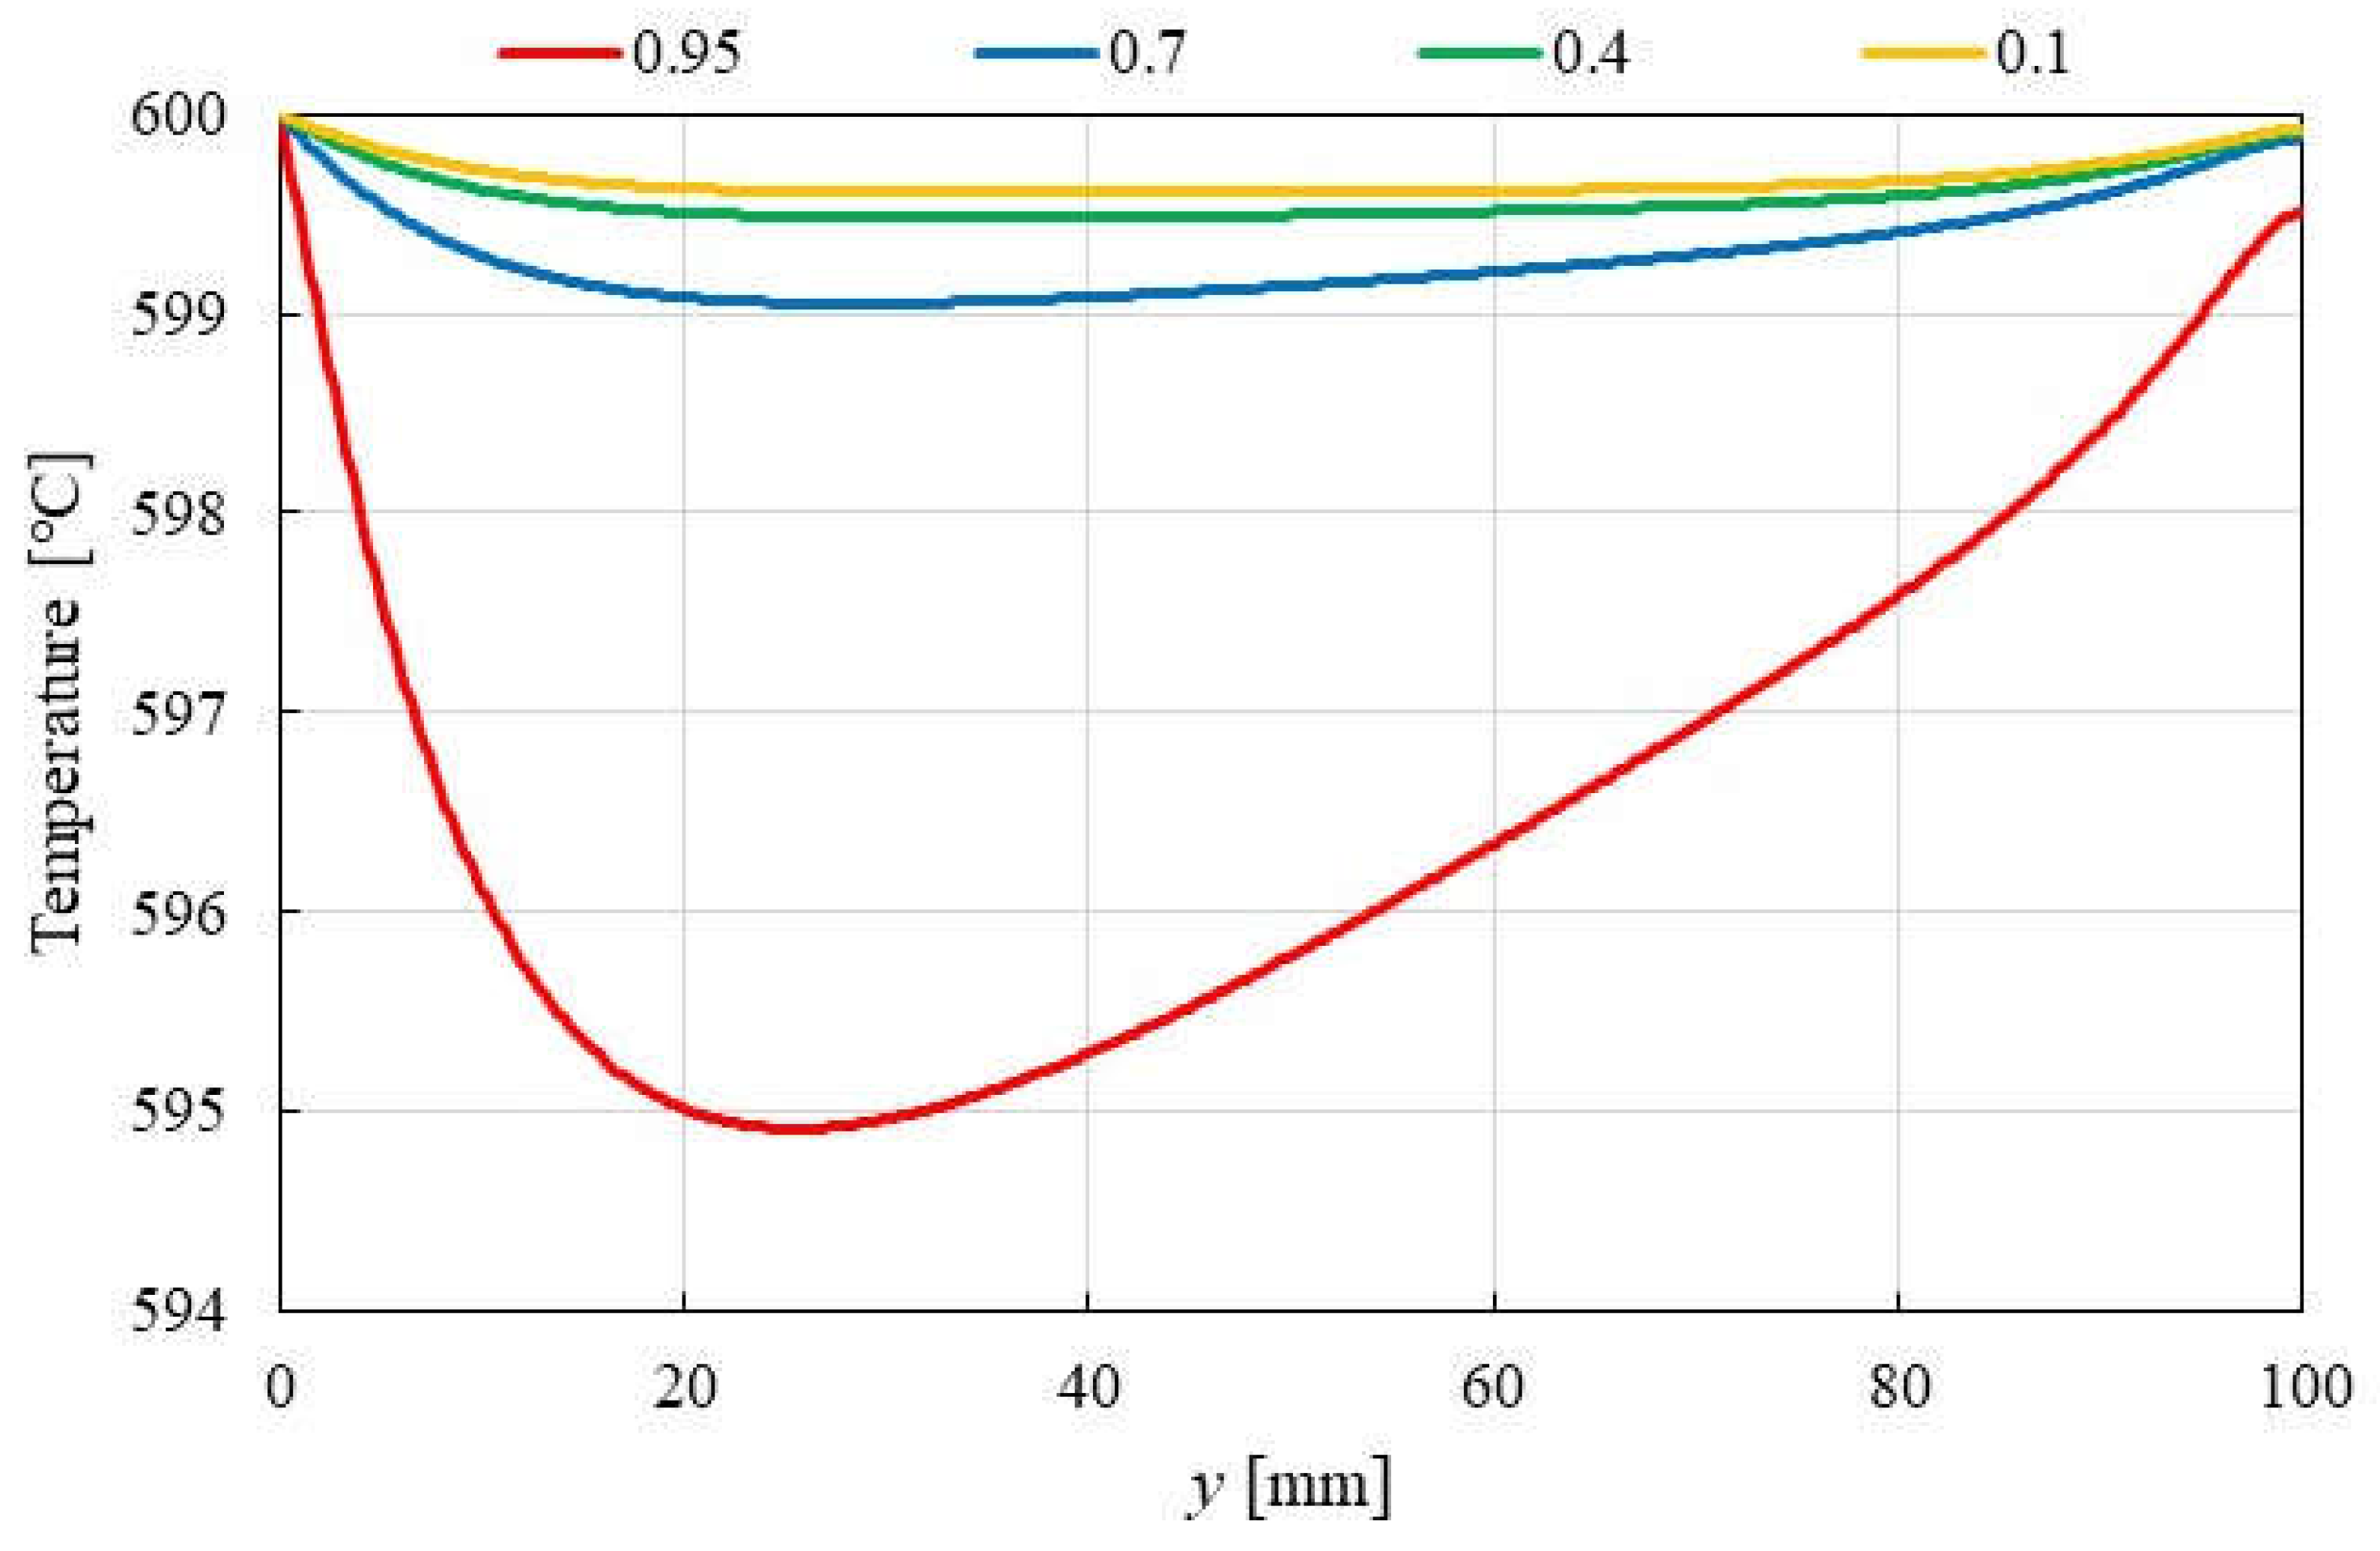
Figure 13.
Impact of molar ratio of CH4:CO2 on the distribution of molar concentrations of CH4, CO2, H2, CO, H2O and C at 400 ℃.
Figure 13.
Impact of molar ratio of CH4:CO2 on the distribution of molar concentrations of CH4, CO2, H2, CO, H2O and C at 400 ℃.
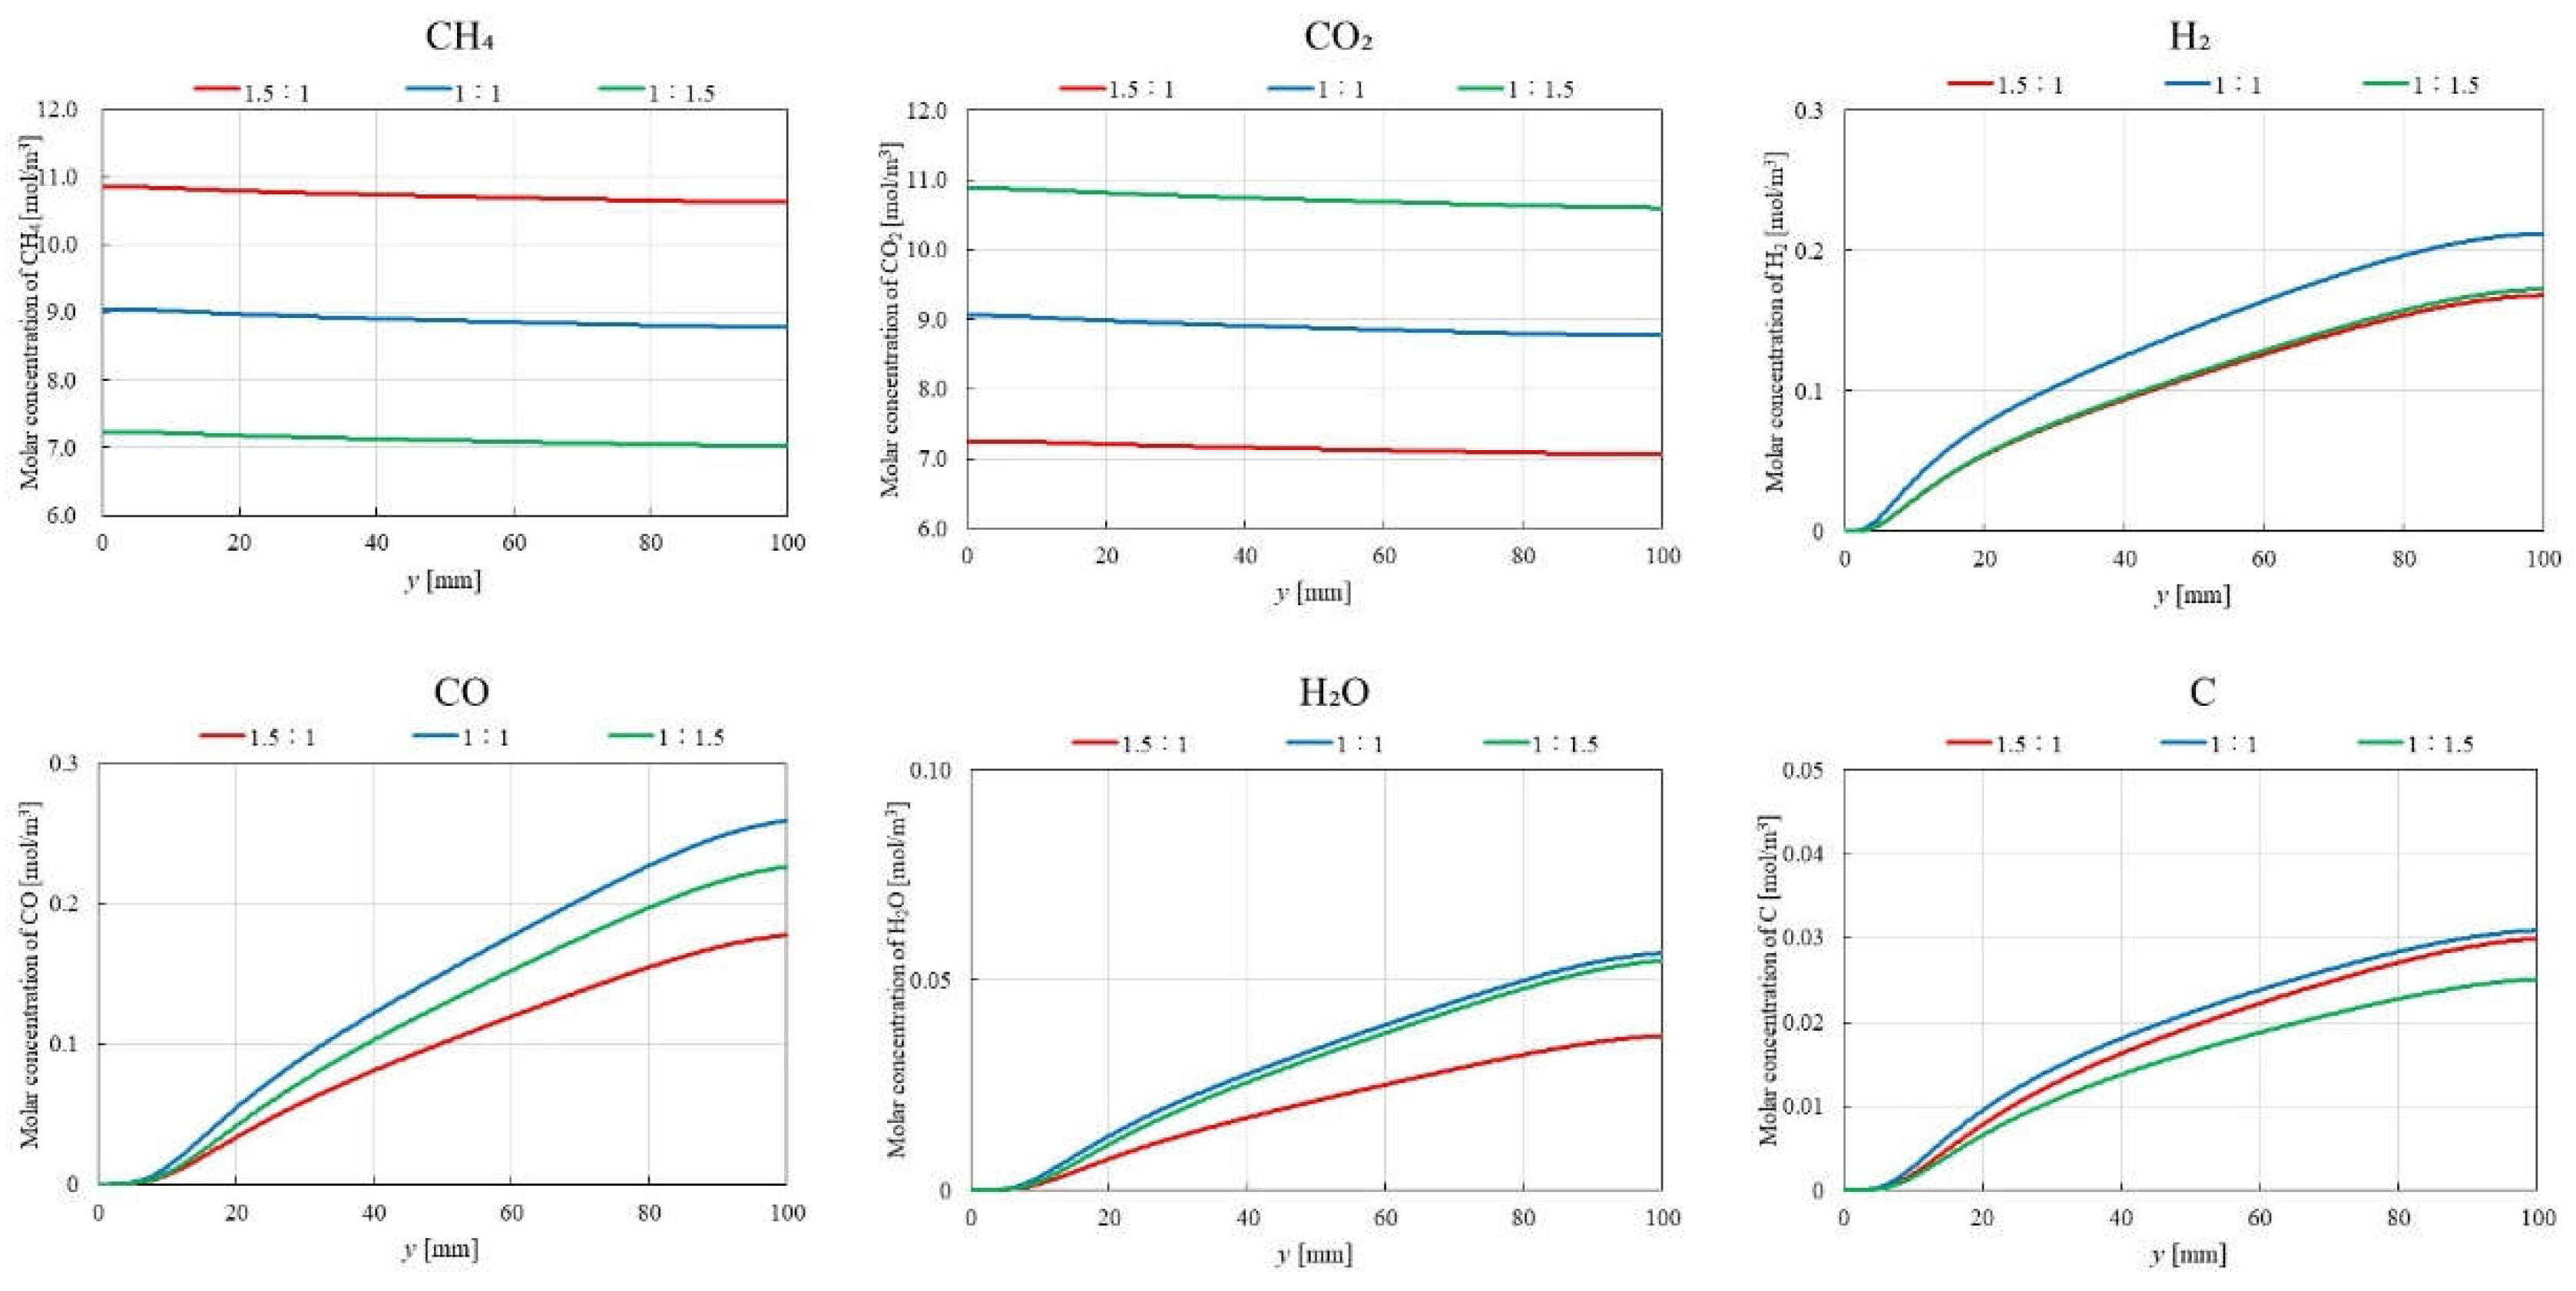
Figure 14.
Impact of molar ratio of CH4:CO2 on the distribution of molar concentrations of CH4, CO2, H2, CO, H2O and C at 700 ℃.
Figure 14.
Impact of molar ratio of CH4:CO2 on the distribution of molar concentrations of CH4, CO2, H2, CO, H2O and C at 700 ℃.
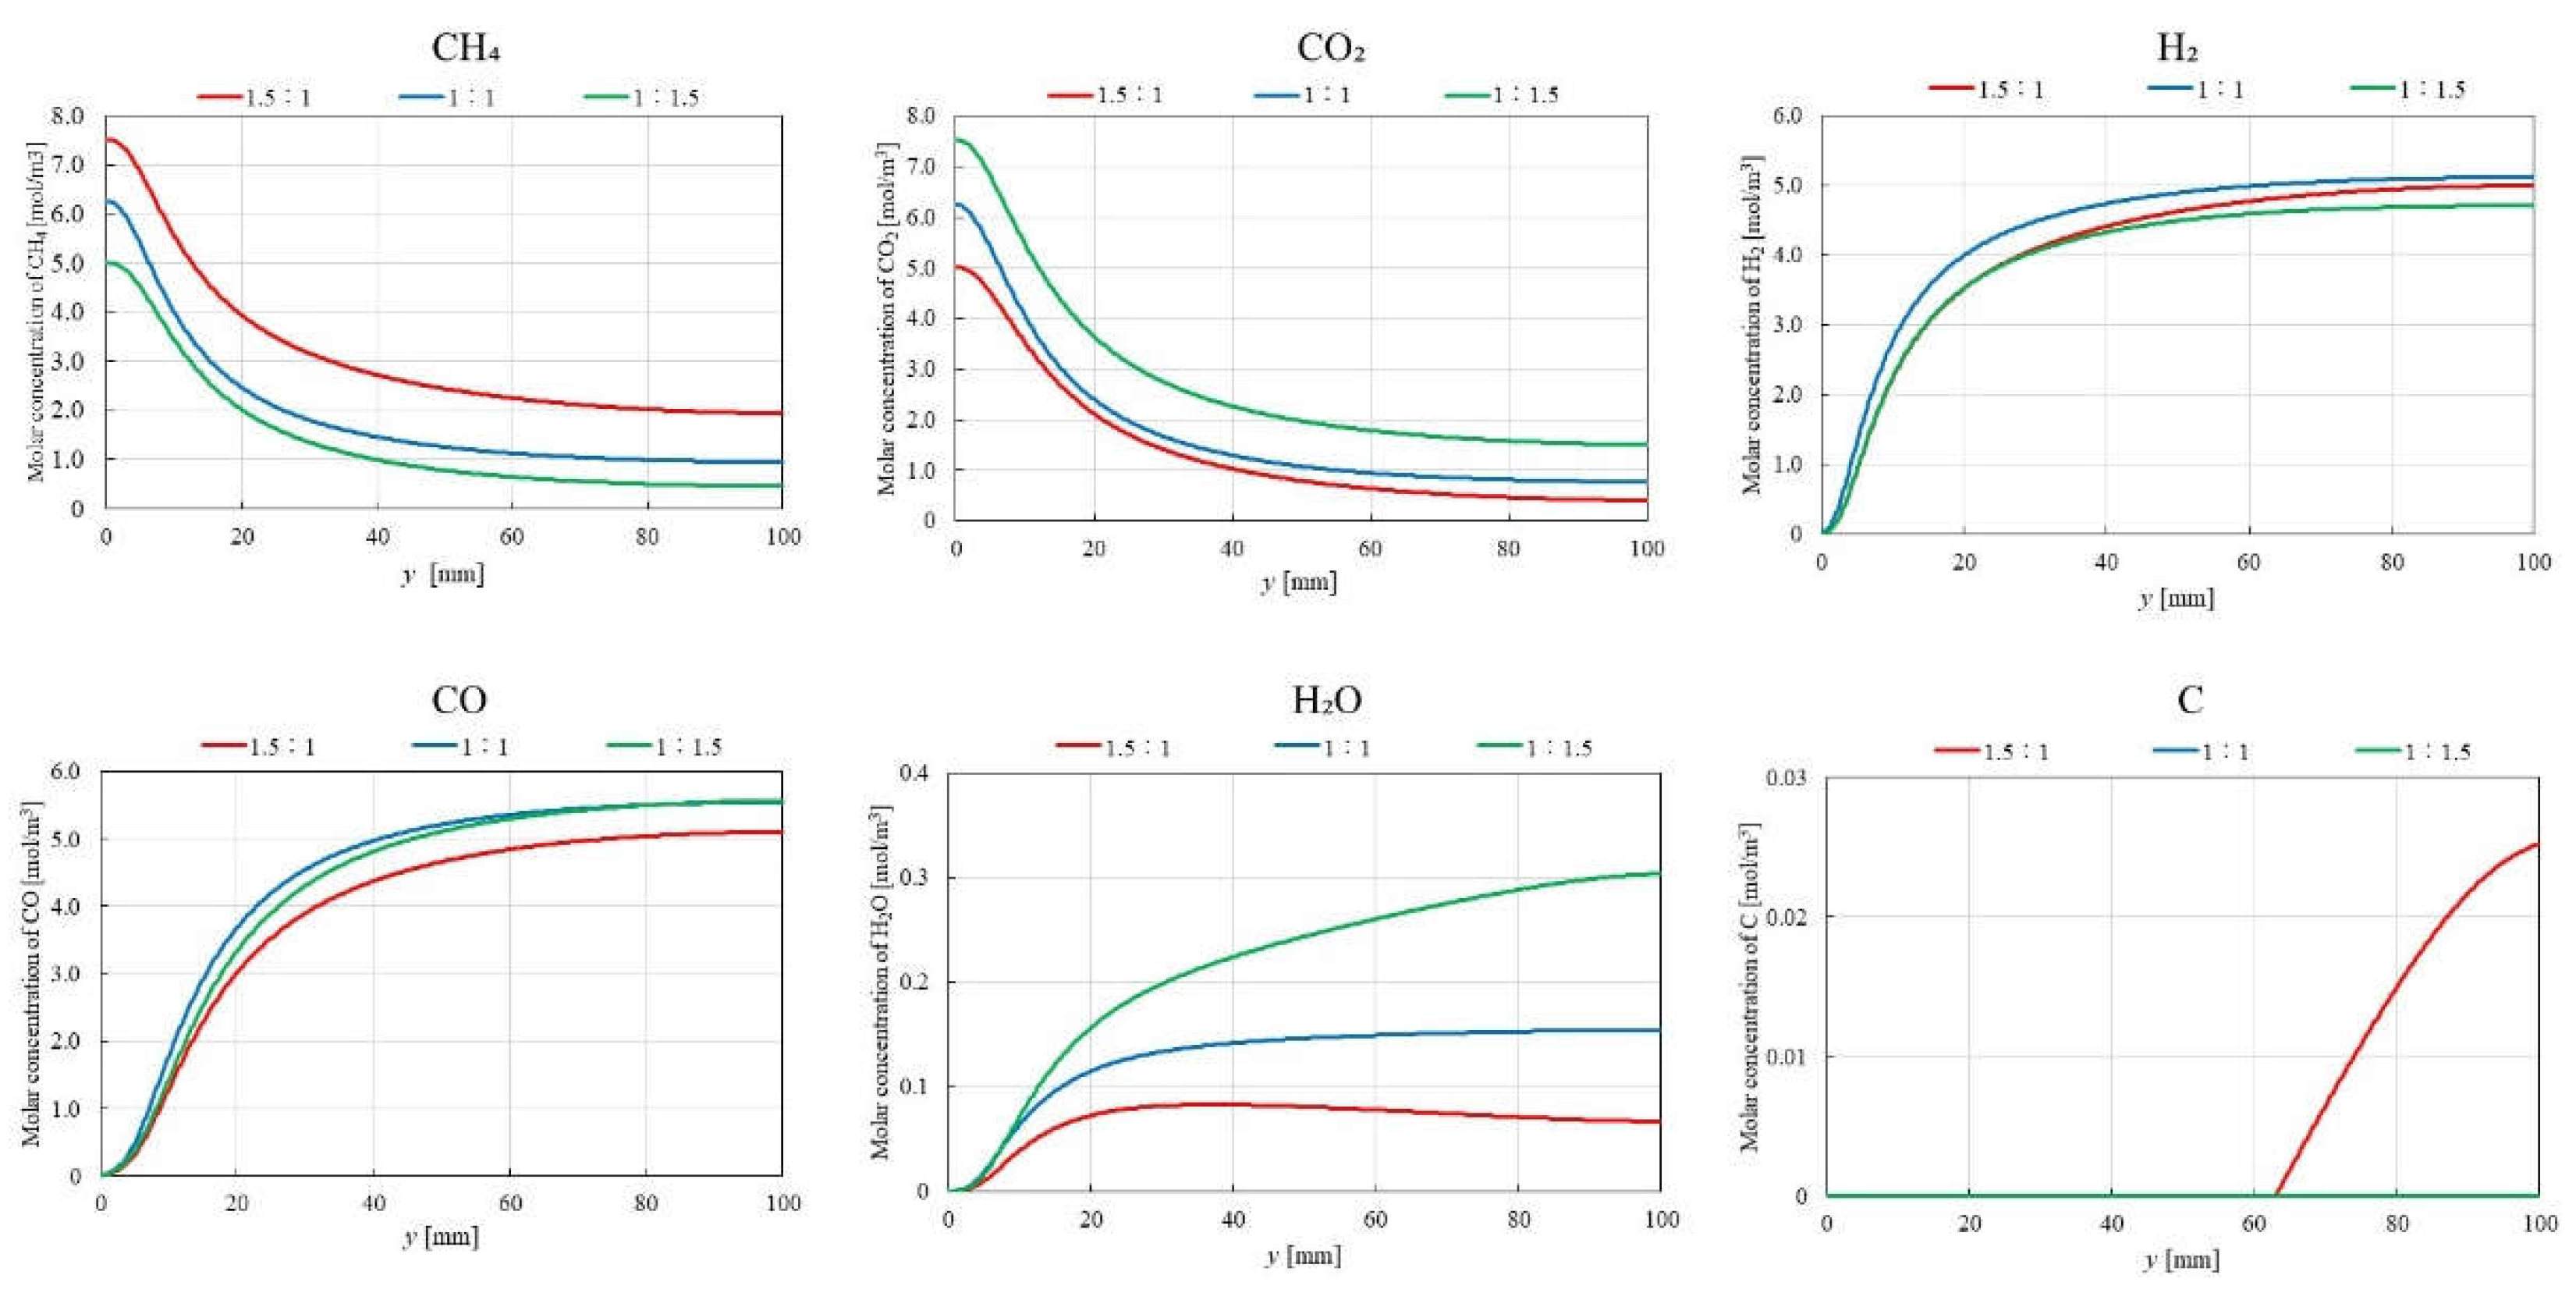

Table 1.
Numerical simulation conditions.
| Initial reaction temperature [℃] | 400, 500, 600 |
| Pressure in reactor [Pa] | 1.013×10⁵ |
| Inlet flow rate of CH4 [NL/min] (CH4:CO2 = 1.5:1, 1:1, 1:1.5) |
1.088, 0.725, 0.725 |
| Inlet flow rate of CO2 [NL/min] (CH4:CO2 = 1.5:1, 1:1, 1:1.5) |
0.725, 0.725, 1.088 |
| Outlet pressure [Pa] | 1.013×10⁵ |
| Density of catalyst [kg/m3] | 8901, 8752, 8709, 8664, 8619 (@20 ℃, 400 ℃, 500 ℃, 600 ℃, 700 ℃) |
| Porosity of catalyst (εp) [-] | 0.95, 0.7, 0.4, 0.1 |
| Permeability of catalyst [m2] | 1.9×10⁻⁸, 1.4×10⁻⁸, 8.0×10⁻⁹, 2.0×10⁻⁹ (εp = 0.95, 0.7, 0.4, 0.1) |
| Constant pressure specific heat of catalyst [J/(kg・K)] | 458, 558, 551, 541, 538 (@20 ℃, 400 ℃, 500 ℃, 600 ℃, 700 ℃) |
| Thermal conductivity of catalyst [W/(m・K)] | 91.2, 65.3, 66.5, 69.1, 72.2 (@20 ℃, 400 ℃, 500 ℃, 600 ℃, 700 ℃) |
| Apparent density of catalyst bed in reactor [kg/m3] | 418, 2504, 5008, 7511 (εp = 0.95, 0.7, 0.4, 0.1) |
| Apparent thermal conductivity of catalyst bed in reactor [W/(m・K)] | 3.5, 20.9, 41.7, 62.5 (εp = 0.95, 0.7, 0.4, 0.1) |
Table 2.
Comparison of CH4 conversion, CO2 conversion, H2 yield, H2 selectivity and CO selectivity among different εp in case of CH4:CO2 = 1.5:1 at 600 ℃.
Table 2.
Comparison of CH4 conversion, CO2 conversion, H2 yield, H2 selectivity and CO selectivity among different εp in case of CH4:CO2 = 1.5:1 at 600 ℃.
| εp [-] | CH4 conversion [%] | CO2 conversion [%] | H2 yield [%] | H2 selectivity [%] | CO selectivity [%] |
| 0.95 | 49.9 | 63.5 | 21.3 | 48.2 | 51.8 |
| 0.7 | 45.6 | 58.2 | 19.5 | 48.1 | 51.9 |
| 0.4 | 33.8 | 43.3 | 14.3 | 47.8 | 52.2 |
| 0.1 | 11.1 | 14.8 | 4.6 | 45.9 | 54.1 |
Table 3.
Comparison of CH4 conversion, CO2 conversion, H2 yield, H2 selectivity and CO selectivity among different temperatures in case of CH4:CO2 = 1.5:1 (based on numerical simulation data).
Table 3.
Comparison of CH4 conversion, CO2 conversion, H2 yield, H2 selectivity and CO selectivity among different temperatures in case of CH4:CO2 = 1.5:1 (based on numerical simulation data).
| Reaction temperature [℃] | CH4 conversion [%] | CO2 conversion [%] | H2 yield [%] | H2 selectivity [%] | CO selectivity [%] |
| 400 | 2.1 | 2.7 | 0.8 | 48.0 | 52.0 |
| 500 | 16.2 | 21.0 | 6.5 | 47.1 | 52.9 |
| 600 | 49.9 | 63.5 | 21.3 | 48.2 | 51.8 |
| 700 | 74.4 | 92.1 | 33.2 | 49.4 | 50.6 |
Table 4.
Comparison of CH4 conversion, CO2 conversion, H2 yield, H2 selectivity and CO selectivity among different temperatures in case of CH4:CO2 = 1.5:1 (based on experimental data).
Table 4.
Comparison of CH4 conversion, CO2 conversion, H2 yield, H2 selectivity and CO selectivity among different temperatures in case of CH4:CO2 = 1.5:1 (based on experimental data).
| Reaction temperature [℃] | CH4 conversion [%] | CO2 conversion [%] | H2 yield [%] | H2 selectivity [%] | CO selectivity [%] |
| 400 | 24.1 | -29.7 | 0.09 | 0.16 | 99.8 |
| 500 | 8.24 | -3.08 | 1.01 | 2.09 | 97.9 |
| 600 | 12.7 | 0.08 | 4.48 | 7.24 | 92.8 |
Disclaimer/Publisher’s Note: The statements, opinions and data contained in all publications are solely those of the individual author(s) and contributor(s) and not of MDPI and/or the editor(s). MDPI and/or the editor(s) disclaim responsibility for any injury to people or property resulting from any ideas, methods, instructions or products referred to in the content. |
© 2024 by the authors. Licensee MDPI, Basel, Switzerland. This article is an open access article distributed under the terms and conditions of the Creative Commons Attribution (CC BY) license (https://creativecommons.org/licenses/by/4.0/).
Copyright: This open access article is published under a Creative Commons CC BY 4.0 license, which permit the free download, distribution, and reuse, provided that the author and preprint are cited in any reuse.


