
Submitted:
25 September 2024
Posted:
27 September 2024
You are already at the latest version
Abstract
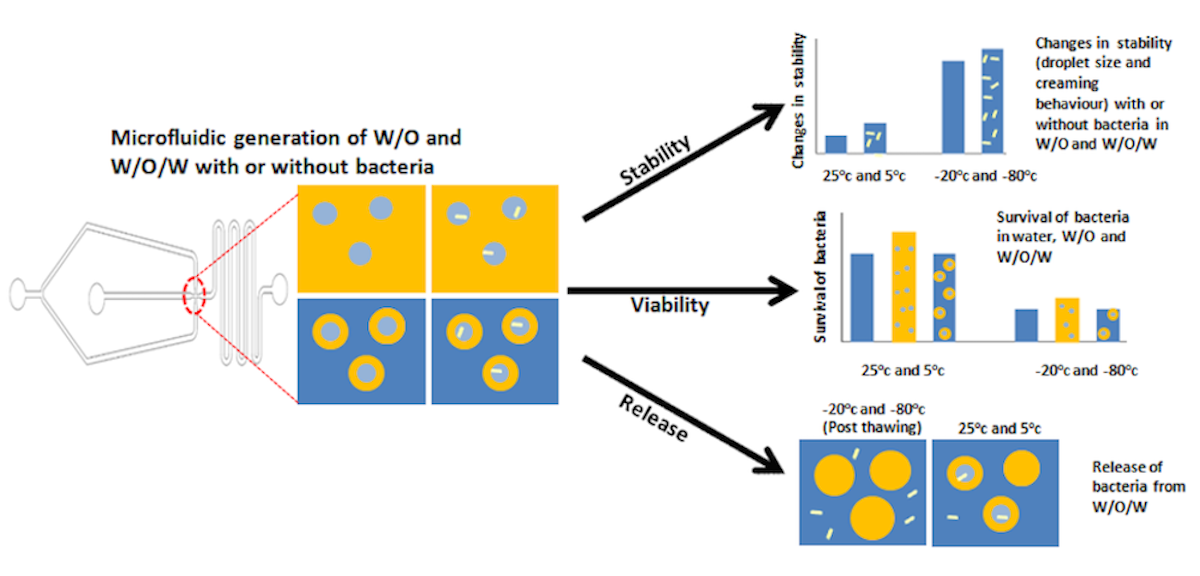
The encapsulation of bacteria in emulsion droplets offer various advantages over other conventional methods of encapsulation such as improvement in bacterial viability and may served as microenvironments for bacterial growth. Nevertheless, changes in temperature may affect bacterial viability and droplet stability. In this study, the encapsulation of bacteria in single water-in-oil (W/O) and double water-in-oil-in-water (W1/O/W2) emulsions was investigated under cold storage with a study on temperature-modulated release. The microencapsulation of bacteria in emulsion droplets was achieved by using a flow-focusing microfluidic device. Droplets stability was determined by measuring changes in droplets size and creaming behaviour at different temperatures. Thermal properties of the samples were determined by using differential scanning calorimetry while the release of bacteria with change in temperature was determined by measuring colony form unit (CFU) of the released bacteria and fluorescence microscopy. Higher bacterial viability was observed for encapsulated samples as compared to free cells indicating the ability of emulsion system in improving the bacterial viability during cold temperature storage. Crystallization temperature was lowered in the presence of bacteria, but the melting temperature was similar with or without bacteria. Storage in freezing temperatures of -20°C and -80°C leads to an extensive droplet destabilization with immediate release of encapsulated bacteria upon thawing in which temperature modulated release of encapsulated bacteria was achieved. This study provides an overview of the potential application of emulsion droplets for encapsulation and controlled release that is beneficial for various applications such as food and pharmaceuticals.
Keywords:
microfluidics
; bacterial release
; W/O/W emulsion
; stability
; crystallization
Highlights
- freeze-thaw triggered bacterial release in W/O/W demonstrated for the first time.
- emulsion stability increased in presence of bacteria.
- enhanced bacterial viability in W/O compared to W/O/W during freezing.
- crystallization temperature lowered in presence of bacteria.
1. Introduction
Emulsion droplet had been extensively studied for the encapsulation of materials such as bacteria, bioactive compounds, and drugs (Chavarri, Maranon and Carmen, 2012; Dluska et al., 2017; Devanthi et al., 2018; Peng et al., 2023; Sobti et al., 2023). These materials usually require storage at low temperatures to maintain its stability, especially for long-term storage. The storage of bacteria in low temperatures is a common practice for bacterial preservation to maintain its viability, for example, lactic acid bacteria in the dairy industry and for biotechnology applications. The freezing of cell to temperatures such as -20˚C and -80˚C help in maintaining not only its viability but also functionality over a long storage period (Fonseca, Béal and Corrieu, 2002; Wang et al., 2019). The encapsulation of bacteria in emulsion, especially food-based emulsions such as milk and ice cream has been reported to improve bacterial viability during freezing depending on the nature of the emulsion (Goderska and Czarnecki, 2008; Dianawati, Mishra and Shah, 2013; Nurliyani, Suranindyah and Pretiwi, 2015; Farias et al., 2019). Nevertheless, further studies are still required to assess not only the viability of bacteria encapsulated in emulsion droplets but also to determine the effect of bacteria on the emulsion stability during storage in cold temperatures.
The successful application of emulsion droplet for bacterial encapsulation depended on their stability. The stability of emulsion during cold temperature storage is highly affected by the changes in the phase behaviour of the oil and aqueous phase as reported in many related studies (Vanapalli, Palanuwech and Coupland, 2002; Cramp et al., 2004; Ghosh and Rousseau, 2009; Tippetts and Martini, 2009). The crystallization of the oil phase followed by the aqueous phase in oil-in-water (O/W) emulsions may cause partial coalescence of the oil droplets whereby in loosely packed emulsions, the collision between the still-liquid oil droplets and crystallized oil droplets with protruding crystals may cause membrane rupture that resulted in the droplets with still-liquid oil to flow out forming a linkage between the two droplets as it freezes. This mechanism will cause droplets flocculation that eventually leads to complete coalescence and oiling-off upon thawing (Vanapalli, Palanuwech and Coupland, 2002; Lin et al., 2007). A different destabilization mechanism for multiple emulsions namely water-in-oil-in-water (W1/O/W2) emulsion has been proposed which involves the external coalescence of the inner W1 phase with the outer W2 phase that occurred during the thawing process while the W1 inner phase remains intact during the freezing process (Rojas and Papadopoulos, 2007; Rojas et al., 2008).
Although emulsion destabilization is unfavourable for food emulsions as it may affect product quality, it has the potential to be applied for the controlled and immediate release of materials, particularly from double emulsion droplets. Targeted release of microbial from double emulsion have been discussed recently by Zhang et al. (2023) that shows promising application of this system whereby release can be triggered by various factors that may help to cater its application in various food and drug environment. Previous studies also show an interesting application of emulsions for the controlled release of encapsulated materials with the change in temperature which has high potentaial to be applied in industries such as food and pharmaceuticals (Guan et al., 2023; Bernal-Chávez et al., 2023; Rojas and Papadopoulos, 2007; Rojas et al., 2008;). However, it is crucial to understand the mechanism behind the release in order to widens the applications of this system for controlled release. This study focused on the application of emulsion droplet for bacterial encapsulation under cold temperature storage. The detrimental effects of cold temperature on bacterial viability and droplet destabilization during storage remains a challenge. Therefore, this study is crucial and may provide valuable information on the suitability of emulsion droplets for bacterial encapsulation under cold temperature storage. In addition, temperature induced bacterial release from double water-in-oil-in-water emulsion was explored to further determined its potential for the controlled release of encapsulated materials.
2. Materials and methods
2.1. Materials and Bacterial Cultures
Microfluidic device fabrication was done by using a Polydimethylsiloxane (PDMS) preparation set (Sylgard 184, Dow-corning, United States) which includes the curing agent and pre-polymer. Oil-soluble surfactant, polyglycerol polyricinoleate (PGPR) was obtained from Danisco (Denmark). Soybean oil (Alfa Aesar, United Kingdom) was used as the oil phase for both single water-in-oil (W/O) and double water-in-oil-in-water (W1/O/W2) emulsion droplet. For bacterial culture preparation, the materials used were nutrient agar, Luria Bertani broth (LB broth) and phosphate buffer saline (PBS) all by Oxoid Ltd. (United Kingdom). Escherichia coli strain SCC1 (MG1655-GFP mutation) expressing green fluorescent protein (E. coli-GFP) stock culture was obtained from Biochemical Engineering Laboratory, University of Birmingham, United Kingdom.
2.2. Bacterial Cells Preparation
Bacterial cultures for encapsulation in emulsion droplets were prepared by culturing E. coli-GFP on nutrient agar at 37 °C for 24 hours. The cultured bacteria were kept at 4°C prior to the experiment. The bacterial cells were then inoculated into 50 mL of Luria Bertani broth (LB Broth) in a shaking incubator at 37°C, 150 rpm for 24 hours and sub-cultured into LB broth (1:50) and incubated for another 2 hours. The bacterial culture was then centrifuged (10000 × g, 10 mins) and washed two times with 50 mL of PBS. After centrifugation, the supernatant was discarded and was replaced with 50 mL of fresh LB broth or DIW to re-suspend bacterial cells for encapsulation. The bacterial cell concentration was prepared to 108 CFU/mL.
2.3. Microfluidic Device Fabrications
The microfluidic devices used for droplet generation were prepared by using standard soft lithography technique (Kim et al., 2008). Microfluidic devices were designed according to Bauer et al. (2010). Patterned moulds were produced by printing the design onto high resolution photomasks (Micro Lithography Services Limited, UK). Silicon wafers (Si-Mat, Germany) that were spin-coated with SU-8 photoresist (SU-8, Microchem) were then exposed to UV light through the photomasks with a mask aligner (Canon PLA-501FA mask aligner). PDMS mixtures consists of PDMS and curing agent prepared at a recommended ratio of 1: 10 was then poured onto the prepared mould, degassed, and cured in an oven at 70 °C for 1 hour. The device was then cut out of the mould and the inlet and outlet holes were punched followed by corona discharge treatment (Relyon, PZ2) for approximately 30 s that bonds the device onto a glass slide to close the channels. The prepared device was then left on a hot plate for approximately 15 min at 100 °C. A new device was prepared for every experiment to minimize contamination.
As part of microfluidic device preparation, partial hydrophilic surface treatment was done on double emulsion droplet devices to ease droplet formation (Bauer et al., 2010). Polyelectrolyte multilayers (PEM) consisting of alternating sequence of poly(allylamine hydrochloride) (PAH) and poly(sodium 4-styrenesulfonate) (PSS) solutions in 0.5 M aqueous sodium chloride solution (0.1% w/v) was loaded into a Tygon tube (Cole-Parmer instrument Co. Ltd., UK) with sodium chloride (NaCl) in deionized water (0.1 M) as washing solution. The PEM was then flushed through the lower part of the microfluidic device while the upper part was blocked with a stream of deionised water. At the end of the process, the lower part of the microfluidic channel was coated with PEM rendering the channel walls hydrophilic while the upper part remains hydrophobic.
2.4. Microfluidic Encapsulation of E. coli-GFP in W/O and W1/O/W2 Droplet
The prepared culture of E. coli-GFP in deionised water (DIW) was then used as the aqueous phase of W/O and the inner aqueous phase of W1/O/W2 droplet. The oil phase for both types of emulsion consist of soybean oil with 1.5% w/v PGPR surfactant while for W1/O/W2, the outer aqueous phase consists of DIW with 1% w/v Tween 80 surfactant. The bacterial encapsulation was conducted by using a flow-focusing microfluidic device whereby a single junction device was used for generating W/O droplet while the encapsulation into W1/O/W2 was done by using a double junction device. The devices were connected to a pressure controller (OB1 MK3, Elveflow, France) to produce monodispersed droplets of approximately 50μm in diameter for W/O. In order to generate double emulsion, the W/O droplets was further emulsified with an outer aqueous phase producing dispersed oil globules of approximately 100μm in diameter. The produced droplets were collected in Eppendorf tubes for further analysis.
2.5. Storage of Samples in Different Temperature
The prepared samples of emulsion droplet incorporated with or without E. coli-GFP was stored in different storage temperature of 25°C (control), 5°C (refrigeration temperature), -20°C (freezing temperature) and -80°C (freezing temperature) in laboratory-based refrigerator and freezers whereby the temperature was monitored throughout the storage period. Samples were stored for 24 hours and were thawed at 25°C for one hour prior to further tests. Samples of E. coli-GFP suspended in sterilised deionised water (DIW) were also prepared and kept at the designated temperature as non-encapsulated control.
2.6. Bacterial Viability Determination
The viability of E. coli-GFP was determined before and after the thawing process of samples stored in different temperatures. Encapsulated samples were centrifuged at 15800 g for 1 min to break the emulsion and release the entrapped cells. Serial dilutions of the samples were done using phosphate buffer saline (PBS) and viable cells were counted immediately after samples preparation and after storage by using the Miles and Misra method (Miles and Misra, 1931).
2.7. Microscopic Observation of Droplet Destabilization
Droplet destabilization was observed with respect to changes in temperature. The samples were prepared for microscopy by placing approximately one drop of sample onto the glass slide. The prepared glass slide was then placed on a Peltier temperature-controlled stage (Model PE-120, LINKAM scientific instruments, United Kingdom) where the temperature of the stage was controlled by using Link software. Eheim circulation pump (ECP) was used for water circulation through the stage in order to keep the temperature-controlled stage at the desired temperature. The temperature-controlled stage was fitted on a Nikon Eclipse Ti microscope equipped with Pco. Edge 5.5 sCMOS camera where the samples were cooled and thawed on the microscope stage while photomicrographs of the samples were acquired. The sample was prepared at an initial temperature of 25°C and was cooled down to -25°C. The sample was then thawed to the initial temperature of 25°C. For fluorescence microscopy, the encapsulated E. coli-GFP was observed at 509 nm emission.
2.8 Determination of Droplet size and Phase Separation
The effect of different storage temperature on droplet size was determined by measuring the diameter of the droplet immediately after sample preparation and after the thawing process at 25°C. Single and double emulsion samples without E. coli- GFP were prepared as controls. Photomicrographs of the droplet were taken before and after the storage period and changes in the size of the dispersed aqueous phase for single emulsion droplet and oil globule size for double emulsion droplet were measured by using the MATLAB software using the circular Hough transform (The Mathworks, 2020).
Droplet stability was also determined by measuring the amount of free water (for W/O emulsion) and free oil (for W1/O/W2 emulsion) with or without the presence of E. coli-GFP. Phase separation measurement was done by collecting 1 mL of sample into graduated syringes immediately after droplet preparation. The samples were then stored at different temperatures in an upright position for 24 hours. The volume of the free water and oil were measured from the graduated syringe immediately after the thawing process and the percentage of free water and oil were determined as follows:
Where Vwater/oil is the volume of separated water or oil as measured from the graduated syringe while Vemulsion is the total volume of the emulsion sample.
2.9 Measuring the Release of Bacteria from W1/O/W2 Droplet
The release of bacteria was determined by measuring the number of cells in the outer aqueous phase immediately after samples preparation and after the thawing process of the double emulsion samples (W1/O/W2). Samples stored in Eppendorf tubes were kept upright to allow the separation of the samples into a cream layer (oil globules) and serum phase (W2) due to the difference in density between the phases. The serum was then carefully withdrawn from the sample by using a pipette and serially diluted in PBS. Plate count was then performed according to Miles and Misra method where the encapsulation efficiency was calculated following El Kadri et al (2015) while the percentage of released cells were quantified as compared to the overall viable cells in the samples after storage as follows:
Where N is the number of viable cells count in the serum phase immediately after emulsion preparation while N0 is the overall viable cell count prior to encapsulation in W1/O/W2 droplets. N1 is the overall viable cells after storage and Nt is the viable cell count in the serum phase after storage at temperature, t.
2.10. Differential Scanning Calorimetry
Differential scanning calorimetry (DSC) was done in order to determine the thermal properties of emulsions samples and bulk aqueous solutions. The crystallization and melting behaviour were characterised by using a differential scanning calorimeter (Mettler Toledo, model 822e, Mettler Scientific Instruments, Germany) with liquid nitrogen as the cooling substance. Approximately 5 mg of sample was weighted and hermetically sealed in aluminium pans together with an empty pan as reference. Samples were then cooled from 25°C to -70°C and were held at -70°C for 5 minutes before heated back to 25°C at 1°C/min. The cooling and heating curves were obtained from the Star e software (Mettler Toledo, Mettler Scientific Instruments, Germany) whereby positive curves resulted from exothermic reaction while the endothermic reaction in the sample creates negative curves. The crystallization and melting points of the tested samples were determined from the peak onset temperatures of the curves by using the same software.
2.11 Statistical Analysis
All experiments were conducted with three replicates (N=3). The data obtained were analysed with Excel (Microsoft corp.) to determine the mean, standard deviation (SD) and standard error of means (SEM). One-way ANOVA with Tukey HSD was conducted to compare several means while students’ T-test was conducted to compare 2 means by using the IBM SPSS Statistical software version 23. The difference between means were considered significant at p<0.05.
3. Results and Discussion
3.1 The Effect of Storage on Droplet Size Change
Monodispersed droplet for both single and double emulsion droplet were observed for all samples with or without E. coli-GFP with a CV value of approximately 9% for single emulsion droplet and 7% for double emulsion droplet prior to the storage test as observed in Figure 1 (A, C, E, G) and Table 1. The results indicate the ability of the flow-focusing microfluidic devices in producing highly monodispersed droplet and the presence of E. coli-GFP does not affect droplet formation. For samples of single emulsion droplet, no significant change (p>0.05) in droplet size was observed after storage at 25°C and 5°C (Table 1) for both samples with and without bacteria. The droplet remains monodispersed with only 0.1-0.2% change in the value of the coefficient of variation (CV). However, a significant change (p<0.05) in droplet size and distribution were observed after 24 hours of storage for samples stored at freezing temperatures of -20°C and -80 °C for both sample with and without bacteria. The highest change was observed for samples stored at -80°C whereby the CV value increases from 9.6% to 28.3% for samples without E. coli-GFP indicating a polydisperse distribution of droplet (CV values of higher than 25% are regarded as polydisperse). Comparing samples with or without E. coli-GFP, change in droplet stability was minimized with the presence of E. coli-GFP whereby a smaller change in average droplet size and CV was observed with samples containing E. coli-GFP as compared to samples without E. coli-GFP.
A significant change (p<0.05) in the size of oil globule after 24 hours of storage was observed for all double W1/O/W2 emulsion samples whereby a decrease in average oil globule size was observed for samples stored at 25°C and 5°C. However, presence of large droplet was also observed with up to 170 µm in droplet size (Figure 1 F, H). Samples stored at freezing temperatures of -20°C and -80°C, showed an increase (p<0.05) in droplet size after storage (Table 1). Samples containing E. coli-GFP show better droplet stability as compared to samples without E. coli-GFP indicating the ability of bacterial cells in maintaining droplet stability during cold temperature storage. Complete external coalescence occurred between the inner W1 droplet with the outer W2 phase after 24 hours of storage forming single oil-in-water (O/W) emulsion.
The storage of single W/O samples at -20°C caused the solidification of the aqueous phase and partial crystallization of the oil phase whereas storing the samples at -80 °C completely solidifies the emulsions. With broad crystallization temperature as opposed to pure water that exhibits a sharp crystallization curve, it is quite difficult to determine the exact crystallization temperature of the soybean oil due to the presence of lipids and a mixture of molecules. It has been reported previously that soybean oil is partially crystallized at a temperature between -10°C to approximately -20°C whereby below this temperature, the soybean oil is most likely to become solid (Tieko Nassu and Gonçalves, 1999; Harada and Yokomizo, 2000; Mezzenga, Folmer and Hughes, 2004; Ishibashi, Hondoh and Ueno, 2016). Several destabilization mechanisms of single W/O emulsions during the freeze-thaw process have been proposed depending on the droplet arrangements in the emulsion (Aronson and Petko, 1993; Aronson et al., 1994; He and Chen, 2002; Chen and He, 2003; Lin et al., 2007). The destabilization of loosely packed W/O emulsion droplet is due to the collision-mediated coalescence (Lin et al., 2007). This process is triggered by the uneven crystallization of the polydisperse water droplet in the emulsion whereby the collision between the smaller still-liquid water droplet with protruding ice crystals of the larger frozen droplet punctures the membrane surrounding the smaller still-liquid water droplet. This leads to the heterogeneous nucleation and crystallization of the smaller water droplet that coalesces forming larger droplet upon thawing (Lin et al., 2007; Ghosh and Rousseau, 2009b). However, this may not be the case for single W/O droplet generated by the microfluidic device as it is highly monodispersed and therefore, minimizes the heterogeneous crystallization of the water droplet and the effect of collision-mediated coalescence.
Although the effect of collision-mediated coalescence was minimized, the destabilization of W/O droplet was still observed and is mainly attributed to the static and upright storage of the samples during freezing that caused the inevitable sedimentation of the water droplet making them closely packed. For densely packed emulsions, the destabilization mechanism is induced by the direct breakage of interfacial films and emulsion inversion (Aronson and Petko, 1993; Aronson et al., 1994). The direct breakage of the droplet interfacial film occurred as neighbouring droplet crystallizes and expands causing destabilization. Droplet expansion pressed the droplet closely together while crystallized droplet punctured the interfacial film of neighbouring still-liquid droplet leading to droplet rupture (Ghosh and Coupland, 2008). This caused the content of the ruptured droplet to flow out and formed a link between the two frozen droplets resulting in flocculation as observed in this study in Figure 2 b (van Boekel and Walstra, 1981). During the thawing process, the crystal network collapsed and the two partially coalesced droplet merged together forming a larger droplet (complete coalescence) as observed in Figure 2 d (Vanapalli, Palanuwech and Coupland, 2002). Droplet crystallization and expansion also resulted in the thinning of the oil and surfactant layer around the aqueous phase that accelerates droplet coalescence during the melting process (Ghosh and Rousseau, 2009b). Emulsion inversion, as reported by Aronson and Petko (1993) involves the rearrangement of ice crystals and the still-liquid oil that leads to the presence of distinct oil droplet within the ice structure. However, this may not be the case for samples tested in this study as it occurs mainly in densely packed emulsions containing distinctively high-volume fraction of the dispersed phase (Vanapalli, Palanuwech and Coupland, 2002).
It has been reported previously that the stability of water-in-oil droplet during the freeze-thaw process depended on the freezing sequence of the oil and aqueous phases and also the type of surfactants used (Ghosh and Rousseau, 2009b). The freezing sequence between the oil and aqueous phase may depend on the type of oil used as some oils may have a lower freezing point or higher freezing point than the aqueous phase. Ghosh and Rousseau (2009) reported that for single water-in-oil emulsions, instability is mostly evident in samples with the oil phase that crystallizes first prior to the aqueous phase and when the emulsifier is in liquid-state during the freezing process. For emulsion containing soybean oil, the oil phase crystallizes at a much lower temperature than the aqueous phase in which droplet destabilization should be minimized. However, significant changes (p < 0.05) in droplet size distribution were observed for samples stored at -80°C. At -80°C, the gradual crystallization of the oil phase due to difference in the melting fraction of fats in soybean oil as the high-melting fraction crystallizes first followed by the low-melting fraction (Ishibashi, Hondoh and Ueno, 2016) resulted in the ice crystals to be forced into the still-liquid oil phase forming a region with highly concentrated ice crystals (Ghosh and Coupland, 2008; Degner et al., 2013). During thawing, as the oil melts, the ice crystals will immediately coalesce as a further increase in temperature caused the aqueous droplet to melt and fuse together (Degner et al., 2014).
Previous study reported on the separation of the W1 phase from the double emulsion droplet where the separated W1 phase retained in the W2 phase supported by a very thin and complex layer of oil and surfactants (Mohd Isa et al., 2021). This also caused the reduction in oil globule size as the W1 phase escaped into the W2 phase. Similar behaviour was also seen for samples of double emulsion kept at a lower temperature of 5°C. However, for double emulsion samples kept at a much lower temperature of -20°C and -80°C, significant (p < 0.05) increase in the average oil globule size and change in the droplet size distribution was observed. Interestingly, the inner W1 phase remains intact in the W1/O/W2 during the freezing process as shown in Figure 2 f and droplet separation process was not observed.
The destabilization mechanism of the double emulsion droplet is mainly attributed to the coalescence between the inner W1 phase and the outer W2 phase which is termed as external coalescence (Magdassi and Garti, 1987; Rojas and Papadopoulos, 2007). In contrast to single emulsions droplet whereby the droplet destabilization process occurred throughout the freeze and thawing processes, the external coalescence of double emulsion occurred during the thawing process of the emulsions while the inner W1 phase remains intact during the freezing process (Rojas and Papadopoulos, 2007). The thawing process caused deformation of the inner W1 phase followed by the complete burst of droplet due to external coalescence and is mainly affected by the size of the inner W1 phase and surfactant concentration. According to Rojas and Papadopoulos (2007), the determined threshold of the W1 inner aqueous phase size to the oil globule size ratio is 0.3 in which above, resulting in coalescence upon thawing. In addition, emulsion droplet with thick surfactant layers creates a repulsive force between the W1 inner phase and the O/W2 interface that improves droplet stability against external coalescence (Wangqi Hou and Papadopoulos, 1996). A similar mechanism was observed in this study whereby the inner W1 droplet remain intact during the freezing process and rapid freezing prevents the droplet from splitting (Figure 2 e-f). Emulsions destabilization only occurred during the thawing process for both samples kept at -20°C and -80°C. As the frozen oil melts at a lower temperature during the thawing process of samples kept at freezing temperatures, the liquid oil flows through the cracks and gaps created by the gradual thawing of the aqueous phase (Figure 2 g) leading to absence of the oil layer that separates the inner W1 phase from the outer W2 phase. This accelerates the external coalescence of the aqueous phase as it melts completely with increase in temperature forming single oil-in-water (O/W) emulsion. Moreover, the droplet distribution graph that tails towards the larger droplet size with sharp distribution at the smaller droplet size region shows evidence of oil globule coalescence after the thawing process that is in contrast to droplet instability that was induced by Ostwald ripening whereby it tends to form sharp droplet distribution at the larger size region with tailing at smaller droplet size region (Aronson and Petko, 1993).
The presence of bacteria also affected droplet stability, especially for single emulsion droplet. As the PGPR surfactant remained liquid during the freezing process (Ghosh and Rousseau, 2009), it is most likely retained in the oil phase and withdrawn from the ice crystals as the aqueous phase freezes. These accelerate the coalescence process of the aqueous phase as the emulsions warmed up. However, the presence of E. coli-GFP on the interface minimizes the droplet coalescence during the thawing process as they are most likely crystallized on the interface. The E. coli-GFP was observed to have a high affinity towards the soybean oil as determined by the BATH assay (Figure S2). Changes in bacterial characteristics due to storage in freezing temperatures ease the attachment of the bacteria onto the interface making the droplet less susceptible to rupture. The stabilization effect of bacteria may be similar to emulsion stabilization due to surfactant crystallization and presence of particles on the droplet interface forming Pickering emulsion as reported previously by Ghosh and Rousseau (2009) and Zhu et al. (2017). The crystallization of glycerol monostearate (GMS) at 25°C creates a crystalline shell around the water droplet that helps in preventing crystallization damage between the adjacent water droplet and coalescence during the thawing process which is in contrast to emulsions containing molten PGPR (Ghosh and Rousseau, 2009). According to Zhu et al. (2017), the addition of heated soy and whey protein in emulsions improves droplet stability against freeze/thaw cycling due to Pickering stearic stabilization. However, further study is still required to confirm the effect of bacteria on droplet stability in freezing conditions.
3.2 The Effect of Storage on Phase Separation of Emulsions
Droplet destabilization of W/O resulted in the presence of a free water layer due to droplet coalescence while the destabilization of W1/O/W2 droplet led to the presence of a free oil layer due to the external coalescence between the inner and outer aqueous phase (forming O/W emulsion) and coalescence between large oil droplets that resulted in the presence of an oil layer on top of the sample. Figure 3 shows the percentage ratio of free water and oil measured after 24 hours of storage with respect to the total emulsion. From the results obtained it was determined that phase separation occurred for samples of both single and double emulsions kept in -20°C and -80°C with the highest amount of free water and free oil observed for samples kept at -80°C. Emulsion stability for samples stored at 25°C was maintained during the storage period as there were no observable free water or oil. However, a small percentage of free water and oil (approximately 2%) were observed for samples without E. coli-GFP at 5°C and is mainly attributed to the closely packed water droplet during storage and the absence of E. coli-GFP that helps in improving droplet stability. Overall comparison between samples with or without the presence of E. coli-GFP shows that phase separation was minimized with the presence of E. coli-GFP.
Droplet destabilization occurred for W/O emulsions kept at -20°C and -80°C due to partial coalescence of the droplet as the crystallization of the dispersed phase resulted in film rupture that connects neighbouring droplet leading to complete coalescence upon thawing (Boode, Walstra and de Groot-Mostert, 1993; Vanapalli, Palanuwech and Coupland, 2002). This eventually leads to bulk water separation that is minimized with the presence of E. coli-GFP in the inner W1 phase. During the consecutive crystallization of the oil phase, the dispersed ice crystals were forced to the still-liquid region of the oil phase and further reduction in temperature lead to the withdrawal of crystallized oil from this region. Combination of these processes leads to complete droplet coalescence and extensive aqueous phase separation from the emulsion during the thawing process (Degner et al., 2013, 2014). The partially crystallized oil phase of samples stored in -20°C prevented the complete withdrawal of the oil phase as some region within the emulsion may contain liquid oil thus minimizes extensive droplet coalescence.
The direct destabilization process of the double emulsion droplet that occurs immediately upon the thawing process leads to oil phase separation and the external coalescence of the inner W1 phase and W2 phase. As shown in Figure 2 g, the movement of liquid oil through the cracks of the outer aqueous phase during the thawing process immediately separates the oil and aqueous phase forming bulk oil layer due to coalescence of bigger oil droplets while some oil droplets remain in a layer of O/W emulsion. The unfrozen W1 phase will remain in the W2 phase and eventually be infused into the W2 phase as it melts (Figure 2 h). This process leads to the complete release of the W1 phase into the W2 phase and extensive separation of the oil phase from the emulsion. Complete W1/O/W2 emulsion destabilization due to external coalescence during the thawing phase of the oil layer was also reported previously by Rojas and Papadopoulos (2007) whereby it leads to the complete release of the W1 phase into the W2 phase forming O/W emulsions.
The presence of crystallized surfactants and Pickering particles has been reported to improve droplet stability as it minimizes droplet coalescence during the thawing process by creating a protective layer that prevents droplet fusion (Ghosh and Coupland, 2008; Marefati et al., 2013; Zhu et al., 2017). A similar stabilization effect may occur with the presence of E. coli-GFP on the interfacial layer. Under the freezing condition, E. coli-GFP undergo changes in membrane conformation and cell shrinkage (Souzu, 1980) making it easily embedded in the interfacial layer. Previous study reported the presence of E. coli-GFP in single W/O emulsions droplet helps in maintaining the stability of the droplet during five days of storage at 25°C whereby the presence of E. coli-GFP particularly dead cells helps in reducing interfacial tension due to its attachment on the interfacial layer (Mohd Isa et al., 2022). The bacterial affinity towards the interface is due to its hydrophobic nature as the dead E. coli-GFP cells exhibit higher affinity towards the oil phase as compared to live cells. BATH assay of E. coli-GFP with soybean oil reveals its affinity towards the oil phase (Figure S2) thus, may help in reducing the interfacial tension and creates a protective barrier that prevents extensive droplet coalescence during the thawing process. Moreover, the presence of bacteria in the W2 phase due to its release as the W1/O/W2 emulsion destabilizes may help in preventing coalescence between the oil droplet as reported previously by Firoozmand and Rousseau (2016) whereby the presence of bacterial cells in the aqueous phase of the O/W emulsions improves droplet stability due to the attachment of bacterial cells onto the oil droplet that creates a boundary layer thus protecting the droplet against coalescence and phase separation.
3.3. Thermal Properties of Emulsions by Differential Scanning Calorimetry (DSC).
The thermal properties of the bulk aqueous solution (Figure 4) were characterised as opposed to emulsified samples of single and double emulsions in soybean oil (Figure 5). The crystallization temperature of the samples was determined from the onset temperature of the crystallization peaks in which the temperature was recorded at the beginning of the crystallite formation. The onset temperature was determined by using the Star e software (Mettler Toledo, Mettler Scientific Instruments, Germany). Referring to the crystallization peaks in Figure 4 a, it was determined that the crystallization of E. coli-GFP suspension in DIW occurred at a lower temperature as compared to pure DIW. The pure DIW crystallizes at -12°C and melted at 0°C which is around the same temperature as reported previously in several studies (Cramp et al., 2004; Clausse et al., 2005; Ghosh and Rousseau, 2009b). For the E. coli-GFP suspension, the crystallization temperature was recorded at -17°C while the melting of the E. coli-GFP suspension occurred around the same temperature as the pure DIW. The reduction in the crystallization temperature with the presence of E. coli-GFP is due to the freezing point depression whereby the presence of E. coli-GFP as solute tend to lower the freezing point.
Figure 5 shows that the emulsified samples freeze at a much lower temperature compared to bulk solutions. A broader crystallization curve was observed for samples of W/O emulsions as compared to W1/O/W2 emulsions. This is mostly attributed to the presence of a large percentage of oil in the continuous phase as compared the aqueous phase for W/O emulsion. The presence of long chains of lipids together with a mixture of other molecules in soybean oil resulted in a broader crystallization temperature as opposed to pure water making it difficult to determine the exact freezing point of the soybean oil. It has been reported that pure soybean oil crystallizes at approximately -10°C to -20°C whereby it is most likely to solidify below these temperatures while soybean oil emulsions solidify at a much lower temperature than the pure oil (Harada and Yokomizo, 2000; Ishibashi, Hondoh and Ueno, 2016). In this study, the single W/O emulsion crystallizes at -20°C for samples without E. coli-GFP while samples with E. coli-GFP crystallize at -28°C. The melting point of both of the emulsions was around 0°C. The difference in crystallization temperature is mainly attributed to the destabilization of emulsions without E. coli-GFP whereby the presence of free water due to phase separation increases the crystallization temperature of the samples. In addition, the similar melting point of the emulsions with that of bulk solutions also indicates the loss in emulsion stability due to an increase in the percentage of free water during the thawing process (Chen and He, 2003; Clausse et al., 2005). It has been reported previously that the W/O emulsions solidify at a lower temperature than that of bulk water as it overcomes the free energy barrier due to homogeneous nucleation (Vanapalli, Palanuwech and Coupland, 2002). Water droplet in emulsions solidifies at a lower temperature than the temperature required to solidify bulk water (-20 °C) and are much lower than the equilibrium melting point of water of 0 °C (Lin et al., 2007).
For double W1/O/W2 emulsions, a small difference in crystallization temperature was observed between samples with or without E. coli-GFP as samples containing E. coli-GFP crystallise at -21°C while samples without E. coli-GFP crystallizes at -23°C. Only one peak was observed which gives the crystallization peak of the W2 phase as opposed to 2 peaks reported by Kovács et al. (2005). The absence of the second peak indicates the loss of the inner W1 phase due to emulsion breakdown (Kovács et al., 2005; Schuch, Köhler and Schuchmann, 2013). However, this may not be the case in this study as the inner W1 droplet were intact during the freezing process as observed in Figure 3 f and the loss of inner W1 phase occurred during the thawing/melting process which explains the presence of only one peak for the melting curve with a melting temperature of approximately 0°C for all samples. Schuch, Köhler and Schuchmann (2013) also described that it is possible to distinguish between the inner W1 phase and the outer W2 phase from the cooling curves due to the presence of two peaks that resulted from the difference in crystallization temperature but it is impossible to distinguish between these two phases from the melting curves of the W1/O/W2. Another possible explanation for the presence of only one cooling curve is due to the highly monodispersed distribution of the droplet that was prepared by using the microfluidic method with single and large size of the W1 inner core and a thin oil layer separating the W1 phase from the W2 phase. A combination of these factors may have caused the outer W2 phase and the inner W1 phase to crystallize simultaneously within the same temperature range. Schuch, Köhler and Schuchmann (2013) previously reported that the crystallization of emulsion droplet may depend on the size of the droplet. However, further studies are still required in order to understand the effect of droplet size distribution on the crystallization temperature of the multiple emulsion.
3.4 Bacterial Viability During Storage
Referring to Figure 6, a large reduction in E. coli-GFP cell count was observed for samples kept at -20°C and -80°C as compared to samples kept in 25°C and 5°C whereby comparing between non-encapsulated samples, 1.2 log CFU/mL and 1.3 log CFU/mL reduction in viable cell count was observed for samples kept in 25°C and 5°C respectively while 2.3 log CFU/mL and 2.7 log CFU/mL of reduction was observed for samples kept in -20°C and -80°C respectively. E. coli-GFP encapsulated in W/O droplet shows a smaller percentage of bacterial reduction as compared to samples encapsulated in W1/O/W2 droplet and control samples of free E. coli-GFP cells in sterilised DIW.
It has been reported previously that freeze-thawing may cause detrimental effects on bacterial cells that lead to a reduction in bacterial viability (Souzu, 1980, 1989; Souzu, Sato and Kojima, 1989; Strocchi et al., 2006). Cell damage during the freeze-thaw process occurred due to various physico-chemical reactions (Simonin et al., 2015; Wang et al., 2019). Some of the factors responsible for cell damage during storage at low temperatures are the nature of the cells (O’Brien et al., 2016; Wang et al., 2019), whereby different bacterial species exhibit different resistance to cell damage depending on cell conformation. Furthermore, the use of cryoprotectant with various formulations (Wang et al., 2019) and the freeze-thawing conditions (Fonseca, Béal and Corrieu, 2002; Powell-Palm et al., 2018) of the samples may also affect the degree of cell damage during storage.
The effect of water crystallization is one of the most common factors responsible for cell damage (Souzu, 1980; Mazur, 2017; Powell-Palm et al., 2018). The detrimental effect of water-crystallization on bacterial viability depended on the freezing rate whereby the decrease in bacterial viability is minimized at a low-freezing rate as compared to high-freezing rate. This is due to the cryoconcentration effect as the crystallization of the external medium resulted in cell dehydration thus preventing the lethal intracellular crystallization. The crystallization of the extracellular medium forces the cells to be concentrated in the unfrozen region of the medium whereby a continuous decrease in temperature caused the region to be increasingly concentrated. This leads to cell dehydration as the cells were exposed to a highly concentrated solution during the freezing process. Meanwhile, the rapid freezing of bacterial suspension resulted in extensive supercooling that crystallizes intracellular water as it is not able to flow out of the cells fast enough causing extensive cell damage (Simonin et al., 2015). These indicate that the degree of cell damage during the freezing process depended on the availability of intra- and extracellular water. Referring to the DSC thermograms (Figure 5), the broader crystallization temperature of the emulsion as compared to the bulk bacterial solution (Figure 4) indicates that the encapsulation of bacteria in emulsion droplet promotes slow freezing of and thus minimizes cell damage during the freezing process. Encapsulation in W/O emulsion droplet shows a smaller reduction in cell count as compared to samples encapsulated in W1/O/W2 emulsion droplet and free cells in DIW due to the thick oil layer and the low water ratio that minimizes cells damage due to water crystallization.
The effect of encapsulation in improving bacterial viability during the freeze-thaw process has also been reported previously (Goderska and Czarnecki, 2008; Priya, Vijayalakshmi and Raichur, 2011; Dianawati, Mishra and Shah, 2013). The microencapsulation of Lactobacillus acidophilus in the self-assembled polyelectrolyte layers of chitosan and carboxymethyl cellulose has been reported to protect bacteria not only from the adverse effect of simulated GI tract but also during the freeze and freeze-drying processes (Priya, Vijayalakshmi and Raichur, 2011). Furthermore, the microencapsulation of Bifidobacterium longum in milk proteins and sugar alcohols aids in improving the protection effect of cryoprotectants such as glycerol resulting in better bacterial viability and function after the freeze and freeze-drying processes (Dianawati, Mishra and Shah, 2013). Moreover, the freezing of emulsion based products such as milk has also been reported to cause small changes in the viability of bacteria indicating the ability of the emulsion structure in protecting bacteria against extensive cell damage. A study done by Sánchez et al. (2003) shows that the freezing of goat milk at -20°C or even after extended storage at -80°C does not significantly affect the viability of E. coli as opposed to cow milk due to differences in milk composition. A similar result was also reported by Nurliyani, Suranindyah and Pretiwi (2015) whereby the frozen storage of Ettawah Crossed bred goats milk samples for 60 days does not cause changes in the total bacteria while changes in emulsion stability were observed after 30 days of storage. Therefore, the encapsulation of bacteria in emulsion droplet especially W/O may help in improving bacterial viability during the freezing process due to the protective effect of the emulsion structure as it reduces available water ratio and prevents the lethal crystallization effect of the water phase.
3.5. The Release of Bacteria from Double Emulsions
Although the storage of samples under freezing temperature leads to the unfavourable phase separation, the immediate destabilization of W1/O/W2 emulsion triggered by the thawing process may be beneficial for the controlled release of bacteria for various applications. A high encapsulation efficiency of approximately 99% was achieved by using microfluidic for bacteria encapsulation in W1/O/W2 that indicating successful encapsulation of bacteria prior to cold storage. The increase in cell counts of the W2 phase, therefore, resulted from the release of bacteria from the W1 phase due to emulsion destabilization process during storage as presented in Table 2. Complete bacterial release into the W2 phase was observed for samples kept in freezing temperatures of -20°C and -80°C with 5.10 log CFU/mL of viable bacteria were observed in the W2 phase from the overall viable cell of 5.19 log CFU/mL (for samples kept at -20°C) and 4.90 log CFU/mL of viable bacteria were observed in the W2 phase from the overall viable cell of 4.93 log CFU/mL (for samples kept at -80°C). Only 2.75 log CFU/mL of cells were released into the W2 phase from the overall viable cell of 6.42 log CFU/mL for samples kept in 25°C and 2.77 log CFU/mL of cells were released from the overall viable cells of 6.18 log CFU/mL at 5°C. The release of bacteria for samples kept in 25°C and 5°C was mainly attributed to the rupture of the thin film that separates the W1 phase from the W2 phase, induced by the change in the osmotic balance of the droplet due to the production of bacterial by-products during the storage period. On the other hand, the complete destabilization of the W1/O/W2 emulsion droplet that was kept in frozen temperature is due to the freeze-thawing process that leads to phase separation. This process resulted in the complete release of the encapsulated bacteria as the emulsion destabilizes into a layer of the bulk oil phase (top), O/W emulsion (middle) and the aqueous phase (bottom) containing the released bacteria.
As the inner W1 phase remains intact during the freezing process (Figure 2 f), the frozen W1/O/W2 may serve as an alternative for bacterial microencapsulation whereby the controlled release of the encapsulated bacteria at the desired time can be achieved by simply thawing the frozen emulsion samples causing immediate and complete release of the bacteria into the W2 phase. Emulsion destabilization induced by the freeze-thawing process has been used extensively in various applications such as in emulsion liquid membrane (ELM) processing (Hirai, Hodono and Komasawa, 2000; Hirai et al., 2002) and waste emulsion treatment such as in oil sludge demulsification (He and Chen, 2002; Chen and He, 2003). Its application in pharmaceuticals have also been discussed previously by Bernal-Chávez et al. (2023). Moreover, a study by Rojas and Papadopoulos (2007) also revealed the potential application of W1/O/W2 emulsion droplet for the controlled release of encapsulated materials that is triggered by the thawing of the oil phase. Similar to the results obtained in this study, the internal coalescence of the inner W1 phase and the external coalescence of the outer W2 phase were not observed during the freezing stage but occurred extensively during the thawing of the oil phase which leads to complete release of the encapsulated material (Figure 7). This study was then followed by a study on its potential application for the controlled release of protein from the bulk emulsion systems (Rojas et al., 2008). As expected, similar results were also obtained in the bulk emulsion systems whereby the stability of the droplet was maintained during the freezing process while the thawing of the oil phase leads to an instant release of the encapsulated protein.
4. Conclusions
This study revealed the feasibility of using emulsion droplet for bacterial encapsulation and storage not only in ambient but also in cold temperatures. The study provides a better understanding of the stability of emulsions with the presence of bacteria in cold temperatures and showed the benefits of encapsulation in maintaining the viability of the bacteria by providing protection against the lethal effect of the freezing process. These characteristics are beneficial for the production of emulsions containing bacteria for laboratory-based and industrial applications. In addition, it also displayed the potential use of the freeze-thaw technique for the controlled release of not only bacteria but also applicable to other applications that used temperature-sensitive compounds such as in drug delivery.
Nevertheless, further studies are still required in order to compare the freeze-thaw mechanism of highly monodispersed W1/O/W2 droplet containing single W1 inner phase with a droplet containing multiple W1 inner phases as it may exhibit different mechanism as observed in the absence of a second peak in the cooling curves of the double emulsion droplet. In addition, further studies are also required in order to investigate the process behind the ability of bacterial cells in maintaining droplet stability during cold temperature storage and also to improve bacterial stability during the freezing process especially for samples encapsulated in double W1/O/W2 droplet.
Author Contributions
Conceptualization, Nur Suaidah Mohd Isa; Formal analysis, Nur Suaidah Mohd Isa; Investigation, Nur Suaidah Mohd Isa; Methodology, Nur Suaidah Mohd Isa, Hani El Kadri, Daniele Vigolo and Konstantinos Gkatzionis; Project administration, Daniele Vigolo and Konstantinos Gkatzionis; Resources, Daniele Vigolo and Konstantinos Gkatzionis; Supervision, Daniele Vigolo and Konstantinos Gkatzionis; Validation, Hani El Kadri and Daniele Vigolo; Visualization, Hani El Kadri and Nur Farra Adlina Mohamed Zakhari; Writing – original draft, Nur Suaidah Mohd Isa and Hani El Kadri; Writing – review & editing, Daniele Vigolo, Nur Farra Adlina Mohamed Zakhari and Konstantinos Gkatzionis.
Acknowledgments
Authors acknowledge the Ministry of Higher Education (MOHE) for funding under the Fundamental Research Grant Scheme (FRGS/1/2022/STG04/UMT/03/1).
References
- Aronson, M. P. and Petko, M. F. (1993) ‘Highly Concentrated Water-in-Oil Emulsions: Influence of Electrolyte on Their Properties and Stability’, Journal of Colloid and Interface Science, Academic Press, 159(1), pp. 134–149. [CrossRef]
- Aronson, M. P. et al. (1994) ‘Origins of freeze-thaw instability in concentrated water-in-oil emulsions’, Colloids and Surfaces A: Physicochemical and Engineering Aspects, 85(2–3), pp. 199–210. [CrossRef]
- Bauer, W.A.C. et al. (2010) ‘Hydrophilic PDMS Microchannels for High-throughput Formation of Oil-In-Water Microdroplets and Water-In-Oil-Water Double Emulsions’, Lab Chip, 2010, 10 , 1814 —1819. [CrossRef]
- Bernal-Chávez, S.A. et al. (2023) ‘Enhancing chemical and physical stability of pharmaceuticals using freeze-thaw method: challenges and opportunities for process optimization through quality by design approach’, Journal of Biological Engineering, 17 (35), pp.1-18. [CrossRef]
- Boode, K., Walstra, P. and de Groot-Mostert, A. E. A. (1993) ‘Partial coalescence in oil-in-water emulsions 2. Influence of the properties of the fat’, Colloids and Surfaces A: Physicochemical and Engineering Aspects, 81(C), pp. 139–151. [CrossRef]
- Chavarri, M., Maranon, I. and Carmen, M. (2012) ‘Encapsulation Technology to Protect Probiotic Bacteria’, in Rigobelo, E.C. (ed.) Probiotics. IntechOpen, pp. 502-529.
- Chen, G. and He, G. (2003) ‘Separation of water and oil from water-in-oil emulsion by freeze/thaw method’, Separation and Purification Technology, 31(1), pp. 83–89. [CrossRef]
- Clausse, D. et al. (2005) ‘Morphology characterization of emulsions by differential scanning calorimetry’, Advances in Colloid and Interface Science, 117(1–3), pp. 59–74. [CrossRef]
- Cramp, G. L. et al. (2004) ‘On the stability of oil-in-water emulsions to freezing’, Food Hydrocolloids, 18(6), pp. 899–905. [CrossRef]
- Cramp, G. L. et al. (2004) ‘On the stability of oil-in-water emulsions to freezing’, Food Hydrocolloids, 18(6), pp. 899–905.
- Degner, B. M. et al. (2013) ‘Influence of freezing rate variation on the microstructure and physicochemical properties of food emulsions’, Journal of Food Engineering. Elsevier Ltd, 119(2), pp. 244–253. [CrossRef]
- Degner, B. M. et al. (2014) ‘Factors influencing the freeze-thaw stability of emulsion-based foods’, Comprehensive Reviews in Food Science and Food Safety, 13(2), pp. 98–113. [CrossRef]
- Devanthi, P. V. P. et al. (2018) ‘Water-in-oil-in-water double emulsion for the delivery of starter cultures in reduced-salt moromi fermentation of soy sauce’, Food Chemistry. Elsevier, 257(March), pp. 243–251. [CrossRef]
- Dianawati, D., Mishra, V. and Shah, N. P. (2013) ‘Survival of Bifidobacterium longum 1941 microencapsulated with proteins and sugars after freezing and freeze-drying’, Food Research International. Elsevier Ltd, 51(2), pp. 503-509. [CrossRef]
- Dluska, E. et al. (2017) ‘Drug-Core Double Emulsions for Co-release of Active Ingredients’, International Journal of Chemical Engineering and Applications, 7(6), pp. 428–432. [CrossRef]
- El Kadri, H. et al. (2015) ‘Understanding and controlling the release mechanism of Escherichia coli in double W1/O/W2 emulsion globules in the presence of NaCl in the W 2 phase’, RSC Adv., 5(127), pp. 105098–105110.
- Farias, T. G. S. de et al. (2019) ‘Viabilities of Lactobacillus rhamnosus ASCC 290 and Lactobacillus casei ATCC 334 (in free form or encapsulated with calcium alginate-chitosan) in yellow mombin ice cream’, Lwt. Elsevier, 100(October 2018), pp. 391–396.
- Firoozmand, H. and Rousseau, D. (2016) ‘Microbial cells as colloidal particles : Pickering oil-in-water emulsions stabilized by bacteria and yeast’, FRIN. Elsevier B.V., 81, pp. 66–73. [CrossRef]
- Fonseca, F., Béal, C. and Corrieu, G. (2002) ‘Operating conditions that affect the resistance of lactic acid bacteria to freezing and frozen storage’, Cryobiology, 43(3), pp. 189–198. [CrossRef]
- Ghosh, S. and Coupland, J. N. (2008) ‘Factors affecting the freeze-thaw stability of emulsions’, Food Hydrocolloids, 22(1), pp. 105–111. [CrossRef]
- Ghosh, S. and Rousseau, D. (2009) ‘Freeze-thaw stability of water-in-oil emulsions’, Journal of Colloid and Interface Science. Elsevier Inc., 339(1), pp. 91–102.
- Goderska, K. and Czarnecki, Z. (2008) ‘Influence of microencapsulation and spray drying on the viability of Lactobacillus and Bifidobacterium strains’, Polish Journal of Microbiology, 57(2), pp. 135–140.
- Guan, X. et al. (2023) ‘Temperature-responsive Pickering double emulsions stabilized by binary microgels’ Chemistry- An Asian Journal, 18 (19), e202300587. [CrossRef]
- Harada, T. and Yokomizo, K. (2000) ‘Demulsification of oil-in-water emulsion under freezing conditions: Effect of crystal structure modifier’, Journal of the American Oil Chemists’ Society, 77(8), pp. 859–864. [CrossRef]
- He, G. and Chen, G. (2002) ‘Lubricating oil sludge and its demulsification’, Drying Technology, 20(4–5), pp. 1009–1018. [CrossRef]
- Hirai, T. et al. (2002) ‘Biomimetic Synthesis of Calcium Carbonate Particles in a Pseudovesicular Double Emulsion’, Langmuir, 13(25), pp. 6650–6653. [CrossRef]
- Hirai, T., Hodono, M. and Komasawa, I. (2000) ‘Preparation of spherical calcium phosphate fine particles using an emulsion liquid membrane system’, Langmuir, 16(3), pp. 955–960. [CrossRef]
- Ishibashi, C., Hondoh, H. and Ueno, S. (2016) ‘Influence of morphology and polymorphic transformation of fat crystals on the freeze-thaw stability of mayonnaise-type oil-in-water emulsions’, Food Research International. Elsevier Ltd, 89, pp. 604–613. [CrossRef]
- Kim, P. et al. (2008) ‘Soft lithography for microfluidics: A review’, Biochip J, 2, pp. 1–11.
- Kovács, A. et al. (2005) ‘Structural analysis of W/O/W multiple emulsions by means of DSC’, Journal of Thermal Analysis and Calorimetry, 82(2), pp. 491–497. [CrossRef]
- Li, J., Mcclements, D. J. and Mclandsborough, L. A. (2001) ‘Interaction between Emulsion Droplet and Escherichia coli Cells’, Journal of Food Science, 66(4), pp. 570–657. [CrossRef]
- Lin, C. et al. (2007) ‘Freeze/thaw induced demulsification of water-in-oil emulsions with loosely packed droplet’, Separation and Purification Technology, 56(2), pp. 175–183. [CrossRef]
- Magdassi, S. and Garti, N. (1987) ‘Formation of water/oil/water multiple emulsions with solid oil phase’, Journal of Colloid and Interface Science, 120(2), pp. 537–539. [CrossRef]
- Marefati, A. et al. (2013) ‘Freezing and freeze-drying of Pickering emulsions stabilized by starch granules’, Colloids and Surfaces A: Physicochemical and Engineering Aspects. Elsevier B.V., 436, pp. 512–520. [CrossRef]
- Mazur, P. (2017) ‘Freezing of living cells: mechanisms and implications’, American Journal of Physiology-Cell Physiology, 247(3), pp. C125–C142. [CrossRef]
- Mezzenga, R., Folmer, B. M. and Hughes, E. (2004) ‘Design of double emulsions by osmotic pressure tailoring’, Langmuir, 20(9), pp. 3574–3582. [CrossRef]
- Miles, B. Y. A. A. and Misra, S. S. (1931) ‘The estimation of the bactericidal power of the blood’, Department of Pathology, British Postgraduate Medical School, pp. 732–749.
- Mohd Isa, N.S. et al. (2021) 'Optimisation of bacterial release from a stable microfluidic-generated water-in-oil-in-water emulsion', RSC Advances, vol. 11, no. 13, pp. 7738-7749. [CrossRef]
- Mohd Isa, N.S. et al. (2022) ‘The Effect of Bacteria on the Stability of Microfluidic-Generated Water-in-Oil Droplet’ Micromachines. 2022; 13(12):2067. [CrossRef]
- Nurliyani, Suranindyah, Y. and Pretiwi, P. (2015) ‘Quality and Emulsion Stability of Milk from Ettawah Crossed Bred Goat During Frozen Storage’, Procedia Food Science. Elsevier Srl, 3, pp. 142–149. [CrossRef]
- O’Brien, K. V. et al. (2016) ‘Short communication: The effects of frozen storage on the survival of probiotic microorganisms found in traditionally and commercially manufactured kefir’, Journal of Dairy Science. Elsevier, 99(9), pp. 7043–7048. [CrossRef]
- Peng, Q. et al. (2023) ‘Effect of Emulsion Particle Size on the Encapsulation Behavior and Oxidative Stability of Spray Microencapsulated Sweet Orange Oil (Citrus aurantium var. dulcis)’, Foods, 12, 116. [CrossRef]
- Powell-Palm, M. J. et al. (2018) ‘Escherichia coli viability in an isochoric system at subfreezing temperatures’, Cryobiology. Elsevier, 85(August), pp. 17–24. [CrossRef]
- Priya, A. J., Vijayalakshmi, S. P. and Raichur, A. M. (2011) ‘Enhanced survival of probiotic Lactobacillus acidophilus by encapsulation with nanostructured polyelectrolyte layers through layer-by-layer approach’, Journal of Agricultural and Food Chemistry, 59(21), pp. 11838–11845. [CrossRef]
- Reger, D. L., Goode, S. R. and Ball, D. W. (2009) Chemistry: Principles and Practice. Cengage Learning.
- Rojas, E. C. and Papadopoulos, K. D. (2007) ‘Induction of instability in water-in-oil-in-water double emulsions by freeze-thaw cycling’, Langmuir, 23(13), pp. 6911–6917. [CrossRef]
- Rojas, E. C. et al. (2008) ‘Temperature-induced protein release from water-in-oil-in-water double emulsions’, Langmuir, 24(14), pp. 7154–7160. [CrossRef]
- Sánchez, A. et al. (2003) ‘Effect of freezing goat milk samples on recovery of intramammary bacterial pathogens’, Veterinary Microbiology, 94(1), pp. 71–77. [CrossRef]
- Schuch, A., Köhler, K. and Schuchmann, H. P. (2013) ‘Differential scanning calorimetry (DSC) in multiple W/O/W emulsions: A method to characterize the stability of inner droplet’, Journal of Thermal Analysis and Calorimetry, 111(3), pp. 1881–1890. [CrossRef]
- Simonin, H. et al. (2015) ‘Cryopreservation of Escherichia coli K12TG1: Protection from the damaging effects of supercooling by freezing’, Cryobiology. Elsevier Inc., 70(2), pp. 115–121. [CrossRef]
- Sobti, B. et al. (2023) ‘Encapsulation Properties of Mentha piperita Leaf Extracts Prepared Using an Ultrasound-Assisted Double Emulsion Method’, Foods, 12, 1838. [CrossRef]
- Souzu, H. (1980) ‘Studies on the damage to Escherichia coli cell membrane caused by different rates of freeze-thawing’, BBA - Biomembranes, 603(1), pp. 13–26. [CrossRef]
- Souzu, H. (1989) ‘Changes in chemical structure and function in Escherichia coli cell membranes caused by freeze-thawing. I. Change of lipid state in bilayer vesicles and in the original membrane fragments depending on rate of freezing’, BBA - Biomembranes, 978(1), pp. 105–111. [CrossRef]
- Souzu, H., Sato, M. and Kojima, T. (1989) ‘Changes in chemical structure and function in Escherichia coli cell membranes caused by freeze-thawing. II. Membrane lipid state and response of cells to dehydration’, BBA - Biomembranes, 978(1), pp. 112–118. [CrossRef]
- Strocchi, M. et al. (2006) ‘Low temperature-induced systems failure in Escherichia coli: Insights from rescue by cold-adapted chaperones’, Proteomics, 6(1), pp. 193–206. [CrossRef]
- he MathWorks, Inc. [internet], Find circles using circular Hough transform MATLAB imfindcircles, accessed 8 October 2022, available from https://www.mathworks.com/help/images/ref/imfindcircles.html.
- Tieko Nassu, R. and Gonçalves, L. A. G. (1999) ‘Determination of melting point of vegetable oils and fats by differential scanning calorimetry (DSC) technique’, Grasas y Aceites, 50, pp. 16–21. [CrossRef]
- Tippetts, M. and Martini, S. (2009) ‘Effect of cooling rate on lipid crystallization in oil-in-water emulsions’, Food Research International. Elsevier Ltd, 42(7), pp. 847–855. [CrossRef]
- Van Boekel, M. A. J. S. and Walstra, P. (1981) ‘Stability of oil-in-water emulsions with crystals in the disperse phase’, Colloids and Surfaces, 3(2), pp. 109–118. [CrossRef]
- Vanapalli, S. A., Palanuwech, J. and Coupland, J. N. (2002) ‘Stability of emulsions to dispersed phase crystallization: Effect of oil type, dispersed phase volume fraction, and cooling rate’, Colloids and Surfaces A: Physicochemical and Engineering Aspects, 204(1–3), pp. 227–237. [CrossRef]
- Wang, G. et al. (2019) ‘Optimal combination of multiple cryoprotectants and freezing-thawing conditions for high lactobacilli survival rate during freezing and frozen storage’, Lwt, 99, pp. 217–223. [CrossRef]
- Wang, G. et al. (2019) ‘Optimal combination of multiple cryoprotectants and freezing-thawing conditions for high lactobacilli survival rate during freezing and frozen storage’, Lwt, 99, pp. 217–223. [CrossRef]
- Wangqi Hou and Papadopoulos, K. D. (1996) ‘Stability of water-in-oil-in-water type globules’, Chemical Engineering Science, 51(22), pp. 5043–5051. [CrossRef]
- Zhang, L. et al. (2023) ‘Microbial Encapsulation and Targeted Delivery Mechanisms of Double Emulsion Loaded with Probiotics — A State-of-Art Review’, Food Reviews International. [CrossRef]
- Zhu, X. F. et al. (2017) ‘Freeze-thaw stability of Pickering emulsions stabilized by soy and whey protein particles’, Food Hydrocolloids. Elsevier Ltd, 69, pp. 173–184. [CrossRef]
Figure 1.
Figure 1. Droplets size distribution for single W/O and double W1/O/W2 emulsions at 25°C ( ), 5°C (····), -20°C (----), -80°C (- · -) before and after 24 hours of storage. Droplet size measurements were taken after the samples were allowed to reach the temperature of 25°C after the cold temperature storage.
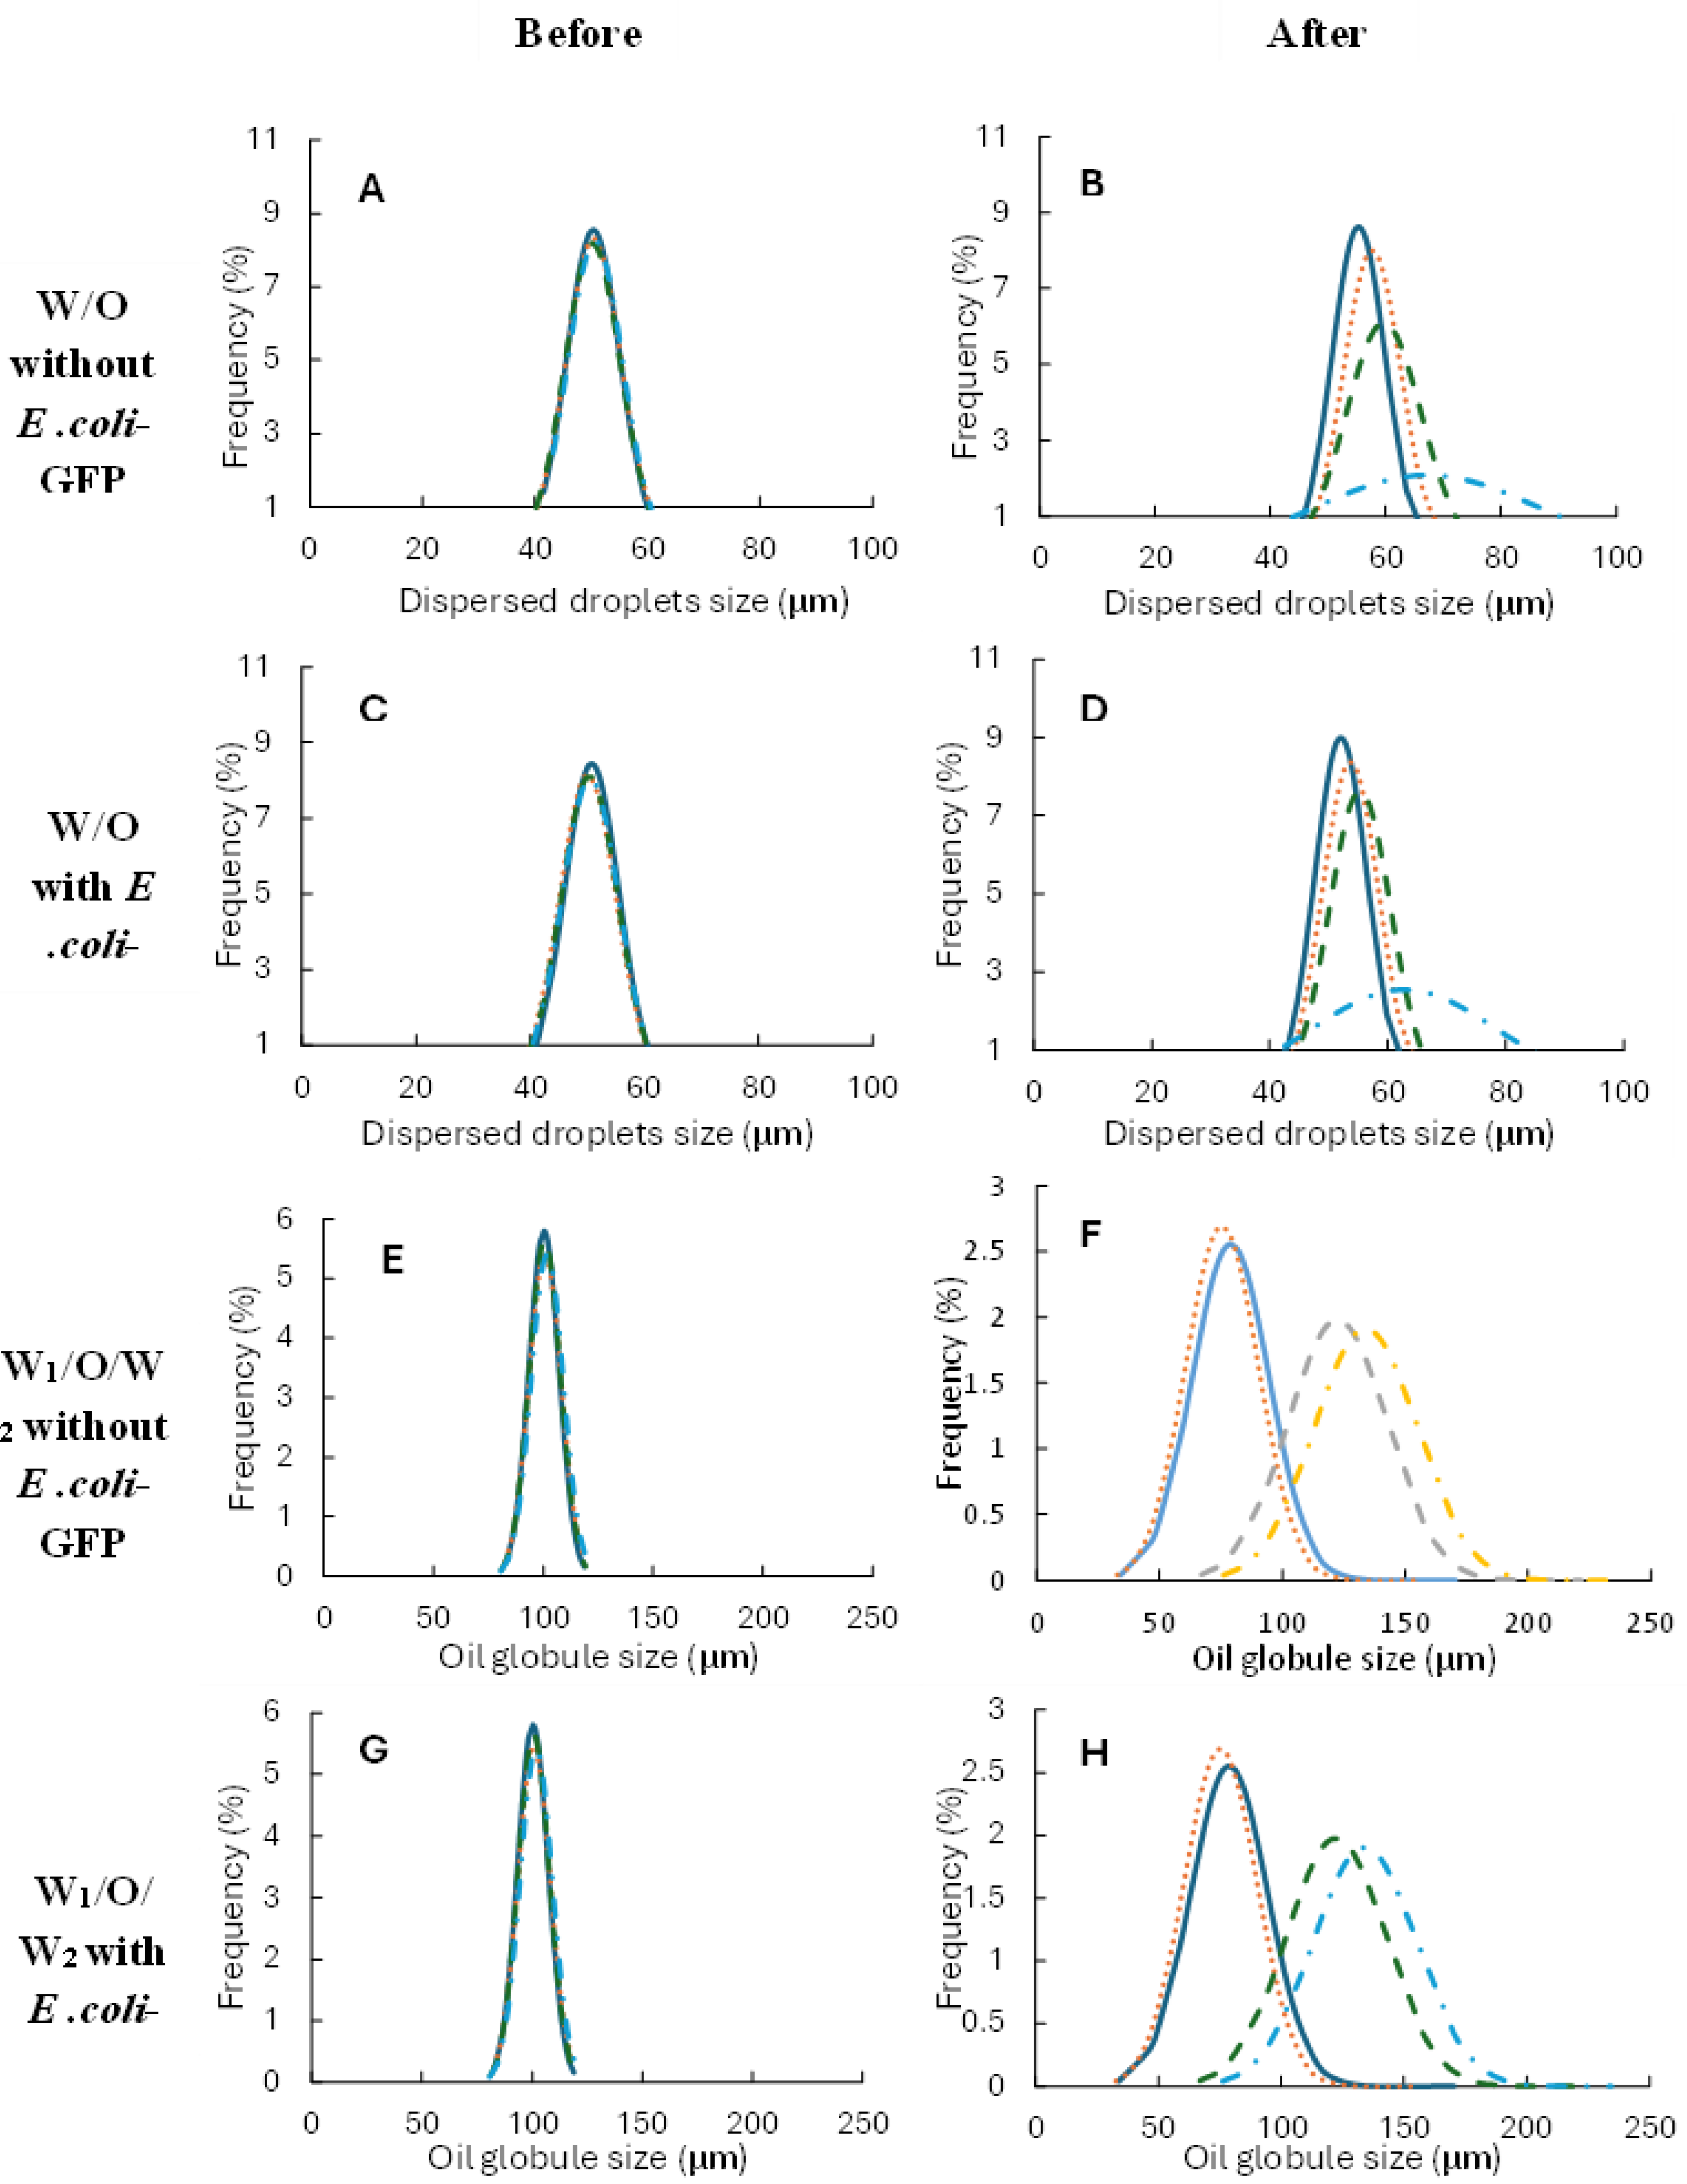
Figure 2.
Photomicrographs of W/O and W1/O/W2 emulsion droplets with change in temperature. The cooling and thawing process were conducted on the temperature- controlled microscope stage. Scale bar represents 100 µm.
Figure 2.
Photomicrographs of W/O and W1/O/W2 emulsion droplets with change in temperature. The cooling and thawing process were conducted on the temperature- controlled microscope stage. Scale bar represents 100 µm.
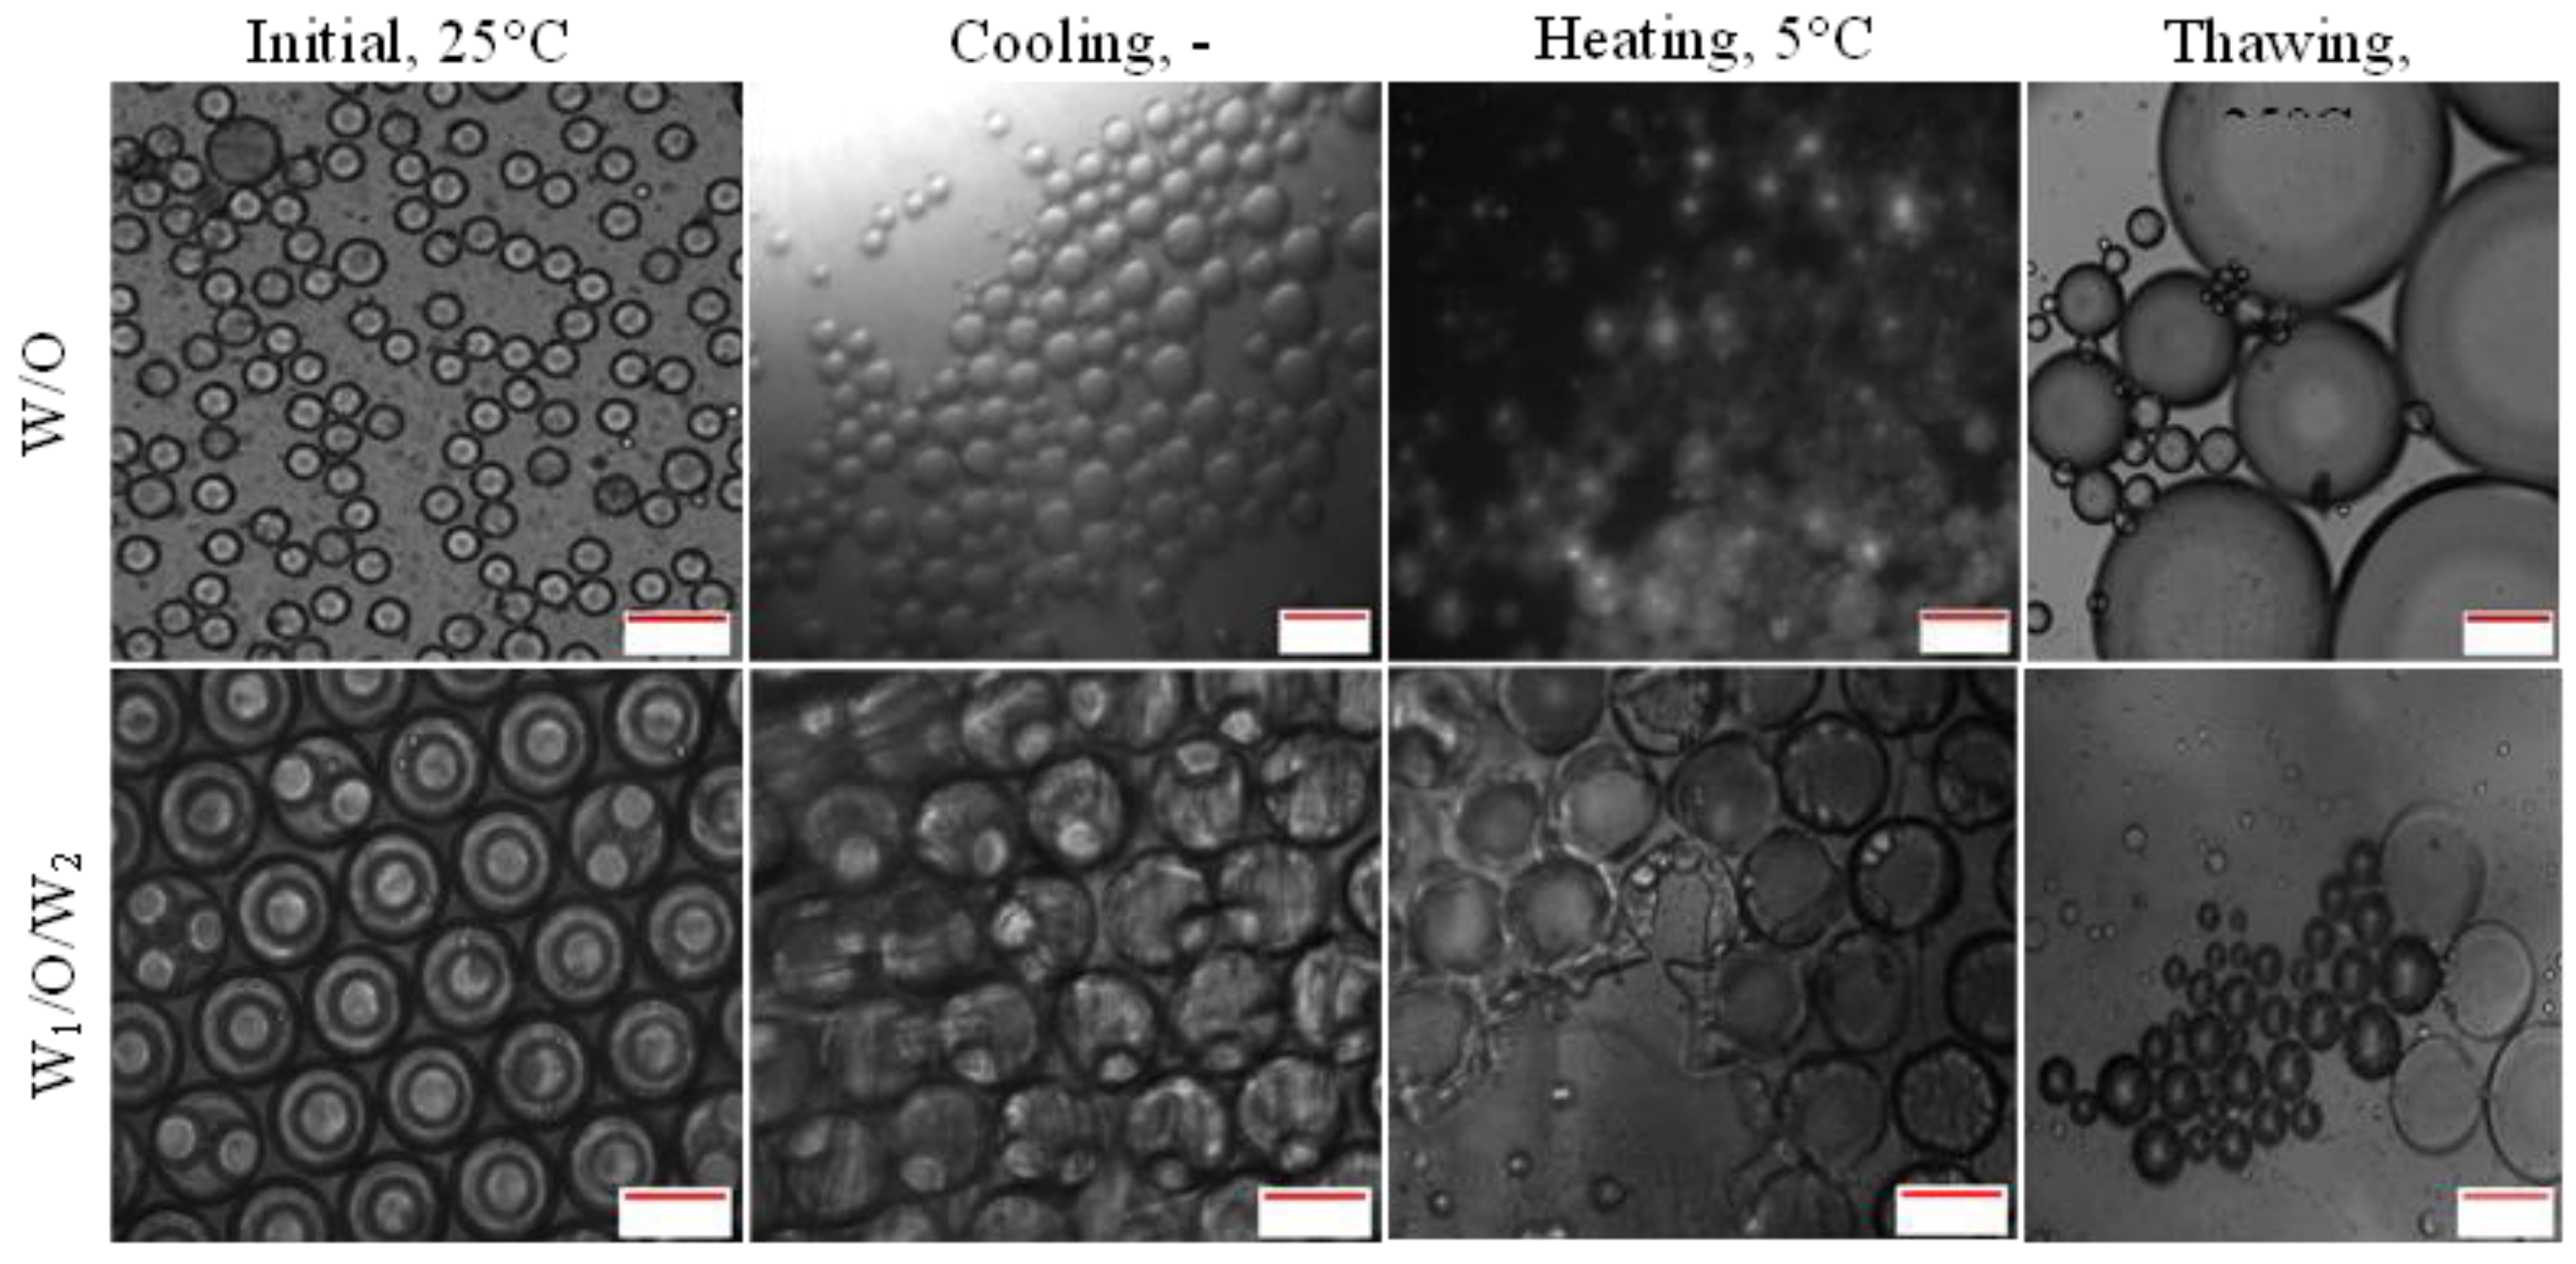
Figure 3.
The percentage of (a) free water measured for single emulsion sample and (b) free oil for double emulsion sample. The volume of free water and free oil were measured with respect to the total volume of emulsions after 24 hours of storage at different temperature. Bars represent mean ± SEM taken from 3 independent experiments.
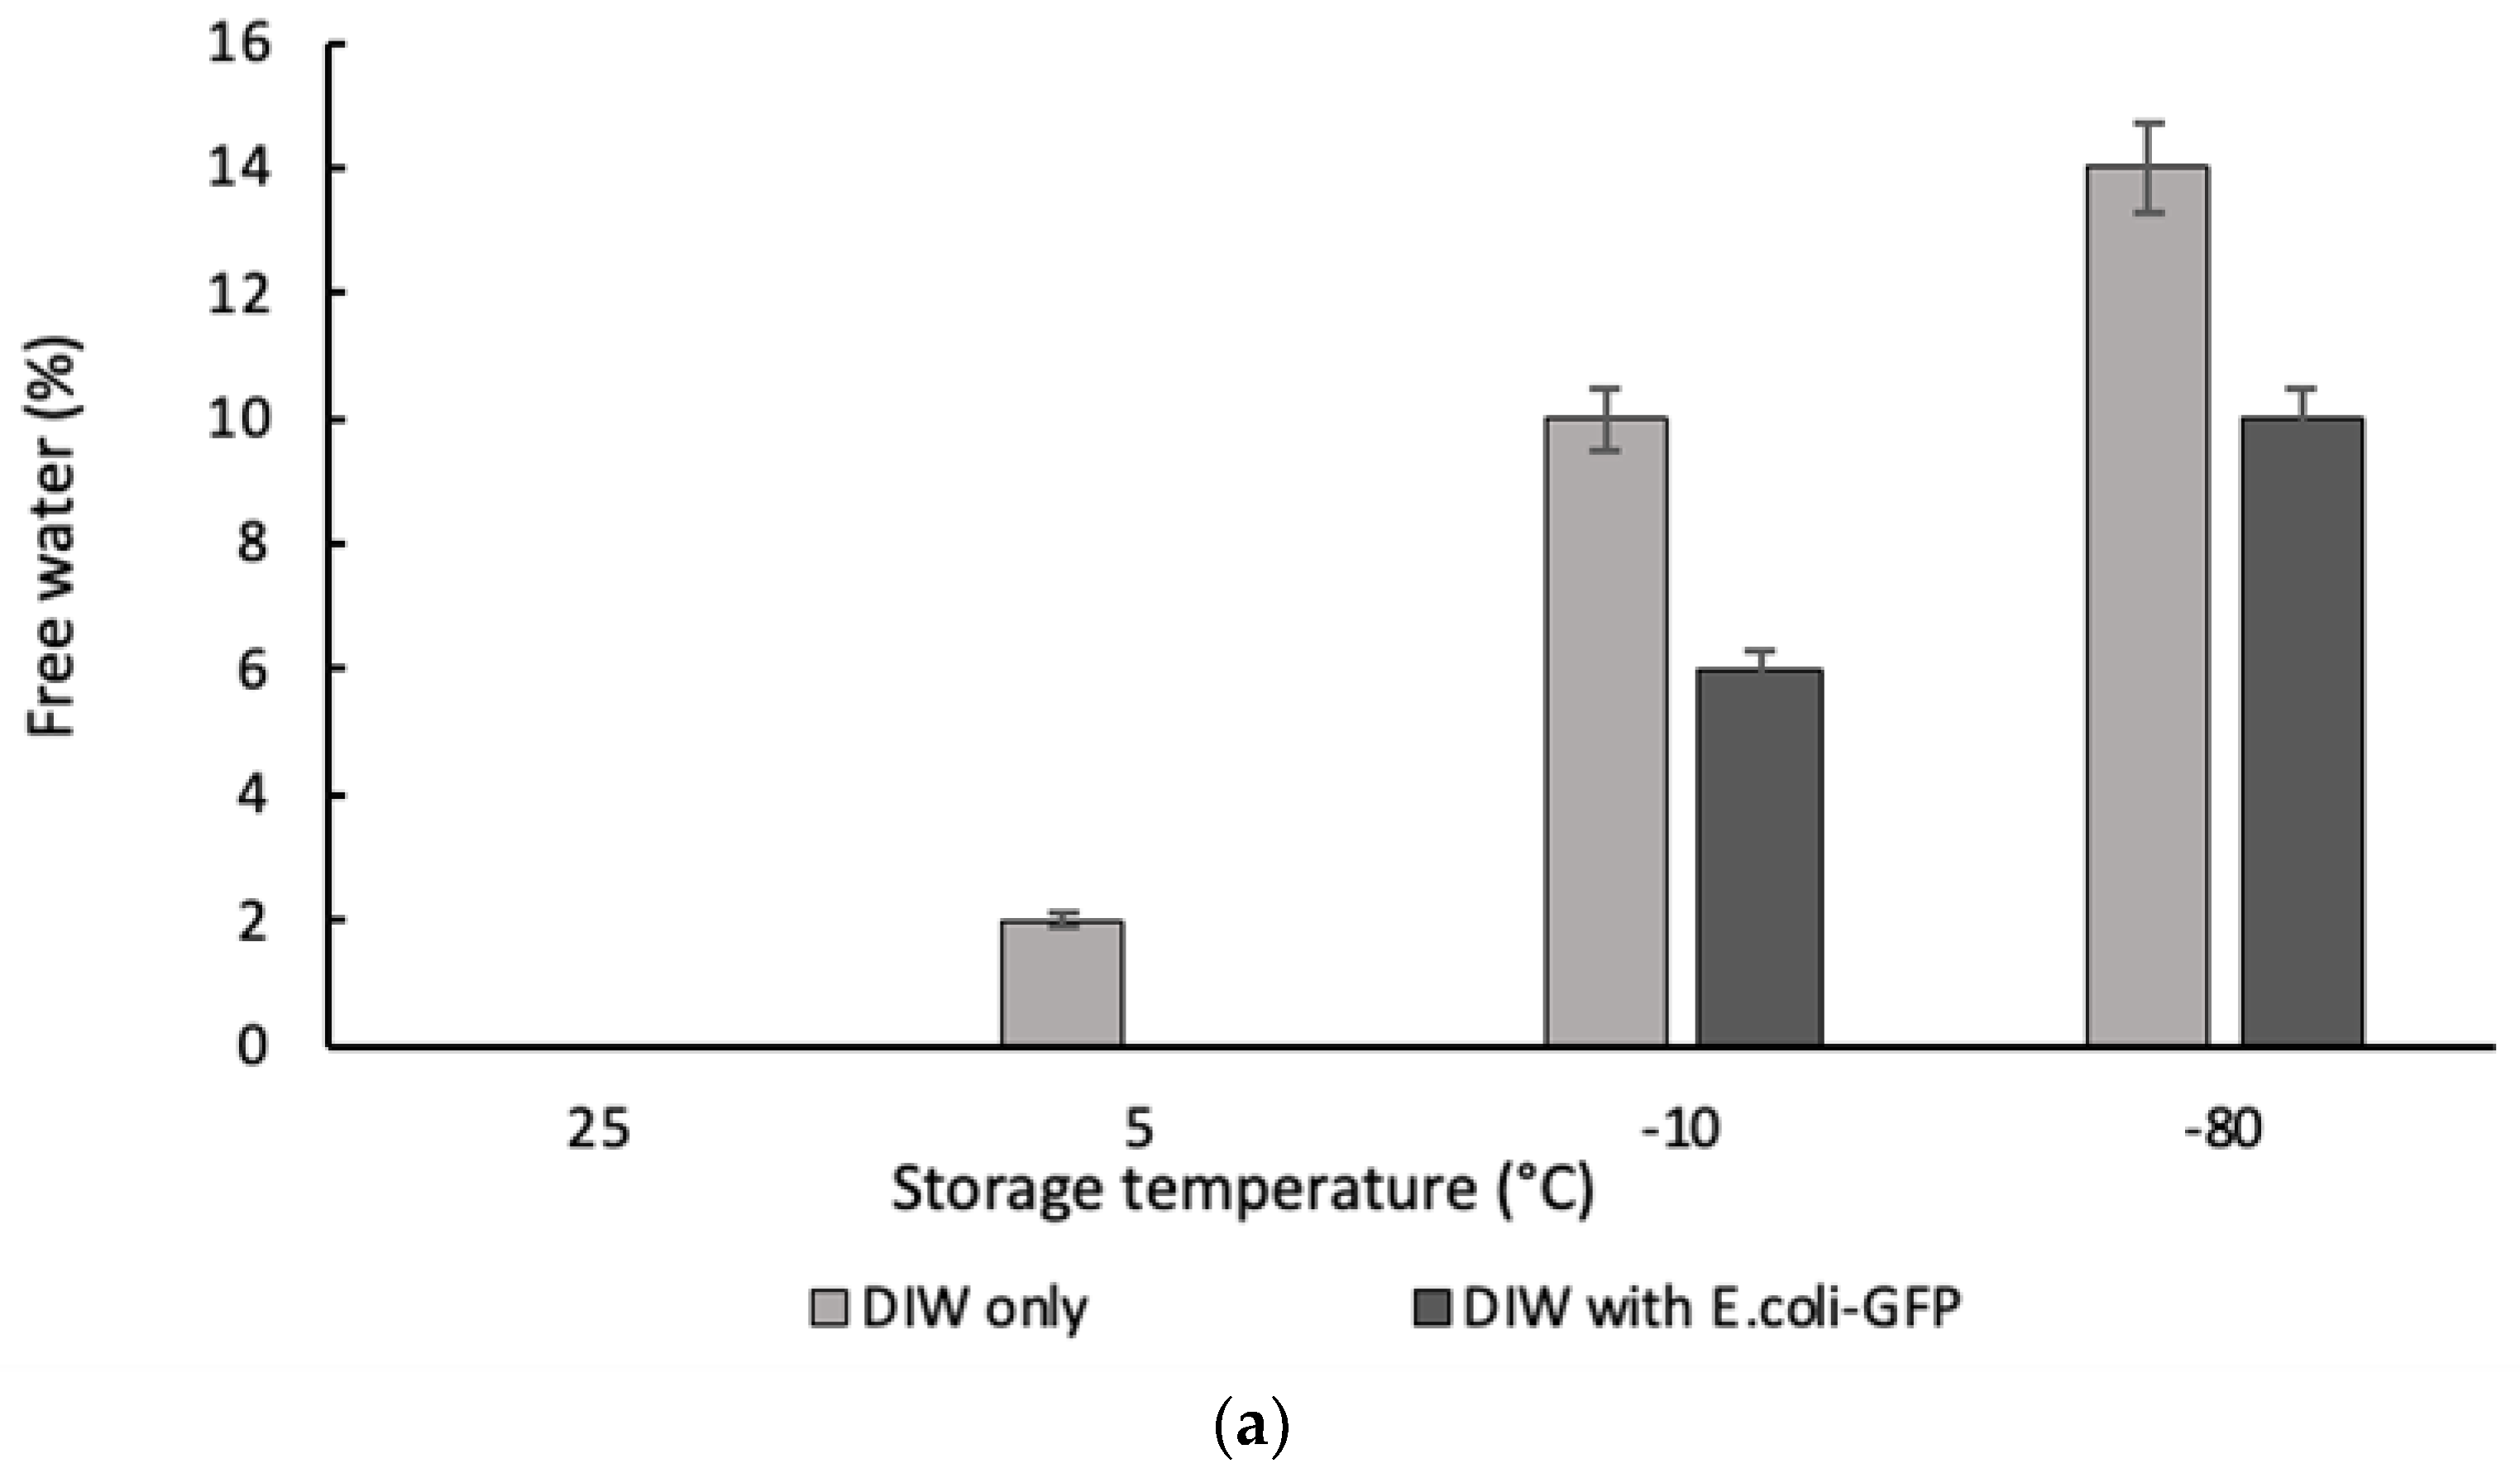
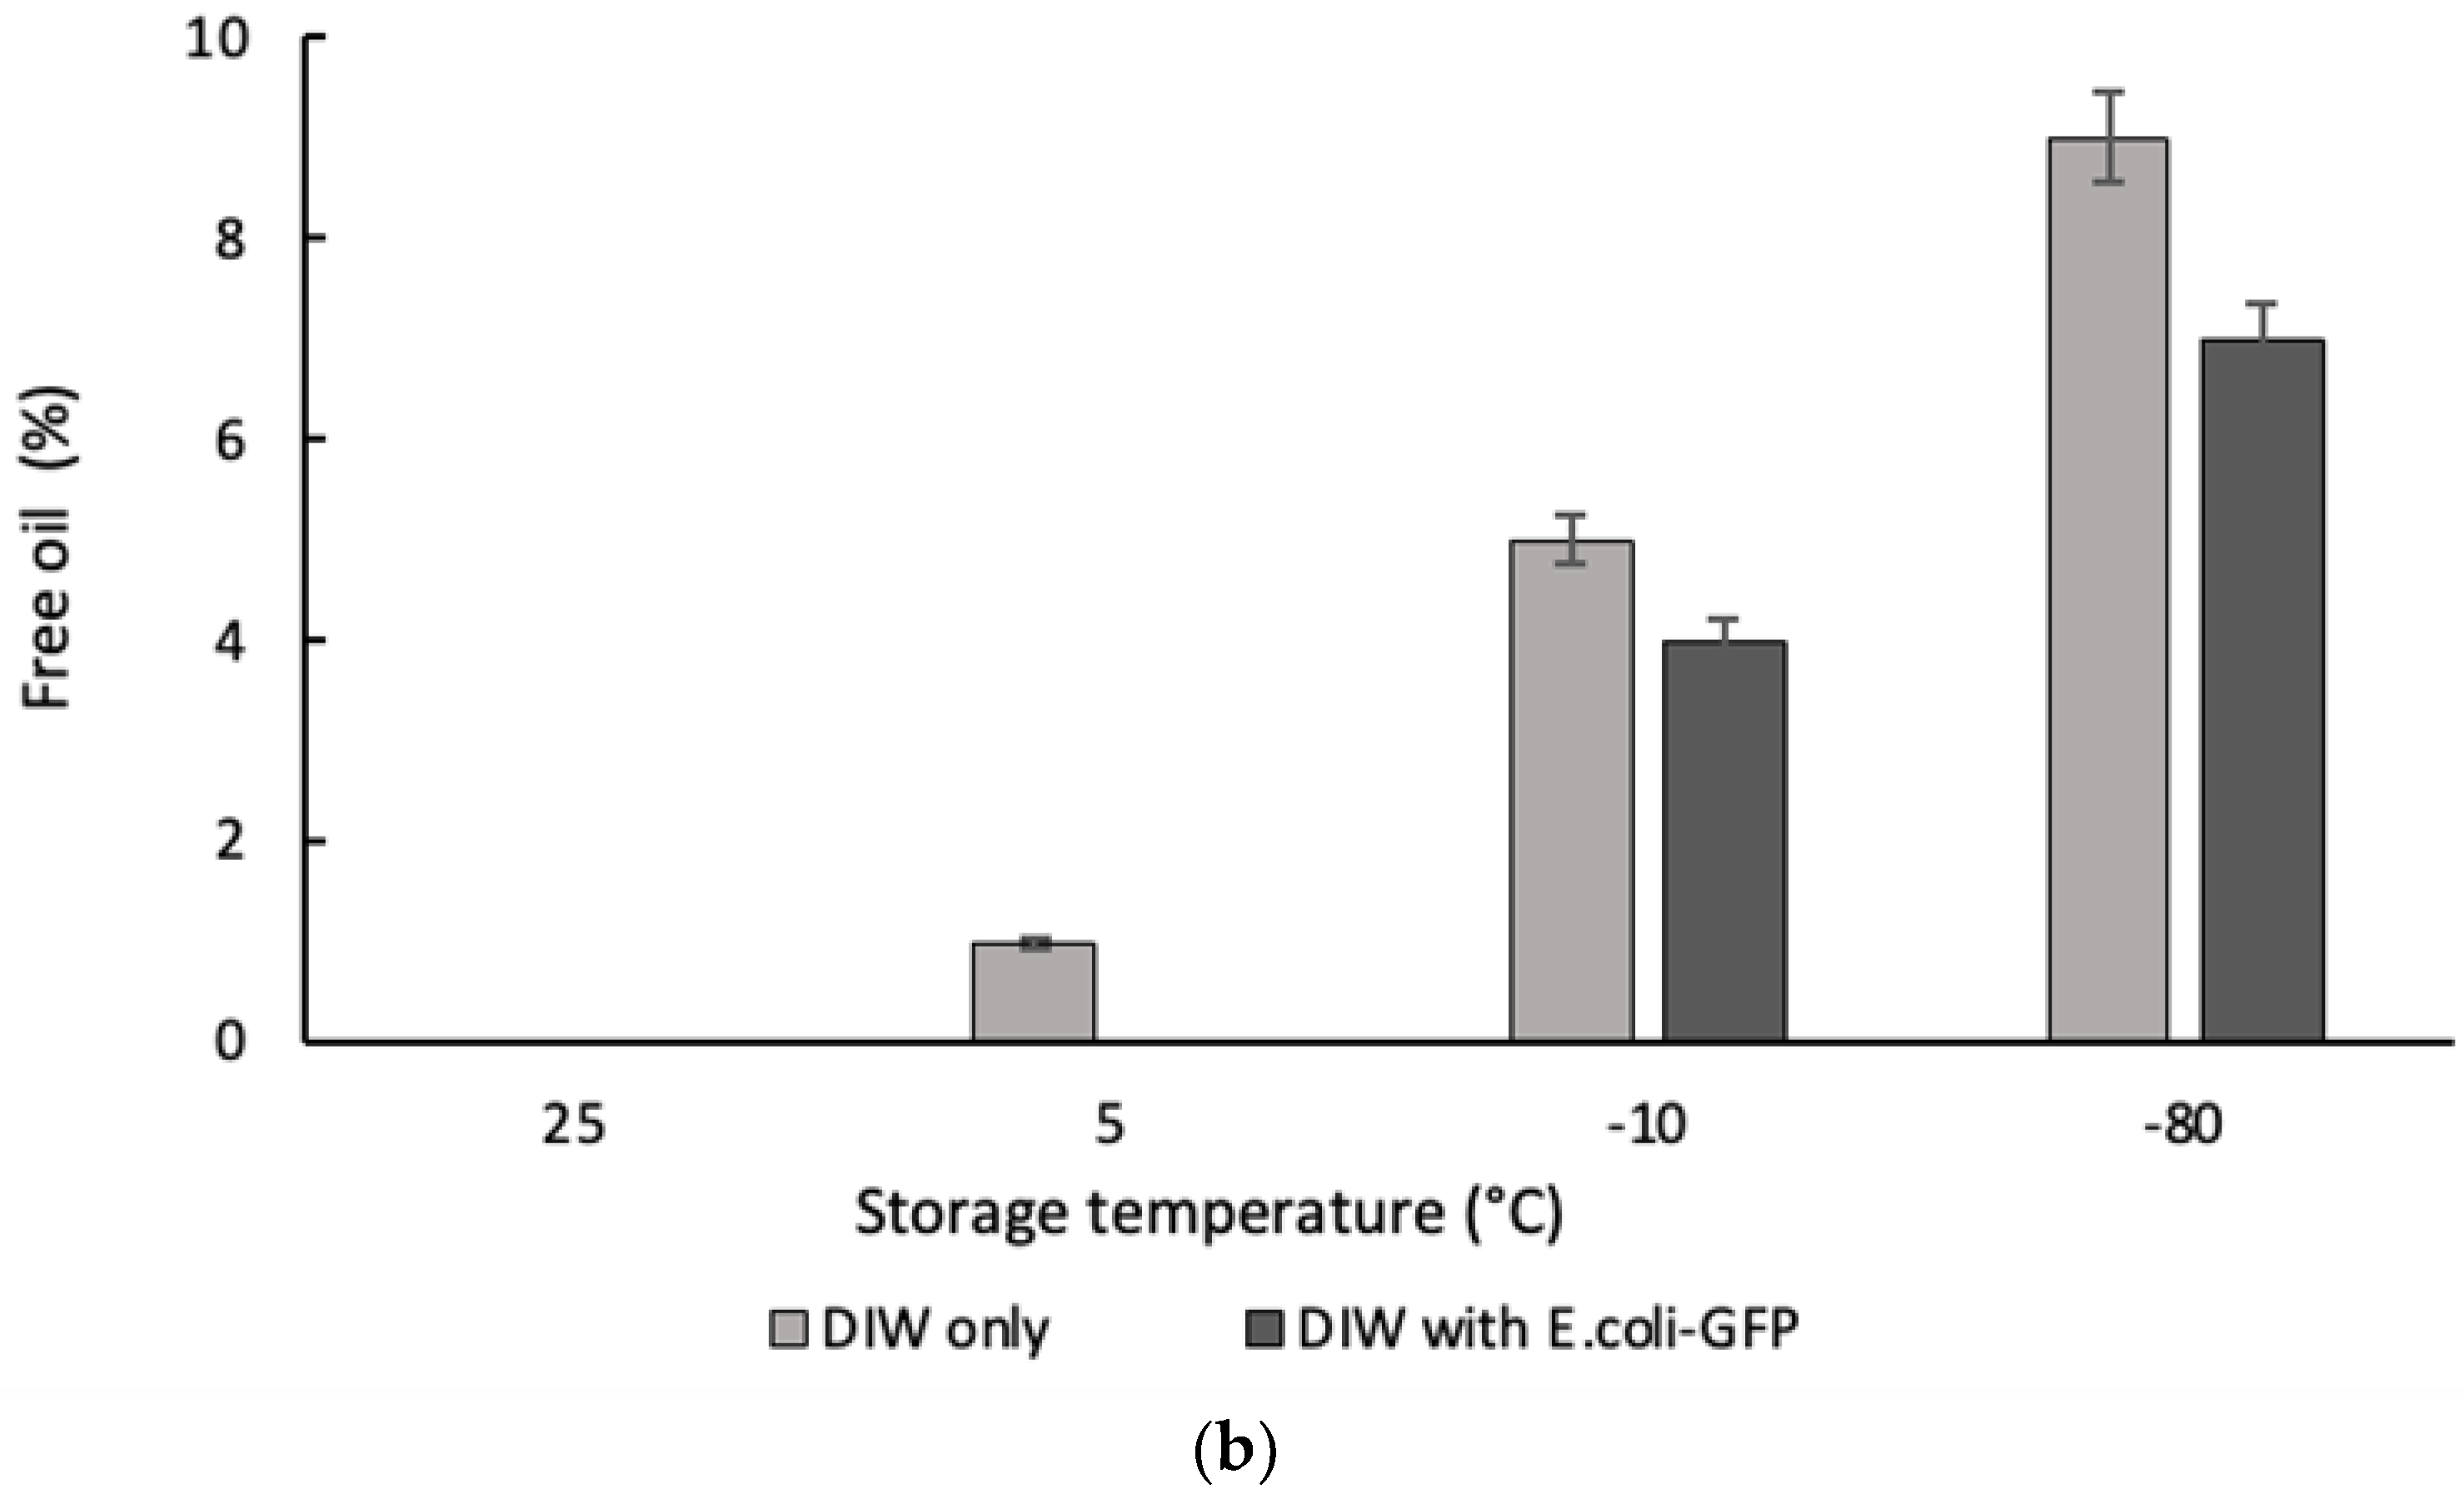
Figure 4.
DSC thermograms showing the cooling curves (a) and heating curves (b) of bulk aqueous samples with or without E .coli-GFP.
Figure 4.
DSC thermograms showing the cooling curves (a) and heating curves (b) of bulk aqueous samples with or without E .coli-GFP.
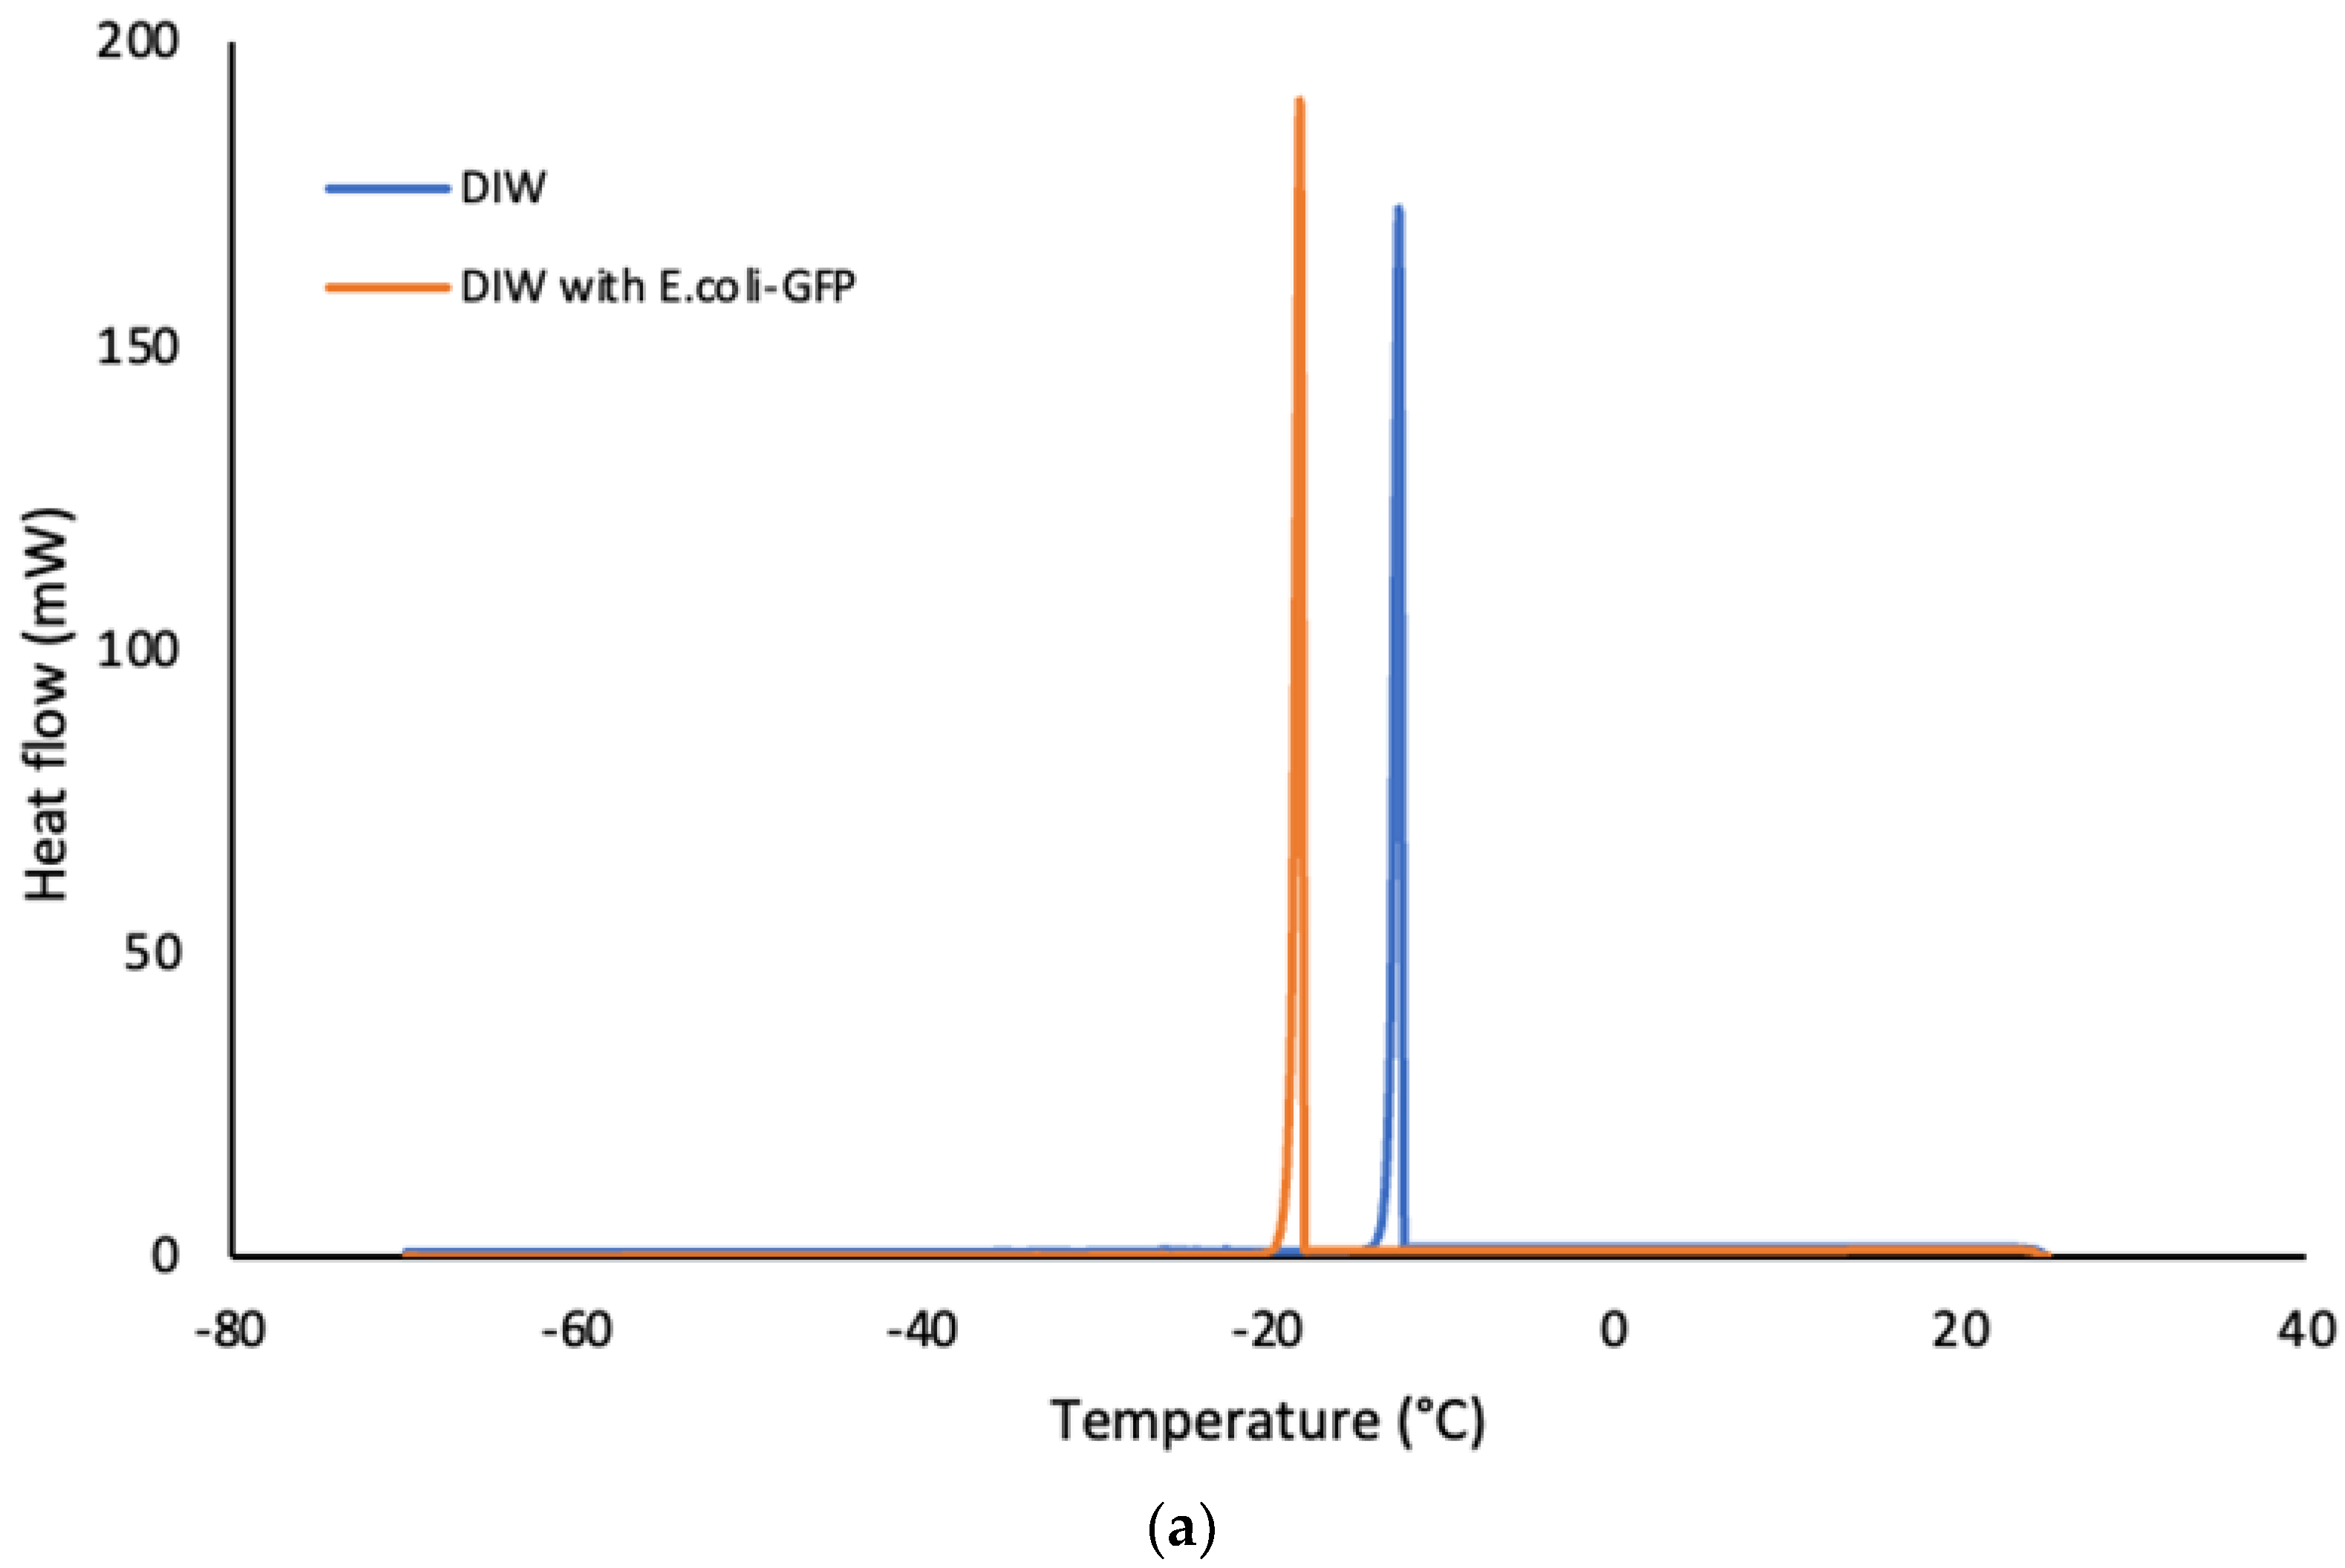
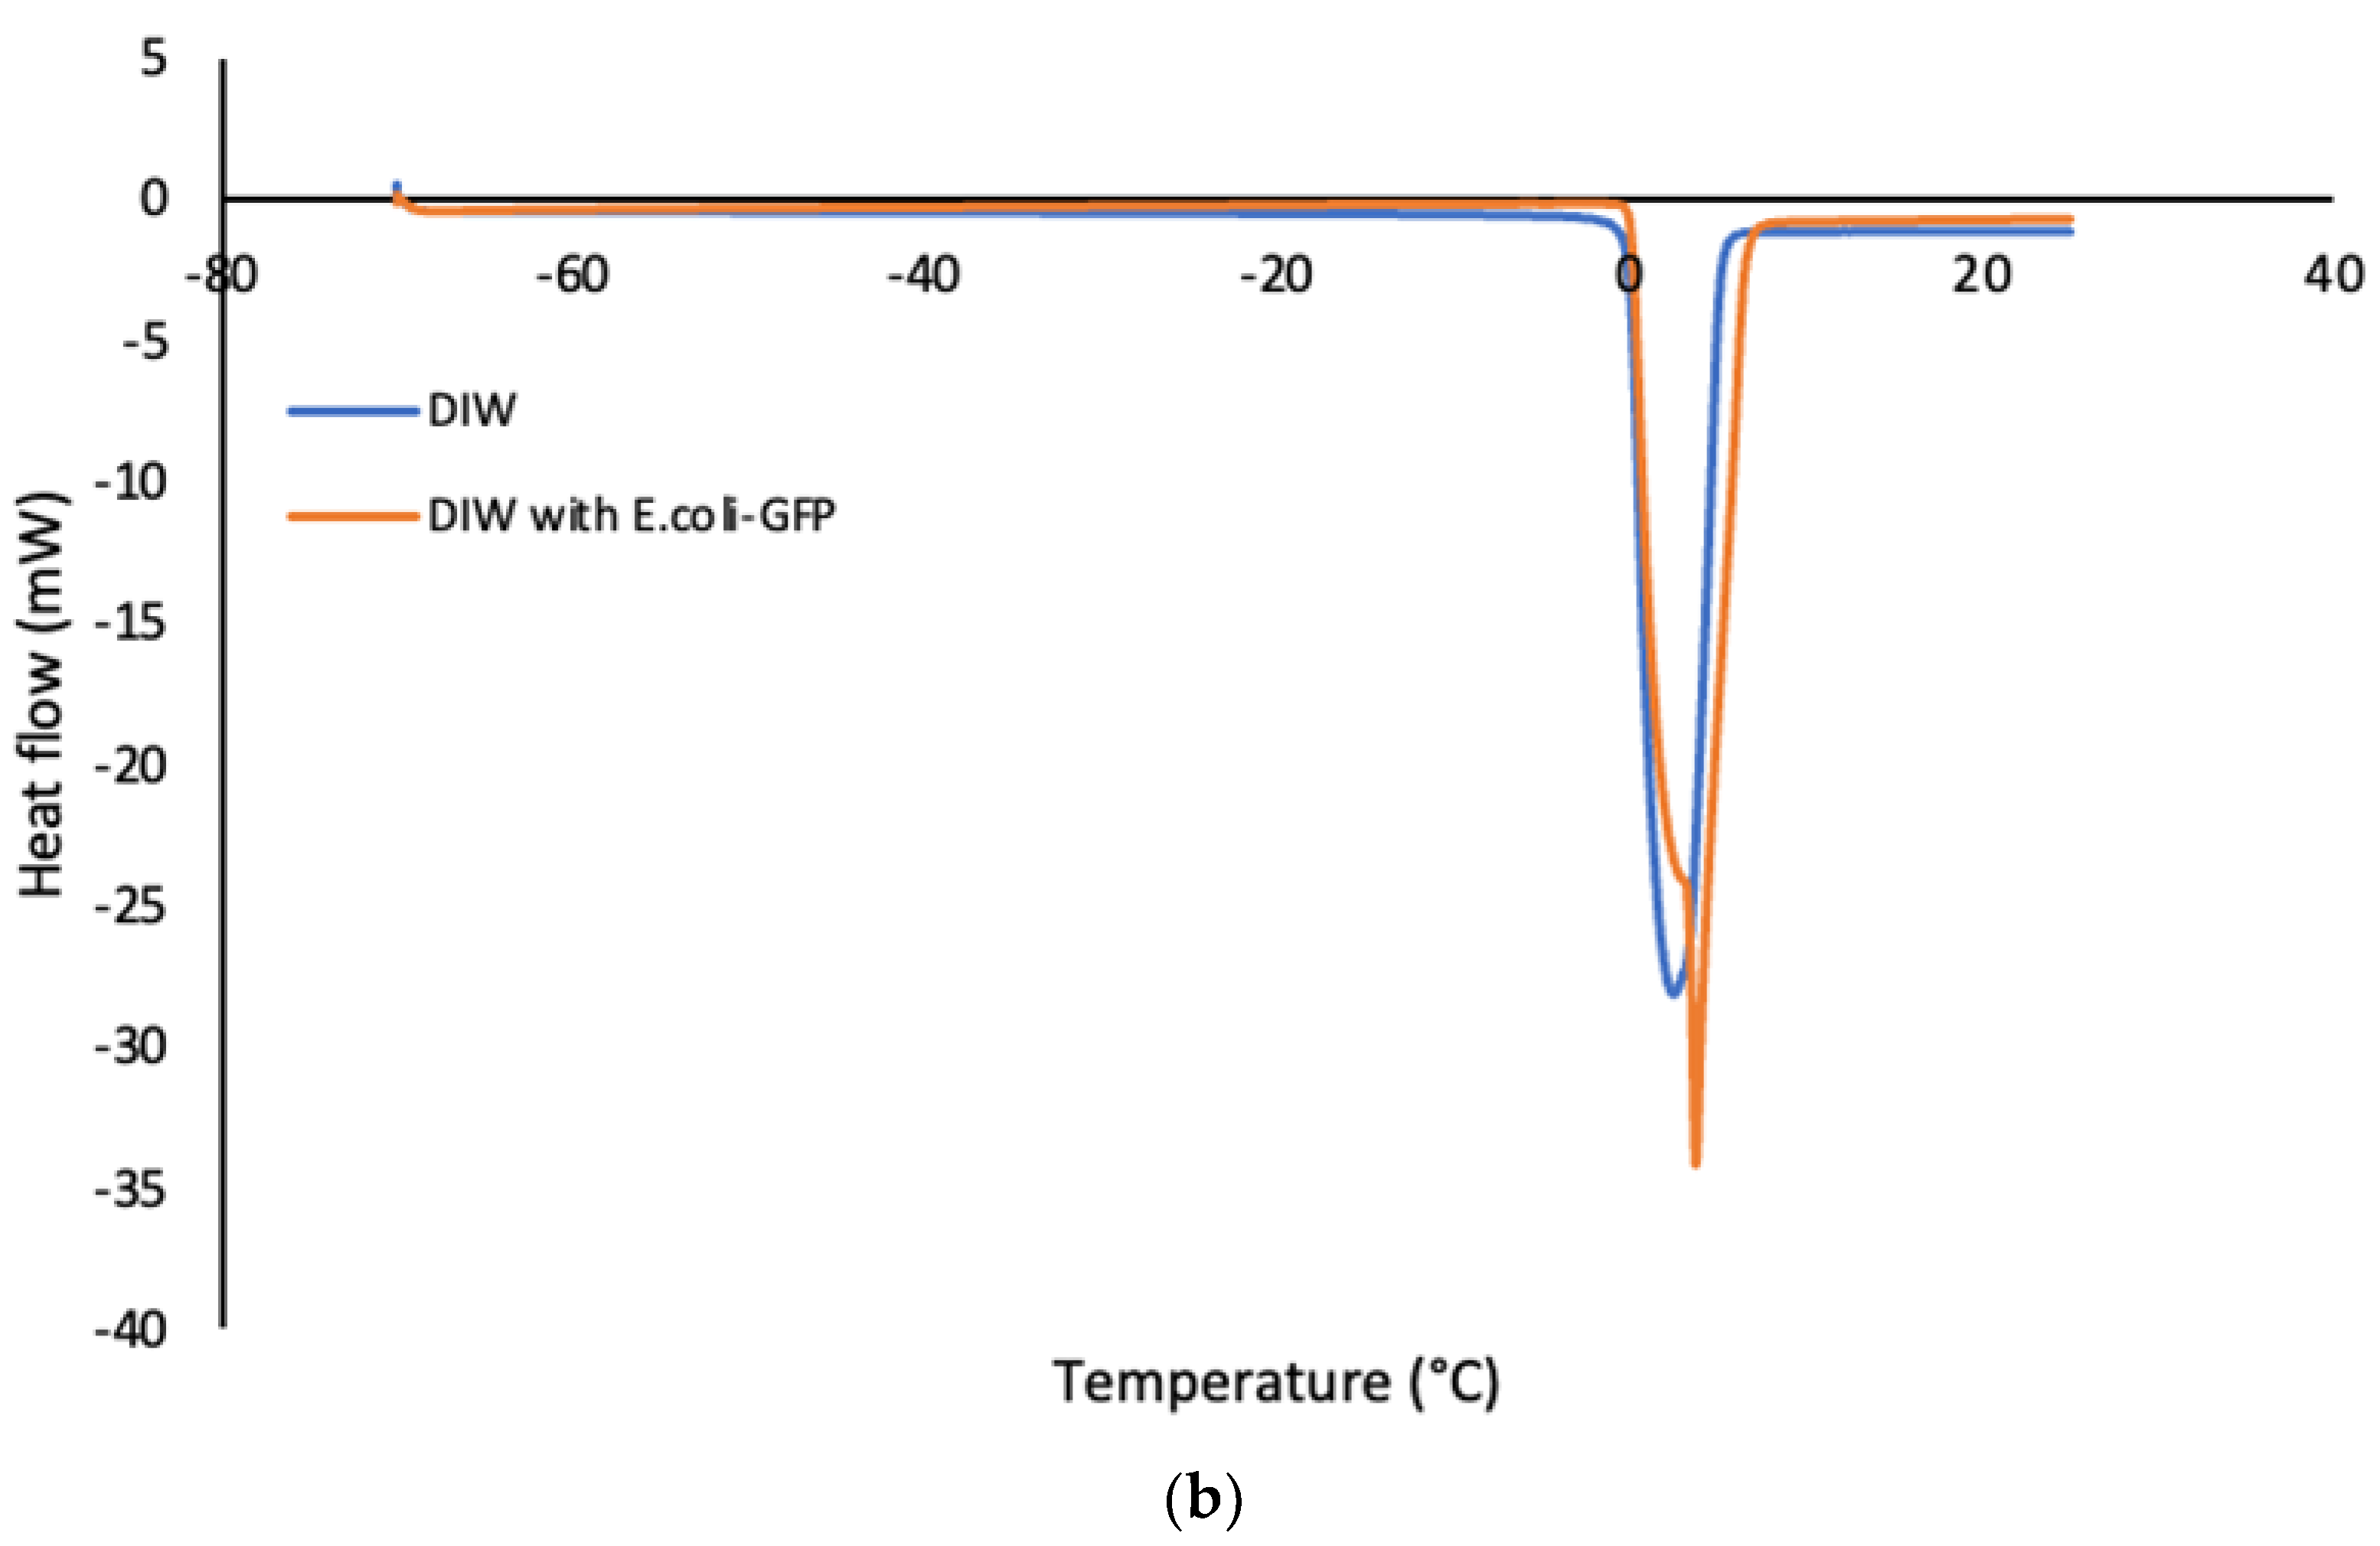
Figure 5.
DSC thermograms of (a) cooling curves and (b) heating curves of emulsified samples with or without E .coli-GFP.
Figure 5.
DSC thermograms of (a) cooling curves and (b) heating curves of emulsified samples with or without E .coli-GFP.
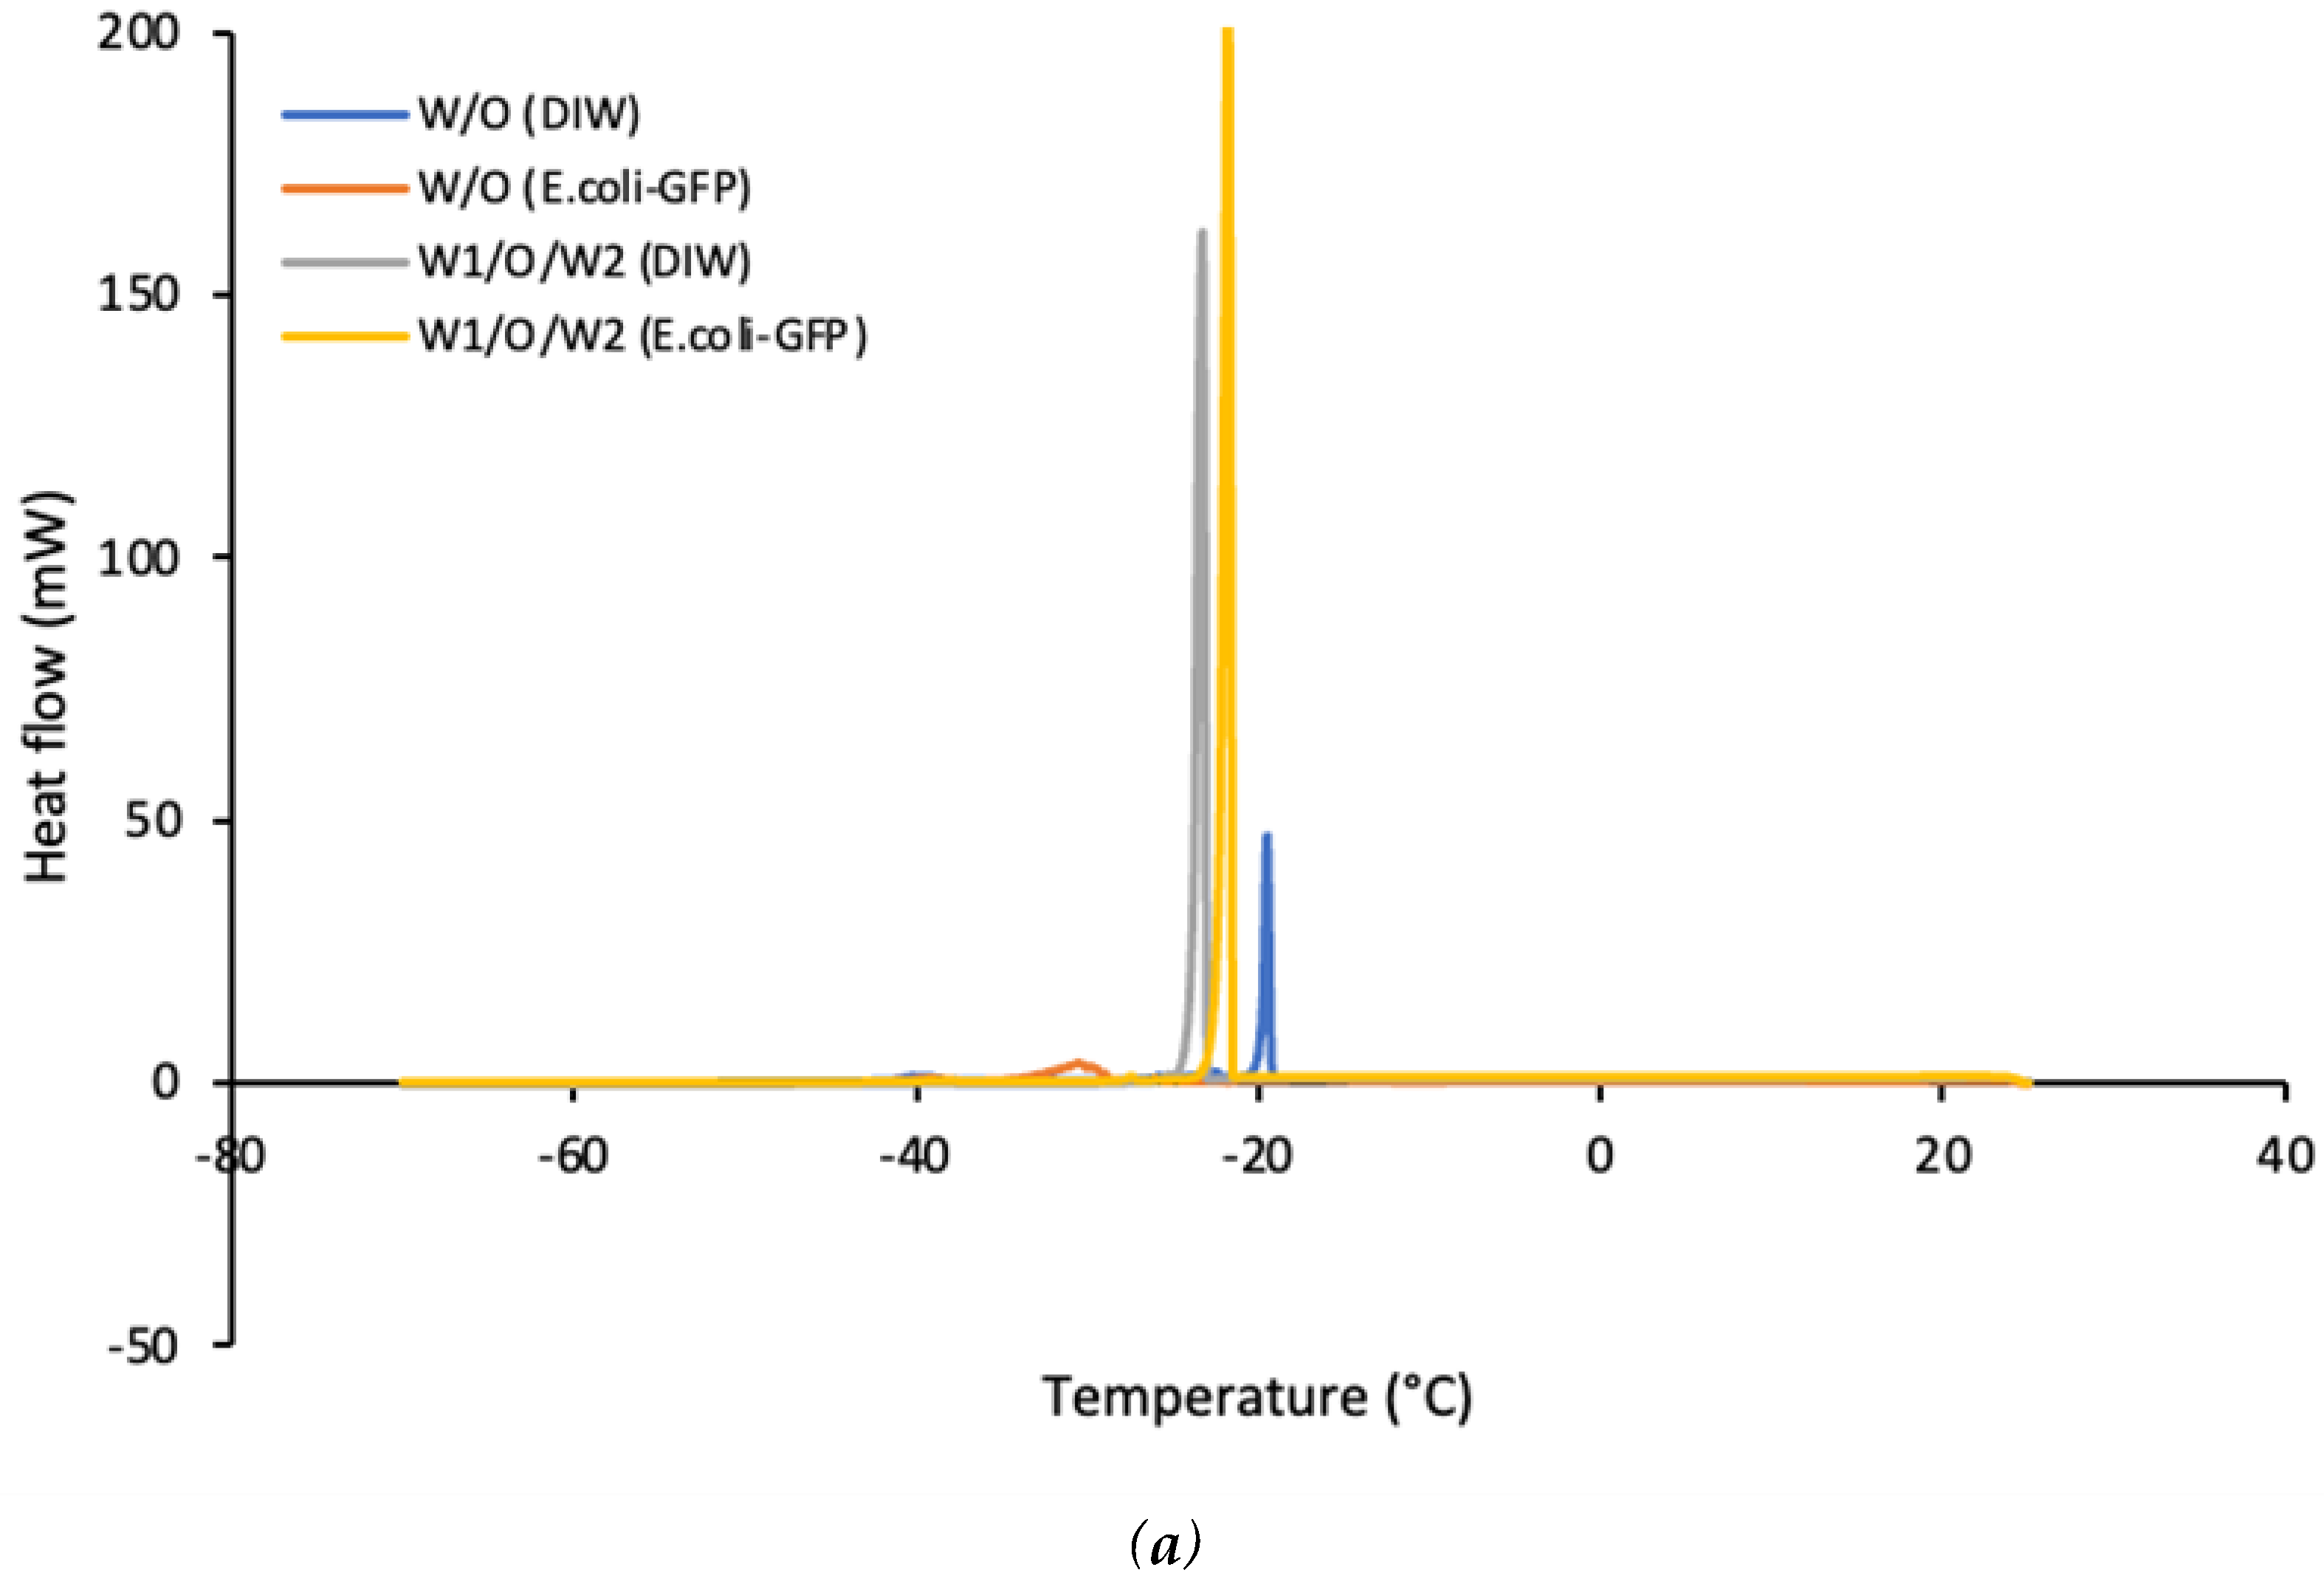
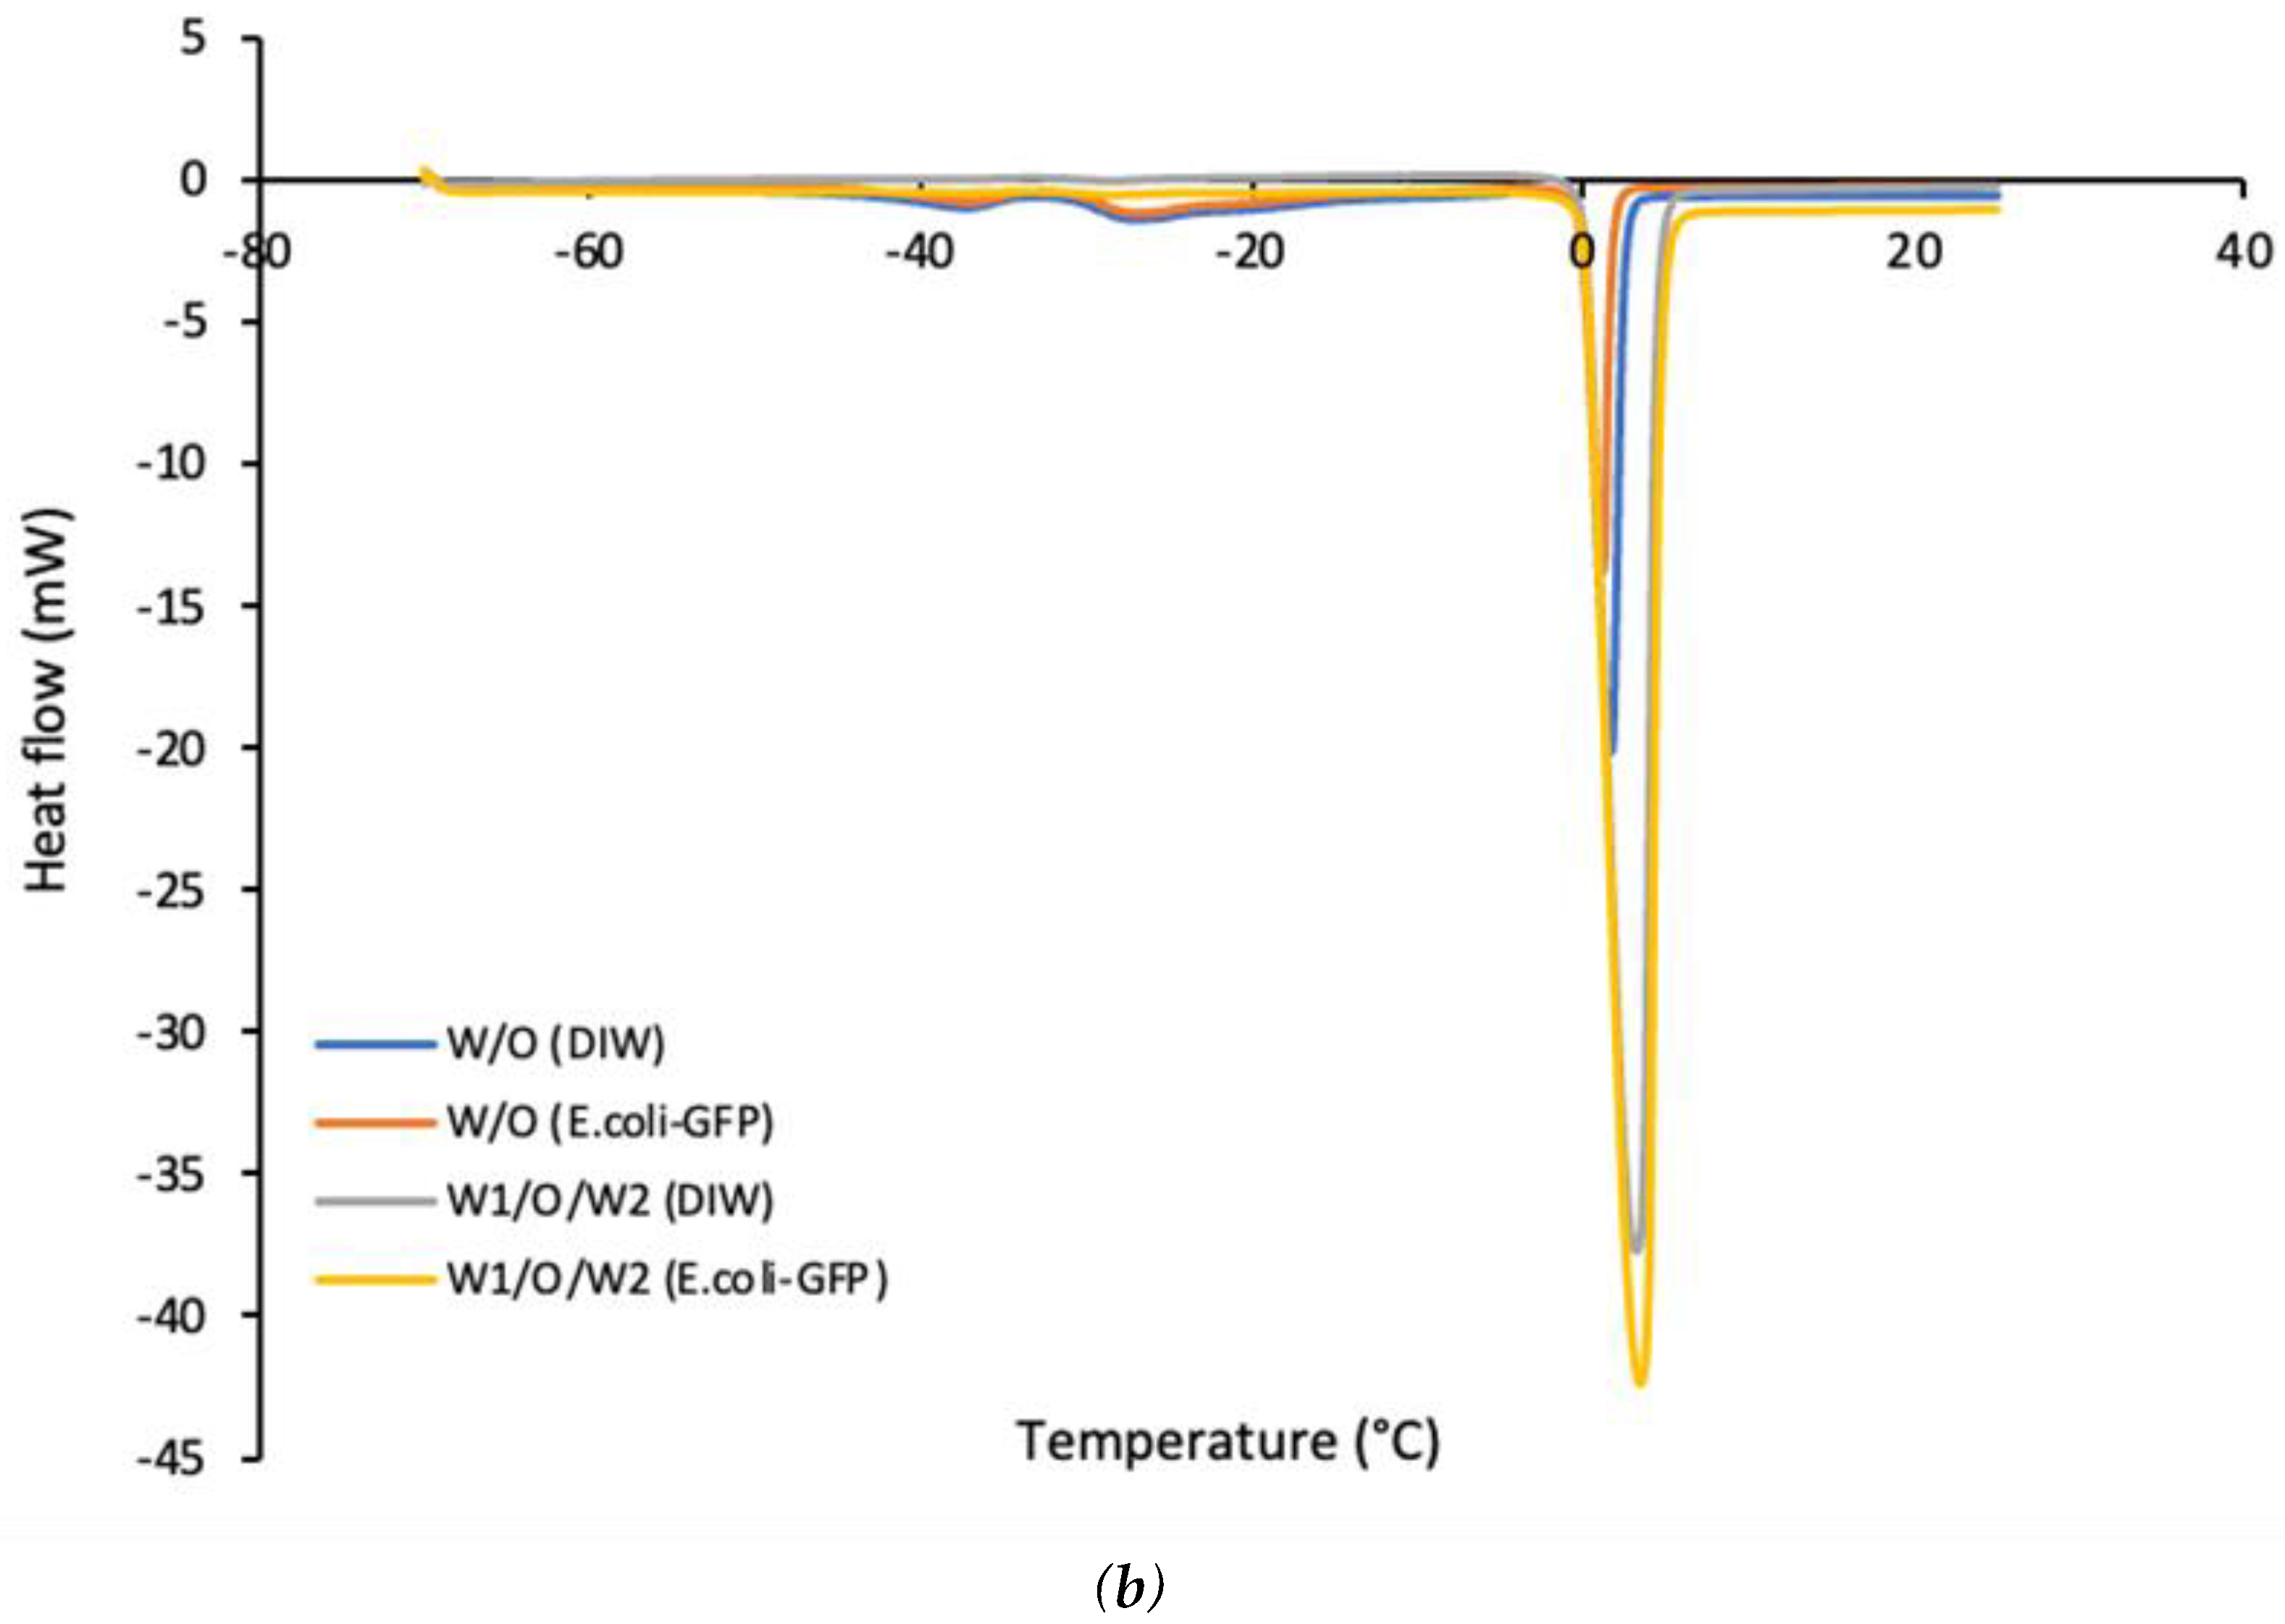
Figure 6.
Reduction in Log CFU/ml of free E. coli-GFP in sterilised DIW and encapsulated in W/O or W1/O/W2 emulsion droplets. Bars represent mean SEM taken from 3 independent experiments.
Figure 6.
Reduction in Log CFU/ml of free E. coli-GFP in sterilised DIW and encapsulated in W/O or W1/O/W2 emulsion droplets. Bars represent mean SEM taken from 3 independent experiments.
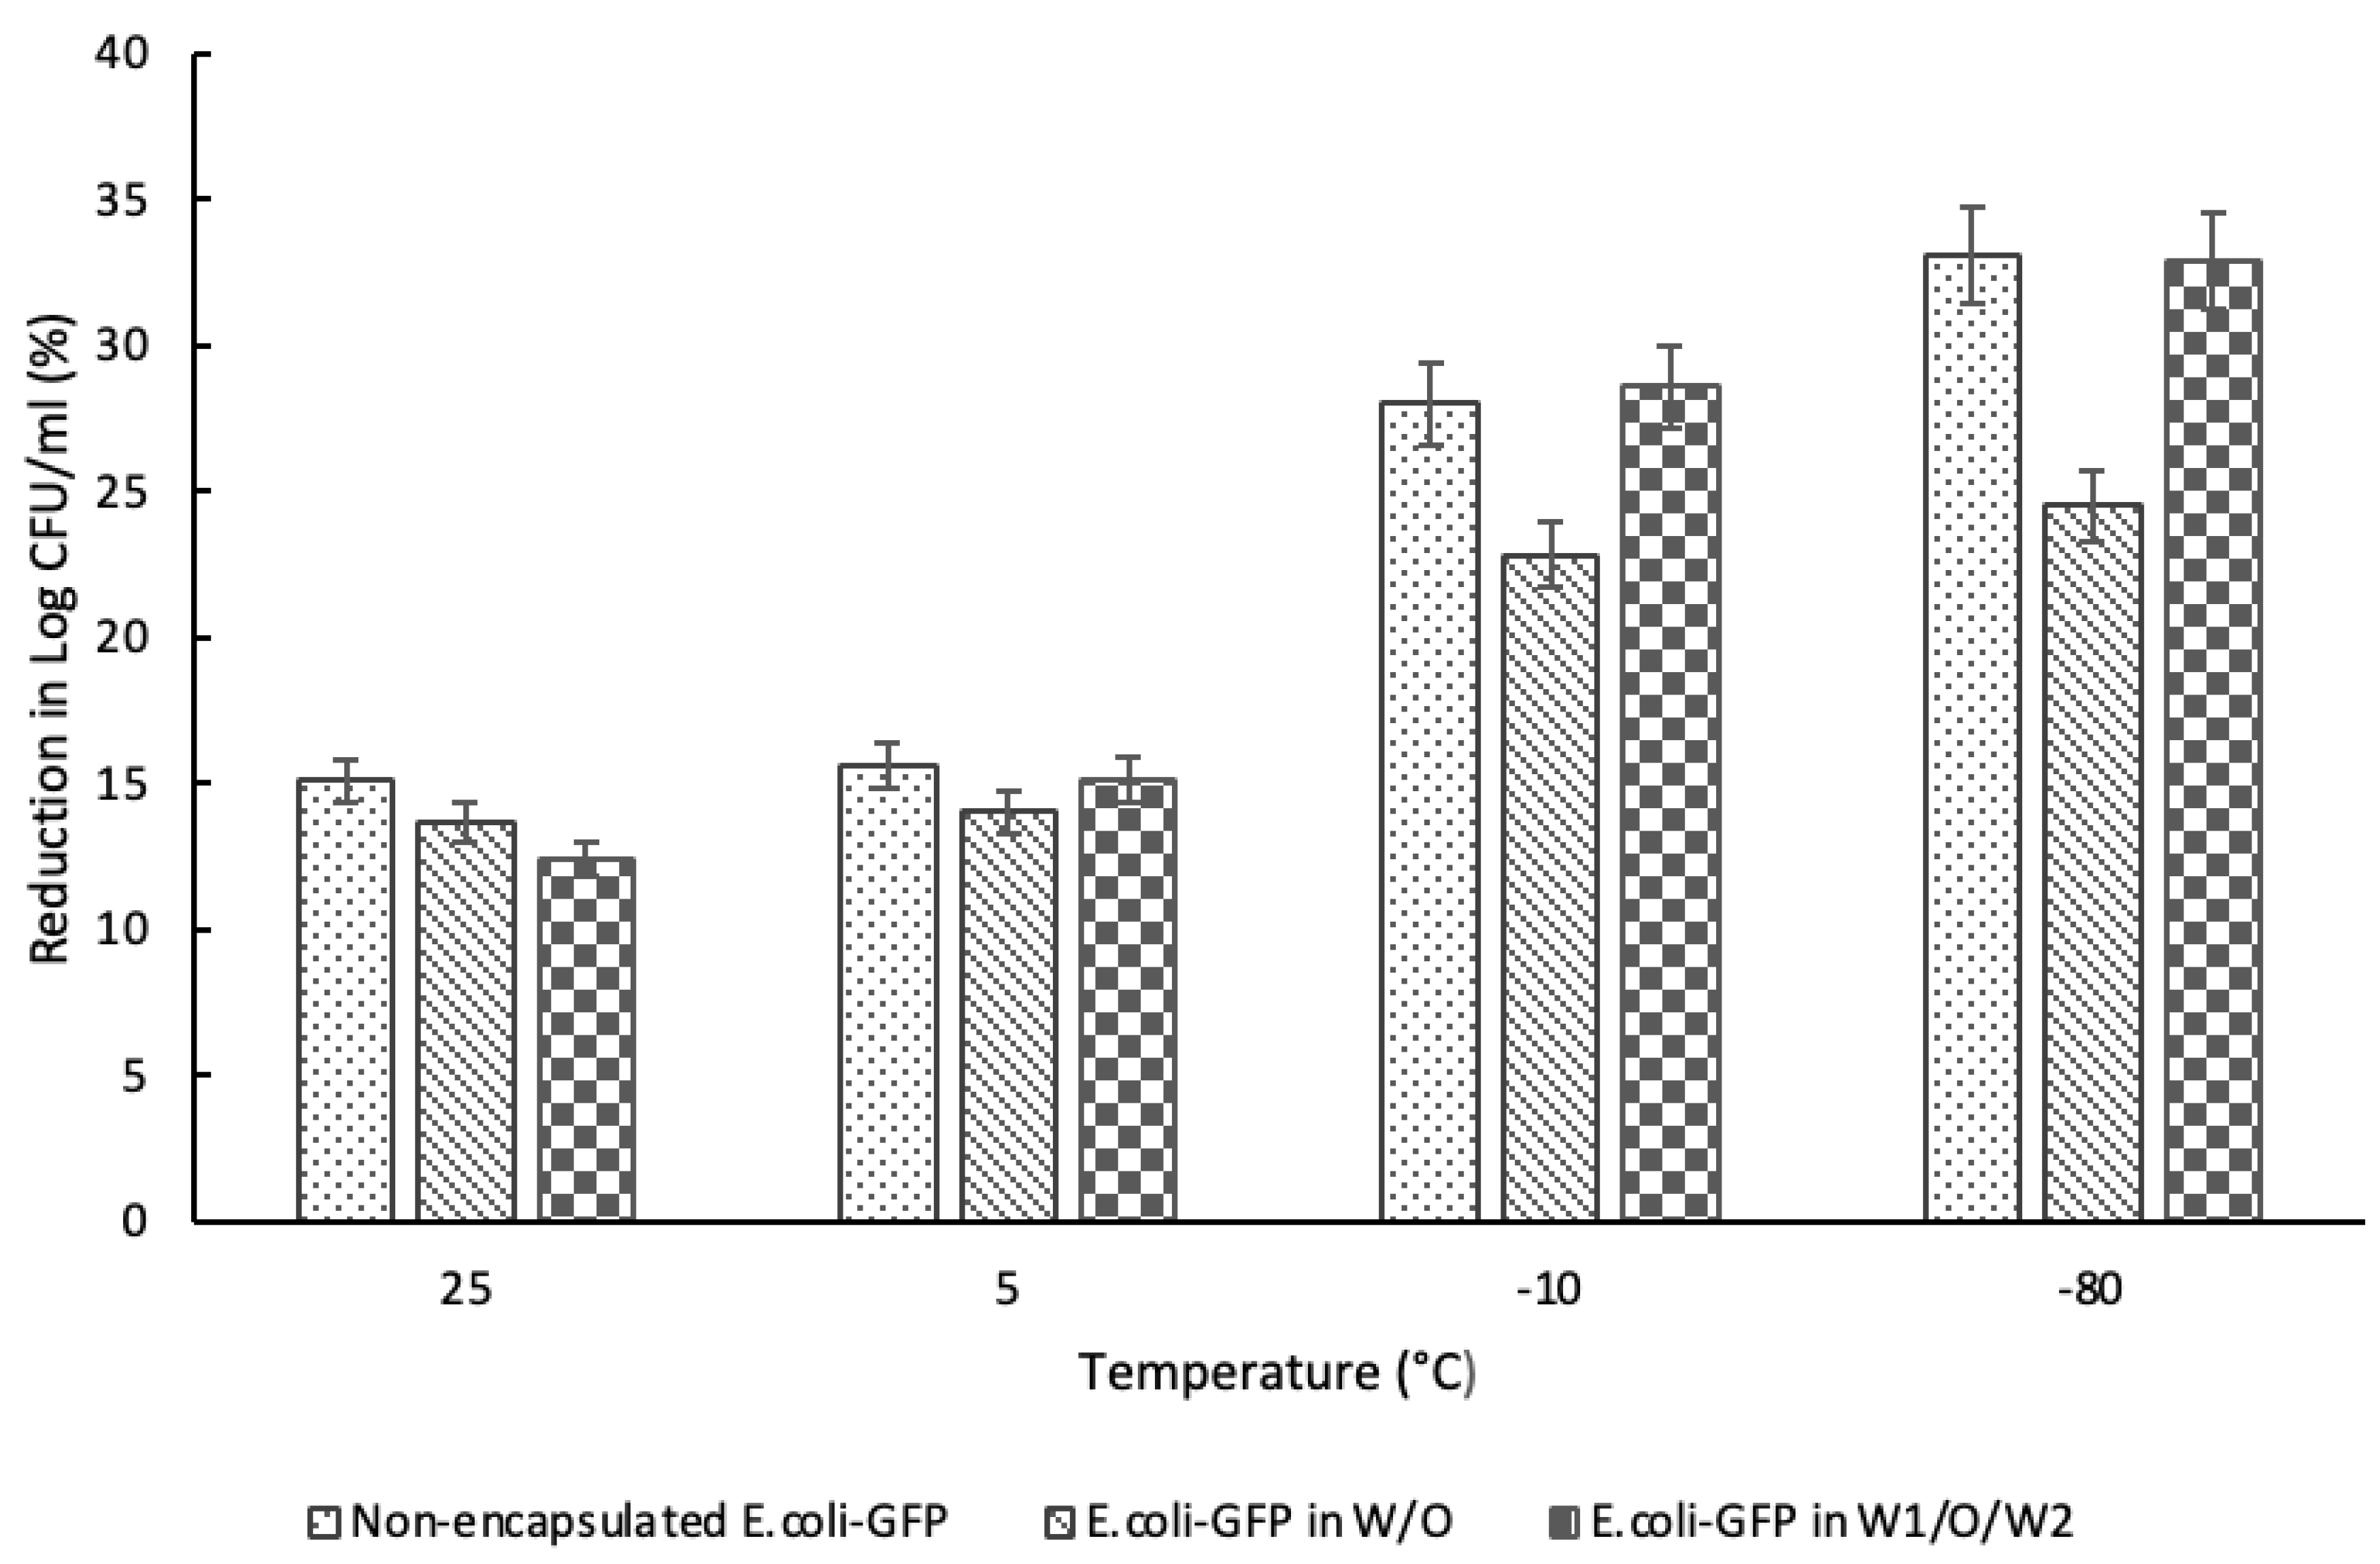
Figure 7.
Photomicrographs of double emulsion droplets before (a) and after (b) storage at -80°C for 24 hours. Scale bar represents 20 µm.
Figure 7.
Photomicrographs of double emulsion droplets before (a) and after (b) storage at -80°C for 24 hours. Scale bar represents 20 µm.
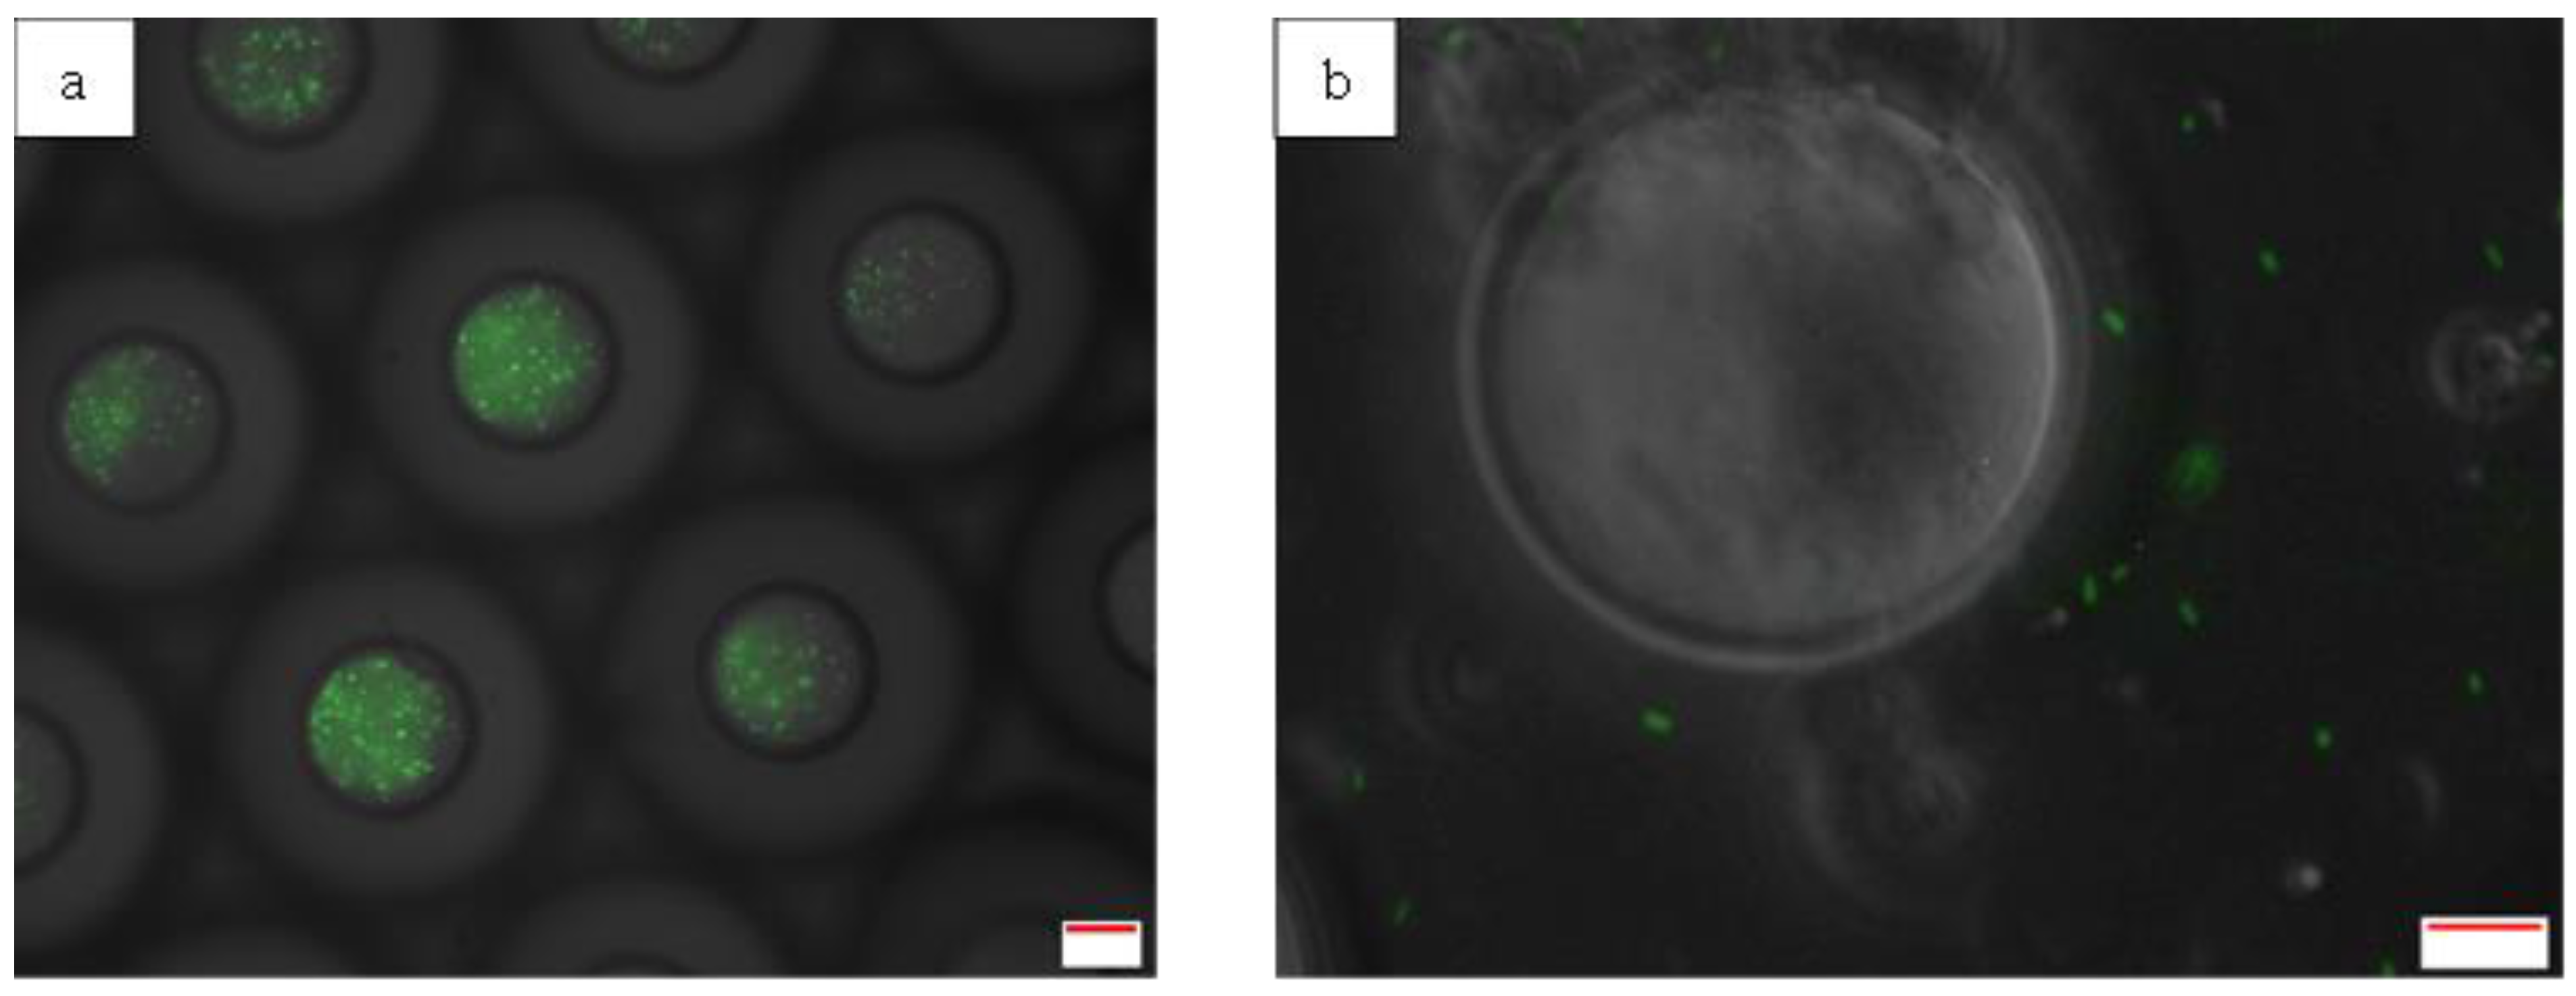

Table 1.
Summary of droplet size and distribution measured before and after 24 hours of storage. Samples were prepared with or without E.coli-GFP for W/O and W1/O/W2 droplets. Data represent mean ± standard deviation taken from 3 independent experiments with N=900 droplet. The coefficient of variation (%) was measured by dividing standard deviation with mean droplet diameter. Mean comparison with small letters and capital letters indicates significant different (P < 0.05) between temperatures within each sample and between before and after storage within each temperature respectively. Data were analyzed with one-way ANOVA and students' T-test.
| Samples | Temperature (°C) | Average droplet diameter (µm) | Coefficient of variation (%) | ||
|---|---|---|---|---|---|
| Before | After | Before | After | ||
| W/O without E. coli-GFP |
25 | 50.4aA ± 4.7 | 55.3aA ± 5.2 | 9.3 | 9.4 |
| 5 | 50.4aA + ± 4.8 | 57.7 aA ± 5.6 | 9.5 | 9.7 | |
| -20 | 50.3aA ± 4.9 | 59.6cB ± 6.6 | 9.7 | 11.1 | |
| -80 | 50.7aA ± 4.8 | 67.2dB ± 19.0 | 9.6 | 28.3 | |
| W/O with E. coli-GFP | 25 | 50.8aA ± 4.7 | 52.1aA ± 4.9 | 9.3 | 9.4 |
| 5 | 50.0aA ± 4.9 | 53.7aA ± 5.3 | 9.8 | 9.9 | |
| -20 | 50.4aA ± 4.9 | 55.3bB ± 5.4 | 9.7 | 9.8 | |
| -80 | 50.5aA ± 5.0 | 62.8cB ± 15.6 | 9.9 | 24.8 | |
| W1/O/W2 without E. coli-GFP |
25 | 100.3aA ± 6.9 | 79.0aB ± 15.6 | 6.9 | 19.7 |
| 5 | 100.7aA ± 7.3 | 75.4bB ± 14.9 | 7.2 | 19.8 | |
| -20 | 100.6aA ± 7.1 | 122.3cB ± 20.2 | 7.1 | 16.5 | |
| -80 | 101.8aA ± 7.4 | 133.8dB ± 20.9 | 7.3 | 15.6 | |
| W1/O/W2 with E. coli-GFP |
25 | 100.9aA ± 7.1 | 79.4aB ± 15.6 | 7.0 | 19.6 |
| 5 | 100.3aA ± 7.7 | 76.3bB ± 14.7 | 7.7 | 19.3 | |
| -20 | 100.4aA ± 7.1 | 116.7cB ± 18.5 | 7.1 | 15.9 | |
| -80 | 100.4aA ± 7.4 | 126.3dB ± 18.9 | 7.4 | 14.9 | |
Table 2.
The effect of storage temperature on the release of bacteria from W1/O/W2 droplets. Samples were prepared with 99.9% encapsulation efficiency and the release of bacteria into the W2 phase was determined after 24 hours of storage. Data represent mean ± standard deviation taken from 3 independent experiments.
| Temperature (°C) | Overall viability (log CFU/ml) | Released (log CFU/ml) | Released (%) |
|---|---|---|---|
| 25 | 6.42 ± 0.03 | 2.75 ± 0.02 | 42.80 ± 0.51 |
| 5 | 6.18± 0.01 | 2.77 ± 0.01 | 44.89 ± 0.23 |
| -20 | 5.19± 0.02 | 5.10 ± 0.01 | 98.36 ± 0.18 |
| -80 | 4.93± 0.03 | 4.90 ± 0.01 | 99.35 ± 0.40 |
Disclaimer/Publisher’s Note: The statements, opinions and data contained in all publications are solely those of the individual author(s) and contributor(s) and not of MDPI and/or the editor(s). MDPI and/or the editor(s) disclaim responsibility for any injury to people or property resulting from any ideas, methods, instructions or products referred to in the content. |
© 2024 by the authors. Licensee MDPI, Basel, Switzerland. This article is an open access article distributed under the terms and conditions of the Creative Commons Attribution (CC BY) license (http://creativecommons.org/licenses/by/4.0/).
Copyright: This open access article is published under a Creative Commons CC BY 4.0 license, which permit the free download, distribution, and reuse, provided that the author and preprint are cited in any reuse.


