
Submitted:
24 September 2024
Posted:
25 September 2024
You are already at the latest version
Abstract
In this study, 3-trimethoxy-silylpropane-1-thiol (MPTMS) was used as a surface modifier for Al2O3 powder to systematically analyze the effects of MPTMS concentration on the rheological properties, photocuring characteristics, and 3D printing performance of photocurable composite slurries. MPTMS concentration significantly influenced the rheological behavior of the slurry. Slurries containing 2 wt.% and 5 wt.% MPTMS exhibited a wide linear viscoelastic range (LVR). However, at concentrations of 10 wt.% and 20 wt.%, the LVR range narrowed, which led to reduced dispersion stability. In dispersion stability tests, the slurry with 2 wt.% MPTMS showed the most stable dispersion, while the 5 wt.% MPTMS concentration exhibited the highest photocuring rate. In 3D printing experiments, the 5 wt.% MPTMS concentration resulted in the most stable printed structures, whereas printing failures occurred with the 2 wt.% concentration. At 10 wt.% and 20 wt.%, internal cracking was observed, leading to structural defects. In conclusion, MPTMS forms silane bonds on the Al2O3 surface, significantly impacting the stability, rheological properties, and printing quality of Al2O3-acrylate composite slurries. An MPTMS concentration of 5 wt.% was found to be optimal, contributing to the formation of stable and robust structures.
Keywords:
Silane coupling agent
; Al2O3 slurry
; Rheology
; Photocuring
; Internal structure analysis
1. Introduction
3D printing technology has established itself as an innovative manufacturing method across various ceramic industries, and with the increasing demand for high-precision structures, UV-curable slurry-based 3D printing technology has garnered attention [1,2,3]. However, to achieve high-quality 3D printing, it is essential to optimize the slurry's rheological properties, dispersion stability, and photopolymerization characteristics. Alumina (Al2O3), a ceramic material with high thermal, chemical stability, and strength, is widely used in various technical applications. However, due to the high agglomeration and specific surface area of Al2O3 powder, maintaining uniform dispersion in the slurry is challenging [4,5]. To address this issue, surface modification techniques such as silanization are employed, where a silane coupling agent (SCA) is adsorbed onto the powder surface to enhance dispersion stability within the slurry [6,7,8,9].
SCAs are compounds whose molecules contain functional groups that bond with both organic and inorganic materials [10]. The organic functional group (X) consists of alkyl, vinyl, methacrylic, and other groups, helping the silane to be compatible with organic materials (monomers). The silicon functional group (OR) typically consists of alkoxy groups like methoxy and ethoxy, facilitating hydrolysis reactions with methanol and ethanol [11,12]. An SCA acts as an intermediary, bonding organic materials to inorganic materials. This characteristic makes SCAs useful for improving the mechanical strength of composite materials, enhancing adhesion, and modifying resins and surfaces.
Many studies have been conducted to improve the properties of 3D printing processes and photocurable structures using various ceramic powders modified with SCA [6,7,8,9]. The powders modified with SCA exhibit excellent dispersibility, improving the uniformity and fluidity of the slurry, which in turn enhances the mechanical properties of the printed ceramic polymer composites. However, most studies have focused on comparing and evaluating different types of SCA or conducting experiments with lower concentrations of additives for practical manufacturing applications. While research has been reported on a wide range of SCA concentrations to increase the solid content of the slurry, these studies have mostly focused on changes in slurry viscosity, without analyzing the effects on photocuring characteristics [13].
In this study, 3-trimethoxy-silylpropane-1-thiol (MPTMS) was used as a surface modifier for Al2O3 powder to systematically analyze the effect of MPTMS concentration on the rheological properties, photocuring characteristics, and 3D printing performance of the slurry. MPTMS plays a crucial role in controlling particle interactions by forming silane bonds on the Al2O3 surface, thereby adjusting the slurry's stability and curing rate. The objective of this study is to evaluate the physical properties of Al2O3 slurry based on MPTMS concentration to determine the optimal conditions for achieving the best 3D printing performance. This will provide fundamental data necessary for the production of high-quality ceramic components.
2. Materials and Methods
2.1. Materials
In this experiment, Al2O3 powder was purchased from Sumitomo, Japan (AES-11H). Methyl alcohol (CH3OH, Extra pure, Daejung, Korea) was used as a solvent. The SCA used was 3-trimethoxy-silylpropane-1-thiol (MPTMS) with an average molecular weight of Mw = 196.34 g/mol (KBM 503, Shin-Etsu Chemicals Co., Ltd., Japan). The monomer used was trimethylolpropane triacrylate (TMPTA) with an average molecular weight of Mw = 296.32 g/mol. Phenylbis (2,4,6-trimethyl benzoyl) phosphine oxide (Irgacure 819) was purchased from Sigma Aldrich and used as a photoinitiator.
2.2. Adsorption of MPTMS on Al2O3 Powder
Methyl alcohol and Al2O3 were mixed in a 6:4 ratio and ball-milled for 24 hours. MPTMS was then added at 2, 5, 10, and 20 wt.% relative to Al2O3, followed by heating at 50 °C for 24 hours using a heating mantle to facilitate hydrolysis and condensation reactions, allowing MPTMS to bond to the Al2O3 surface. To remove the solvent from the slurry, it was centrifuged at 5000 rpm for 30 minutes (1696R, Rabogene, Korea), and the precipitate was rinsed three times with methanol and acetone. The cleaned precipitate was then dried in a vacuum oven (SOV-20, Daihan Sci., Korea) set at 60 °C for 5 hours.
The amount of MPTMS adsorbed on the Al2O3 surface was measured using thermogravimetric analysis (TGA; STA7200RV, Hitachi, Japan). The weight of the thermally decomposed material was measured three times between 25°C and 800°C with a heating rate of 10°C/min, and the average value was reported. To confirm the functional groups of the MPTMS-adsorbed Al2O3, Fourier-transform infrared spectroscopy (FT-IR; Nicolet 6700, Thermo Fisher Scientific) was conducted on the dried particles using transmittance mode in the range of 600–4000 cm⁻¹ on an ATR crystal.
2.3. Preparation and Characterization of Al2O3 Acrylate Composite Slurry
The MPTMS-modified Al2O3 slurry prepared as described above was mixed with TMPTA and allowed to react for 12 hours at room temperature to induce chain polymerization between MPTMS and TMPTA. The solvent was then evaporated at 50 °C using a vacuum evaporator (N-1200A, EYELA, Japan) to obtain solvent-free slurry. Afterward, 1 wt.% of the photoinitiator was mixed for 24 hours to prepare the final solvent-free Al2O3-acrylate composite slurry, which had a solid content of 60 wt.%.
A rheometer (HAAKE MARS III, Thermo Fisher Scientific Inc., Germany) was used to analyze the rheological behavior of the slurry. The experiment was conducted at a constant temperature (25 °C) using a cup-and-bob (Coaxial Cylinders) measuring system. Viscosity was measured under steady-state mode with a shear rate ranging from 10⁻⁴ to 10³ s⁻¹. To evaluate the deformation behavior and viscoelastic properties of the slurry, amplitude oscillation sweep measurements were conducted. In the linear viscoelastic range (LVR) determined from the amplitude oscillation sweep, frequency oscillation sweep (angular frequency = 0.1–100 rad/s) was performed.
To analyze dispersion stability, a sedimentation test was conducted using a Turbiscan LAB stability analyzer (Formulaction SA, France). Cylindrical glass cells were used for the measurement, and an 880 nm near-infrared wavelength was employed as the light source. The backscattering (%) profile was used to graph destabilization phenomena, which include particle migration (creaming/sedimentation) and particle size variation (flocculation/coalescence).
The photocuring behavior of the slurry was analyzed using a photo-DSC (DSC 204 F1 Phoenix, Netzsch, Germany). The sample was placed in an aluminum crucible with a pierced lid, and measurements were taken at the same temperature (25°C), light source (405 nm), and light intensity (5.4 W/cm²), with varying exposure times (1.2, 2.4, 4.8 seconds). The photocuring conversion rate was calculated based on the curing enthalpy (ΔH) measured by the photo-DSC [14].
2.4. 3D Printing and Internal Structure Analysis
To verify the 3D printing behavior of the solvent-free Al2O3-acrylate composite slurry, disk-shaped samples (diameter = 10 mm, thickness = 2 mm) were printed using a DLP 3D printer (IM96, Carima, Korea). The basic/primary exposure times were varied as 1.2/5.0, 2.4/10, and 4.8/20 seconds during printing. Basic exposure time refers to the time taken for the slurry to adhere to the build platform during the first 10 layers of the total 204-layer printing process. Primary exposure time refers to the exposure time for all remaining layers except for the basic exposure time.
The internal structure of the Al2O3-acrylate composite printed via 3D printing was examined using a Micro Focus X-ray CT system (InspeXio SMX-225CT, Shimadzu). The captured images were reconstructed into 3D images using the myVGL ver.3.2 program, and the internal structures of the Al2O3 composites were compared based on MPTMS content.
3. Results and Discussion
3.1. Concentration-Dependent Adsorption of SCA on Al2O3
The weight change of MPTMS-modified Al2O3 as a function of temperature was summarized in Figure 1.
The weight loss occurred in two stages: the first stage was observed in the temperature range of 300-380 °C, and the second stage appeared between 400-500 °C. The first stage is attributed to the thermal decomposition of the organic solvents used for cleaning, with the amount of weight loss falling between 0.07 and 0.09 wt.%. The second stage reflects the thermal decomposition of MPTMS adsorbed on the Al2O3 surface. The weight loss in this second stage, corresponding to the decomposition of the SCA, was 0, 0.18, 0.11, 0.14, and 0.25 wt.% as the SCA content increased.
Figure 2 shows the variation in the amount of SCA adsorbed as a function of SCA concentration.
The adsorption amount increased up to an SCA concentration of 2 wt.%, decreased at 5 wt.%, and then increased again at concentrations above 10 wt.%. Interestingly, at an SCA concentration of 5 wt.%, the adsorption amount was lower than that at 2 wt.%, despite the higher SCA concentration. J. Quinton et al. reported an oscillatory adsorption behavior of SCA depending on the SCA concentration and adsorption time. They explained this behavior through a model where organosilane molecules initially bind strongly to the oxide surface, but after a certain period, they desorb and then re-adsorb onto the surface [15,16]. As a result, the adsorption amount does not increase linearly with SCA concentration or adsorption time but follows an oscillatory adsorption pattern, showing a cycle of increase-decrease-increase.
In this context, the experimental results of SCA adsorption as a function of concentration suggest that at 2 wt.% SCA, only the initial adsorption reaction occurs, while at 5 wt.% SCA, both adsorption and desorption reactions happen simultaneously, leading to re-adsorption. As the SCA concentration increases to 10 wt.% or more, re-adsorption becomes more pronounced, resulting in a further increase in the adsorption amount. Consequently, the amount of SCA adsorbed on the Al2O3 surface does not increase linearly with SCA concentration but follows the trend of 20 > 2 > 10 > 5 > 0 wt.%, showing the oscillatory adsorption behavior.
3.2. FT-IR Analysis of SCA Bonding on Al₂O₃ Surface
To confirm the bonding state of SCA on the surface of Al2O3, the FT-IR measurement results are summarized in Figure 3.
The FT-IR spectrum of Al2O3 powder without SCA did not exhibit any significant absorption peaks, and most of the peaks appeared broad. In contrast, all the Al2O3 samples with SCA (2, 5, 10, 20 wt.%) showed sharp peaks of similar shape.
Regardless of the SCA concentration, all samples displayed peaks at 3450, 2359, 2338, and 1659 cm⁻¹, which correspond to the Al-O-H bonds on the surface of Al2O3. The peaks at 2980 and 2885 cm⁻¹ represent C-H stretching vibrations between Al2O3 and SCA, while the peak at 1045 cm⁻¹ in the 1200-950 cm⁻¹ region indicates the formation of Al-O-Si and Si-O-Si bonds. Since the masses of Al and Si atoms are similar, this peak appears at a vibration frequency close to that of Al-O-Al bonds. These peaks demonstrate the bonding interaction between Al2O3 and SCA [17].
The peak at 2980 cm⁻¹ corresponds to asymmetric CH3 and CH2 stretching, while the 2885 cm⁻¹ peak represents the symmetric stretching of the CH3 group in OCH3 [18]. The 1045 cm⁻¹ peak indicates asymmetric and symmetric Si-O-CH3 stretching, suggesting that Si-O-Si bonds are formed as a result of hydrolysis and condensation reactions of the alkoxy groups in the SCA. This also implies that double bonds are generated by the acrylate group of the SCA. As such, it can be confirmed that SCA forms the same type of bonding on the Al2O3 surface, regardless of the SCA concentration.
3.3. Rheological Behavior of Photocurable Al2O3 Slurries
To investigate the rheological behavior of the photocurable slurry prepared by adding TMPTA to MPTMS-modified Al2O3 slurry, viscoelastic and viscosity analyses were conducted using a rheometer. Figure 4 presents the results of the amplitude oscillation sweep measurements.
All slurries exhibited elastic deformation behavior within the LVR with (G' > G"). The LVR range for the slurries containing 2 and 5 wt.% SCA was 10-3 ~ 1 Pa, while the slurries with higher SCA content, 10 and 20 wt.%, showed a relatively shorter LVR range of 10-3 ~ 10-1 Pa. As the SCA content increased, the LVR range decreased, indicating a weakening in the slurry's resistance to deformation. In other words, the slurries with 2 and 5 wt.% SCA had higher resistance to deformation compared to those with 10 and 20 wt.% SCA.
The results of the frequency oscillation sweep measurements are shown in Figure 5.
The slurries with 2 and 5 wt.% SCA exhibited elastic behavior across the entire frequency range, with a relatively wide gap between G' and G". This indicates that the slurry has a typical gel-like structure. The slurries with 10 and 20 wt.% SCA also exhibited elastic behavior, but after initially displaying elastic behavior, a crossover point appeared at 10 Hz, after which they returned to elastic behavior.
Using G' and G" obtained from the oscillation sweep measurements, the loss factor (tan δ) was calculated. This loss factor, also known as the sol/gel transition point, provides insight into the ratio between the two components of viscoelastic behavior. The values of the loss factor were presented over a frequency range of 0.1 – 10 Hz (Figure 6(a)).
The results were consistent with the previous viscoelastic behavior experiment, with all samples showing tan δ = G"/G' < 1, indicating that the slurry remained in a gel state without any changes in properties during measurement. As the SCA content decreased, the tan δ values also decreased, meaning that the lower the SCA content, the greater the proportion of elasticity in the viscoelastic properties.
Figure 6(b) shows the changes in apparent viscosity of the slurries with varying shear rates. For the slurries with 2 and 5 wt.% SCA, the apparent viscosity steadily decreased with a consistent slope in the low shear range (10-3), whereas the slurries with 10 and 20 wt.% SCA exhibited relatively lower apparent viscosity. Although there were differences depending on the SCA content, all slurries initially exhibited Newtonian behavior at low shear rates, followed by a decrease in apparent viscosity as the shear rate increased, showing shear-thinning behavior. The decrease in viscosity was observed over a wide range of shear rates.
It was observed that the viscosity of the slurry decreased as the SCA content increased. This phenomenon is likely due to the steric stabilization effect, where the SCA adsorbed onto the Al2O3 particles acts as a dispersant. In other words, as the SCA content increases, the dispersion effect of the Al2O3 powder improves, resulting in a decrease in slurry viscosity.
3.4. Dispersibility and Sedimentation Behavior of Photocurable Al2O3 Slurries
The dispersibility of the photocurable Al2O3 slurry with varying SCA content is shown in Figure 7.
The slurry containing 2 wt.% SCA exhibited an approximately 20% increase in backscattering (%) in the upper layer. This indicates the occurrence of Rayleigh diffusion, which happens when particle size is small. As the spacing between small particles decreases, the probability of light scattering with particles increases, leading to an increase in backscattering (%) values [19,20]. Changes in the middle and upper layers show relatively thin sedimentation and flocculation layers, indicating that the small particle size and uniform distribution prevent significant sedimentation, resulting in a smaller inter-particle distance and thus an increase in backscattering values.
The slurries with 5, 10, and 20 wt.% SCA exhibited a decrease in backscattering (%) in the upper layer due to Mie diffusion [19,20,21]. The slurry with 5 wt.% SCA showed the widest and deepest clarification layer and an approximately 80% reduction in backscattering (%). The slurries with 10 wt.% and 20 wt.% SCA showed backscattering (%) reductions of about 60% and 40%, respectively. The bimodal decrease pattern observed in all three slurries suggests the formation of aggregates. The most significant reduction observed in the 5 wt.% SCA slurry indicates the highest occurrence of aggregates. The formation of these aggregates increases the average inter-particle distance in the slurry, resulting in fewer scattering events and a decrease in backscattering values.
The Turbiscan Stability Index (TSI) of the slurries with varying SCA content was measured and summarized in Figure 8.
After 24 hours, the TSI values of the slurries with 2, 5, 10, and 20 wt.% SCA were approximately 1.0, 16.0, 4.0, and 2.0, respectively. The TSI values followed the trend of 5 > 10 > 20 > 2 wt.%. The TSI value for the 5 wt.% SCA slurry increased sharply after 4 hours, whereas the slurries with 2, 10, and 20 wt.% SCA showed a gradual increase over 24 hours. The sudden increase in TSI indicates the occurrence of particle aggregation and sedimentation.
3.5. Photocuring Behavior of Al2O3 Slurry
The photocuring behavior of the photocurable Al2O3 slurry depending on the SCA content is presented in Figure 9 and Table 1.
As the exposure time increased at the same SCA content, the maximum heat flow (ΔQmax), curing enthalpy (ΔH), and conversion (%) generally increased. However, the maximum values were observed when the specimen with 5 wt.% SCA was exposed for 4.8 seconds. The 5 wt.% SCA slurry was relatively agglomerated, which extended the mean free path of the photons. Therefore, as the depth of cure increased during the photopolymerization reaction, the highest values of maximum heat flow (ΔQmax), curing enthalpy (ΔH), and conversion (%) were obtained.
The slurries with 2 wt.% and 20 wt.% SCA exhibited lower photocuring rates. The analysis of the slurries revealed that the well-dispersed Al2O3 particles caused scattering during the photopolymerization reaction, reducing the depth of cure. Consequently, these slurries showed relatively lower maximum heat flow (ΔQmax) and curing enthalpy (ΔH) values. The slurry with 10 wt.% SCA had a relatively longer mean free path due to the presence of larger aggregates, resulting in higher maximum heat flow (ΔQmax) and curing enthalpy (ΔH) values compared to the 2 wt.% slurry, but lower than those of the 20 wt.% slurry.
3.6. 3D Printing Behavior and Internal Structure Analysis of Al2O3 Acrylate Composites
The printing behavior of the photocurable Al2O3 slurry depending on the SCA content is summarized in Figure 10, Figure 11, Figure 12 and Figure 13.
The slurry containing 2 wt.% SCA failed to adhere to the build platform under all exposure time conditions, resulting in failed fabrication. This phenomenon occurred because the photocuring reaction was inefficient, weakening the chain polymerization structure of the MPTMS-modified Al2O3 slurry and preventing the formation of the Al2O3 acrylate composite.
In contrast, the slurry containing 5 wt.% SCA formed a thin Al2O3 acrylate composite at a primary exposure time of 5 seconds. However, under all other exposure times, a normal Al2O3 acrylate composite was formed, leading to successful fabrication over a wide range. Due to the highest photocuring rate of the slurry, the MPTMS-modified Al2O3 slurry formed a strong network during the photopolymerization reaction, successfully forming the Al2O3 acrylate composite under all exposure conditions.
For the 10 wt.% SCA slurry, the Al2O3 acrylate composite was printed only at a primary exposure time of 5 seconds. For the 20 wt.% SCA slurry, the Al2O3 acrylate composite was formed at primary exposure times of 10 and 20 seconds. The increased printing area of the Al2O3 acrylate composite with the 20 wt.% SCA slurry as exposure time increased suggests that the re-adsorption phenomenon, caused by oscillatory absorption, was more prominent.
The internal structure of the specimens fabricated by 3D printing was examined via micro-CT, as shown in Figure 14.
The Al2O3 acrylate composite with 2 wt.% SCA could not be analyzed due to the extremely thin thickness after failing to adhere to the build platform. The Al2O3 acrylate composite with 5 wt.% SCA showed a stable internal structure with no cracks and high density. Cracks were observed in the Al2O3 acrylate composites with 10 and 20 wt.% SCA. The specimen with 10 wt.% SCA exhibited larger cracks than that with 20 wt.% SCA.
The internal structure of the printed Al2O3 acrylate composite is significantly influenced by the SCA adsorption isotherm and slurry dispersion behavior. The 5 wt.% SCA Al2O3 acrylate composite, with optimal dispersion, exhibited the most stable internal structure due to uniform photopolymerization during printing. The 20 wt.% SCA Al2O3 acrylate composite, with a higher adsorption amount than the 10 wt.% SCA, formed stronger bonds between the alumina and SCA, resulting in fewer cracks and a more stable internal structure.
4. Conclusions
This comprehensive study highlights the critical role of SCA concentration in determining the stability, rheology, and printability of Al₂O₃-acrylate composite slurries, with the 5 wt.% SCA concentration emerging as the most optimal for achieving stable and robust printed structures.MPTMS was successfully adsorbed onto the surface of Al₂O₃, forming Al-O-Si and Si-O-Si bonds. The highest adsorption was observed at the 20 wt.% MPTMS concentration, but due to oscillation adsorption behavior, the adsorption amount did not increase proportionally with the added amount.The rheological properties of the slurry varied significantly depending on the MPTMS concentration. At 2 wt.% and 5 wt.% concentrations, the slurries exhibited a wide linear viscoelastic region (LVR) and formed a strong gel structure. In contrast, at 10 wt.% and 20 wt.% concentrations, the LVR region decreased, indicating reduced resistance to deformation. All slurries exhibited shear-thinning behavior, and as the MPTMS concentration increased, the dispersion effect of the Al₂O₃ powder improved, resulting in lower slurry viscosity.The dispersion stability experiments showed that the 2 wt.% MPTMS concentration provided the most stable dispersion with minimal sedimentation. However, at concentrations above 5 wt.%, particle aggregation and sedimentation became more pronounced.The photocuring reaction rate varied with the MPTMS concentration, with the highest photocuring rate observed at 5 wt.%. This was attributed to the increased light transmittance due to particle aggregation. In contrast, at the 2 wt.% concentration, the increased light scattering caused by dispersed fine particles led to a decrease in the photocuring rate.The success rate and quality of 3D printing were significantly influenced by the MPTMS concentration. The 5 wt.% MPTMS slurry formed stable, high-density structures and showed the best printing results. At the 2 wt.% concentration, the slurry did not adhere well to the substrate during printing, resulting in printing failure. At concentrations of 10 wt.% or higher, internal cracks occurred, leading to structural defects.
Author Contributions
Conceptualization, K.S.H and U.S.K; Methodology, K.H.R..; Formal Analysis, J.H.K. and J.H.C.; Writing –Original Draft Preparation, K.H.R; Writing – Review & Editing, K.S.H.; Project Administration, J.H.K.; Funding Acquisition, U.S.K.
Funding
This work was supported by the Technology Innovation Program (20025022, Development of Refractory Raw Materials with Superior Li-Corrosion Resistance using Fusion, Sintering, Nano Hybrid technology) funded By the Ministry of Trade, Industry & Energy (MOTIE, Korea).
Conflicts of Interest
Authors declare no conflict of interest.
References
- Bose, S.; Akdogan, E.K.; Balla, V.K.; Ciliveri, S.; Colombo, P.; Franchin, G.; Ku, N.; Kushram, P.; Niu, F.; Pelz, J.; et al. 3D printing of ceramics: Advantages, challenges, applications, and perspectives. J. Am. Ceram. Soc. 2024, 1–42. [Google Scholar] [CrossRef]
- Zakeri, S.; Vippola, M.; Levänen, E. A comprehensive review of the photopolymerization of ceramic resins used in stereolithography. Addit. Manuf. 2020, 35, 101177. [Google Scholar] [CrossRef]
- de Camargo, I.L.; Morais, M.M.; Fortulan, C.A.; Branciforti, M.C. A review on the rheological behavior and formulations of ceramic suspensions for vat photopolymerization. Ceram. Int. 2021, 47, 11906–11921. [Google Scholar] [CrossRef]
- Cesarano III, J.; Aksay, I.A. Processing of highly concentrated aqueous α-alumina suspensions stabilized with polyelectrolytes. J. Am. Ceram. Soc. 1998, 71, 1062–1067. [Google Scholar] [CrossRef]
- Singh, B.P.; Menchavez, R.; Takai, C.; Fuji, M.; Takahashi, M. Stability of dispersions of colloidal alumina particles in aqueous suspensions, J. Colloid Interface Sci. 2005, 291, 181–186. [Google Scholar] [CrossRef] [PubMed]
- Sukthavorn, K.; Phengphon, N.; Nootsuwan, N.; Jantaratana, P.; Veranitisagul, C.; Laobuthee, A. Effect of silane coupling on the properties of polylactic acid/barium ferrite magnetic composite filament for the 3D printing process. J. Appl. Polym. Sci. 2021, 138, e50965. [Google Scholar] [CrossRef]
- Liu, Y.; Cheng, L.; Li, H.; Li, Q.; Shi, Y.; Liu, F.; Wu, Q.; Liu, S. Formation mechanism of stereolithography of Si3N4 slurry using silane coupling agent as modifier and dispersant. Ceram. Int. 2020, 46, 14583–14590. [Google Scholar] [CrossRef]
- Song, S.Y.; Park, M.S.; Lee, J.W.; Yun, J.S. A Study on the rheological and mechanical properties of photo-curable ceramic/polymer composites with different silane coupling agents for SLA 3D printing technology. Nanomaterials. 2018, 8, 93. [Google Scholar] [CrossRef] [PubMed]
- Liu, T.; Wang, Y.; Zhang, H.; Chen, F.; Fu, Q. Competition of hydrolysis, self-polymerization and graft coupling for n-dodecyltrimethoxysilane modified Al2O3 under non-catalytic conditions, Appl. Surf. Sci. 2023, 607, 154985. [Google Scholar] [CrossRef]
- Plueddemann, E.P. Silane Coupling Agents, 2nd ed.; Plenum Press: New York, USA, 1991; pp. 31–54. [Google Scholar]
- Indumathy, B.; Sathiyanathan, P.; Prasad, G.; Reza, M.S.; Prabu, A.A.; Kim, H. A Comprehensive review on processing, development and applications of organofunctional silanes and silane-based hyperbranched polymers. Polymers 2023, 15, 2517. [Google Scholar] [CrossRef] [PubMed]
- Xie, Y.; Hill, C.A.S.; Xiao, Z.; Militz, H.; Mai, C. Silane coupling agents used for natural fiber/polymer composites: A review, Compos. Part A-Appl. S. 2010, 41, 806–819. [Google Scholar] [CrossRef]
- Li, H.; Liu, T.; Liu, Y.; Zeng, Q.; Liang, J. 3D printed ceramic slurries with improved solid content through optimization of alumina powder and coupling agent, J. Manuf. Process. 2021, 64, 1206–1213. [Google Scholar] [CrossRef]
- Stanko, M.; Stommel, M. Kinetic prediction of fast curing polyurehane resins by model-free isoconversional methods. Polymers. 2018, 10, 698. [Google Scholar] [CrossRef] [PubMed]
- Quinton, J.S.; Dastoor, P.C. Modelling the observed oscillations in the adsorption kinetics of propyltrimethoxysilane on iron and aluminium oxide surfaces. Surf. Interface Anal. 2000, 30, 25–28. [Google Scholar] [CrossRef]
- Quinton, J.; Dastoor, P.; Allison, W. PTMS on iron and aluminium oxide surfaces : A study of damped adsorption kinetics. Surf. Sci 1998, 402–404, 66–70. [Google Scholar] [CrossRef]
- Prado, L.A.S.A.; Sriyai, M.; Ghislandi, M.; Barros-Timmons, A.; Schultea, K. Surface modification of alumina nanoparticles with silane coupling agents. J. Braz. Chem. Soc. 2010, 21, 2238–2245. [Google Scholar] [CrossRef]
- Windarsih, A.; Rohman, A.; Irnawati. The use of FTIR spectroscopy combined with pattern recognition and multivariate calibration for rapid authentication of Etawa goat milk from soymilk. Food Res. 2022, 6, 337–344. [Google Scholar] [CrossRef] [PubMed]
- Mengual, O.; Meunier, G.; Cayre, I.; Puech, K.; Snabre, P. Characterisation of instability of concentrated dispersions by a new optical analyser: the turbiscan MA 1000. Colloids Surf. A Physicochem. Eng. Asp. 1999, 152, 111–123. [Google Scholar] [CrossRef]
- Kang, W.; Xu, B.; Wang, Y.; Li, Y.; Shan, X.; An, F.; Liu, J. Stability mechanism of W/O crude oil emulsion stabilized by polymer and surfactant. , Colloids Surf. A Physicochem. Eng. Asp, 2011, 384, 555–560. [Google Scholar] [CrossRef]
- Mengual, O.; Meunier, G.; Cayre, I.; Puech, K.; Snabre, P. Turbiscan MA 2000: multiple light scattering measurement for concentrated emulation and suspension instability analysis. , Talanta, 1999, 50, 445–456. [Google Scholar] [CrossRef] [PubMed]
Figure 1.
Thermogravimetric analysis of Al2O3 powders treated with various concentrations of SCA.
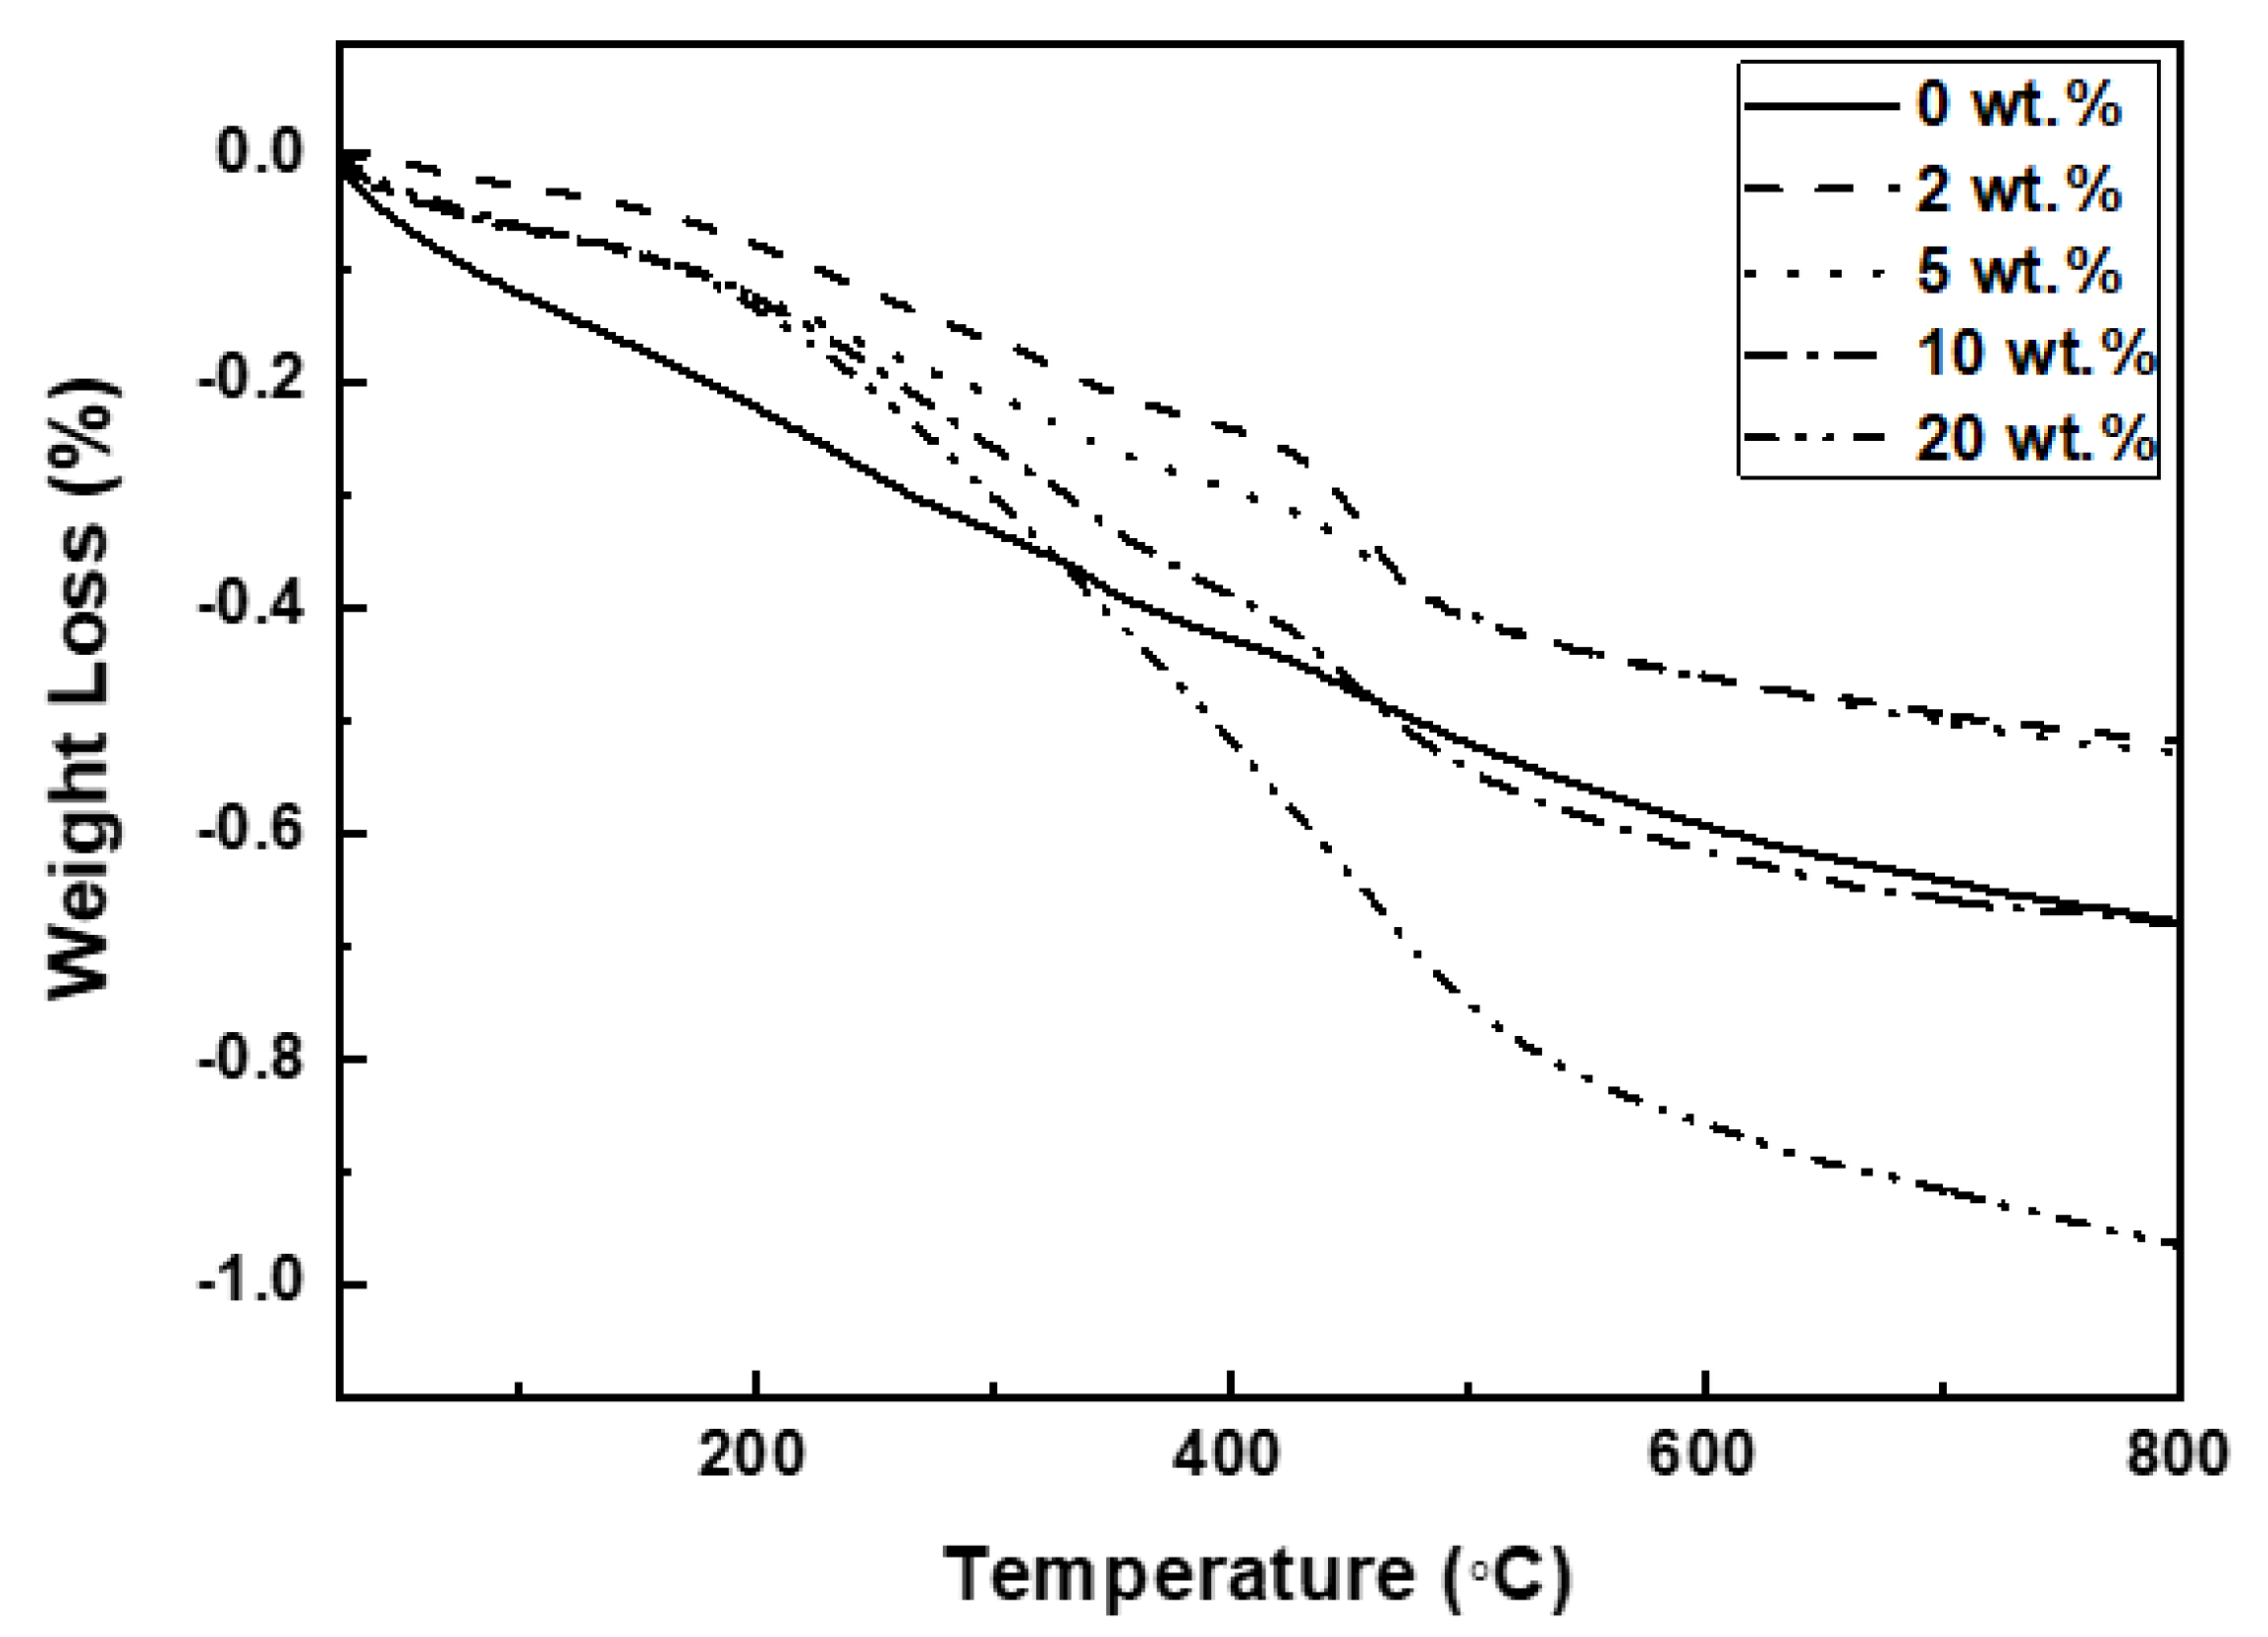
Figure 2.
Weight loss of Al2O3 powders treated with various concentrations of SCA.
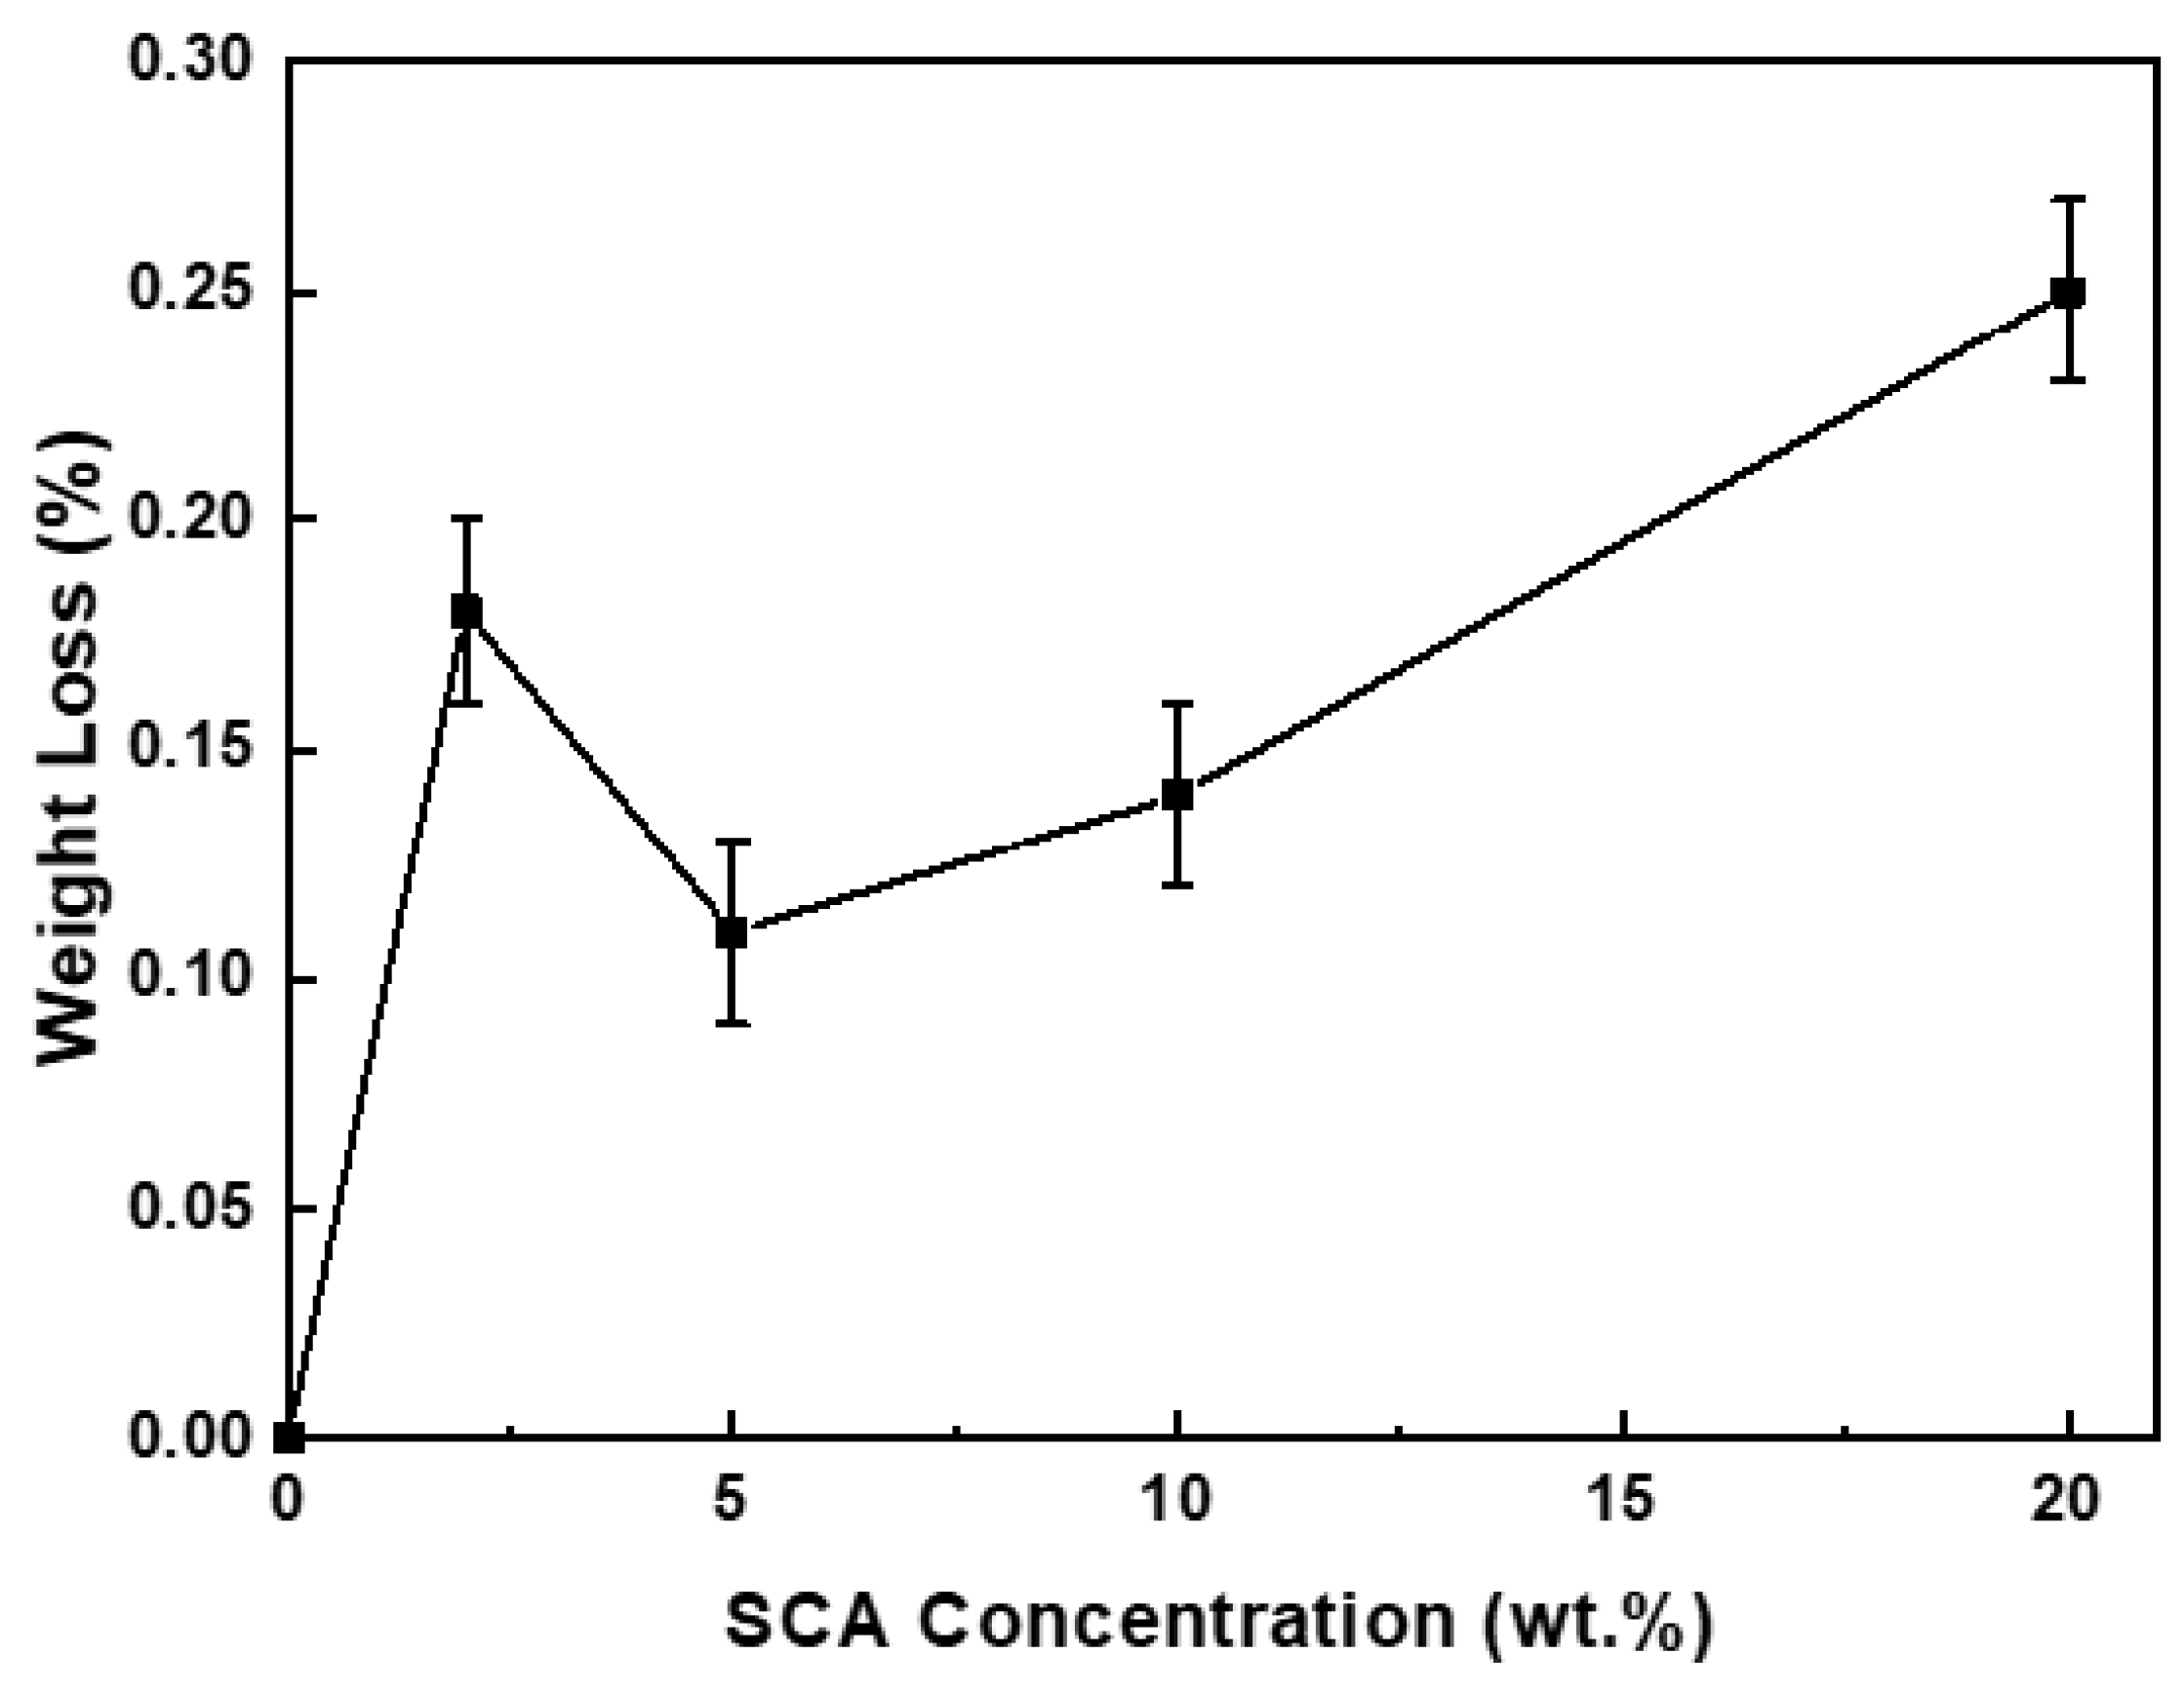
Figure 3.
FT-IR spectra of as-received and SCA treated Al2O3 powders.
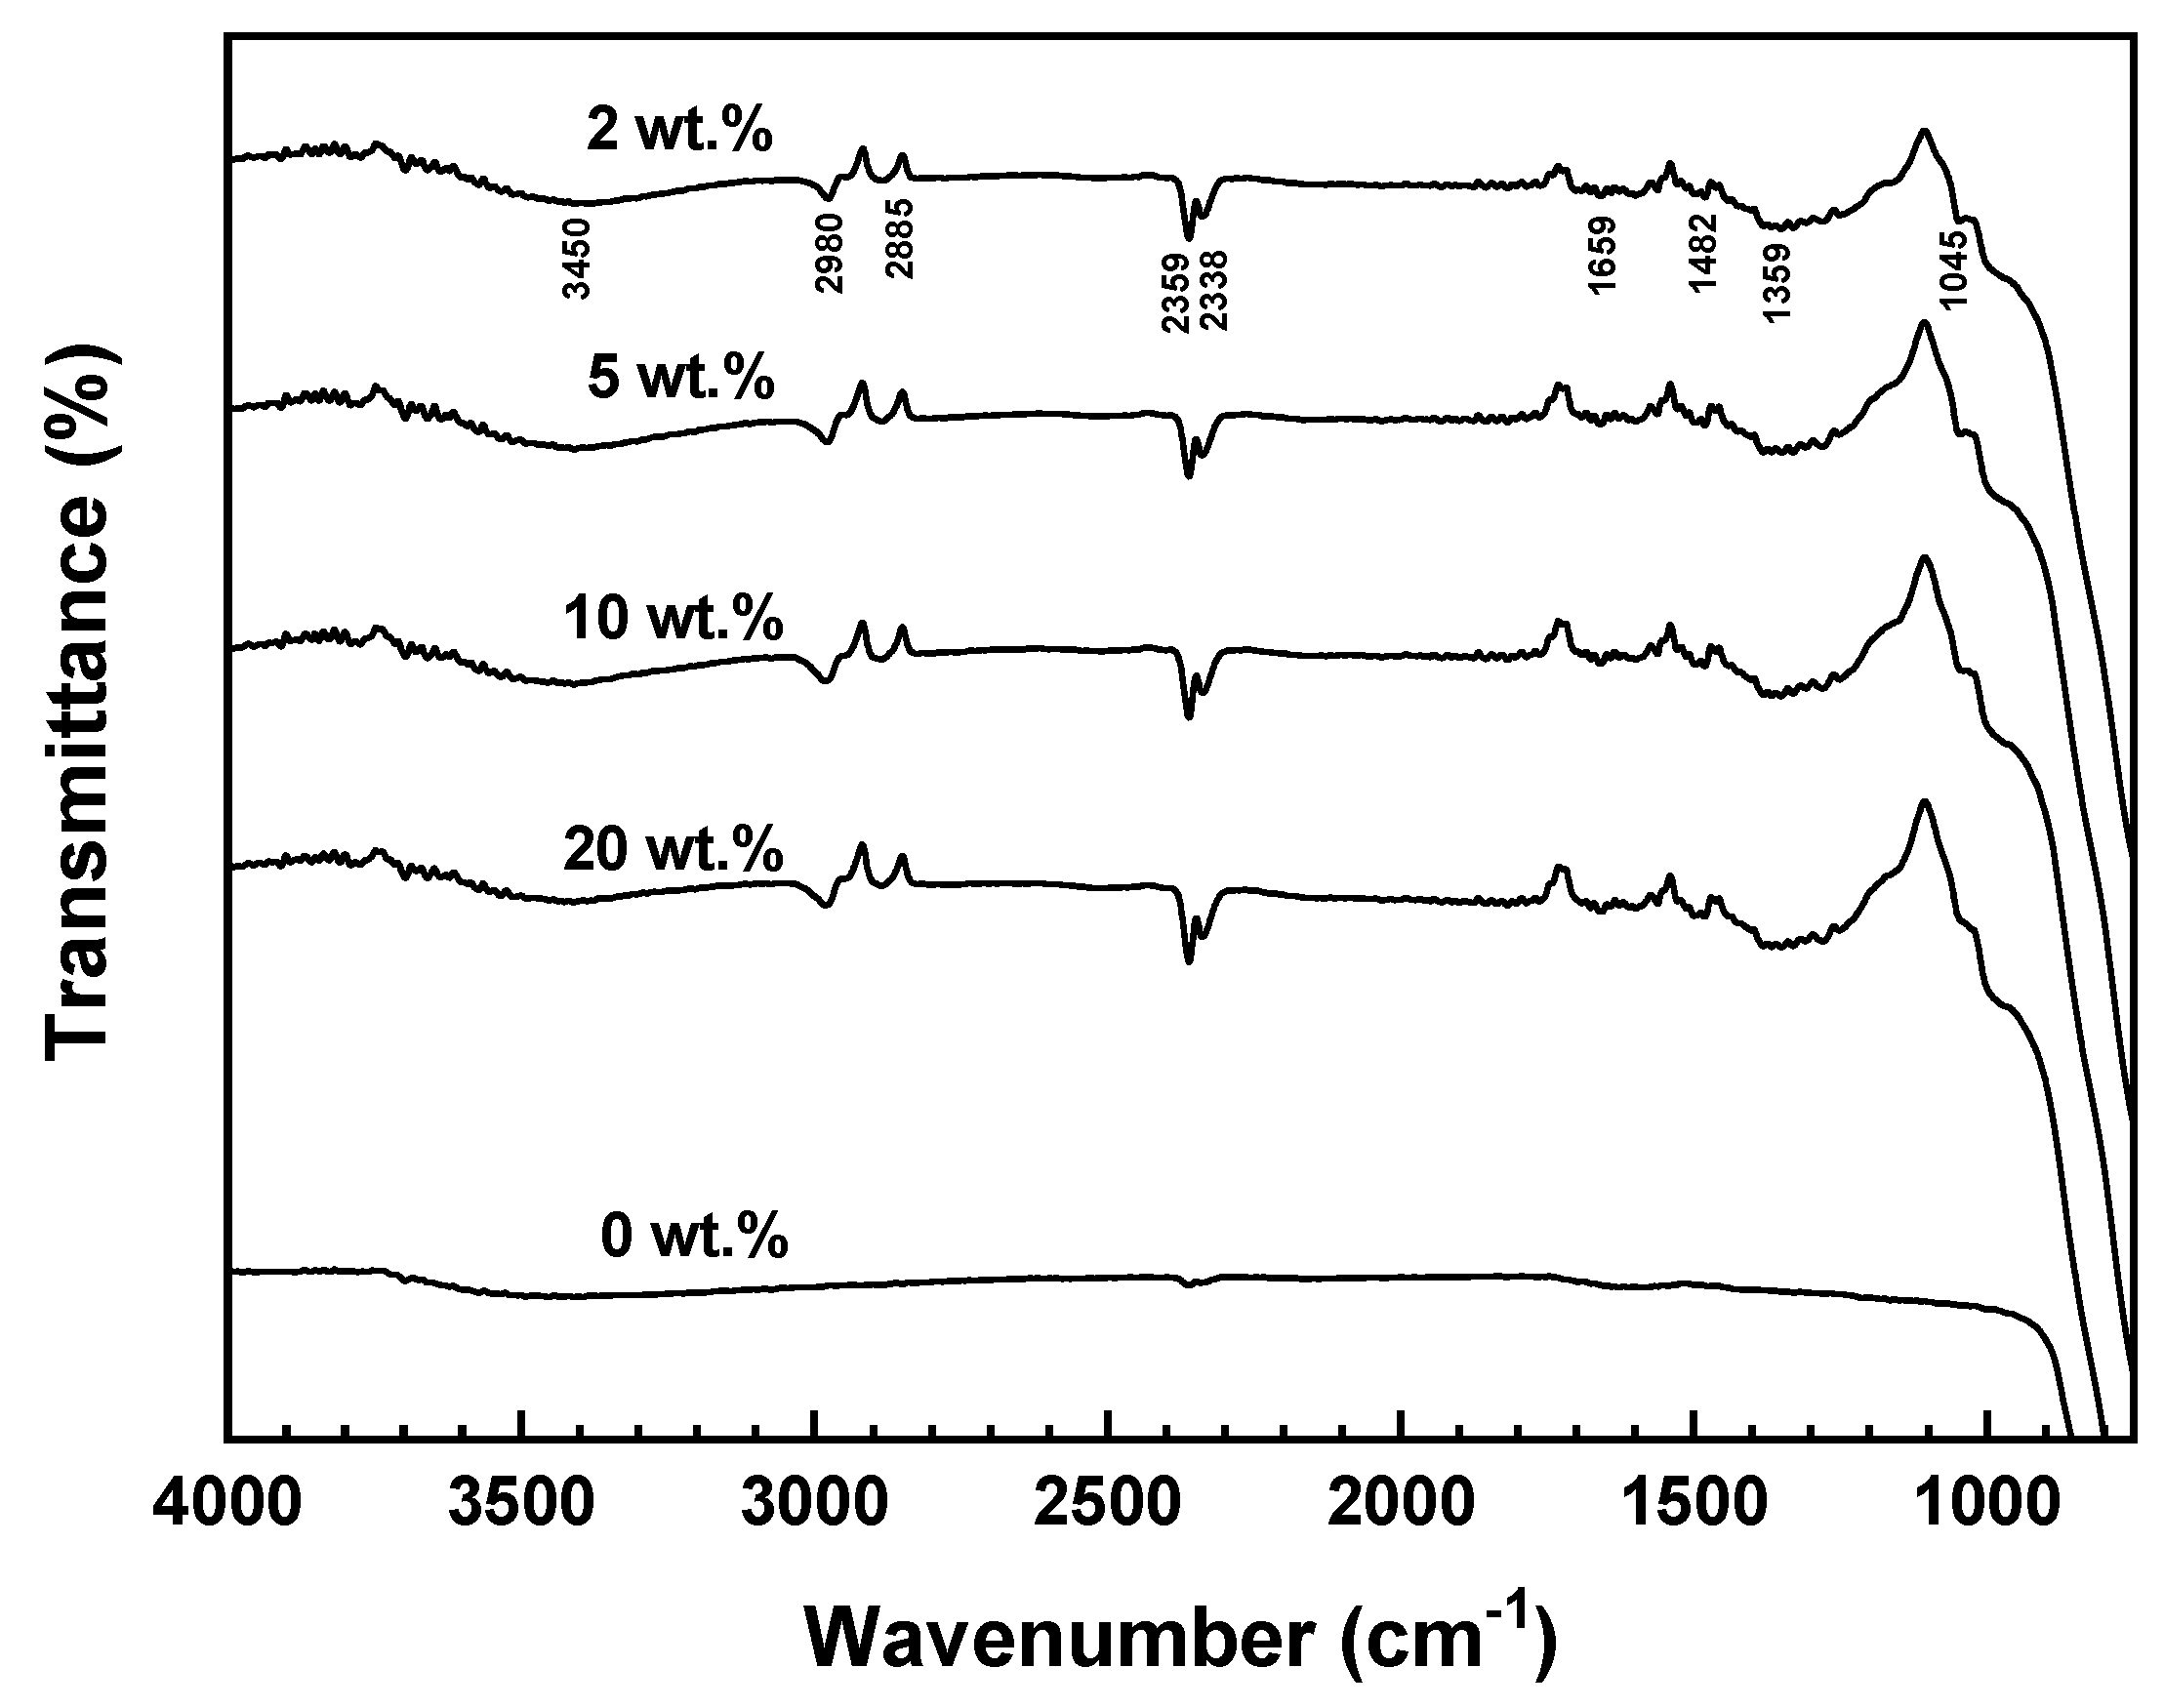
Figure 4.
Results of amplitude sweep test for the Al2O3 slurries with different SCA concentrations; (a) 2 wt.%, (b) 5 wt.%, (c) 10 wt.%, and (d) 20 wt.%.
Figure 4.
Results of amplitude sweep test for the Al2O3 slurries with different SCA concentrations; (a) 2 wt.%, (b) 5 wt.%, (c) 10 wt.%, and (d) 20 wt.%.
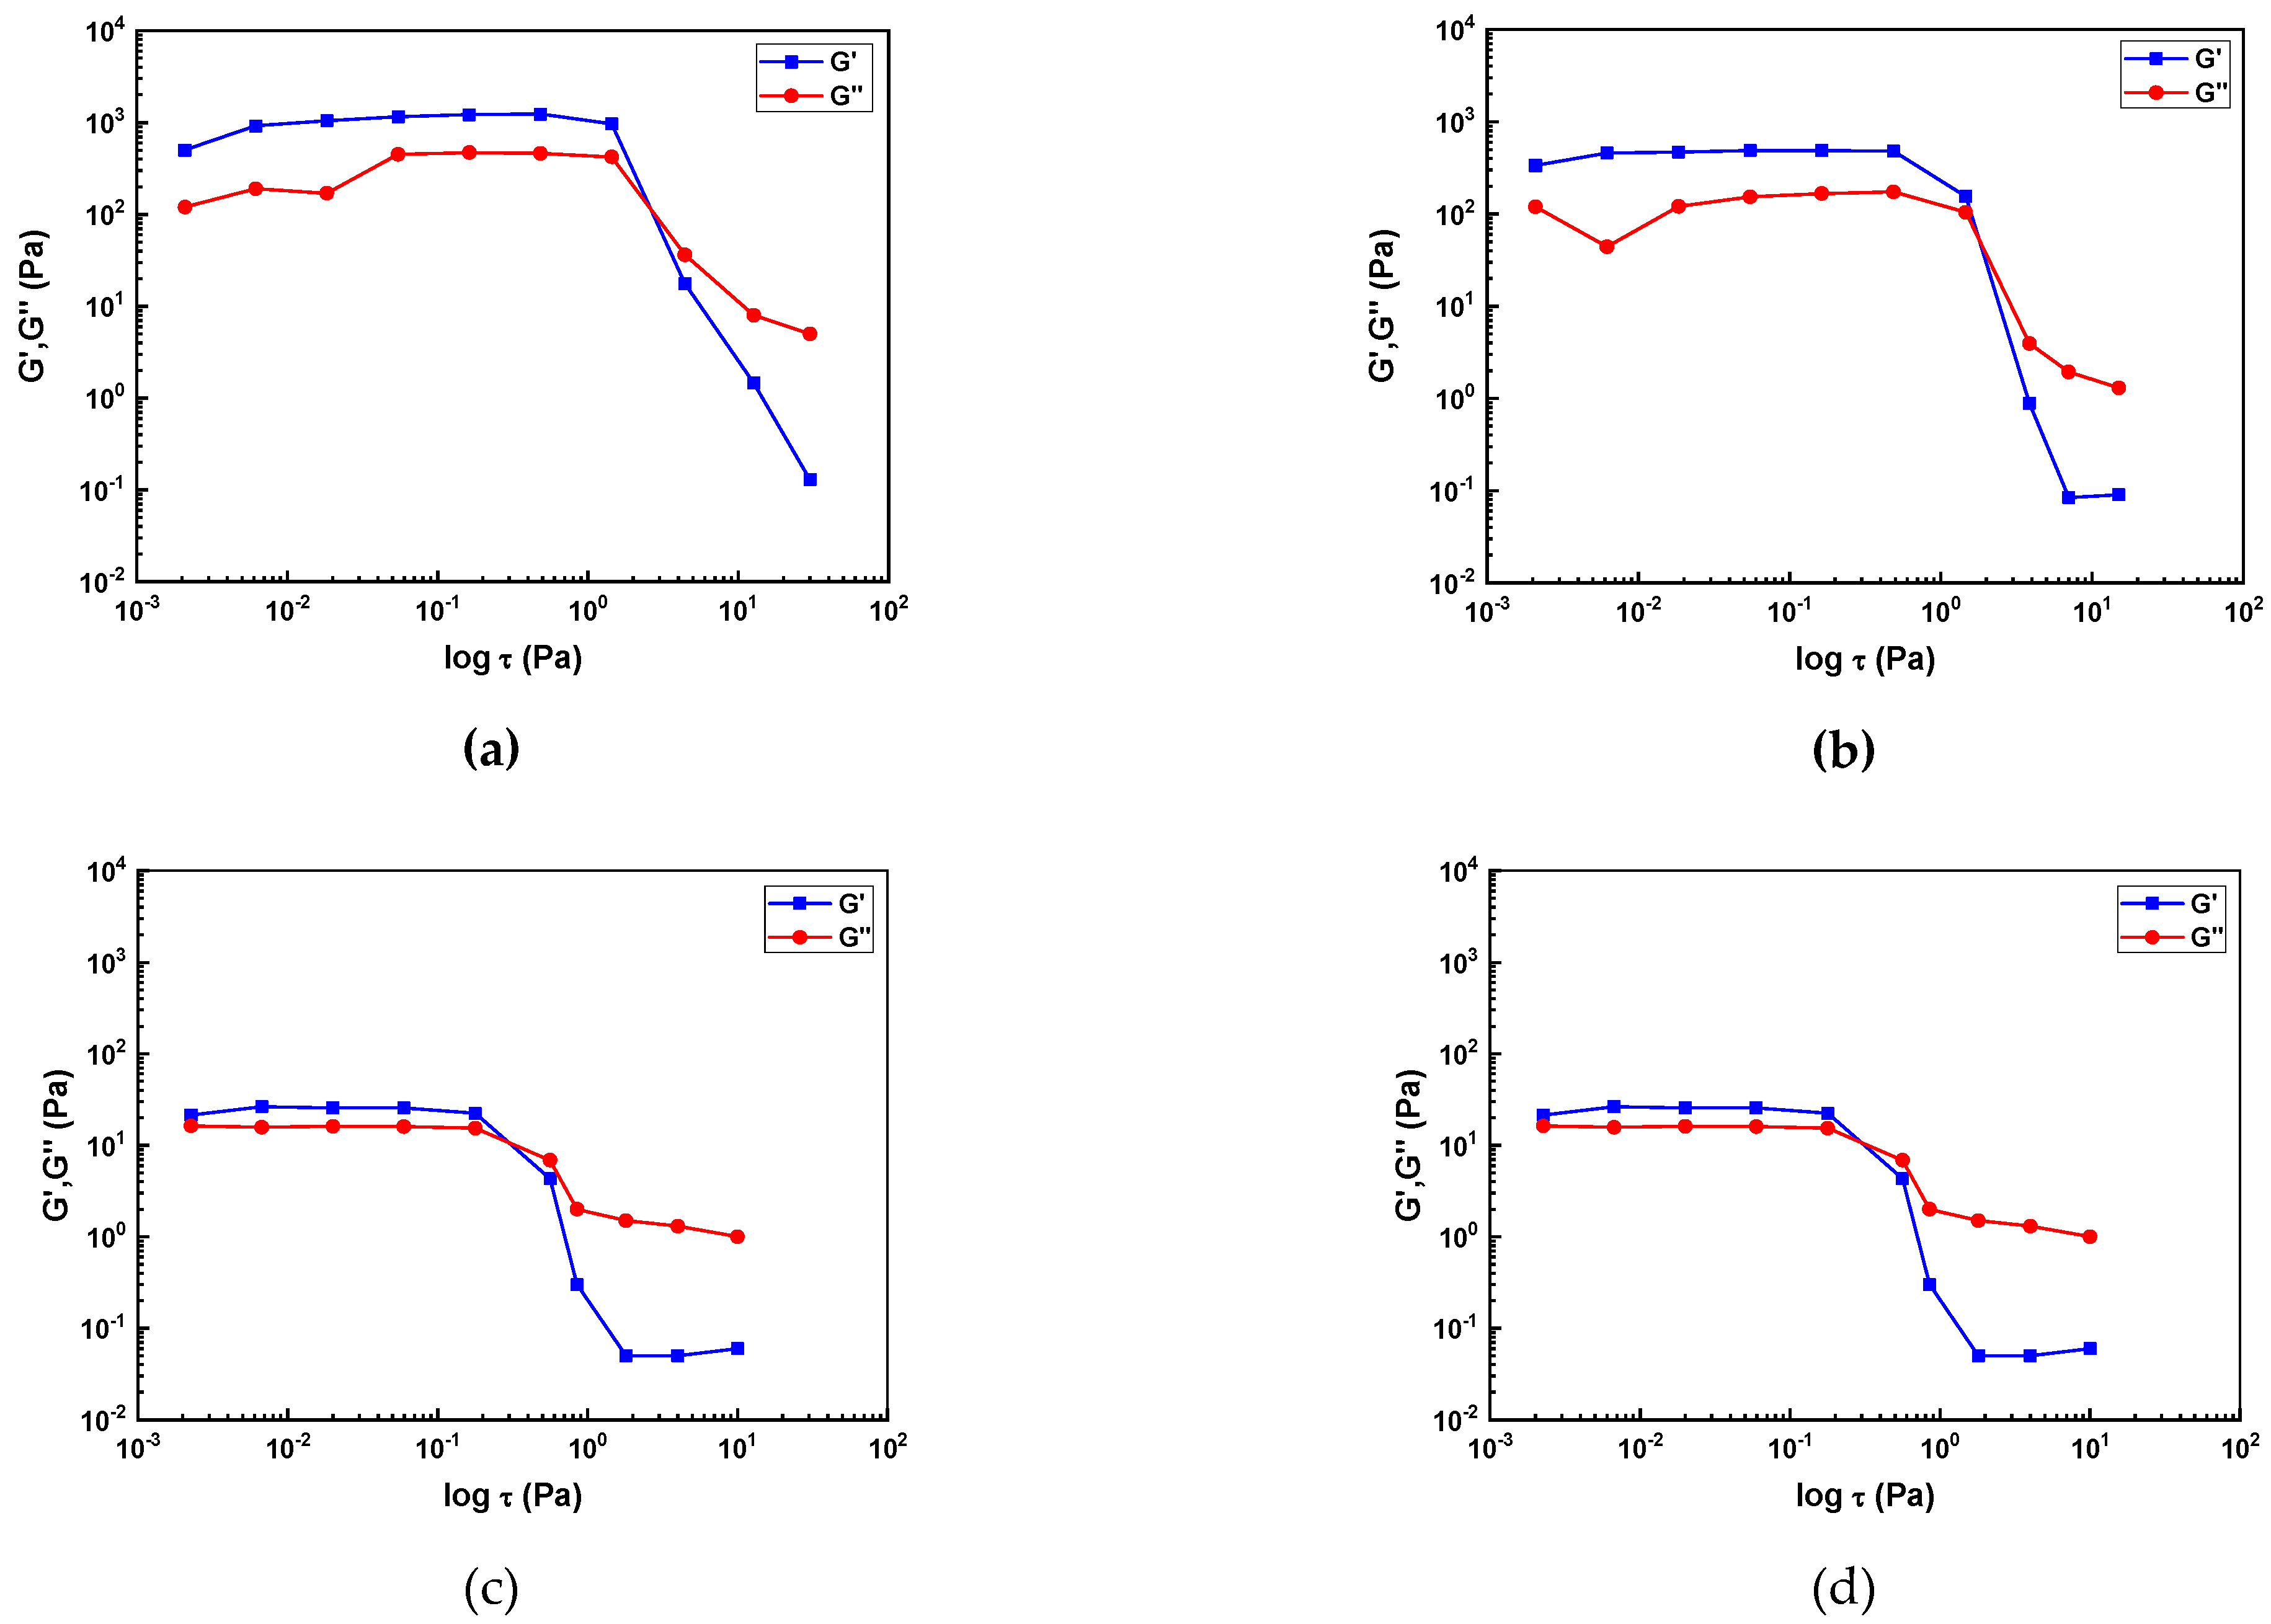
Figure 5.
Results of frequency sweep test for the Al2O3 slurries with different SCA concentrations; (a) 2 wt.%, (b) 5 wt.%, (c) 10 wt.%, and (d) 20 wt.%.
Figure 5.
Results of frequency sweep test for the Al2O3 slurries with different SCA concentrations; (a) 2 wt.%, (b) 5 wt.%, (c) 10 wt.%, and (d) 20 wt.%.
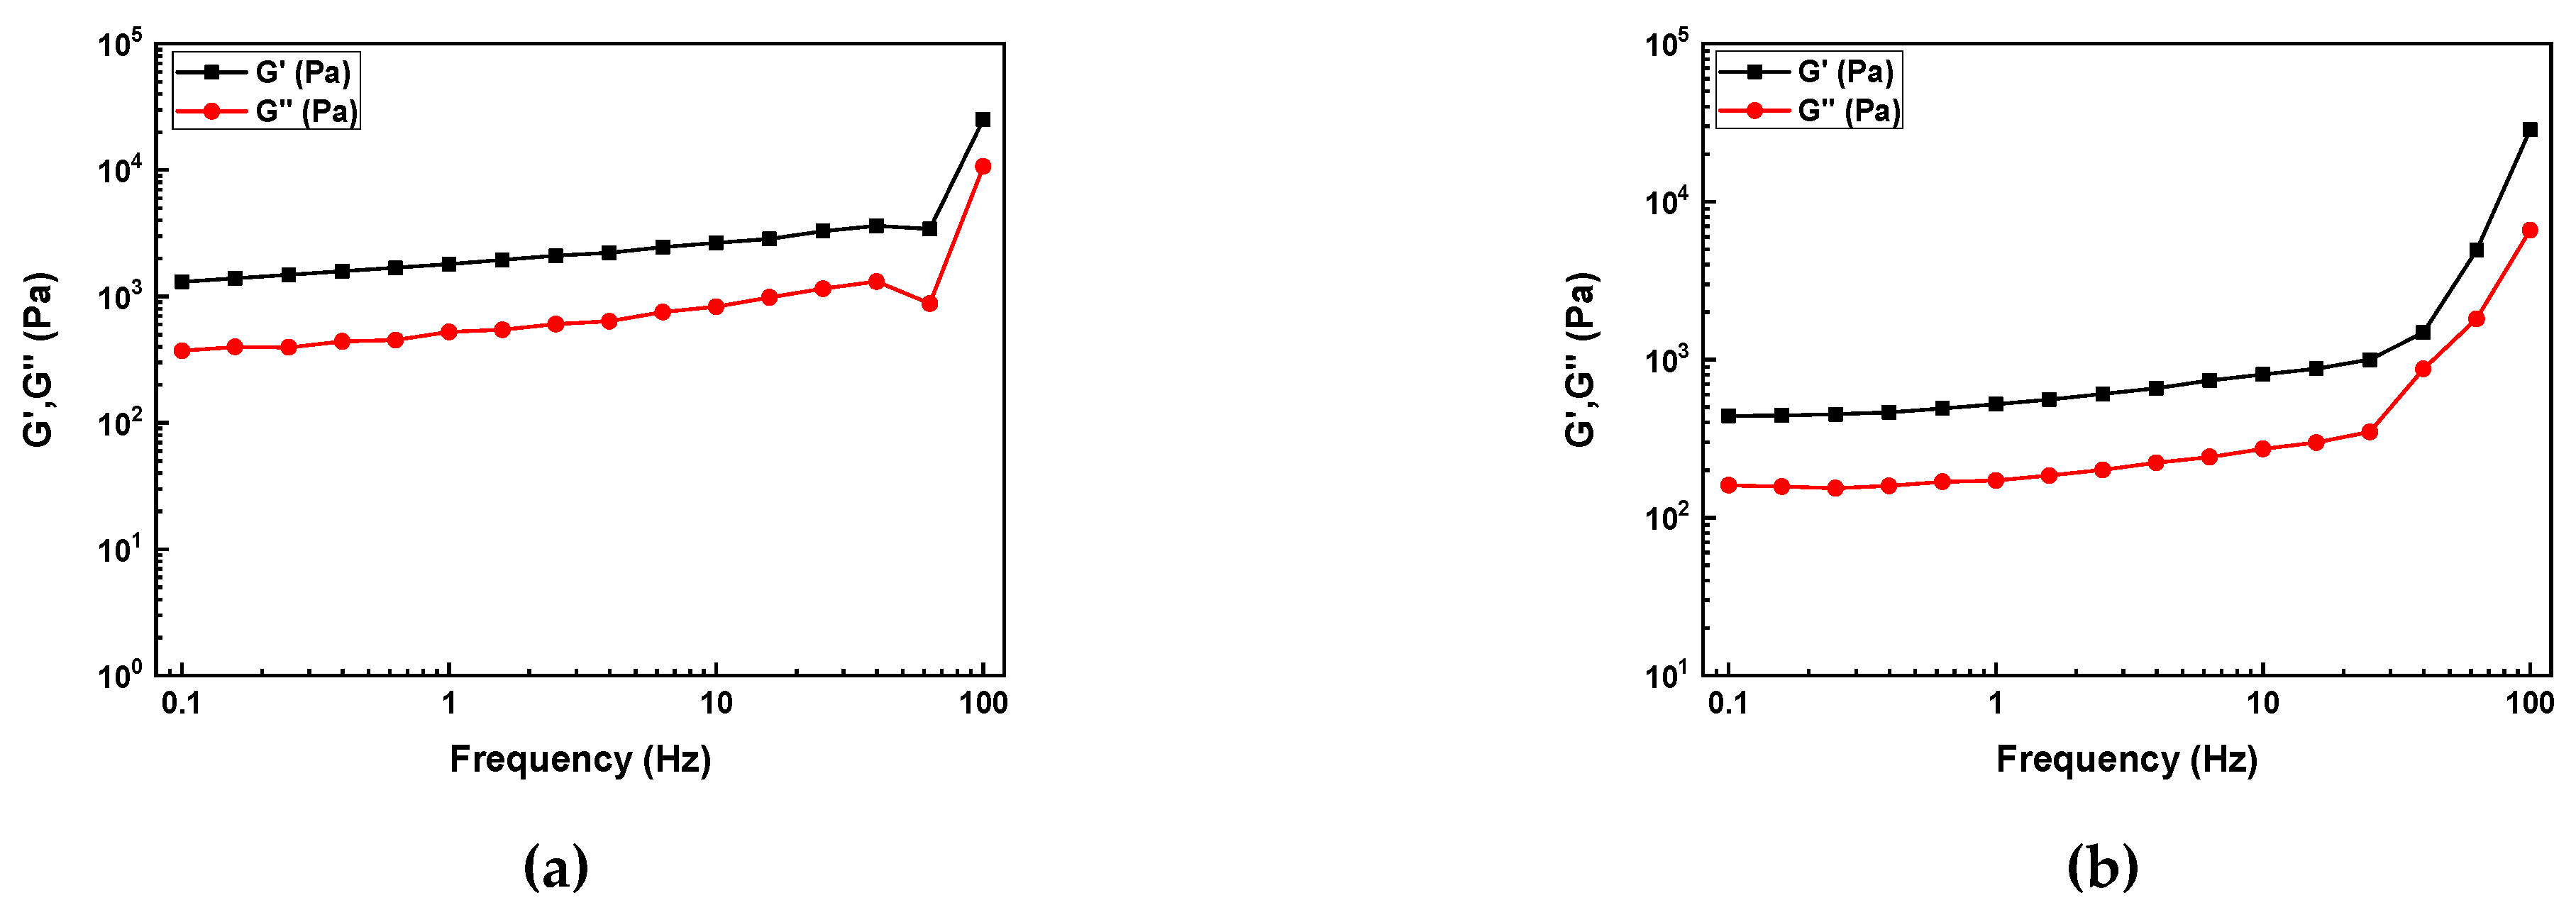
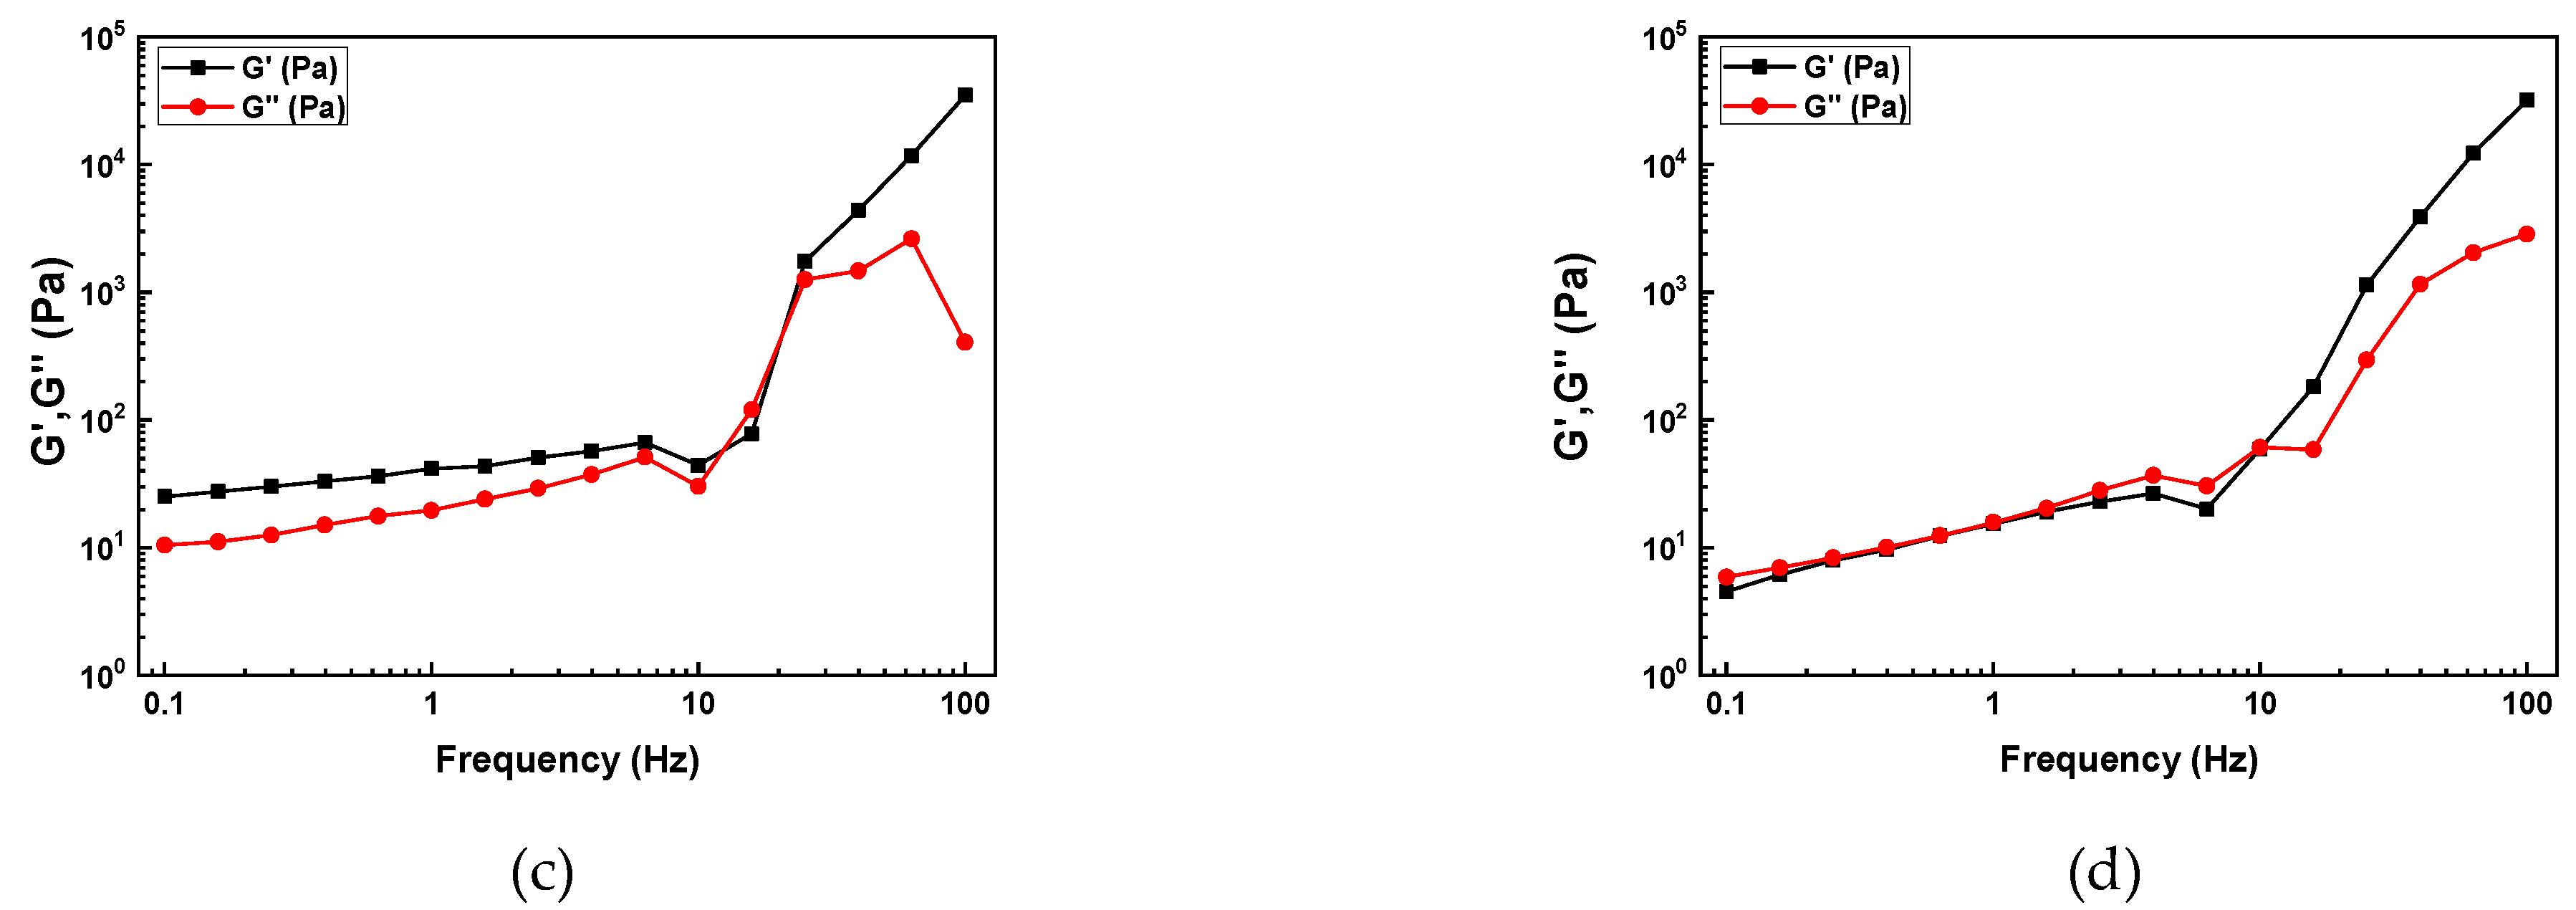
Figure 6.
Influence of SCA concentration on the rheological properties of photocurable Al2O3 slurries; (a) tan δ value as a function of oscillation frequency, and (b) apparent viscosity.
Figure 6.
Influence of SCA concentration on the rheological properties of photocurable Al2O3 slurries; (a) tan δ value as a function of oscillation frequency, and (b) apparent viscosity.
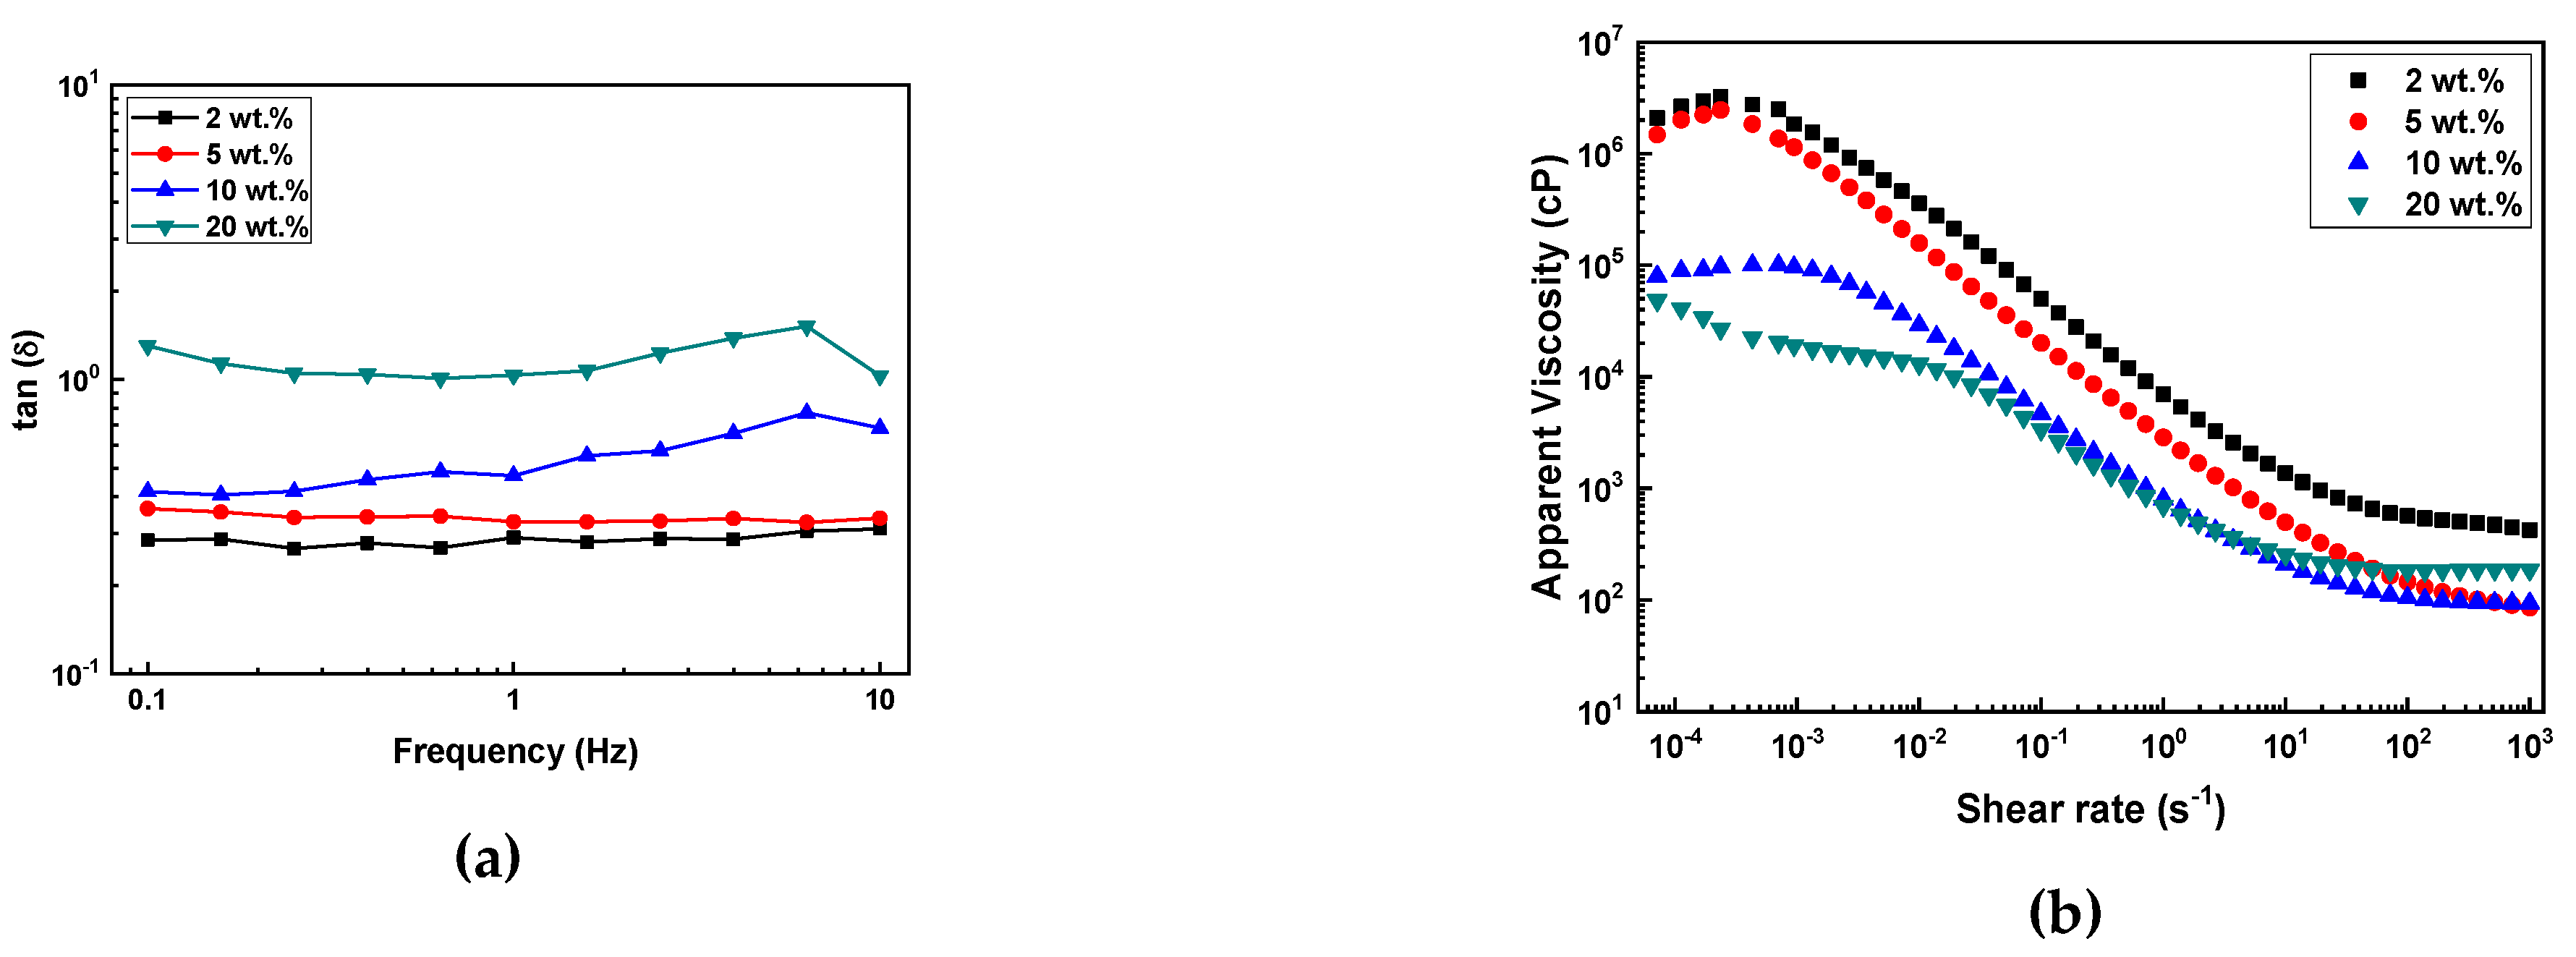
Figure 7.
Backscattering profile of photocurable Al2O3 slurries with different SCA concentrations; (a) 2 wt.%, (b) 5 wt.%, (c) 10 wt.%, and (d) 20 wt.%.
Figure 7.
Backscattering profile of photocurable Al2O3 slurries with different SCA concentrations; (a) 2 wt.%, (b) 5 wt.%, (c) 10 wt.%, and (d) 20 wt.%.
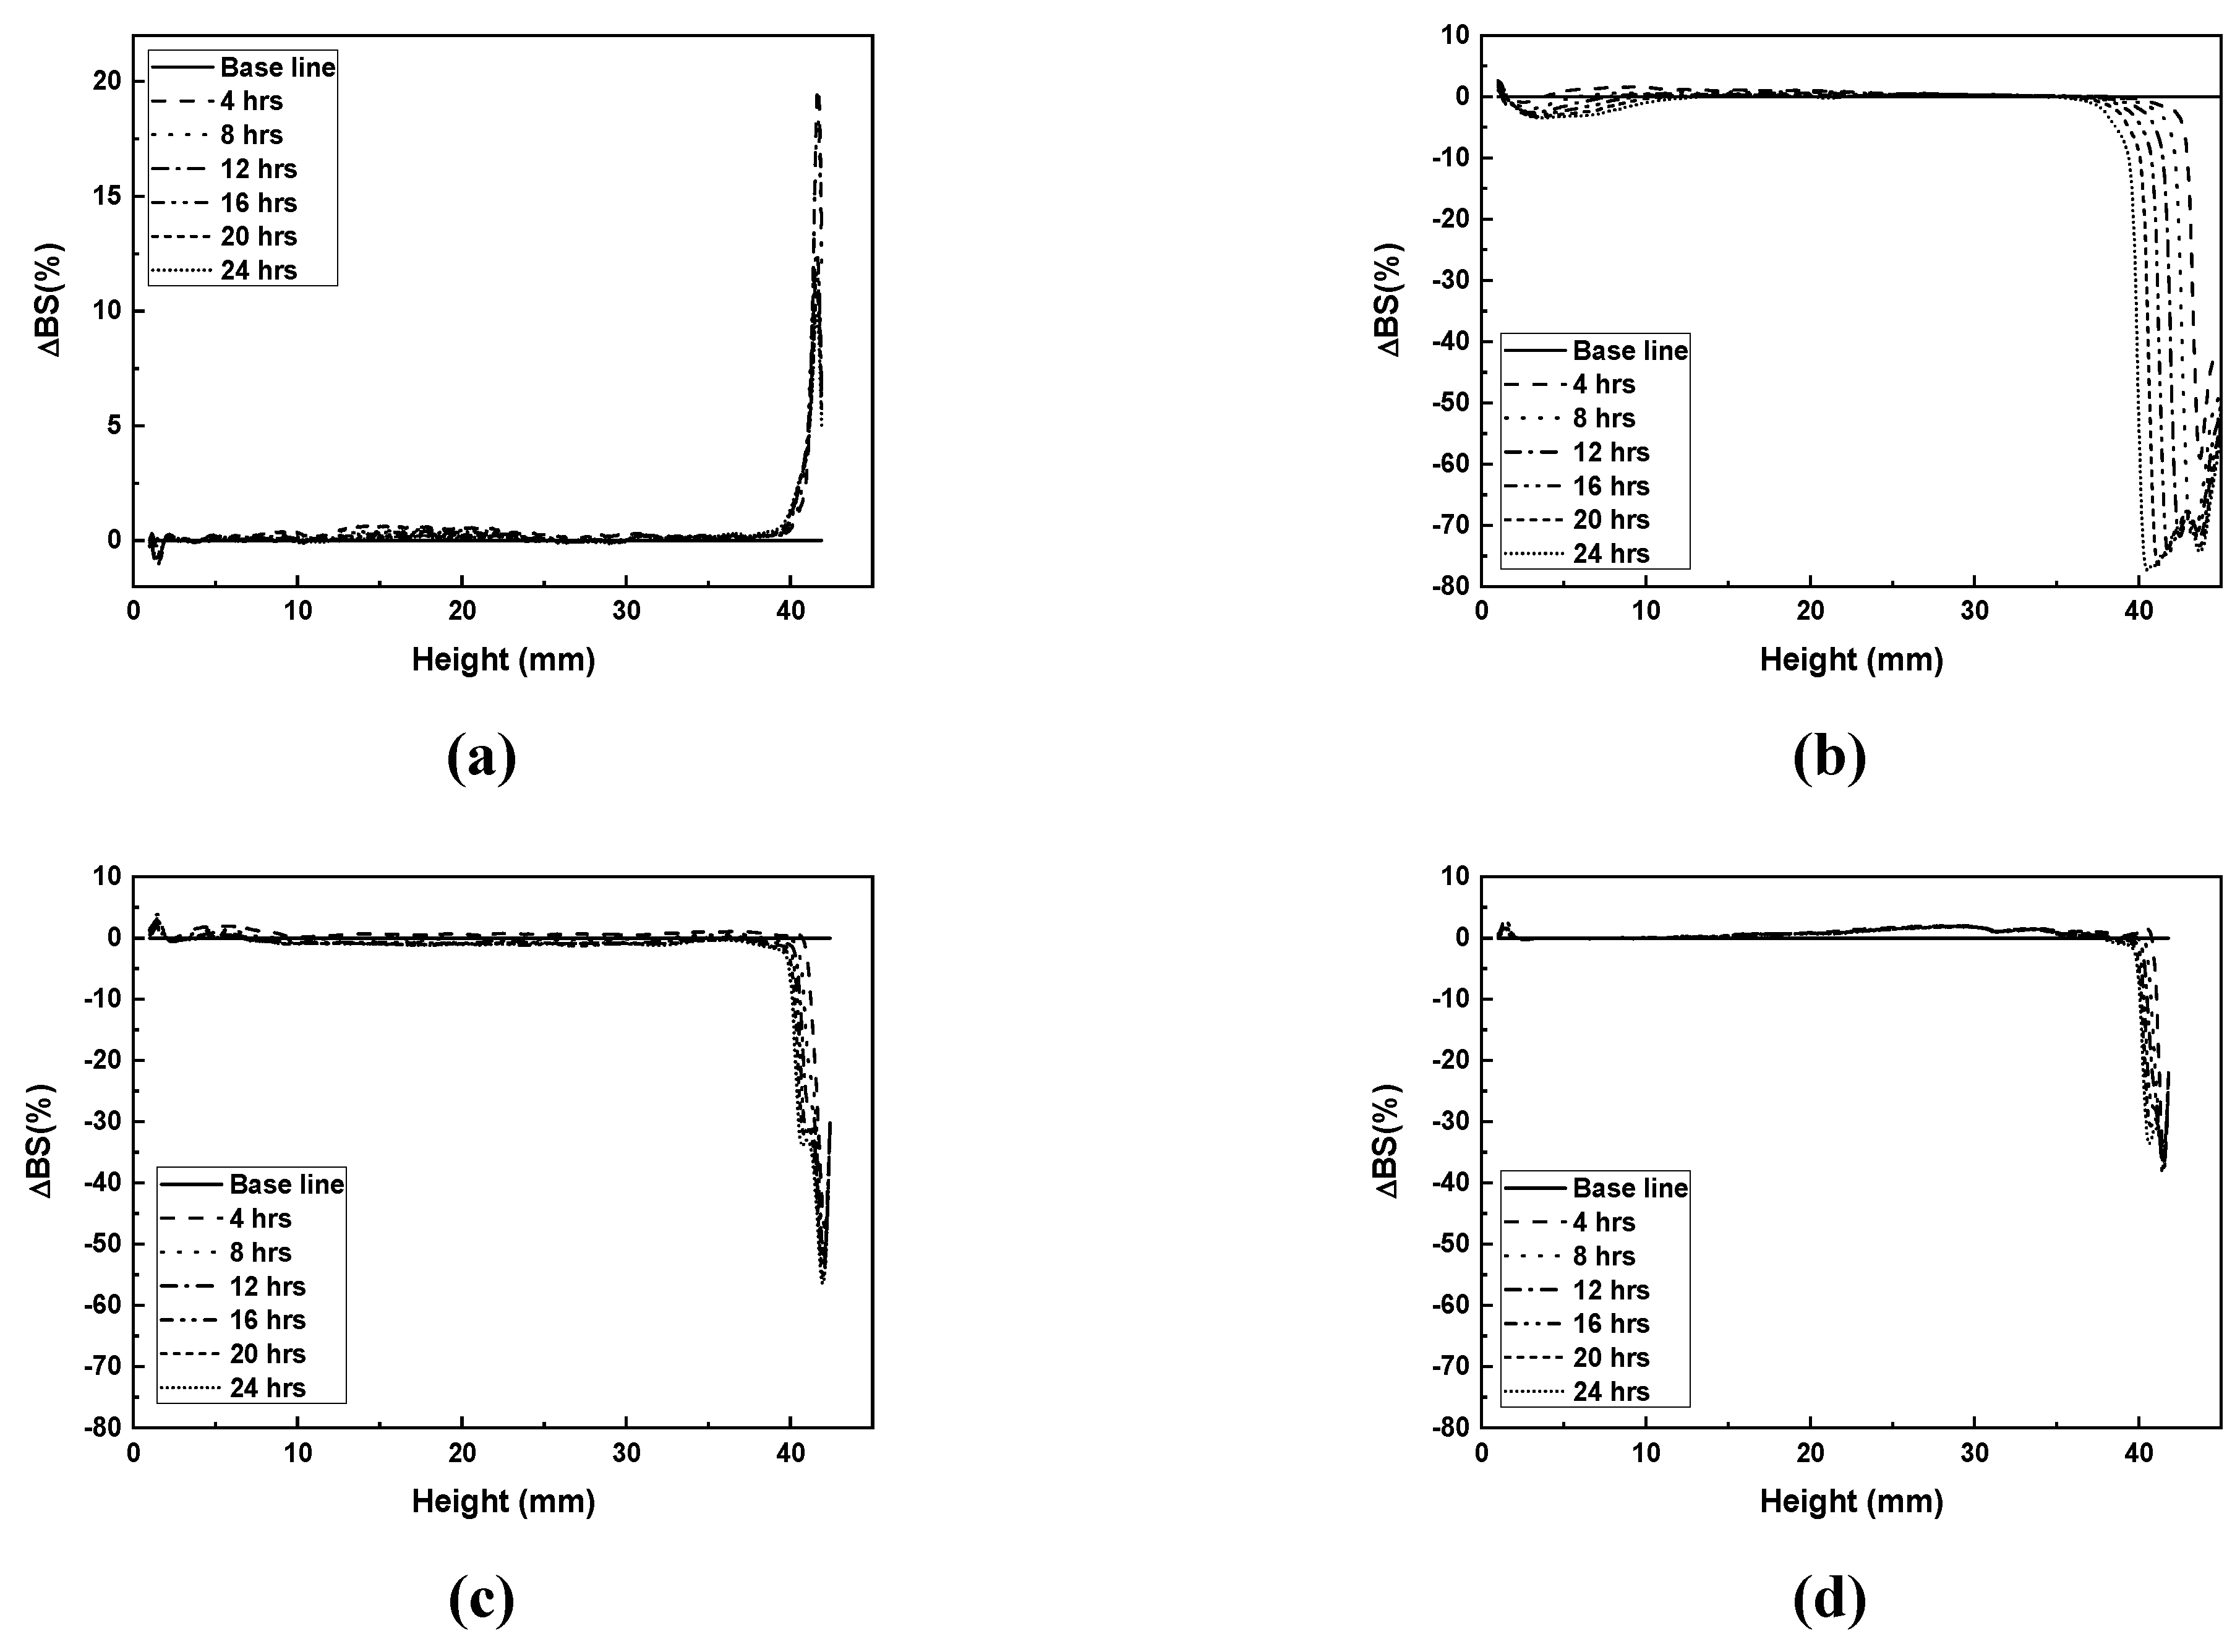
Figure 8.
TSI curves of photocurable Al2O3 slurries with different SCA concentrations.
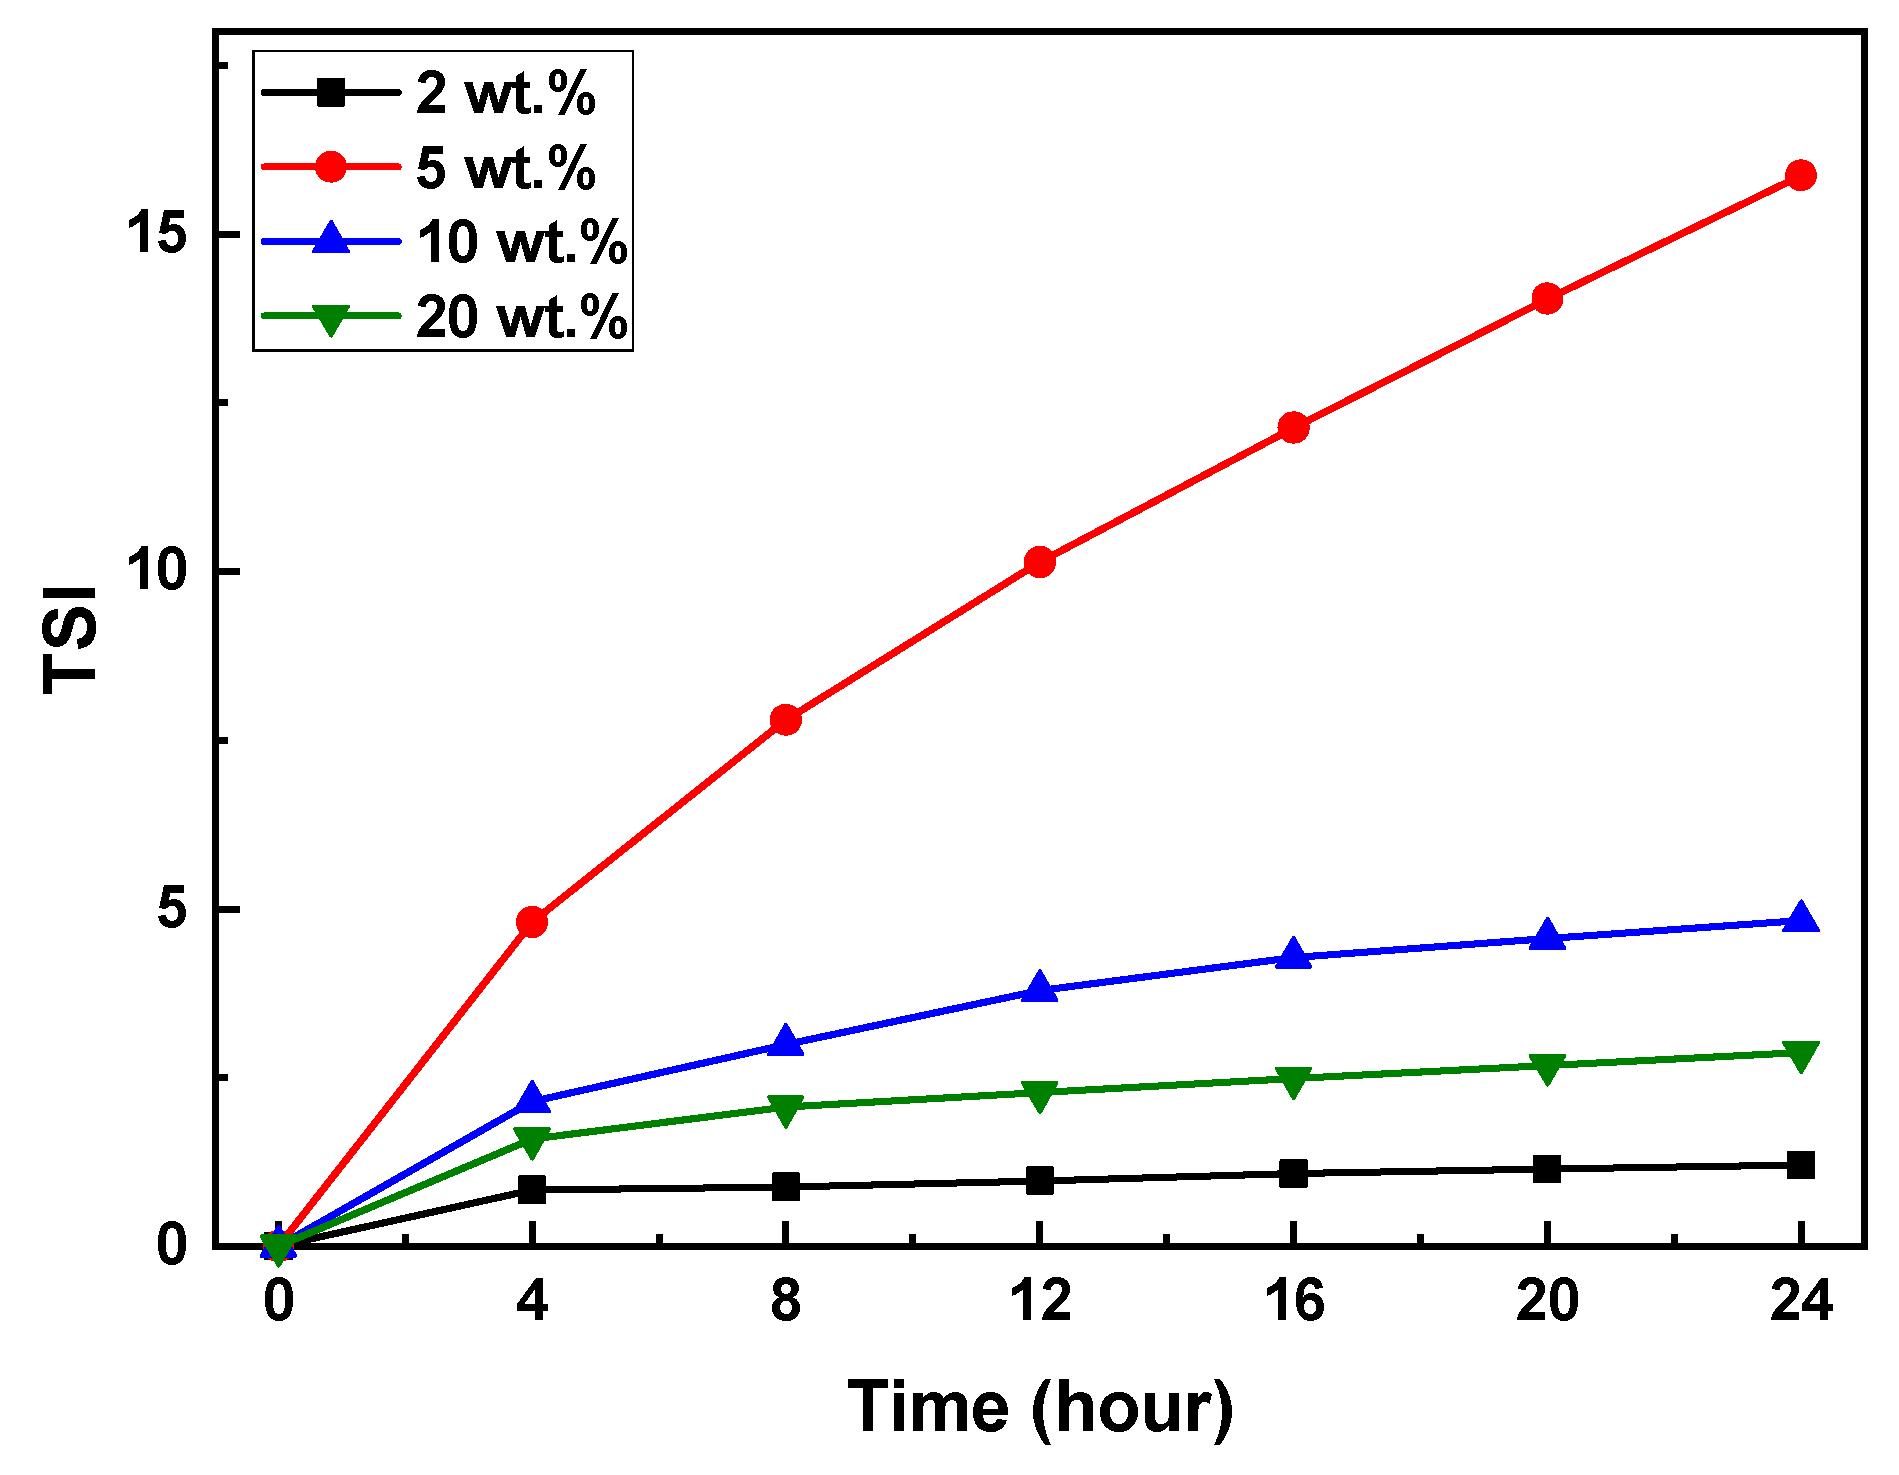
Figure 9.
Heat flow and conversion of photocurable Al2O3 slurries with different SCA concentrations; (a) SCA 2 wt.%, (b) SCA 5 wt.%, (c) SCA 10 wt.%, and (d) SCA 20 wt.%.
Figure 9.
Heat flow and conversion of photocurable Al2O3 slurries with different SCA concentrations; (a) SCA 2 wt.%, (b) SCA 5 wt.%, (c) SCA 10 wt.%, and (d) SCA 20 wt.%.
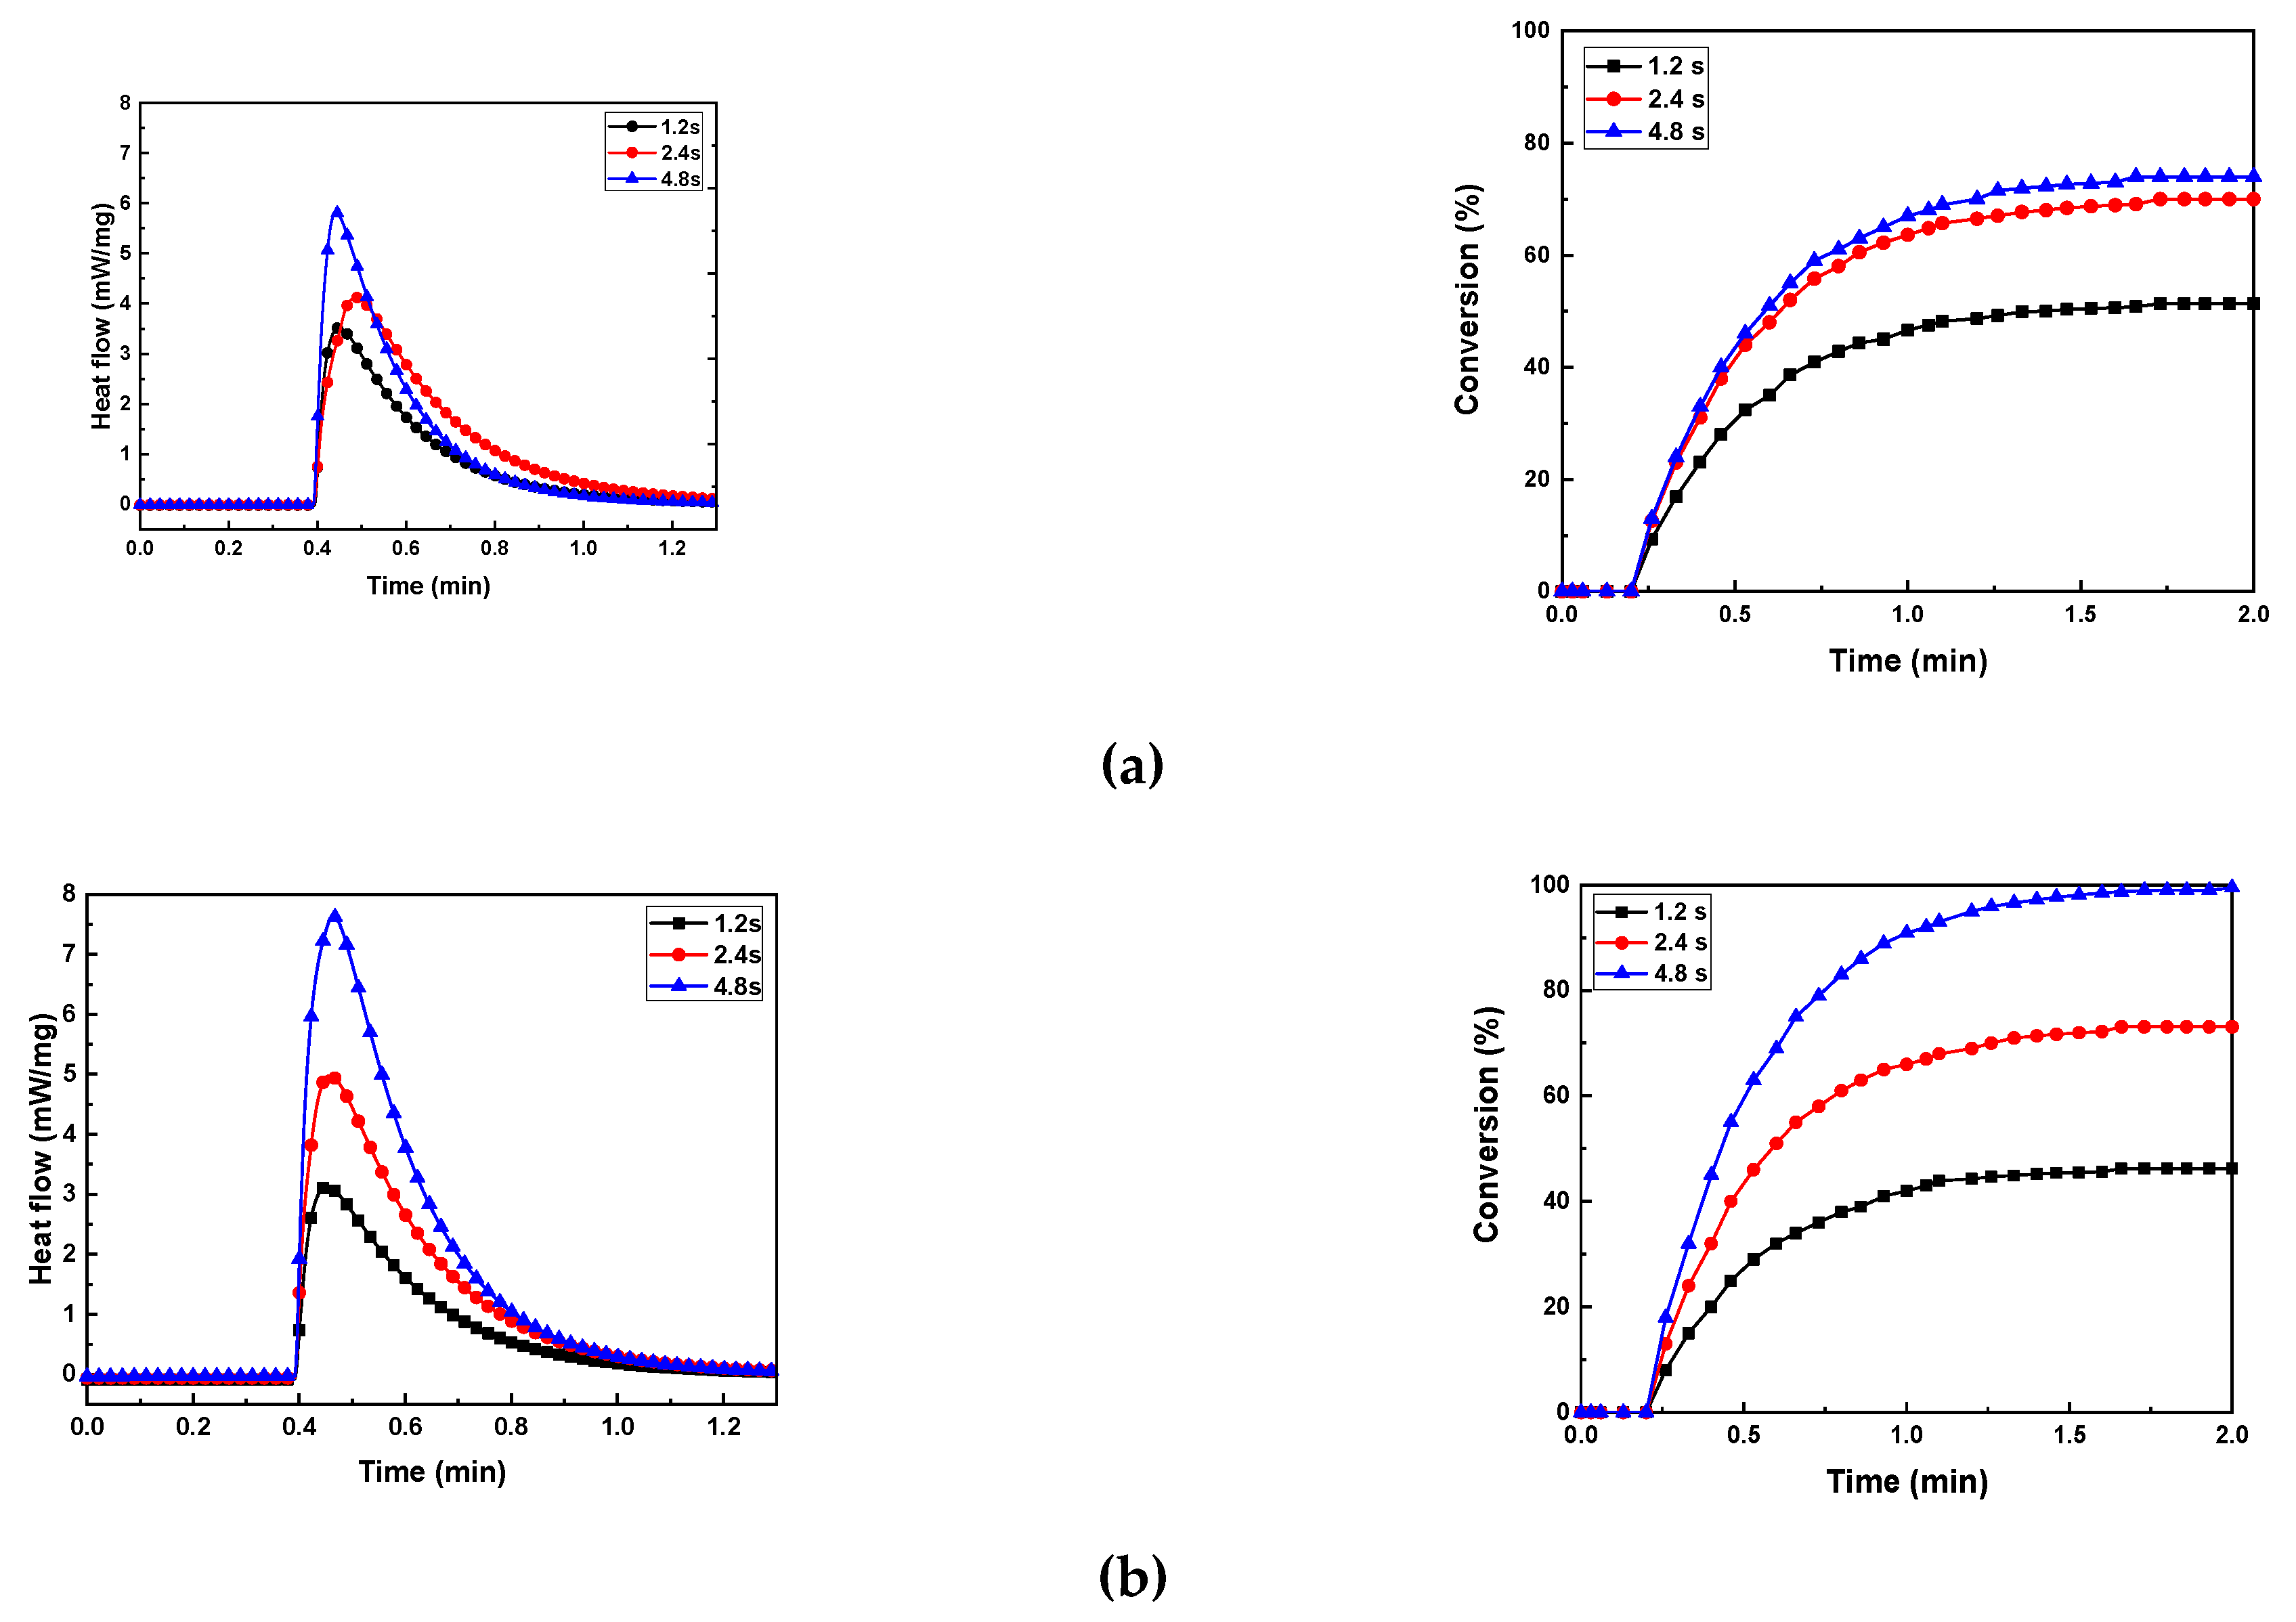
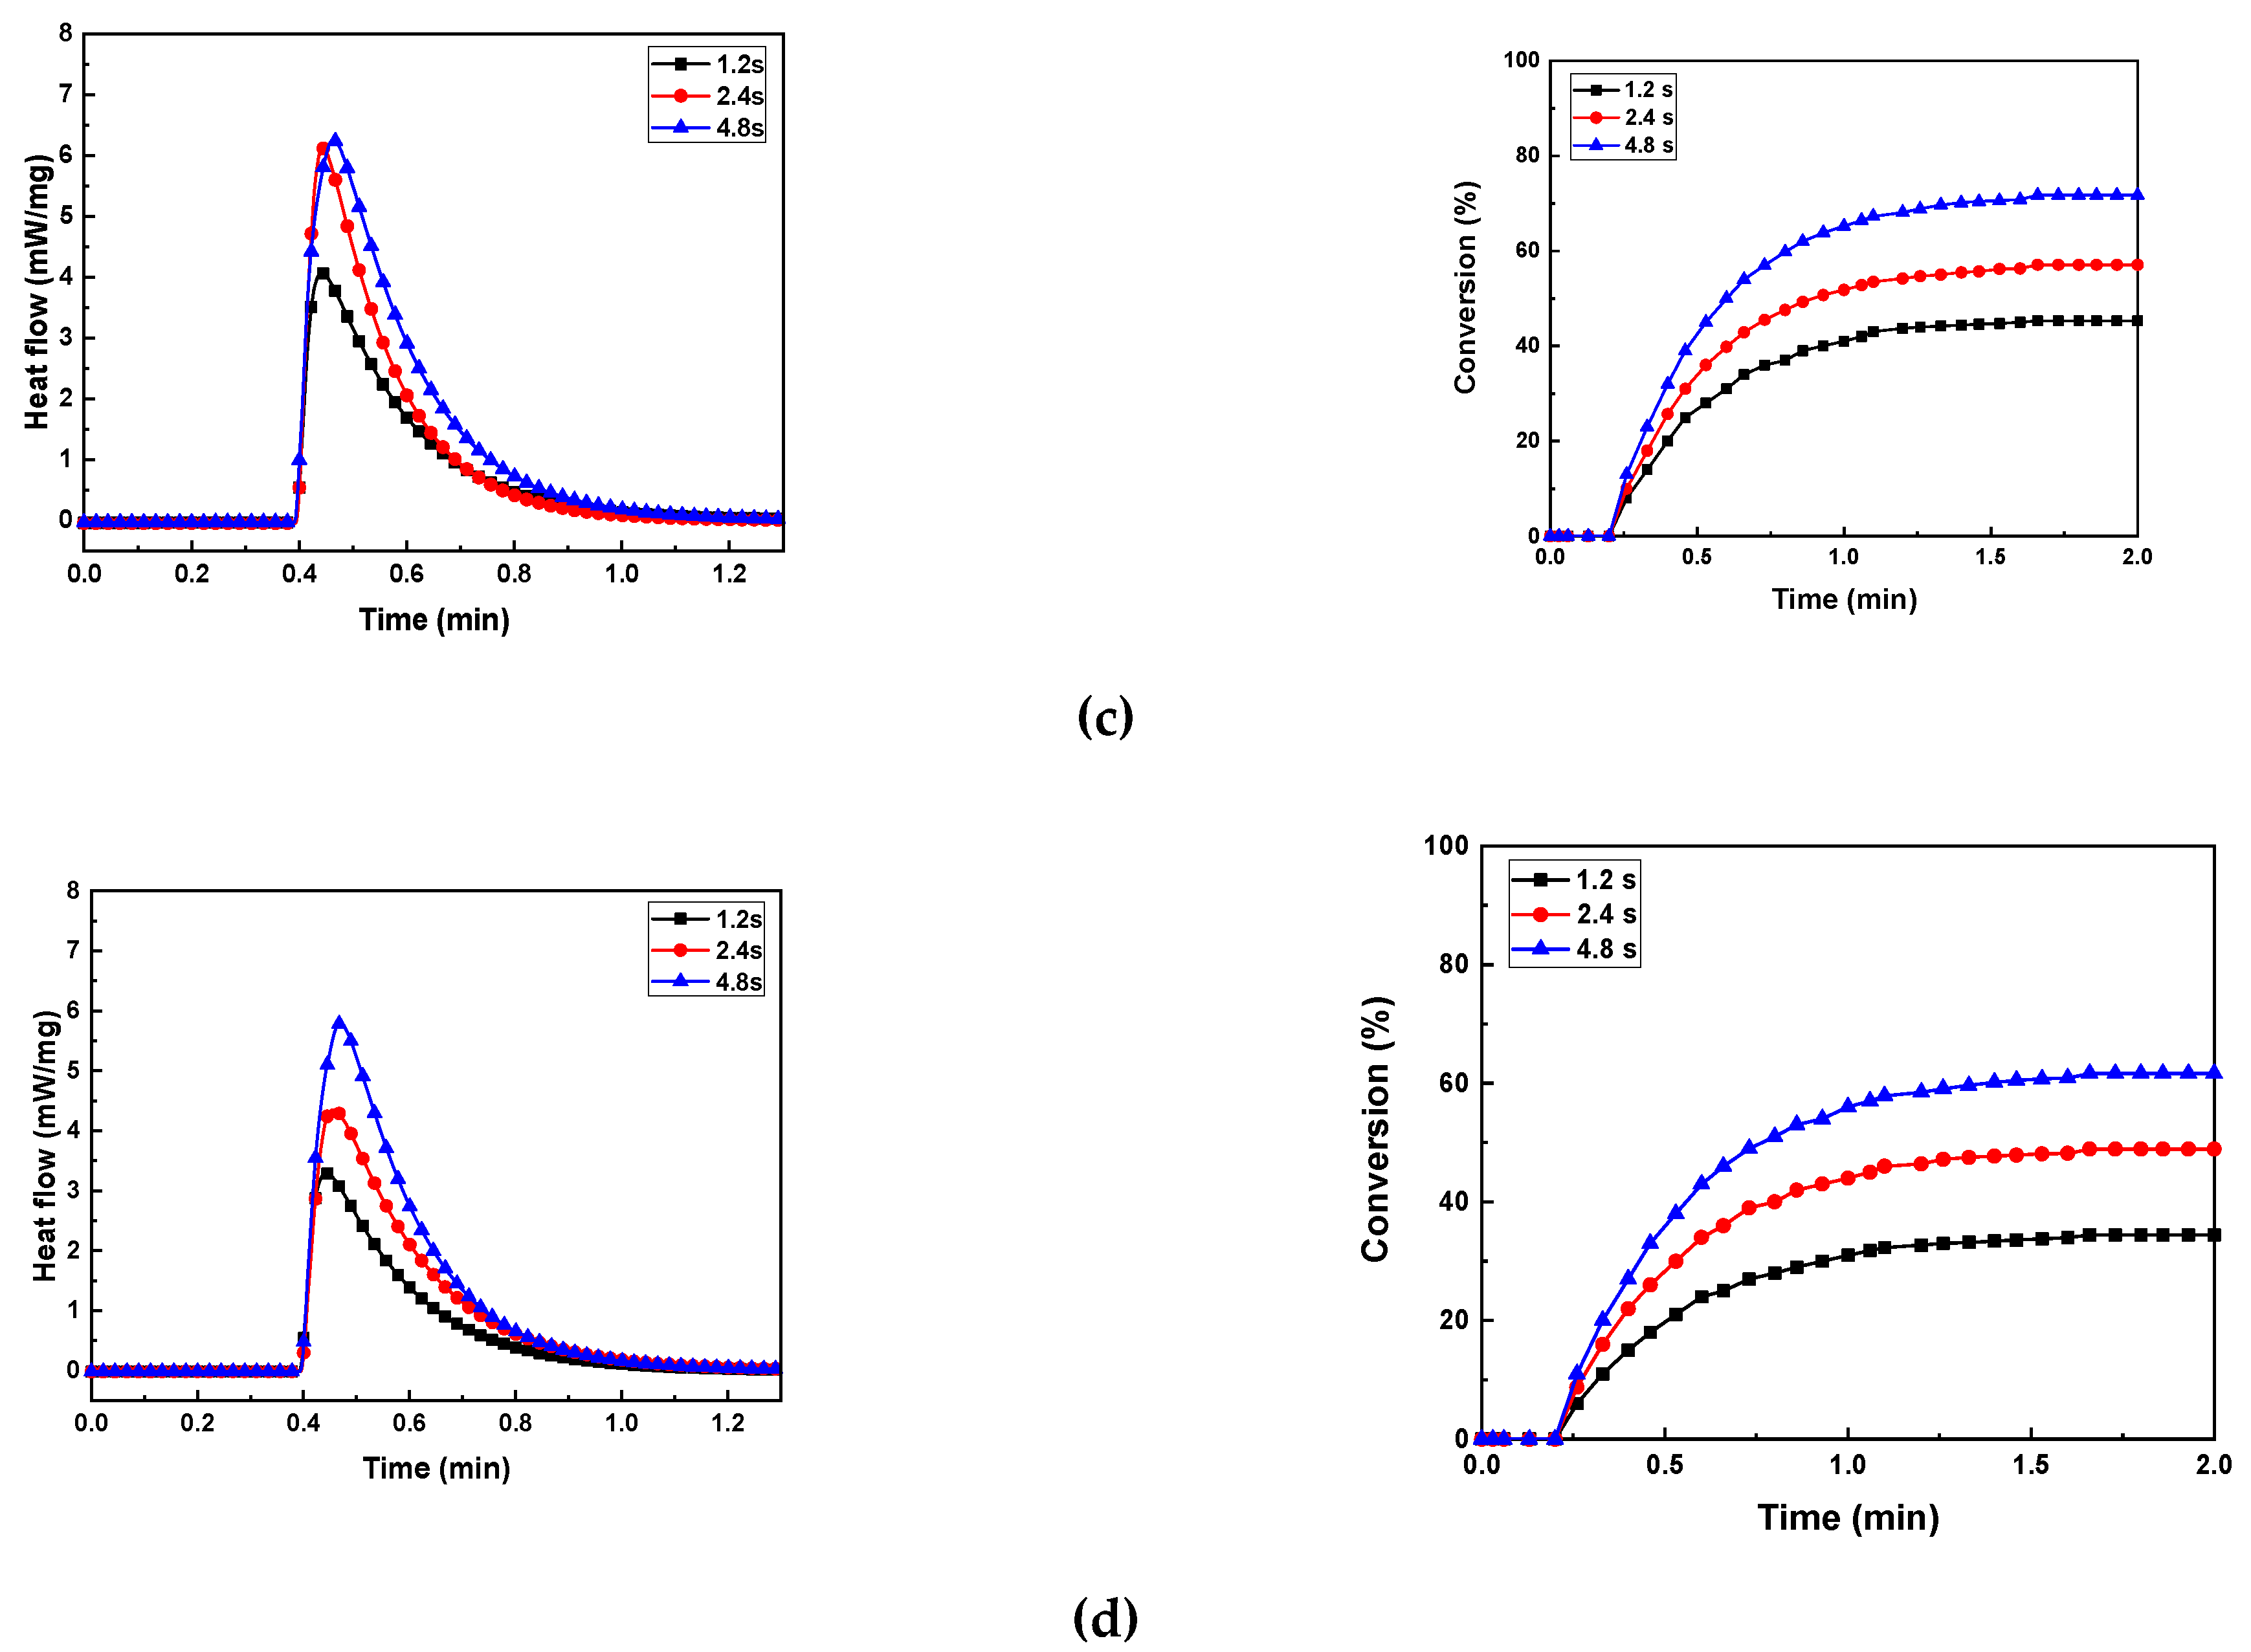
Figure 10.
Printing results of photocurable Al2O3 slurry with 2 wt.% SCA concentration under different exposure conditions; (a) surface image facing build platform (top) and (b) surface image facing tray.
Figure 10.
Printing results of photocurable Al2O3 slurry with 2 wt.% SCA concentration under different exposure conditions; (a) surface image facing build platform (top) and (b) surface image facing tray.
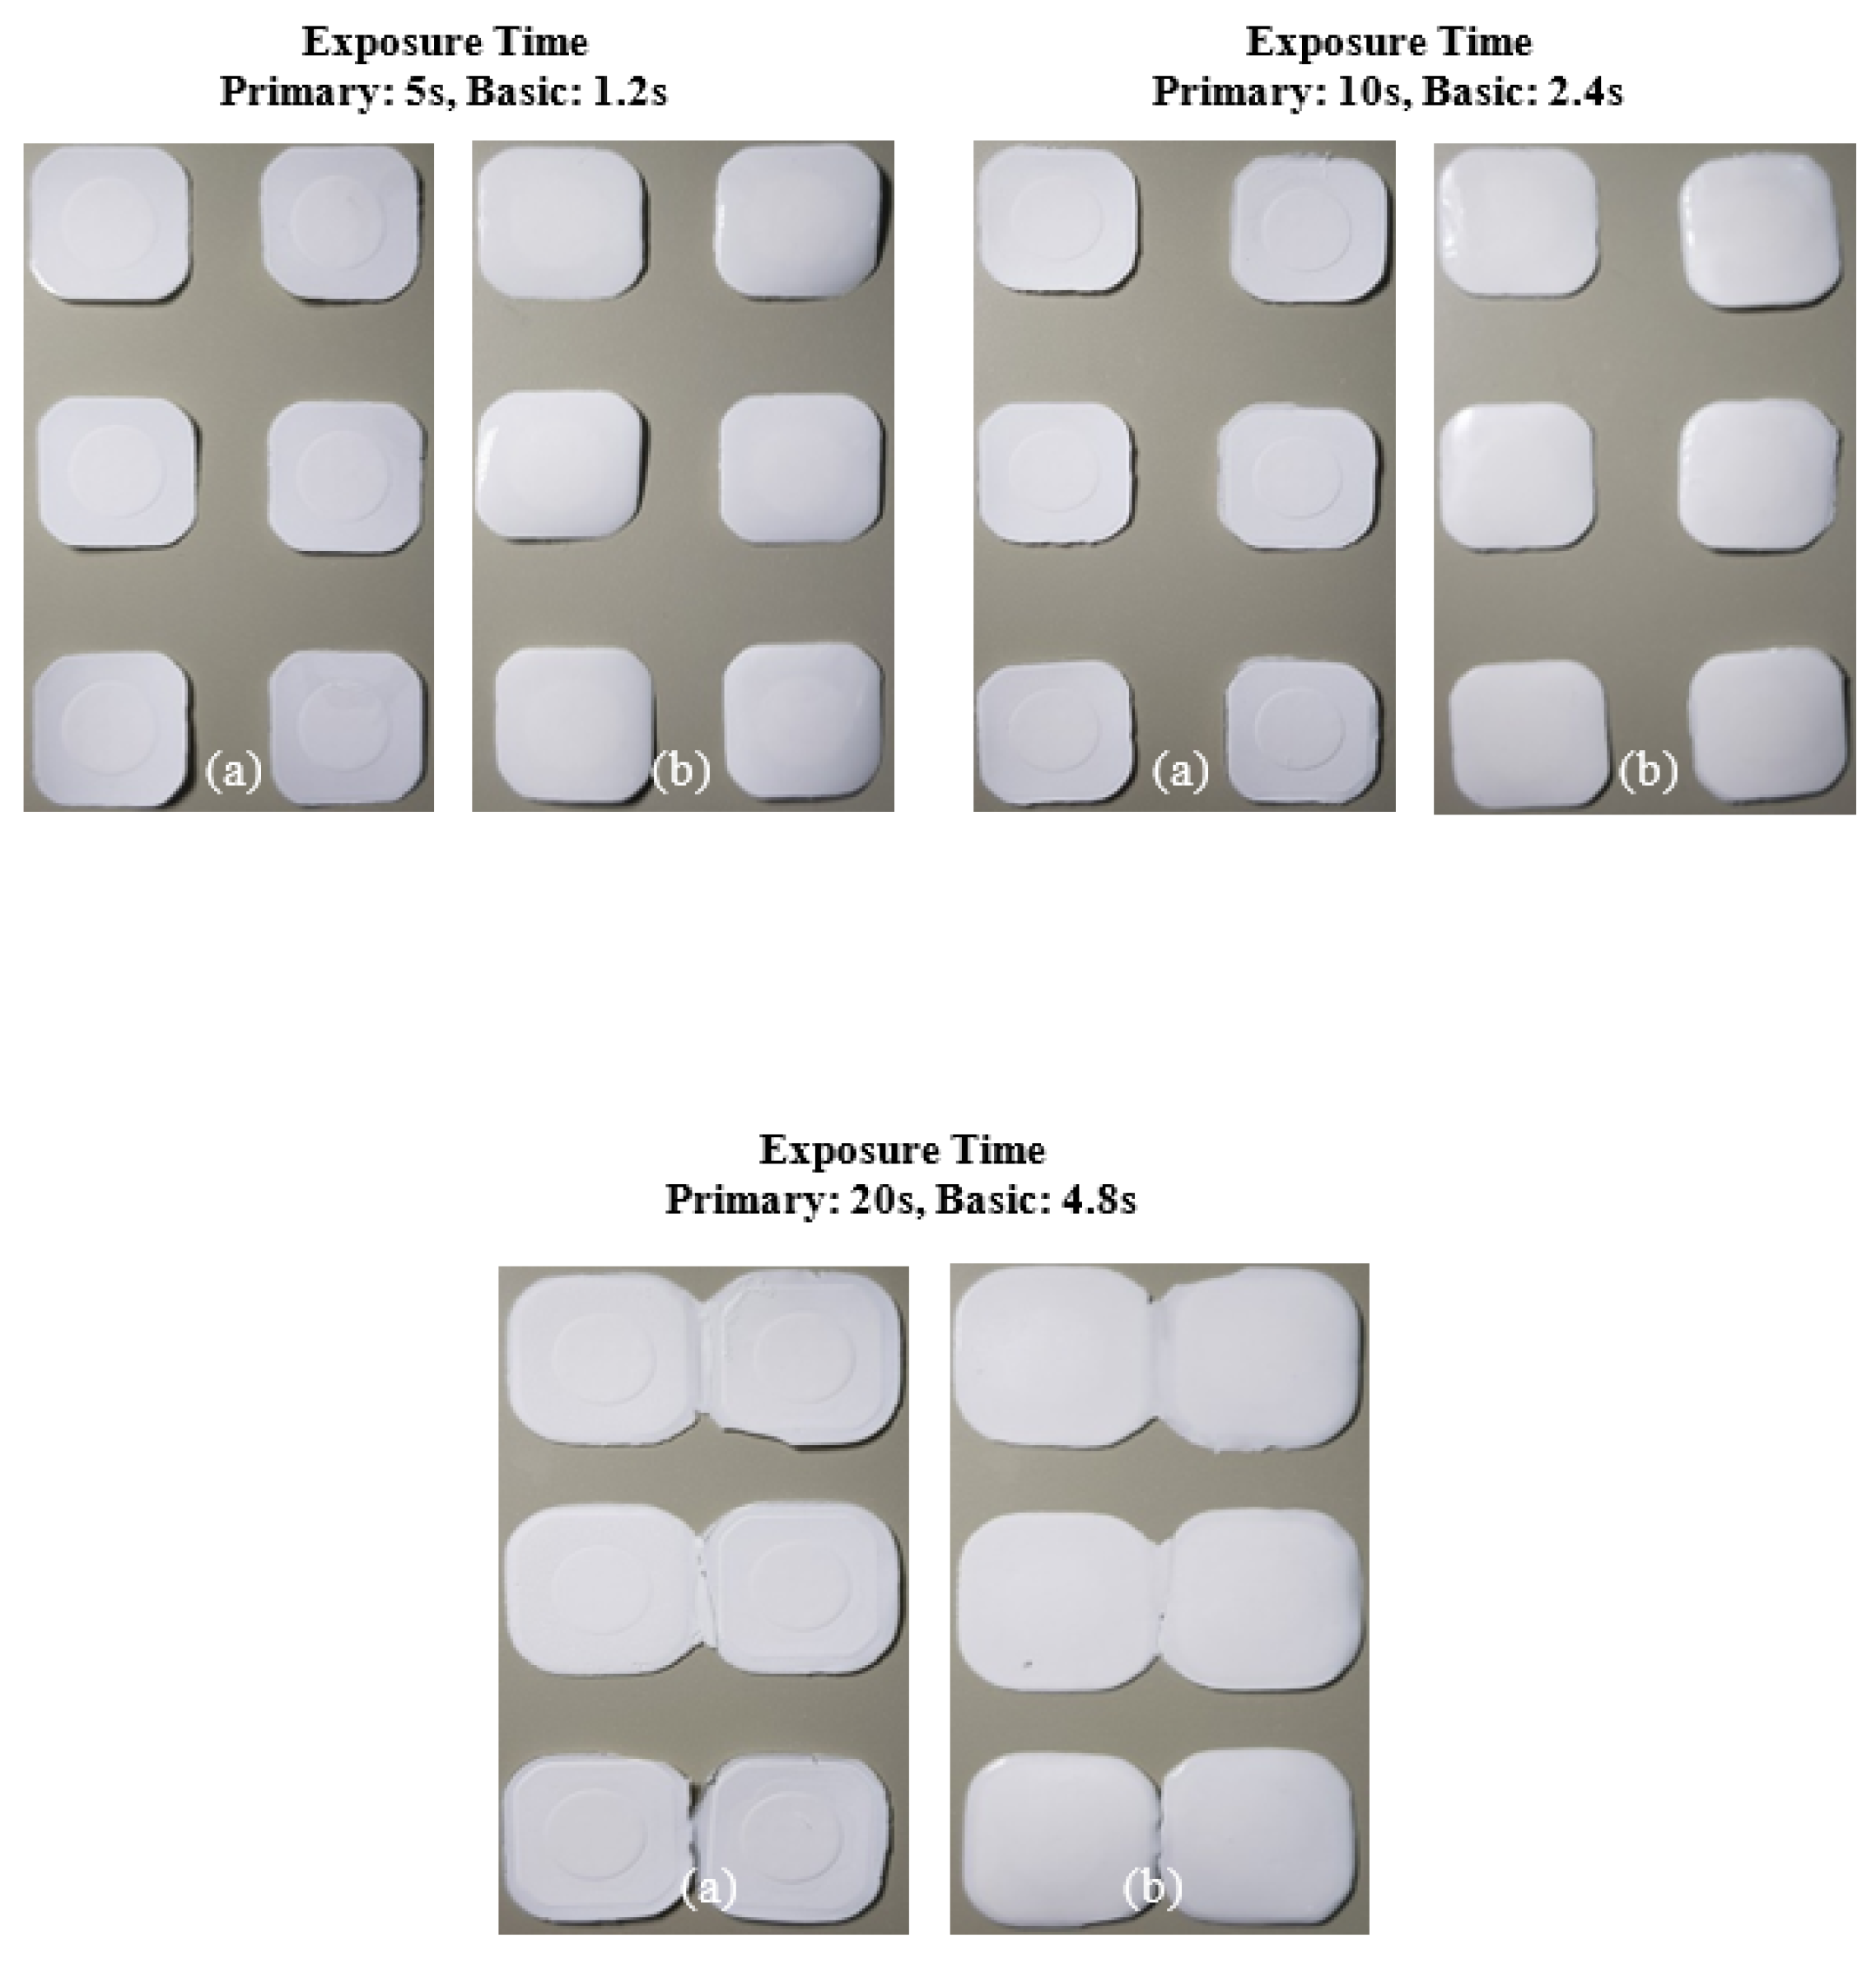
Figure 11.
Printing results of photocurable Al2O3 slurry with 5 wt.% SCA concentration under different exposure conditions; (a) surface image facing build platform (top) and (b) surface image facing tray.
Figure 11.
Printing results of photocurable Al2O3 slurry with 5 wt.% SCA concentration under different exposure conditions; (a) surface image facing build platform (top) and (b) surface image facing tray.
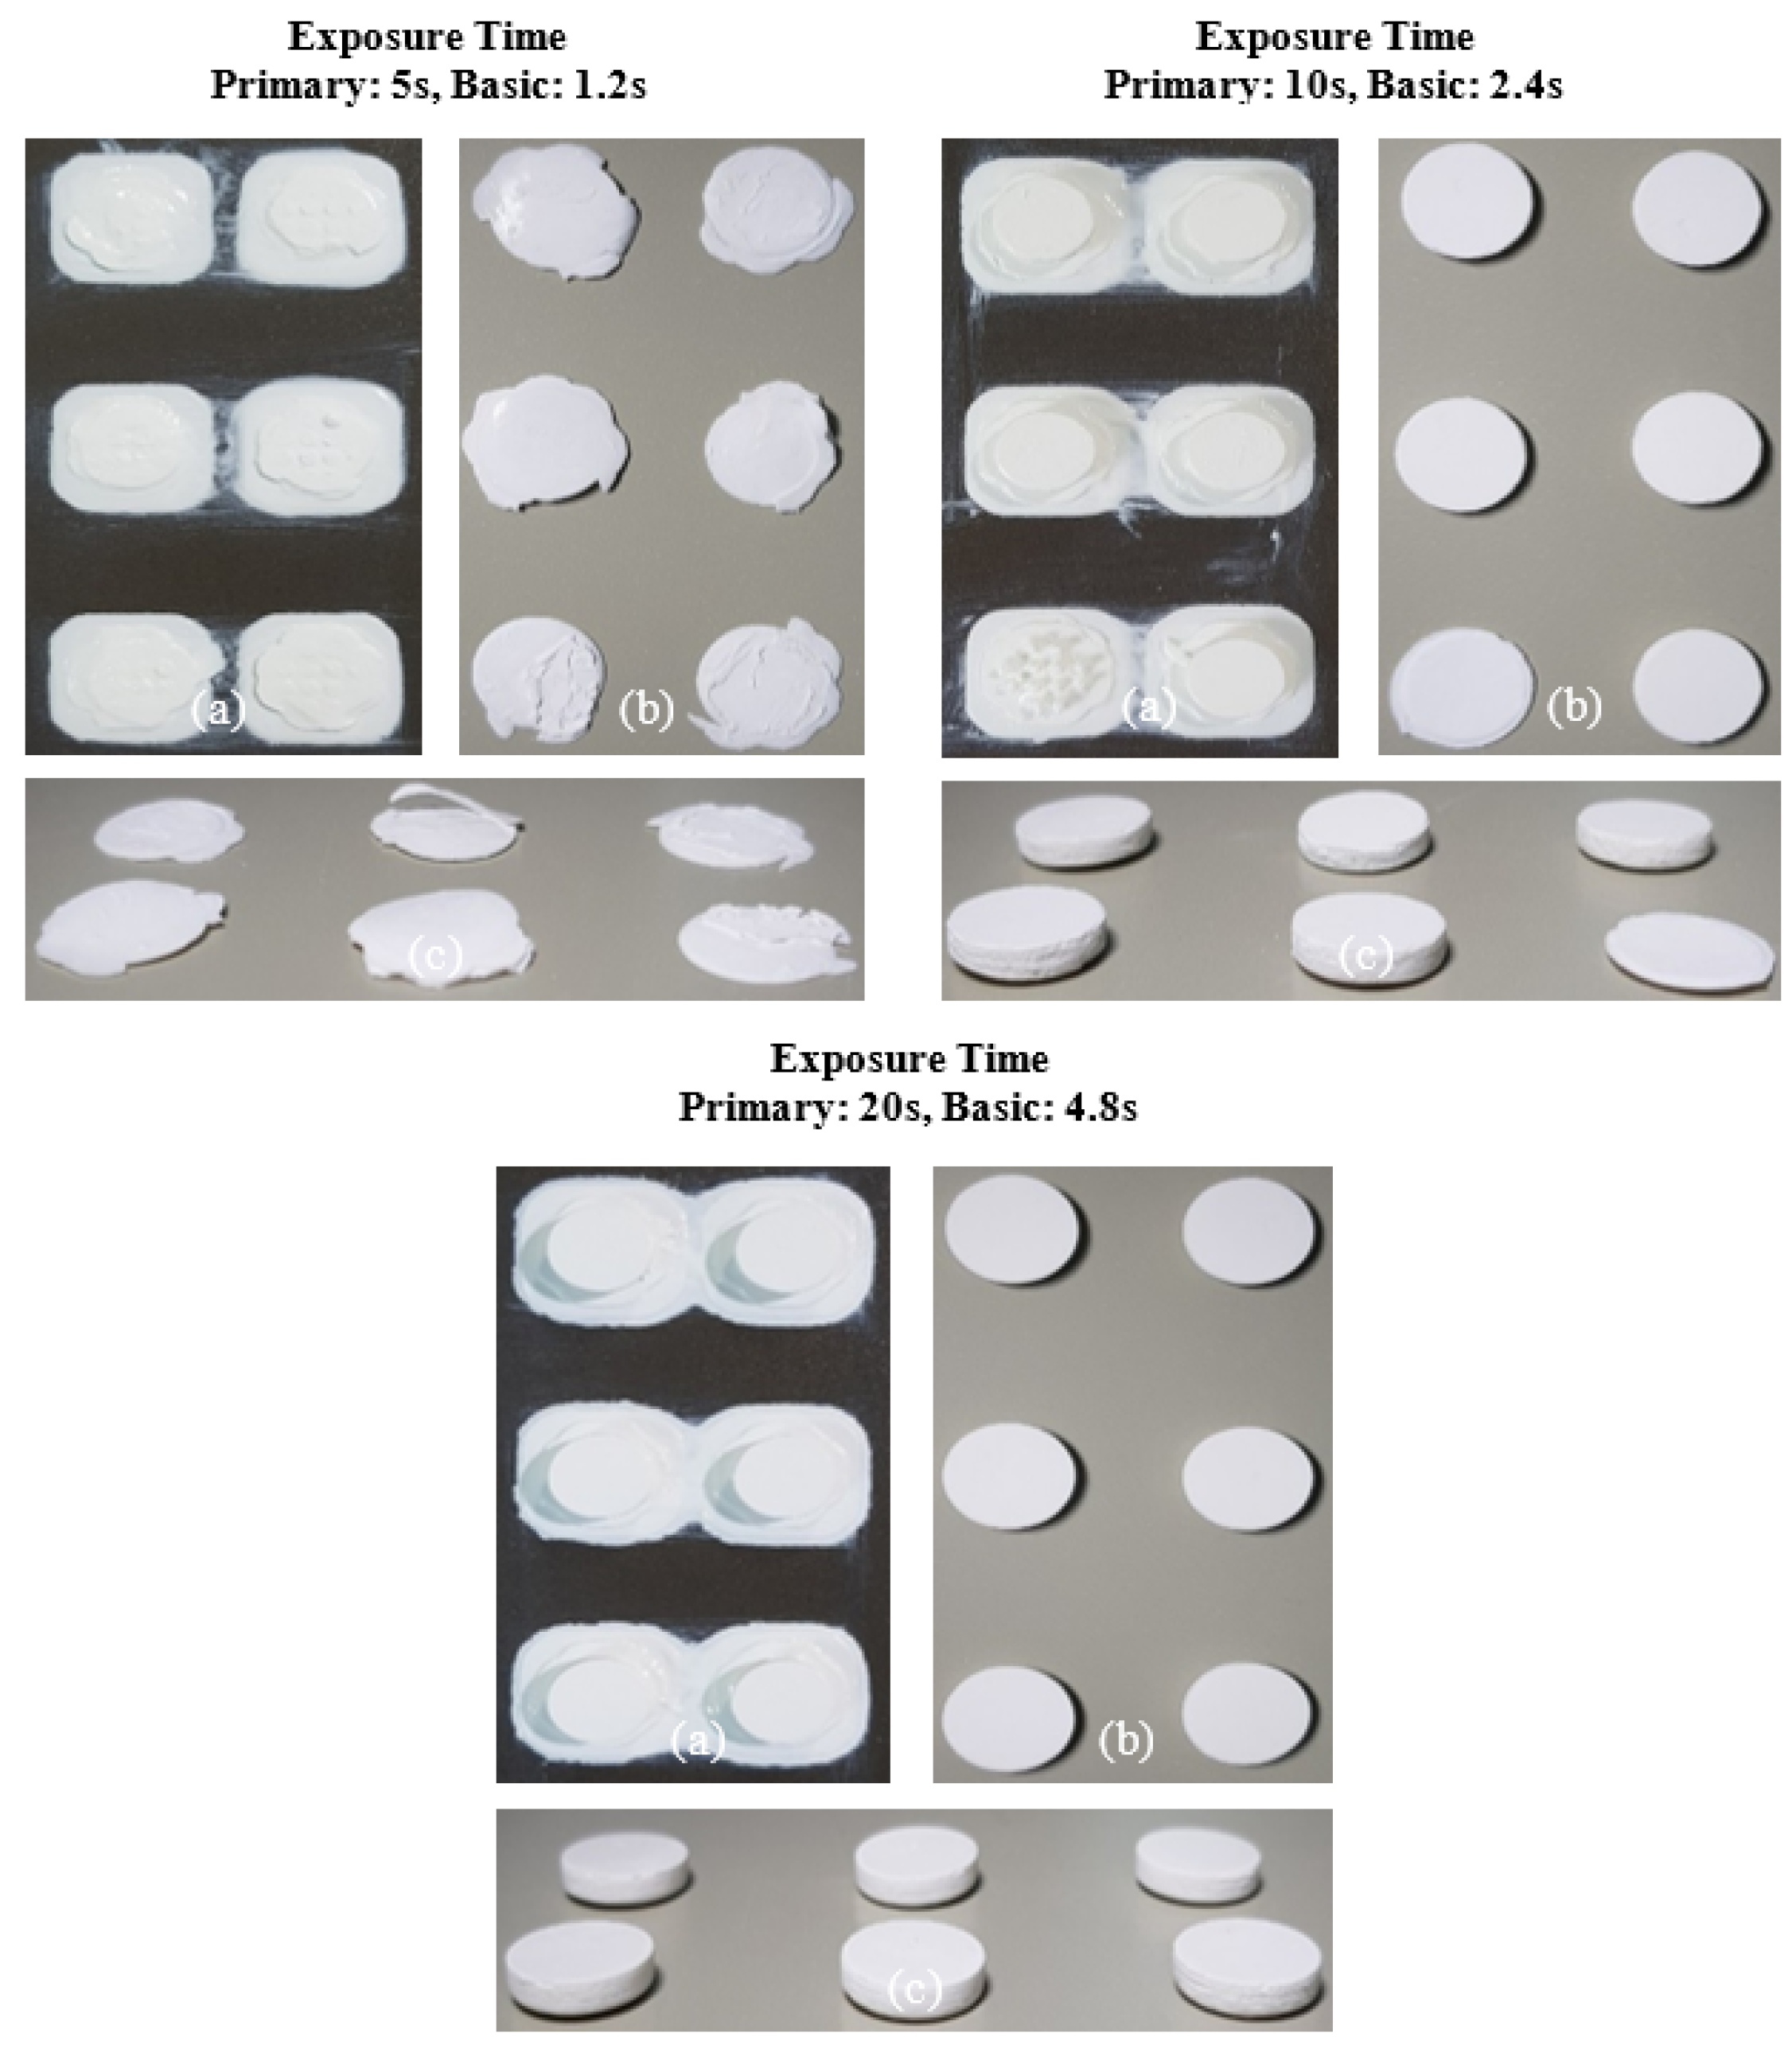
Figure 12.
Printing results of photocurable Al2O3 slurry with 10 wt.% SCA concentration under different exposure conditions; (a) surface image facing build platform (top) and (b) surface image facing tray.
Figure 12.
Printing results of photocurable Al2O3 slurry with 10 wt.% SCA concentration under different exposure conditions; (a) surface image facing build platform (top) and (b) surface image facing tray.
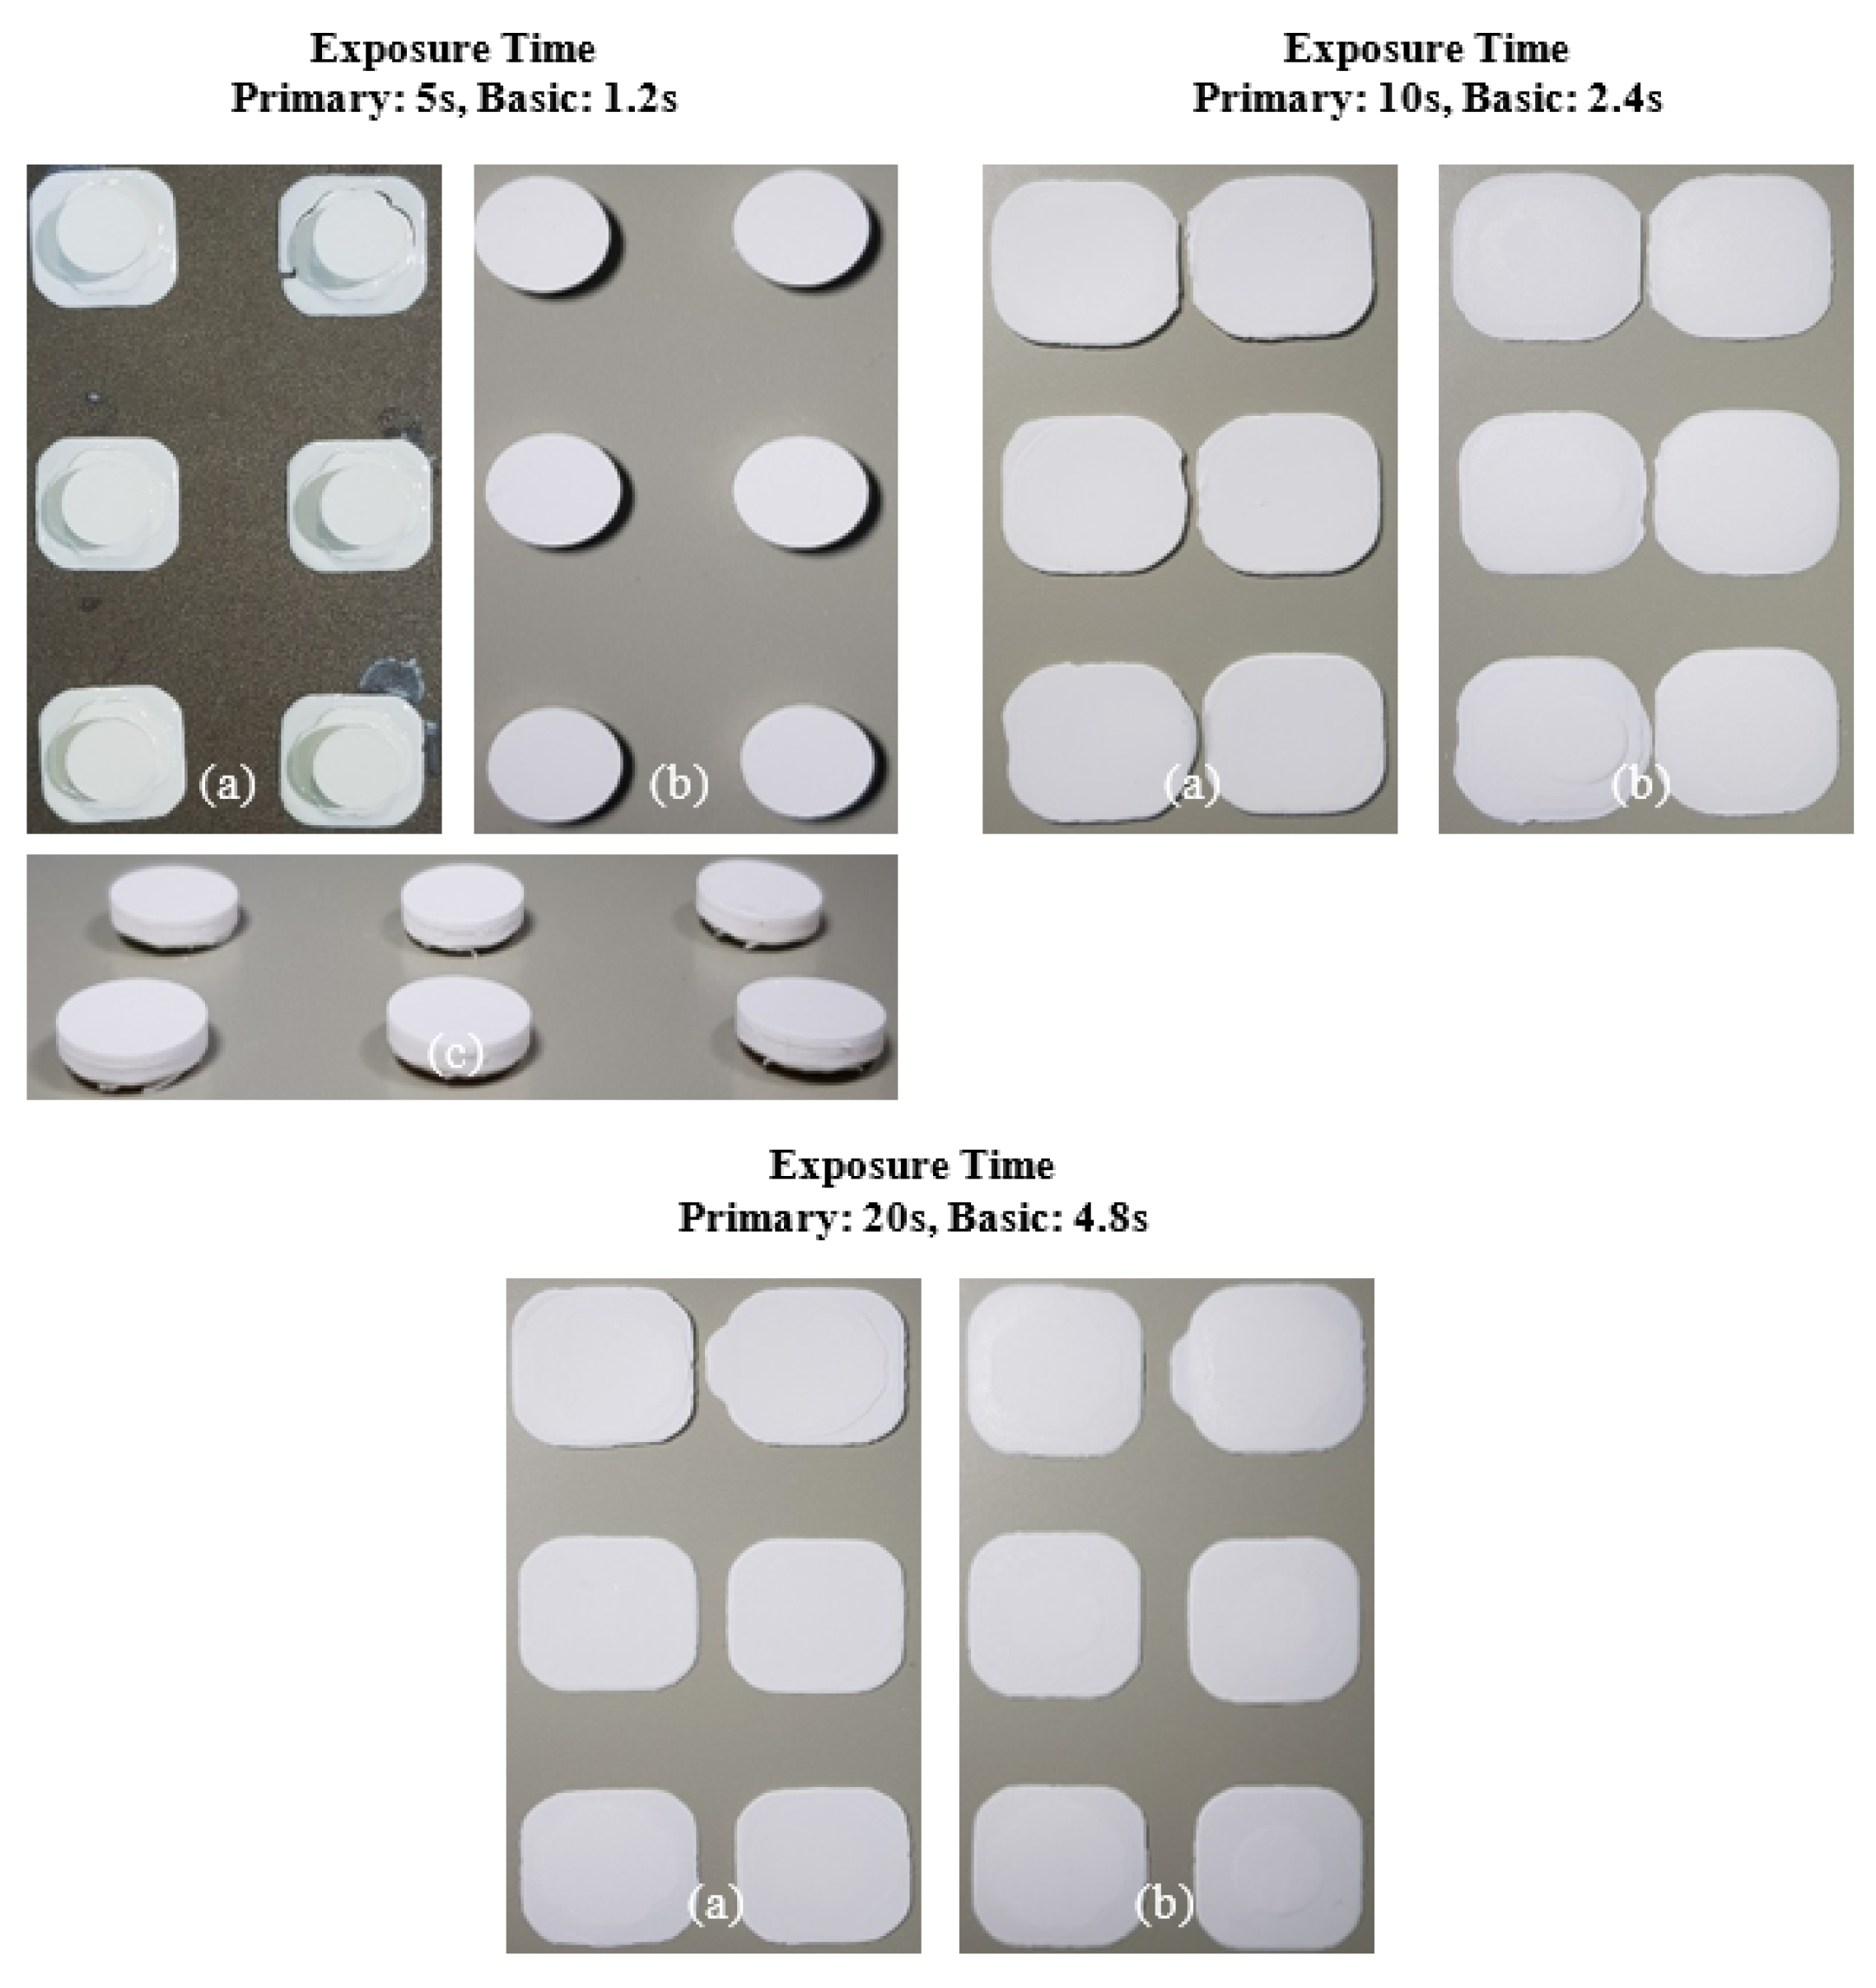
Figure 13.
Printing results of photocurable Al2O3 slurry with 20 wt.% SCA concentration under different exposure conditions; (a) surface image facing build platform (top) and (b) surface image facing tray.
Figure 13.
Printing results of photocurable Al2O3 slurry with 20 wt.% SCA concentration under different exposure conditions; (a) surface image facing build platform (top) and (b) surface image facing tray.
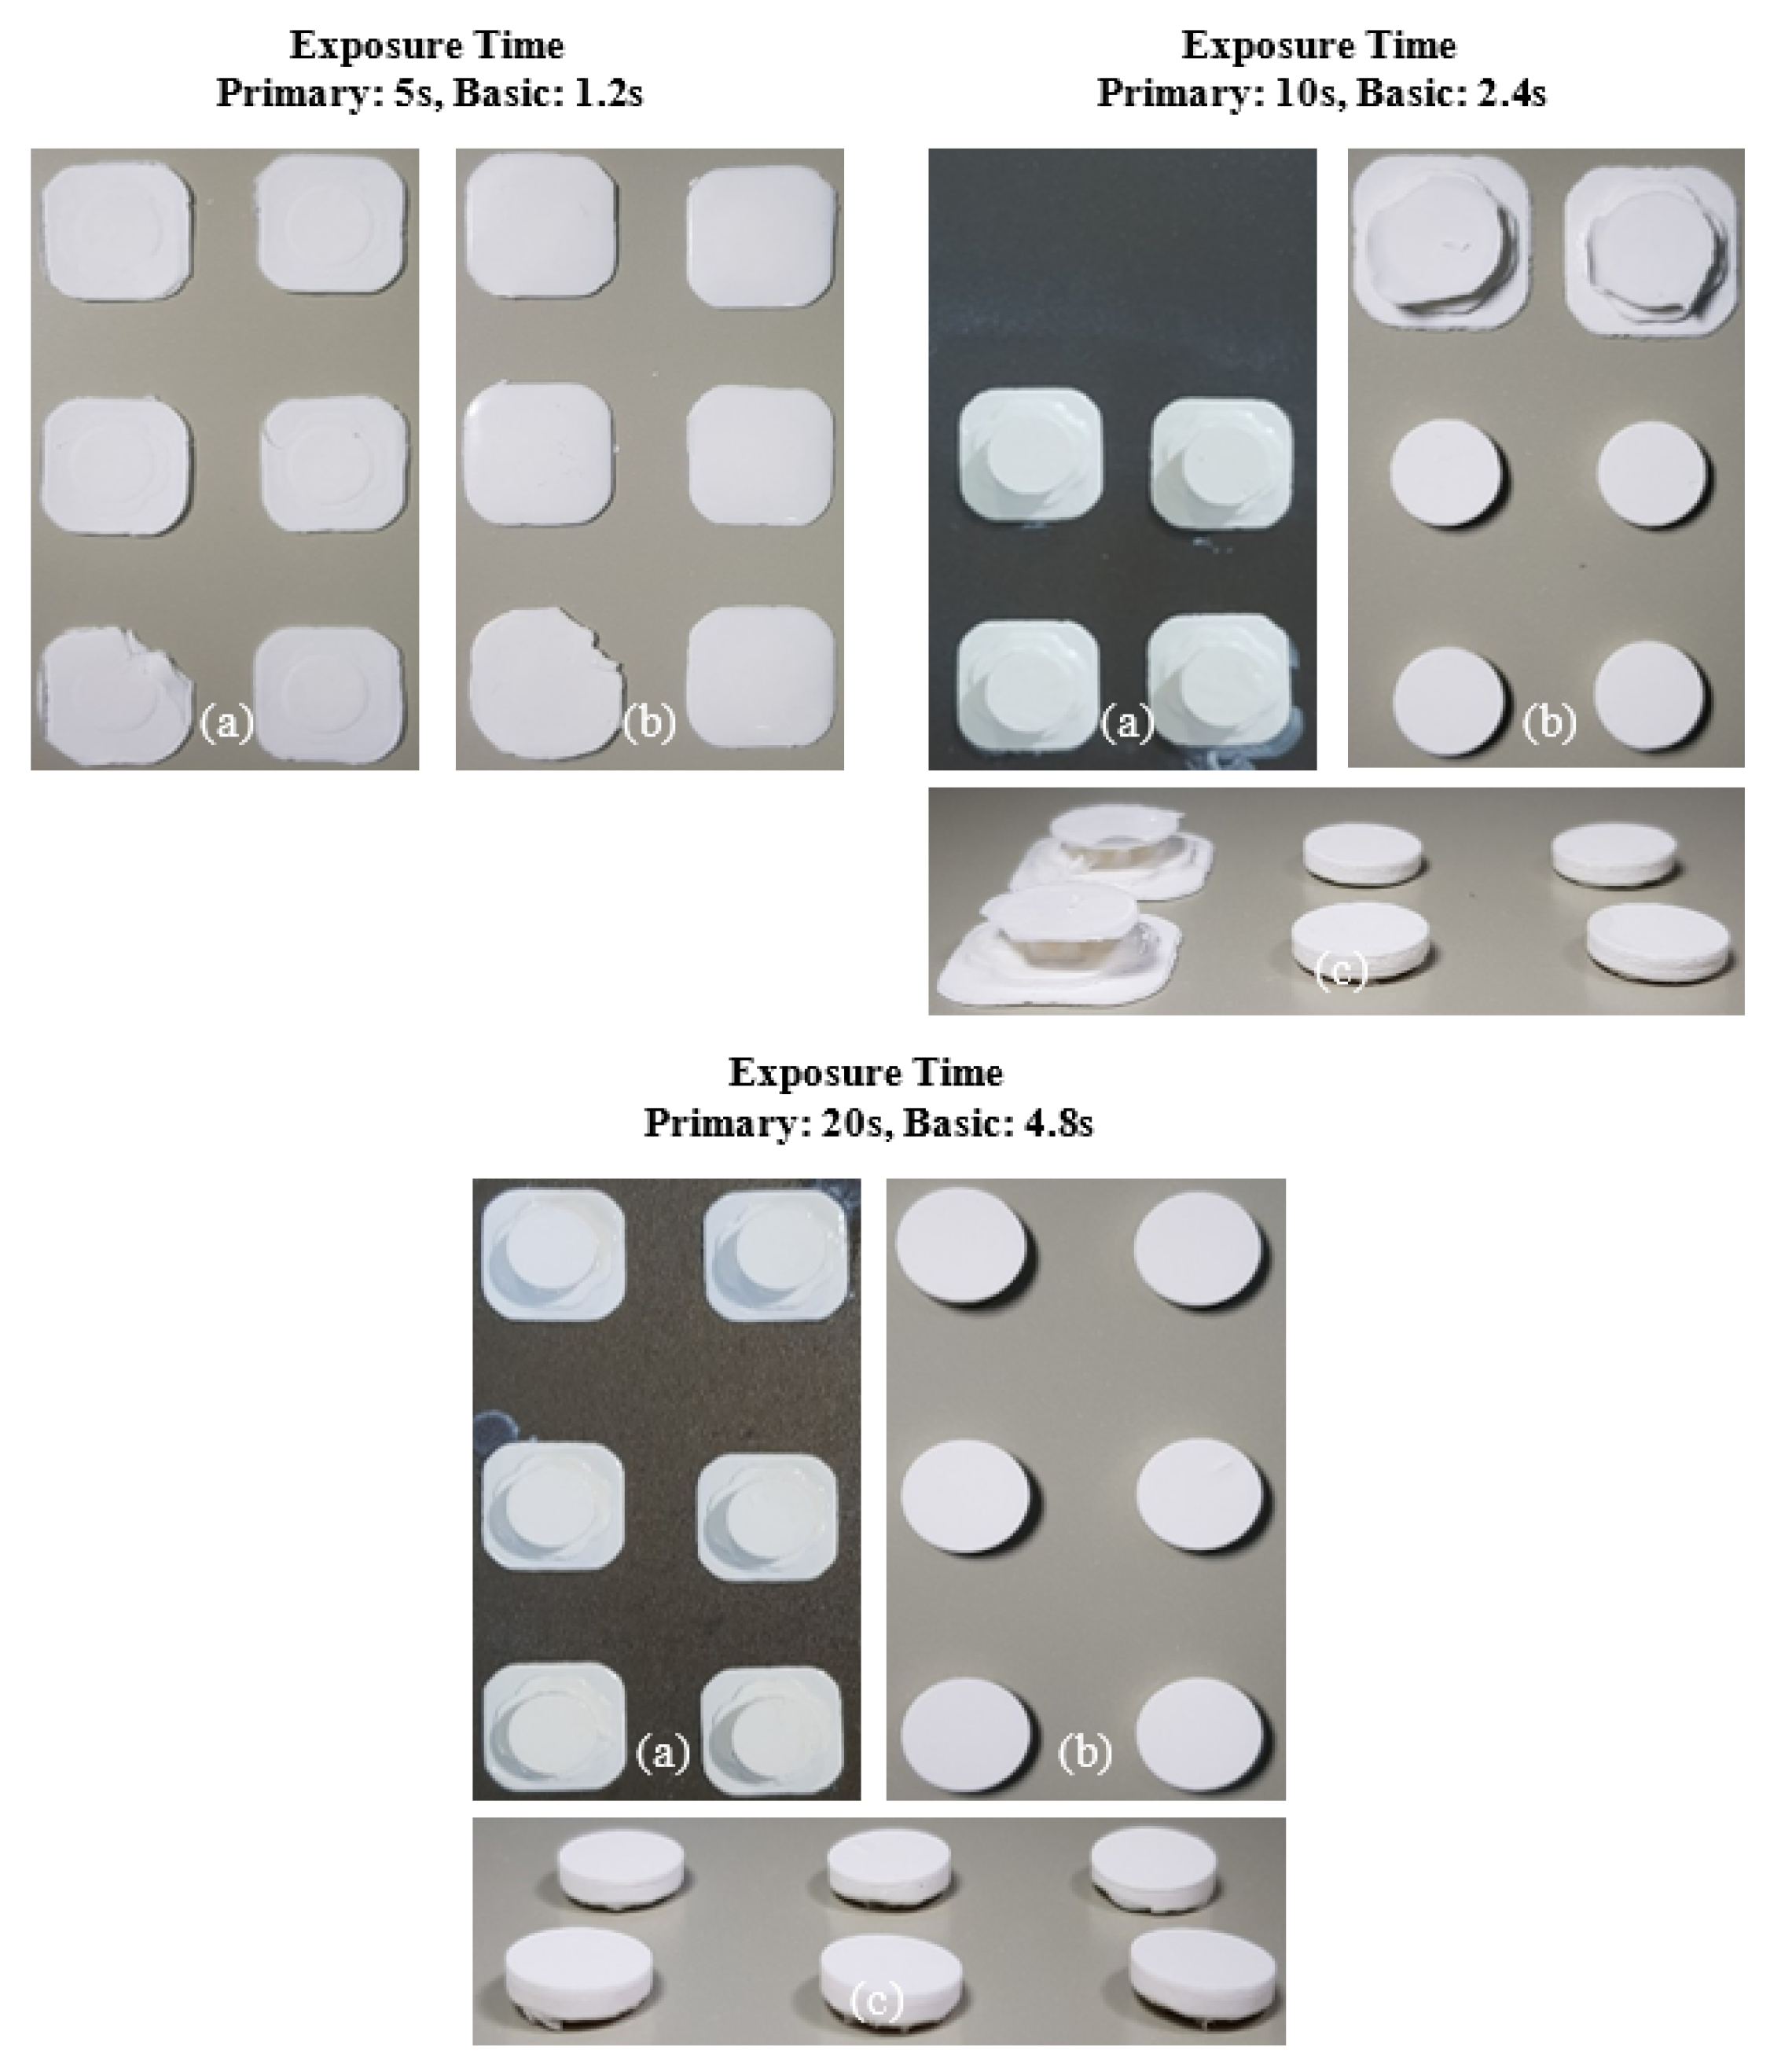
Figure 14.
X-ray CT cross-sectional images of printed Al2O3-acrylate composites with different SCA concentrations; (a) 2 wt.%, (b) 5 wt.%, (c) 10 wt.%, and (d) 20 wt.%.
Figure 14.
X-ray CT cross-sectional images of printed Al2O3-acrylate composites with different SCA concentrations; (a) 2 wt.%, (b) 5 wt.%, (c) 10 wt.%, and (d) 20 wt.%.
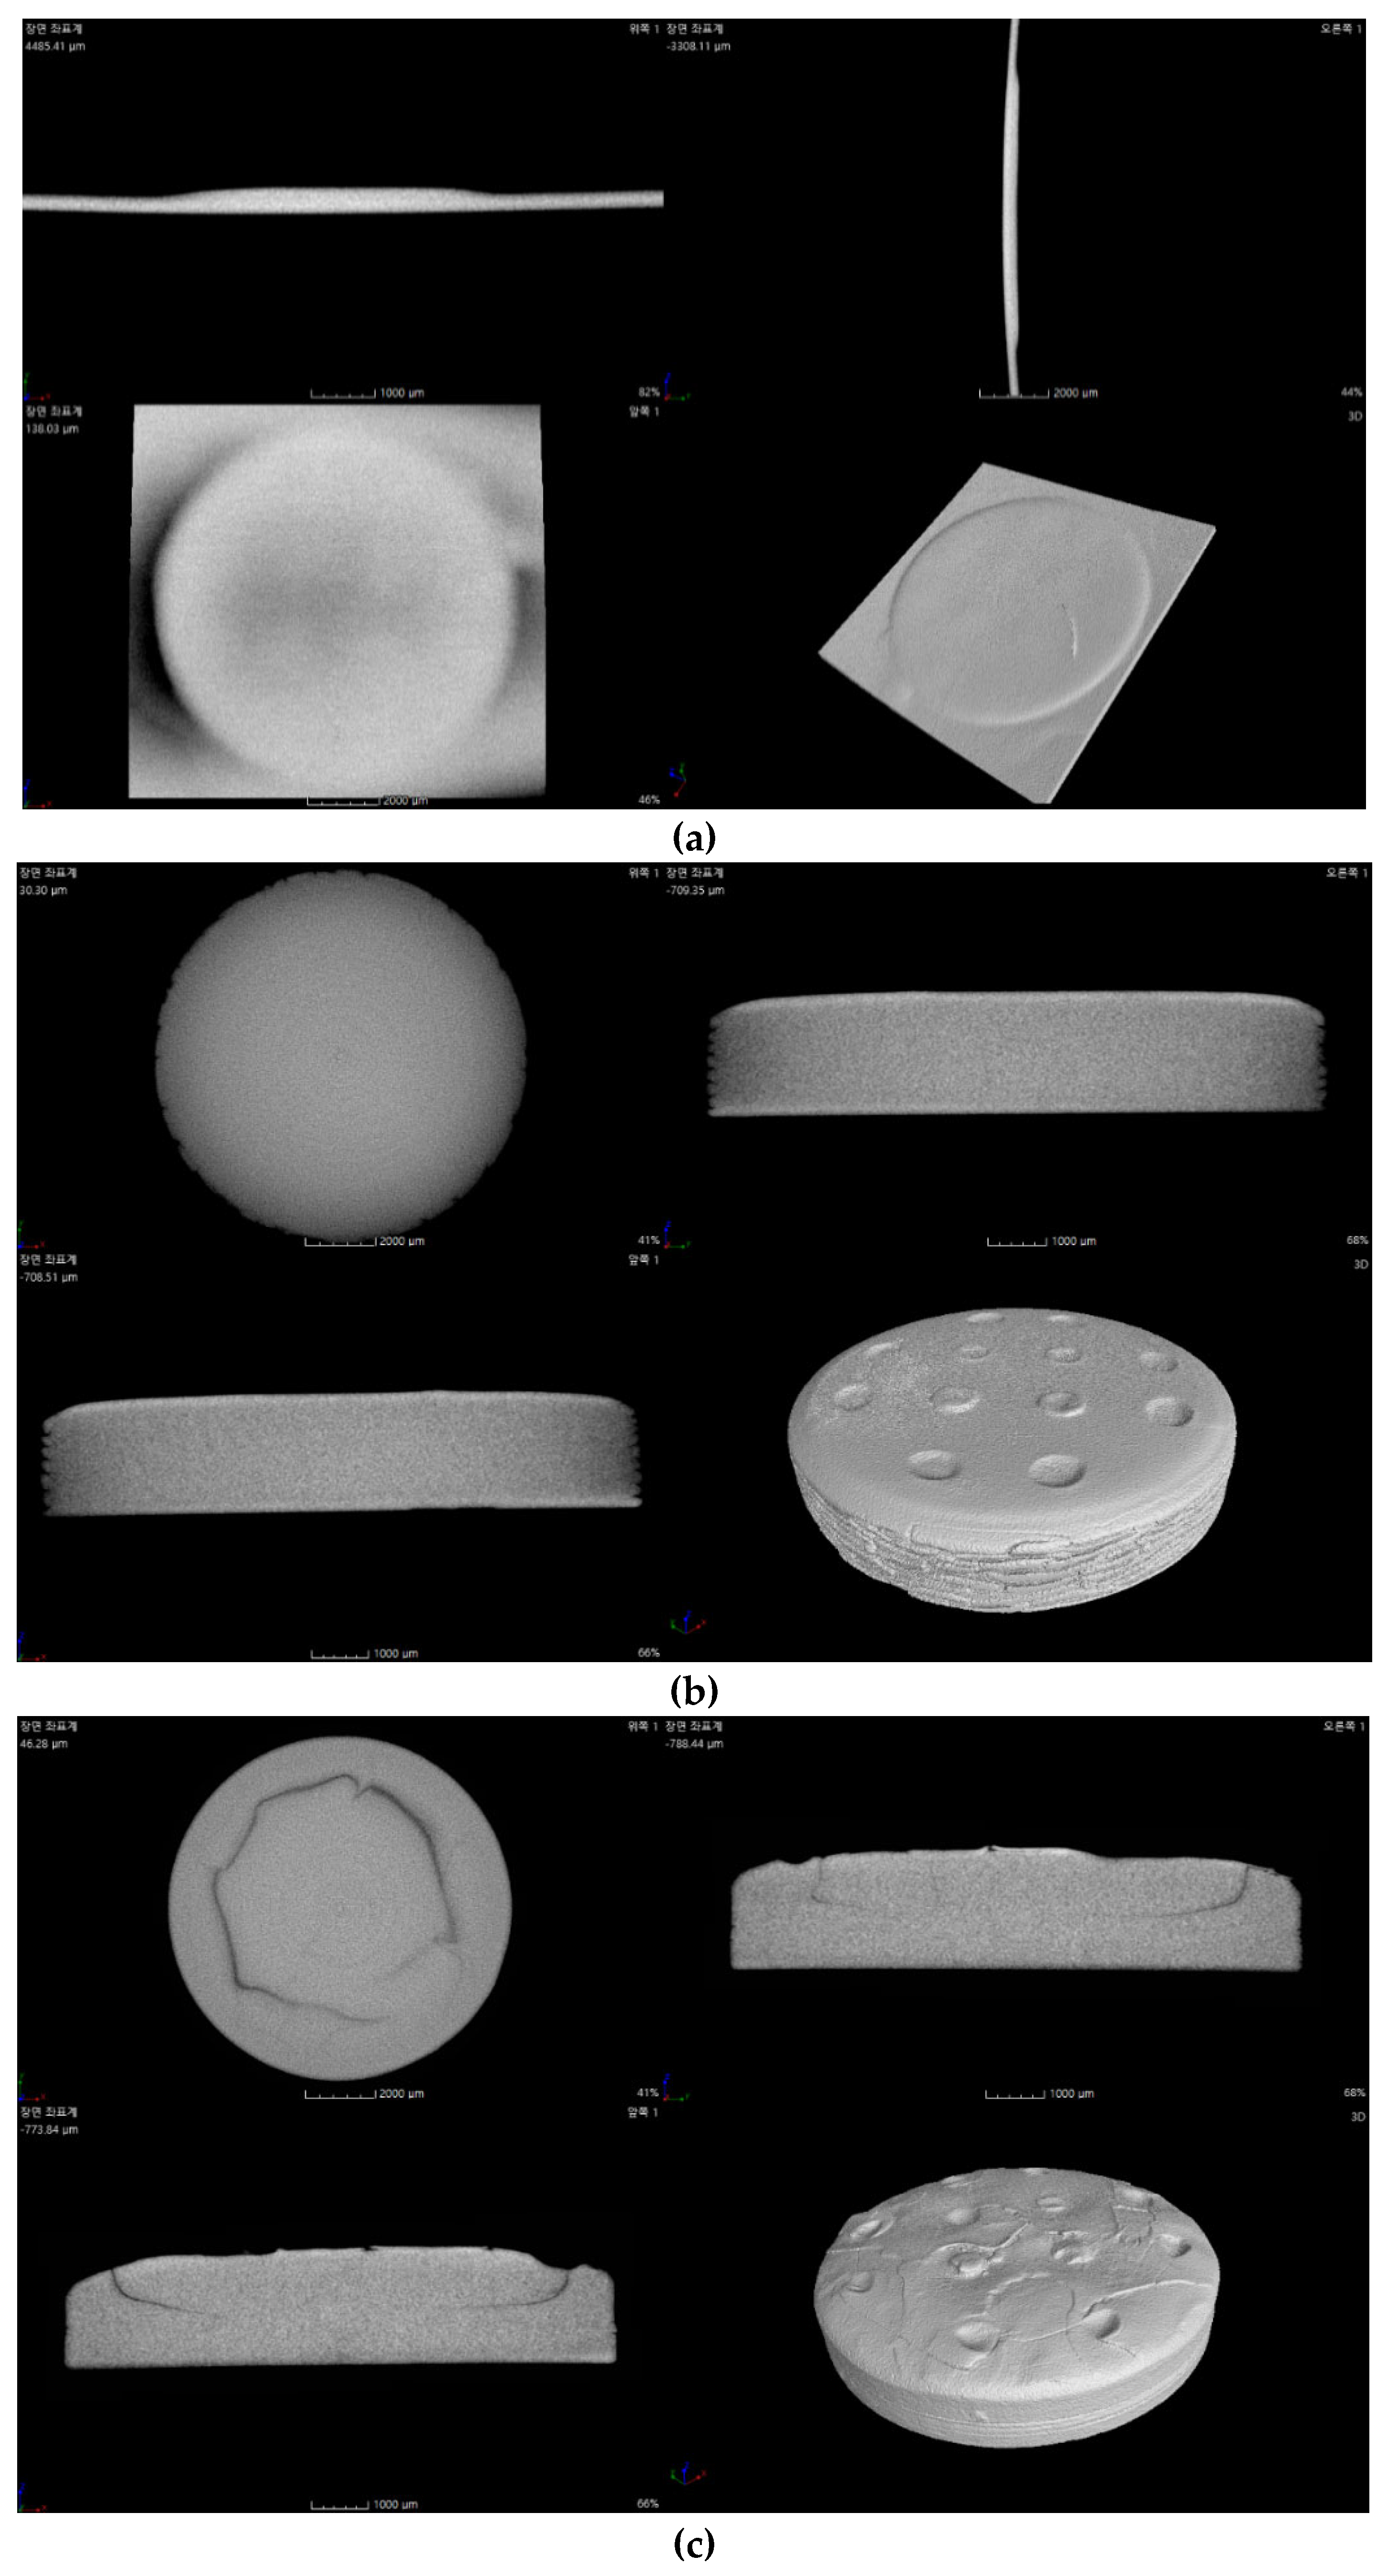
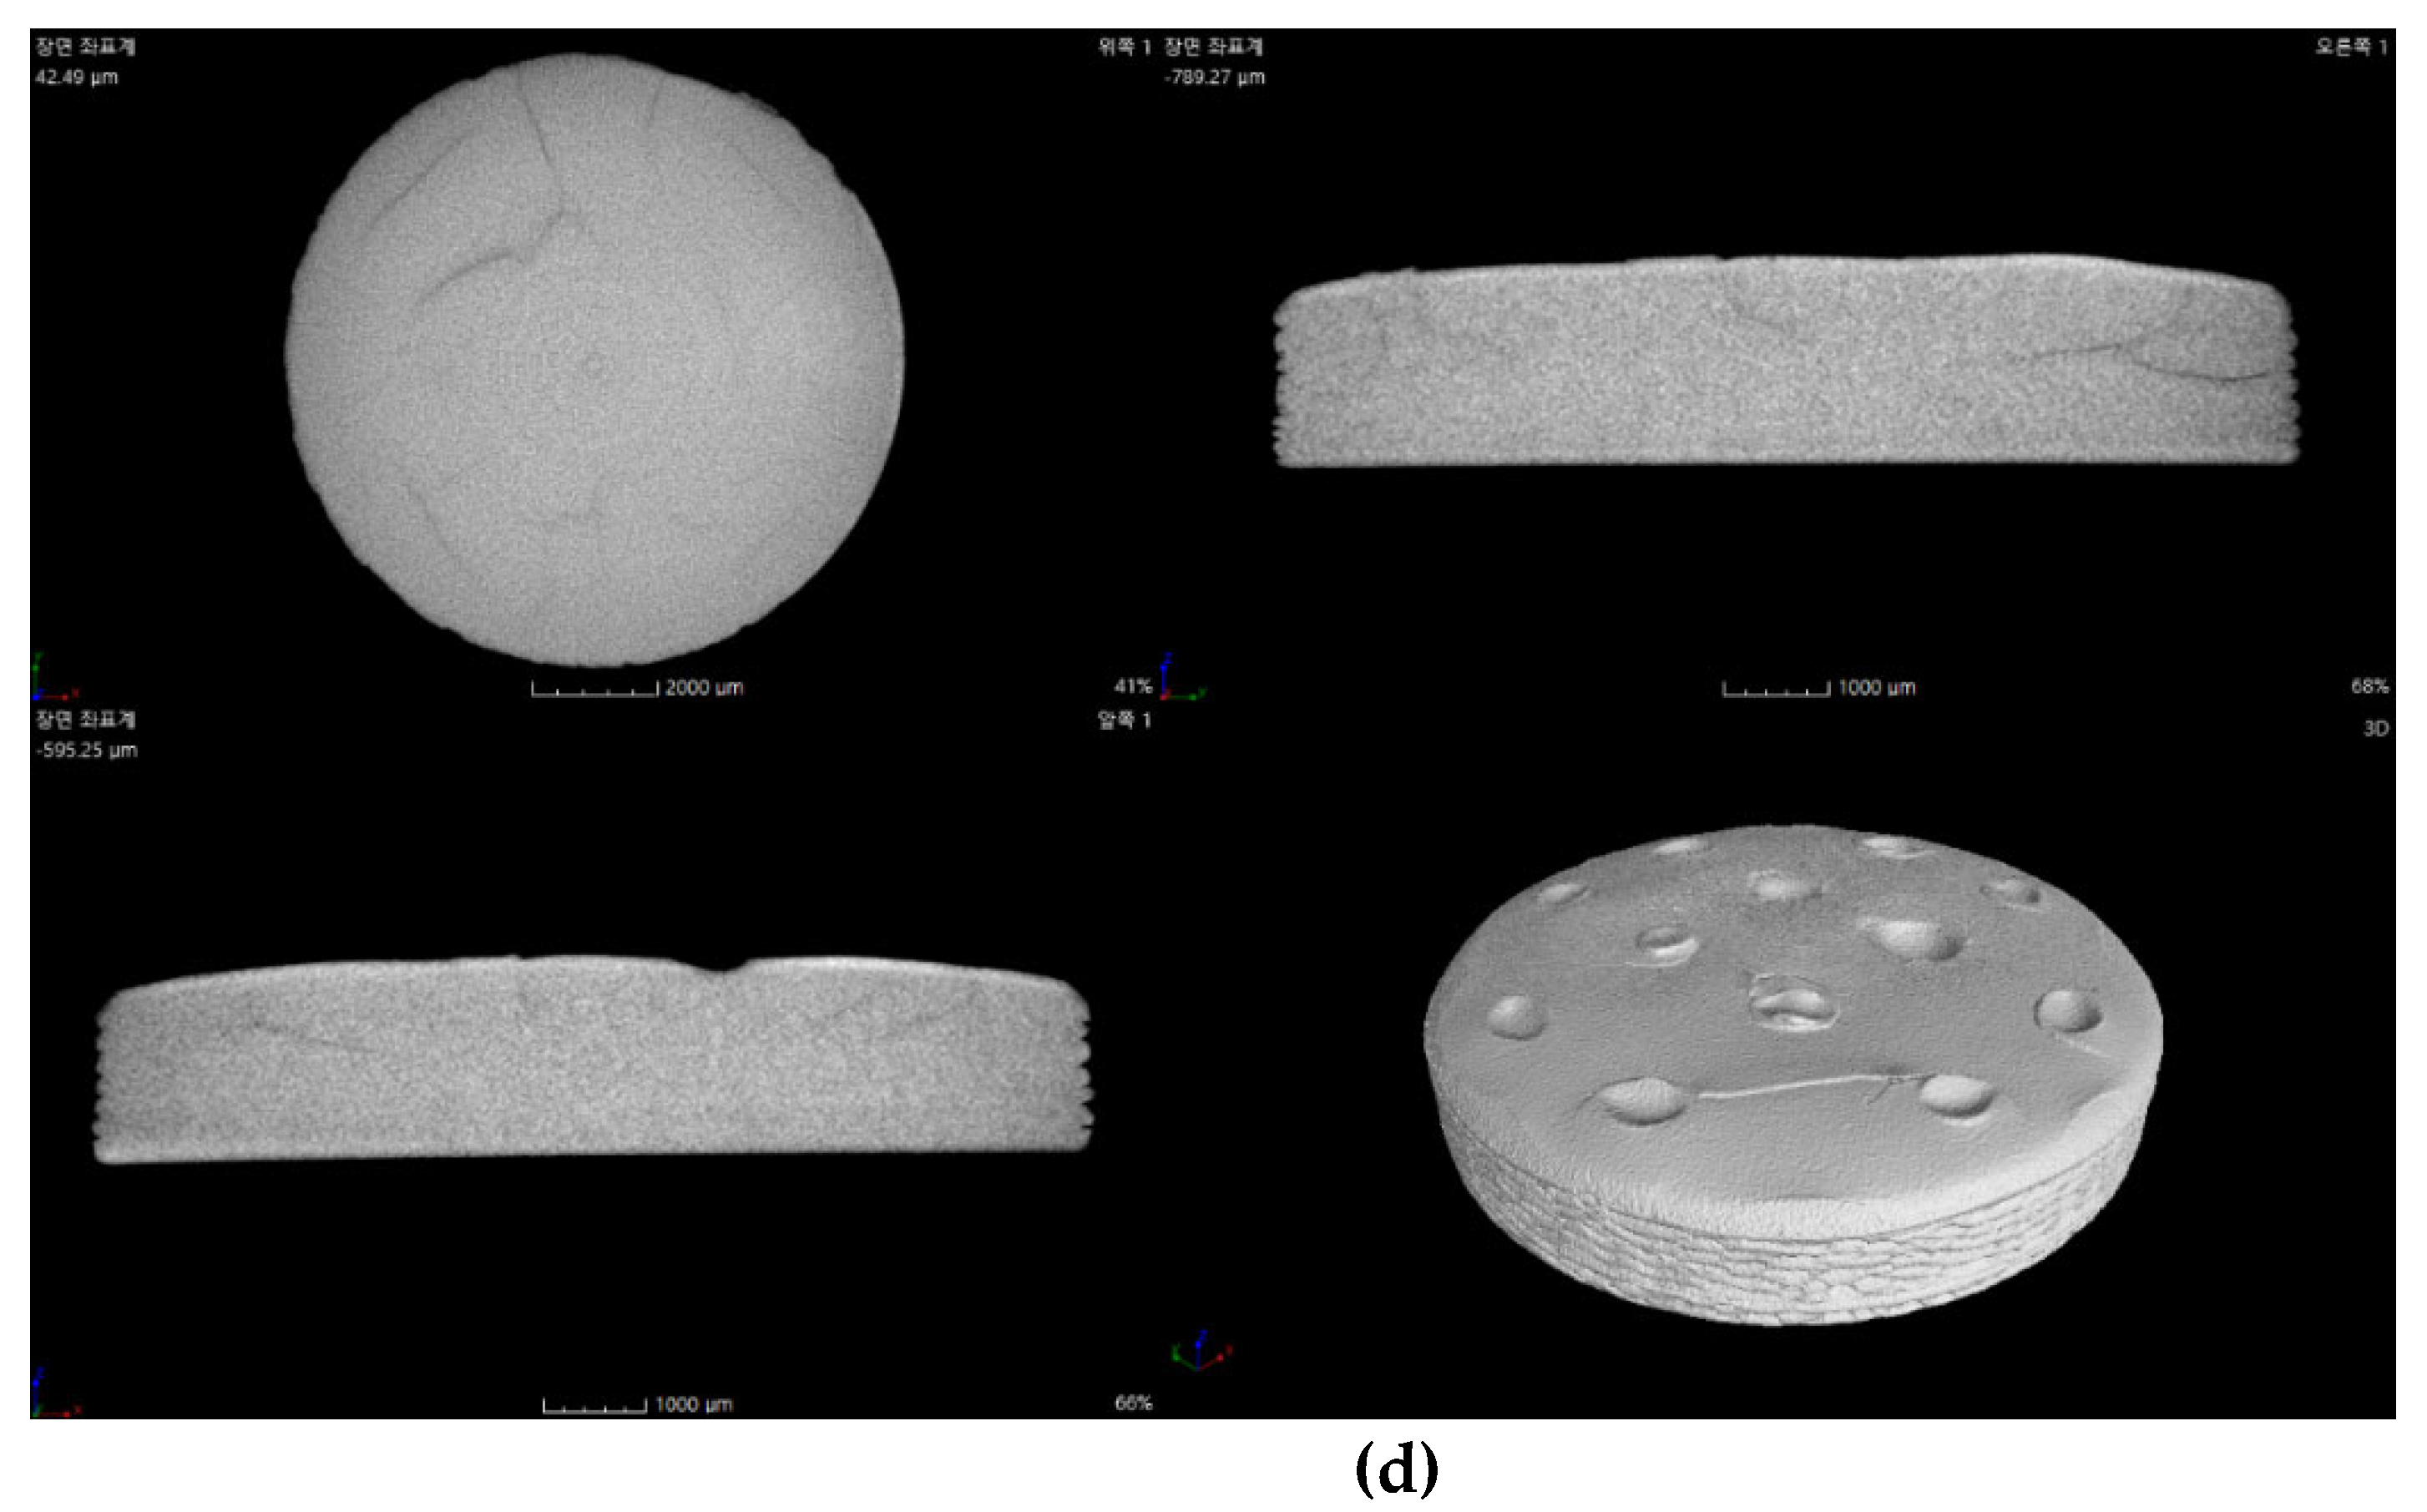

Table 1.
Cure parameters for photocurable Al2O3 slurries with various silane coupling agent concentrations.
Table 1.
Cure parameters for photocurable Al2O3 slurries with various silane coupling agent concentrations.
| SCA Content (wt.%) | Exposure Time (t) | Maximum Heat Flow (mW/mg) | Curing Enthalpy (J/g) | Conversion (%) |
|---|---|---|---|---|
| 2 | 1.2 | 3.29 | 77 | 51 |
| 2.4 | 4.12 | 105 | 70 | |
| 4.8 | 5.82 | 111 | 74 | |
| 5 | 1.2 | 3.12 | 74 | 46 |
| 2.4 | 4.98 | 117 | 73 | |
| 4.8 | 7.63 | 160 | 100 | |
| 10 | 1.2 | 4.06 | 77 | 45 |
| 2.4 | 6.12 | 97 | 57 | |
| 4.8 | 6,25 | 122 | 71 | |
| 20 | 1.2 | 3.51 | 62 | 34 |
| 2.4 | 4.34 | 88 | 48 | |
| 4.8 | 5.78 | 111 | 61 |
Disclaimer/Publisher’s Note: The statements, opinions and data contained in all publications are solely those of the individual author(s) and contributor(s) and not of MDPI and/or the editor(s). MDPI and/or the editor(s) disclaim responsibility for any injury to people or property resulting from any ideas, methods, instructions or products referred to in the content. |
© 2024 by the authors. Licensee MDPI, Basel, Switzerland. This article is an open access article distributed under the terms and conditions of the Creative Commons Attribution (CC BY) license (http://creativecommons.org/licenses/by/4.0/).
Copyright: This open access article is published under a Creative Commons CC BY 4.0 license, which permit the free download, distribution, and reuse, provided that the author and preprint are cited in any reuse.


