
Submitted:
20 September 2024
Posted:
23 September 2024
You are already at the latest version
Abstract
A novel method has been developed based on the amplitude data of the EM waves measured by Digisondes to calculate and investigate the relative ionospheric absorption changes. The effect of 13 solar flares (> C4.8) that occurred between 06:00 and 16:30 UT from 04 to 10 September 2017 have been studied at three European Digisonde stations (Juliusruh (54.63° N, 13.37° E), Průhonice (49.98° N, 14.55° E) and San Vito (40.6° N, 17.8° E)). Present study compares the results of the amplitude method with the absorption changes measured by the Finnish Riometer Network and determined by the NOAA D-RAP model during the same events. The X-class flares caused 1.5–2.5 dB attenuation at 30–32.5 MHz based on riometer data, while the absorption changes were between 10 and 15 dB in the 2.5–4.5 MHz frequency range according to the amplitude data. The impact caused by the energetic particles after the solar flares are clearly seen in the riometer data, while it can be observed only at Juliusruh (~55°) at some certain cases among the Digisonde stations. Comparing the results of the amplitude method with the D-RAP model it seems evident that the observed values exceed the values given by the model both at 2.5 MHz and at 4 MHz almost always during the investigated period. According to the comparison between the riometer data with the D-RAP, the model underestimates the values obtained from the riometers during the X-class solar flares, while it overestimates the caused impact during the particle events.
Keywords:
space weather
; solar flare
; ionosphere
; ionospheric absorption
; ionosonde data
; HF radio wave absorption
; radio fade-out
; riometer
; D-RAP model
1. Introduction
The ionosphere is a highly dynamic interface between the outer plasma space and the neutral atmosphere. Its state is affected both from above, from the direction of outer space (mainly related to solar activity), and from below, from the neutral atmosphere (e.g., by tropospheric events, sudden stratospheric warmings). The ionosphere influences propagation of electromagnetic (EM) waves depending on their frequency affecting the radio and satellite communication and navigation. The attenuation of EM waves propagating through the ionosphere is most significant in the high frequency (HF) range (3–30 MHz), particularly important for radio-communication, consequently for the commercial and military aircraft operations, too.
Absorption occurs when free electrons in the plasma that are impelled into motion by the radio wave lose their energy through collisions with ions and neutrals. The product of free electron density, furthermore the collision frequency is highest in the D-region (2 × 10⁶ s−1), therefore the radio waves below 10 MHz predominantly attenuate there [1]. The electron collision frequency in this region depends largely on the neutral particle density and temperature. The most intense external force causing further ionization and absorption in the ionosphere is related to solar flares, which emit a huge amounts of EM energy at a broad range of wavelengths for a short period of time (∼30 min to ∼1 h) [2]. According to the emitted flux in 0.1–0.8 nm X-rays measured by the GOES spacecraft flares can be classified as large (X, >10E−4 W/m2), medium-size (M, ∼10E−5–10E−4 W/m2) and small (C, ∼10E−6–10E−5 W/m2). Furthermore, with the number from 0 to 9 within the above written categories applying a finer logarithmic scale. Total radio fade-outs lasting for tens of minutes or even hours can be occurred during flare events as a result of the increased ionization and attenuation of the radio waves caused by the extra radiation [2,3,4,5,6,7]. Enhancement of the D-region electron density and consequently increased radio wave absorption can also be caused by collision with energetic auroral electrons (Auroral Absorption [8]), or with solar energetic protons (Polar Cap Absorption - PCA).
Generally, the ionospheric absorption is measured by riometer (Relative Ionospheric Opacity meter) which record the cosmic radio noise at certain frequencies (~ 20 - 50 MHz frequency range) [9]. Nevertheless, these instruments are generally located at higher latitudes, thus give information about the changes of the ionospheric absorption occurred there [10]. Using data of the Imaging Riometer for Ionospheric Studies (IRIS) at Kilpisjärvi from solar cycle 23 Ogunmodimu et al. [11] identified that the M4 class flare are the less intense ones that still can bear significant influence on Cosmic Noise absorption. They also presented the magnitude of absorption that the different class of solar flares can produce. Data of imaging riometers were also used to investigate the frequency and spatial dependence of short wave fadeouts (e.g., [12,13]).
The minimum frequency (fmin) recorded as the lowest frequency at which an o-mode echo is observed on the ionograms measured by the ionosonde is also a commonly used proxy for the “non-deviative” absorption of the ionosphere [3,4,5,6,7,14,15]. Another way to measure the ionospheric absorption variation by the ionosondes is the analysis of the signal-to-noise ratio of radio waves recorded on the ionograms (SNR method) during solar flares and its comparison with the reference quiet days [16]. This method has been further developed and used to study the absorption changes caused by flare events by de Paula et al. [17]. A novel method has been developed to determine the ionospheric absorption changes from amplitude data measured by European Digisondes (DPS-4D) [18]. The amplitude changes measured at 2.5 MHz—which can be mainly related to the enhanced absorption occurring in the D-layer—varied between 68% and 1430% at the three European stations, Juliusruh, Průhonice and San Vito. The amplitude changes measured at 4 MHz—which indicate the absorption variation in the E- and D-layer together—were between 18% and 565% at the same stations, thus, a bit smaller than in the previous case. Nevertheless, there are two main limitations of the amplitude method: 1) it can not be used at higher frequencies (>3 MHz) during the early morning/evening hours and during negative ionospheric storms caused by geomagnetic disturbances when the value of the foF2 drops below 3 MHz; 2) there are no detected amplitude data at the lower frequency band (2.5–3.5 MHz) after the more intense solar flares (>M3 class) because of the partial or total radio fade-outs (fmin is increased above 4 MHz).
There are multiple ways to model the ionospheric absorption. One of the better-known models is the so-called D-RAP (NOAA D-region Absorption Prediction) model, which uses the 0.1-0.8 nm solar soft X-ray flux observed by the NOAA/NASA GOES satellites. In the papers by Fiori et al. [19,20], a semi-empirical, data-based method to further refine the absorption prediction is introduced. Based on riometer data and taking into account the solar zenith angle of the site of observation, Fiori et al. [19,20] was able to model the impact of a flare with a given X-ray intensity on the ionosphere on different spatial and temporal scales for a higher frequency (30 MHz). Furthermore, there are physics-based absorption models, which solve dispersion equations to evaluate enhanced ionization by solving radiative transport equations [21,22,23]. These models can be more accurate than the semi-empirical ones, however, their run time is much longer which can be a problem to use them for operational purpose [19].
In the present study we compare the results of the amplitude method with the absorption changes measured by the Finnish Riometer Chain and determined by the NOAA D-RAP model during 13 solar flare events occurred in the period 4-10 September, 2017. The paper will be structured as follows: following the present introduction (1) we will describe the used measurement methods and data and detail the used model. The comparison of the ionosonde and riometer data with the D-RAP model values for the same location will be detailed in Section 3. Then beside the discussion of the results the main conclusions will be summarized in Section 4.
2. Methods and Data
We selected thirteen flare events that occurred between 04 and 10 September 2017 for the current analysis. The detailed description of the applied criteria in event selection is described in Buzás et al. [18]. Figure 1. shows the X-ray and proton flux measured at the GOES satellites during the investigated period. The time of the selected flares with their class are indicated by vertical dashed lines. The most important properties of the selected events are detailed in Table 1.
2.1. Ionosonde Measurements – Amplitude Method
Amplitude data from three European ionosonde stations operating with DPS-4D Digisondes (a novel type of ionosonde) were used to calculate the ionospheric absorption. The three stations are (more-or-less) located along a meridional line: Juliusruh (JR, Germany, 54.63° N, 13.37°E), Průhonice (PQ, Czechia, 49.98° N, 14.55°E) and San Vito (VT, Italy, 40.6° N, 17.8° E) (marked by green stars on Figure 2.). The amplitudes (in dB) of the reflected echoes emitted at different sounding frequencies (typically between 1.2 and 12 MHz) and reflected at different heights are received and stored in the Digisonde systems. An ionogram was made every 5 and 15 minutes in the case of JR and VT stations, respectively. The sampling rate was 2 and 15 minutes in the case PQ station during the investigated period. The denser, 2 minutes campaign took place on the 8–9th September.
The amplitude data recorded by the Digisondes at the three investigated stations (JR, PQ, VT) were used to calculate the relative ionospheric absorption of the emitted radio waves following the method proposed by Sales [24]. This method is called the Sales-absorption method or amplitude method and it is based on the Friis-transmission equation [25]. From the Friis-equation, one can derive the loss of a given signal transmitted from an antenna at a certain wavelength which travels along a certain propagation path to arrive at the receiver station (Eq. (1)).
In Eq. (1), L is the loss term, Pt is the power of the transmitted signal, Gt and Gr are the gain of the transmitter and receiver, respectively, λ is the wavelength of the transmitted signal, h is the height of the reflection, and Pr is the power of the transmitter.
However, in order to obtain the loss term, one must determine the PtGtGr product first as it is not known a priori. To do this, each of the Digisonde systems was calibrated based on quiet, nighttime data as described in detail in chapter 2.1 in Buzás et al. [18]. After the PtGtGr product was quantified in the case of every Digisonde system and at different frequency ranges (namely at 2.5, 3.0, 3.5, 4.0, 4.5, 5.0, and 5.5 MHz±200 kHz, respectively), the loss term in Eq. (1) which relates to the absorption could be calculated in dB for the investigated time period.
2.2. Riometer Measurements
The Sodankylä Geophysical Observatory (https://www.sgo.fi/ [26]) operates several traditional La Jolla riometers and novel spectral riometers in Scandinavia (mostly in Finland) forming the Finnish Riometer Network (blue stars in Figure 2.). In the present study, data from the La Jolla riometers are used from the 6 stations listed in Table 2.. These narrow band, widebeam (60°) systems are equipped with a half-wavelength dual dipole antenna. Most of the stations are located in the 25-28o E longitude range (except for ABI), 4 stations (ABI, IVA, SOD, OUL) operate at a frequency of 30 MHz, while 2 stations (ROV, JYV) at a frequency of 32.4 MHz. Absorption values are given in dB relative to the quiet day level in 1 minute time resolution.

Table 2.
Detailed information about the La Jolla riometer stations used in this study. Note that the coordinates (latitude, longitude) are geographic.
Table 2.
Detailed information about the La Jolla riometer stations used in this study. Note that the coordinates (latitude, longitude) are geographic.
| Station | Abbreviation | Latitude | Longitude | Frequency |
| Abisko | ABI | 68.40°N | 18.90°E | 30.0 MHz |
| Ivalo | IVA | 68.55°N | 27.28°E | 30.0 MHz |
| Sodankylä | SOD | 67.42°N | 26.39°E | 30.0 MHz |
| Rovaniemi | ROV | 66.78°N | 25.94°E | 32.4 MHz |
| Oulu | OUL | 65.08°N | 25.90°E | 30.0 MHz |
| Jyväskylä | JYV | 62.42°N | 25.28°E | 32.4 MHz |
2.3. D-RAP Model
The Global D-Region Absorption Prediction (D-RAP) model operated by NOAA’s Space Weather Prediction Center (SWPC) predicts the absorption values occurring mainly in the D-region, ionosphere. The model determines the combined absorption caused by the X-ray changes and the proton events. The D-RAP is a complex prediction model, nevertheless it still has several weaknesses detailed in its validation [27]. Figure 3. (left side) shows the picture of an X8.2 flare event observed by Solar Dynamic Observatory (SDO) and the ionospheric absorption caused by the enhanced X-ray flux as it is determined by the D-RAP model at 16:06 UT on 10 September.
The following program was used to download the D-RAP data: [27]. This python code has been modified in order to collect the data from the coordinates closest to the ionosonde and riometer stations for comparison between the modeled and measured values. D-RAP originally shows all the frequencies where the absorption is at least 1 dB. However, for the comparison we need the absorption of what occurred at certain frequencies (2.5 and 4 MHz for the ionosonde, and 30 or 32 MHz for the riometer measurements). To get the absorption for a fixed frequency the following equation (2) has been used [4]:
Where the original f1 is the frequency for the 1dB absorption, A1 = 1 dB is the one that fixes the absorption value. AC and fC are the values of the input data. To change this equation a bit we will receive the following formula (3):
where the input data are f1 and A1 = 1 dB. Therefore, at a certain frequency (fc), Ac is going to be the absorption value for that given frequency. Then, the time series of the determined absorption value at a given frequency (2.5 and 4 MHz, and 30 or 32 MHz) and a certain location (close to the ionosonde and riometer stations) has been calculated and analyzed (compared with the measured values there).
3. Results
The main aim of the current study is to compare the ionospheric absorption changes occurring during solar flares determined by the recently developed amplitude method with the values predicted by the NOAA D-RAP model. The magnitude of the observed differences between the measured and modeled values can give us feedback about the applicability of the developed method. We also analyze the modeled absorption values and the changes recorded by the Finnish Riometer Network at the same frequency and location during the investigated flares. According to the scientific report [27] of D-RAP the model has been evaluated by observations of riometer stations in the American sector, thus we assume that the difference between the observed and modeled values should not be large. Then we compare the magnitude of the differences between riometer and D-RAP values with the differences between amplitude method results and D-RAP values.
3.1. Comparing the Results of Amplitude Method with D-RAP
The most intense flare events, consequently the largest variation in the ionospheric absorption occurred during the X2.2 and X9.3 flares on 6 September. However, we do not show the occurred changes recorded at 2,5 and 4 MHz by the European ionosondes at midlatitude, because total radio fade-out was detected almost at every investigated digisonde station in most part of the day. Therefore, no measured values are available, especially at 2,5 MHz for comparison with the D-RAP model on that day. Nevertheless, the amplitude data recorded after the blackout are still increased compared with the before the X-class flares period (please see Table 2.). Because of the quite long duration of the fade-outs at 2,5 and 4 MHz we compared the measured values with the modeled ones at the time of the first record after the blackout. In the case of the measured values at 4 MHz it is clearly seen that one of the largest absorptions was detected after the X-class flares on 06 September (with 17 - 23 dB at the different stations). The absorption variation measured by the three ionosonde stations and determined by the D-RAP model on 08 September are seen in Figure 4. Two M-class flares occurred on that day (M8.1 and M 2.9 with the peak times 7:49 and 15:47 respectively) as it can be recognised in the X-ray flux changes (upper plot). Total radio blackout occurred at every investigated station after the M8.1 flare (example of ionograms are shown in Supplementary Figure S1.). The detected duration of the blackout event at 2.5 MHz changed with latitude, higher the latitude longer the caused impact. The observed values varied between ~ 10 and 25 dB in the periods before and after the investigated M8.9 and M2.9 class flares. The increased values of the absorption as a result of the flares is more remarkable at 2.5 MHz, while it is difficult to recognise at 4 MHz. It is also worth to mention here, that the time resolution of the recorded data is also an important factor, e.g., PQ with 2 min resolution nicely follows the changes of the X-ray curve during the M2.9 flare at 2.5 MHz, while at San Vito with 15 min resolution is not that remarkable, but still can be recognised. Comparing the measured with the values determined by D-RAP we can conclude that the recorded values exceed the estimated ones by D-RAP almost always during the day. Therefore the model underestimates the ionospheric absorption. E.g. at the peak time of the M2.9 flare (what did not caused total radio blackouts) the D-RAP predicted 9-10 dB absorption at 2.5 MHz at the location of the three European Digisonde stations, while the observed values varied between ~ 17 and 23 dB at 2.5 MHz (Figure 4, and Table 2.). At 4 MHz the model determined ~ 4.7-5.1 dB values, while the recorded ones were ~ 23 – 27 dB. Therefore, there are 2-4 time differences between the modeled and observed values during that event.
Figure 5. shows the X-ray, proton flux and absorption changes at 2.5 and 4 MHz based on the amplitude method during an X8.2 flare on 10 September (example of ionograms recorded during the flare event are seen in Supplementary Figure S2.). Increased amplitude values compared to the before flare period were detected at both frequencies at every station. The detected absorption values increased from ~ 10dB to ~ > 20 dB at both frequencies at Juliusruh (where there was no fade-out). It means that the flare caused ~ 10 dB changes at both frequencies. Thus the more intense flare compared to the previous cases has a clear impact on the measured data. The impact of the energetic particles can be recognised also at Juliusruh sub-auroral station at 2.5 MHz. The model underestimated the measured absorption values most of the time according to the careful comparison of the measured (green dots) with the modeled ones (red curve). It predicts the absorption close to zero before the flare, while the detected values are ~ 10 dB at most of the stations even before the flare. It is worth to note that the changes of the recorded values has the larger variation (within the period before the flare) at San Vito station, where the cadence of the measurements is the longest (15 min) among the three stations. Furthermore, the predicted values at the peak time of the flare was ~ 16 and ~ 8 dB at 2.5 and 4 MHz respectively, while the observed ones were a bit larger (~ 19 dB) at 2.5 MHZ and much more larger (~ 23 dB) at 4 MHz. Moreover, D-RAP does not take into account the impact of the particles at Juliusruh, however it can be seen in the observation at 2.5 MHz.
Table 2 presents the measured (upper part) and the modeled (lower part) values at 2.5 MHz at the three ionosonde stations. The date, and the class of the selected flares are seen respectively at the first two columns. In some cases quite long total radio fade-out occurred during and after the flares, thus we decided to do the comparison between the measured and modeled values at the time of the first record (ionogram) after the blackout (Measured and modelled values at the peak time of the investigated flares are shown in Supplementary Table S2.). The time of the peak, or the first record after the fade-outs are shown in the 3rd column, while the X-ray flux at that time is in the 4th column. The absorption values calculated by the amplitude method at JR, PQ and VT are shown respectively in the next columns. Table 3 shows the same but for 4 MHz. Looking through the values the picture seems to be quite complicated. According to the D-RAP values (lower part of the Tables) the more intense flares caused larger changes in the ionospheric absorption. While the time of the investigated impact also plays an important role, e.g., the effect of the C8.3 flare which occurred around noon (peak time is 12:22 UT) is larger than the response to the X-class flares in the afternoon hours. It is true also for the measured values, larger at the time C8.3 flare than e.g., at 15:15 after an X1.3 flare on 07. September. This is not that evident for the values recorded at 4 MHz (upper part of Table 3.) Nevertheless, it is clear from Table 2. and Table 3. that the measured values almost always increase the modeled ones, and sometimes the first ones can be 2-3 times larger than those determined by the D-RAP. Consequently, the model underestimates the absorption occurred during and after increased X-ray flux.
Table 2.
The values measured by the Digisondes and determined by D-RAP at 2.5 MHz at the peak time of the flare, or - in a case of fade-out - at the first measurement time after it.
Table 2.
The values measured by the Digisondes and determined by D-RAP at 2.5 MHz at the peak time of the flare, or - in a case of fade-out - at the first measurement time after it.
| Measured values at 2.5 MHz | ||||||
| Date | Class | Time (UT) of peak or of first record after Fadeout | X-ray flux at that time | JR | PQ | VT |
| 2017-9-4 | C8.3 | 12:22 | 8.5162E-07 | 17.120 | 23.828 | 21.122 |
| 2017-9-4 | M1.5 | 15:30 | 3.1434E-06 | 8.127 | 20.256 | 12.7977 |
| 2017-9-5 | M3.2 | 4:53 | - | 3.99734 | 6.773 | 8.239 |
| 2017-9-5 | M3.8 | 6:40 | 9.8452E-06 | 13.6911 | 18.288 | 16.611 |
| 2017-9-6 | X2.2 | 15:15 | 1.9817E-06 | 15.41 | 20.3 | 19.4613 |
| 2017-9-6 | X9.3 | 15:15 | 1.9817E-06 | 15.41 | 20.3 | 19.4613 |
| 2017-9-7 | M1.4 | 10:30 | 9.9090E-08 | 20.44 | 22.124 | 22.4674 |
| 2017-9-7 | M7.3 | 10:30 | 9.9090E-08 | 20.44 | 22.124 | 22.4674 |
| 2017-9-7 | X1.3 | 15:15 | 3.3895E-06 | 15.96 | 23.6961 | 15.4766 |
| 2017-9-8 | M8.1 | 8:45 | 1.6497E-07 | 15.67 | 19.46 | 22.0385 |
| 2017-9-8 | M2.9 | 15:47 | 7.1936E-06 | 17.4162 | 23.627 | 18.15 |
| 2017-9-9 | M3.7 | 12:15 | 2.9838E-07 | 15.06 | 24.01 | 21.6762 |
| 2017-9-10 | X8.2 | 16:45 | 5.1431E-05 | 19.04 | 22.3796 | 12.7332 |
| D-RAP determined values at 2.5 MHz | ||||||
| Date | Class | Time (UT) of peak or of first record after Fadeout | X-ray flux at that time | JR | PQ | VT |
| 2017-9-4 | C8.3 | 12:22 | 8.5162E-07 | 15,14 | 17,58 | 19,16 |
| 2017-9-4 | M1.5 | 15:30 | 3.1434E-06 | 7,88 | 8,85 | 7,88 |
| 2017-9-5 | M3.2 | 4:53 | - | 2,10 | 1,66 | 3,00 |
| 2017-9-5 | M3.8 | 6:40 | 9.8452E-06 | 11,99 | 13,54 | 16,80 |
| 2017-9-6 | X2.2 | 15:15 | 1.9817E-06 | 12,83 | 13,54 | 12,83 |
| 2017-9-6 | X9.3 | 15:15 | 1.9817E-06 | 12,83 | 13,54 | 12,83 |
| 2017-9-7 | M1.4 | 10:30 | 9.9090E-08 | 6,27 | 7,17 | 8,00 |
| 2017-9-7 | M7.3 | 10:30 | 9.9090E-08 | 6,27 | 7,17 | 8,00 |
| 2017-9-7 | X1.3 | 15:15 | 3.3895E-06 | 12,83 | 14,40 | 13,54 |
| 2017-9-8 | M8.1 | 8:45 | 1.6497E-07 | - | - | - |
| 2017-9-8 | M2.9 | 15:47 | 7.1936E-06 | 9,61 | 10,39 | 9,61 |
| 2017-9-9 | M3.7 | 12:15 | 2.9838E-07 | 14,40 | 16,80 | 18,36 |
| 2017-9-10 | X8.2 | 16:45 | 5.1431E-05 | 6,60 | 6,83 | 3,35 |
3.2. Comparing the Riometer Data with D-RAP
On 6th September the X9.3 flare caused ~ 1.6 – 2.6 dB changes in the ionospheric absorption according to the riometer data. The largest changes (2.6 dB) occurred at ABI station, while the smallest one (1.6) was recorded at JYV. Nevertheless, no clear latitudinal (or solar zenith angle) dependence can be recognized based on the results (Figure 6., Table 4. ). The flare was accompanied by an energetic particle event as it can be seen in the 30 and 60 MeV proton flux measured by the GOEs satellite (upper plots on Figure 6.). The energetic particles caused ~ 0.3-1.2 dB variation in the absorption data. Clear latitude dependence can be recognized in the ionospheric response in this case, larger the latitude greater was the detected absorption changes.
The D-RAP model predicted ~1-2.4 dB for the ionospheric absorption during and after the X9.3 flare, with clear latitudinal dependence, larger the latitude greater the predicted values. However, it determined smaller absorption almost in all cases than it was detected by the riometers at the same frequency and the same location (Table 4.). The absorption varied between ~ 0.7-2.2 dB with clear latitudinal dependence (from North to South) after the increased proton flux based on the D-RAP model. However, it is very striking from Figure 6 that the model overestimates the absorption generated by the energetic particles at every latitude compared with the values recorded in the riometer stations. The difference is larger at higher latitudes than at lower latitudes.
Similar results were detected during the X8.2 solar flare that occurred at ~ 16 UT on 10th of September. The X-class flare caused ~ 0.4 – 1 dB changes in the ionospheric absorption according to the riometer data (Figure 7., Table 4.). Larger detected changes seem to be at the higher latitudes (ABI, SOD ~ 1 dB, IVA is an exception with ~ 0.4 dB) than at the lower latitudes (OUL, JYV, ~ 0.6-0.7 dB). This flare was also accompanied by an energetic particle event. Proton flux (at 10, 30 and 60 MeV as well) enhanced ~ 20 min after the peak time of the flare. The induced absorption values recorded at the riometer stations as a result of the energetic particles varied between ~ 0.2 – 2.3 dB. The observed changes showed a clear latitude dependence, at higher latitudes (ABI) reached 2.3 dB and it decreased with latitude, until it became negligible at OUL and JYV stations. The D-RAP model underestimated the effect caused by the increased X-ray flux at every station, since it determined only ~ 0.15 – 0.26 dB values (Figure 7. and Table 4.). On the contrary, the model overestimated the impact of the energetic particles, especially at higher latitudes (ABI, IVA) where the predicted values for 18 UT reached ~ 2.6 – 3.4 dB, which is ~ 2 times higher than the observed values at the same time. In summary, the D-RAP model underestimates the values obtained from the riometers during the solar flares (X-ray flux changes) while it overestimates the caused impact during the particle events based on the investigated events.
Looking through the absorption values recorded by the riometers during the selected events (Table 4.) we can conclude that generally the X-class solar flares had a larger impact (~ 1-2.6 dB) than the M-class flares (~ 0.1 - 0.7 dB). (Detailed information for the flare and energetic particle events are seen in in Supplementary Table S1.) Interestingly, the largest detected values (~ 1.2 - 4.1 dB) were during an M2.9 class flare (peak time: 15:47) on 08 September (this conclusion is also true for the ionosonde data). Nevertheless, the duration of the increased X-ray flux took almost two hours (upper plot on Figure 4.) during this event, that can be a reason that the integrated effect on the ionospheric absorption was the highest in this case. Thus, the duration of the flare event seems to be an important parameter. Looking through the recorded values during the flares separately we can not see a clear latitudinal dependence of the caused impact. Looking through the recorded values during the flares separately we can not see a clear latitudinal dependence of the caused impact. Comparing the observed values with the predicted ones, we can say that the model generally underestimates the effect as a result of the X-class solar flares, however the determined D-RAP values are agree well with observed ones during the M-class flares, or sometimes even overestimates them at higher latitudes (e.g., M3.2 and M3.8 flare on 05 September). The comparison of the model and the measurements during the two investigated energetic particle events were detailed above.
4. Discussion and Concluding Remarks
The ionospheric response to 13 solar flares that occurred in the period 4-10 September, 2017 were investigated in the current study with a special focus to the ionospheric absorption changes. A new observation method to determine the absorption variation has been developed by Buzás et al. (2023) [18], based on the amplitude data detected by the Digisondes. The absorption changes that occurred during the 13 above mentioned flares have been carefully analyzed in the previous study. However, the method has not been compared with a model for the ionospheric absorption. Present study aims to fill this gap.
Most commonly used model for the ionospheric absorption determination globally is the D-RAP (D Region Absorption Predictions) developed by the Space Weather Prediction Center of NOAA (National Oceanic and Atmospheric Administration). Previous studies found that the D-RAP model underestimates the ionospheric absorption changes during solar flares [29]. Our results generally agree with this, the D-RAP model underestimates the caused ionospheric absorption changes as a results of the enhanced X-ray flux even at 2.5-4 MHz range (ionosonde data, Figure 4 and Figure 5.) and at higher frequencies (30-32 MHz, riometer data, Figure 6 and Figure 7.) especially during the X-class flares. Moreover, the observed values are larger at most of the time than the predicted ones at 2.5 and at 4 MHz not only at the periods under the impact of the solar flares (Figure 4 and Figure 5.). The main reason for the underestimation can be that the D-RAP model was originally based on the results of Stonehocker [30] what used a limited data set from one station from New Mexico (low-latitude) detected at 5 MHz (instead of the 30 MHz generally used by riometers) during noon is summertime [19]. As the scientific report of D-RAP described [27], the model has been evaluated using data from several riometer stations but only from the American sector during several historic representative events. However, riometers operate only at high latitudes and at high frequencies (the data investigated in the report have been measured at stations with a latitude higher than 50° and at f >= 30 MHz), thus their data can not be representative for the whole globe (especially lower latitudes). A further explanation is that the absorption changes related to auroral particle (electron) precipitation has not been considered in the model [27].
The period between 04 - 10 September 2017 was the most active period of the Sun to produce solar flares in the Solar Cycle 24. The X9.3 class flare occurred at noon (peak time is 12:02 UT) on 06 September is the most intense detected solar flare of the decade. According to our results it caused ~ 1,5 hours total radio fade-out at every investigated ionosonde stations. While the duration of the blackout during the X2.2 flare (peak time 09:10 UT on 06 September) varied between 25 - 90 min depending on the latitude (solar zenith angle, shortest at Juliusruh and longest at San Vito). Our results agree well with the previous findings, the ionospheric impact of these two events were carefully discussed in the literature because of the severity of them. Kolarski et al. [31] has shown that the electron density in the lower ionosphere (70-80 km height) increased by ~2-3 orders of magnitude during the X-class solar flares on 06 September. Fagundes et al. [32] reported that the total radio blackouts lasted for about 45 min during the X2.2 flare, while the duration of the blackout caused by the X9.3 flare was ~ 1,5 hours. The detected duration of the fade-outs in our study agree very well with this. According to their results the fade-out was seen over global extent which demonstrates the severity of the caused ionospheric absorption changes. Curto et al. [16] demonstrated that the HF absorption took for more than 3 hours at Ebro station during the X9.3 class event. Based on their results, although the X-ray flux agree with a category of X-class lasted only for a few minutes the radiation remained in the category of class M, consequently the HF absorption is sensitive also to the fainter (M class) solar flares. Our results also confirm this state, since increased values of the fmin parameter [18] and even 10 - 14 dB enhancement of the loss values determined by the amplitude data recorded at the different stations were found during the M class flares of the investigated period. The riometers detected 1.1 - 1.5 dB cosmic noise absorption during the X2.2 flare which agree with the values reported by Sinha et al. [33], 1 - 2 dB during X2 and X2.2 solar flares. The measured values varied between 1.6 and 2.6 dB in the case of the X9.3 flare event (Table 4.).
It has been extensively discussed in the literature that the ionospheric absorption changes greatly depend on the class of the flare, thus on the enhancement of the X-ray flux that causes the increased ionization and attenuation of the electromagnetic waves in the ionospheric plasma. It has been demonstrated using riometer (e.g., [33,34]) and different ionosonde data (e.g., [5,6,18]) as well. Our results regarding the absorption values recorded by the riometers also confirm this, generally the X-class solar flares had a larger impact (~ 1-2.6 dB) than the M-class flares (~ 0.1 - 0.7 dB, Table 4.).
Beside the X-ray flux enhancement itself the solar zenith angle of the observation site at the time of the flare events is also an important factor to determine the caused changes. The impact of 43 solar flares (37 M-class and 6 X-class) on the ionospheric absorption was investigated using riometer data from Abisko in the northern hemisphere [33]. According to their results the solar zenith angle (SZA) plays a crucial role in the ionospheric response. The detected absorption was smaller in the case of higher SZA (e.g., 1 dB when SZA ~ 82.3° for X2 class) then under smaller SZA but with similar intensity (2 dB when SZA ~ 45.6° for X2.2 class). It agrees well with the previous findings based on ionosonde data (fmin and also amplitude method), that the larger the SZA the larger the caused impact in the ionospheric absorption [5,6,18]. Our present results in the case of the ionosonde data also confirms this solar zenith angle dependence. However, the role of the solar zenith angle for the caused changes in the ionospheric absorption as a result of the flares is not that clear based on the riometer data in the present case. For example the impact of the X8.2 flare on 10 September seems to be higher at the higher latitude stations (e.g., 1 db at ABI and SOD) than at the lower latitude stations (~ 0.6 dB at OUL and JYV, Figure 7. and Table 4.). Nevertheless, Sinha et al. [33] discussed that other factors, like the latitudinal position of the station and background conditions can also play an important role in the cosmic radio noise absorption at high latitudes beside the flare intensity and the solar zenith angle.
Some of the investigated flare events were accompanied by increased flux of energetic protons, the X9.3 flare (peak time at 12:02) on 06 September and the X8.2 flare (peak time 16:06) on 10 September as it is shown in the upper plots of Figure 5, Figure 6 and Figure 7. The absorption changes caused by the energetic protons on 10 September were even detectable at the sub-auroral region, at 2.5 MHz at Juliusruh station (Figure 5.). This extra absorption related to the particle event was not determined by the D-RAP model. The impact of the increased proton flux was recorded at the riometer data in both cases with a clear latitude dependence, larger the latitude greater the observed values. The latitude dependent enhancement of the ionospheric absorption at higher latitudes as a result of the increased proton flux (solar proton events) has already discussed in the literature (see e.g., [35,36,37]). In the case of the 06 September event the D-RAP model overestimated the effect of the energetic particles at every station (Figure 6.). While in the other case it over- and underestimated the caused impact depending on the stations. Furthermore, the model predicted a second peak for the absorption around 18:00 UT on 10 September which is not visible at the observed data at all (Figure 7.). At this time the model overestimated the increased absorption at almost every station (except JYV). The determined values were almost 2 times higher at the higher latitude stations (ABI, IVA) than the observed ones. The D-RAP global model uses a linear relationship between absorption and the square root of the integral proton flux for the proton events, based on the observation of a single high-latitude station. Akmaev et al. [27] discussed that D-RAP often misrepresents the occurred absorption changes and it can be only considered as a qualitative indicator of absorption. Recently, Rogers and Honary (2015 [38]) suggested an optimized D-RAP modeling approach based on data observed during 94 solar proton events, and reached a better agreement between the measured and modeled values. Fiori and Danskin [36] also highlighted that a single constant of proportionality derived from data of one high latitude stations [39] can no longer to be used to determine the ionospheric absorption and analyzed data from lower latitude stations (up to 58° MLAT) to define a factor what varies as a function of magnetic latitude leading to a much improved fit compared to the D-RAP model.
Despite the large discrepancy between riometer and other observations and the modeled values, D-RAP is the most accepted and widely used model to determine the ionospheric absorption, thus the degradation of HF waves used for radio communication and aviation (see e.g., [40]). Our results agree with previous papers that suggested that the D-RAP model should be significantly improved to carefully determine the ionospheric absorption changes as a result of solar flares [20,21,23]. Nevertheless, based on the present results the amplitude method seems to be applicable to detect the ionospheric absorption changes during flare events taking into consideration its limitations (that it can produce high values during twilight and during negative ionospheric storms when the foF2 is low, more details in [18].
The most important results of the study can be summarized as follows:
- The X-class flares caused 1–2.6 dB attenuation at 30–32.5 MHz based on riometer data (Figure 6 and Figure 7.), while the absorption changes were between 10 and 15 dB in the 2.5–4.5 MHz frequency range (thus 10 times higher) according to the amplitude data measured by the Digisondes (Figure 4 and Figure 5.).
- The ionospheric response to X-ray flux changes (flares) at midlatitude measured by the ionosondes show a solar zenith angle dependence (Figure 4 and Figure 5.), this dependence is not evident for the case of the riometers measurement ( Figure 6 and Figure 7.). It is true also for the results of the D-RAP model regarding the same flares and same coordinates (Figure 4, Figure 5, Figure 6 and Figure 7.).
- The impact caused by the energetic particles after the solar flares are clearly seen in the riometer data (Figure 6 and Figure 7.), while it can be observed only at Juliusruh (~55°) in some certain cases (Figure 5.) among the Digisonde stations. Consequently, the absorption changes as a result of the particle precipitation is significant at high latitudes, but decreases rapidly with decreasing latitude, and is no longer detectable below the sub-auroral region.
- The main conclusion from the comparison of the riometer data with the D-RAP model is that the model underestimates the values obtained from the riometers during the X-class solar flares (X-ray flux changes) while it overestimates the caused impact during the particle events (Figure 6 and Figure 7.).
- According to the current results the amplitude method seems to be applicable to detect the ionospheric absorption changes during flare events taking into consideration its limitations.
Supplementary Materials
The following supporting information can be downloaded at the website of this paper posted on Preprints.org, Figure S1: Consequtive ionograms recorded at Pruhonice ionosonde station during and after an M8.1 class flare (between 07:45-08:40) on 08 September. The total radio fade-out is clearly seen on the ionograms. Figure S2: Consequtive ionograms recorded at San Vito ionosonde station during and after an X8.2 class flare (between 15:45-16:30) on 10 September. The total radio fade-out is clearly seen on the ionograms. Table S1: Detailed data of the investigated flare and energetic particle events. Date, maximum X-ray or proton flux (measured at different chanels) and the exact time of the maximum. Table S2: The values measured by the Digisondes and determined by D-RAP at 2.5 and at 4 MHz at the peak time of the investigated flares.
Author Contributions
VB was the conceptual author of the study, performed the scientific analysis and comparison of the different data and wrote the main part of the text. AB performed the amplitude method analysis of the Digisonde data. BT analyzed the data of the Finnish Riometer Network. DPS downloaded the data of the D-RAP model and produced the time series of them for the investigated events. VB, AB, BT and DPS produced the figures and the Tables of the study. JM was responsible for the data from Juliusruh. DK was responsible for the data from Pruhonice. TR was responsible for the data of the Finnish Riometer Network. All authors contributed to the article and approved the submitted version.
Funding
This work was supported by OTKA, Hungarian Scientific Research Fund (Grant No. PD 141967) of the National Research, Development and Innovation Office. The contribution of VB was also supported by Bolyai Fellowship (GD, No. BO/00461/21). The authors appreciate support of the bilateral project of the Czech Academy of Sciences and Hungarian Academy of Sciences, title: Multiinstrumental investigation of the midlatitude ionospheric variability (n. MTA-19-03 and NKM 2018-28) in facilitating scientific communication.
Data Availability Statement
The datasets presented in this study can be found in online repositories. The names of the repository/repositories and access number(s) are the following: Global Ionospheric Radio Observatory http://giro.uml.edu ; NASA/GSFC’s OMNI data set through OMNIWeb https://omniweb.gsfc.nasa.gov/ ; GOES 11 and 12 data, National Oceanic and Atmospheric Administration https://satdat.ngdc.noaa.gov/sem/goes/data/avg/ ; Hinode flare catalog https://hinode.isee.nagoya-u.ac.jp/flare_catalogue/ ; SAO-X software https://ulcar.uml.edu/SAO-X/SAO-X.html , Finnish Riometer Network https://www.sgo.fi/ , D Region Absorption Prediction (D-RAP) model, operated by the Space Weather Prediction Center (SWPC) of the National Oceanic and Atmospheric Administration (NOAA) https://www.swpc.noaa.gov/content/global-d-region-absorption-prediction-documentation
Acknowledgments
The authors wish to express their gratitude to the late Dr. Gary Sales who made a substantial contribution in developing the absorption method used in this study and to Prof. Bodo Reinisch who attracted our attention to this method. The authors wish to thank the OMNIWeb data center for providing web access to the solar data of the Geostationary Operational Environmental Satellites (GOES) satellites.
Conflicts of Interest
The authors declare no conflicts of interest.”
References
- Zolesi, B.; Cander, L. Ionospheric Prediction and Forecasting, Springer Geophysics, Springer Heidelberg New York Dordrecht London, 2014. [CrossRef]
- Tsurutani, B.T.; Verkhoglyadova, O.P.; Mannucci, A.J.; Lakhina, G.S.; Li, G.; Zank, G.P.; et al. A brief review of “solar flare effects” on the ionosphere. Radio Sci. 2009, 44, 1–14. [Google Scholar] [CrossRef]
- Rishbeth, H.; Garriot, O.K. Introduction to Ionospheric Physics. Int. Geophys. Ser. 1969, Vol. 14, Academic Press, NY.
- Davies, K.; Ionospheric radio (No. 31). IET.; 1990.
- Barta, V.; Sátori, G.; Berényi, K.A.; Kis, Á.; and Williams, E. Effects of solar flares on the ionosphere as shown by the dynamics of ionograms recorded in Europe and South Africa. Annales Geophysicae 2019, 37, 747–761. [Google Scholar] [CrossRef]
- Tao, C.; Nishioka, M.; Saito, S.; Shiota, D.; Watanabe, K.; Nishizuka, N.; et al. Statistical analysis of short-wave fadeout for extreme space weather event estimation. Earth, Planets Space 2020, 72, 173. [Google Scholar] [CrossRef]
- Barta, V.; Natras, R.; Srećković, V.; Koronczay, D.; Schmidt, M.; Šulic, D. Multi-instrumental investigation of the solar flares impact on the ionosphere on 05-06 December 2006. Front. Environ. Sci. 2022, 10, 904335. [Google Scholar] [CrossRef]
- Fiori, R.A.D.; Trichtchenko, L.; Balch, C.; Spanswick, E.; Groleau, S. Characterizing auroral-zone absorption based on global Kp and regional geomagnetic hourly range indices. Space Weather 2020, 18, e2020SW002572. [Google Scholar] [CrossRef]
- Little, C.G. High latitude ionospheric observations using extra-terrestrial radio waves. Proc. IRE 1954, 42, 1700. [Google Scholar] [CrossRef]
- Stauning, P. Investigations of ionospheric radio wave absorption processes using imaging riometer techniques. J. Atmos. solar-terrestrial Phys. 1996, 58, 753–764. [Google Scholar] [CrossRef]
- Ogunmodimu, O.; Honary, F.; Rogers, N.; Falayi, E.O.; Bolaji, O.S. Solar flare induced cosmic noise absorption. NRIAG Journal of Astronomy and Geophysics 2018, 7, 31–39. [Google Scholar] [CrossRef]
- Honary, B.; Hargreaves, J.; Browne, S. An imaging riometer for ionospheric studies. Electronics & Communication Engineering Journal 1995, 7, 209–217. [Google Scholar] [CrossRef]
- Kero, A.; Enell, C.-f.; Ulich, T.; Turunen, E.; Rietveld, M.T.; Honary, F.H. Statistical signature of active. D-region HF heating in IRIS riometer data from 1994-2004. Annales Geophysicae 2007, 25, 407–415. [Google Scholar] [CrossRef]
- Sripathi, S.; Balachandran, N.; Veenadhari, B.; Singh, R.; and Emperumal, K. Response of the equatorial and low-latitude ionosphere to an intense X-class solar flare (X7/2B) as observed on 09 August 2011. J. Geophys. Res. Space Phys. 2013, 118, 2648–2659. [Google Scholar] [CrossRef]
- Nogueira, P.A.B.; Souza, J.R.; Abdu, M.A.; Paes, R.R.; Sousasantos, J.; Marques, M.S.; ... & Cueva, R.Y.C. Modeling the equatorial and low-latitude ionospheric response to an intense X-class solar flare. Journal of Geophysical Research: Space Physics 2015, 120, 3021–3032. [CrossRef]
- Curto, J.J.; Marsal, S.; Blanch, E.; and Altadill, D. Analysis of the solar flare effects of 6 September 2017 in the ionosphere and in the Earth’s magnetic field using Spherical Elementary Current Systems. Space weather. J. 2018, 16, 1709–1720. [Google Scholar] [CrossRef]
- de Paula, V.; Segarra, A.; Altadill, D.; Curto, J.J.; Blanch, E. Detection of Solar Flares from the Analysis of Signal-to-Noise Ratio Recorded by Digisonde at Mid-Latitudes. Remote Sensing 2022, 14, 1898. [Google Scholar] [CrossRef]
- Buzás, A.; Kouba, D.; Mielich, J.; Burešová, D.; Mošna, Z.; Koucká Knížová, P.; and Barta, V. Investigating the effect of large solar flares on the ionosphere based on novel Digisonde data comparing three different methods. Frontiers in Astronomy and Space Sciences 2023, 10. [Google Scholar] [CrossRef]
- Fiori, R.A.D.; Chakraborty, S.; Nikitina, L. Data-based optimization of a simple shortwave fadeout absorption model. Journal of Atmospheric and Solar-Terrestrial Physics 2022, 230, 105843. [Google Scholar] [CrossRef]
- Fiori, R.A.D.; Rogers, N.C.; Nikitina, L.; Lobzin, V.; Rock, E. Duration and extent of solar X-ray flares and shortwave fadeouts likely to impact high frequency radio wave propagation based on an evaluation of absorption at 30 MHz. Journal of Atmospheric and Solar-Terrestrial Physics 2023, 252, 106148. [Google Scholar] [CrossRef]
- Eccles, J.V.; Hunsucker, R.D.; Rice, D.; Sojka, J.J. Space weather effects on midlatitude HF propagation paths: Observations and a data-driven D-region model. Space Weather 2005, 3. [Google Scholar] [CrossRef]
- Levine, E.V.; Sultan, P.J.; Teig, L.J. A parameterized model of X-ray solar flare effects on the lower ionosphere and HF propagation. Radio Sci. 2019, 54, 168–180. [Google Scholar] [CrossRef]
- Chakraborty, S.; Baker, J.B.H.; Fiori, R.A.D.; Ruohoniemi, J.M.; Zawdie, K.A. A model framework to estimate ionospheric HF absorption produced by solar flares. Radio Sci. 2021, 56. [Google Scholar] [CrossRef]
- Sales, G.S. HF absorption measurements using routine digisonde data, Conference material, XII. Lowell, MA: International Digisonde Forum, University of Massachusetts. 2011.
- Friis, H.T. A note on a simple transmission formula. Proc. IRE 1946, 34, 254–256. [Google Scholar] [CrossRef]
- Website: https://www.sgo.fi/.
- Akmaev, R.A.; Newman, A.; Codrescu, M.; Schulz, C.; Nerney, E. D-RAP model validation: I. Scientific report. 2010, [Available at https:// www.ngdc.noaa.gov/stp/drap/DRAP-V-Report1.pdf.].
- Website: https://github.com/hayesla/NOAA-DRAP-Analysis/tree/master.
- Schumer, E.A. Improved Modeling of Midlatitude D-Region Ionospheric Absorption of High Frequency Radio Signals during Solar X-Ray Flares, PhD Dissertation, 2009, AFIT/DS/ENP/09-J01, U.S. Air Force. Wright-Patterson Air Force Base, Ohio.
- Stonehocker, G.H.; Advanced telecommunication forecasting technique in AGY, 5th., Ionospheric forecasting. AGARD (Advis. Group Aerosp. Res. Dev) Conf. Proc. 1970, 29, 27–31.
- Kolarski, A.; Veselinović, N.; Srećković, V.A.; Mijić, Z.; Savić, M.; and Dragić, A. Impacts of extreme space weather events on september 6th, 2017 on ionosphere and primary cosmic rays. Remote Sensing 2023, 15, 1403. [Google Scholar] [CrossRef]
- Fagundes, P.R.; Pezzopane, M.; Habarulema, J.B.; Venkatesh, K.; Dias, M.A.L.; Tardelli, A.; ... Seemala, G.K. Ionospheric disturbances in a large area of the terrestrial globe by two strong solar flares of September 6, 2017, the strongest space weather events in the last decade. Advances in Space Research 2020, 66, 1775–1791. [CrossRef]
- Sinha, S.; Vichare, G.; Sinha, A.K. Hemispheric comparison of solar flare associated cosmic noise absorption (SCNA) from high latitude stations: Maitri (70.75° S, 11.75° E) and Abisko (68.4° N, 18.9° E). Frontiers in Astronomy and Space Sciences 2024, 11, 1347874. [Google Scholar] [CrossRef]
- He, L.; Nishino, M.; Zhang, B.; Liu, R.; Liu, Y.; Liu, S.; ... Yamagishi, H. Absorption events associated with solar flares. Chinese Science Bulletin 2001, 46, 369–372. [CrossRef]
- Romano, V.; Cerrone, M.; Perrone, L.; Pietrella, M. Magnetic and solar effects on ionospheric absorption at high latitude. Annals of Geophysics 2002, 45. [Google Scholar] [CrossRef]
- Fiori, R.A.D.; and Danskin, D.W. Examination of the relationship between riometer-derived absorption and the integral proton flux in the context of modeling polar cap absorption. Space Weather 2016, 14, 1032–1052. [Google Scholar] [CrossRef]
- Heino, E.; Verronen, P.T.; Kero, A.; Kalakoski, N.; Partamies, N. Cosmic noise absorption during solar proton events in WACCM-D and riometer observations. Journal of Geophysical Research: Space Physics 2019, 124, 1361–1376. [Google Scholar] [CrossRef]
- Rogers, N.C.; Honary, F. Assimilation of real-time riometer measurements into models of 30 MHz polar cap absorption, J. Space Weather Space Clim. 2015, 5, A8. [Google Scholar] [CrossRef]
- Sellers, B.; Hanser, F.A.; Stroscio, M.A.; Yates, G.K. The night and day relationships between polar cap riometer absorption and solar protons. Radio Sci. 1977, 12, 779–789. [Google Scholar] [CrossRef]
- National Research Council Severe Space Weather Events—Understanding Societal and Economic Impacts: A Workshop Report, 2008, 144 pp., Natl. Acad. Press, Washington, D.C.
Figure 1.
Solar X-ray and solar proton flux during the investigated period (4-10 September 2017, updated from Buzás et al. [18]. We will use X-ray and proton flux names during the manuscript which refer to the solar ones.
Figure 1.
Solar X-ray and solar proton flux during the investigated period (4-10 September 2017, updated from Buzás et al. [18]. We will use X-ray and proton flux names during the manuscript which refer to the solar ones.
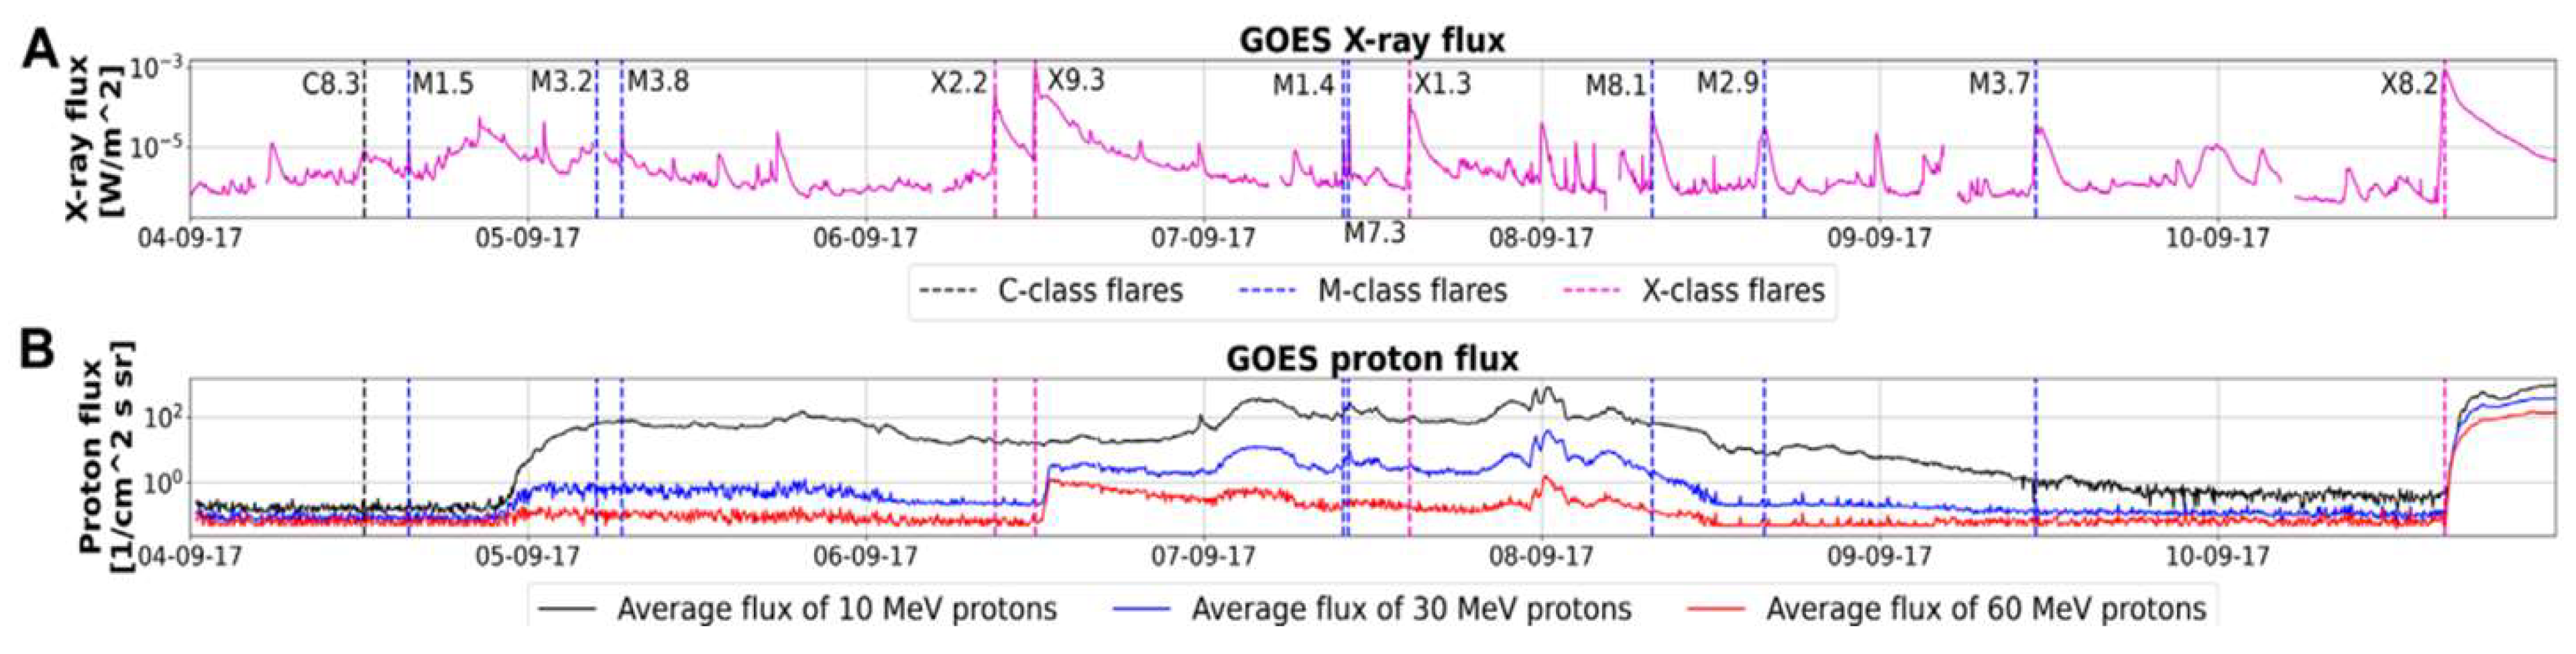
Figure 2.
The geographical locations of the used riometer (blue stars) and ionosonde (green stars) stations, with the abbreviated names (codes) of the observation sites.
Figure 2.
The geographical locations of the used riometer (blue stars) and ionosonde (green stars) stations, with the abbreviated names (codes) of the observation sites.
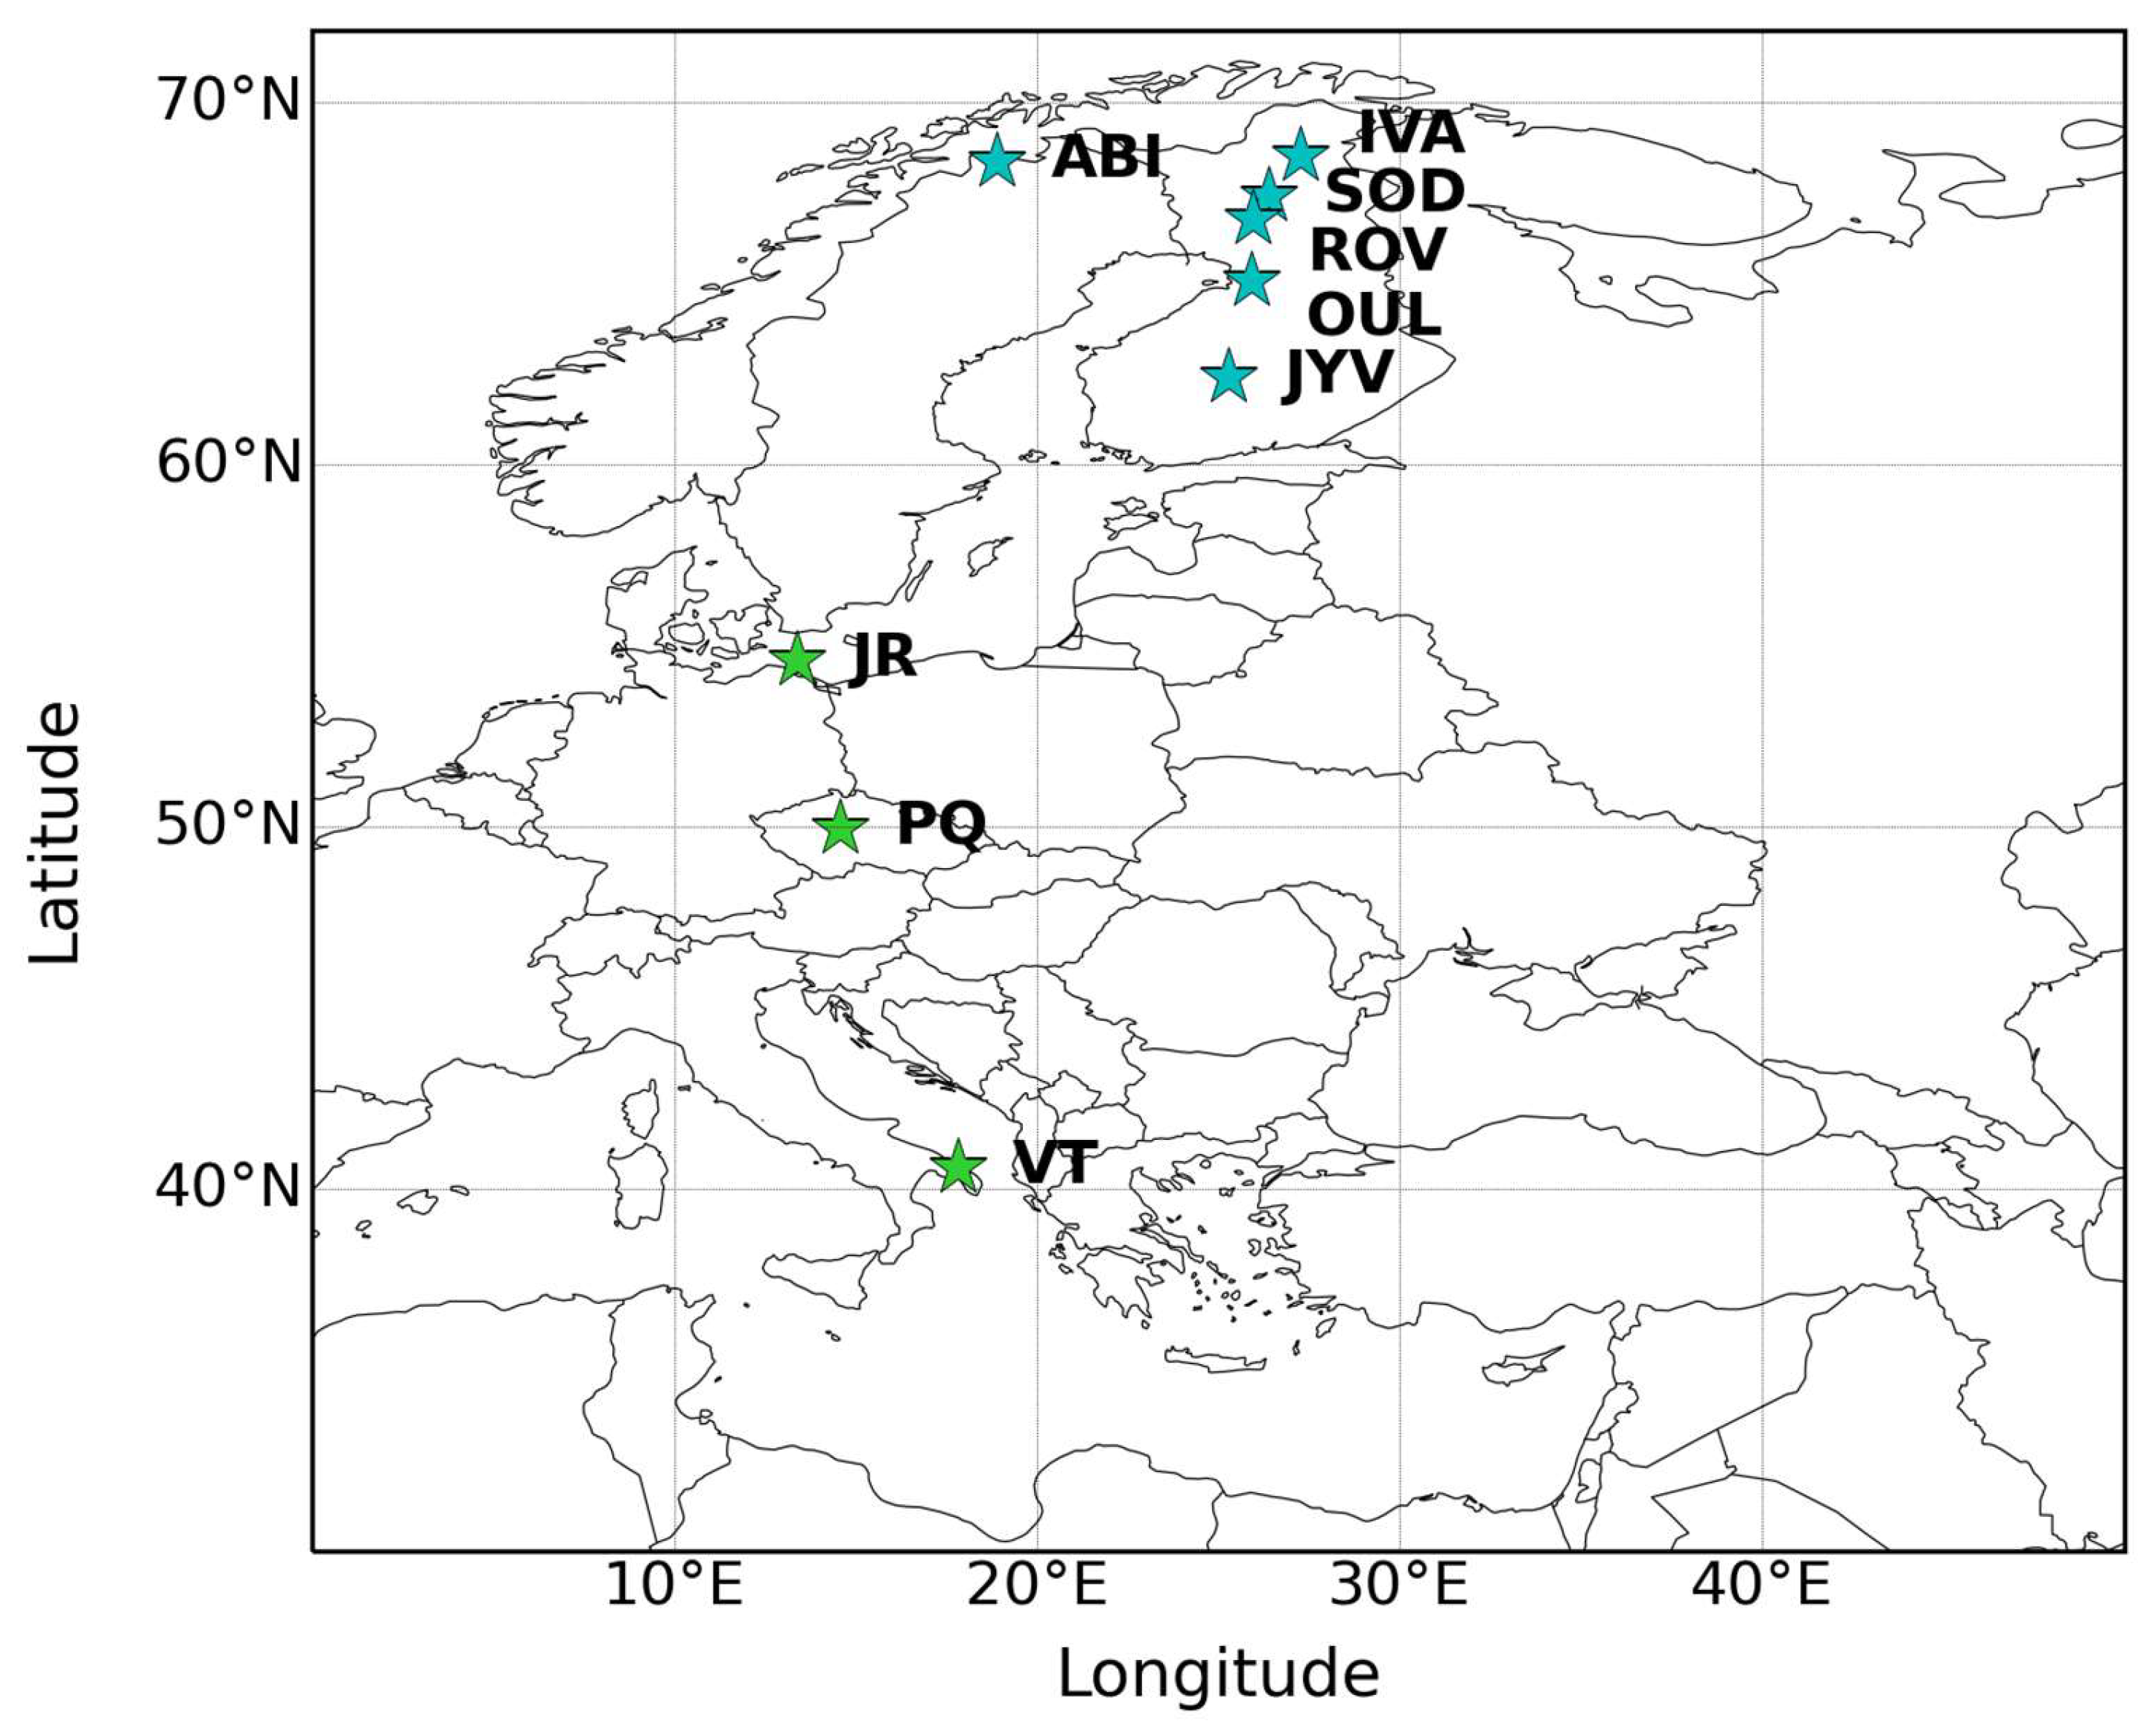
Figure 3.
X8.2 flare event detected by Solar Dynamic Observatory (SDO) and its impact on the ionospheric absorption as modeled by the D-RAP at 16:06 UT on 10 September.
Figure 3.
X8.2 flare event detected by Solar Dynamic Observatory (SDO) and its impact on the ionospheric absorption as modeled by the D-RAP at 16:06 UT on 10 September.
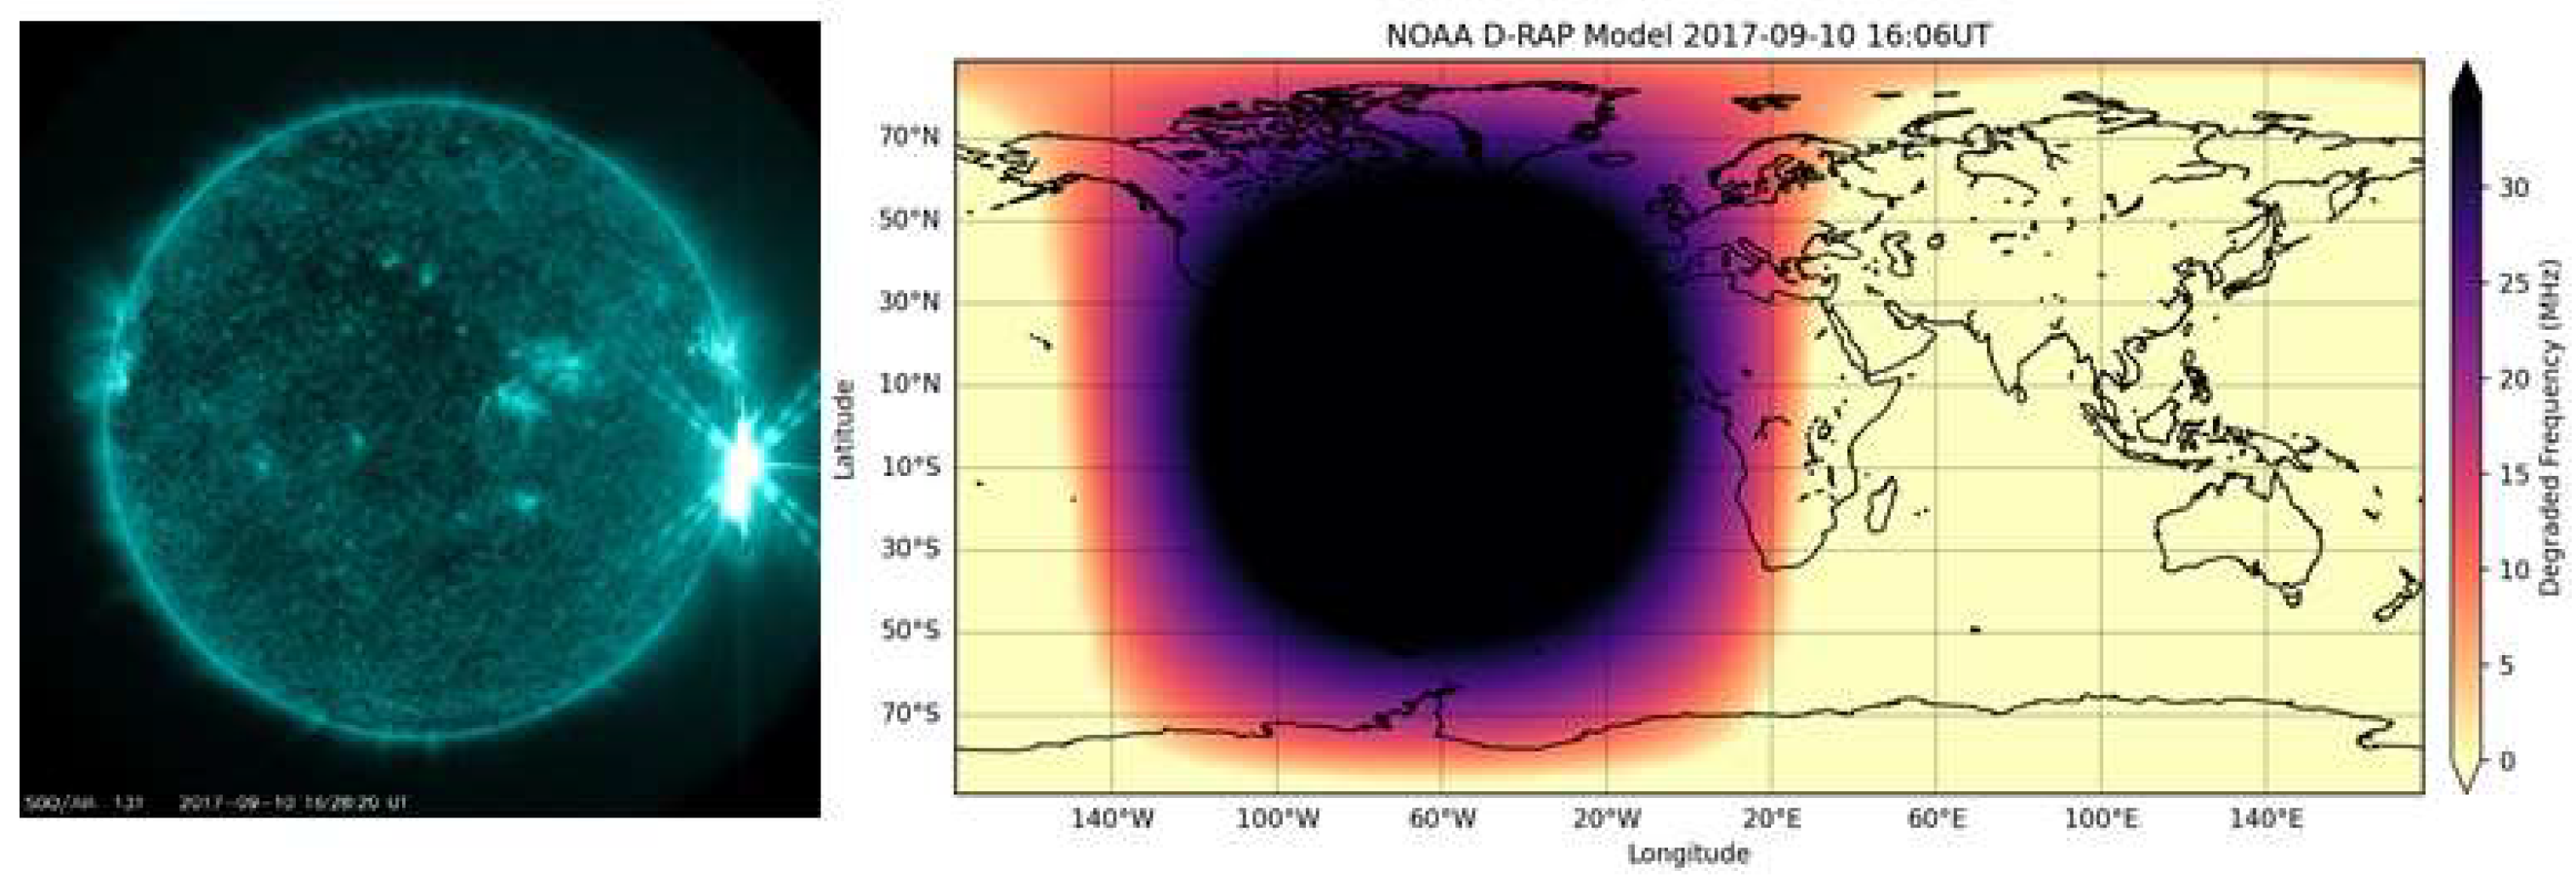
Figure 4.
X-ray and proton flux on 08 September, and the changes measured by the European Digisondes (green dots) and determined by the D-RAP model at 2.5 MHZ and at 4 MHz (red curves). The radio fade-outs occurred at the certain frequencies are indicated by gray rectangles (left).
Figure 4.
X-ray and proton flux on 08 September, and the changes measured by the European Digisondes (green dots) and determined by the D-RAP model at 2.5 MHZ and at 4 MHz (red curves). The radio fade-outs occurred at the certain frequencies are indicated by gray rectangles (left).
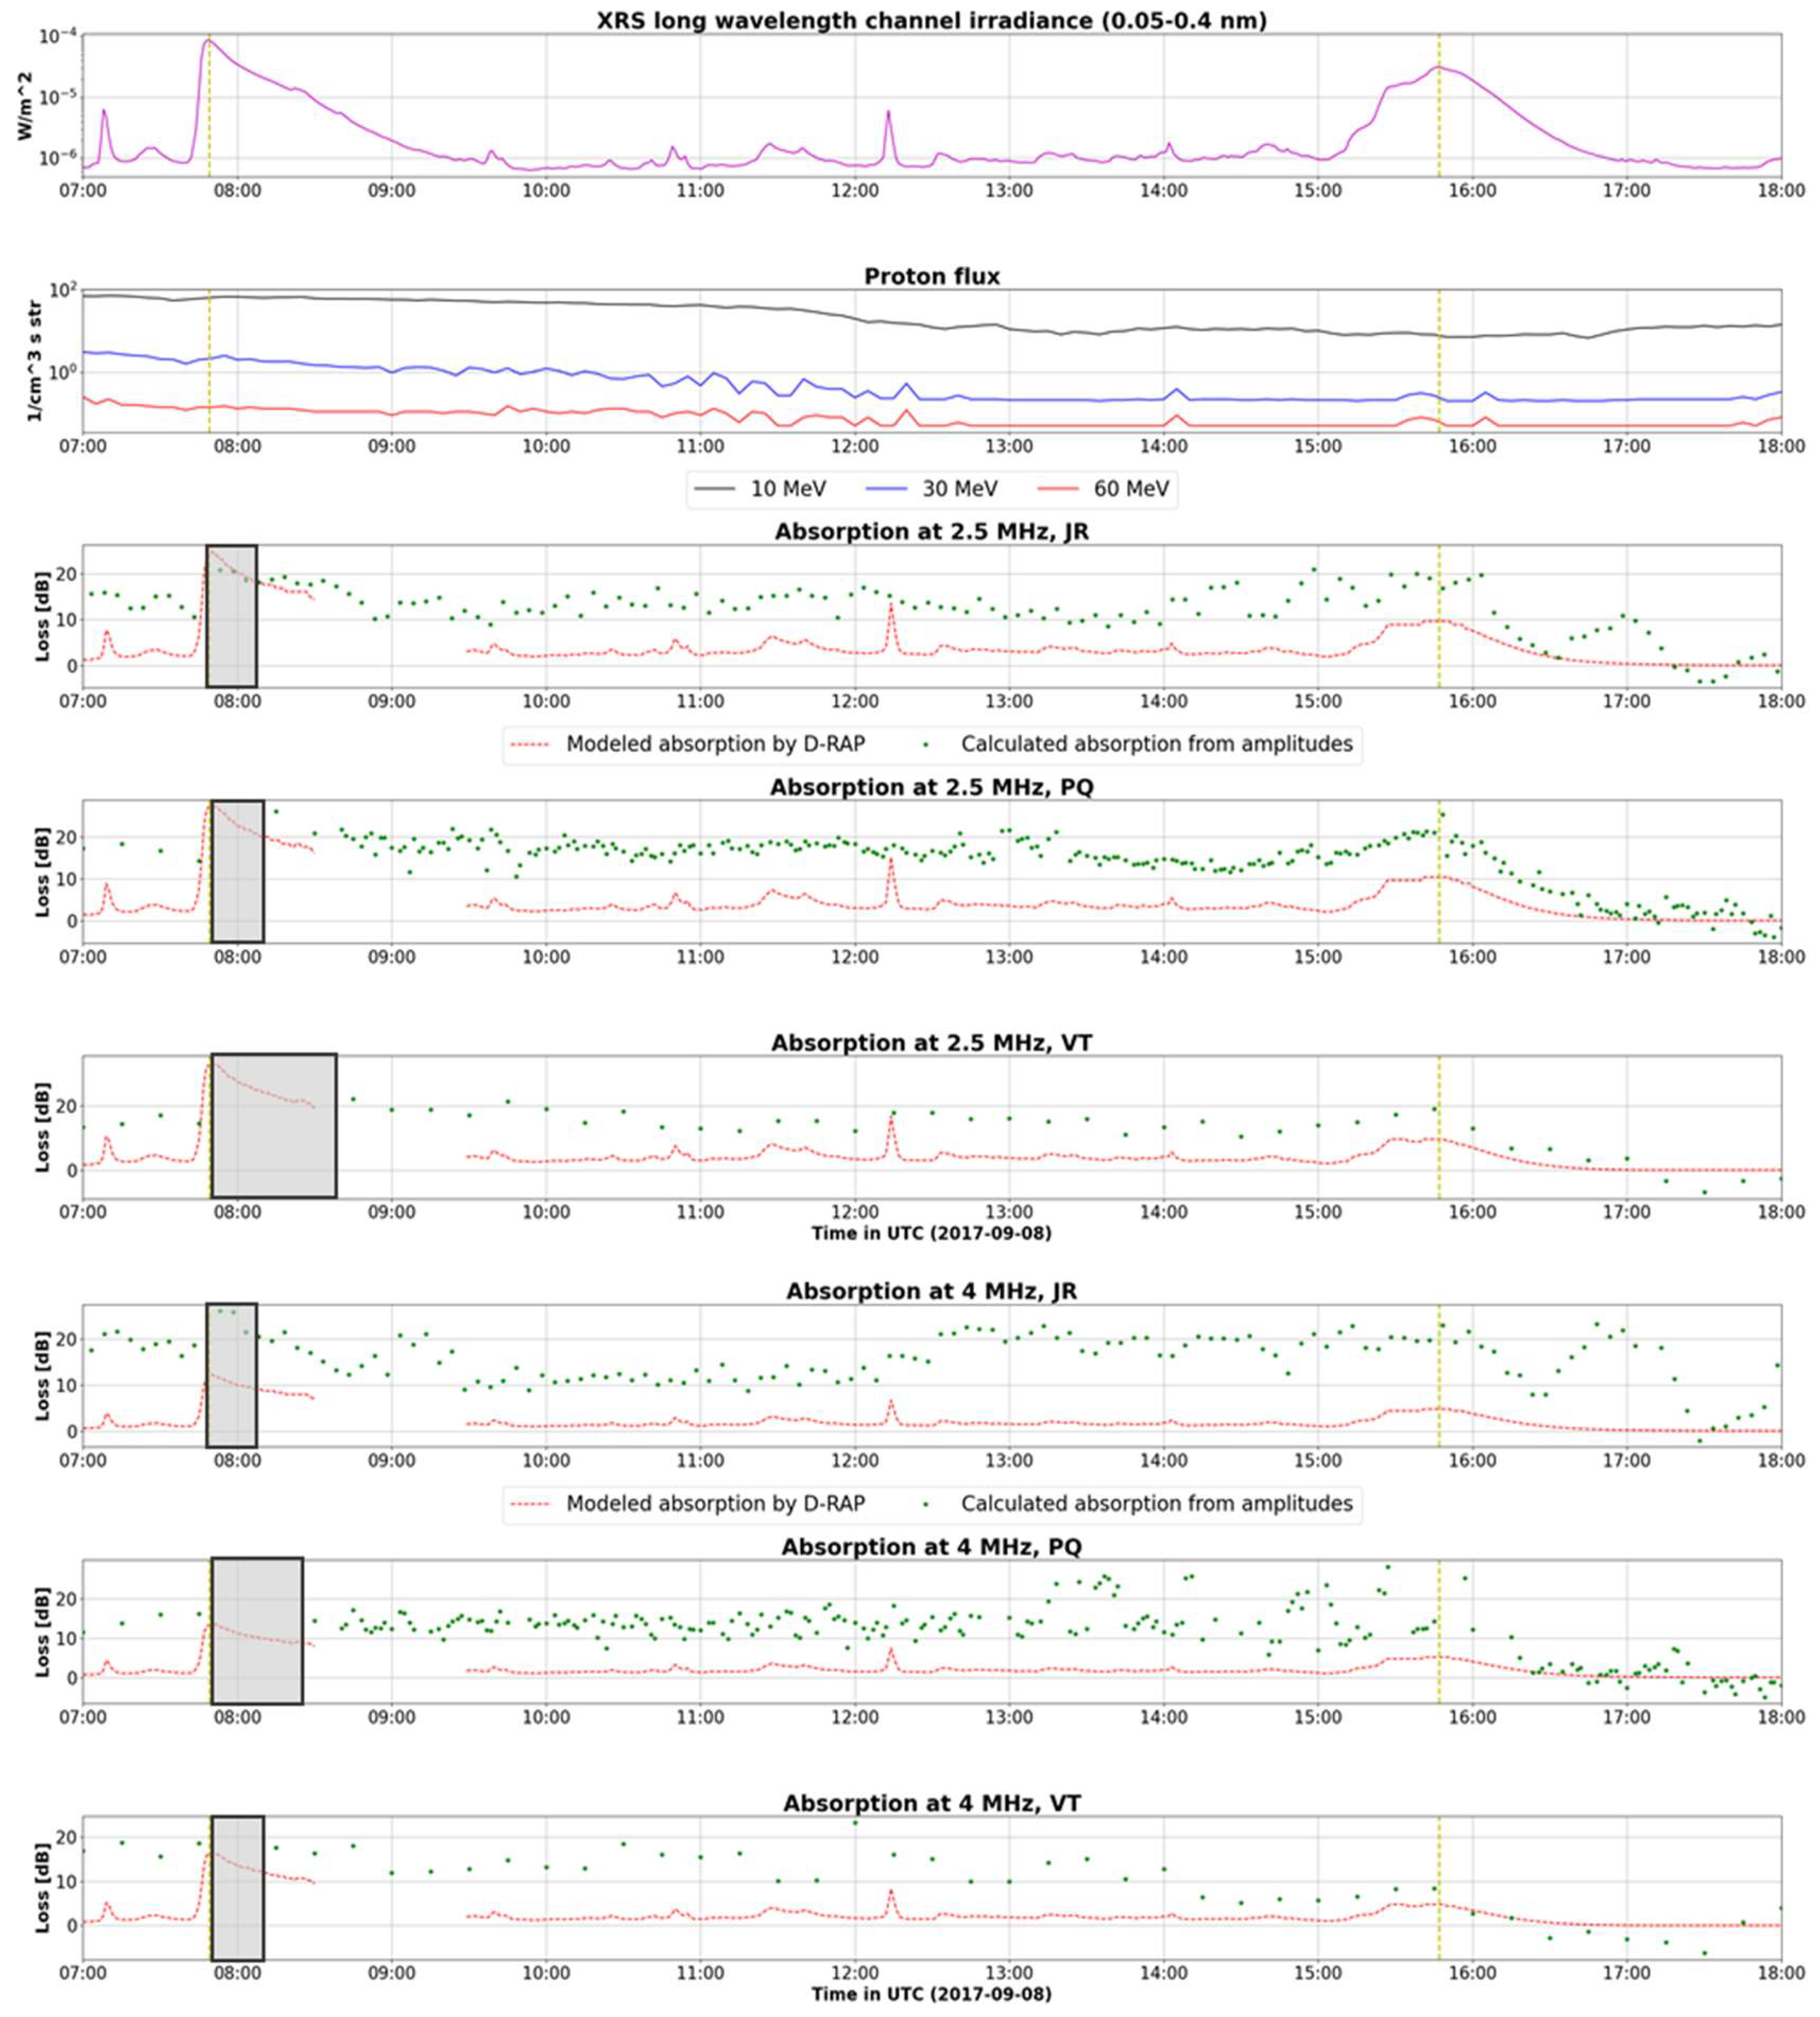
Figure 5.
X-ray and proton flux on 10 September, and the changes measured by the European Digisondes (green dots) and determined by the D-RAP model at 2.5 MHZ and at 4 MHz (red curves). The radio fade-outs occurred at the certain frequencies are indicated by grey rectangles.
Figure 5.
X-ray and proton flux on 10 September, and the changes measured by the European Digisondes (green dots) and determined by the D-RAP model at 2.5 MHZ and at 4 MHz (red curves). The radio fade-outs occurred at the certain frequencies are indicated by grey rectangles.
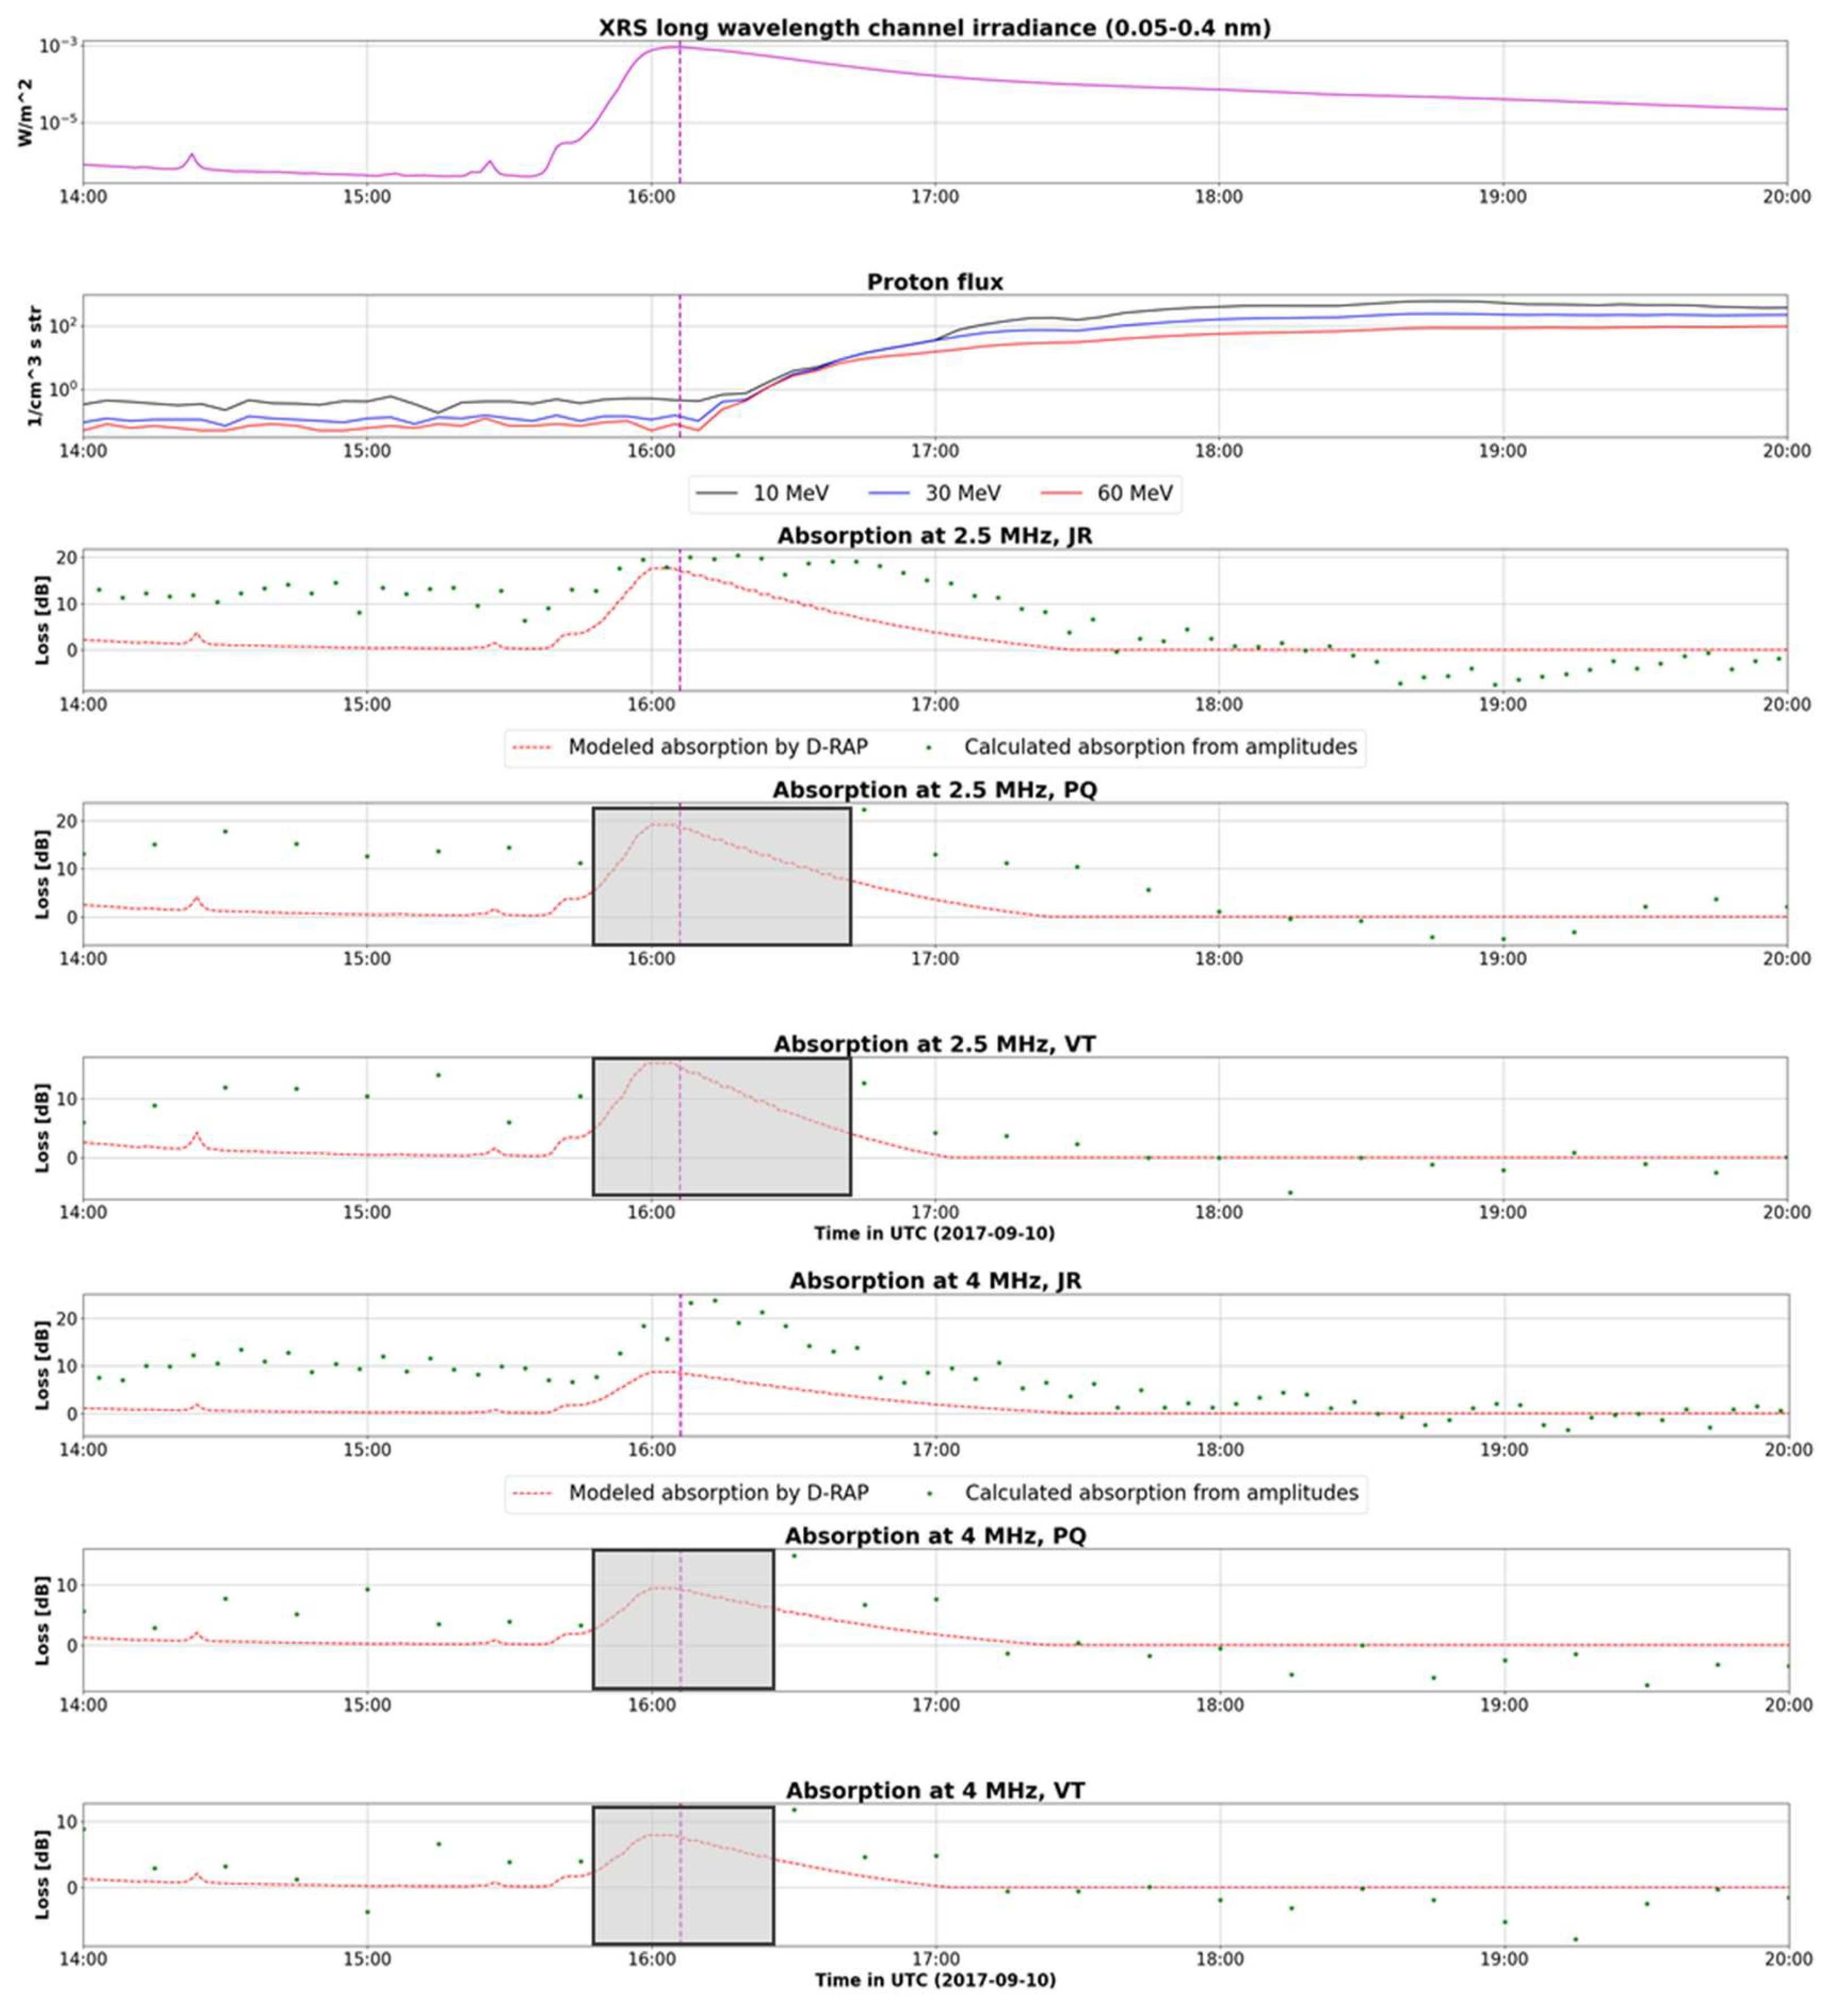
Figure 6.
X-ray and proton flux on 06 September, and the changes measured by the Finnish Riometer Chain (black curve) and determined by the D-RAP model at the same frequency (30, 32 MHZ) and at the same location (red curves).
Figure 6.
X-ray and proton flux on 06 September, and the changes measured by the Finnish Riometer Chain (black curve) and determined by the D-RAP model at the same frequency (30, 32 MHZ) and at the same location (red curves).
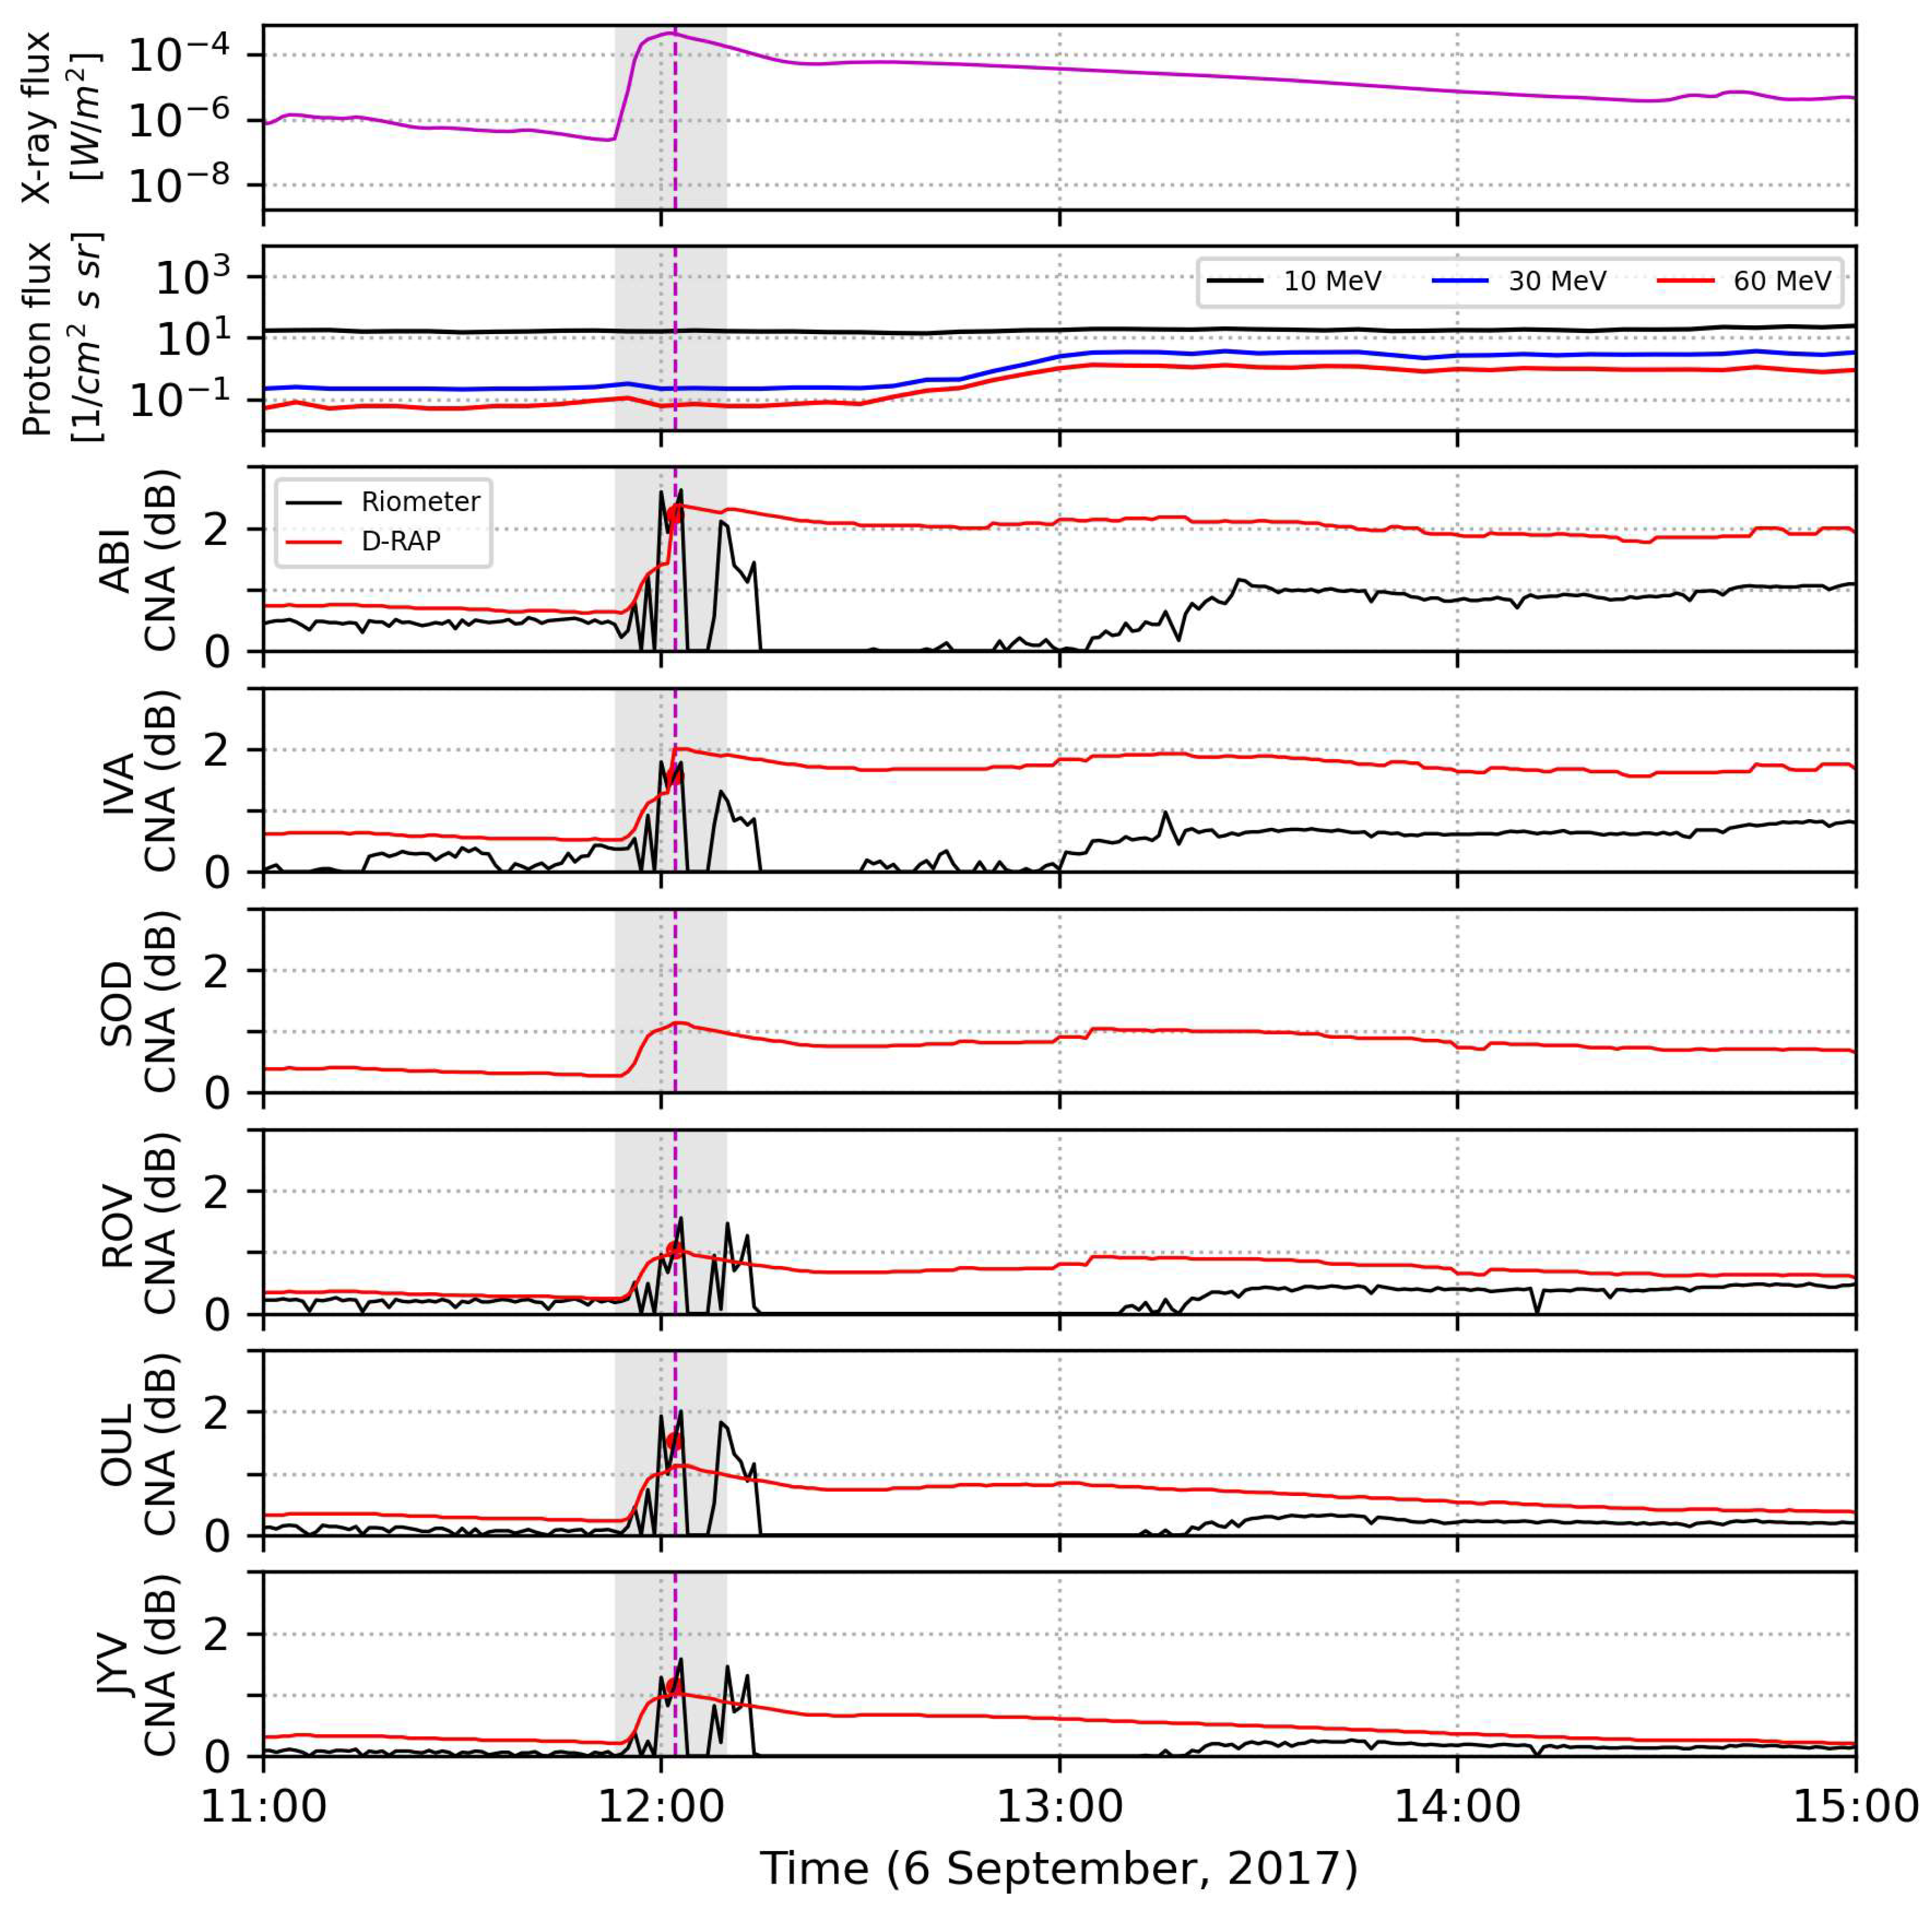
Figure 7.
X-ray and proton flux on 10 September, and the changes measured by the Finnish Riometer Network (black curve) and determined by the D-RAP model at the same frequency (30, 32 MHZ) and at the same location (red curves).
Figure 7.
X-ray and proton flux on 10 September, and the changes measured by the Finnish Riometer Network (black curve) and determined by the D-RAP model at the same frequency (30, 32 MHZ) and at the same location (red curves).
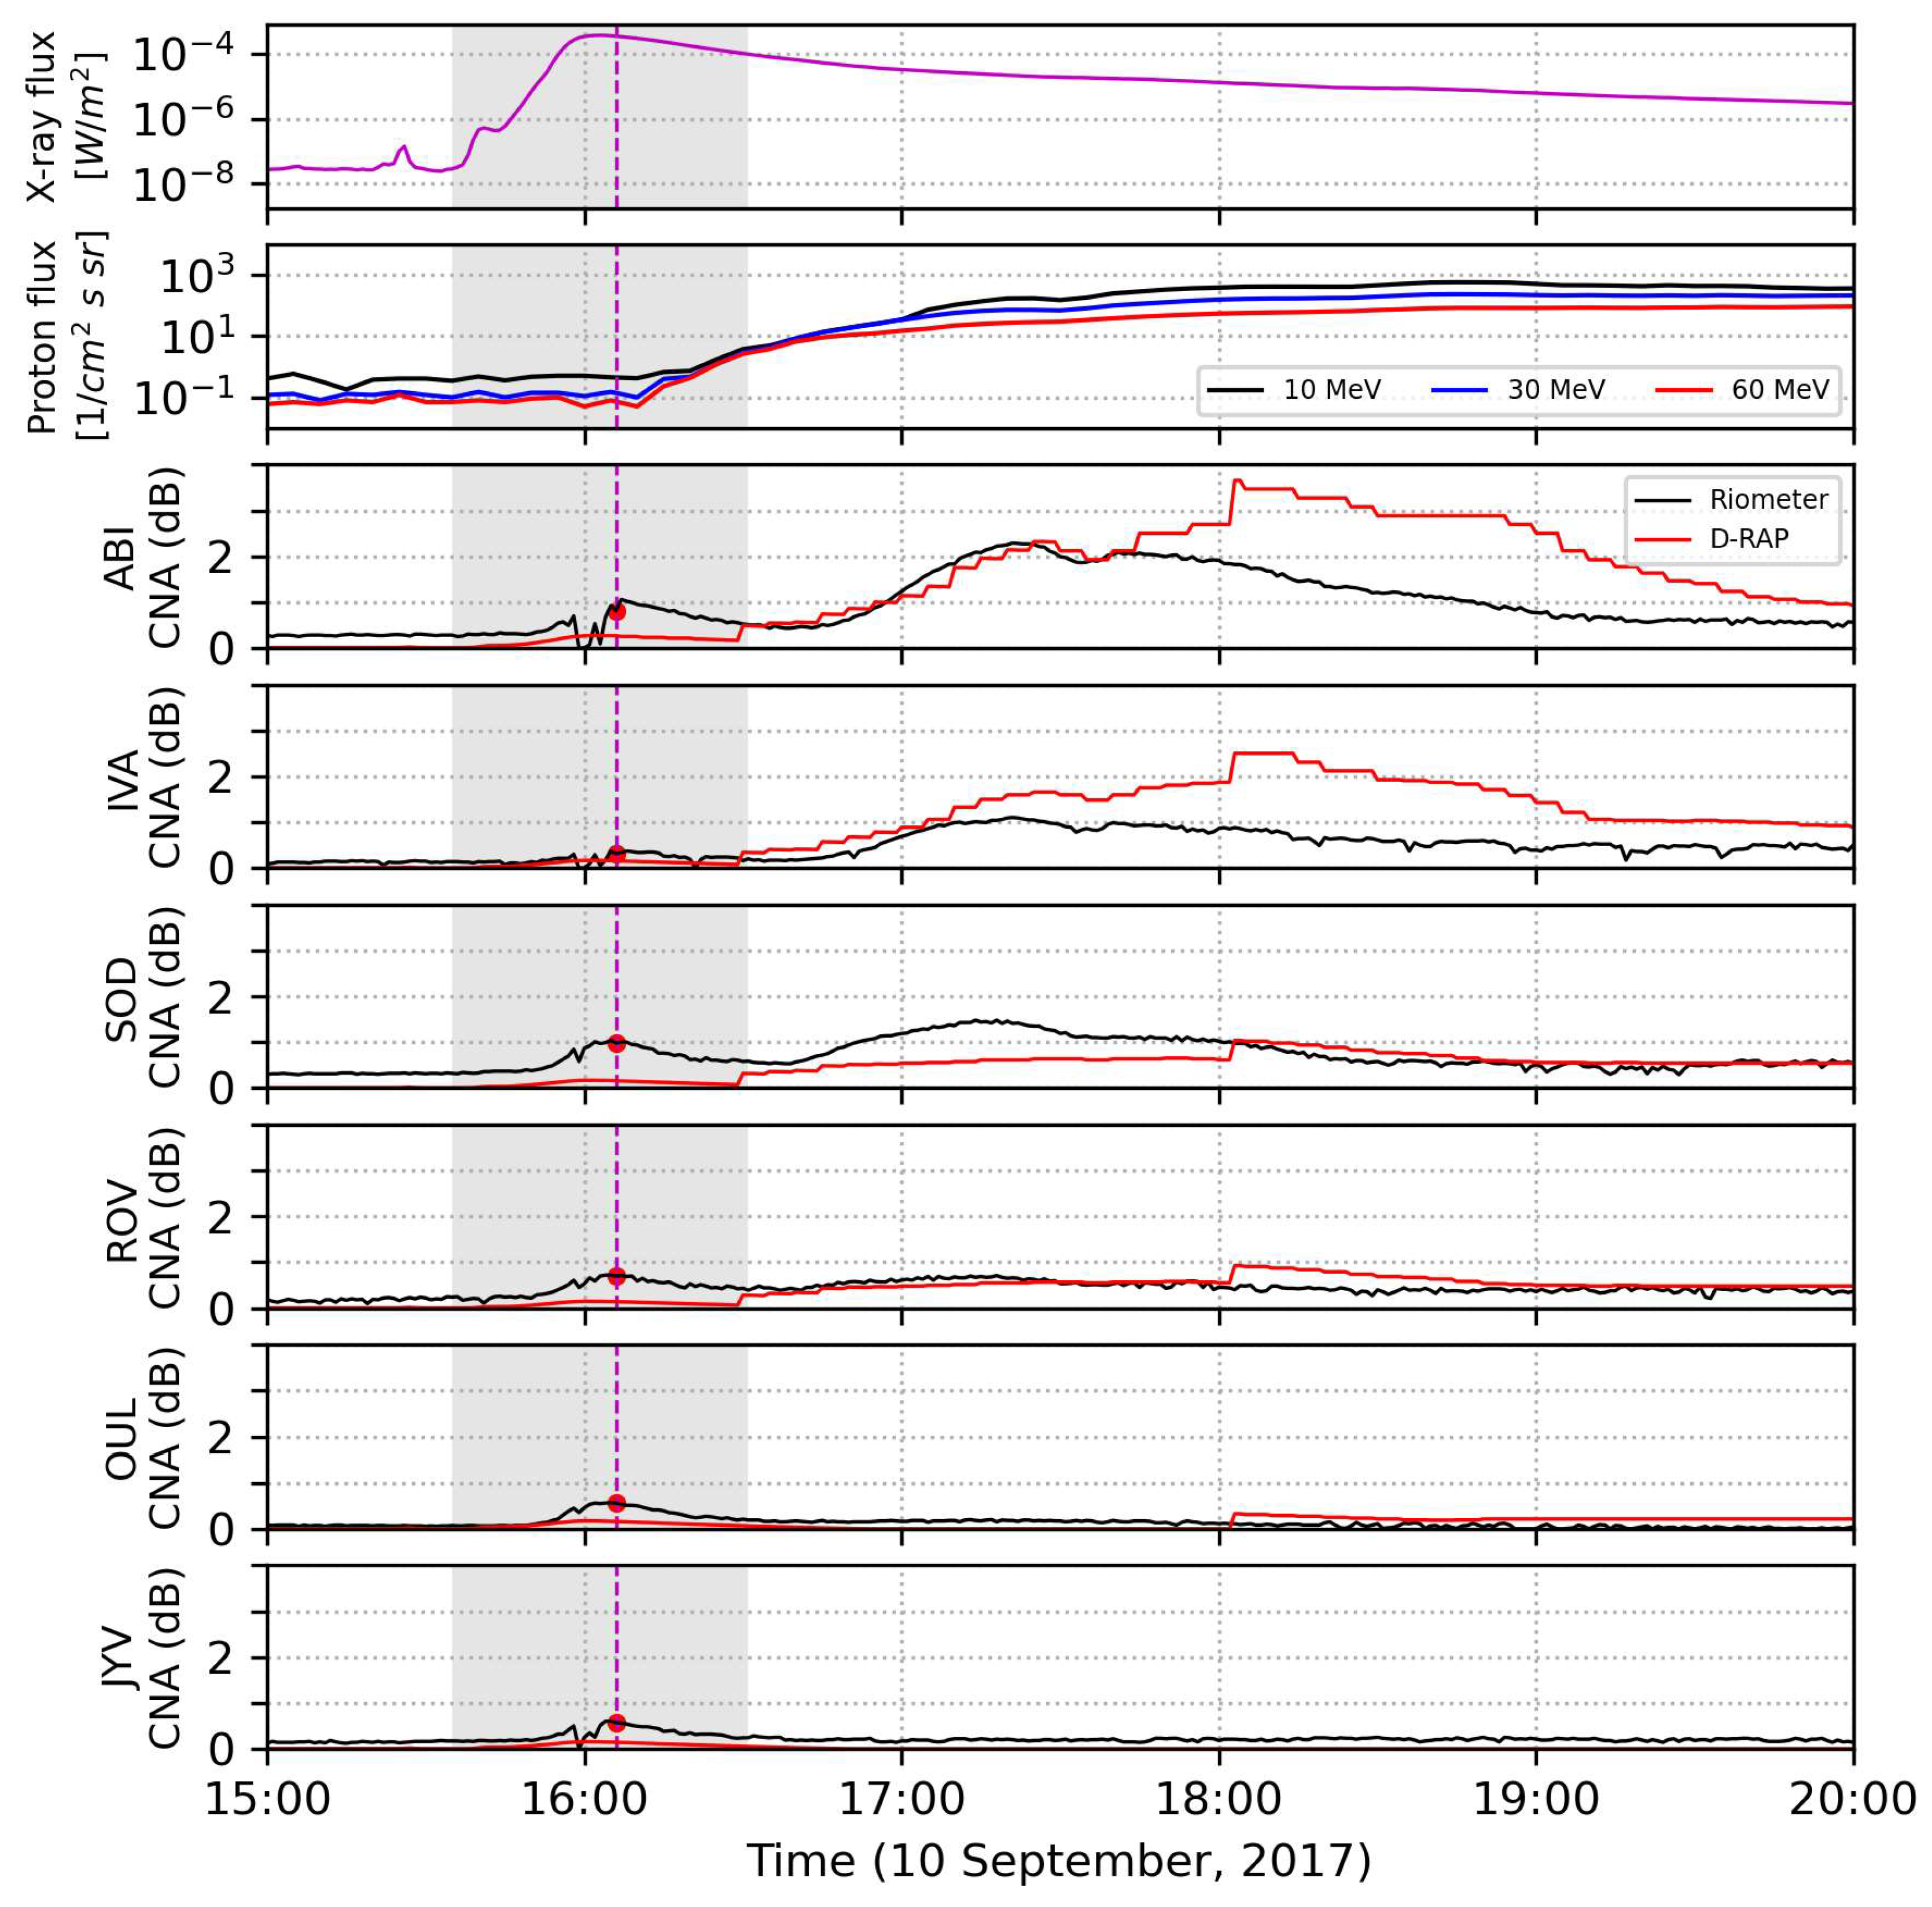
Table 1.
The most important properties of the selected flare events (updated from Buzás et al. [18]).
Table 1.
The most important properties of the selected flare events (updated from Buzás et al. [18]).
| Date | Start time | Peak time | End time | Duration (min) | Class |
| 04 Sep 2017 | 11:54 | 12:22 | 14:00 | 126 | C8.3 |
| 04 Sep 2017 | 15:11 | 15:30 | 15:33 | 22 | M1.5 |
| 05 Sep 2017 | 4:33 | 4:53 | 5:07 | 34 | M3.2 |
| 05 Sep 2017 | 6:33 | 6:40 | 6:43 | 10 | M3.8 |
| 06 Sep 2017 | 8:57 | 9:10 | 9:17 | 20 | X2.2 |
| 06 Sep 2017 | 11:53 | 12:02 | 12:10 | 17 | X9.3 |
| 07 Sep 2017 | 9:35 | 9:54 | 11:28 | 113 | M1.4 |
| 07 Sep 2017 | 10:11 | 10:15 | 10:18 | 7 | M7.3 |
| 07 Sep 2017 | 14:20 | 14:36 | 14:55 | 35 | X1.3 |
| 08 Sep 2017 | 7:40 | 7:49 | 7:58 | 18 | M8.1 |
| 08 Sep 2017 | 15:09 | 15:47 | 16:04 | 55 | M2.9 |
| 09 Sep 2017 | 10:50 | 11:04 | 11:42 | 52 | M3.7 |
| 10 Sep 2017 | 15:35 | 16:06 | 16:31 | 56 | X8.2 |
Table 3.
The values measured by the Digisondes and determined by D-RAP at 4 MHz at the peak time of the flare, or - in a case of fade-out - at the first measurement time after it.
Table 3.
The values measured by the Digisondes and determined by D-RAP at 4 MHz at the peak time of the flare, or - in a case of fade-out - at the first measurement time after it.
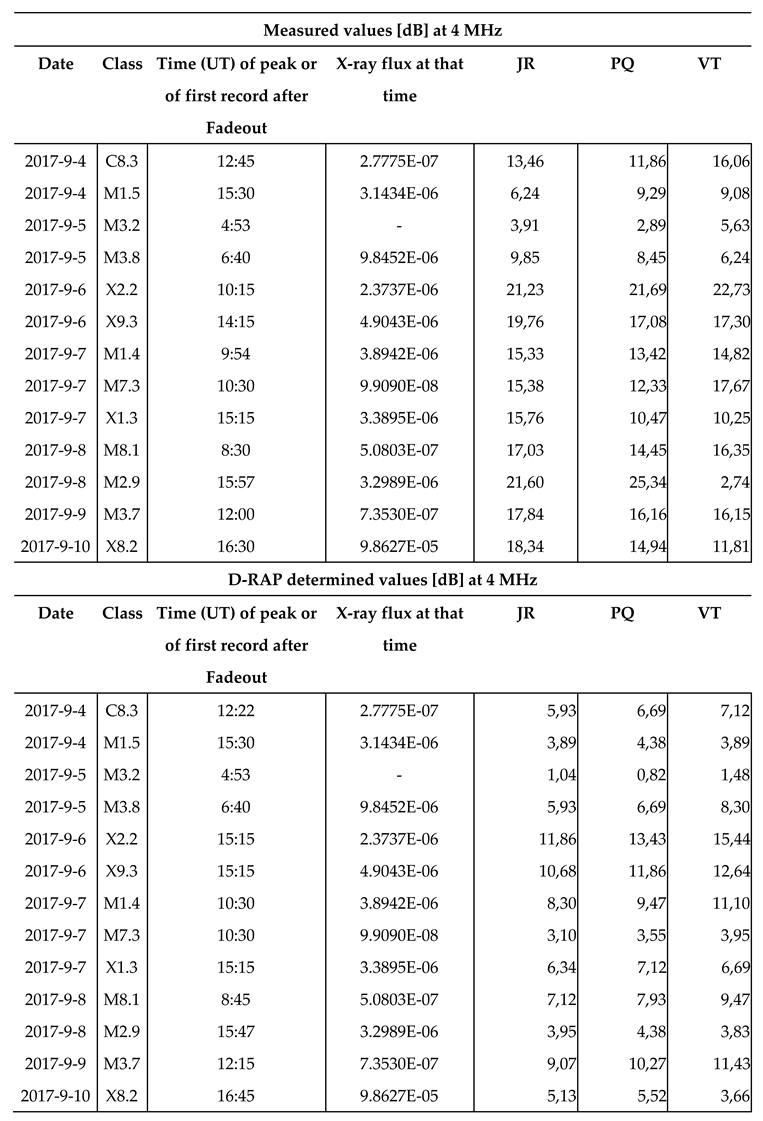 |
Table 4.
The values measured by the riometers and determined by D-RAP at 30/32.4 MHz at the peak time of the investigated flares and two energetic particle events what followed the X-class flares on 06 and 10 September.
Table 4.
The values measured by the riometers and determined by D-RAP at 30/32.4 MHz at the peak time of the investigated flares and two energetic particle events what followed the X-class flares on 06 and 10 September.
| Measured values by the riometers (30-32 MHz) | ||||||||
| Date | Class | Peak Time (UT) | ABI | IVA | SOD | ROV | OUL | JYV |
| 2017-9-4 | C8.3 | 12:22 | 0.14 | 0.13 | - | 0.24 | 0.14 | 0.1 |
| 2017-9-4 | M1.5 | 15:30 | 0.59 | 0.11 | - | 0.57 | 0.1 | 0.08 |
| 2017-9-5 | M3.2 | 4:53 | 1.22 | 1.06 | - | 0.36 | 0.19 | 0.09 |
| 2017-9-5 | M3.8 | 6:40 | 1.0 | 0.64 | - | 0.36 | 0.23 | 0.17 |
| 2017-9-6 | X2.2 | 9:10 | 1.53 | 1.12 | - | 1.36 | 1.47 | 1.45 |
| 2017-9-6 | X9.3 | 12:02 | 2.62 | 1.79 | - | 1.56 | 2.01 | 1.58 |
| 2017-9-6 | Proton | 13:05 | 1.16 | 0.97 | - | 0.45 | 0.33 | 0.26 |
| 2017-9-7 | M1.4 | 9:54 | ||||||
| 2017-9-7 | M7.3 | 10:15 | ||||||
| 2017-9-7 | X1.3 | 14:36 | 2.11 | 1.46 | 1.86 | 1.210 | 0.65 | 0.48 |
| 2017-9-8 | M8.1 | 7:49 | 1.3 | 1.04 | 1.8 | 1.18 | 0.85 | 0.38 |
| 2017-9-8 | M2.9 | 15:47 | 4.13 | 3.08 | 3.79 | 1.81 | 1.18 | - |
| 2017-9-9 | M3.7 | 11:04 | 0.65 | 0.46 | 0.78 | 0.5 | 0.7 | 0.54 |
| 2017-9-10 | X8.2 | 16:06 | 1.06 | 0.37 | 1.04 | 0.72 | 0.57 | 0.6 |
| 2017-9-10 | Proton | 17:20-17:30 | 2.29 | 1.1 | 1.48 | 0.71 | 0.2 | 0.22 |
| Values determined by D-RAP (30-32 MHz) | ||||||||
| Date | Class | Peak Time (UT) | ABI | IVA | SOD | ROV | OUL | JYV |
| 2017-9-4 | C8.3 | 12:22 | 0.249 | 0.249 | 0.249 | 0.225 | 0.268 | 0.257 |
| 2017-9-4 | M1.5 | 15:30 | 0.159 | 0.122 | 0.127 | 0.113 | 0.13 | 0.118 |
| 2017-9-5 | M3.2 | 4:53 | 2.598 | 2.074 | 0.336 | 0.299 | 0.219 | 0.146 |
| 2017-9-5 | M3.8 | 6:40 | 2.963 | 2.308 | 0.46 | 0.41 | 0.426 | 0.324 |
| 2017-9-6 | X2.2 | 9:10 | - | - | - | - | - | - |
| 2017-9-6 | X9.3 | 12:02 | 2.368 | 1.998 | 1.138 | 1.014 | 1.122 | 1.014 |
| 2017-9-6 | Proton | 13:05 | 2.177 | 1.923 | 1.04 | 0.927 | 0.849 | 0.669 |
| 2017-9-7 | M1.4 | 9:54 | ||||||
| 2017-9-7 | M7.3 | 10:15 | ||||||
| 2017-9-7 | X1.3 | 14:36 | 3.602 | 2.963 | 0.636 | 0.567 | 0.4 | 0.343 |
| 2017-9-8 | M8.1 | 7:49 | 5.387 | 5.422 | 1.597 | 1.423 | 0.675 | 0.533 |
| 2017-9-8 | M2.9 | 15:47 | 2.145 | 2.138 | 2.138 | 1.905 | 2.138 | 1.911 |
| 2017-9-9 | M3.7 | 11:04 | 0.675 | 0.636 | 0.565 | 0.503 | 0.52 | 0.495 |
| 2017-9-10 | X8.2 | 16:06 | 0.268 | 0.164 | 0.167 | 0.148 | 0.169 | 0.153 |
| 2017-9-10 | Proton | 17:20-17:30 | 2.32 | 1.656 | 0.636 | 0.567 | 0 | 0 |
Disclaimer/Publisher’s Note: The statements, opinions and data contained in all publications are solely those of the individual author(s) and contributor(s) and not of MDPI and/or the editor(s). MDPI and/or the editor(s) disclaim responsibility for any injury to people or property resulting from any ideas, methods, instructions or products referred to in the content. |
© 2024 by the authors. Licensee MDPI, Basel, Switzerland. This article is an open access article distributed under the terms and conditions of the Creative Commons Attribution (CC BY) license (http://creativecommons.org/licenses/by/4.0/).
Copyright: This open access article is published under a Creative Commons CC BY 4.0 license, which permit the free download, distribution, and reuse, provided that the author and preprint are cited in any reuse.


