
Submitted:
13 December 2024
Posted:
17 December 2024
You are already at the latest version
Abstract
Occupational incidents in construction workplaces present a persistent challenge, with severe consequences for both workers and project outcomes. This study aims to examine the specific causal factors contributing to these incidents, focusing on the interaction between worker-related, environmental, and procedural factors. The objective is to identify key contributors to workplace accidents and develop a unified predictive model to mitigate future risks. To achieve this, we employed a machine learning approach on a comprehensive accidentology dataset collected from contractors across multiple construction sites. The dataset includes variables such as worker ex-perience, environmental conditions, adherence to safety protocols, and more. By analyzing direct, indirect, and root causes, the methodology uncovers hidden patterns and interdependencies that traditional analysis might overlook. The study’s findings indicate that worker experience and environmental factors are the most significant contributors to incident occurrence, with a clear interaction effect between these variables. The results not only confirm previous research but also offer enhanced predictive capabilities for future safety measures. This research demonstrates the value of machine learning in generating data-driven insights, ultimately aiding in the develop-ment of targeted interventions to improve safety standards in the construction industry.
Keywords:
machine learning
; predictive analytics
; data mining
; safety
; occupational accidents
; construction
; workplace
; artificial intelligence
; big data
; incidents
1. Introduction
The construction industry is inherently hazardous, with a high incidence of occupational accidents and fatalities. Despite advances in safety protocols and regulations, construction workplaces continue to experience significant numbers of incidents that not only result in human suffering but also incur substantial economic costs. Understanding the causal factors behind these incidents is essential for developing effective prevention strategies and improving overall workplace safety.
Traditional approaches to investigating construction accidents often involve retrospective analyses of incident reports and expert surveys. While these methods have provided significant insights, they are limited by issues such as underreporting, subjectivity, and the inability of exploitation when it comes to Big Data. Therefore, Machine Learning is used to uncover complex patterns and relationships within large datasets that are not easily discernible through conventional methods (APC, et al., 2023).
Building upon recent research (Sa-ngiamsak, Zlatar, & Thetkathuek, 2023); (Khan, Yin, Mustafa, & Shi, 2023), data preprocessing and optimal machine learning techniques have been proposed to handle the complexity and diversity of construction accident data, enabling the derivation of meaningful variables and correlations (Lee, Yoon, Oh, Park, & & Ryu, 2020). A comprehensive review of ML applications in accidentology investigations at work identified key research domains and highlighted the need for further exploration of ML algorithms in this field (Sarkar, S.; Maiti, J, 2020).
This paper presents a comprehensive data exploration of accidentology historic and the application of predictive analytics in construction workplace safety to uncover the impact of causalities on the occurrence of all types of workplace incidents, focusing on a machine learning approach.
In this present work, we advocate for a proactive approach to dynamic adaptation. The advantages can be outlined as follows: 1) mitigating oscillatory safety practices and action plans, 2) optimizing the allocation of limited resources, and 3) enabling proactive responses to seasonal trends. This research aims to advance dynamic adaptation by implementing a computational model that leverages historical HSE data from each Business Unit’s projects to forecast future performance, supplemented by real-time statistics to enhance the accuracy of these predictions. Consequently, the approach transitions decision-making from static analysis to a dynamic, operationally predictive framework.
To enhance pre-analysis visualization, the literature categorizes predictive datasets into four distinct operational families, facilitating a clearer understanding of safety prediction. These are: (1) Safety Observation Reports (SOR) datasets, which assess hazard climates and work characteristics; (2) Accidentology datasets, which compile historical records of incidents; (3) Key Performance Indicators (KPI) datasets, capturing both leading and lagging safety metrics alongside event tracking to reflect the scope of safety management activities; and (4) Training datasets, integral to safety metrics evaluation.
The current body of research proposes a unified model that incorporates all these dataset families, promoting opportunities for synergy and cross-validation. Looking ahead, the application of this model can be expanded to generate more precise and dependable safety predictions. These predictions will account for the interplay between work-related factors, human resources, and management strategies, which collectively influence safety outcomes.
By synthesizing and exploiting recent advancements in both predictive analytics and construction safety management, we aim also to address the importance of direct, indirect and root cause correlation analysis with the occurrence of accidents per type and criticality. Specifically, an investigation about the development and implementation of predictive models capable of identifying safety risks in real-time has taken place, thereby enabling proactive interventions to prevent accidents and injuries.
2. Materials and Methods
2.1. Related Works
The construction industry is a high-risk sector, with a significant number of work-related accidents. To address this, recent research has explored the use of machine learning (ML) and predictive analytics to enhance workplace safety. (Cavalcanti, Lessa, & Vasconcelos, 2023) conducted a systematic review of ML applications in construction accident prevention, highlighting the need for further studies in this area. (Fargnoli & Lombardi, 2020) emphasized the potential of Building Information Modelling (BIM) to improve occupational safety in construction activities, suggesting practical applications such as safety training and risk analysis.
(Gao, Gonzalez, Yiu, & Cabrera-Guerrero., 2019) developed a model using ML and the Big Five personality taxonomy to predict construction workers’ safety behavior, identifying workers prone to unsafe behaviors. (Baker, Hallowell, & Tixier, 2020) further advanced this work by using ML to predict independent construction safety outcomes, achieving significant improvements in injury severity prediction. These studies collectively underscore the potential of ML and predictive analytics in enhancing construction workplace safety.
One study developed a predictive model using machine learning to identify the potential risk of fatality accidents at construction sites, utilizing a dataset from the Ministry of Employment and Labor of the Republic of Korea (Jongko Choi et al., 2020). The study found that the random forest method had the highest predictive success rate, with influential factors including the month of the accident and employment size. Another research effort focused on predicting the consequences of construction accidents in China, analyzing 16 critical factors with eight different algorithms (Zhu, Hu, Hou, & & Li, 2021). The study highlighted the importance of the ‘Type of accident’ and ‘Accident reporting and handling’ as critical factors, with Naive Bayes and Logistic regression achieving the best F1-Score on the raw dataset.
Predictive modeling has also been applied to the mining industry, which shares similar safety concerns with construction. Machine learning models, including decision trees and artificial neural networks, were used to predict outcomes of mining accidents and days away from work, with narrative data providing additional insights compared to structured data (Yedla, Kakhki, & Jannesari, 2020).
A framework for predicting safety performance before the implementation of construction projects was proposed in another study (Abbasianjahromi & & Aghakarimi, 2021). It utilized a decision tree algorithm coupled with the k-Nearest Neighbors algorithm, identifying key criteria for safety performance prediction such as safety employees, training, rule adherence, and management commitment.
A comprehensive literature review on ML applications in construction safety literature revealed trends and gaps in the field (Koc & & Gurgun, 2021). It found that severity evaluation of construction accidents was the most widely investigated sub-topic, with linear regression and logistic regression commonly used as benchmark models. The performance of machine learning techniques in predicting injury severity in agribusiness industries was tested, with models achieving high accuracy rates (Kakhki, Freeman, & Mosher, 2019). This study emphasized the importance of quantitative analysis of empirical injury data in safety science.
The integration of machine learning into construction safety management has shown promising results, with various studies demonstrating the effectiveness of different algorithms in predicting accident outcomes. These advancements hold the potential to significantly improve safety measures and reduce the incidence of accidents in the construction industry as we will argue in this paper. The following (see Table 1) are some of the leading predictive models in the construction safety domain mentioned in our state of art and their relevant information.
2.2. Process Overview
The objective of the following section is to outline the different methods utilized for safety predictions in our specific case. Where relevant, this paper tracks the evolution of the research conducted. In examining each safety prediction approach, the following aspects are discussed:
- Key factors or components involved in the analysis, representing the data used as input for the predictive model.
- An overview of previously employed strategies, including the problem definition, data sources, analytical methods, and an evaluation of their strengths and limitations in terms of scientific accuracy and dependability.
Also in our study, we have presented and organized safety prediction research into four major families, based upon the information that has been provided by the organization. Our work was in a pilot phase aimed at evaluating the techniques available. The potential of data-mining techniques not only derived from the possibility for processing large quantities of data but also from the following:
- Their capacity to deal with large-dimension problems, which is necessary when endeavoring to identify relevant variables among many potential factors.
- Their flexibility in reproducing the data-generation structure, irrespective of complexity, thanks to a non-linear structure that is adaptable to the data (non-parametric philosophy).
- Their great predictive and, in some cases, interpretative, potential.
Many of the studies included in this review aimed to consolidate the widely scattered literature on these topics. We then propose a unified safety prediction model that harnesses the distinct characteristics of the four prediction families, while also taking advantage of the overlap between methodologies as a potential means for cross-validation.
Although there are notable differences among the predictive families, their objectives are aligned. Therefore, we suggest that there is an opportunity for synergy and collective prediction by integrating multiple techniques. Prior to proposing a unified model for safety prediction, we explored the theoretical relationships between the prediction families within the context of the global project process flowchart shown in Figure 1.
Some families of safety prediction measure fundamentally different dimensions of the safety system. When the methods are completely independent, we postulate that the combination of methods offers synergy and improved predictive accuracy. When the methods measure fundamentally similar aspects of the safety system, we postulate that this is an opportunity for cross-validation.
2.3. Data in Use
As we have delved into the examination of safety prediction methods relevant to our use case, we aimed to explore diverse safety prediction techniques to be utilized and enhanced in our study and, when pertinent, to chronicle the research evolution for it to trace a scientific improvement to the business case.
Unlike previous studies that predominantly focused on a singular dataset, a distinctive challenge encountered in our study lies in managing and integrating multiple categories of datasets. This multifaceted data landscape necessitates a more intricate approach to data preprocessing, feature engineering, and model development to ensure comprehensive and accurate multiple predictive modeling (see Figure 2).
The data used in this study is extracted from three primary databases (see Figure 2), each offering unique and complementary insights into workplace safety and accident prediction:
- The Safety Operations Database contains detailed records of safety observation reports, completed safety inductions, and actions implemented by field inspectors. This database captures real-time safety practices, including hazard observations and responses to identified risks. It provides critical insights into the day-to-day management of safety on construction sites and helps identify patterns of behavior or conditions that could lead to incidents.
- The Safety Activities Database includes data on workforce training, critical activities conducted on-site, and key safety performance indicators. It also documents job hazard analysis (JHA) samplings, which assess the risks associated with specific tasks, and detailed historical accident data categorized into direct, indirect, and root causes. This database offers a comprehensive view of the safety measures employed and their correlation with accident occurrences, enabling a deeper understanding of proactive and reactive safety strategies.
- The Contractors’ Safety Performance Database evaluates the safety performance of contractors working on the construction sites. This database provides an overall health score for each contractor based on their compliance with safety regulations, historical performance, and the corrective measures implemented in response to previous incidents. It helps assess contractor accountability and identifies practices or teams that may pose higher risks to workplace safety.
The dataset is well-documented and detailed, allowing for robust analysis and predictive modeling. The key characteristics of these databases include:
- Volume: Over 132,500 employees across 103 sites and more than 3,000 contractors.
- Diversity: A wide range of construction activities (15 critical activities daily) and workforce demographics, reflecting real-world variability.
- Granularity: Incident data is meticulously categorized into direct, indirect, and root causes, enhancing the accuracy of the models by isolating factors contributing to accident likelihood.
- Temporal Scope: The dataset includes historical data collected over multiple years, providing a longitudinal perspective on safety trends and risks.
This rich and diverse dataset enables the application of machine learning models to predict occupational accidents effectively. By integrating observations, activity data, and contractor evaluations, the models can:
- Identify high-risk scenarios based on training gaps, critical activity execution, and safety inspection outcomes.
- Highlight contractor-specific risks and areas for improvement, aiding targeted interventions.
- Accurately predict accident likelihood, helping prioritize proactive measures to enhance safety and project outcomes.
These three data sources collectively provide a rich and granular dataset for predictive analysis, integrating real-time observations, proactive safety measures, and contractor evaluations. Together, they form the foundation for building robust machine learning models to predict occupational accidents and mitigate risks in the construction industry.
Each recorded incident is meticulously documented with detailed descriptions of the direct, indirect, and root causes, which are further categorized into subcategories (see Table 2).
This extensive categorization facilitates a thorough assessment and evaluation of the correlations and potential causal links leading to the occurrence of injuries on-site. The richness and granularity of the data enable the identification of patterns and trends that are critical for understanding the underlying factors contributing to workplace accidents.
Consequently, this analysis not only sheds light on the immediate and obvious causes of accidents but also delves into the more complex and interrelated factors that can precipitate such incidents, providing valuable insights for improving safety protocols and preventive measures in the construction industry.
2.4. Synergy Possibilities
- Key Performance Indicators (KPI) And Training Datasets:
The two safety prediction families—safety leading indicators and training datasets—are primarily long-term in focus, typically measured over weeks or months. As a result, they are more suited for predicting injury rates over extended timeframes, such as months or even years, rather than making real-time situational predictions. Although training and safety leading indicators assess different aspects of the safety system, they are not entirely separate.
Safety leading indicators focus on the effectiveness of safety management activities (Hinze, J, Hallowell, M., & Baud, K., 2013) while training data reflects broader perceptions of safety, which may include views on the management of safety itself. For example, perceptions regarding the organization’s commitment to safety, the role of supervisors, or the adequacy of training programs (i.e., safety climate) can be influenced by factors such as the volume and quality of training, the frequency of audits, and the types of incentive programs implemented (i.e., leading indicators). We therefore propose that integrating training data with safety leading indicators could provide both synergistic benefits and the opportunity for cross-validation.
- Safety Observation Reports (SOR) And Preliminary Event Notifications (PEN): A Synergy of Situational Predictive Methods:
Safety Observation Reports (SOR) and Preliminary Event Notifications (PEN), along with Accidentology, are categorized as situational methods because they aim to predict safety outcomes for individual events based on information specific to a particular work situation. We suggest that these two methods can be used in combination to produce more reliable predictions than either method applied alone.
For example, Preliminary Event Notifications provide strong predictions about the type of injury and its direct, indirect, and root causes. However, these factors do not offer insights into the injury’s severity. On the other hand, Safety Observation Reports are effective at predicting injury severity and have demonstrated a strong ability to assess the likelihood of an injury occurring by distinguishing between successful and failed safety outcomes (Alexander, D., Hallowell, M., & Gambatese, J, 2017). While both methods are designed for situational predictions, they focus on different components of the safety system.
- Synergy and Cross-Validation Among Situational and Long-Term Methods
To explore the potential interactions among different safety prediction families, there are several promising combinations of methods that span across varying timeframes:
Firstly, there is a natural synergy between safety leading indicators and safety risk assessments through Safety Observation Reports (SOR), despite one being a situational method and the other long-term. Leading indicators assess efforts over extended periods, while SOR evaluates the immediate risks associated with specific tasks. Theoretically, safety outcomes are shaped by the interplay between effort and risk, where more hazardous work requires greater organizational effort in safety management. We propose that these two families can work together to more effectively predict safety performance, but we do not believe they are suitable for cross-validation, as they measure fundamentally different aspects of safety.
Secondly, there is a valid opportunity for cross-validation between safety leading indicators (KPIs) and Preliminary Event Notifications. An organization must determine the safety activities to implement and their frequency, which directly influences safety outcomes, as more safety activities are correlated with improved future performance. In a more indirect manner, increased safety efforts (e.g., additional training) should lead to a reduction in safety precursors (e.g., workers’ lack of knowledge on safe procedures or insufficient pre-job planning).
While not all precursors align with every safety leading indicator, some indirect relationships exist. Thus, as safety efforts are increased or decreased, organizations should observe corresponding changes in the prevalence of specific precursors. These relationships form a logical hierarchy, with safety leading indicators driving the changes, and precursor scores mediating their impact on injury rates.
2.5. Research Hypothesis
The suggested model, illustrated in Figure 3, based originally on the Heinrich’s domino model of accident causation (Heinrich, 1941) aims to explore and analyze and defend the assumptions aligned with this study. This model will be specifically applied to the construction industry.
The hypothesis for this study are whether the various subcategories originally linked to the direct, indirect and root causes have an underlaying impact on the occurrence of occupational accidents per type (hypothesis 1) and whether this impact can be predictively materialized in terms of accuracy, for predicting the different types of accidents (hypothesis 2).
2.5.1. Risk Mitigation Statistics
The accidentology data (see Table 3, Figure 4) reveals a nuanced landscape of occupational hazards across construction sites, underscoring critical areas for targeted risk mitigation. First Aid Cases (FAC) are the most frequent, with 117,430 incidents, accounting for 40.9% of all reported incidents. This high prevalence indicates that while these injuries are generally minor, there is a substantial volume of accidents that require immediate attention, suggesting potential gaps in everyday safety practices and minor hazard management (Shrestha, 2020).
Medical Treatment Cases (MTC), with 92,118 events (32.1%), point to more serious incidents necessitating professional medical care. The frequency of MTCs signals significant underlying risks that warrant more robust safety interventions to prevent these injuries. Restricted Work Cases (RWC), totaling 52,009 events (18.1%), highlight injuries severe enough to limit workers’ duties temporarily, emphasizing the need for preventive measures that can address the conditions leading to such incapacitating incidents.
Lost Time Injuries (LTI), with 34,317 events (12.0%), represent injuries that result in significant work absences, impacting both worker well-being and project timelines. This category’s considerable proportion underscores the critical importance of enhancing safety protocols to reduce incidents with such profound effects on productivity. Asset Damages (AD), while the least frequent at 21,023 events (7.3%), reveal a troubling reality of hazards present on construction sites.
Overall, this data highlights the need for a multi-faceted predictive approach to safety management, focusing on reducing the frequency and severity of all injury types.
2.5.2. Theoretical Approach
Our study capitalizes on a synthesis of methodologies employed in prior research, encompassing the conceptualization of the problem, data source selection, analytical techniques utilized, and the respective strengths and limitations of each approach in terms of scientific rigor and robustness following the framework annotated in Figure 5 and Figure 6:
In addition to reviewing and organizing safety prediction research, we have categorized it into three primary families based on the data provided by the organization. Our work is still in the pilot phase, aimed at evaluating the available techniques. The value of data-mining approaches lies not only in their capacity to handle vast amounts of data but also in their ability to:
- Address large-scale challenges by identifying key variables from an extensive set of possibilities.
- Replicate complex data generation processes due to their non-linear structure (non-procedural approach).
- Offer predictive capabilities, and in some cases, interpretative insights.
Many of the studies included in this work sought to consolidate the extensive literature on these topics and propose a unified model for safety prediction. This model aims to leverage the distinct advantages of all three prediction families, while also utilizing overlaps between methodologies as an opportunity for cross-validation.
While there are notable differences between the predictive families, their objectives align closely. Therefore, we suggest that combining multiple techniques simultaneously has the potential to create synergies and improve predictions. Certain safety prediction families assess distinct elements of a safety system.
We propose that when these methods are independent, their combination enhances synergy and predictive accuracy. However, when the methods measure similar aspects, this situation can be viewed as an instance of cross-validation.
The data will be rigorously analyzed using various classification algorithms within a machine learning framework to achieve two main objectives: (1), to explore the correlation between the occurrence of incidents and different causation categories, and (2), to assess how direct, indirect, and root causes influence the prediction of injury types.
By applying classification algorithms such as decision trees and random forests, we aim to identify patterns and relationships within the data that reveal how different causation categories contribute to incidents. Additionally, we will evaluate the predictive impact of each causation type on injury outcomes to determine which factors are most influential. This comprehensive analysis will provide valuable insights for enhancing safety protocols and reducing injury rates by targeting the most significant causative factors.
3. Results
3.1. Unified Model Approach
- Safety Observation Reports (SOR) & Accidentology Historical: Safety Observation Reports (SORs) and accidentology histories serve as situational methods in this context, aiming to forecast safety outcomes for individual events based on specific environmental data. We hypothesize that combining these situational methods can yield predictions that are more reliable than those obtained using a single method in isolation. For instance, Random Forest and Decision Tree algorithms excel in predicting the type of injury and identifying its direct, indirect, and root causes. However, they do not inherently predict injury severity. In contrast, Safety Observation Reports demonstrate proficiency in forecasting injury severity and have proven effective in differentiating between successful and failed safety outcomes. Thus, while both methods focus on situational predictions, they are grounded in distinct aspects of the safety system.
- Safety Key Performance Indicators Datasets: Both safety prediction families, namely safety leading indicators, and the training dataset are time-dependent, as well as safety activities and operations, typically measured over weeks or months. Consequently, they are not suited for situational predictions but rather for forecasting injury rates over extended periods, spanning months to years. While training and safety leading indicators assess distinct facets of the safety system, they may not be entirely independent. Safety leading indicators gauge the efficacy of safety management, as documented by Hinze J, Hallowell M, & Baud K. (2013), whereas training evaluates overall safety perceptions. This encompasses perceptions regarding management’s safety commitment, the role of supervisors, and the adequacy and effectiveness of training, encapsulated as “safety climate dimensions”. These perceptions may be influenced by various factors, such as the quality and quantity of training programs, audit frequency, and incentive structures. Therefore, we postulate that integrating training data with safety-leading indicators could yield synergistic effects and opportunities for cross-validation.
- Contractors Safety Performance Datasets: This section aims to predict safety performance in construction sites using contractors’ safety performance data. By analyzing the comprehensive dataset, including factors such as accident types, severity, and frequency, as well as contractor characteristics and historical safety records, examination of past safety performance, including incident rates, corrective actions taken, and adherence to safety regulations, to gauge the overall safety culture and performance trajectory. We employ various machine learning algorithms to identify patterns and predict potential safety incidents related to the accidentology historic dataset.
In summary, these safety prediction families can be strategically designed to cross-validate each other, thereby enhancing the accuracy and comprehensiveness of future performance predictions. To present a higher-level systems model illustrating the relationships among these families, we provide Figure 7. This figure visually connects the different safety prediction methods, highlighting the predictions each method can generate, how they can work together synergistically, and potential opportunities for cross-validation. When two constructs assess similar safety attributes, we view these as theorized relationships and opportunities for cross-validation, which are represented by dashed lines in the diagram:
3.2. Correlation of Causal Factors
A correlation matrix for the studied data groups relevant to multiple workplace sites is presented in Table 4 As illustrated in the table, all the studied variables exhibit a significant relationship with accident occurrence, underscoring the intricate interplay among the factors contributing to workplace incidents. The table also reveals a remarkable correlation between the variables themselves, highlighting their interconnected nature.
In addition to the correlation analysis, the mean and standard deviation for each variable are also calculated and presented, providing a comprehensive overview of their distribution. The statistical significance of these findings is indicated by a p-value of less than 0.03, further reinforcing the robustness of the observed relationships.
In order identify and quantify the interdependencies among risk factors using this correlation matrix, we proceeded with the following steps:
- -
- The data used for the analysis were collected from incident reports, workplace surveys, safety audits & inspections across 103 worksites. Each row in the merged datasets represents a distinct historic incident, supported by a complete and detailed investigation through multiple variables (see Figure 2) and a following plan of action that contains the safety measures needed.
- -
- Variables included in the analysis were chosen based on their relevance to workplace incidents, as determined by the literature reviews. This selection process ensured that only factors with a known or hypothesized link to accident occurrence were included.
- -
-
The relationships between variables were analyzed the matrix to quantify the strength and direction of their associations. The correlation coefficient values range from -1 to 1, where:
- -1 indicates a perfect negative relationship (one variable increases while the other decreases).
- 0 indicates no relationship.
- 1 indicates a perfect positive relationship (both variables increase or decrease together).
- -
- The statistical significance of the correlations was determined using a threshold p-value of 0.03, meaning correlations with p < 0.01 are unlikely to have occurred by chance.
- -
- The findings from the correlation matrix not only identify individual risk factors but also reveal how these factors interact. This interconnected view helps prioritize interventions and policies that address not only standalone risks but also the combined effects of multiple variables.
The correlation matrix presented in Table 4 reveals several key insights into the relationships between various workplace safety factors. Unsafe Acts (UA) exhibit strong positive correlations with People Factors (PF) (0.71) and Unsafe Conditions (UC) (0.65), indicating that individual behaviors and poor environmental conditions are closely linked to the occurrence of unsafe actions. Unsafe Conditions are also strongly associated with People Factors (0.78) and Execution Factors (EF) (0.60), suggesting that both individual factors and execution issues contribute significantly to unsafe conditions.
Execution Factors show a strong relationship with Management Aspects (MA) (0.71) and Program System Aspects (PSA) (0.68), highlighting the importance of effective management and robust systems in mitigating execution problems. Lastly, Management Aspects and Program System Aspects are highly correlated (0.75), underscoring the critical role of integrated management and system improvements in enhancing overall workplace safety.
The correlations, with a significance level of p < 0.01 (see Figure 8), indicate that addressing these interrelated factors could substantially improve safety outcomes.
3.3. Impact on Accident Occurrence
The correlation matrix in Table 5 reveals significant positive relationships between accident occurrence and all the causation factors studied. Unsafe Acts, Unsafe Conditions, and People Factors are particularly strongly associated with accidents, suggesting that both individual behaviors and environmental conditions play crucial roles in incident rates.
Execution Factors and Management Aspects also show meaningful correlations, highlighting the importance of effective execution processes and management practices in influencing accident occurrences. Additionally, Program System Aspects are closely related to accidents, underscoring the role of system deficiencies.
Overall, these findings highlight the complex interplay between various factors and emphasize the need for comprehensive improvements across all areas to enhance workplace safety and reduce accident rates.
3.4. Predictive Analysis of Accident Occurrence
Given the insights from the correlation matrixes, a predictive analysis of accident occurrence will be conducted using various machine learning algorithms deployed in Google Colab as well as VS Code using Scikit-learn in Python and several machine learning libraries. The strong correlations between accident occurrence and the identified causation factors provide a robust foundation for this analysis (Sarkar & & Maiti, Machine learning in occupational accident analysis: A review using science mapping approach with citation network analysis. , 2020). By employing multiple machine learning algorithms, we aim to train and test models that can accurately predict the likelihood of accidents based on these factors (Choi, Gu, & Chin, 2020).
In this case study, several machine learning algorithms were utilized to leverage the correlations identified in the data.
- -
- Random forest (RF): The RF model was built using 100 decision trees, maximum tree depth of 15, minimum samples split of 2. These parameters were optimized using a grid search method to balance bias and variance, thereby minimizing overfitting while maintaining robust predictions.
- ✓
- Random Forest was used for its ability to manage complex interactions between multiple factors (Zhang, Khattak, Matara, Hussain, & Farooq, 2022) and reduce overfitting (see Figure 9).
- ✓
- The dataset was divided into training (80%) and testing (20%) sets using a stratified sampling technique to ensure balanced representation of accident occurrences.
- ✓
- Model performance was evaluated using standard metrics, including accuracy, precision, recall & F1-score.
- ✓
- Cross-validation was performed with k = 5 folds to ensure robustness and generalizability of the results.
- -
- Decision Tree (DT): Decision Tree was also incorporated (Eetvelde, Mendonça, Ley, & Tischer, 2021) to offer clear, interpretable insights into how different factors influence accident predictions (see Figure 10). Unlike other machine learning models that may function as “black boxes,” the Decision Tree offers a visual and logical breakdown of how variables and thresholds contribute to the risk prediction process.
The Decision Tree model was constructed with the following key configurations:
- ✓
- Criterion for Splitting: Gini impurity was used as the splitting criterion to measure the quality of splits at each node.
- ✓
- Maximum Depth: The maximum depth of the tree was set to 5 to prevent overfitting and to enhance interpretability.
- ✓
- Minimum Samples per Split: A threshold of 10 samples per split was defined to ensure meaningful partitions.
- ✓
- Pruning Strategy: Post-pruning was applied to remove nodes that did not significantly contribute to the predictive accuracy, further simplifying the model for better generalization.
- ✓
- The dataset was divided into training (80%) and testing (20%) subsets using stratified sampling.
- ✓
- The Decision Tree was trained using Scikit-learn in Python, and its performance was evaluated using standard metrics such as accuracy, precision, recall, and F1-score.
- ✓
- Cross-validation with k = 5 folds was conducted to ensure the robustness of the model.
- -
- AdaBoost: AdaBoost was applied (see Figure 11) to enhance prediction accuracy by focusing on correcting misclassifications and boosting the performance of weaker models (Augustine & & Shukla, 2022).
- ✓
- Base Estimator: Decision Trees with a maximum depth of 1–3 were used as weak learners. This choice balances interpretability and the model’s ability to identify simple decision boundaries.
- ✓
- Number of Estimators: The number of boosting iterations was set to 50, providing a sufficient balance between computation time and model accuracy.
- ✓
- Learning Rate: A learning rate of 0.1 was employed, controlling the contribution of each weak learner to the final model. This parameter was tuned to avoid overfitting while maximizing performance.
- ✓
- Boosting Strategy: The AdaBoost algorithm assigned higher weights to misclassified samples in each iteration, focusing subsequent weak learners on correcting these errors.
- ✓
- The training and testing datasets were the same as those used for other models, with 80% of the data used for training and 20% for testing.
- ✓
- The model’s performance was evaluated using accuracy, precision, recall and F1-score.
- ✓
- Hyperparameters were optimized using grid search cross-validation with k = 5 folds.
3.5. Interpretations
After evaluating the performance of the machine learning models, the following key findings emerged:
- Random Forest achieved the highest accuracy of 84.32%, making it the most reliable model for predicting accidents. This model can be used confidently to identify high-risk factors and predict accidents, enabling proactive safety measures on construction sites. The high accuracy of Random Forest suggests that it could serve as a reliable tool for safety management in real construction environments. Safety managers could leverage this model to identify and predict high-risk conditions, enabling them to take preventive measures before accidents occur. So, Random Forest is the most effective tool for predicting and preventing accidents, guiding safety interventions on construction sites based on identified risk factors.
- Decision Tree performed with an accuracy of 81.08%, providing a slightly lower but still strong prediction. Its interpretability makes it valuable for safety managers who need clear, actionable insights to guide safety decisions and protocols. While slightly less accurate, DT offers a more interpretable approach. Safety managers may find it beneficial for developing clear safety guidelines and protocols based on the model’s outputs. The ease of interpreting decision tree splits makes it an excellent tool for training and guiding site supervisors and contractors in accident prevention strategies. So, Decision Tree can be used for designing clear safety guidelines and training programs, thanks to its interpretability.
- AdaBoost showed an accuracy of 66.49%, which is lower than the other two models. While less accurate, it could still be useful for improving model performance by focusing on misclassifications in specific contexts.
The relatively lower performance of AdaBoost might suggest that it is less suited for predicting accidents in this particular case. However, this model could still be valuable for improving prediction accuracy in combination with other techniques, particularly if it is used to focus on correcting misclassifications in certain contexts or risk scenarios. So, AdaBoost, while less effective overall, may still be useful in improving prediction accuracy in certain scenarios.
4. Discussion
The ultimate objective of this study was to model the factors influencing workplace accidents, and the results reveal significant insights into how various causation factors are interrelated. Our findings indicate a substantial correlation between accident occurrence and a range of direct, indirect, and root causes within the case group. Notably, accident occurrence was inversely related to several variables, suggesting that an increase in these factors correlates with a decrease in accident rates, or vice versa, depending on the nature of the variable (Zarei, Karimi, Habibi, Barkhordari, & A., 2021).
Our analysis highlights several critical pressure factors that impact workplace safety. Specifically, family-to-work conflict and occupational responsibilities were identified as significant sources of stress that adversely affect safety outcomes. The lack of effective management in balancing personal and professional demands exacerbates this issue, leading to increased accident risks. Furthermore, inadequate feedback and rewards from the work environment contribute to this pressure, affecting employees’ overall safety performance.
Another key finding is the role of perceived control over one’s behavior. Employees who feel that their behavior is heavily regulated by external controls rather than self-determined are under greater stress, which in turn increases the likelihood of workplace accidents. This perception of diminished personal agency contributes to a heightened sense of pressure, further elevating accident risks.
The study underscores the importance of general health on occupational safety. Individuals who are physically and psychologically healthier are better equipped to handle job-related stress, which can influence their ability to manage safety risks effectively. Improved health conditions are associated with greater resilience to stress, reducing the likelihood of accidents and mitigating their potential consequences.
Overall, these findings suggest that a multifaceted approach is necessary to address workplace safety. Effective management strategies, support systems for balancing work and personal life, and health-promoting interventions are crucial to reducing accident rates. By addressing these pressure factors and enhancing individual well-being, organizations can create a safer work environment and potentially lower the incidence of occupational accidents.
The training and testing results supported both hypotheses across all data groups, demonstrating a positive impact on occupational accident occurrences. These findings align with the research by (TD, C, MA, & DM, 2020) who also investigated factors influencing occupational accidents, including work-family conflict. Their study highlighted that work-family conflict, among other organizational parameters, showed a strong association with accident occurrences and severity.
As this is consistent with the present study, it confirms that several causations significantly affect accident rates. They represent a misalignment between personal and professional responsibilities, increasing the potential risk levels and, consequently, the likelihood of accidents. The results suggest that managing and mitigating these causations and related stressors can effectively reduce accident rates and enhance employee health. Thus, organizations should focus on addressing these conflicts to improve workplace safety.
5. Conclusions
The current analysis identified several safety climate variables—underlaying in direct, indirect and root causes as significant risk factors for occupational accidents. To improve workplace safety, it is essential for management to involve workers in safety decisions and to enhance safety programs through targeted proactive action plans based on the predictive insights proven possible and accurate in this study results.
The study found that increased safety climate issues correlate with higher accident rates, particularly among workers in sectors construction. This underscores the need for targeted preventive and proactive measures in these high-risk areas.
Evaluating the predictive results during construction work could help identify individuals prone to accidents, allowing for better safety. The study’s strength lies in the comparable sampling of several machine learning algorithms used in data that has been collected across multiple sites and circumstances, though future research should address the gap in comparing injured versus non-injured workers for more detailed insights into accident causation.
Informed Consent Statement
Informed consent was obtained from all subjects involved in the study.
Data Availability Statement
The data used for this research are not publicly available due to privacy and legal restrictions related to companies’ ethics.
Conflicts of Interest
The authors declare no conflicts of interest.
References
- Abbasianjahromi, H.; Aghakarimi, M. (2021). Safety performance prediction and modification strategies for construction projects via machine learning techniques. Engineering, Construction and Architectural Management.
- Alexander, D.; Hallowell, M.; Gambatese, J. Precursors of construction fatalities. II: predictive modeling and empirical validation. Journal of construction engineering and management, 2017; 143. [Google Scholar]
- APC, C.; J, G.; TNY, C.; Y, Y.; G, W.; E. ; L. Improving Safety Performance of Construction Workers through Learning from Incidents. Int J Environ Res Public Health 2023, 5, 4–20. [Google Scholar]
- Augustine, T.; Shukla, S. (2022). Road accident prediction using machine learning approaches. 2nd International Conference on Advance Computing and Innovative Technologies in Engineering (ICACITE).; (pp. 808–811).
- Baker, H.; Hallowell, M.R.; Tixier, A.J.-P. AI-based prediction of independent construction safety outcomes from universal attributes. Automation in Construction 2020, 118. [Google Scholar] [CrossRef]
- Baradan, S.; Usmen, M.A. Comparative injury and fatality risk analysis of building trades. J. Constr. Eng. Manage 2006, 533–539. [Google Scholar] [CrossRef]
- Cavalcanti, M.; Lessa, L.; Vasconcelos, B. Construction accident prevention: A systematic review of machine learning approaches. Work 2023, 145, 293–302. [Google Scholar] [CrossRef]
- Chen, J.R.; Yang, Y.T. A predictive risk index for safety performance in process industries. J. Loss Prev. Process Ind 2004, 17, 233–242. [Google Scholar] [CrossRef]
- Chen, W. ; al.; e. Artificial Intelligence Marvelous Approach for Occupational Health and Safety Applications in an Industrial Ventilation Field: A Short-systematic Review. Electronics, 2020; 9. [Google Scholar] [CrossRef]
- Choi, J.; Gu, B.; Chin, S.E. Machine Learning Predictive Model Based on National Data for Fatal Accidents of Construction Workers. Automation in Construction 2020, 110, 102974. [Google Scholar] [CrossRef]
- Chua, D.K.H.; Goh, Y.M. A Poisson model of construction incident occurence. J. Constr. Eng. Manage 2005, 715–722. [Google Scholar] [CrossRef]
- Cooper, M.D.; Phillips, R.A. Exploratory analysis of the safety climate and safety behavior relationship. J. Saf. Res. 2004, 35, 497–512. [Google Scholar] [CrossRef]
- Eetvelde, H.; Mendonça, L.; Ley, C.S.; Tischer, T. Machine learning methods in sport injury prediction and prevention: a systematic review. Journal of Experimental Orthopaedics 2021, 8, 1186. [Google Scholar] [CrossRef]
- Fang, D.P.; Chen, Y.; Louisa, W. Safety climate in construction industry: A case study in Hong Kong. J. Constr. Eng. Manage. 2006, 573–584. [Google Scholar] [CrossRef]
- Fargnoli, M.; Lombardi, M. Building Information Modelling (BIM) to Enhance Occupational Safety in Construction Activities: Research Trends Emerging from One Decade of Studies. Buildings 2020, 10, 98. [Google Scholar] [CrossRef]
- Gao, Y.; Gonzalez, V.; Yiu, K.T. ; Cabrera-Guerrero.; G. (2019). The Use of Machine Learning and Big Five Personality Taxonomy to Predict Construction Workers’ Safety Behaviour. Computer Science.
- Gillen, M.; Baltz, D.; Gassel, M.; Kirch, L.; Vaccaro, D. Perceived safety climate, job demands, and coworker support among union and nonunion injured construction workers. J. Saf. Res. 2002, 33, 33–51. [Google Scholar] [CrossRef]
- Glendon, A.I. Safety climate factors, group differences and safety behavior in road construction. J. Saf. Sci 2001, 39, 157–188. [Google Scholar] [CrossRef]
- Hallowell, M.R.; Gambatese, J.A. Activity-based safety and health risk quantification for formwork construction. J. Constr. Eng. Manage. 2009, 990–998. [Google Scholar] [CrossRef]
- Heinrich, H.W. (1941). Industrial Accident Prevention: A Scientific Approach. McGraw-Hill.
- Hinze, J. , Hallowell, M.; Baud, K. Construction-safety best practices and relationships to safety performance. J. Constr. Eng. Man. 2013, 04013006, 1943–7862. [Google Scholar]
- Johnson, S.E. The predictive validity of safety climate. J. Saf, Res. 2007, 511–521.
- Kakhki, F.D.; Freeman, S.A.; Mosher, G.A. Evaluating machine learning performance in predicting injury severity in agribusiness industries. Safety Science 2019, 117, 257–262. [Google Scholar] [CrossRef]
- Khan, R.U.; Yin, J.; Mustafa, F.S.; Shi, W. Factor assessment of hazardous cargo ship berthing accidents using an ordered logit regression model. Ocean Engineering 2023, 284. [Google Scholar] [CrossRef]
- Koc, K.; Gurgun, A. (2021). MACHINE LEARNING APPLICATIONS IN CONSTRUCTION SAFETY LITERATURE. Proceedings of International Structural Engineering and Construction.
- Lee, J.; Yoon, Y.; Oh, T.; Park, S.; Ryu, S. A Study on Data Pre-Processing and Accident Prediction Modelling for Occupational Accident Analysis in the Construction Industry. Journal of Safety Research 2020, 73, 285–297. [Google Scholar] [CrossRef]
- Lee, S.; Halpin, D.W. Predictive tool for estimating accident risk. J. Constr. Eng. Manage 2003, 4, 431–436. [Google Scholar] [CrossRef]
- Mahamulkar, S.; Lad, V.H.; Patel, K.A. (5-7 September 2022). Development of a Framework for Selection of a Tunnel Lining Formwork System. Proceedings 38th Annual ARCOM Conference (pp. 359–368). Glasgow, UK: Association of Researchers in Construction Management.
- Rozenfeld, O.; Sacks, R.; Rosenfeld, Y.; Baum, H. Construction Job Safety Analysis. J. Saf. Sci. 2010, 48, 491–498. [Google Scholar] [CrossRef]
- Sarkar, S.; Maiti, J. Machine learning in occupational accident analysis: A review using science mapping approach with citation network analysis. Safety Science 2020, 131, 104900. [Google Scholar] [CrossRef]
- Shrestha, S. (2020). Occupational Hazards in Building Construction. SCITECH Nepal(10.3126).
- Shuang, Q.; Zhang, Z. (2023). Determining Critical Cause Combination of Fatality Accidents on Construction Sites with Machine Learning Techniques. Buildings.
- Tam, C.M.; Fung, I.W.H. (1998). Effectiveness of safety management strategies on safety performance in Hong Kong. J. Construction Management Economy.
- TD, S.; C, M.-J.; MA, D.; DM, D. Stress, burnout and diminished safety behaviors: An argument for Total Worker Health® approaches in the fire service. J Safety Res. 2020, 75, 189–195. [Google Scholar] [CrossRef]
- Yedla, A.; Kakhki, F.D.; Jannesari, A. Predictive Modeling for Occupational Safety Outcomes and Days Away from Work Analysis in Mining Operations. Int. J. Environ. Res. Public Health 2020, 17. [Google Scholar] [CrossRef] [PubMed]
- Zarei, E.; Karimi, A.; Habibi, E.; Barkhordari, A.R. Dynamic occupational accidents modeling using dynamic hybrid Bayesian confirmatory factor analysis: An in-depth psychometrics study. Safety Science 2021, 131, 105146. [Google Scholar] [CrossRef]
- Zhang, S.; Khattak, A.; Matara, C.M.; Hussain, A.; Farooq, A. (2022). Hybrid feature selection-based machine learning Classification system for the prediction of injury severity in single and multiple-vehicle accidents. PLoS One(10.1371).
- Zhu, R.; Hu, X.; Hou, J.; Li, X. (2021). Application of machine learning techniques for predicting the consequences of construction accidents in China. Process Safety and Environmental Protection.
- Zohar, D. Safety climate in industrial organizations: Theoretical and Applied Implications. J. Appl. Psychol. 1998, 78–85. [Google Scholar] [CrossRef]
Figure 1.
Project process flowchart.
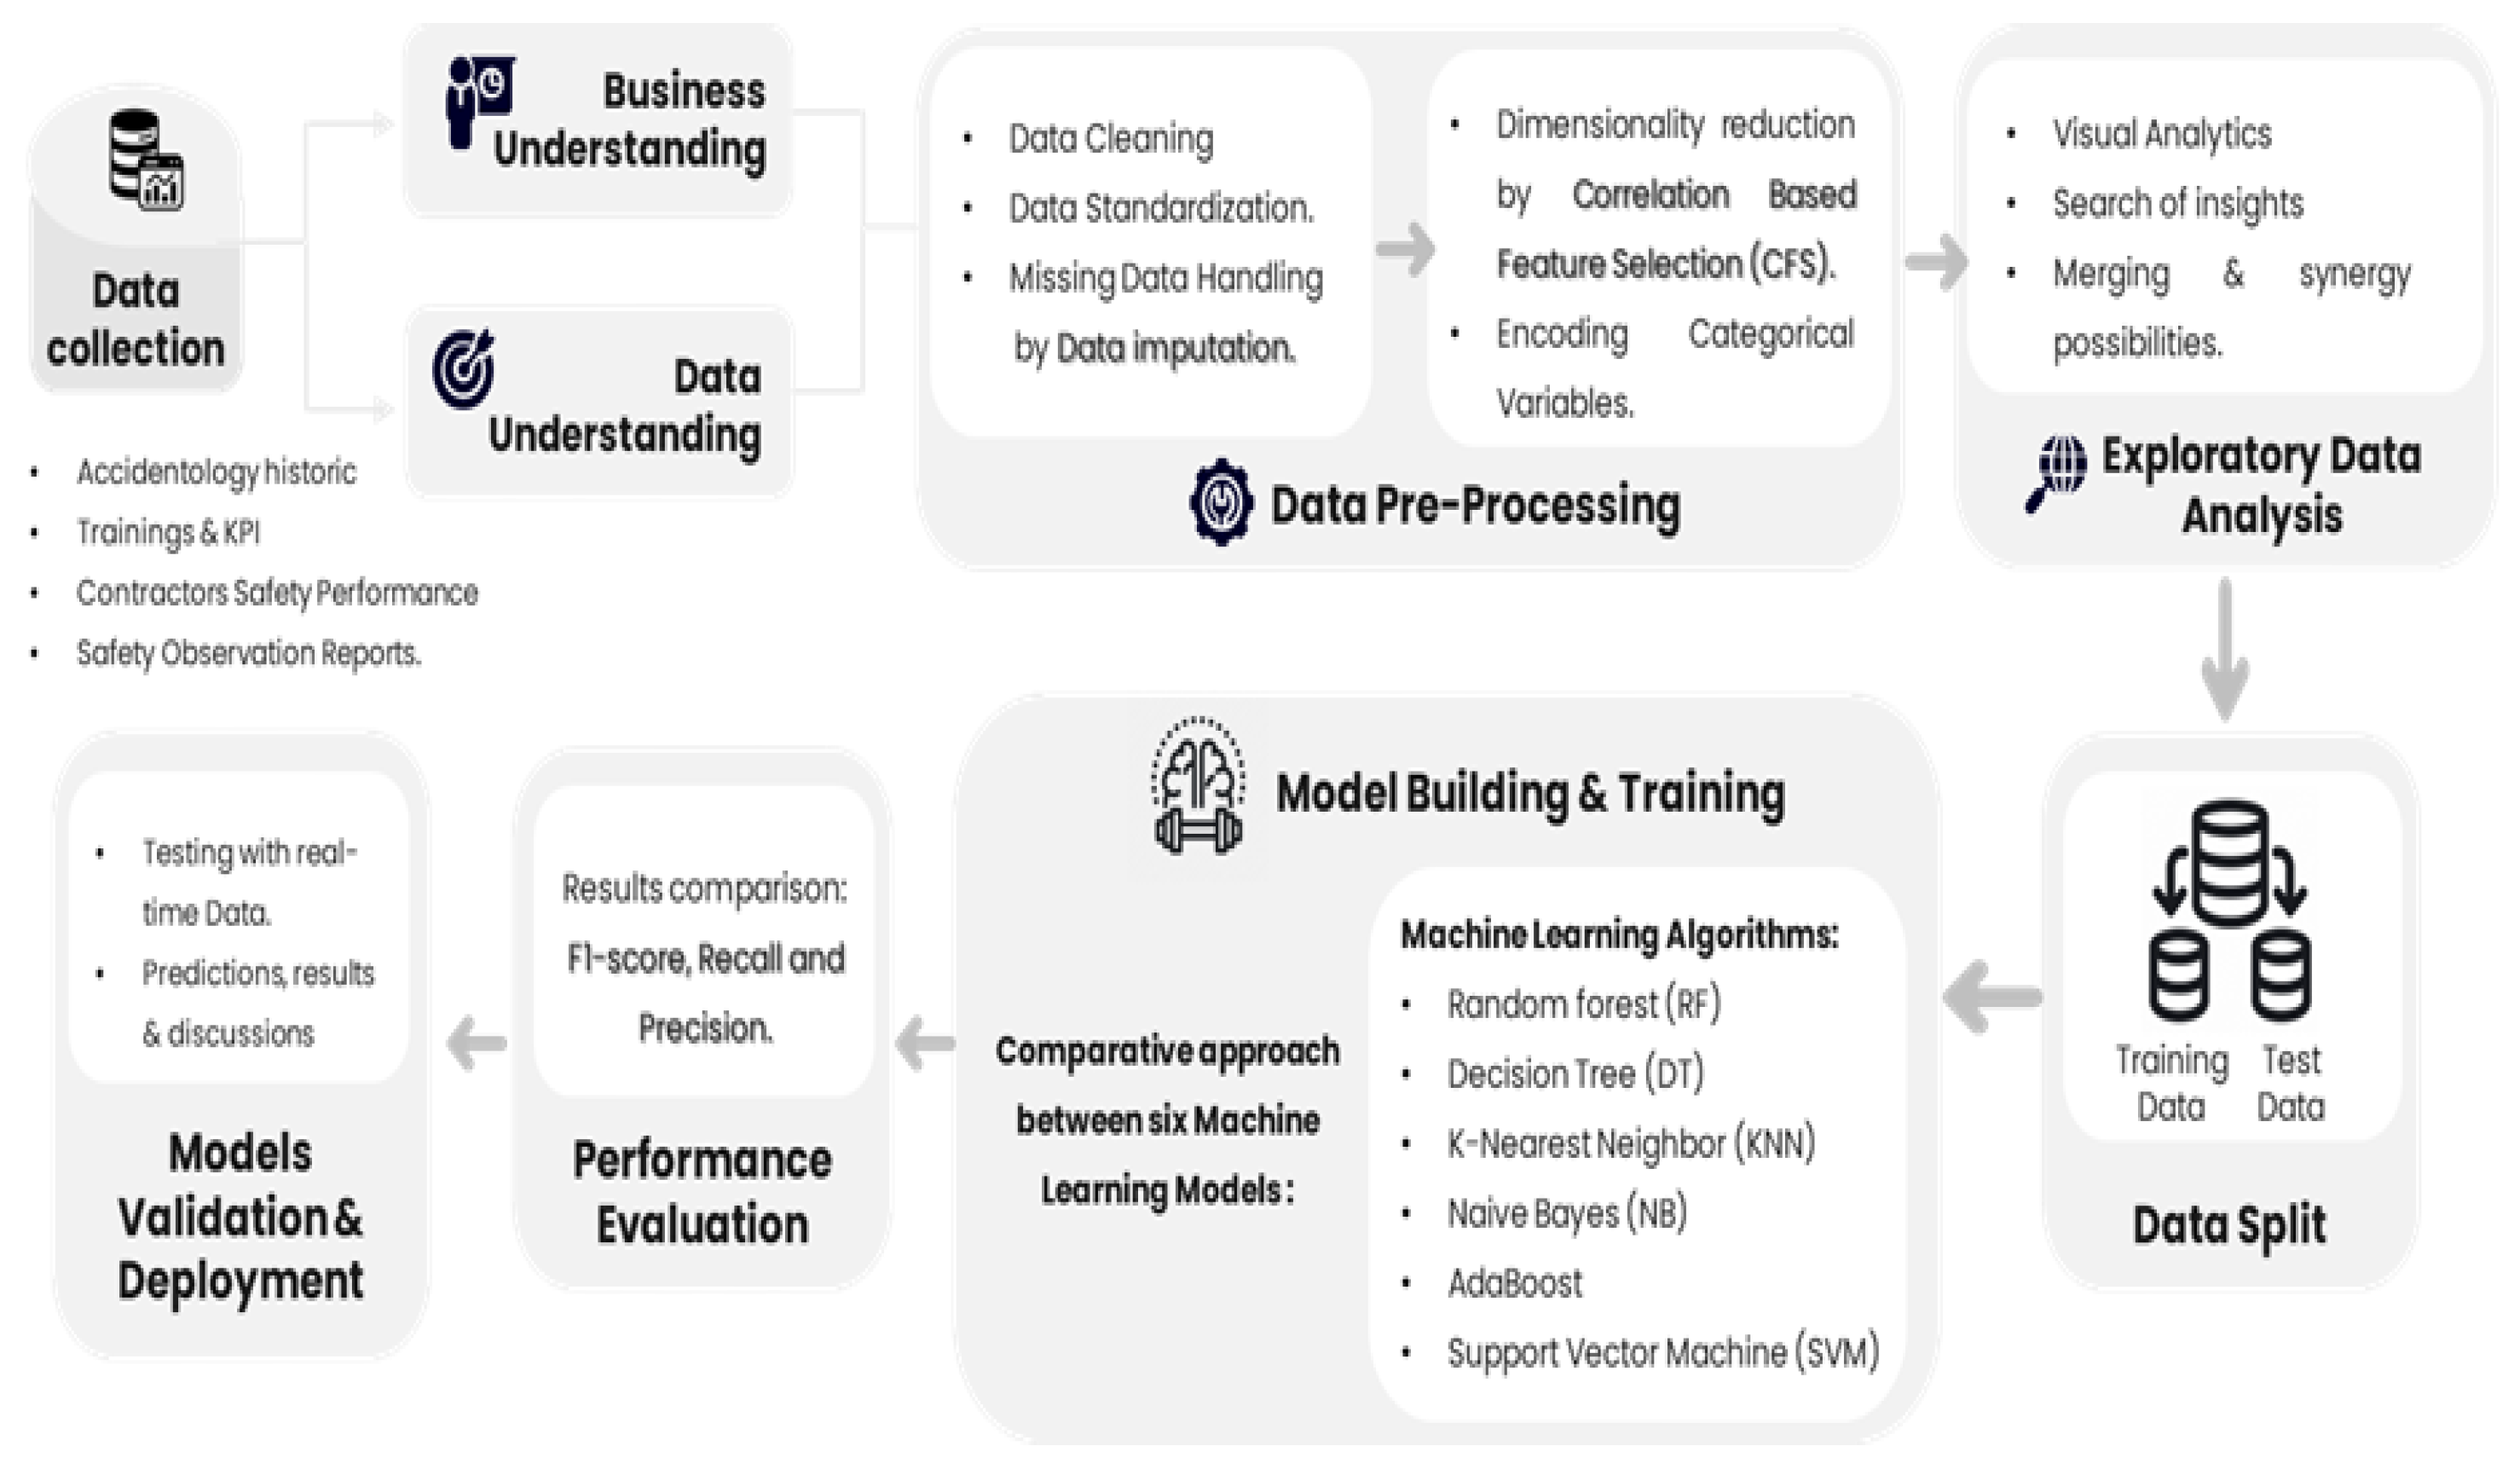
Figure 2.
Datasets and Variables in Use.
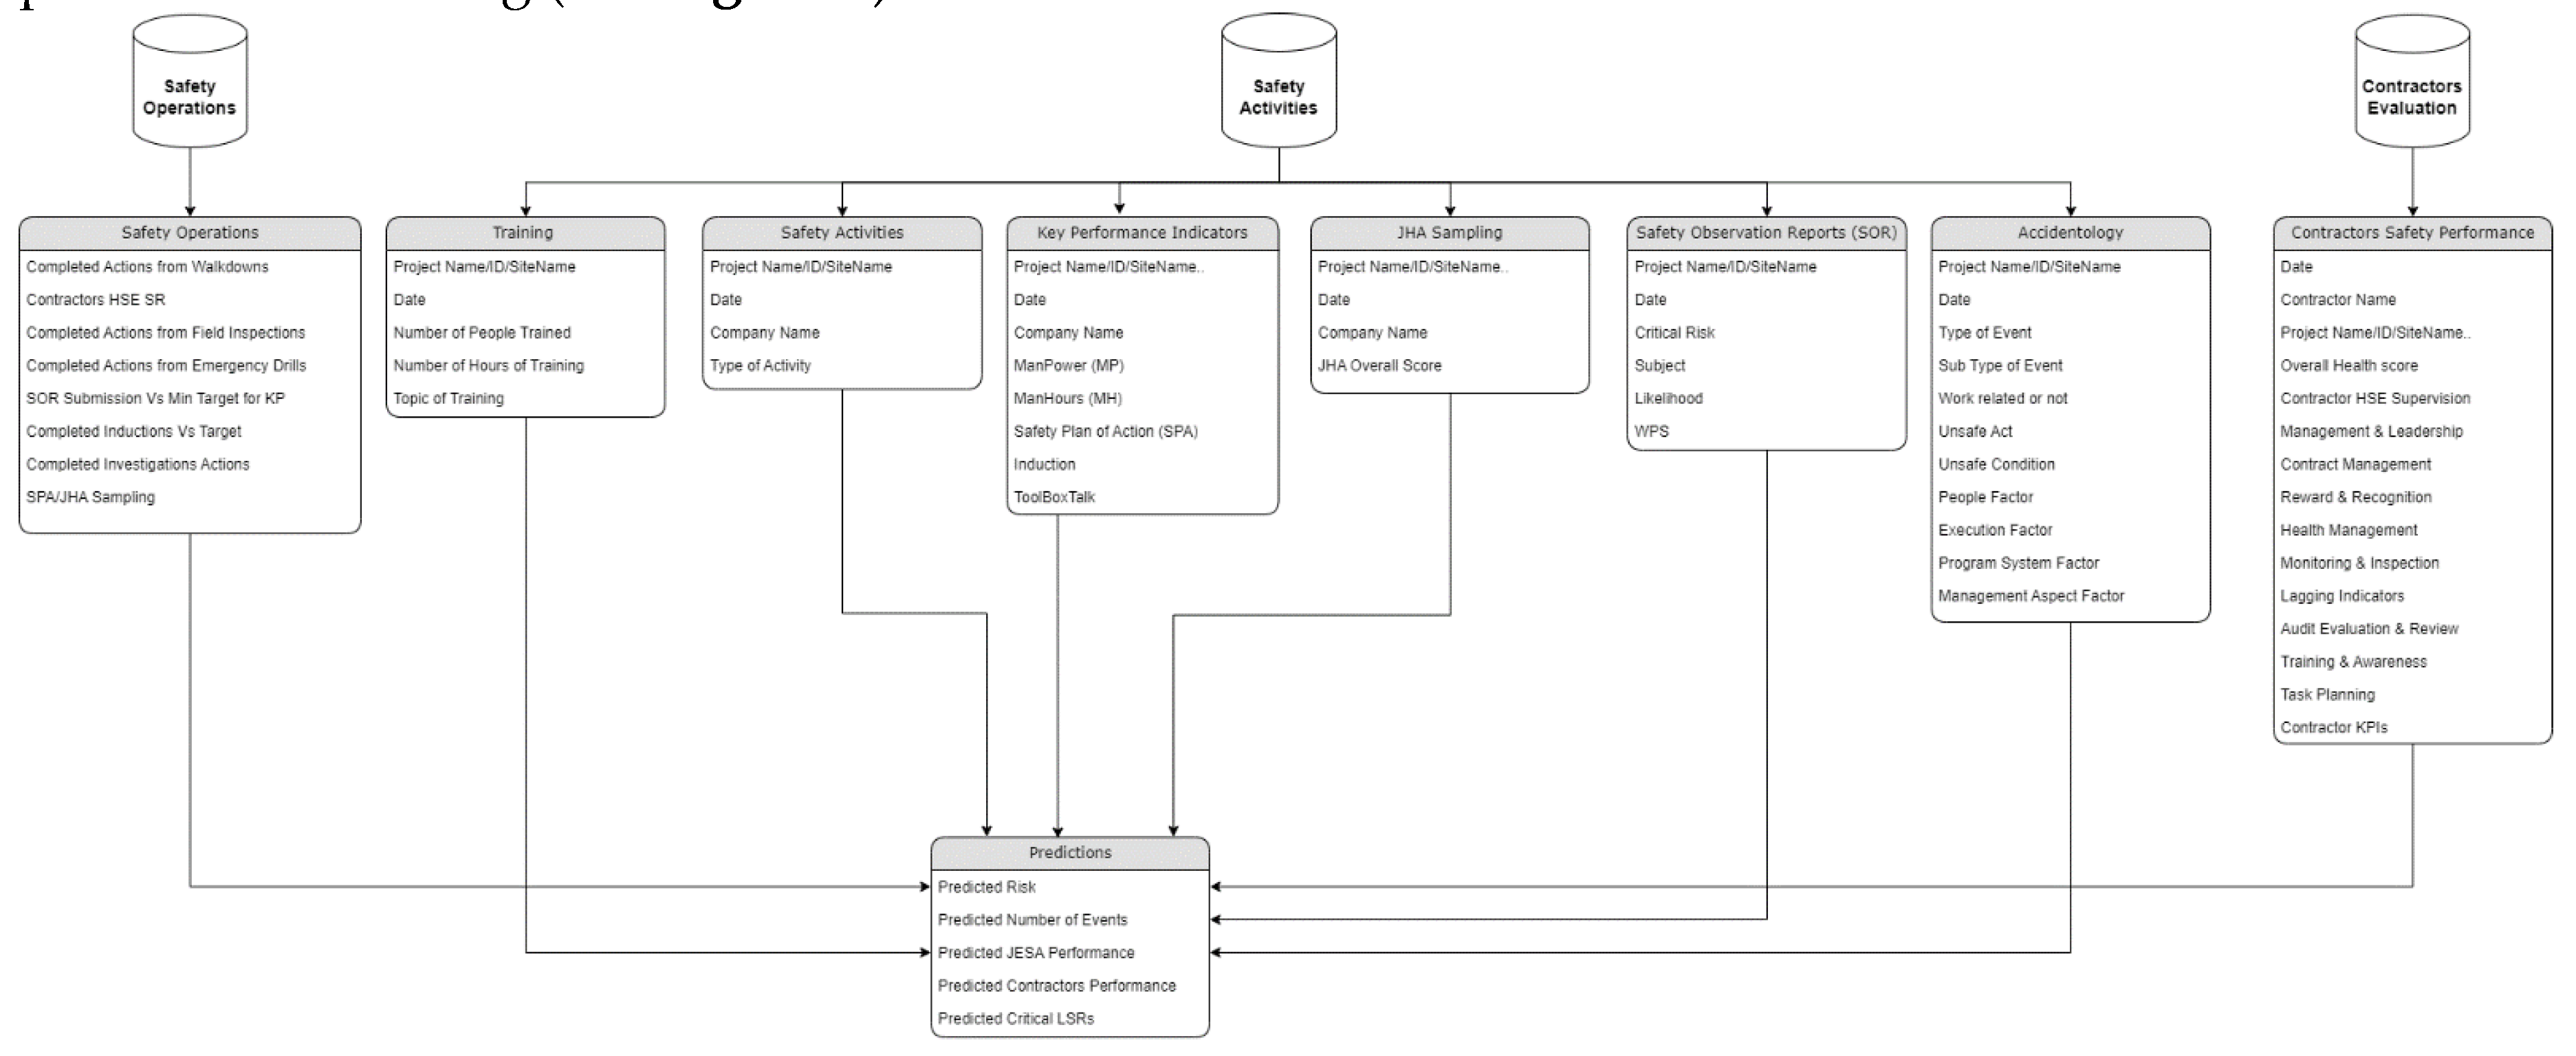
Figure 3.
Projection of Heinrich’s Domino Model on the Hypothesis of the Analysis.
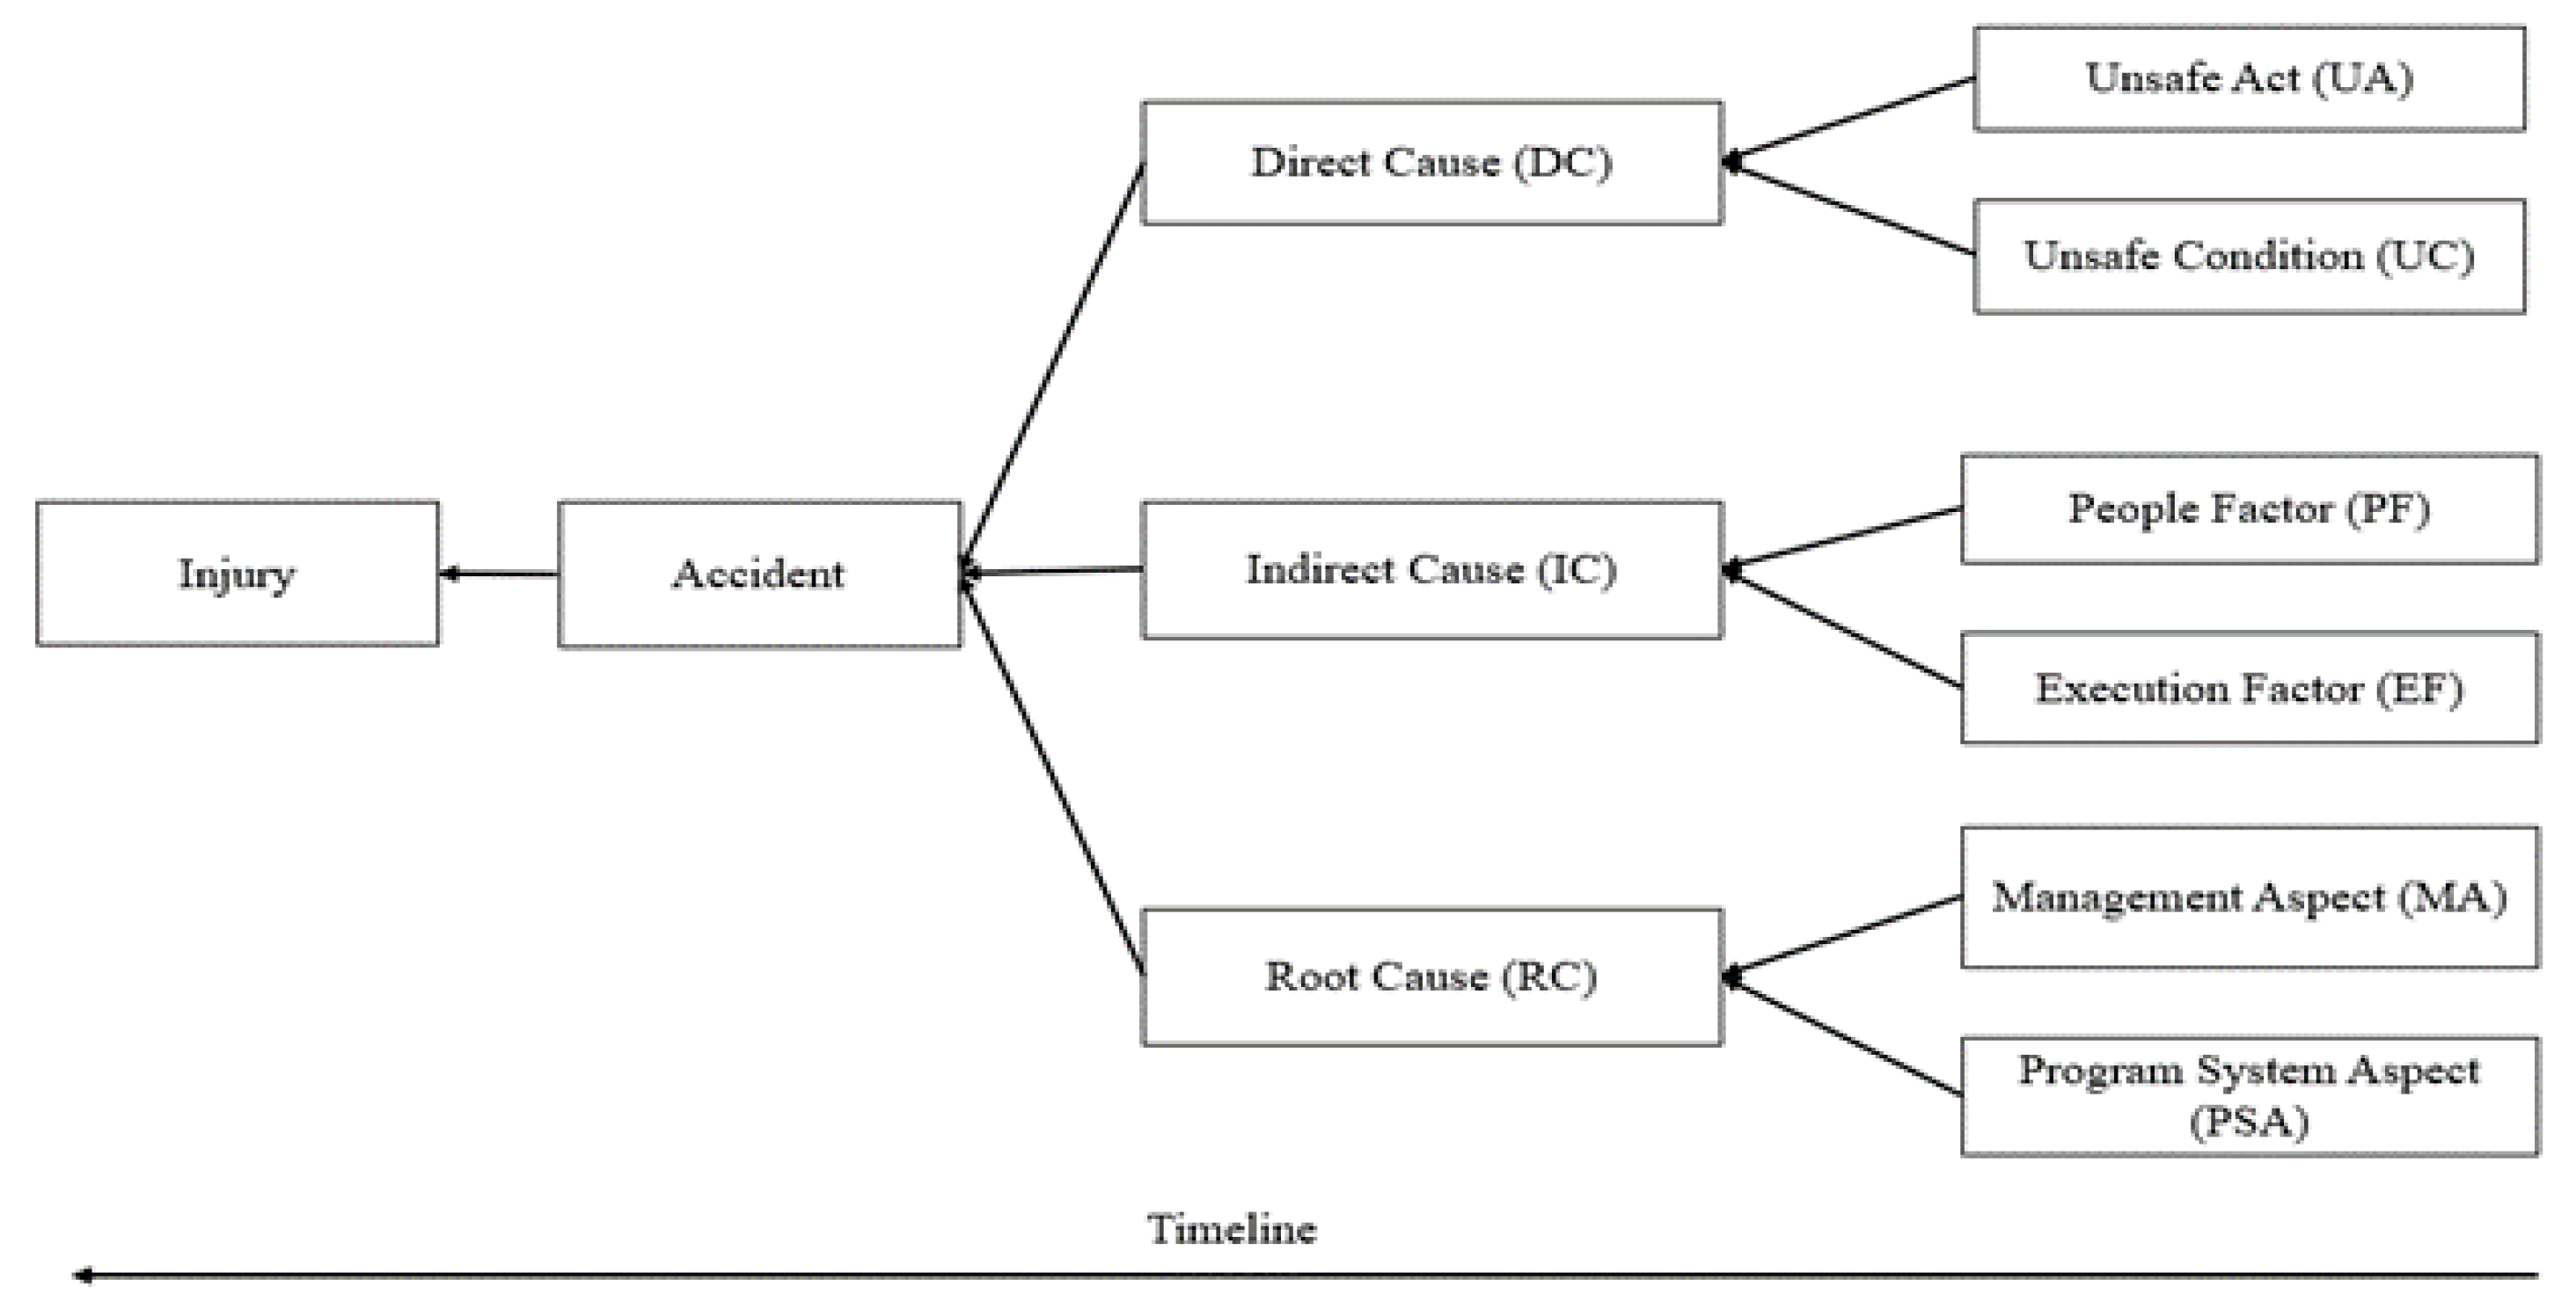
Figure 4.
Overview of data quantity per type of injury.
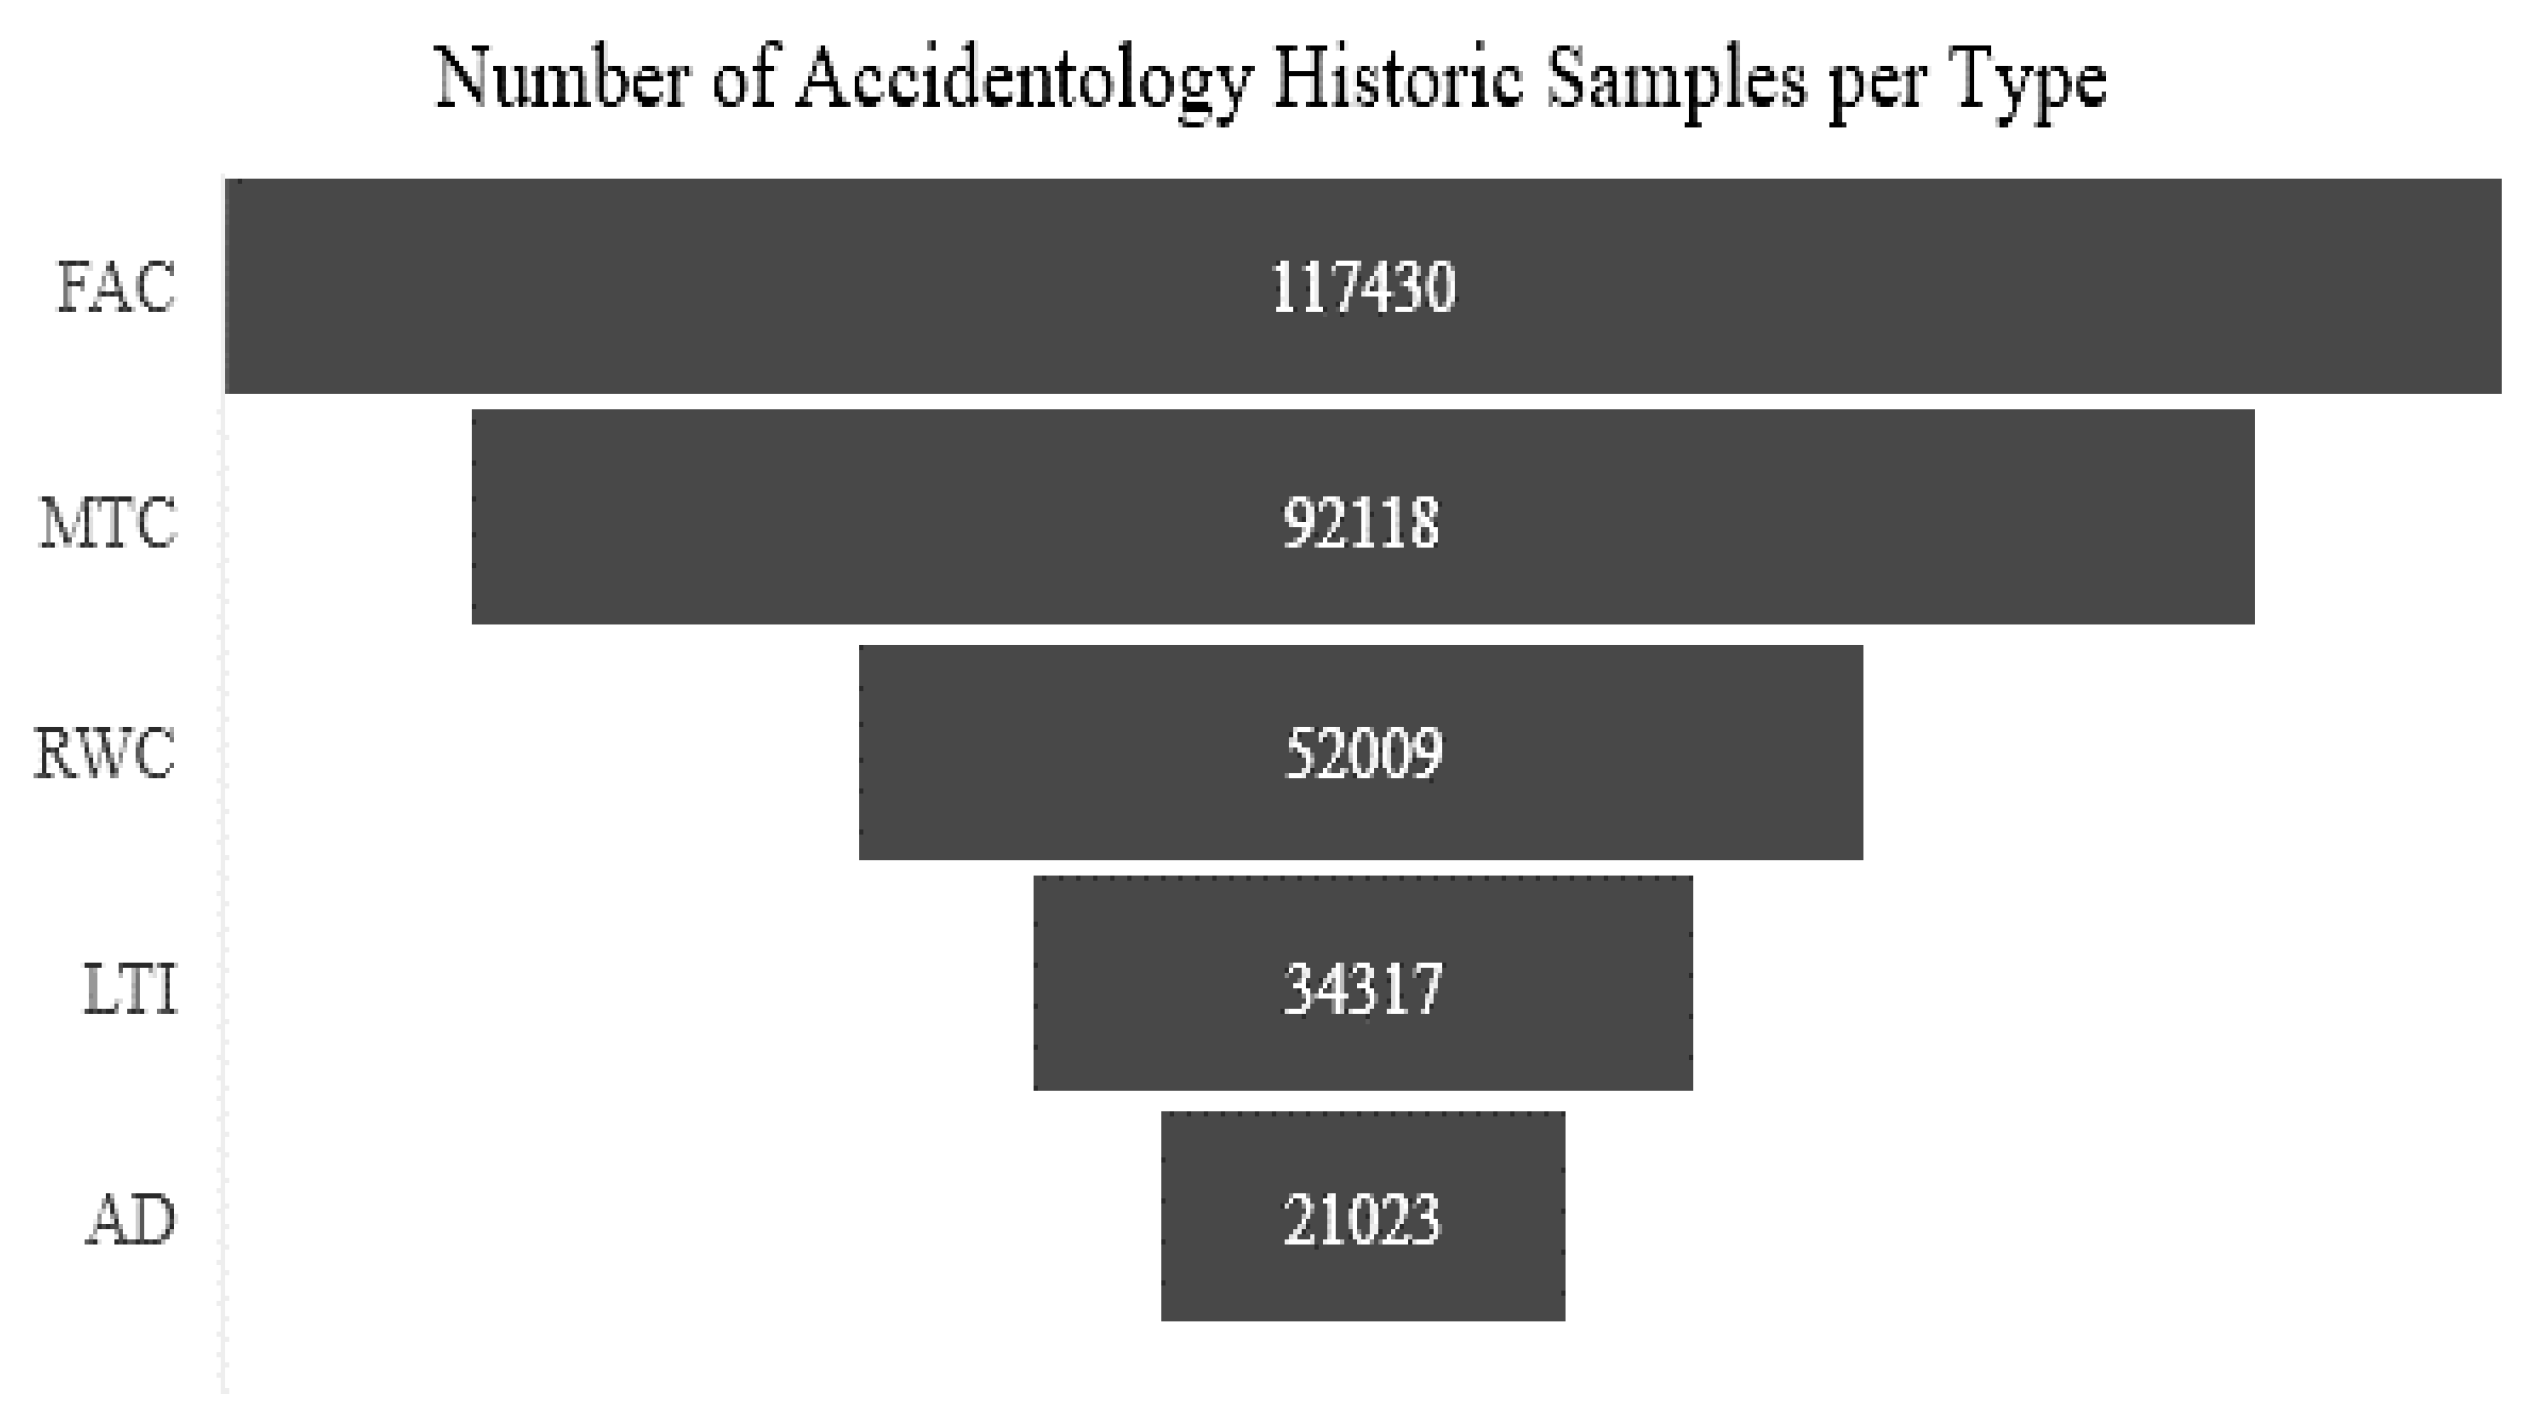
Figure 5.
Suggested architecture for the model deployment.
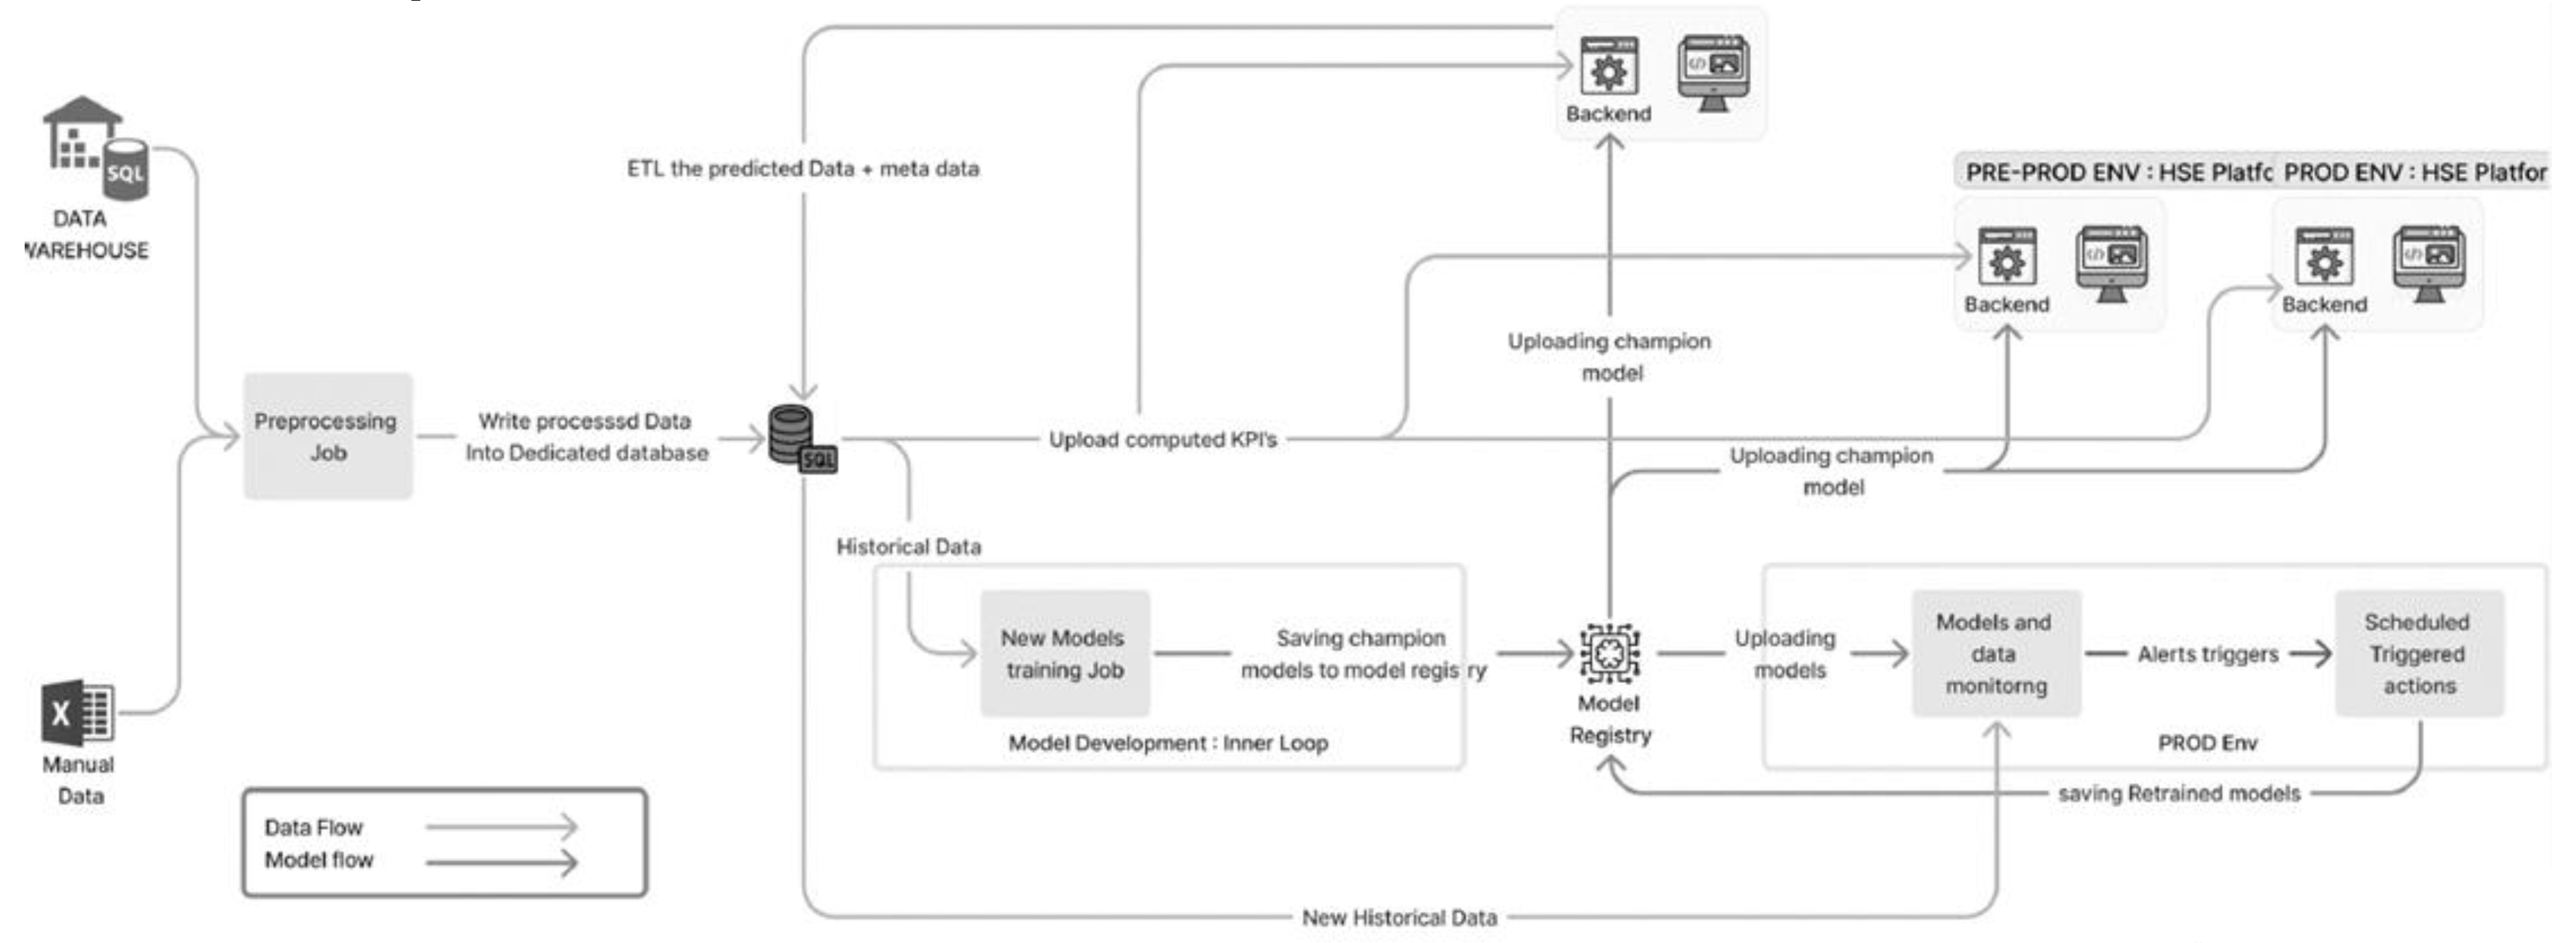
Figure 6.
Safety Predictive Analysis Business Case Diagram.
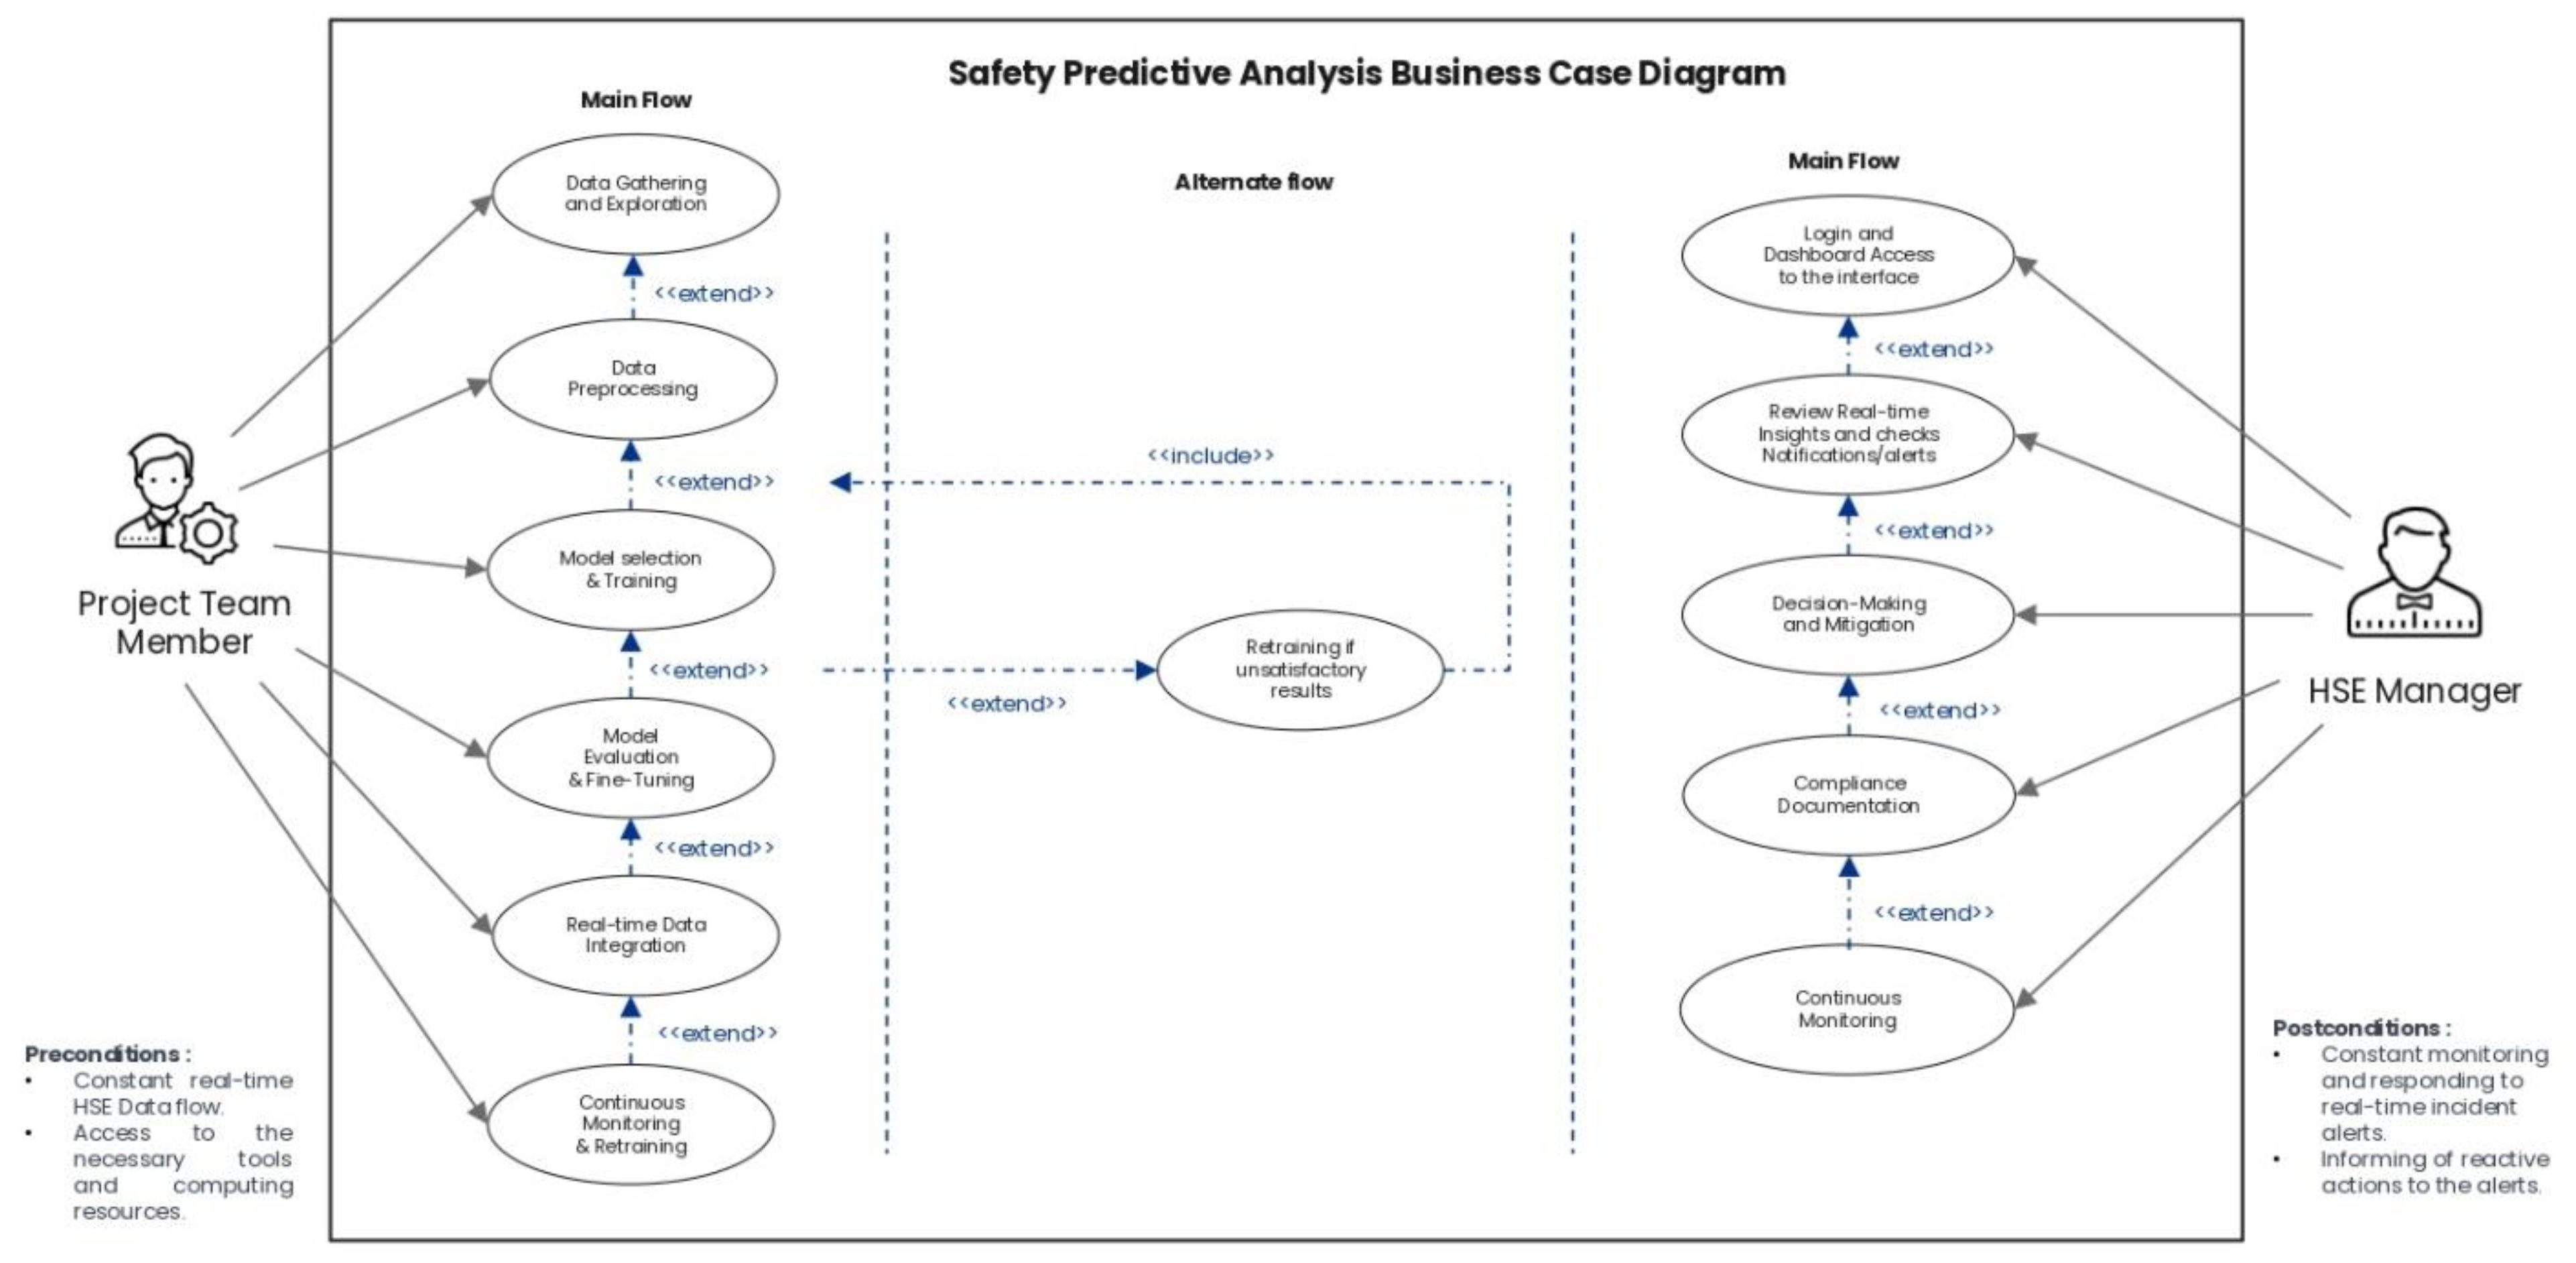
Figure 7.
Suggested Model of the Relationships Among the Datasets Families.
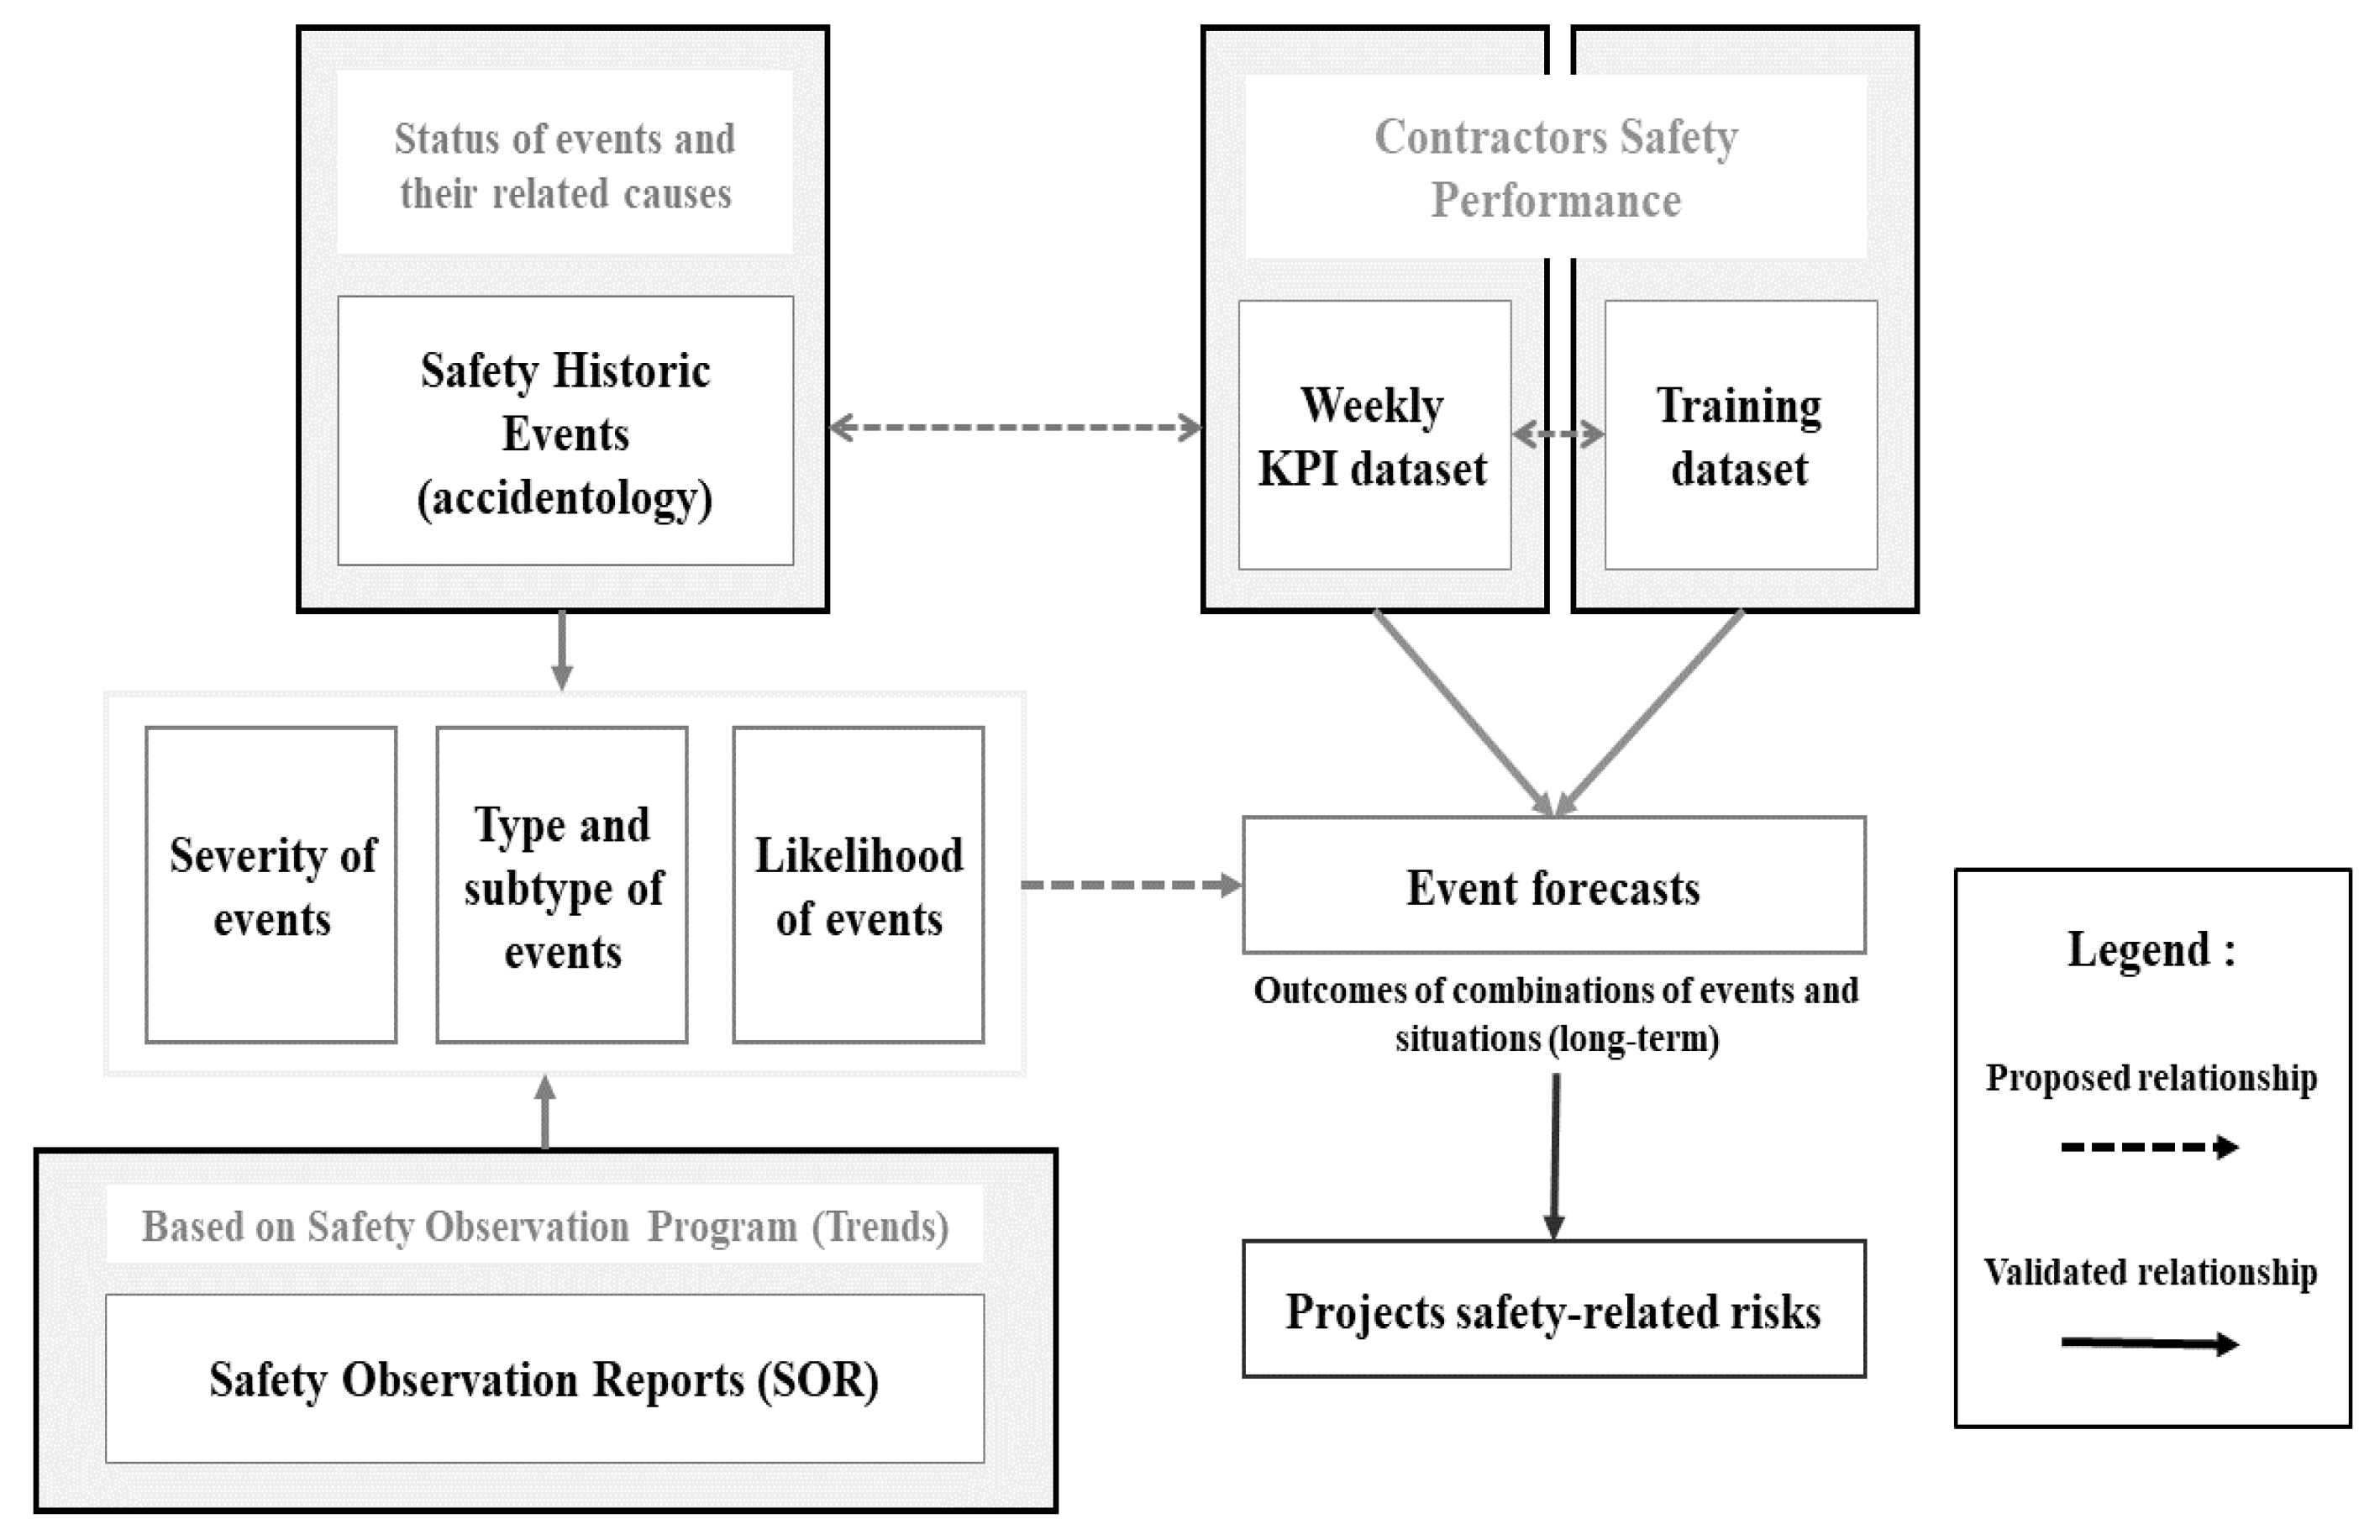
Figure 8.
Theoretical Model of Correlation Between Causal Factors of The Study.
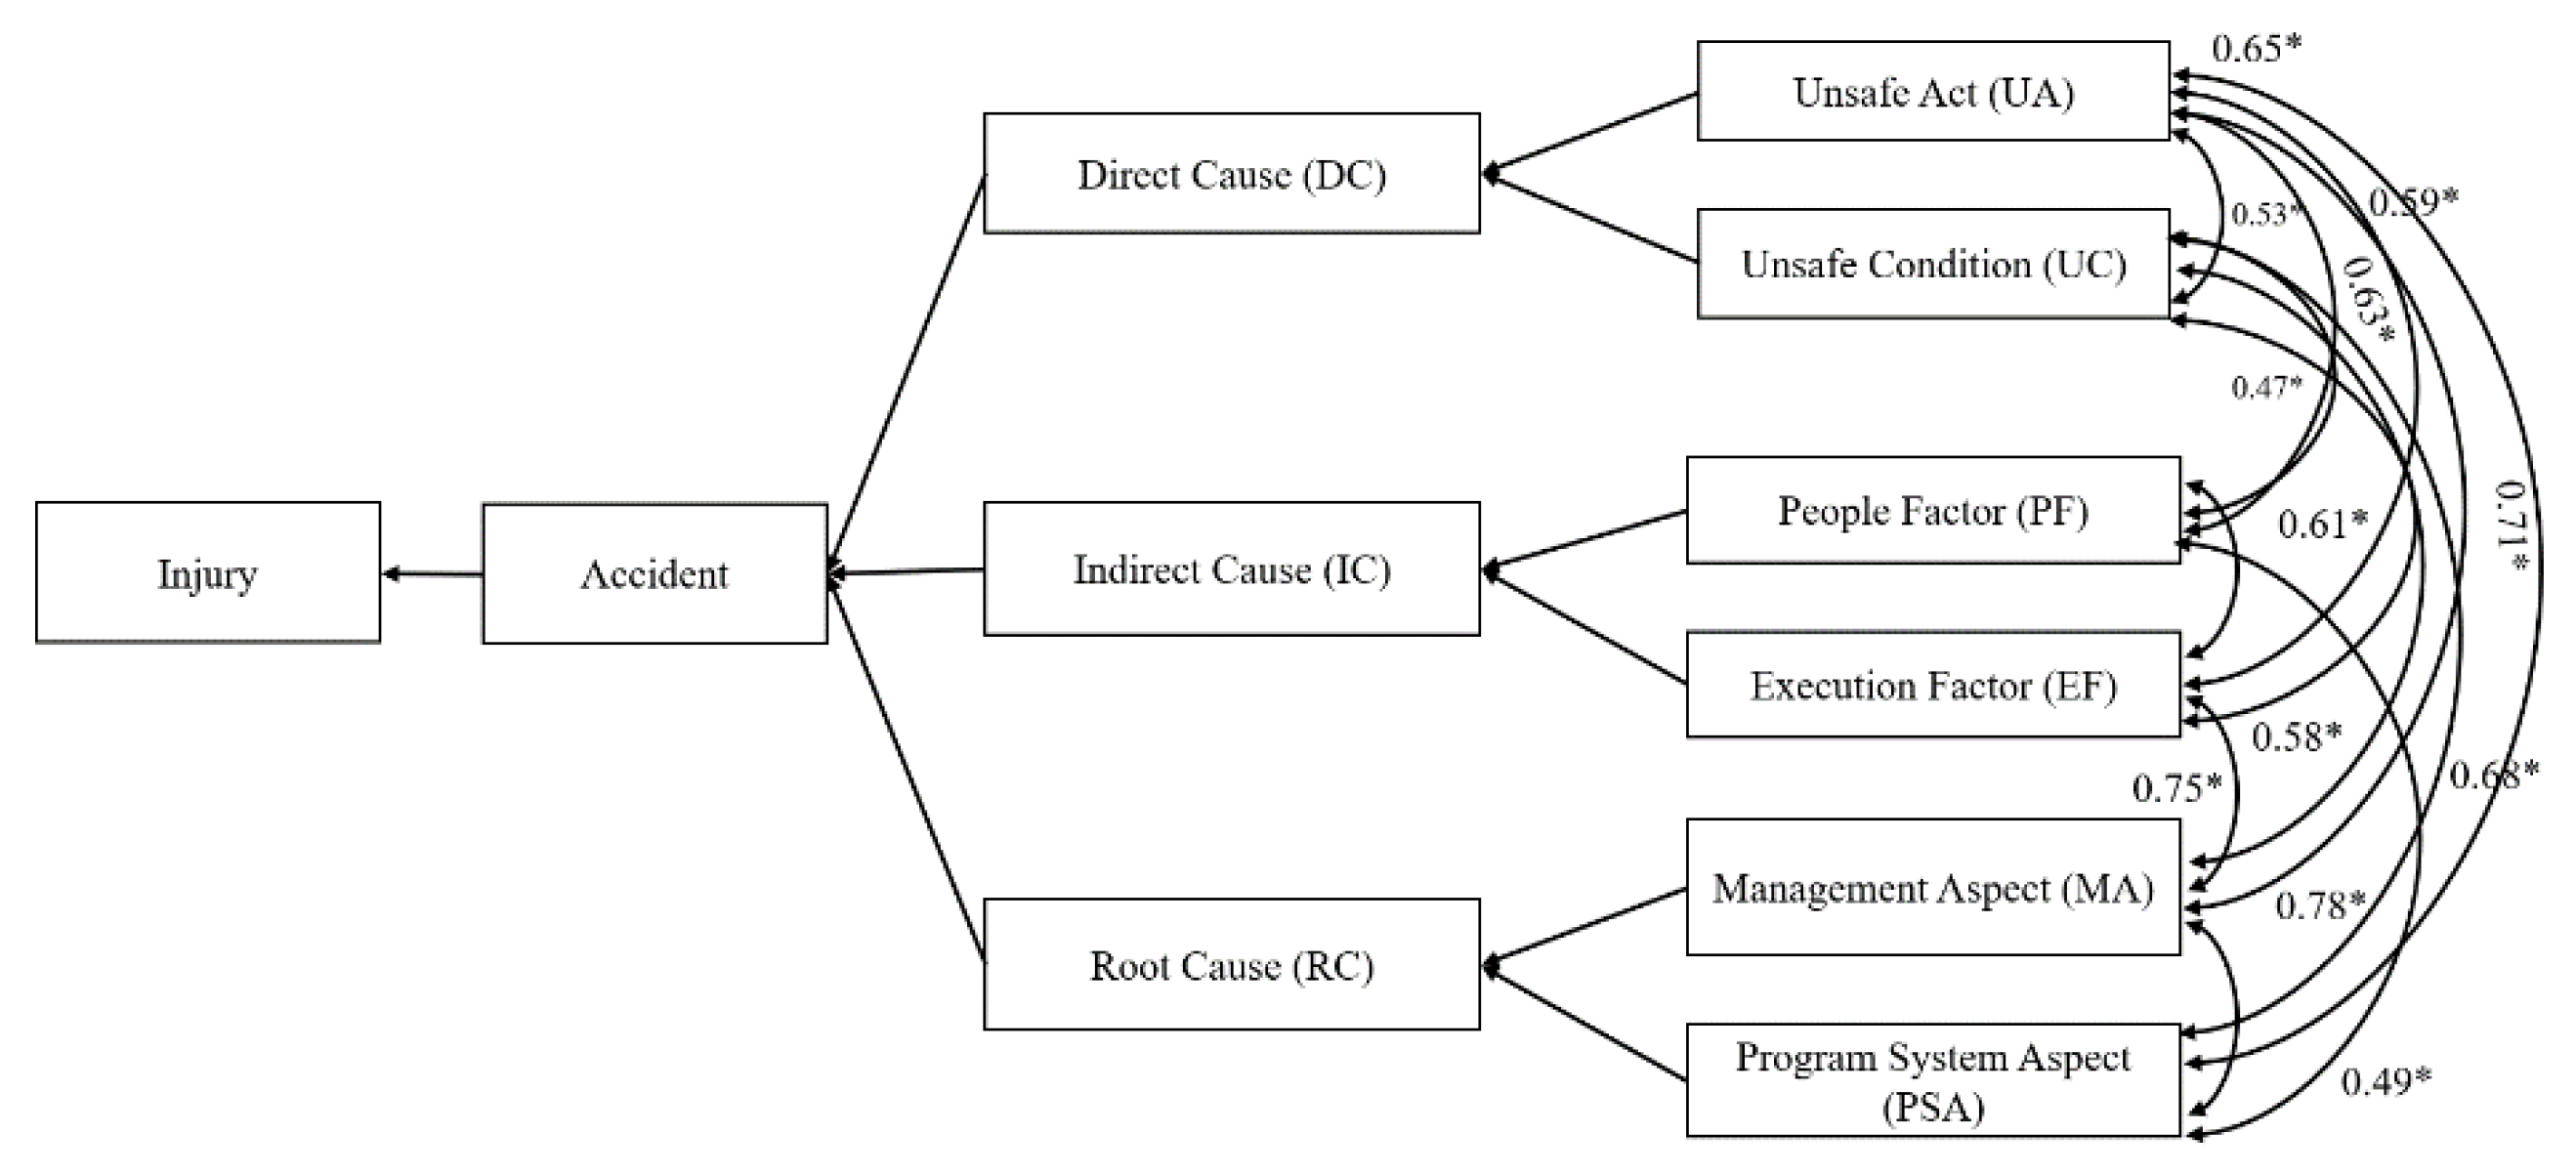
Figure 9.
Classification report of Random Forest Algorithm.
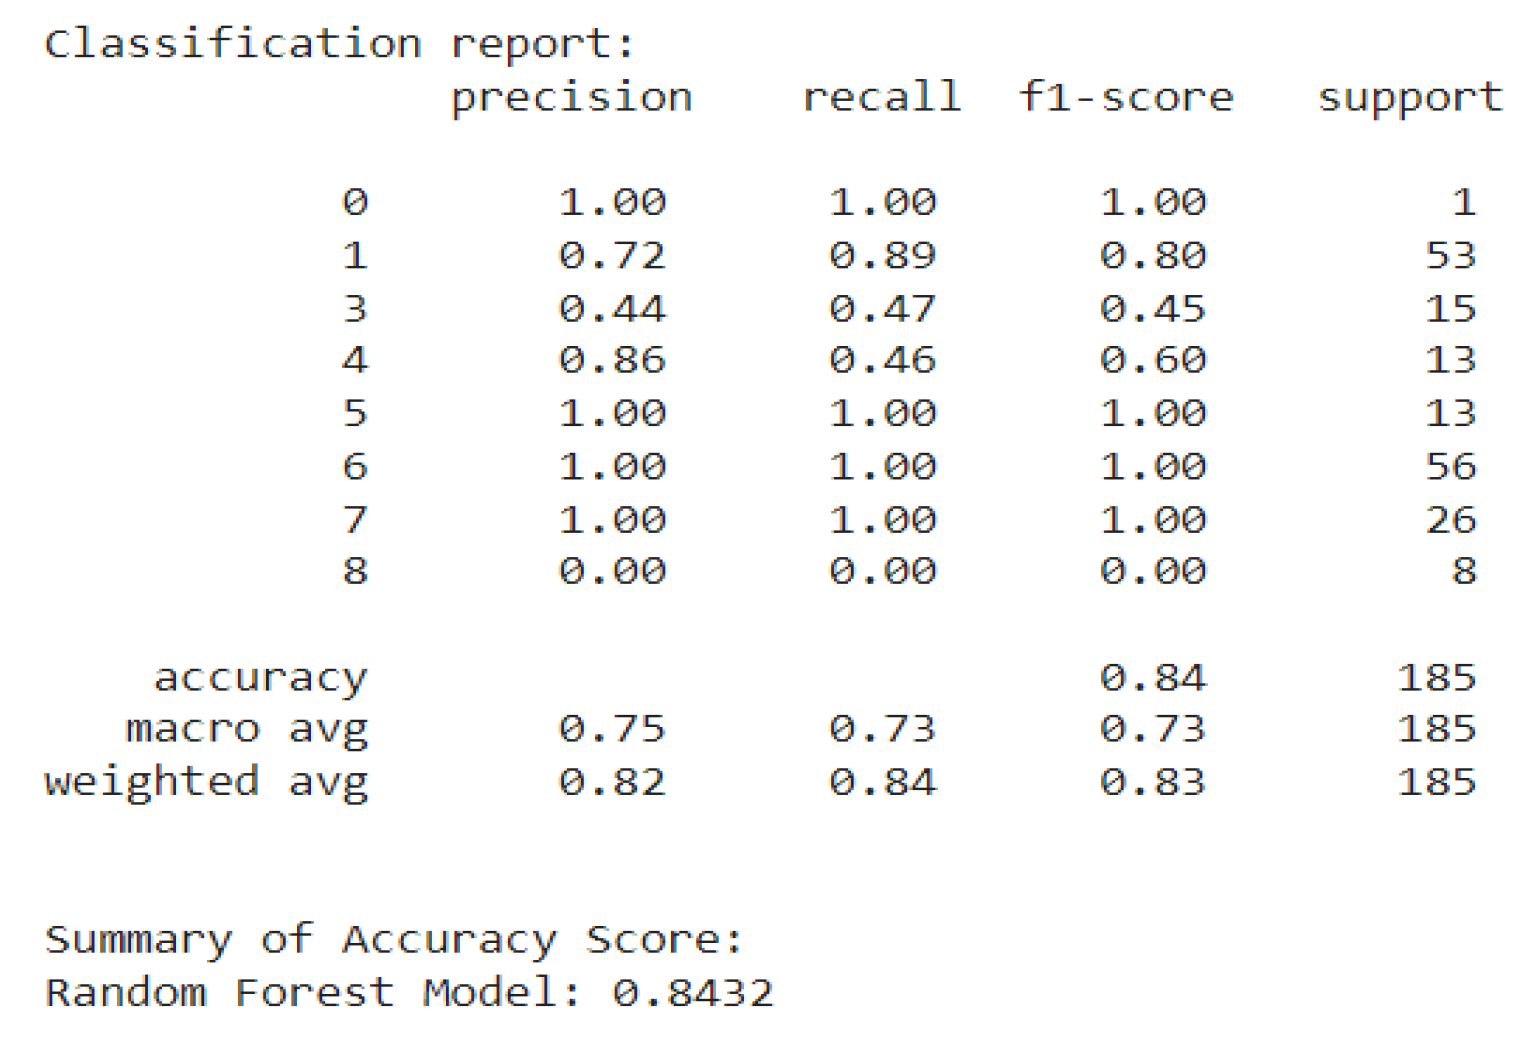
Figure 10.
Classification report of Decision Tree Algorithm.
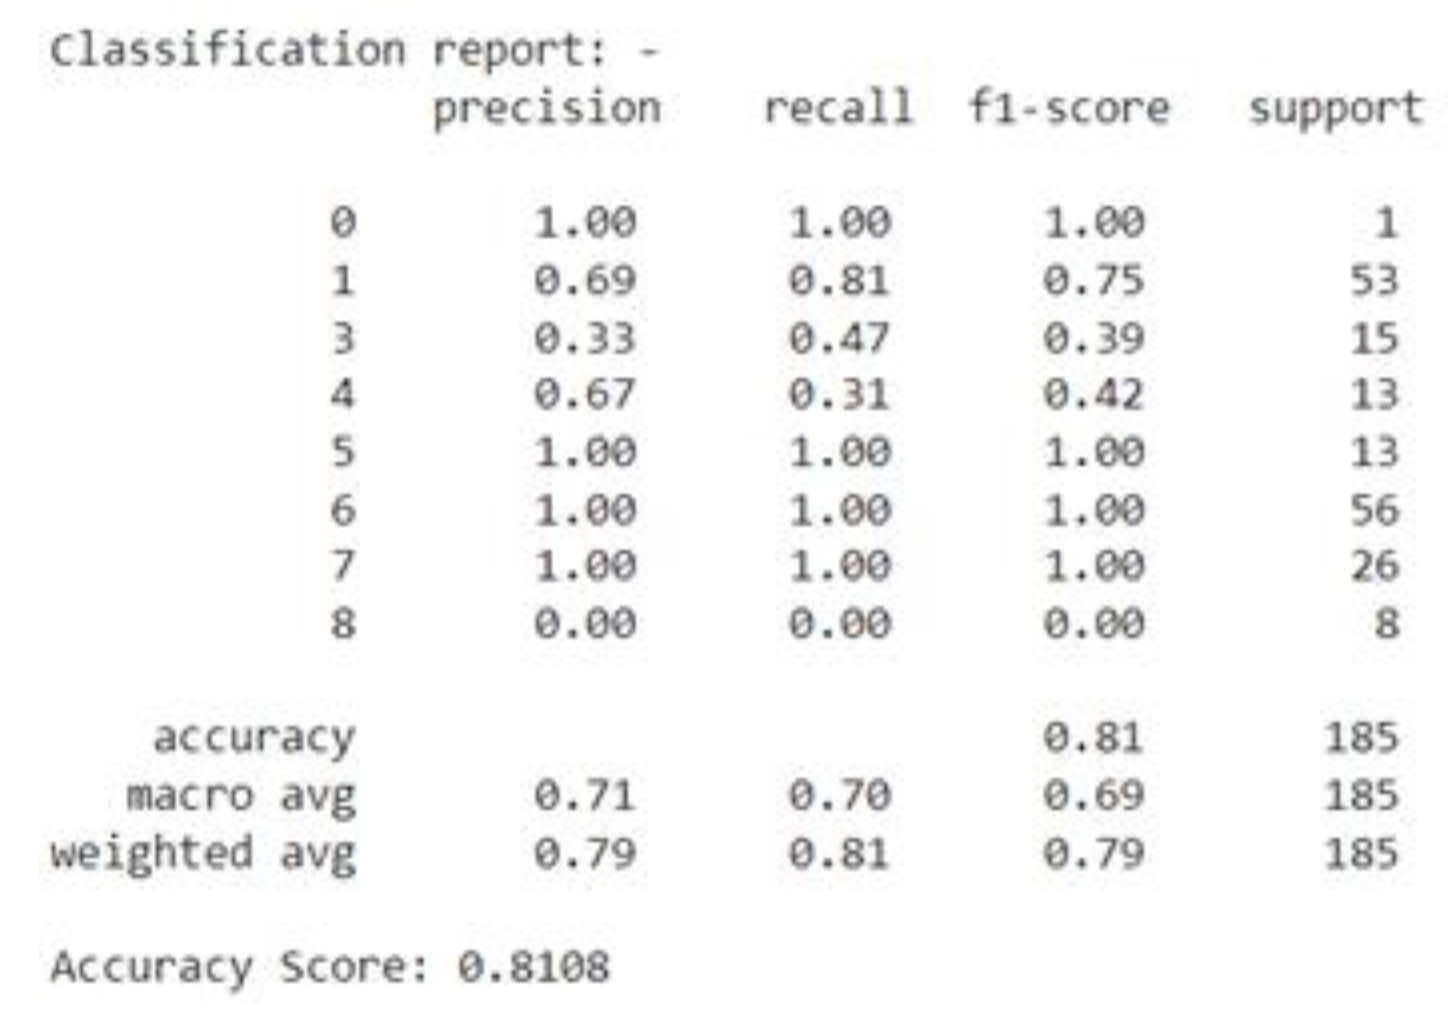
Figure 11.
Classification report of AdaBoost Algorithm.
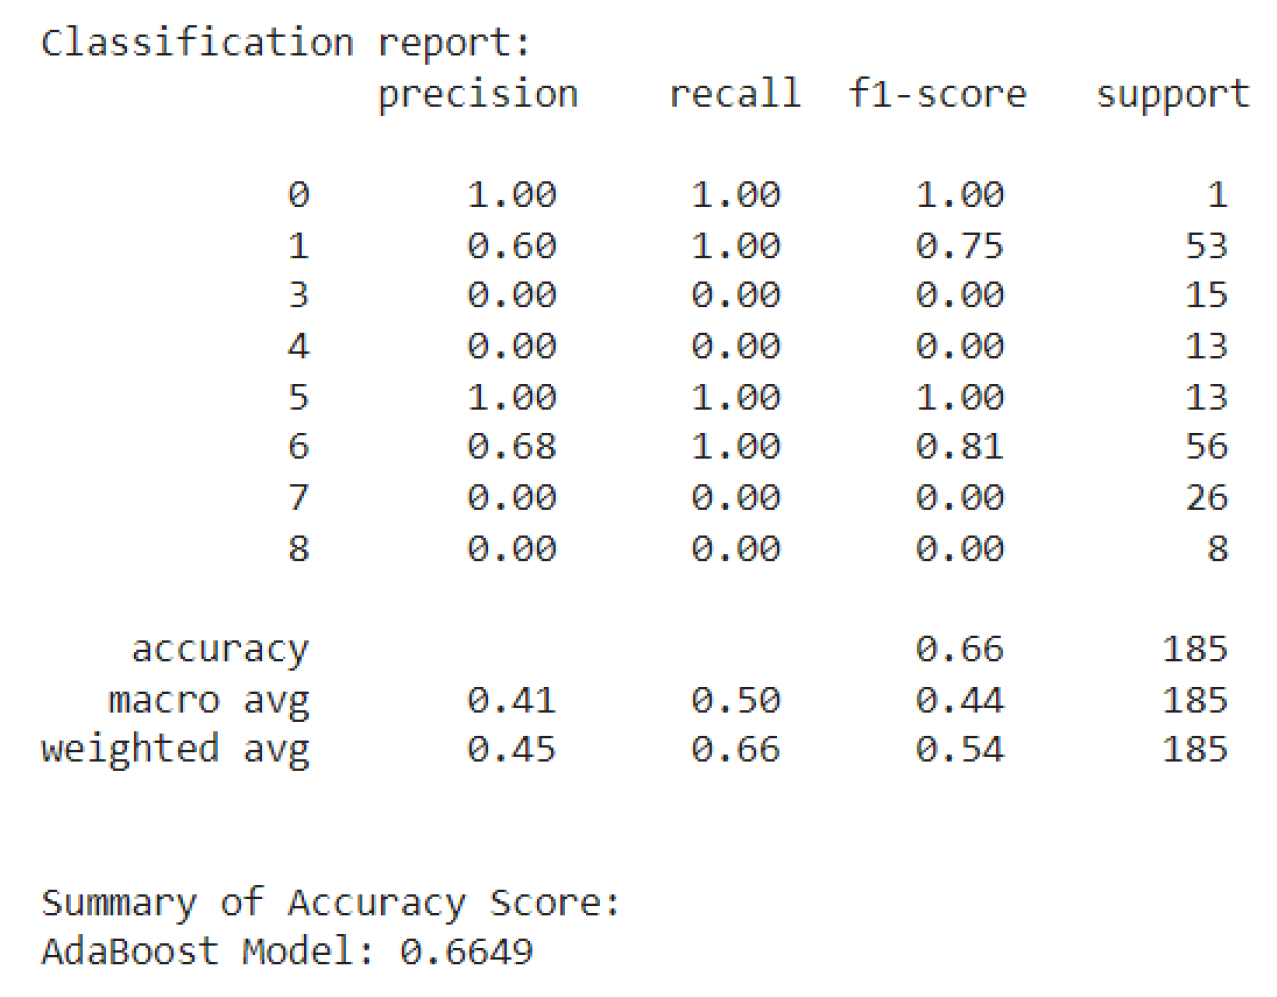

Table 1.
Inventory of Reviewed Safety-Related Studies in Predictive Approaches.
| Study | Main findings | Authors, Year | DOI |
|---|---|---|---|
| Machine Learning Predictive Model Based on National Data for Fatal Accidents of Construction Workers | Machine learning can effectively predict fatal accidents at construction sites, with month, employment size, age, weekday, and service length being the most influential factors. | Jongko Choi, Bonsung Gu, Sangyoon Chin, Jong-seok Lee (2020) | 10.1016/j.autcon.2019.102974 |
| Application of Machine Learning Techniques for Predicting the Consequences of Construction Accidents in China | Naive Bayes and Logistics regression are the best machine learning algorithms for predicting the severity of construction accidents, with accident type, reporting, and handling being the most critical factors. | Rongchen Zhu, Xiaofeng Hu, Jiaqi Hou, Xin Li (2021) | 10.1016/j.psep.2020.08.006 |
| Predictive Modeling for Occupational Safety Outcomes and Days Away from Work Analysis in Mining Operations | Machine learning techniques, such as decision trees and random forests, can improve mining safety by predicting accident outcomes and days away from work. | Anurag Yedla, Fatemeh Davoudi Kakhki, A. Jannesari (2020) | 10.3390/ijerph17197054 |
| Customized AutoML: An Automated Machine Learning System for Predicting Severity of Construction Accidents | Customized AutoML is an automated machine learning system that accurately predicts construction accident severity for professionals with limited data science knowledge, offering higher scalability, accuracy, and result-oriented insight. | V. Toğan, F. Mostofi, Y. Ayözen, Onur Behzat Tokdemir (2022) | 10.3390/buildings12111933 |
| Safety Performance Prediction and Modification Strategies for Construction Projects Via ML Techniques | The decision tree algorithm effectively predicts safety performance in construction projects, with safety employees, training, rule adherence, and management commitment being key criteria. | H. Abbasianjahromi, Mehdi Aghakarimi (2021) | 10.1108/ecam-04-2021-0303 |
| Component-Based Machine Learning for Performance Prediction in Building Design | This paper presents a component-based machine learning approach for predicting building performance, enabling high prediction quality with errors as low as 3.7% for cooling and 3.9% for heating. | P. Geyer, Sundaravelpandian Singaravel (2018) | 10.1016/J.APENERGY.2018.07.011 |
| Machine Learning Applications in Construction Safety Literature | Machine learning methods, particularly support vector machine and decision tree, are widely used in construction safety literature to predict accident outcomes and identify potential safety risks. | K. Koc, A. Gurgun (2021) | 10.14455/isec.2021.8(1).csa-05 |
| Evaluating Machine Learning Performance in Predicting Injury Severity in Agribusiness Industries | Machine learning techniques can accurately predict injury severity in agribusiness industries using workers’ compensation claims, with a 92-98% accuracy rate. | Fatemeh Davoudi Kakhki, S. Freeman, G. Mosher (2019) | 10.1016/j.autcon.2019.102974 |
Table 2.
Causal Factors Classification.
| Injury Categories | Direct Causes Categories | Indirect Cuses Categories | Root Causes Categories |
|---|---|---|---|
| - First Aid Case -Medical Treatment Case -Restricted Work Case - Lost Time Injury - Asset Damage |
Unsafe Act (UA) | People Factor (PF) | Management Aspect (MA) |
| - Individual behavior/ attitude - Tools or Equipment Use - Procedures implementation |
- Physical Capabilities - Mental Capabilities - Physiological |
- Resource Management - Leadership - Contractors & Subcontractor Mgt. |
|
| Unsafe Condition (UC) | Execution Factor (EF) | Program System Aspect (PSA) | |
| -Workplace Hazards - Process Hazards - Tools & Equipment Condition - Protective Defenses - Weather conditions |
- Engineering / Design - Project level execution - Communication - Skill & Knowledge - Tools & Equipment Provision |
- Work Standards / Procedures - Risk Evaluation - Task Planning - Training - Inspection and Audit program |
Table 3.
Data Classification of Causation Per Injury Type per Man Hours.
| Injury Type | % of Data related to UA | % of Data related to UC | % of Data related to PF | % of Data related to EF | % of Data related to MA | % of Data related to PSA |
|---|---|---|---|---|---|---|
| FAC | 35,21 | 27,35 | 12,34 | 7,32 | 9,87 | 7,91 |
| MTC | 30,56 | 28,45 | 14,67 | 11,23 | 8,74 | 6,35 |
| RWC | 22,45 | 29,87 | 13,42 | 17,48 | 9,81 | 6,97 |
| LTI | 16,78 | 25,12 | 15,43 | 21,87 | 14,26 | 6,54 |
| AD | 10,34 | 21,13 | 13,21 | 23,14 | 19,87 | 12,31 |
Table 4.
Correlation Matrix of The Studied Parameters for the Studied Group.
| Injury Type | 1 | 2 | 3 | 4 | 5 | 6 | SD | Mean |
|---|---|---|---|---|---|---|---|---|
| UA | ------ | 0.65* | 0.71* | 0.47* | 0.53* | 0.49* | 0.13 | 0.56 |
| UC | 0.65* | ------ | 0.78* | 0.60* | 0.58* | 0.61* | 0.15 | 0.70 |
| PF | 0.71* | 0.78* | ------ | 0.63* | 0.59* | 0.62* | 0.13 | 0.72 |
| EF | 0.47* | 0.60* | 0.63* | ----- | 0.71* | 0.68* | 0.14 | 0.68 |
| MA | 0.53* | 0.58* | 0.59* | 0.71* | ---- | 0.75* | 0.14 | 0.69 |
| PSA | 0.49* | 0.61* | 0.62* | 0.68* | 0.75* | ---- | 0.14 | 0.69 |
(1) Unsafe Act, (2) Unsafe Condition, (3) People Factor, (4) Execution Factor, (5) Management Aspect, (6) Program System Aspect. *p < 0.01. SD, standard deviation.
Table 5.
Correlation Matrix of The Causations & Accident Occurrence.
| 0 | 1 | 2 | 3 | 4 | 5 | 6 | SD | Mean | |
|---|---|---|---|---|---|---|---|---|---|
| AO | ------ | 0.75* | 0.70* | 0.77* | 0.65* | 0.68* | 0.74* | 0.12 | 0.72 |
| UA | 0.75* | ----- | 0.65* | 0.71* | 0.47* | 0.53* | 0.49* | 0.13 | 0.56 |
| UC | 0.70* | 0.65* | ------ | 0.78* | 0.60* | 0.58* | 0.61* | 0.15 | 0.70 |
| PF | 0.77* | 0.71* | 0.78* | ------ | 0.63* | 0.59* | 0.62* | 0.13 | 0.72 |
| EF | 0.65* | 0.47* | 0.60* | 0.63* | ----- | 0.71* | 0.68* | 0.14 | 0.68 |
| MA | 0.68* | 0.53* | 0.58* | 0.59* | 0.71* | ----- | 0.75* | 0.14 | 0.69 |
| PSA | 0.74* | 0.49* | 0.61* | 0.62* | 0.68* | 0.75* | ---- | 0.14 | 0.69 |
(0) Accident Occurrence, (1) Unsafe Act, (2) Unsafe Condition, (3) People Factor, (4) Execution Factor, (5) Management Aspect, (6) Program System Aspect. *p < 0.01. SD, standard deviation.
Disclaimer/Publisher’s Note: The statements, opinions and data contained in all publications are solely those of the individual author(s) and contributor(s) and not of MDPI and/or the editor(s). MDPI and/or the editor(s) disclaim responsibility for any injury to people or property resulting from any ideas, methods, instructions or products referred to in the content. |
© 2024 by the authors. Licensee MDPI, Basel, Switzerland. This article is an open access article distributed under the terms and conditions of the Creative Commons Attribution (CC BY) license (http://creativecommons.org/licenses/by/4.0/).
Copyright: This open access article is published under a Creative Commons CC BY 4.0 license, which permit the free download, distribution, and reuse, provided that the author and preprint are cited in any reuse.


