
Submitted:
11 March 2025
Posted:
12 March 2025
You are already at the latest version
Abstract
The automotive industry constantly seeks intelligent technologies to increase competitiveness, reduce costs, and minimize waste, in line with the advancements of Industry 4.0. This study aims to apply a predictive model based on machine learning within the automotive industry, validating its capability to reduce the impact of unplanned downtime. The implementation process involved identifying the central problem and its root causes using quality tools, prioritizing equipment through the Analytic Hierarchy Process (AHP), and selecting critical failure modes based on the Risk Priority Number (RPN) derived from the Process Failure Mode and Effects Analysis (PFMEA). Predictive algorithms were implemented to select the best-performing model based on error metrics. Data were collected, transformed, and cleaned for model preparation and training. Among the five machine learning models trained, Random Forest demonstrated the highest accuracy. This model was subsequently validated with real data, achieving an average accuracy of 80% in predicting failure cycles. The results indicate that the predictive model can effectively contribute to reducing the financial impact caused by unplanned downtime, enabling the anticipation of preventive actions based on the model's predictions. This study highlights the importance of multidisciplinary approaches in Production Engineering, emphasizing the integration of machine learning techniques as a promising approach for efficient maintenance and production management in the automotive industry, reinforcing the feasibility and effectiveness of predictive models in contributing to sustainability.
Keywords:
machine learning
; predictive maintenance
; automotive industry
; sustainability
; unplanned downtime
; industry 4.0
1. Introduction
The automotive industry is constantly seeking advanced technologies to enhance its competitiveness, reduce costs, and minimize waste, all aligned with Industry 4.0 advancements. In this context, Machine Learning emerges as a powerful tool capable of transforming various aspects of industrial operations, including predictive maintenance [1,2].
Predictive maintenance, utilizing machine learning models, offers the possibility to early identify potential failures, enabling the implementation of preventive actions before unplanned downtime occurs. This results not only in greater equipment reliability and efficiency but also in significant operational cost savings and reduced environmental impact, promoting sustainability in industrial operations [3,4,5].
This study aims to apply a predictive model based on machine learning in the context of the automotive industry, validating its ability to reduce the impact of unplanned downtime. The model implementation process involves identifying the core problem and its root causes using quality tools, prioritizing equipment through Analytic Hierarchy Process (AHP), and selecting the critical failure mode based on Risk Priority Number (RPN) derived from Failure Modes and Effects Analysis (FMEA). Subsequently, predictive algorithms are implemented to select the best-performing model based on error metrics.
The collected data underwent transformations and cleaning for model preparation and feeding. Five machine learning models were trained, with Random Forest standing out in terms of accuracy. This model was validated with real data, achieving an average accuracy of 80% in predicting failure cycles.
The results indicate that the application of the predictive model can effectively contribute to reducing the financial impact of unplanned downtime by allowing proactive actions based on model predictions. This study highlights the importance of a multidisciplinary approach in engineering, integrating machine learning techniques as a promising approach for efficient maintenance and production management in the automotive industry, reinforcing the viability and effectiveness of predictive models in promoting sustainability [6,7].
In this context, this article aims to explore the following question: "Is it possible to use supervised machine learning models that enable planning and scheduling through predictive maintenance predictions with reduced errors in assets involved in productive processes of an automotive company, in order to avoid unplanned interruptions in production?"
2. Theoretical Reference
2.1. Content Analysis
To deepen understanding of the application of predictive models based on machine learning in predictive maintenance and its relationship with sustainability practices in the automotive industry, a content analysis was conducted using the Scopus database. The research was structured to identify relevant articles published in the last five years, ensuring the timeliness and relevance of the information.
The search was conducted in the Scopus database using the following filters and keywords: Period: 2018-2023; Knowledge Area: Engineering, Computer Science, Environmental Science, Management and Business; Document Type: Journal Articles; Language: English; Keywords: "Predictive Maintenance", "Machine Learning", and "Automotive Industry".
The initial search using these keywords resulted in 38 articles. Applying the filters reduced the number of articles as follows: Period (2018-2025): Reduced to 32 articles; Knowledge Area (Engineering, Computer Science, Environmental Science, Management and Business): Reduced to 31 articles; Document Type (Journal Articles): Further reduced to 15 articles; Language (English): No reduction in articles.
Content analysis of the 15 selected articles reveals strong relevance to the central theme of the research (Apendix 1), with emphasis on sustainability aspects. In one study, authors discuss advances in predictive maintenance modeling using machine learning in the oil and gas sector, highlighting how this approach improves operational efficiency and reduces resource waste, significantly contributing to environmental sustainability [7]. Another article focuses on remote vehicle health monitoring and prognosis through machine learning, where maintenance improvements can lead to emissions reduction and material waste, promoting more sustainable practices in the automotive industry [8].
In the manufacturing sector, the application of a logistic regression classifier for predictive maintenance is addressed, emphasizing how improvements in equipment lifespan and reduction of unexpected failures save resources and energy, aligning with sustainability principles [9]. Additionally, a comprehensive testing strategy for AI-based systems in the automotive industry is proposed, where effective testing ensures system functionality, optimizing resource use and minimizing waste [10].
Unsupervised anomaly detection in car sensor data using machine learning is discussed, emphasizing that improved fault detection allows for preventive repairs, reducing material waste and extending vehicle lifespan [11]. Another research explores machine learning strategies for industrial deployment in predictive maintenance, where optimized maintenance of industrial machinery reduces unplanned downtime and resource consumption, contributing to more sustainable operations [12].
In the context of automotive systems, anomaly detection for early fault identification is presented, highlighting that early fault identification contributes to efficient maintenance and waste reduction, enhancing process sustainability [9] [13]. A machine learning-based model to enhance automated maintenance in the IIOT context is discussed, where process efficiency of automated processes is increased, resulting in energy and resource savings [14].
Furthermore, predictive analytics to improve availability in manufacturing systems is explored, where enhanced system availability reduces energy consumption and material waste, promoting sustainable practices [15]. Predictive maintenance of lead-acid batteries using machine learning is addressed, highlighting how extending battery life reduces the need for frequent replacements and disposal of toxic waste, contributing to environmental sustainability [16].
A decision-making tool based on exploratory visualization for predictive maintenance is presented, facilitating efficient decision-making that optimizes resource utilization, promoting sustainable practices [17]. Finally, a systematic literature review on predictive maintenance in the automotive industry compiles best practices and innovations that enhance efficiency and sustainability in the sector [18].
In conclusion, all articles are relevant to the research and provide valuable insights into the application of predictive maintenance and machine learning, with positive impacts on sustainable practices. The implementation of predictive maintenance strategies is a recurring theme, highlighting the importance of resource efficiency and waste reduction across various industrial sectors. This analysis underscores the innovative and relevant aspect of this article as a scientific contribution.
2.2. Applications of Machine Learning in Industry
No industrial setting, developing monitoring techniques and decision-making processes on the production line is crucial for understanding production and avoiding bottlenecks [19]. Machine Learning (ML) is a technology that incorporates concepts from artificial intelligence, statistics, and computer science. Its primary goal is to construct and refine algorithms that learn from databases, aiming to create generalized models capable of making accurate predictions and/or identifying patterns in unfamiliar data [20,21].
While artificial intelligence (AI) encompasses the science enabling machines to perform human tasks, machine learning specializes in training machines to learn from data. This technique can be applied in various ways; in this article, the Python system was used to process data and implement ML [22].
There are different approaches to machine learning: (i) Supervised learning: where data is labeled and algorithms associate inputs with known outputs; (ii) Unsupervised learning: where data is unlabeled and underlying structures are explored without known responses; (iii) Semi-supervised learning: a combination of labeled and unlabeled data for model training; (iv) Reinforcement learning: where the system learns by interacting with the environment [22,23]. These approaches have different objectives and applications. For instance, ML algorithms can predict equipment failures by anticipating their failure modes. Machine learning has excelled in predictive maintenance, bringing significant advancements to industrial maintenance management. According to [24], ML models are designed to identify complex patterns in data and use these patterns to make predictions or decisions. This enables the implementation of predictive strategies that anticipate failures and prevent unplanned downtime, optimizing production processes.
[25] highlight that ML algorithms are widely used in pattern recognition, natural language processing, computer vision, and data analysis. In the industrial context, these algorithms are applied for fault detection, demand forecasting, logistics optimization, and predictive maintenance. Models such as Linear Regression, Decision Trees, Neural Networks, and Random Forests are common for predicting failures and optimizing equipment maintenance.
Moreover, the use of ML in predictive maintenance offers advantages such as the ability to handle large volumes of real-time data and the flexibility to adapt to different types of equipment and operational conditions. These models can be continuously improved as more data is collected, resulting in increasingly accurate predictions. The application of deep learning techniques allows for the identification of even more complex patterns, continuously enhancing predictive maintenance processes [26].
To bridge these two areas, it is important to recognize how machine learning, with its capability to analyze large volumes of data and identify complex patterns, seamlessly integrates with predictive maintenance. The synergy between these technologies allows not only for predicting failures but also for better understanding the root causes of these failures, offering a more robust and informed approach to industrial maintenance management.
2.3. Predictive Maintenance
A Predictive Maintenance (PdM) aims to provide significant benefits to industrial operations, playing a crucial role. According to [27], one of the main requirements for effective implementation of PdM is the availability of a sufficient amount of data from all parts of the manufacturing process. The outcomes include cost reduction, increased operational efficiency, extended equipment lifespan, and efficient resource utilization [28].
According to [29], there are four categories of maintenance: corrective, preventive, predictive, and prescriptive. In corrective maintenance, intervention occurs when a failure is detected or there are signs of it. Preventive maintenance uses schedules at specific times. On the other hand, PdM uses time-based information and knowledge to anticipate a possible failure, thus avoiding downtime. An example of applying predictive maintenance using explainable machine learning models, along with data collected solely from the operational state of industrial equipment to predict future maintenance, can be seen in [30].
Studies conducted demonstrate the effectiveness of various machine learning implementations in conducting predictive maintenance. However, most research utilizes methods known as "black boxes," which focus on predictive performance without providing insights into root cause analysis and explainability. Despite the increased predictive power compared to simpler and more interpretable approaches, the logic behind the predictions of these methods is difficult, if not impossible, to fully explain. In this context, the ability to develop a highly accurate predictive model is achieved at the cost of being unable to fully elucidate the primary causes of imminent failures [31].
3. Methodological Procedures
For the implementation of an effective methodology enabling the application of a predictive model in the automotive industry, it is necessary to follow a systematic and well-structured approach. This study followed a sequence of steps that included problem identification, data collection and transformation, machine learning model training, and validation of results. The main methodological steps adopted are described below.
3.1. Problem Identification
For the implementation of an effective methodology, it is crucial to identify and clearly understand the existing problem within the studied process. This step allows for a thorough analysis of the underlying causes of the problem, aiming to map them accurately. Subsequently, it becomes crucial to propose appropriate and effective solutions for the identified causes, aiming at their elimination or mitigation.
To identify the problem, an approach will be adopted that starts with a detailed mapping of the process under study, through the development of a process flowchart. This visual representation will enable a clearer and more comprehensive understanding of the involved steps, interactions among different components, and potential failure points. Once the process is mapped, a series of brainstorming sessions will be conducted to analytically develop an Ishikawa diagram and propose solutions based on the results obtained through a cause-and-effect matrix comparison.
With the problem, its causes, and solutions defined, the next step will be to define the steps to be followed for the application of predictive models, if validated as an efficient solution for the identified problems and causes.
Therefore, to structure the methodology for applying predictive models, this topic will be divided into 6 groups: (1) selection of the target equipment through a multi-criteria decision-making method, (2) selection of failure mode based on the Risk Priority Number (RPN) from the Process Failure Mode and Effects Analysis (PFMEA), (3) ETL (Extract - Transform - Load) of data, (4) Training of Machine Learning (ML) models, (5) evaluation and selection of the model, and (6) application.
3.2. Equipment Selection
To start, it is necessary to choose the equipment to be analyzed before proceeding with the subsequent steps. Therefore, there is a need to use methods that prioritize one among the numerous available assets. This approach is crucial because the quantity of assets, the number of decision variables, and the volume of data involved would make this process complex. Moreover, using a prioritization method eliminates the subjectivity of choice.
For this context, a multi-criteria decision-making method will be used, with common methods including PROMETHEE (Preference Ranking Organization Method for Enrichment), ELECTRE (Elimination Et Choix Traduisant Realité), and AHP (Analytic Hierarchy Process). In this study, AHP method was chosen primarily due to its flexibility in addressing a wide range of decision-making problems, regardless of the types of criteria used or the number of alternatives. The AHP method will be implemented using Excel software, chosen for its ability to handle large matrices of data and its user-friendly interface with clear syntax.
After defining the decision method, it is necessary to define the criteria to be used in the AHP implementation. Given the context of where the data were collected, the type of operation the studied equipment performs, and the objectives of this study, criteria related to equipment reliability and maintenance were selected. These criteria include MTTR (Mean Time To Repair), MTBF (Mean Time Between Failures), availability, and number of downtimes. With the criteria defined, the next step is their prioritization through pairwise comparisons.
To conduct quantitative and objective comparisons and prioritization of criteria, a scale is necessary. Saaty's scale [32] was chosen due to its widespread use. It proposes a numerical evaluation ranging from 1 to 9, aiming to determine the relative importance of one criterion compared to another.
Once the importance of each criterion is defined, it becomes possible to proceed with the implementation of the remaining steps of the AHP method using Excel to obtain the prioritization order of the equipment on which the study will be conducted.
3.3. Failure Mode Selection
After selecting the equipment for study, the next step is to define the failure mode for which predictive analysis will be conducted. To accomplish this, the Process Failure Mode and Effects Analysis (PFMEA) will be used to prioritize a failure mode from the available options. This prioritization will be based on the Risk Priority Number (RPN) analysis, where the potential failure with the highest RPN will be prioritized due to its higher severity, occurrence, and detection relationship compared to others. Therefore, critical failures can be addressed analytically, optimizing resource efficiency and making data-driven decisions.
3.4. ETL (Extract, Transform, Load)
The ETL (Extraction, Transformation, Loading) process applied to Machine Learning plays a crucial role in preparing and preprocessing data before using them in machine learning models. The primary goal of the ETL process in this context is to provide high-quality, consistent, and suitable data for training and evaluating models, ensuring the effectiveness and reliability of the results obtained.
The Extraction step involves obtaining raw data from the chosen equipment through a database from a Manufacturing Execution System (MES) or an Excel file (.xlsx). Next, the Transformation step cleans, reformats, and enriches the data. This may include removing missing or inconsistent data. Finally, the Loading step prepares the transformed data into a suitable format for use in machine learning algorithms. This can include dividing the data into training, validation, and testing sets, balancing classes, normalizing values, and final feature encoding.
These steps will be executed using Power Query software in conjunction with Python and the Pandas library, as they meet all requirements for executing this process effectively.
3.5. Training of Machine Learning Models
The training and implementation of the Machine Learning models will be carried out using Python, with the libraries Seaborn, Pandas, Numpy, Matplotlib, and Scikit-learn. Initially, Pandas will be used to import the data to feed the models, perform descriptive statistical analysis, and clean and process the data. Next, the dependent and independent variables of the model will be defined. Subsequently, the data will be divided into training and testing sets. This division is essential to assess the generalization ability of the models used and will be done using the `train_test_split` function from the Scikit-learn library. With the data separated, the next step will be training the selected models. For this study, five regression models were selected to compare their results: Gradient Boosting Regressor, K Neighbors Regressor, Support Vector Regressor, Decision Tree Regressor, and Linear Regression.
3.6. Model Evaluation and Selection
The evaluation and selection of the model are crucial steps in a modeling process. In this context, various evaluation metrics can be applied to measure the performance of the models and identify the one that best meets the established objectives. Starting with the Mean Absolute Error (MAE), this metric will be used to calculate the average of the absolute differences between the predicted and actual values. By applying MAE to the models in question, we can obtain a direct measure of the average size of the prediction errors, regardless of the direction of the errors. This allows us to evaluate the models' ability to make accurate predictions.
Next, the Mean Absolute Percentage Error (MAPE) will be used as an additional metric to evaluate the models' performance. MAPE calculates the average percentage difference between the predicted and actual values. By applying MAPE, we can obtain a measure of the average magnitude of the percentage errors in the predictions. This metric is particularly useful in forecasting scenarios, as it provides an understanding of the relative error in relation to the actual values.
Another metric is the Mean Squared Error (MSE). MSE calculates the average of the squares of the differences between the predicted and actual values. By using MSE, we consider both the magnitude and the direction of the errors, giving more weight to larger errors. This metric helps evaluate the models' performance by taking into account the dispersion of the errors.
Finally, the Root Mean Squared Error (RMSE) will be used, which is the square root of the MSE. RMSE provides a measure of the average magnitude of the prediction errors, in the same unit as the target variable. This metric facilitates the interpretation of the results and the comparison between different models or benchmarks.
3.7. Application of the Chosen Model
In the application stage, the developed methodology is practically implemented using the previously trained Machine Learning models. At this stage, predictions or decisions are made based on the models, and the results obtained are carefully evaluated and discussed, considering their relevance to the established objectives.
During the application phase, it is common to encounter challenges and obstacles that require critical analysis. These challenges may involve the availability of quality data, the proper adjustment of models in new contexts, or even integration with other systems or processes. It is essential to proactively address these challenges, seeking solutions and suggesting possible improvements for future applications.
As the methodology is applied, it is important to closely monitor the results and conduct an in-depth analysis to identify any discrepancies between the predictions and the actual outcomes. This allows for a more comprehensive understanding of the models' performance in different scenarios and helps to identify opportunities for optimization.
Furthermore, interaction with stakeholders is crucial at this stage. It is essential to maintain constant dialogue with the stakeholders, sharing the results and seeking feedback to continuously improve the application of the models. Collaboration between data specialists, end users, and other stakeholders is fundamental to ensuring that Machine Learning solutions meet the needs and expectations of all parties involved.
4. Results
This section will present the results of the implementation of the proposed models, allowing for an empirical analysis of the key concepts discussed. The evaluation of the results will validate the implemented models and verify their effectiveness in achieving the established objectives. Additionally, this section will delve into the methods used.
The fundamental step preceding all others in this study is the process mapping of the analysis to clearly understand the problem and its possible causes. Following this, it is necessary to conduct a brainstorming session with stakeholders to identify potential solutions for the identified causes. Once this is done, the solution that best addresses the identified causes, either completely or partially, is chosen.
4.1. Process Mapping
For process mapping, a process flowchart tool was used to structure the flow of events, decisions, and cycles from start to finish. The studied process begins with the decision of whether or not the tooling is included in the production schedule. If it is, the tooling goes through a review process. Once the review is completed, the tooling remains on standby until the production date arrives. On the production date, the tooling is transported to the external setup of the machine and then enters production.
The identified problem occurs during this event, as it was reported by process specialists during a brainstorming session that during mass production, the tooling experiences various failures, leading to numerous unplanned stops. These unplanned stops cause significant financial and operational impacts. The identified problem was a loss of productivity due to these unplanned stops.
4.2. Root Cause Analysis
Mapping the process flow and identifying the problem, defined as the loss of productivity due to unplanned stops, necessitated a cause analysis. For this purpose, the Ishikawa diagram [33] was used. This was developed in collaboration with process specialists, and the results are presented below.
The mapped causes after applying the tool were:
- Labor: Inadequate skills; Insufficient training.
- Method: Lack of standardization; Incorrect maintenance.
- Machine: Premature failures; Excessive stamping cycles.
- Environment: Contamination.
- Material: Out-of-specification material; Lack of material quality.
- Measurement: Lack of monitoring of critical parameters.;
4.3. Definition and Selection of Solutions
To define and select solutions related to the identified causes, a comparison matrix was constructed between the causes obtained from the Ishikawa diagram and the solutions proposed by the specialists.
After analyzing the results of the matrix, it was observed that predictive maintenance is the solution that addresses the highest number of causes. Additionally, it aligns with the company's current state, which already has a well-structured preventive maintenance system and aims to implement predictive models based on Machine Learning as the next step in the studied process. With this in mind, the development of the work continued, following the proposed steps to achieve the established objectives.
4.4. Tool Selection
For selecting the tooling, the Analytic Hierarchy Process (AHP) method was chosen as the appropriate approach due to its ability to handle multiple criteria and their interrelationships in a structured manner. As highlighted by [34], AHP provides an analytical framework that allows decision-makers to compare and weigh different criteria according to their relative importance.
One of the main advantages of using the AHP method is its ability to incorporate the subjective preferences of the specialists involved in the decision-making process [29]. By allowing experts to express their opinions and weigh the importance of criteria, AHP helps reduce the inherent subjectivity in decision-making. Another advantage of AHP is its ability to handle both qualitative and quantitative criteria in an integrated manner [34]. This means that the method allows the combination of subjective information, such as preferences and opinions, with objective data, such as metrics and indicators, to evaluate and compare alternatives.
Therefore, using the AHP method for selecting the tooling in this work provides a systematic and transparent approach to decision-making, considering multiple criteria and incorporating the preferences of the specialists involved. This methodology helps ensure a well-founded and consistent choice, contributing to the quality and reliability of the results obtained.
4.4.1. Application of the AHP Method
[34] proposed a structured process for applying the Analytic Hierarchy Process (AHP), which will be detailed in the following sections.
Definition of the Objective
The objective of applying the method is to prioritize and choose only one asset from the 34 available for study and analysis.
Construction of the Hierarchy
According to [34], the construction of the hierarchy in the Analytic Hierarchy Process (AHP) involves organizing criteria and alternatives into different levels, representing their hierarchical structure. Criteria are grouped at higher levels, while alternatives are placed at the lower level. This hierarchical structure enables a more systematic analysis and facilitates understanding of the dependencies and influences among the elements in the hierarchy.
The criteria were chosen based on the objectives established by this study, the industrial context in which the assets are situated, and the availability of data types. The defined criteria are: (i) Quantity of downtimes; (ii) MTBF (Mean Time Between Failures); (iii) MTTR (Mean Time to Repair); and (iv) Availability.
The criterion "Quantity of downtimes" relates to the volume of existing data on the asset's failure history. The greater the number of failure occurrences stored in the database, the more data available for feeding the decision model and, consequently, the machine learning models.
MTBF, MTTR, and Availability were chosen as they are key performance indicators within the maintenance sector of an industry, responsible for measuring the reliability and efficiency of assets. According to [36], these indicators are widely used to assess the reliability of systems and components, directly influencing asset availability and performance. Measurement and monitoring of these indicators play a crucial role in maintenance management and strategic decision-making regarding the reliability and efficiency of industrial assets.
Establishment of Pairwise Comparisons
The establishment of paired comparisons is a fundamental step in the AHP method proposed by [34]. In this step, systematic comparisons are made between criteria and alternatives regarding their relative importance. These comparisons are conducted using a preference scale ranging from 1 to 9, as shown in Table 1.
[34] emphasizes the importance of paired comparisons as a means to gather valuable insights into decision-makers' preferences and priorities. Through paired comparisons, a consistent hierarchical structure can be established, where criteria are compared against each other and alternatives are compared against each criterion. It is through these comparisons that the necessary data for constructing the preference matrix are obtained, which will be used in subsequent steps of the AHP method.
The comparison of criteria was carried out by a technical expert familiar with the process, and the values were recorded in an Excel spreadsheet. The result of the criteria evaluation is shown in Table 1.
Based on the analysis of the table, it is observed that the MTBF criterion has a higher relative preference compared to MTTR and Availability, with a value of 3. This indicates that MTBF is considered moderately more preferable than these criteria. Similarly, the MTTR criterion is slightly more important than Availability, with a value of 3.
Regarding the Quantity of Stops criterion, the assigned values are 9 and 7, reflecting its relationship with the other criteria. Quantity of Stops is considered significantly more preferable than MTTR and Availability, with a value of 9, indicating a strong preference. Likewise, Quantity of Stops is considered significantly more important than MTBF, with a value of 7, indicating a strong preference. These comparisons provide a basis for the analysis of the relative importance of the criteria and will be used in calculating the priorities of the criteria in the AHP method.
Calculation of Pairwise Comparison Matrix Consistency
After defining the paired comparisons between the criteria, it is necessary to calculate the consistency indices and the consistency ratio. According to [34], these indicators are used to verify the consistency of the comparisons made and ensure the reliability of the results.
The consistency index (CI) is calculated using the formula , where λmax is the largest eigenvalue of the pairwise comparison matrix and n is the order of the matrix. Next, the random index (RI) is calculated, which depends on the size of the matrix and is provided in specific tables made available by Saaty. Finally, the consistency ratio (CR) is calculated using the formula .
The consistency ratio allows evaluating whether the comparisons made are sufficiently consistent. If the value of CR is less than or equal to 0.1, the comparisons are considered consistent. Otherwise, it is necessary to review the comparisons and adjust the values to achieve greater consistency. These calculations are essential to ensure the reliability of the results obtained in the decision-making process using the AHP method.
[35] propose using Table 2 for RI values of matrices larger than 15, which is the maximum size provided in the table proposed by [32], Table 3.
Given that, for the studied data, the pairwise comparison matrix had n equal to 4, and the value of RI (Random Index) proposed by Saaty is 0.9 [32], the next step is to calculate λmax. To achieve this, the pairwise comparison matrix was normalized (Table 4) by dividing each value in the matrix by the sum of its respective column. With the normalized matrix, the arithmetic mean of each row was calculated, resulting in the relative priority vector (Table 5) that ranks the criteria in terms of their importance levels. This process follows the methodology proposed by [34].
Subsequently, the relative priority vector is used in a matrix multiplication with each row of the unnormalized pairwise comparison matrix. This multiplication results in a new matrix (Table 6), denoted as the λ matrix. Finally, the arithmetic mean of the λ matrix is calculated, obtaining the value of λmax (Table 6), which is essential for analyzing the consistency of the pairwise comparison matrix [34].
With the value of calculated, it is possible to calculate the consistency index (CI) and consistency ratio (CR), as presented in Table 7.
Given that CR < 0.1, indicating acceptable consistency in the comparisons made. Therefore, it can be concluded that the pairwise comparison matrix is consistent enough to proceed with the subsequent stages of decision-making analysis.
Calculation of Pairwise Comparison Matrices Aggregating Each Criterion to the Decision Alternatives
After ensuring the consistency of the pairwise comparison matrix, the next step is to develop pairwise comparison matrices for each criterion with respect to the alternatives. A matrix will be developed for each criterion, where each of the 34 alternatives will be compared against each other, thereby defining their level of preference relative to the evaluated criterion. Similar to the pairwise comparison matrix for criteria, the assessment of preference levels was conducted by the same technical specialist as in the initial evaluation. The results are presented in Figure 3 (Pairwise Comparison Matrix – MTBF), Figure 4 (Pairwise Comparison Matrix – MTTR), Figure 5 (Pairwise Comparison Matrix – Availability), and Figure 6 (Pairwise Comparison Matrix – Number of stops).
As previously mentioned, there are 34 alternatives (assets) under study, resulting in pairwise comparison matrices with n = 34. The random index (RI) value proposed by [35]. Following this step, it is necessary to calculate for each of these matrices, after which the matrices were normalized. With the normalized matrices, the arithmetic mean of each row was calculated, resulting in relative priority vectors (Table 8) that rank the alternatives in terms of importance relative to each criterion.
Next, the relative priority vectors are used in a matrix product with each row of the unnormalized pairwise comparison matrix of alternatives relative to the criteria. This product yields a new matrix, denoted as the matrix. Finally, the arithmetic mean of the matrix is calculated to obtain the value.
Once is calculated, the next step is to compute the consistency indices (CI) and consistency ratios (CR) again, as presented in Table 9.
Given that CR < 0.1, indicating acceptable consistency in the comparisons made. Therefore, it can be concluded that the comparisons in the pairwise comparison matrices of alternatives are consistent enough to proceed with selecting the preferred alternative.
Obtaining Priority for the Alternatives
The attainment of composite priorities for the alternatives is a crucial step in the multicriteria analysis process, enabling overall evaluation and ranking of alternatives based on established criteria. This stage involves combining the weights or priorities of the criteria with the evaluations of alternatives relative to these criteria.
According to [34], the composite priority of an alternative is calculated by the matrix product sum of the relative priority vector of the criteria and the relative priority vector of the alternatives with respect to each criterion. This product yields a new matrix where each element represents the composite priority of an alternative relative to the criteria.
Thus, obtaining the composite priorities for the alternatives (Table 10) allows for classification and comparison of alternatives based on established criteria, providing a solid foundation for multicriteria decision-making.
Classification of Alternatives
With the composite priority matrix of criteria calculated, the next step is to rank these values from highest to lowest. This ranking represents the prioritization order of each alternative relative to the objective established at the beginning of the AHP method application. The classification result is presented in Table 11.
Finally, the result of applying the AHP method identified the alternative FET68553464 as the priority option, with a 9.3% priority compared to the other alternatives.
4.5. Selection of Failure Mode
As highlighted by [36] , PFMEA analysis is a systematic approach that allows for the identification and classification of failure modes based on severity, occurrence, and detection criteria. Prioritization of failures is achieved through the calculation of the Risk Priority Number (RPN), which is a composite measure obtained by multiplying the aforementioned criteria scores for each known failure mode. The selection of the prioritized failure mode is based on the highest RPN, indicating that the failure has a high potential to cause significant impact on the process or system.
With that said, PFMEA analysis was conducted for the prioritized alternative (Table 12) in the AHP application, aiming to identify the failure mode with the highest RPN. In total, 36 different failure modes were analyzed. The failure mode with the highest risk priority number has an RPN of 210, described as "Crack in the part".
This approach is supported by [36], who emphasizes the importance of focusing on failure modes with higher RPNs to direct prevention and risk mitigation efforts more efficiently.
4.6. ETL
The data extraction covered the period from June 2022 to June 2023, spanning one year, concerning the history of downtime for the specific tooling. Subsequently, these data underwent transformation, involving the elimination of redundant columns, duplicate records, null values, and errors using Power Query. Through this process, two distinct tables were obtained: one encompassing all production sets associated with the chosen tooling, and the other containing information about the strikes performed during these productions. This initiated the production analysis with the aim of identifying those subject to the selected failure mode, "Crack." Consequently, a filtered table was constructed showing the number of strikes delivered by the tooling during occurrences of the mentioned failure. Upon completing this stage, relevant data for the first predictor were obtained.
As for the second and third predictors, these were defined as the height of the balancers and the pressure of the nitrogen system, due to their direct influence on crack occurrences in the forming process. It is noteworthy that data collection for these predictors does not occur via automated sensors; instead, measurements are manually taken during tooling inspection, potentially impacting data reliability. Thus, the same data transformation process was applied to ensure their integrity and consistency.
Figure 1 illustrates that the target prediction variable (Number of strikes) exhibits a multimodal distribution. This indicates the presence of multiple distinct clusters of values, each with its characteristic average. Additionally, Figure 2 displays the data distribution through quartiles, minimum, maximum values, and the absence of outliers in the dataset, as depicted by the boxplot graph type. This analysis is crucial as outliers can reduce the accuracy of prediction models, directly impacting the presented results.
For loading the data into the Machine Learning models, the Excel spreadsheet format (.xlsx) was chosen. In this format, the tables were unified and processed to create Table 13. The dataset used in this study consists of 2 predictors: Predictor 1 is the nitrogen pressure (bar) in the forming die of a forming matrix, and Predictor 2 is the height of the balancers (mm) of this matrix. For Predictor 1, data is collected from 7 different points, and for Predictor 2, from 6 different points. The data collected over this one-year period totals 150 sampling rows. Regarding the response variable, this study utilizes a numerical and continuous variable represented by the number of strikes or cycles of the tooling under study during the data collection period.
With the data properly processed, it becomes feasible to begin using them for training Machine Learning models.
4.7. Training
During the training stage of the Machine Learning models, the process began with splitting the data into training and testing sets using the structure 'X_train', 'X_test', 'y_train', and 'y_test', where the dataset was divided with 30% for testing and 70% for training (cross-validation). In this structure, the variable `X` represents the attributes or features of the dataset, i.e., the predictors, while the variable `y` represents the target variable that we aim to predict. To obtain the 'X' variables from the dataset, the 'drop' operation was used to remove the 'Strikes' column, leaving only the predictors in the dataset. The variable `y` stores the 'Strikes' column, which is the variable we intend to analyze or predict. This approach to splitting the data is crucial to ensure that the Machine Learning model is properly trained with relevant attributes and subsequently evaluated for its ability to generalize and perform well.
4.8. Evaluation and Selection of the Model
For model evaluation and selection, accuracy and performance are crucial criteria. To quantify how well the model fit the data, four error metrics were used: Mean Absolute Error (MAE), Mean Absolute Percentage Error (MAPE), Mean Squared Error (MSE), and Root Mean Squared Error (RMSE). The evaluated models were Gradient Boosting, K-Nearest Neighbors (KNN), Support Vector Machine (SVM), Random Forest, and Linear Regression.
The specific hyperparameters used for each model were as follows: For the K-Nearest Neighbors (KNN) Regression model, "weights='uniform', algorithm='auto', p=2" was employed. The 'n_neighbors' parameter was tuned using GridSearchCV, which conducts a grid search on the training data, evaluating different KNN models with varying 'n_neighbors' values through cross-validation, to find the best value within the specified range (1 to 99 in this study), as a wider range did not yield significant gains. For the Gradient Boosting Regression model, "n_estimators=100, learning_rate=0.1, max_depth=3, min_samples_split=2, min_samples_leaf=1, max_features='auto', loss='ls'" was used. The Support Vector Machine (SVM) used default parameters including "C=1.0, kernel='rbf', degree=3, gamma='scale'". In the case of Random Forest, the parameters employed were "n_estimators=100, max_depth=None, min_samples_split=2, min_samples_leaf=1, max_features='auto', random_state=0". Finally, Linear Regression does not require specific hyperparameters as it is a simple linear model. These values are defaults used when no specific values are provided, except for 'n_neighbors' as mentioned.
The result of applying these metrics based on the performance of the models presented is shown in Table 14.
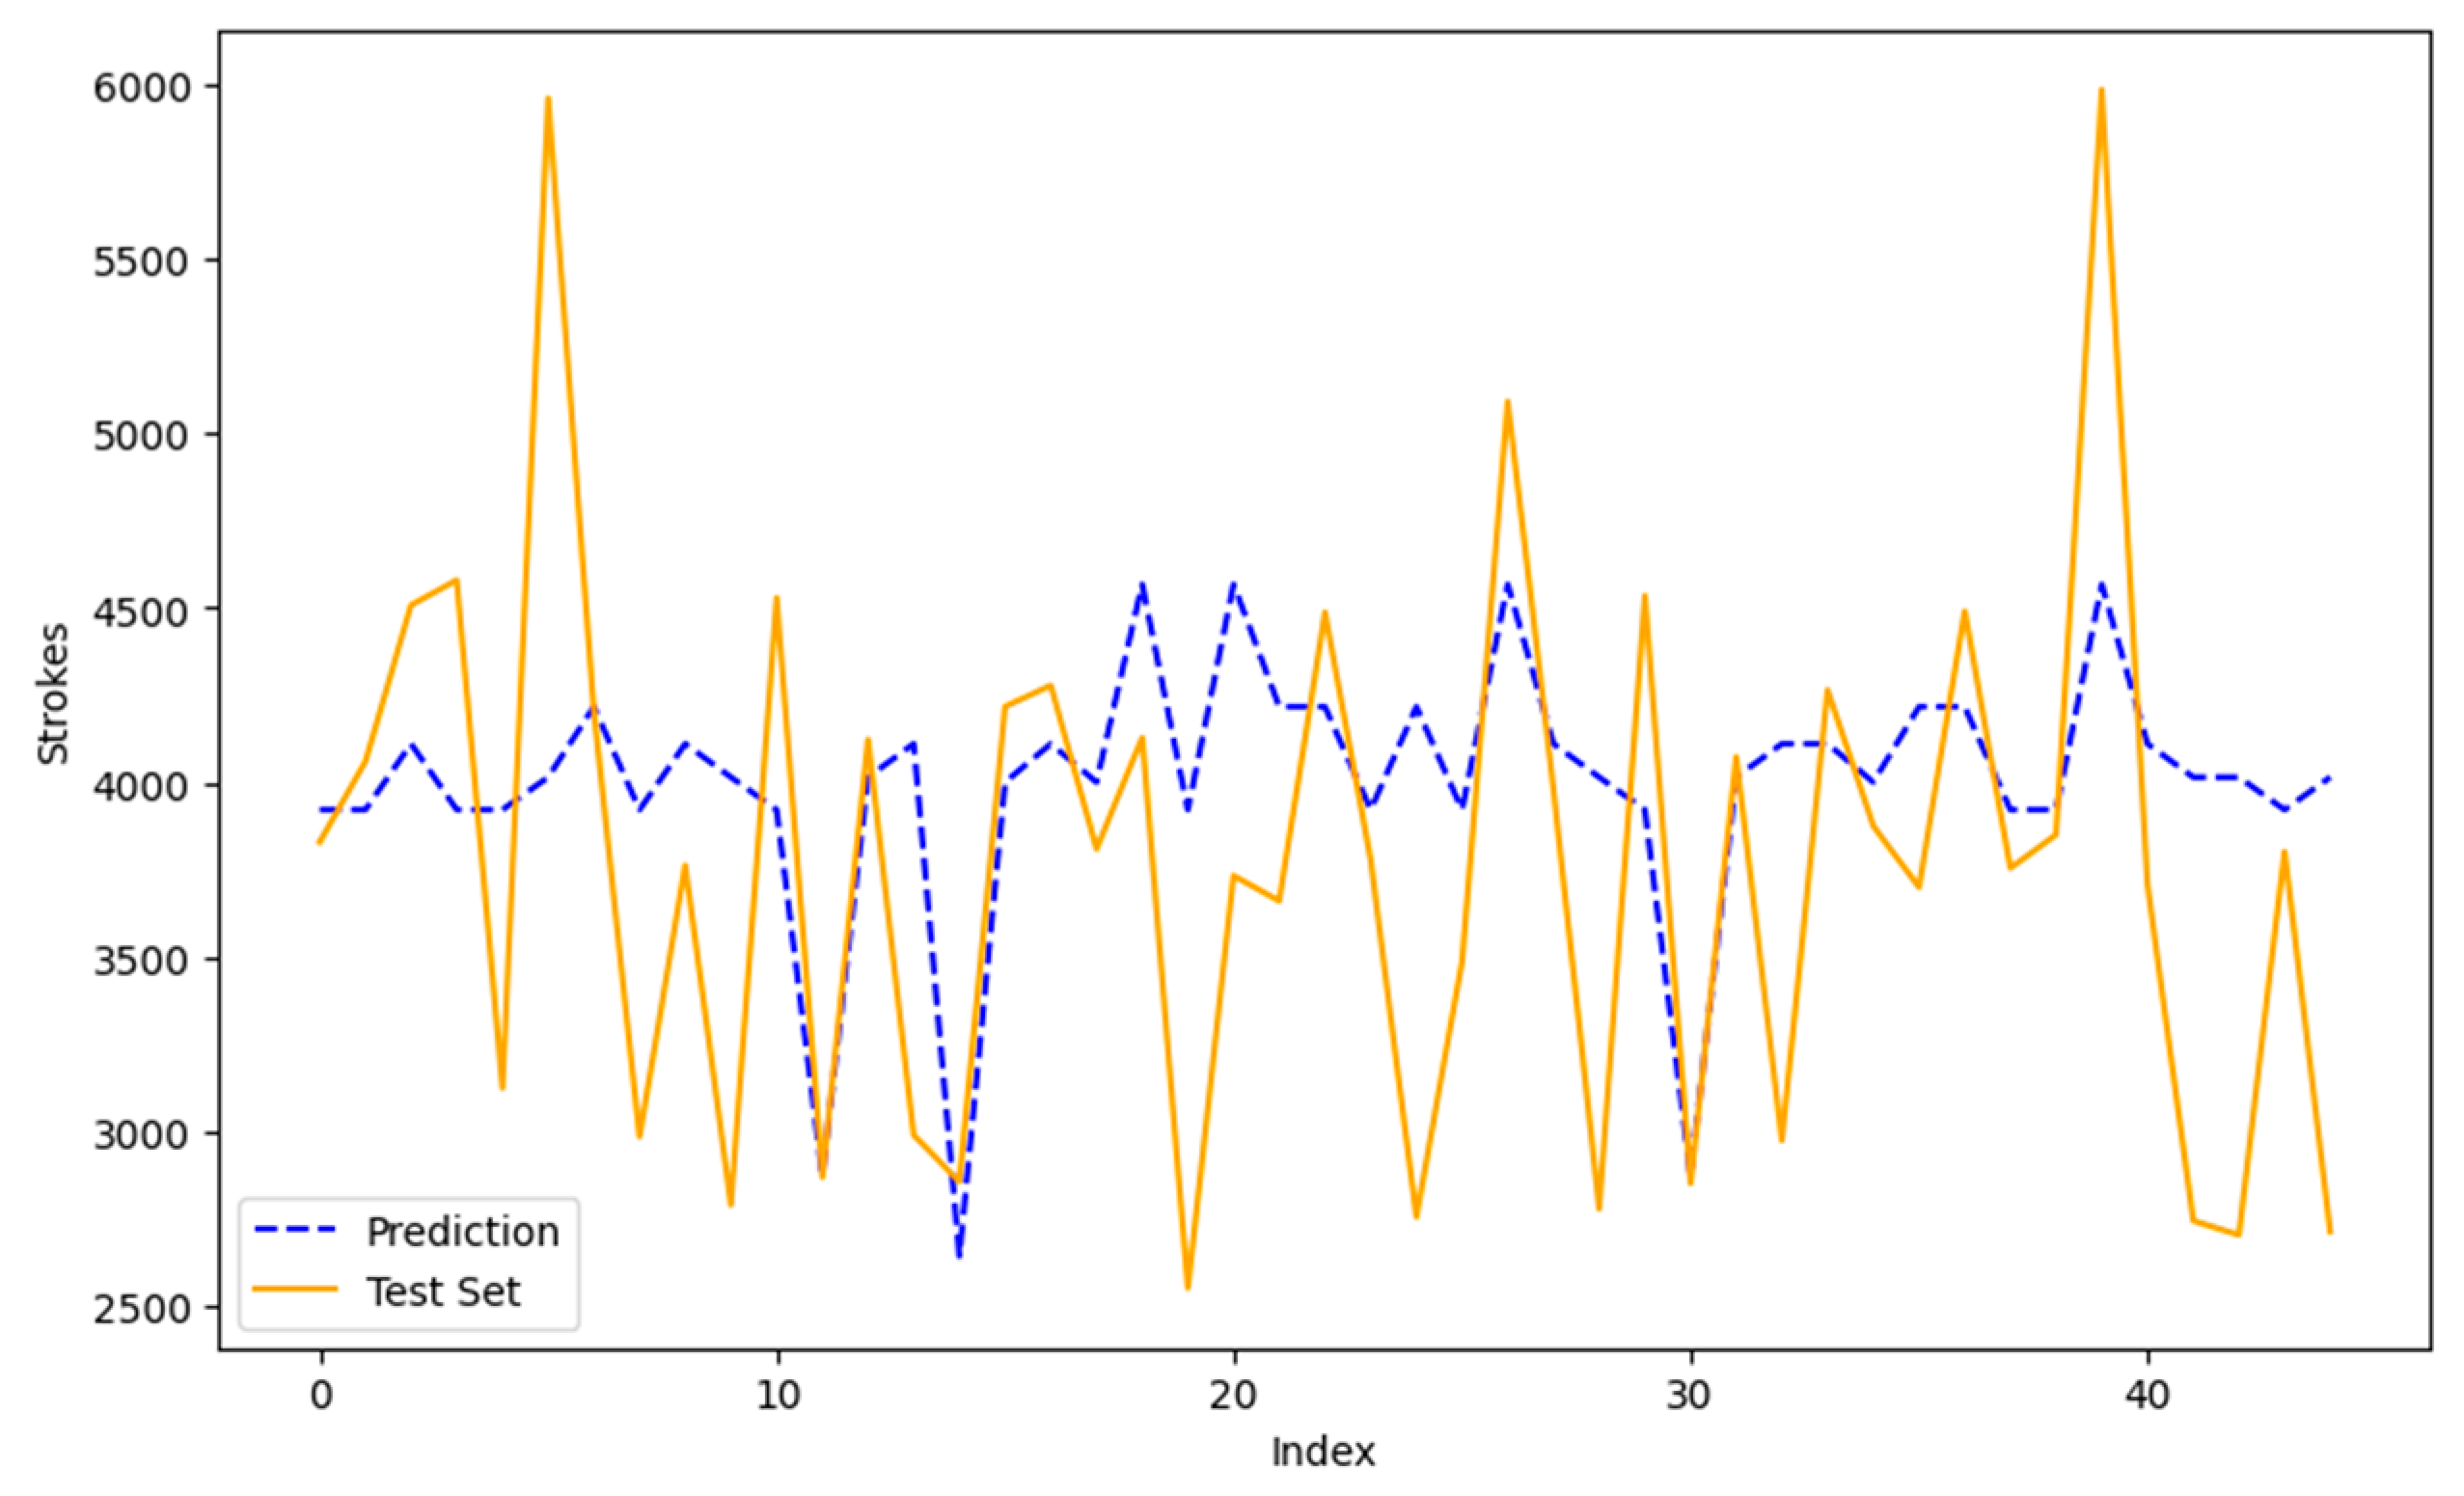
Therefore, it can be observed that the model with the best performance and accuracy is the Random Forest, as it showed the best results in all evaluated metrics (MAE, MAPE, MSE, and RMSE), and for this reason, it was chosen as the model. For ease of explanation and understanding with stakeholders, MAPE was used because it reflects percentage values for error analysis. The prediction result on the test data can be seen in Figure 3.
Figure 3.
Comparison between prediction and test data. Source: Author, 2023.
4.9. Application of the Model
During the model application stage, data that were not part of the test set were used. For this purpose, data from July 2023 to August 2023 were extracted and processed following the systematic approach described earlier. Subsequently, predictions were made using the Random Forest model with the updated data, as shown in Figure 4.
Figure 4.
Comparison between prediction and actual data. Source: Author, 2023.
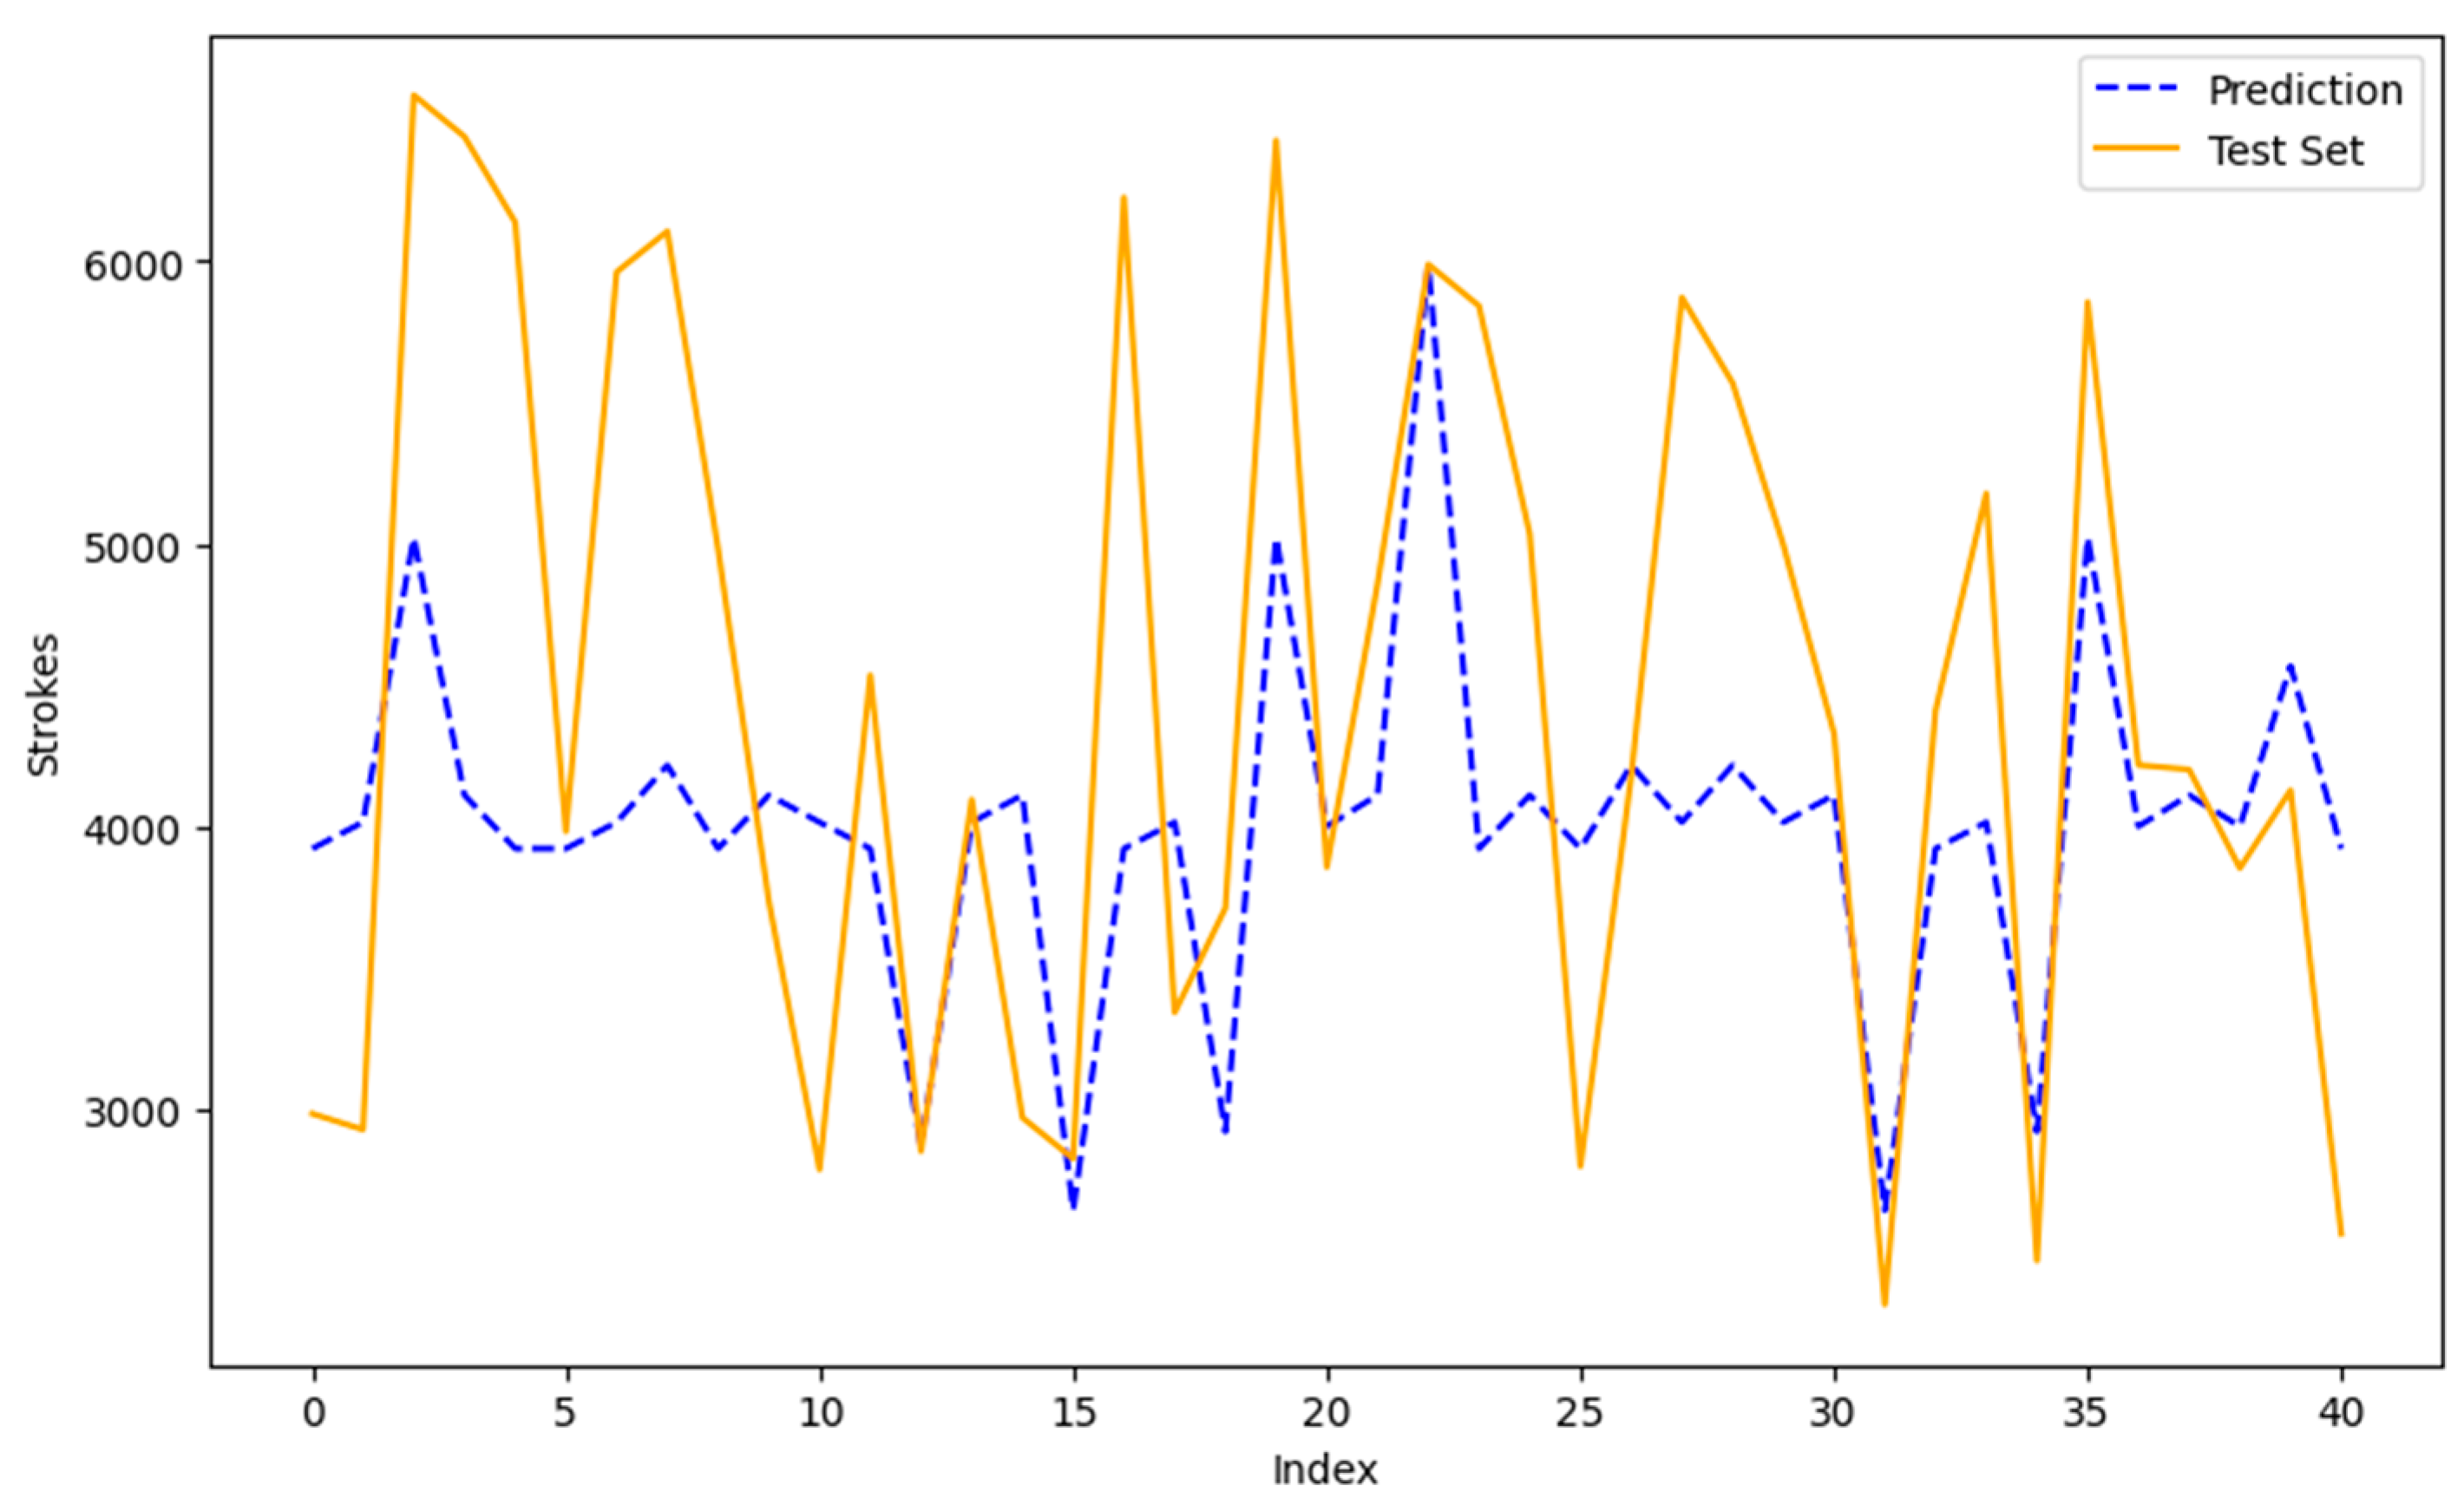
In Table 15, it is possible to observe the error metrics for the chosen model applied to the new data, which were used instead of the test set from the trained model.
5. Discussion
In this section, we will discuss the results obtained from the implementation of a Machine Learning predictive model in the automotive industry, emphasizing its practical implications, challenges faced, and impact on sustainability and operational efficiency.
The results of this study demonstrate that the Random Forest predictive model achieved an average accuracy of 80% in predicting failures. This high accuracy confirms the model's effectiveness in identifying complex patterns in data and anticipating potential failures. The ability to predict failures enables the implementation of preventive actions, significantly reducing the number of unplanned downtime events. Comparing the tested models, Random Forest showed the best performance across all error metrics, including Mean Absolute Error (MAE), Mean Absolute Percentage Error (MAPE), Mean Squared Error (MSE), and Root Mean Squared Error (RMSE). This suggests that Random Forest can better capture variations and patterns in data compared to other models such as Linear Regression, Decision Trees, SVM, and Gradient Boosting.
The application of the predictive model brought several practical benefits to maintenance management in the automotive industry. The reduction in unplanned downtime resulted in increased operational efficiency, making production more continuous and less prone to interruptions, thereby enhancing productivity. Additionally, there was a significant cost reduction as the decrease in unplanned downtime lowered costs associated with corrective maintenance and production losses. Another benefit was the improvement in the quality of the final product, leading to reduced rework and less waste [37].
Despite the positive results, the implementation of the predictive model encountered some challenges. Data quality was a critical factor, as the model's accuracy depends directly on the quality of the collected data. Incomplete or inaccurate data could compromise the model's effectiveness. Integration with existing systems also posed challenges, as it required adjusting the technical compatibility between the predictive model and maintenance and production management systems. Furthermore, operational staff needed training to understand and effectively use the predictive model results, which required time and resources.
Predictive maintenance based on Machine Learning significantly contributed to operational sustainability. Failure prediction allowed for the implementation of preventive actions, avoiding the waste of materials and resources. More efficient operation resulted in lower energy consumption, aligning with environmental sustainability goals. Moreover, predictive maintenance helped extend equipment lifespan, reducing the need for frequent replacements and consequently decreasing the environmental impact associated with production and disposal of new equipment [38, 39, 40, 41, 42, 43].
This study makes a significant contribution to the existing literature in several aspects. Firstly, it demonstrates the practical application of machine learning algorithms like Random Forest in predictive maintenance within the automotive industry, filling an important gap in practical and applied research. Furthermore, the integration of predictive models with sustainability practices highlights an innovative approach that combines operational efficiency with environmental responsibility. Insights gained into the challenges and benefits of practical implementation provide a solid foundation for future research, especially in improving data quality and system integration. Lastly, this study expands understanding of the impact of predictive maintenance on extending equipment lifespan and reducing waste, contributing to industrial sustainability.
6. Conclusions
This study demonstrated the effectiveness of applying Machine Learning predictive models in predictive maintenance within the automotive industry. The Random Forest model, in particular, proved highly accurate in predicting failures, achieving an average of 80% accuracy. Implementing the model enabled proactive actions, resulting in a significant reduction in unplanned downtimes and consequently enhancing operational efficiency.
The application of predictive modeling brought substantial practical benefits, including reduced operational costs, increased productivity, and improved final product quality. Moreover, Machine Learning-based predictive maintenance contributed to operational sustainability by reducing material and resource waste, lowering energy consumption, and extending equipment lifespan.
However, the implementation faced challenges such as the need for high-quality data and integration with existing systems. These challenges underscore the importance of a robust ETL (Extraction, Transformation, Loading) process and training operational staff to maximize the predictive model's benefits.
The implications of this study are broad, suggesting that adopting Machine Learning technologies can transform maintenance management in the automotive industry. Technological innovation, coupled with a well-structured approach and high-quality data, can promote more efficient, sustainable, and cost-effective operations.
To further expand on the findings of this study, the following recommendations are proposed:
- (a)
- Explore New Algorithms: Investigate the effectiveness of other Machine Learning algorithms, including advanced Deep Learning techniques, to further enhance the accuracy of failure predictions.
- (b)
- Expand Scope: Apply the model to different types of equipment and production processes within and beyond the automotive industry to verify the generalizability of results.
- (c)
- Improve Data Collection: Invest in sensor technologies and monitoring systems that ensure continuous and high-quality collection of operational data, which is critical for the effectiveness of predictive models.
- (d)
- Integration with Management Systems: Develop solutions that facilitate the integration of predictive models with maintenance and production management systems, making implementation more efficient and less susceptible to technical incompatibilities.
This study underscores the importance of multidisciplinary approaches in engineering, integrating Machine Learning techniques for more effective maintenance and production management. Predictive maintenance not only enhances operational efficiency and product quality but also promotes sustainability, an increasingly crucial factor in the modern industry.
Author Contributions
Conceptualization, J. C. O. O., J. G. B. M, C. V. S. F, and M.C.G.; methodology, J. C. O. O., and M.C.G.; validation, J. C. O. O., and M.C.G.; formal analysis, J. C. O. O., and M.C.G.; investigation, J. C. O. O., and M.C.G.; resources, M. S. P., J. V. Q. P., I. C. P. D., E. C. M. S., and M. G. M. P; data curation, J. C. O. O., and M.C.G.; writing—original draft preparation, J. C. O. O., and M.C.G.; writing—review and editing, J. C. O. O., and M.C.G.; visualization, J. C. O. O., and M.C.G.; project administration, J. C. O. O., and M.C.G. All authors have read and agreed to the published version of the manuscript.
Funding
This research was funded by Fundação de Apoio a Pesquisa do Distrito Federal (FAPDF) and Universidade de Brasília (UNB).
Institutional Review Board Statement
Not applicable.
Informed Consent Statement
Not applicable.
Data Availability Statement
Not applicable.
Acknowledgments
Not applicable.
Conflicts of Interest
The authors declare no conflicts of interest.
Appendix A

Table A1.
Literature review on the application of machine learning methods in industrial processes.
| Authors | Journal | Proposal | Contributions | Limitations |
|---|---|---|---|---|
| Karthikeyan et al. (2024) | Arabian Journal for Science and Engineering | Using three different feature extraction techniques, namely statistical, histogram, and the autoregressive moving average model (ARMA), this study attempted to employ feature fusion to identify the most significant features required for detecting suspension faults using vibration signals and a machine learning approach. | The study classified eight different states of the suspension system, comprising seven fault conditions and one normal (good) condition. The study demonstrates that the combination of ARMA-histogram-statistical features with a random forest classifier results in high classification accuracy and presents findings that can enhance predictive maintenance for vehicles. | The experiments conducted in this study were performed under laboratory conditions using a quarter-car model. The accuracy of the proposed method and model may vary. For future work, real-time implementation could provide greater significance and practical value |
| Prytz R. et al. (2015) | Engineering Applications of Artificial Intelligence | This article proposes a data-driven approach to predict the future maintenance needs of air compressors in heavy trucks, combining pattern recognition and Remaining Useful Life (RUL) estimation. The proposal classifies whether the RUL will be shorter or longer than the interval until the next scheduled service visit, using historical data collected from vehicles and records of certified workshop services. | This study makes an innovative contribution to the literature by using historical vehicle data and service records to predict maintenance needs, overcoming the limitation of data sources not designed for mining. The application of failure prediction models and Remaining Useful Life (RUL) estimates for air compressors, components with multiple potential failure modes, extends the reach of predictive automotive maintenance, bringing significant advancements to the industry. Furthermore, the research contributes to the field of Condition-Based Maintenance (CBM) by proposing a solution that does not rely on continuous monitoring or real-time sensors, thus overcoming connectivity challenges and associated costs. | An important limitation of the study lies in the complexity of the data, which includes maintenance records and vehicle usage data designed for other purposes, such as warranty analysis, rather than for data mining. Additionally, the datasets are highly imbalanced, with noisy class labels and missing data, which hinders the accuracy of predictions. Another challenge is the variety of vehicle configurations, as well as adverse conditions and the lack of continuous monitoring, making the application of predictive maintenance models more complex and difficult to generalize across all scenarios. |
| Joseph Chukwudi I. et al. (2024) | IEEE Access | Develop a model capable of real-time prediction of failures or potential problems in a vehicle's engine using a data pre-processing technique scaled in sklearn, analyzing and validating the performance of the proposed models using statistical tools. | Presented an effective model by leveraging the strengths of multiple machine learning models to generate more accurate and specific solutions. | The findings of this study consist of fundamental tools for the implementation of a predictive maintenance guide for the automotive industry, however they do not guarantee that the results obtained are related to the real world, aiming at the use of more efficient techniques and parameters. |
| Rana K. et al. (2024) | Computers and Electrical Engineering | Presented a literature review focusing on the use of Artificial Intelligence (AI) and Machine Learning (ML) for automotive systems with applications that go beyond Advanced Driver Assistance Systems (ADAS). | Gaps in the existing literature were identified, highlighting the evolution of the mobility scenario. From this perspective, research needs were identified for a complete evaluation of network architecture, connectivity and performance metrics, covering Automated Guided Vehicle (AGV) technology, networking protocols and swarm dynamics. | It focused on identifying gaps in the literature, addressing the impact of AI in areas such as automotive emissions, predictive maintenance, connected vehicles, safety-focused driver monitoring systems, and the use of various algorithms from an ADAS perspective. The summarized case studies provide excellent examples of applications of each system, but do not provide methodological details. |
| Tabit S. et al. (2022) | Journal of Theoretical and Applied Information Technology (JATIT) | The objective of our research is to develop an algorithmic solution for the detection of anomalies and nonconformities in production units, through an automatic classification of the data collected by the sensors (which represent the INPUTS of our model) into two categories: defects and without defects, which constitute the set of arrivals of the value of OUTPUT |
The work contributes by presenting an approach capable of classifying images of product surfaces (such as steel strips) into two categories: defect present or defect absent. It utilizes algorithms that map pixel intensity values to achieve precise categorization. The use of machine learning for predictive maintenance allows predicting the failures of different types of equipment, anticipating the maintenance of machines, and therefore planning it in advance. | The proposed research requires extensive annotated data on non-compliance, making it costly. The efficiency of machine learning applications is heavily influenced by selecting the correct evaluation metrics, particularly in scenarios with imbalanced data, where incorrect predictions can have significant consequences. The efficient application of machine learning for the detection of anomalies in the production process depends essentially on the analytical approach used by the data scientist to select the data and exploit it. |
| Jain A. et al. (2023) | International Journal of Prognostics and Health Management. | The aim of this paper is to propose a Machine Learning (ML) based framework which utilizes minimally labelled or unlabeled sensor data generated from a vehicle system at a given frequency. The framework utilizes an ML model to identify any anomalous behavior or aberration, and flag it for further review. | The framework helps in providing an automation solution to quickly analyze the field data and provide alerts for any aberration. It is useful in creating early alert model for any known problem or new anomaly in absence of labeled data. The infrastructure, pipeline creation, or models could be configured as per the specific requirements of the problem and is technology agnostic. The framework also proposes to convert a generic anomaly detection problem to specific predictive maintenance problem once the labels are captured in the data. Another aspect for which this framework could be utilized is for creation of a Vehicle Health Index (VHI) indicating the overall health of the vehicle. |
The framework can handle most scenarios but may encounter rare operating conditions not defined during design. These conditions would appear as anomalies, potentially forming densely populated clusters that indicate a new operating regime. Regular performance monitoring is crucial, especially when such clusters are reported. Subject Matter Experts (SMEs) should investigate to confirm if the scenario represents a new condition or an actual anomaly. |
| Voronov S. et al. (2020) | Journal of Prognostics and Health Management | The article proposes the development of predictive models for lead-acid battery maintenance in heavy vehicles, utilizing sparse and non-equidistant operational data. The focus is on predicting battery failure through machine learning techniques, specifically Random Survival Forest (RSF) and Long Short-Term Memory (LSTM) models | This paper contributes to the field of predictive maintenance by addressing the challenge of predicting lead-acid battery failures in heavy-duty vehicles using sparse operational data. The proposed approach combines imputation techniques, such as mean imputation for missing values, and two predictive models: RSF and LSTM-based neural networks. The study demonstrates that LSTM models significantly outperform RSF models and other traditional algorithms like Cox regression, particularly in scenarios with sparse data. Additionally, the work highlights the importance of handling data imbalances and proposes an ensemble method to address this issue. The findings suggest that more frequent data readouts improve model performance, but due to the accumulative nature of sensor readings, data collection can be optimized by reducing readout frequency, thus lowering transmission costs and vehicle equipment requirements. These contributions provide valuable insights into data collection strategies and the application of machine learning in industrial predictive maintenance. | The data primarily consists of accumulated sensor readings collected throughout the battery's lifetime, typically recorded during irregular workshop visits. The dataset contains several uncertainties, including a high rate of non-random missing values. |
| Jain M. et al. (2022) | Computational Intelligence | This article intends to provide the literature review of ML techniques used for predictive maintenance of automobiles and diagnosis of the vehicle’s health using ML. |
The article synthesizes the state-of-the-art in the application of machine learning models, such as Random Forest (RF) and Support Vector Machines (SVM), for predicting faults, diagnosing vehicle health, and estimating remaining useful life (RUL). It highlights the importance of On-Board Diagnostics (OBD) systems, which serve as a crucial tool for collecting data that enables the application of predictive and prognostic techniques. | The OBD system proves to be a valuable tool in collecting data on which machine learning models can be applied. However, data concentration has been confined to only a limited number of parts, and there is significant scope for collecting data from other parts of the vehicle that requires further investigation. Supervised learning techniques such as SVM, RF, and others have been successfully applied to prognosis applications. However, further research is necessary, as there remains considerable room for improvement in these methodologies. |
| Cherdo Y. et al. (2023) | Sensors | The proposal of this article is to explore the application of recurrent and convolutional neural networks for unsupervised anomaly detection in real multidimensional time series generated by vehicle sensors, extracted from the Controller Area Network (CAN) bus. | It contributes to the literature by applying unsupervised anomaly detection techniques based on LSTM and CNN to time series data from real vehicles, enabling the identification of complex multidimensional behaviors without focusing on specific types of anomalies. Furthermore, it demonstrates that smaller models can achieve similar performance in anomaly detection, albeit with lower prediction accuracy, offering a more efficient alternative. Finally, the study introduces an innovative method to correlate variables with the detected anomalies, aiding in the interpretation of results and the diagnosis of abnormal behaviors. | The limitations of this article include the difficulty of fully evaluating the model due to the labels representing only a specific abnormal behavior, as well as the lack of more advanced preprocessing and feature engineering driven by experts, which could improve the results. Additionally, the reduction in computational costs, although addressed, lacks further in-depth study on public benchmarks, which is essential for validating and generalizing the results. Finally, the proposed method for correlating variables with abnormal behaviors, while promising, still requires a more detailed evaluation to be refined. |
| Theissler A. et al. (2021) | Reliability Engineering & System Safety | The purpose of this article is to investigate the application of predictive maintenance (PdM) in the automotive industry, using machine learning (ML) to ensure the functional safety of vehicles throughout their lifecycle while limiting maintenance costs. | The main contributions of this paper are introducing the most relevant machine learning subfields for predictive maintenance, making the field of ML-based PdM accessible to experts from different backgrounds; conducting a systematic survey and categorization of papers on ML-based PdM for automotive systems, analyzing them from both a use case and machine learning perspective; identifying the most frequent use cases, commonly used ML methods, and the most active authors; and identifying open challenges and discussing future research directions, providing research questions that may inspire new studies. | The main limitations of the research include the reliance of most articles on fully labeled datasets, which creates a significant bottleneck due to the difficulty in obtaining such data, especially in field scenarios. While supervised (or semi-supervised) learning yields more reliable results, the need for labeled data for these methods is a major obstacle. Furthermore, none of the reviewed papers used reinforcement learning, indicating a gap in the research, despite the potential for applying this approach to predictive maintenance in automotive systems. |
| Muideen A.A. et al. (2023) | Mathematics | This article proposes an innovative approach for detecting failures in automotive air pressure systems (APS) by introducing a Broad Integrated Logistic Regression (BELR), which combines a Broad Learning System (BLS) and a Logistic Regression (LogR) classifier to predict APS failures. | O trabalho contribui ao introduzir uma abordagem capaz de classificar falhas em sistemas de pressão de ar automotivos (APS) em duas categorias: falha de APS presente ou falha de APS ausente. Ele alavanca algoritmos que extraem características discriminativas de dados de entrada para obter previsões precisas. Ao empregar técnicas de aprendizado de máquina, o estudo permite a manutenção preditiva, permitindo a detecção precoce de falhas de APS, o planejamento oportuno de atividades de manutenção e minimizando custos associados a quebras inesperadas. | Its limitations include reliance on the KNN imputation method for handling missing data, which, although effective, leaves room for improvement through the exploration of advanced imputation techniques like generative adversarial networks (GANs). While BELR outperforms comparison algorithms such as Gaussian Naive Bayes, Random Forest, KNN, SVM, and Logistic Regression in metrics like F1-score, its superiority is context-dependent, and further validation across diverse datasets |
| Gopalakrishnan S. et al. (2022) | Tech Science Press | Test predictive methodology in anomaly detection, production line accuracy and machinery efficiency for the automotive industry, especially among Accessory Manufacturers (AMs), in comparison to other existing Machine Learning (ML) approaches. | Developed a predictive maintenance system applying a hybrid ML model, with supervised and unsupervised training, within the framework of the Industrial Internet of Things (IIoT). | The proposed model was designed for two main scenarios: training phase and execution phase. The results were efficient in detecting defective parts earlier. However, more data is needed to complete the study of the unsupervised learning model. |
| Singh S. et al. (2023) | IEEE Engineering Management Review | Propose four predictive maintenance methodologies for different sensor groups that produce real-time failure and anomaly results, addressing Machine Learning (ML) for automotive industries. | Presented unique predictive maintenance framework applicable to equipment in automotive industries emphasizing increased productivity and efficiency, improved availability of equipment and components, reduced utility and labor costs, automated processing of maintenance checks and reduced operating costs using cloud-based services. | The proposed framework assumes that each component can suffer a single failure, so predicting Remaining Useful Lifetime (RUL) is challenging in the presence of Big Data. The proposed model can forecast and foresee anomalies, but fails to calculate RUL. |
| Redondo R. et al. (2020) | MDPI AG: Applied Sciences (Switzerland) | This study extends Hybrid Unsupervised Exploratory Plots (HUEPs) as a visualization technique that combines Exploratory Projection Pursuit (EPP) and Clustering methods for the automotive industry. | Added the Classical Multidimensional Scaling, Sammon Mapping and Factor Analysis methods. A new and real case study was analyzed, comprising two of the usual machines in the automotive industry. Proving that, depending on the dataset, it may be better to use a combination of methods to generate one HUEP or another. | The results obtained show that HUEPs is a technique that supports the continuous monitoring of machines to anticipate failures, however the use of HUEPs for quality purposes was not explored. They could also have addressed the combination of HUEPs with the outputs of supervised models. |
| Shafi U. et al. (2022) | Journal of Advanced Transportation: Hindawi Limited | Presented an approach for fault prediction of four subsystems of a vehicle: fuel system, ignition system, exhaust system and cooling system. Compare the accuracy of all the classifiers based on Receiver Operating Characteristics (ROC) curves. Propose a new vehicle monitoring and fault prediction system using four classifiers: Decision Tree, SVM, RF and K-NN. | Prediction of vehicle system failures and proper real-time vehicle monitoring and prognostic maintenance system. It used sensor data and machine learning algorithms in conjunction with smartphone applications, enabling easy-to-use remote vehicle health monitoring. | The data source comes from a sample of 70 cars of the same model. The accuracy of the data could be further refined with more in-depth work on the data set and by applying other forecasting techniques. |
References
- Lourenço F, Gonçalves MC, Canciglieri Júnior O, Dias ICP, Benitez GB, Benitez LB, Nara EOB. (2024). A Systemic Approach to the Product Life Cycle for the Product Development Process in Agriculture. Sustainability (Switzerland), 16(10), 4207. [CrossRef]
- Serra FNT, Gonçalves MC, Bortoluzzi SC, Costa SEG, Dias ICP, Benitez GB, Benitez LB, Nara EOB. (2024). The Link between Environment and Organizational Architecture for Decision-Making in Educational Institutions: A Systemic Approach. Sustainability (Switzerland), 16(10), 4309. [CrossRef]
- Gonçalves, M. C. , Canciglieri, A. B., Strobel, K. M., Antunes, M. F., Zanellato, R. R. (2020). Application of operational research in process optimization in the cement industry. Journal of Engineering and Technology for Industrial Applications, Vol. 6, No. 24, pp. 36-40. [CrossRef]
- Tardio, P.R. , Schaefer, J.L., Gonçalves, M.C., Nara, E.O.B. (2023a). Industry 4.0 and Lean Manufacturing Contribute to the Development of the PDP and Market Performance? A Framework. Lecture Notes in Computer Science, Vol. 14316, pp. 236 - 249. [CrossRef]
- Junior, O. , Gonçalves, M. C. (2019). Application of quality and productivity improvement tools in a potato chips production line | Aplicação de ferramentas de melhoria de qualidade e produtividade em uma linha de produção de batatas tipo chips. Journal of Engineering and Technology for Industrial Applications, Vol. 5, No. 18, pp. 65-72. [CrossRef]
- Serra, F.N.T. , Nara, E.O.B., Gonçalves, M.C., Gouvea da Costa, S.E., Bortoluzzi, S.C. (2023). Preliminary Construct for Decision Making in Organizations: A Systemic Approach. Proceedings of the 11th International Conference on Production Research – Americas: ICPR Americas 2022, pp. 639–646. [CrossRef]
- Theissler, A. , Pérez-Velázquez, J., Kettelgerdes, M., Elger, G. (2021). Predictive Maintenance Enabled by Machine Learning: Use Cases and Challenges in the Automotive Industry. Reliability Engineering and System Safety, 215. [CrossRef]
- Shafi, U., Safi, A., Shahid, A.R., Ziauddin, S., Saleem, M.Q. (2018). Vehicle Remote Health Monitoring and Prognostic Maintenance System. Journal of Advanced Transportation, 2018. [CrossRef]
- Muideen, A.A. , Lee, C.K.M., Chan, J., Pang, B., Alaka, H. (2023). Broad Embedded Logistic Regression Classifier for Prediction of Air Pressure Systems Failure. Mathematics, 11(4). [CrossRef]
- Bodenhausen, U. (2022). Comprehensive Test Strategy for AI Based Systems: From AI Test Principles to Test Optimization. VDI Berichte, 2022(2405), 265-282.
- Cherdo, Y. , Miramond, B., Pegatoquet, A., Vallauri, A. (2023). Unsupervised Anomaly Detection for Cars CAN Sensors Time Series Using Small Recurrent and Convolutional Neural Networks. Sensors, 23(11). [CrossRef]
- Tabit, S. , Soulhi, A. (2022). Machine Learning: Strategies for Industrial Defect Detection. Journal of Theoretical and Applied Information Technology, 100(21), 6652-6661.
- Jain, A. , Tarey, P. (2023). Anomaly Detection for Early Failure Identification on Automotive Field Data. International Journal of Prognostics and Health Management, 14(3). [CrossRef]
- Gopalakrishnan, S., Kumaran, M.S. (2022). IIOT Framework Based ML Model to Improve Automobile Industry Product. Intelligent Automation and Soft Computing, 31(3), 1435-1449. [CrossRef]
- Singh, S. , Batheri, R., Dias, J. (2023). Predictive Analytics: How to Improve Availability of Manufacturing Equipment in Automotive Firms. IEEE Engineering Management Review, 51(4), 157-168. [CrossRef]
- Voronov, S. , Krysander, M., Frisk, E. (2020). Predictive Maintenance of Lead-Acid Batteries with Sparse Vehicle Operational Data. International Journal of Prognostics and Health Management, 11(1), 1-17.
- Redondo, R. , Herrero, A., Corchado, E., Sedano, J. (2020). A Decision-Making Tool Based on Exploratory Visualization for the Automotive Industry. Applied Sciences (Switzerland), 10(12). [CrossRef]
- Jain, M. , Vasdev, D., Pal, K., Sharma, V. (2022). Systematic Literature Review on Predictive Maintenance of Vehicles and Diagnosis of Vehicle's Health Using Machine Learning Techniques. Computational Intelligence, 38(6), 1990-2008. [CrossRef]
- Vianna, L. V. , Gonçalves, M. C., Dias, I. C. P., Nara, E. O. B. (2024). Application of a production planning model based on linear programming and machine learning techniques. JETIA, Vol. 10, No. 45. [CrossRef]
- Gonçalves, M.C. , Machado, T.R., Nara, E.O.B., Dias, I.C.P., Vaz, L.V. (2023a). Integrating Machine Learning for Predicting Future Automobile Prices: A Practical Solution for Enhanced Decision-Making in the Automotive Industry. Lecture Notes in Computer Science, Vol. 14316, pp. 91 - 103. [CrossRef]
- Hamasaki, K., Gonçalves, M. C., Junior, O. C., Nara, E. O. B., & Wollmann, R. R. G. (2023). Robust Linear Programming Application for the Production Planning Problem. In Proceedings of the 11th International Conference on Production Research – Americas: ICPR Americas 2022 (pp. 647-654). [CrossRef]
- Gonçalves, M.C. , Nara, E.O.B., Santos, I.M.d., Mateus, I.B., do Amaral, L.M.B. (2023b). Comparative Analysis of Machine Learning Techniques via Data Mining in a Railroad Company. Proceedings of the 11th International Conference on Production Research – Americas: ICPR Americas 2022, pp. 655–664.
- Tardio, P.R. , Schaefer, J.L., Nara, E.O.B., Gonçalves, M.C., Dias, I.C.P., Benitez, G.B. and Castro e Silva, A.d (2023b). The link between lean manufacturing and Industry 4.0 for product development process: a systemic approach. Journal of Manufacturing Technology Management, 34(8), pp. 1404–1424.
- James, G. , Witten, D., Hastie, T., Tibshirani, R. (2013). An Introduction to Statistical Learning. Springer.
- Hastie, T. , Tibshirani, R., Friedman, J. (2009). The Elements of Statistical Learning. Springer.
- Chen, J. , Song, L., Wainwright, M. J., Jordan, M. I. (2018). Learning to explain: An information-theoretic perspective on model interpretation. International Conference on Machine Learning (ICML).
- Shingo, S. O Sistema Toyota de Produção. Porto Alegre: Bookman, Vol. 2, pp. 291, 1996.
- Gonçalves, M.C. , Pamplona, A.B., Nara, E.O.B., Dias, I.C.P. (2023c). Optimizing Dental Implant Distribution: A Strategic Approach for Supply Chain Management in the Beauty and Well-Being Industry. Lecture Notes in Computer Science, Vol. 14316, pp. 385 - 397. [CrossRef]
- de Faria, G.; Tulik, J.; Gonçalves, M.C. Proposition of A Lean Flow of Processes Based on The Concept of Process Mapping for A Bubalinocultura Based Dairy. J. Eng. Technol. Ind. Appl. 2019, 5, 23–28. [Google Scholar] [CrossRef]
- Zonta, T. , da Costa, C. A., Righi, R. R., de Lima, M. J., da Trindade, E. S., Li, G. P. (2020). Predictive maintenance in the Industry 4.0: A systematic literature review. Computers & Industrial Engineering, Vol. 150, Dec. 2020. [CrossRef]
- Burmeister, N. , Frederiksen, R. D., Høg, E. and Nielsen, P. (2023). Exploration of Production Data for Predictive Maintenance of Industrial Equipment: A Case Study. IEEE Access, Vol. 11, pp. 102025-102037. [CrossRef]
- Saaty, T. L. Rank from comparisons and from ratings in the analytic hierarchy/network processes. European Journal of Operational Research, Vol. 168, No. 2, pp. 557-570, 2005.
- Ishikawa, K. Introduction to Quality Control. 3A Corporation, Tokyo, 1990.
- Saaty, T. L. The Analytic Hierarchy Process: Planning, Priority Setting, Resource Allocation. 1980. ISBN-13: 978-0070543713.
- Alonso, J. and Lamata, M. (2006). Consistency in the Analytic Hierarchy Process: A New Approach. International Journal of Uncertainty, Fuzziness and Knowledge-Based Systems, 14, 445-459. [CrossRef]
- Smith, M. T. (2014). History of the FMEA. Retrieved from Elsmar: http://elsmar.com/FMEA/sld011.htm.
- Stankevecz, F. , Dias, I. C. (2019). System Integrated Management for Stock Management in a Beverage Distributor: A Proposal Based on A Case Study. JETIA, Vol. 5, No. 18, pp. 58-64. [CrossRef]
- Cardoso, G. , Dias, I. C. (2020). Mapping Process Improvement and Sequencing Analysis for Productive Definitions. JETIA, Vol. 6, No. 21, pp. 66-71. [CrossRef]
- Lourenço, F. , Nara, E. O. B., Gonçalves, M. C., & Canciglieri Junior, O. Preliminary Construct of Sustainable Product Development with a Focus on the Brazilian Reality: A Review and Bibliometric Analysis. In World Sustainability Series (Part F1432, pp. 197-220).2023. [CrossRef]
- Karthikeyan, H.L. , Sridharan N.V., Balaji P.A., Vaithiyanathan S. (2024). Diagnosing Faults in Suspension System Using Machine Learning and Feature Fusion Strategy. Arabian Journal for Science and Engineering.
- Prytz, R. , Nowaczyk S., Rögnvaldsson T., Byttner S. (2015). Predicting the need for vehicle compressor repairs using maintenance records and logged vehicle data. Engineering Applications of Artificial Intelligence.
- Joseph Chukwudi, I. , Zaman N., Abdur Rahim M., Arafatur Rahman M., Alenazi M.J.F., Pillai P. (2024). An Ensemble Deep Learning Model for Vehicular Engine Health Prediction. IEEE Access.
- Rana, K. , Khatri N. (2024). Automotive intelligence: Unleashing the potential of AI beyond advance driver assisting system, a comprehensive review. Computers and Electrical Engineering.
Figure 1.
Target variable histogram. Source: Author, 2023.
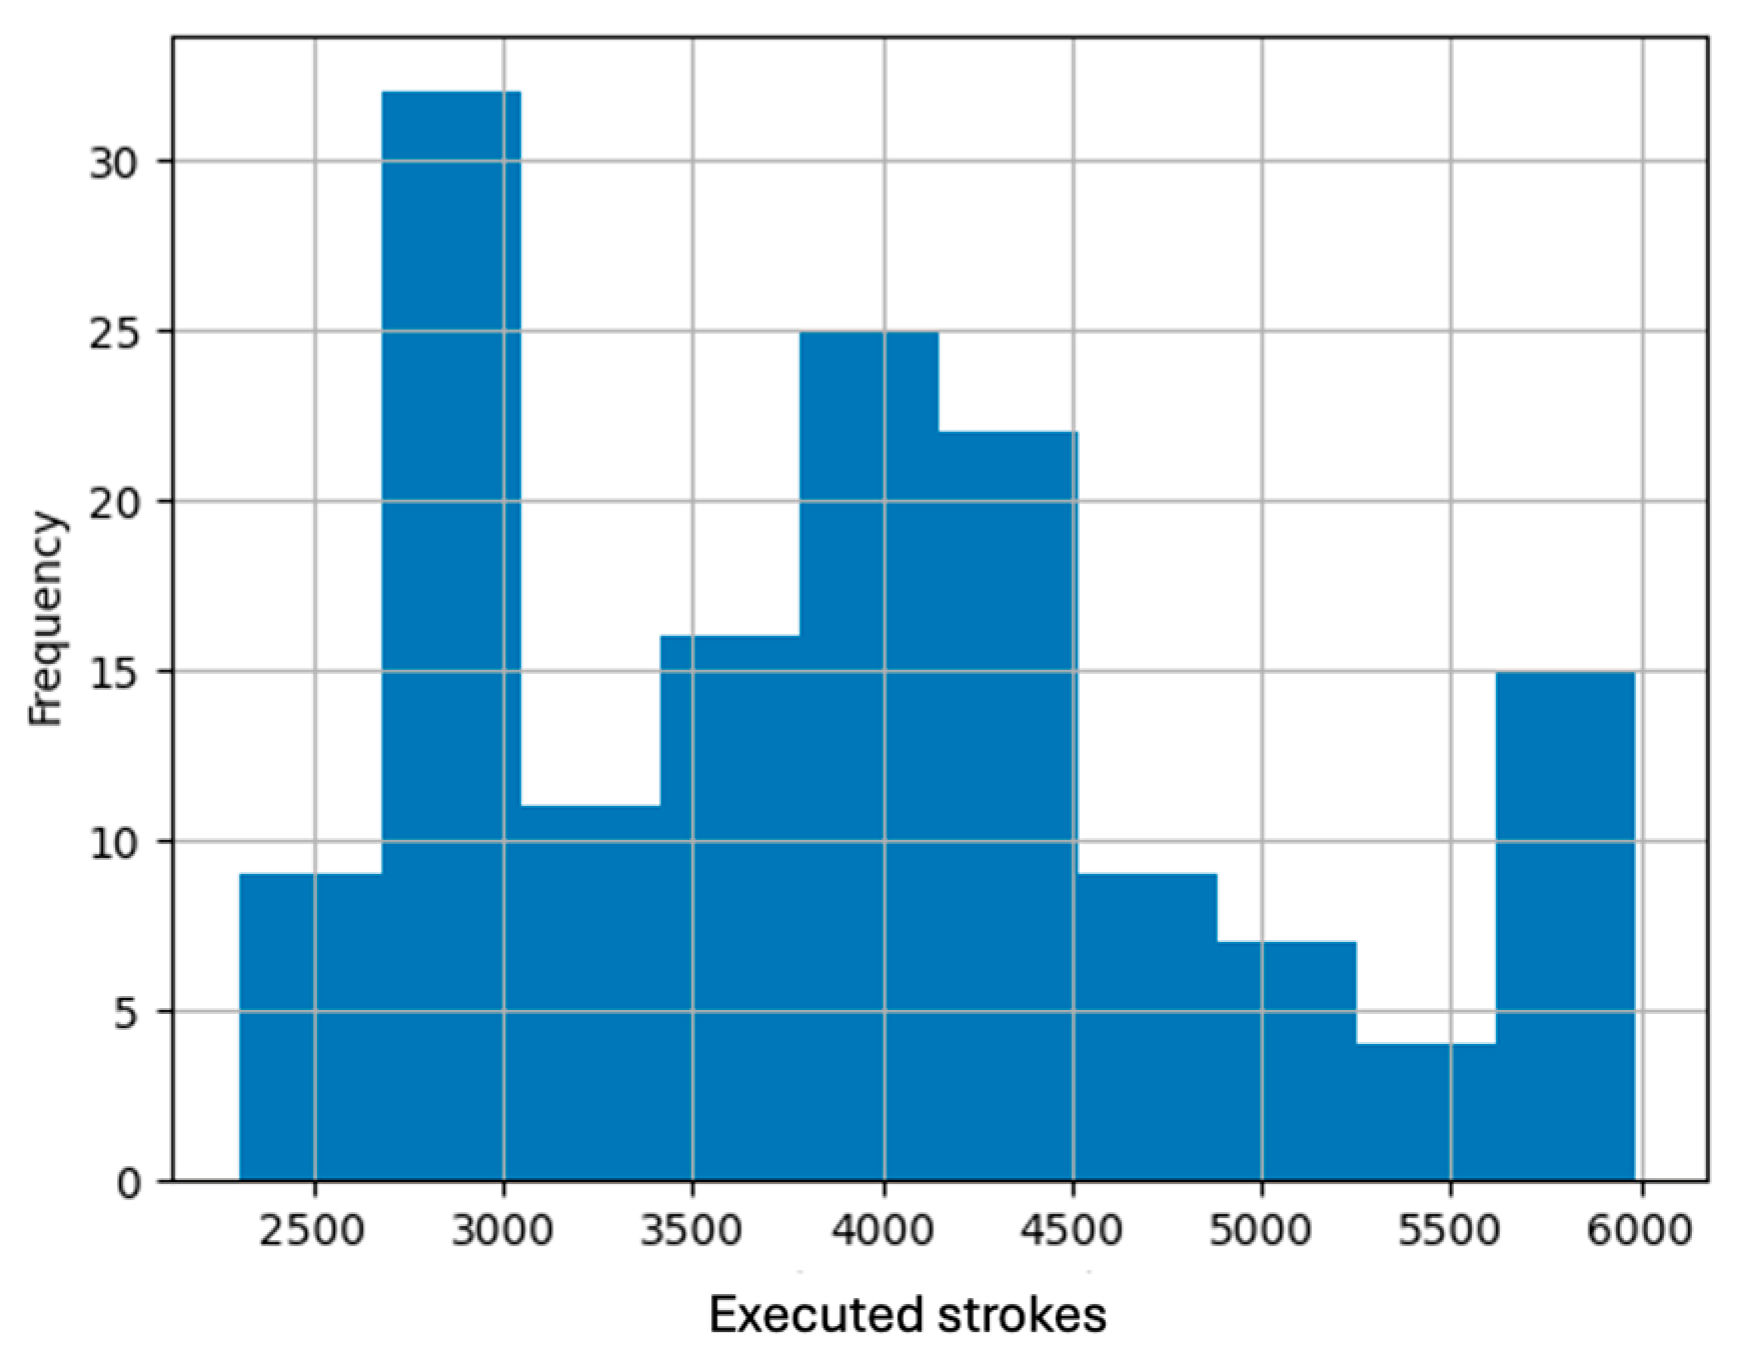
Figure 2.
Target variable boxplot. Source: Author, 2023.
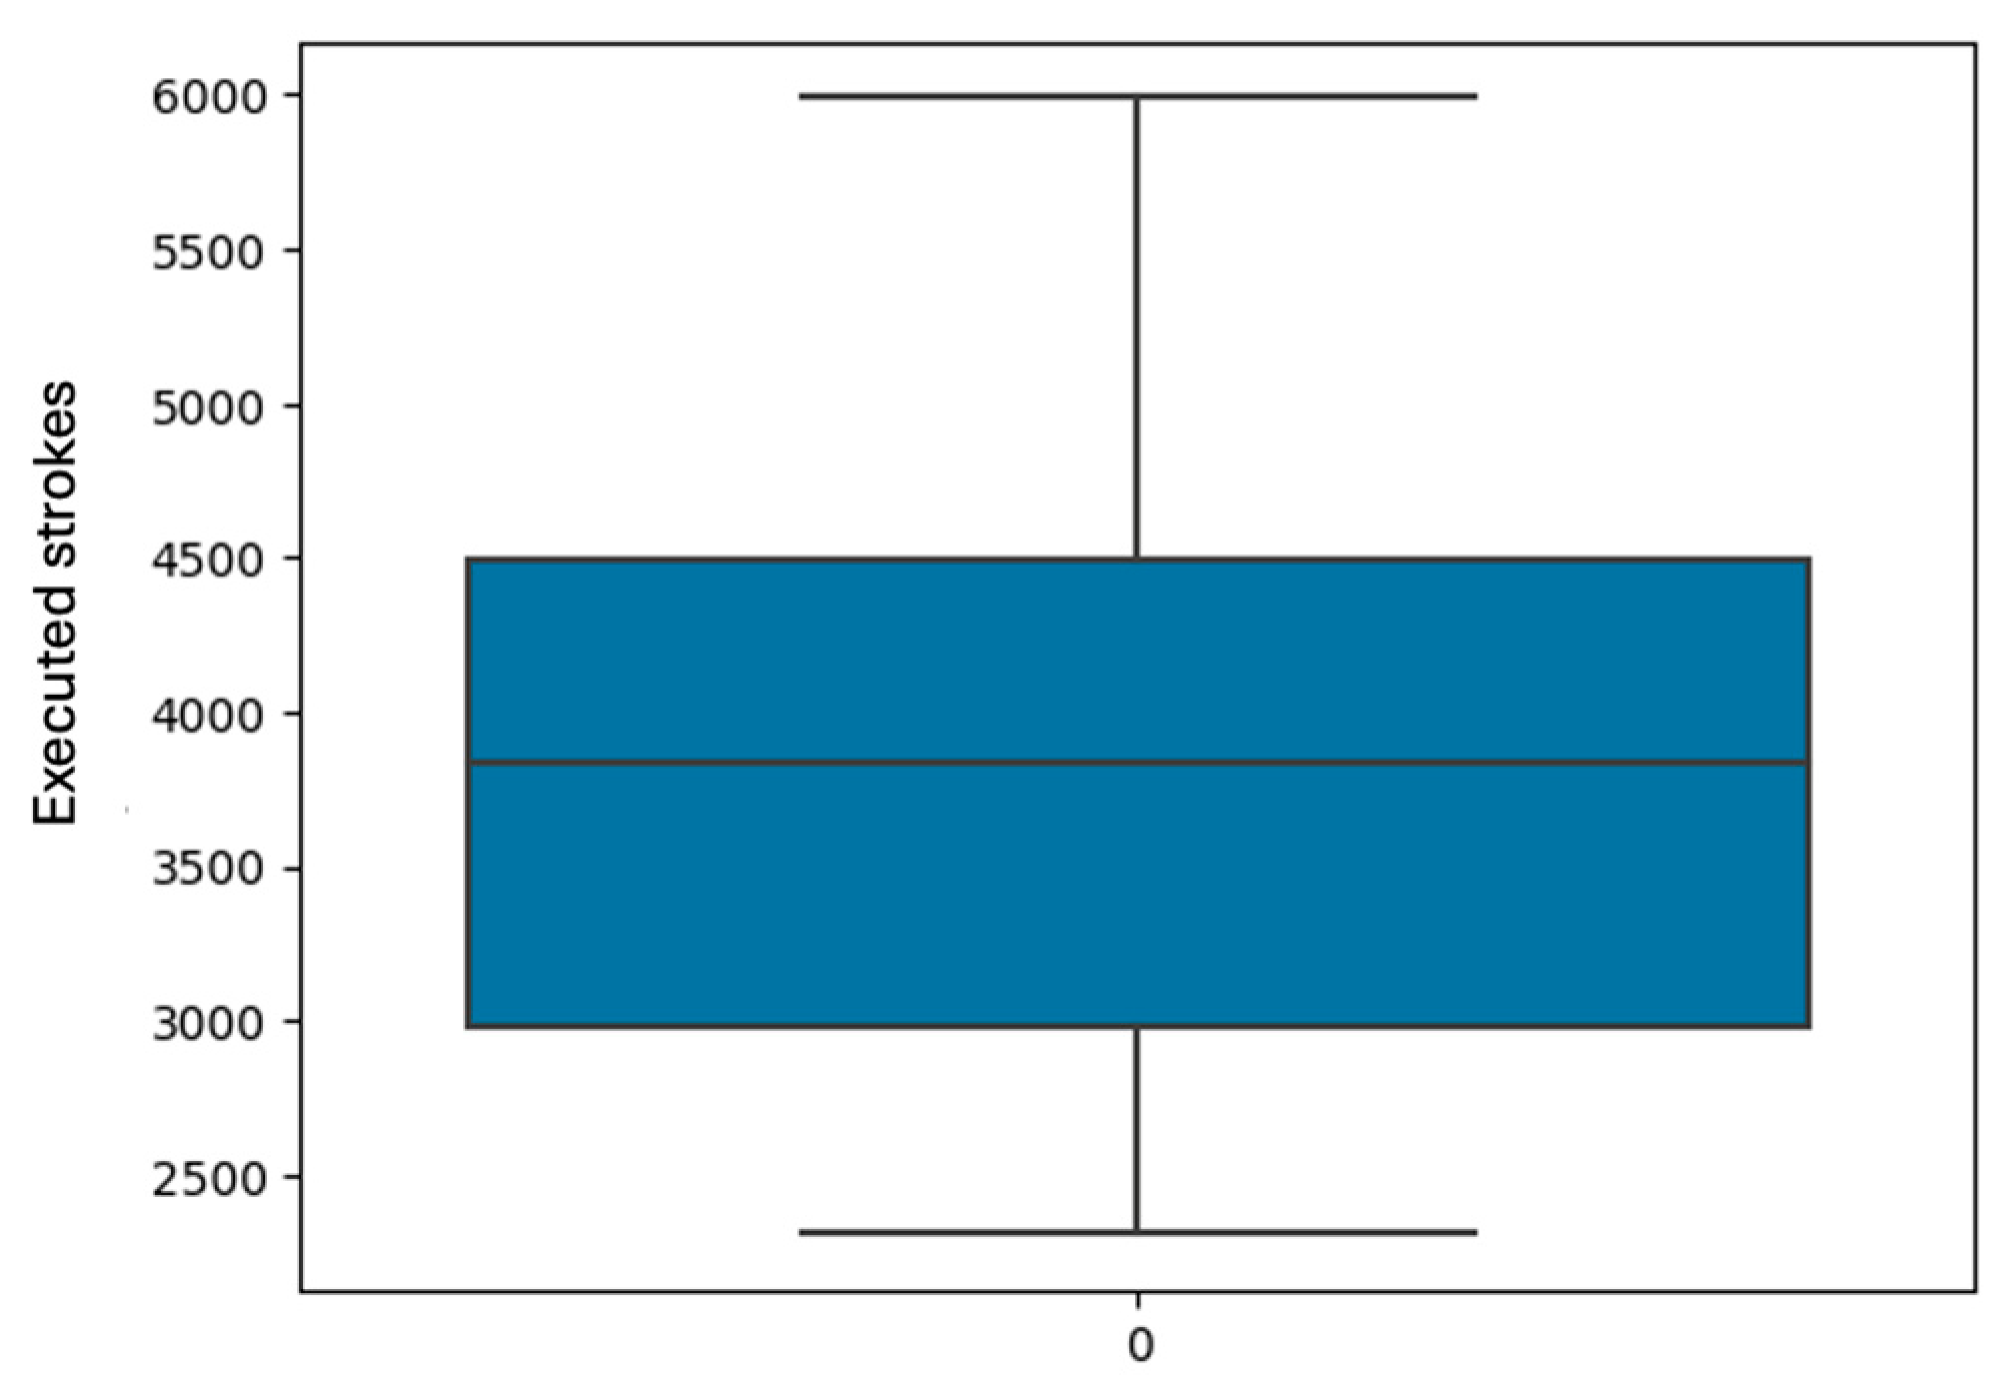
Table 1.
Pairwise comparison matrix between criteria.
| Criterias | MTBF | MTTR | Availability | Number of stops |
|---|---|---|---|---|
| MTBF | 3 | 3 | 1/7 | |
| MTTR | 1/3 | 1 | 3 | 1/9 |
| Availability | 1/3 | 1/3 | 1 | 1/9 |
| Number of stops | 7 | 9 | 9 | 1 |
| Totals | 8,6667 | 13,3333 | 16,0000 | 1,3651 |
Source: Author, 2023.
Table 2.
- Random consistency index table (RI).
| n | 1 | 2 | 3 | 4 | 5 | 6 | 7 | 8 | 9 | 10 | 11 | 12 | 13 | 14 | 15 |
| RI | 0 | 0 | 0,58 | 0,9 | 1,12 | 1,24 | 1,32 | 1,41 | 1,45 | 1,49 | 1,52 | 1,54 | 1,56 | 1,58 | 1,59 |
Source: Saaty, 2005.
Table 3.
Table of λmax and random index for dimensions greater than 15.
| n | 16 | 17 | 18 | 19 | 20 | 21 | 22 | 23 |
| RI | 1,5978 | 1,6086 | 1,6181 | 1,6265 | 1,6341 | 1,6409 | 1,6470 | 1,6526 |
| 24 | 25 | 26 | 27 | 28 | 29 | 30 | 31 | |
| 1,6577 | 1,6624 | 1,6667 | 1,6706 | 1,6743 | 1,6777 | 1,6809 | 1,6839 | |
| 32 | 33 | 34 | 35 | 36 | 37 | 38 | 39 | |
| 1,6867 | 1,6893 | 1,6917 | 1,6940 | 1,6992 | 1,6982 | 1,7002 | 1,7020 |
Sounce: [35].
Table 4.
Normalized pairwise comparison matrix between criteria.
| Criteria | MTBF | MTTR | Availability | Number of stops |
|---|---|---|---|---|
| MTBF | 0,1154 | 0,2250 | 0,1875 | 0,1047 |
| MTTR | 0,0385 | 0,0750 | 0,1875 | 0,0814 |
| Availability | 0,0385 | 0,0250 | 0,0625 | 0,0814 |
| Number of stops | 0,8077 | 0,6750 | 0,5625 | 0,7326 |
| Totals | 1,0000 | 1,0000 | 1,0000 | 1,0000 |
Source: Author, 2023.
Table 5.
- Relative Priority Vector.
| Criterias | Relative Priority Vector |
|---|---|
| MTBF | 0,1581 |
| MTTR | 0,0956 |
| Availability | 0,0518 |
| Number of stops | 0,6944 |
| Totals | 1,0000 |
Source: Author, 2023.
Table 6.
Vector λ.
| Criteria | Λ |
|---|---|
| MTBF | 4,4243 |
| MTTR | 3,9856 |
| Availability | 4,1199 |
| Number of stops | 4,5047 |
| 4,2586 |
Source: Author, 2023.
Table 7.
CI and CR Results.
| CI | CR |
|---|---|
| 0,0862 | 0,0958 |
Source: Author, 2023.
Table 8.
Table relative priorities of alternatives in relation to each criterion.
| Tools | MTBF | MTTR | Availability | Number of stops |
|---|---|---|---|---|
| FET35927330 | 0,0037 | 0,0197 | 0,0081 | 0,0067 |
| FET85266918 | 0,0120 | 0,0110 | 0,0081 | 0,0105 |
| FET65636346 | 0,0067 | 0,0110 | 0,0081 | 0,0105 |
| FET85620376 | 0,0525 | 0,0110 | 0,0193 | 0,0067 |
| ... | ... | ... | ... | ... |
| FET23304797 | 0,0525 | 0,0412 | 0,0476 | 0,0105 |
| FET91903962 | 0,0525 | 0,0412 | 0,1667 | 0,0193 |
| FET78749352 | 0,0525 | 0,0110 | 0,0193 | 0,0193 |
| FET79585955 | 0,0525 | 0,0197 | 0,0476 | 0,0193 |
Source: Author, 2023.
Table 9.
CI and CR result for the parity preference matrices of global alternatives.
| Criteria | λmax | CI | CR |
|---|---|---|---|
| MTBF - Alternatives | 39,3865 | 0,1632 | 0,0965 |
| MTTR - Alternatives | 35,3610 | 0,0412 | 0,0244 |
| Availability - Alternatives | 37,0011 | 0,0909 | 0,0538 |
| Number of stops - Alternatives | 37,3241 | 0,0595 | 0,0595 |
Source: Author, 2023.
Table 10.
Composite priority of alternatives.
| Tools | Composite priority |
|---|---|
| FET35927330 | 0,0076 |
| FET85266918 | 0,0107 |
| FET65636346 | 0,0098 |
| FET85620376 | 0,0150 |
| ... | ... |
| FET23304797 | 0,0220 |
| FET91903962 | 0,0343 |
| FET78749352 | 0,0237 |
| FET79585955 | 0,0260 |
Source: Author, 2023.
Table 11.
Classification of alternatives.
| Priorização | Ferramental | Prioridade composta % |
|---|---|---|
| 1º | FET68553464 | 9,3% |
| 2º | FET18064297 | 8,0% |
| 3º | FET82469803 | 7,5% |
| 4º | FET74886320 | 7,5% |
| 5º | FET32107266 | 7,4% |
| ... | ... | ... |
| 29º | FET77832561 | 0,8% |
| 34º | FET62619706 | 0,7% |
Source: Author, 2023.
Table 12.
Failure mode with the highest RPN.
| Failure Modes Potential | Potential Failure Effects | Severity | Classification | Causes and Potential Failure Mechanisms | Current preventive process controls | Occurrence | Current process detection controls | Detection | NRP |
| Crack in the part | Inability to assemble the part | 7 | CIC | Poor sharpening / Punch and die wear | Punch control during preventive maintenance | 6 | Standard Method: Visual Inspection | 5 | 210 |
| Crack in the part | Reduction in component lifespan | 7 | CIC | Lack of clearance between punch and die | Pressure frame adjustment on machine during calibration operation | 6 | Standard Method: Visual Inspection | 5 | 210 |
| Crack in the part | Premature wear | 7 | CIC | Burrs on the cutting line | Adjustment of punch and die during cutting operation | 6 | Standard Method: Visual Inspection | 5 | 210 |
Source: Author, 2023.
Table 13.
Tools - Dataset.
| Blows | OP 20 SUP | OP 30 SUP | ... | Height B1 (mm) | Height B2 (mm) | ... | Height B6 (mm) |
|---|---|---|---|---|---|---|---|
| 2983 | 120 | 120 | ... | 19,00 | 19,00 | ... | 19,00 |
| 2927 | 120 | 120 | ... | 19,00 | 19,15 | ... | 19,00 |
| 6588 | 150 | 110 | ... | 19,00 | 19,15 | ... | 19,00 |
| 6441 | 150 | 120 | ... | 19,00 | 19,00 | ... | 19,00 |
| 6138 | 120 | 120 | ... | 19,00 | 19,00 | ... | 19,00 |
| ... | ... | ... | ... | ... | |||
| 2713 | 120 | 0,8% | ... | 19,00 | 19,00 | ... | 19,00 |
| 3712 | 120 | 0,8% | ... | 19,00 | 19,00 | ... | 19,00 |
| 6400 | 120 | 0,8% | ... | 11,90 | 19,15 | ... | 19,00 |
| 2571 | 120 | 0,8% | ... | 19,00 | 19,00 | ... | 19,00 |
| 5783 | 120 | 0,8% | ... | 11,90 | 19,15 | ... | 19,00 |
| 5283 | 120 | 0,7% | ... | 19,00 | 19,00 | ... | 19,00 |
Source: Author, 2023.
Table 14.
Error metrics for evaluated models.
| MAE | MAPE | MSE | RMSE | |
|---|---|---|---|---|
| Gradient Boosting | 568.26 | 0.17 | 577792.10 | 760.13 |
| KNN | 667.42 | 0.20 | 699428.12 | 836.32 |
| SVM | 621.02 | 0.18 | 651951.23 | 807.43 |
| Random Forest | 568.19 | 0.17 | 577750.50 | 760.10 |
| Linear Regression | 569.83 | 0.18 | 577750.50 | 760.10 |
Source: Author, 2023.
Table 15.
Error metrics for the chosen model on new data.
| MAE | MAPE | MSE | RMSE | |
|---|---|---|---|---|
| Random Forest | 896.58 | 0.20 | 1280554.39 | 1131.62 |
Source: Author, 2023.
Disclaimer/Publisher’s Note: The statements, opinions and data contained in all publications are solely those of the individual author(s) and contributor(s) and not of MDPI and/or the editor(s). MDPI and/or the editor(s) disclaim responsibility for any injury to people or property resulting from any ideas, methods, instructions or products referred to in the content. |
© 2025 by the authors. Licensee MDPI, Basel, Switzerland. This article is an open access article distributed under the terms and conditions of the Creative Commons Attribution (CC BY) license (http://creativecommons.org/licenses/by/4.0/).
Copyright: This open access article is published under a Creative Commons CC BY 4.0 license, which permit the free download, distribution, and reuse, provided that the author and preprint are cited in any reuse.


