
Submitted:
15 September 2024
Posted:
16 September 2024
You are already at the latest version
Abstract
CpG islands typically occur at or near the transcription start site of genes, particularly housekeeping genes, invertebrates. Normally a C (cytosine) base followed immediately by a G (guanine) base (a CpG) is rare in vertebrate DNA because the cytosines in such an arrangement tend to be methylated. Described DNA methylation mediated gene silencing occurs by direct inhibition of transcription factor binding to their relative sites and by recruitment of methyl binding domain proteins. The present study aims at predicting the CpG islands using Perl and R environment codes. The results indicated that the average length of the CpG islands in the X-chromosomes is comparable, however, the number of CpG islands is three times in swine (13539), as compared to that of rats (4465). The average CpG percent and the Average Guanine+Cytosine percent are also similar in the X-Chromosomes of both species. Similar results were evident for Y-Chromosome. The results obtained need validation through wet-lab experimentation.
Keywords:
CpG island
; in silico prediction
; X-chromosome
; Y-chromosome
Introduction
CpG islands are the developed key genomic features
in epigenetic research. The role of DNA methylation can be discovered by
characterizing their methylation state. By mapping of DNA methylation in
various cell types, it was clear the lack of methylation in the majority of CpG
islands, but numerous cases were found of differentially methylated, or even
constitutively methylated regions that are well defined as CpG islands based on
their sequence content (Dindot et al., 2009). Antequera and Bird (1993)
suggested that mammalian promoters belong to two different categories in terms
of base composition and DNA methylation. The region is devoid of methylation
that has a higher G+C content than the genome average, while the rest have a
methylation pattern and base composition indistinguishable from bulk DNA.
Regulatory regions are made up of a variable number of short modules to which
activators and repressors bind in such a way that their integrated
contributions result in the correct expression of the gene. Despite the
sequence diversity among promoters, genes transcribed by RNA polymerase II can
be classified in two different and mutually exclusive groups according to the
distribution of CpG dinucleotides across their 5’ ends. The frequency of CpGs
is the same as the genome average, which is roughly one of every 100
nucleotides. Genes belonging to the other group are surrounded by a region ~ 1
kb long where the frequency of CpGs is approximately 10 times higher than the
genome average. CpG involves transcriptional regulation and their potential use
as markers to localize genes in genome sequences. The contrast between the
island and non-island DNA is so sharp because CpGs occur at the expected
frequency at CpG islands based on their G+C content, whereas CpGs in bulk DNA
is 20% of their expected frequency, due to the spontaneous deamination (Suzuki
and Bird (2008), Illingworth et al. (2008), Futscher (2002) ).
Materials and Methods
The present study aims to identify CpG islands using
a comparative biocomputational approach. The sequence of in X Chr and Y Chr Rattus
norvegicus and Sus scrofa will
be downloaded from NCBI Genome (https://www.ncbi.nlm.nih.gov/genome). The
downloaded chromosome sequences were subjected to notepad++ for further
modification. Then the sequences were subjected to Perl code for predicting the
statistical data. The statistical data were subjected to an R programming
environment for further cleaning and getting the predicted data.
Results and Discussion
The average island length of Rattus
norvegicus in the
X-chromosome is 596.19 and Sus scrofa has an average island length of 580.44 it means Rattus norvegicus has
a greater average island length as compared to Sus scrofa as shown in the table. Variation in island length is more in both
species. The standard error of the CpG island of the X-chromosome of Rattus norvegicus is 3.68 and in Sus scrofa the value is2.02. It means Rattus norvegicus has a
greater variation in their genome. Island number varies in both species.
X-chromosome of Rattus norvegicus island
number is 4465 and in Sus scrofa the value is 13539. It means Sus scrofa has more island number as
compared to Rattus norvegicus. Average G+C
concentration is close to each other in both species. In the X-chromosome of Sus
scrofa, the value is54.5 and the
case of the Rattus norvegicus value is 53.03. The average CpG concentration is close to each other as shown in Table 1. The value of average
CpG concentration in Rattus norvegicus is 4.94 and in the
case of Sus scrofa it is 5.13. It means there is a small difference in the value of both species.
The average ratio (Observed CpG/Expected CpG) is 0.73 in Rattus
norvegicus in the case of Sus
scrofa 0.7. It means the value
of the average ratio of Rattus norvegicus is
greater than the value of Sus scrofa. We have
got the minimum island length which is the same in both species. Both species
have a similar value that is 500. The maximum island length value of Sus scrofa is 5639 and in the case of Rattus
norvegicus that is 4484. It means Sus
scrofa has a maximum island length as compared to Rattus norvegicus.

Table 1.
Final parameters of CpG island in in X-chromosome of Rattus norvegicus and Sus scrofa.
| Features | Rat | Swine |
|---|---|---|
| Average Island Length | 596.19 | 580.44 |
| Standard error (Island Length) | 3.68 | 2.02 |
| Island Number | 4465 | 13539 |
| Average G+ C percent | 53.03 | 54.5 |
| Standard error G+ C percent | 0.07 | 0.05 |
| Average CpG percent | 4.94 | 5.13 |
| Standard error CpG percent | 0.01 | 0.01 |
| Average Ratio | 0.73 | 0.70 |
| Standard error Ratio | 0 | 0 |
| Minimum Island length | 500 | 500 |
| Maximum Island length | 4484 | 5639 |
The average island length of Rattus
norvegicus in Y-chromosome is 560.46 and Sus scrofa has an average island
length of 567.28 it means Sus scrofa has a greater average island length as compared to Rattus
norvegicus as shown in the table. Variation in
island length is more in both species. The standard error of the CpG island of
Y-chromosome of Rattus norvegicus is 12.67 and in Sus scrofa the value is 4.55. It means Rattus norvegicus has a greater variation in their genome. Island number varies in
both species. Y-chromosome of Rattus norvegicus island number is 110 and in Sus
scrofa the value is 1820. It means Sus scrofa has more island number as
compared to Rattus norvegicus. Average G+C
concentration is close to each other in both species. In the Y-chromosome of Sus
scrofa the value is 53.86 and in
the case of the Rattus norvegicus value is 52.7. The average CpG concentration is close to each other as shown in Table 2. The value of average
CpG concentration in Rattus norvegicus is 4.73 and in the case of Sus scrofa, it is
4.96. It means there is a small difference in the value
of both species. The average ratio (Observed CpG/Expected CpG) is 0.7 in
Rattus norvegicus in the case of Sus scrofa 0.7. We have got the minimum island length which is the same in
both species. Both species have a similar value that is 500. The maximum island
length value of Sus scrofa is 2650 and in the case of Rattus norvegicus, that is 1059. It means Sus scrofa has a maximum island length as compared to Rattus
norvegicus.
Table 2.
Final parameters of CpG island in in Y-chromosome of Rattus norvegicus and Sus scrofa.
| Features | Rat | Swine |
|---|---|---|
| Average Island Length | 560.46 | 567.28 |
| Standard error Island Length | 12.67 | 4.55 |
| Island Number | 110 | 1820 |
| Average G+ C percent | 52.7 | 53.86 |
| Standard error G+ C percent | 0.37 | 0.11 |
| Average CpG percent | 4.73 | 4.96 |
| Standard error CpG percent | 0.06 | 0.02 |
| Average Ratio | 0.7 | 0.7 |
| Standard error Ratio | 0.01 | 0 |
| Minimum Island length | 500 | 500 |
| Maximum Island length | 1059 | 2650 |
Figure 1.
G+C% of Rattus norvegicus in X-chromosome, (B) G+C% of Sus scrofa in X-chromosome. The X-axis of the graph describes the length of the chromosome. Where e is the exponential constant, for example, 5.0e+07 can be written as 5*107. On the Y-axis, the graph shows the G+C%. At some positions, we have obtained the higher G+C% whereas at some positions we have obtained the lower G+C%.
Figure 1.
G+C% of Rattus norvegicus in X-chromosome, (B) G+C% of Sus scrofa in X-chromosome. The X-axis of the graph describes the length of the chromosome. Where e is the exponential constant, for example, 5.0e+07 can be written as 5*107. On the Y-axis, the graph shows the G+C%. At some positions, we have obtained the higher G+C% whereas at some positions we have obtained the lower G+C%.
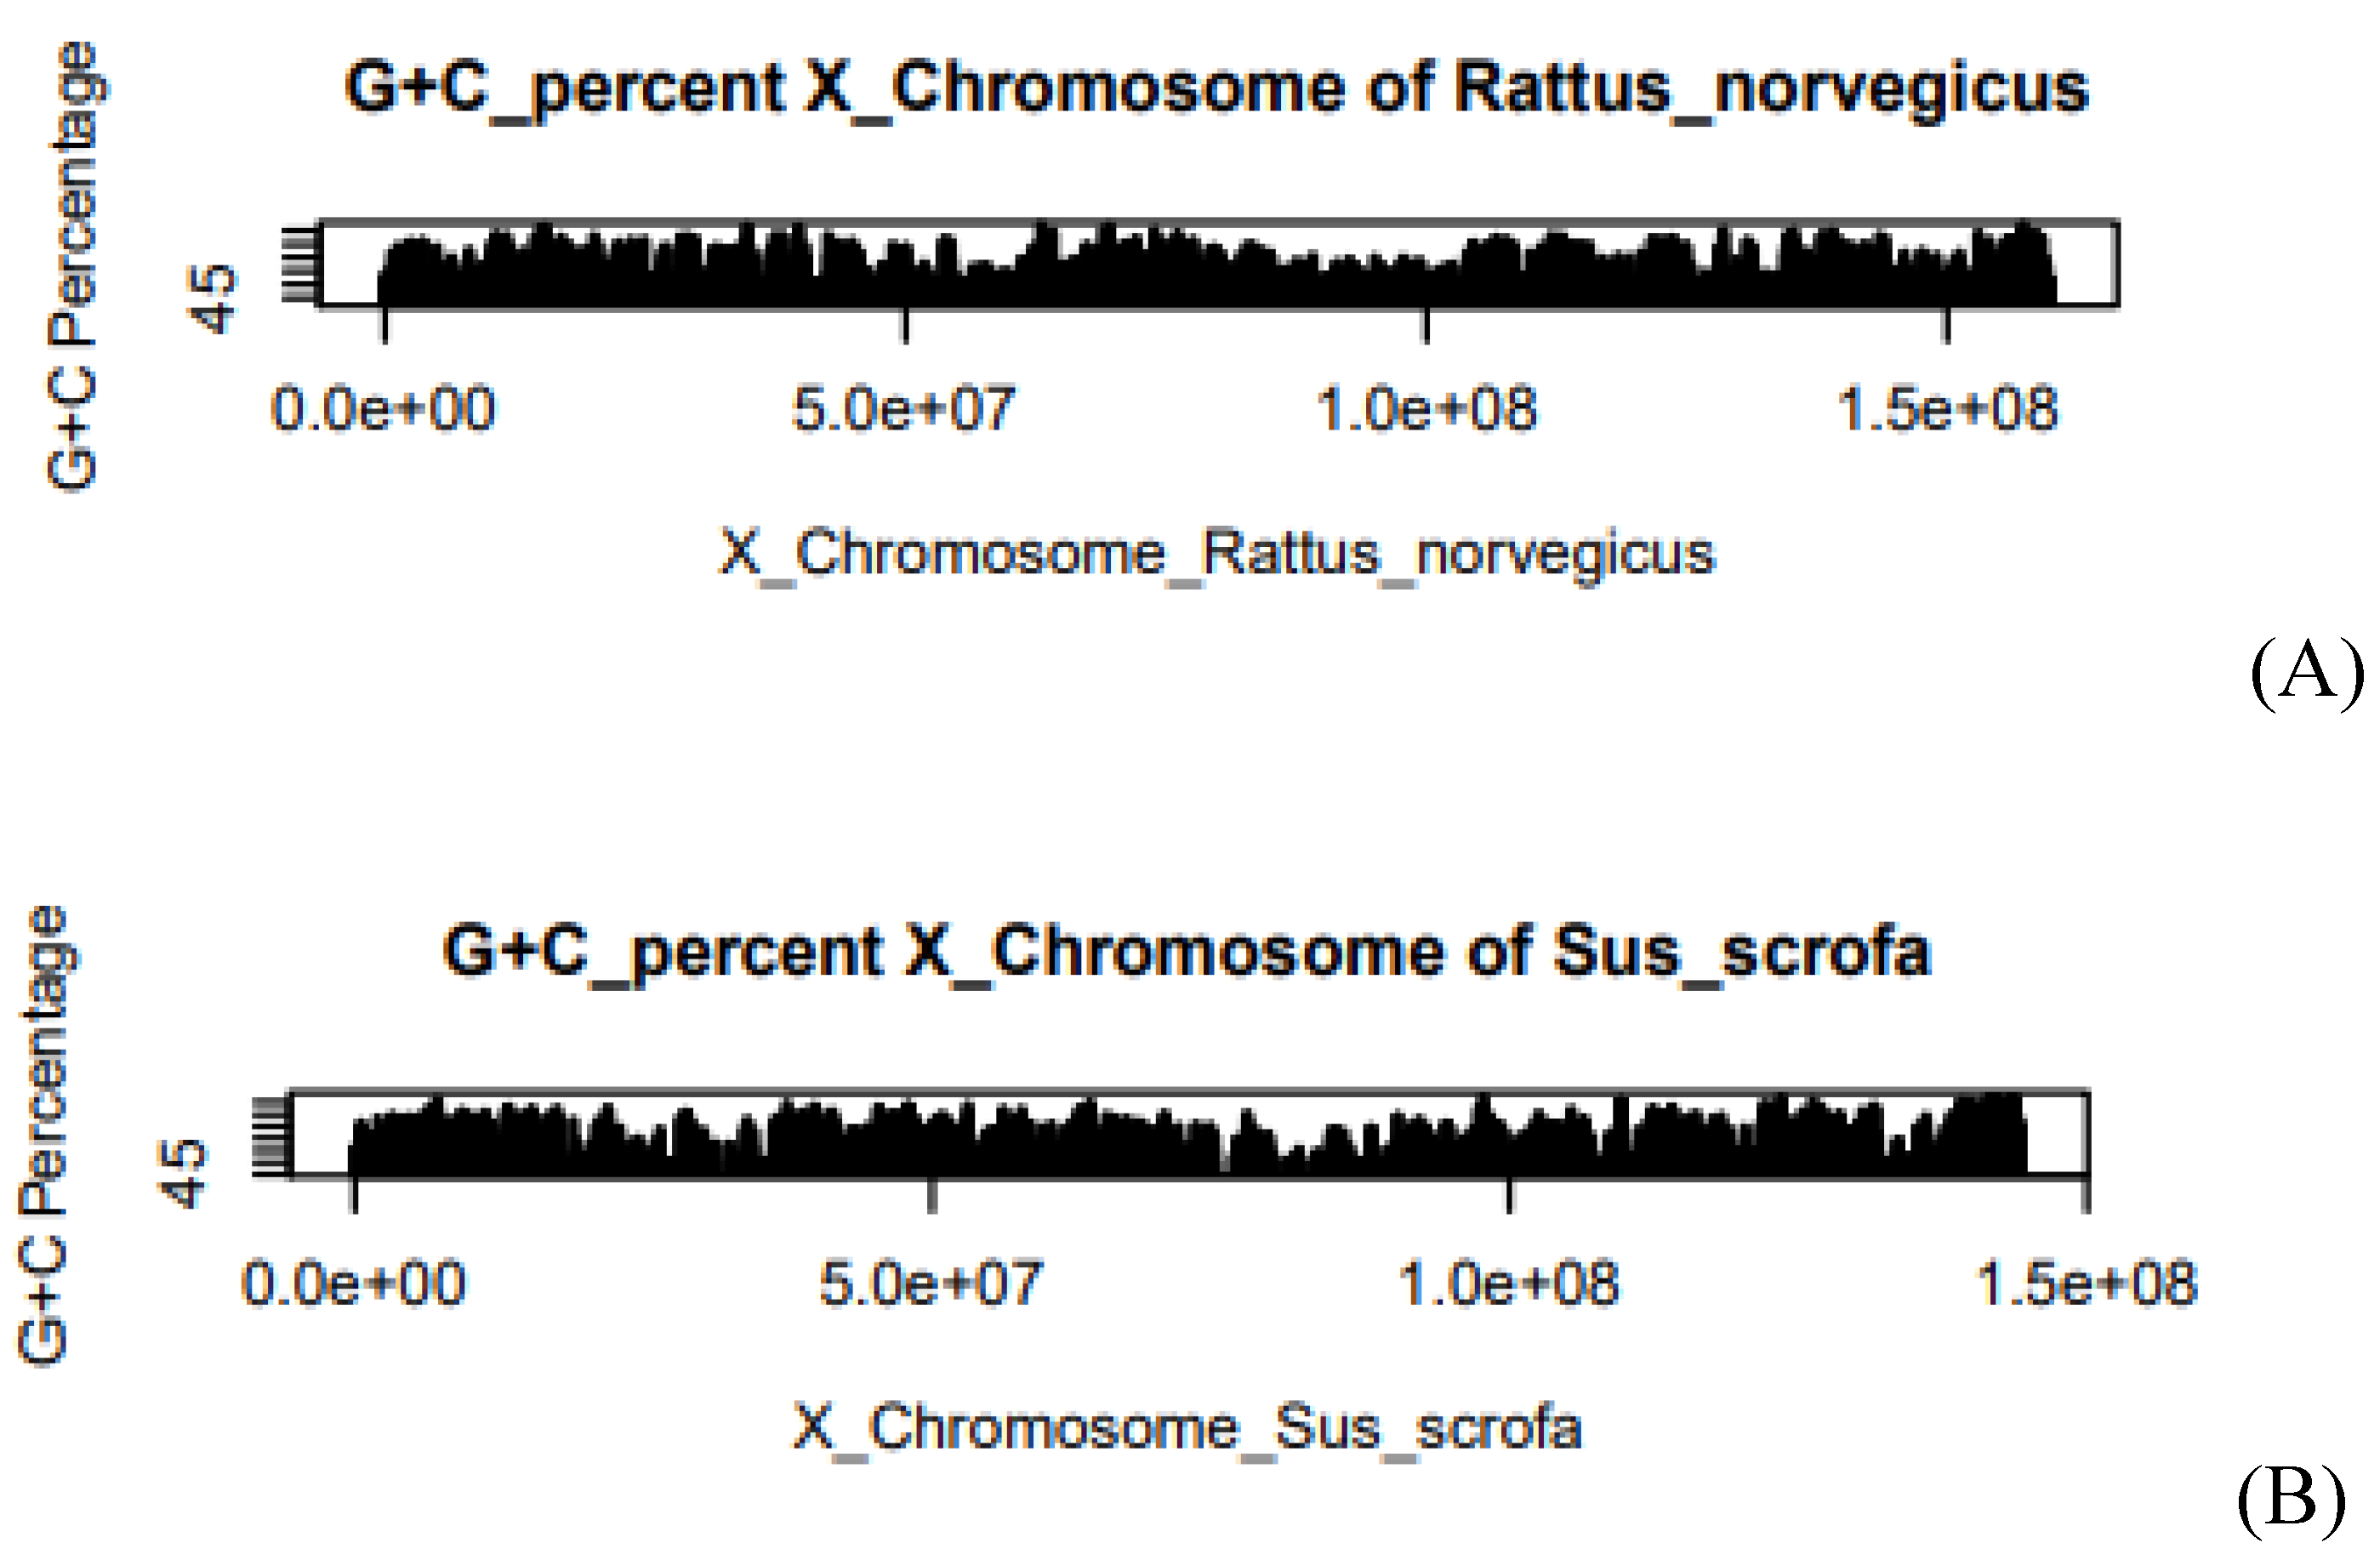
Figure 2.
(A) G+C% of Rattus norvegicus in Y-chromosome, (B) G+C% of Sus scrofa in Y-chromosome. The X-axis of the graph describes the length of the chromosome. Where e is the exponential constant, for example, 5.0e+07 can be written as 5*107. On the Y-axis, the graph shows the G+C%. At some positions, we have obtained the higher G+C% whereas at some positions we have obtained the lower G+C%.
Figure 2.
(A) G+C% of Rattus norvegicus in Y-chromosome, (B) G+C% of Sus scrofa in Y-chromosome. The X-axis of the graph describes the length of the chromosome. Where e is the exponential constant, for example, 5.0e+07 can be written as 5*107. On the Y-axis, the graph shows the G+C%. At some positions, we have obtained the higher G+C% whereas at some positions we have obtained the lower G+C%.
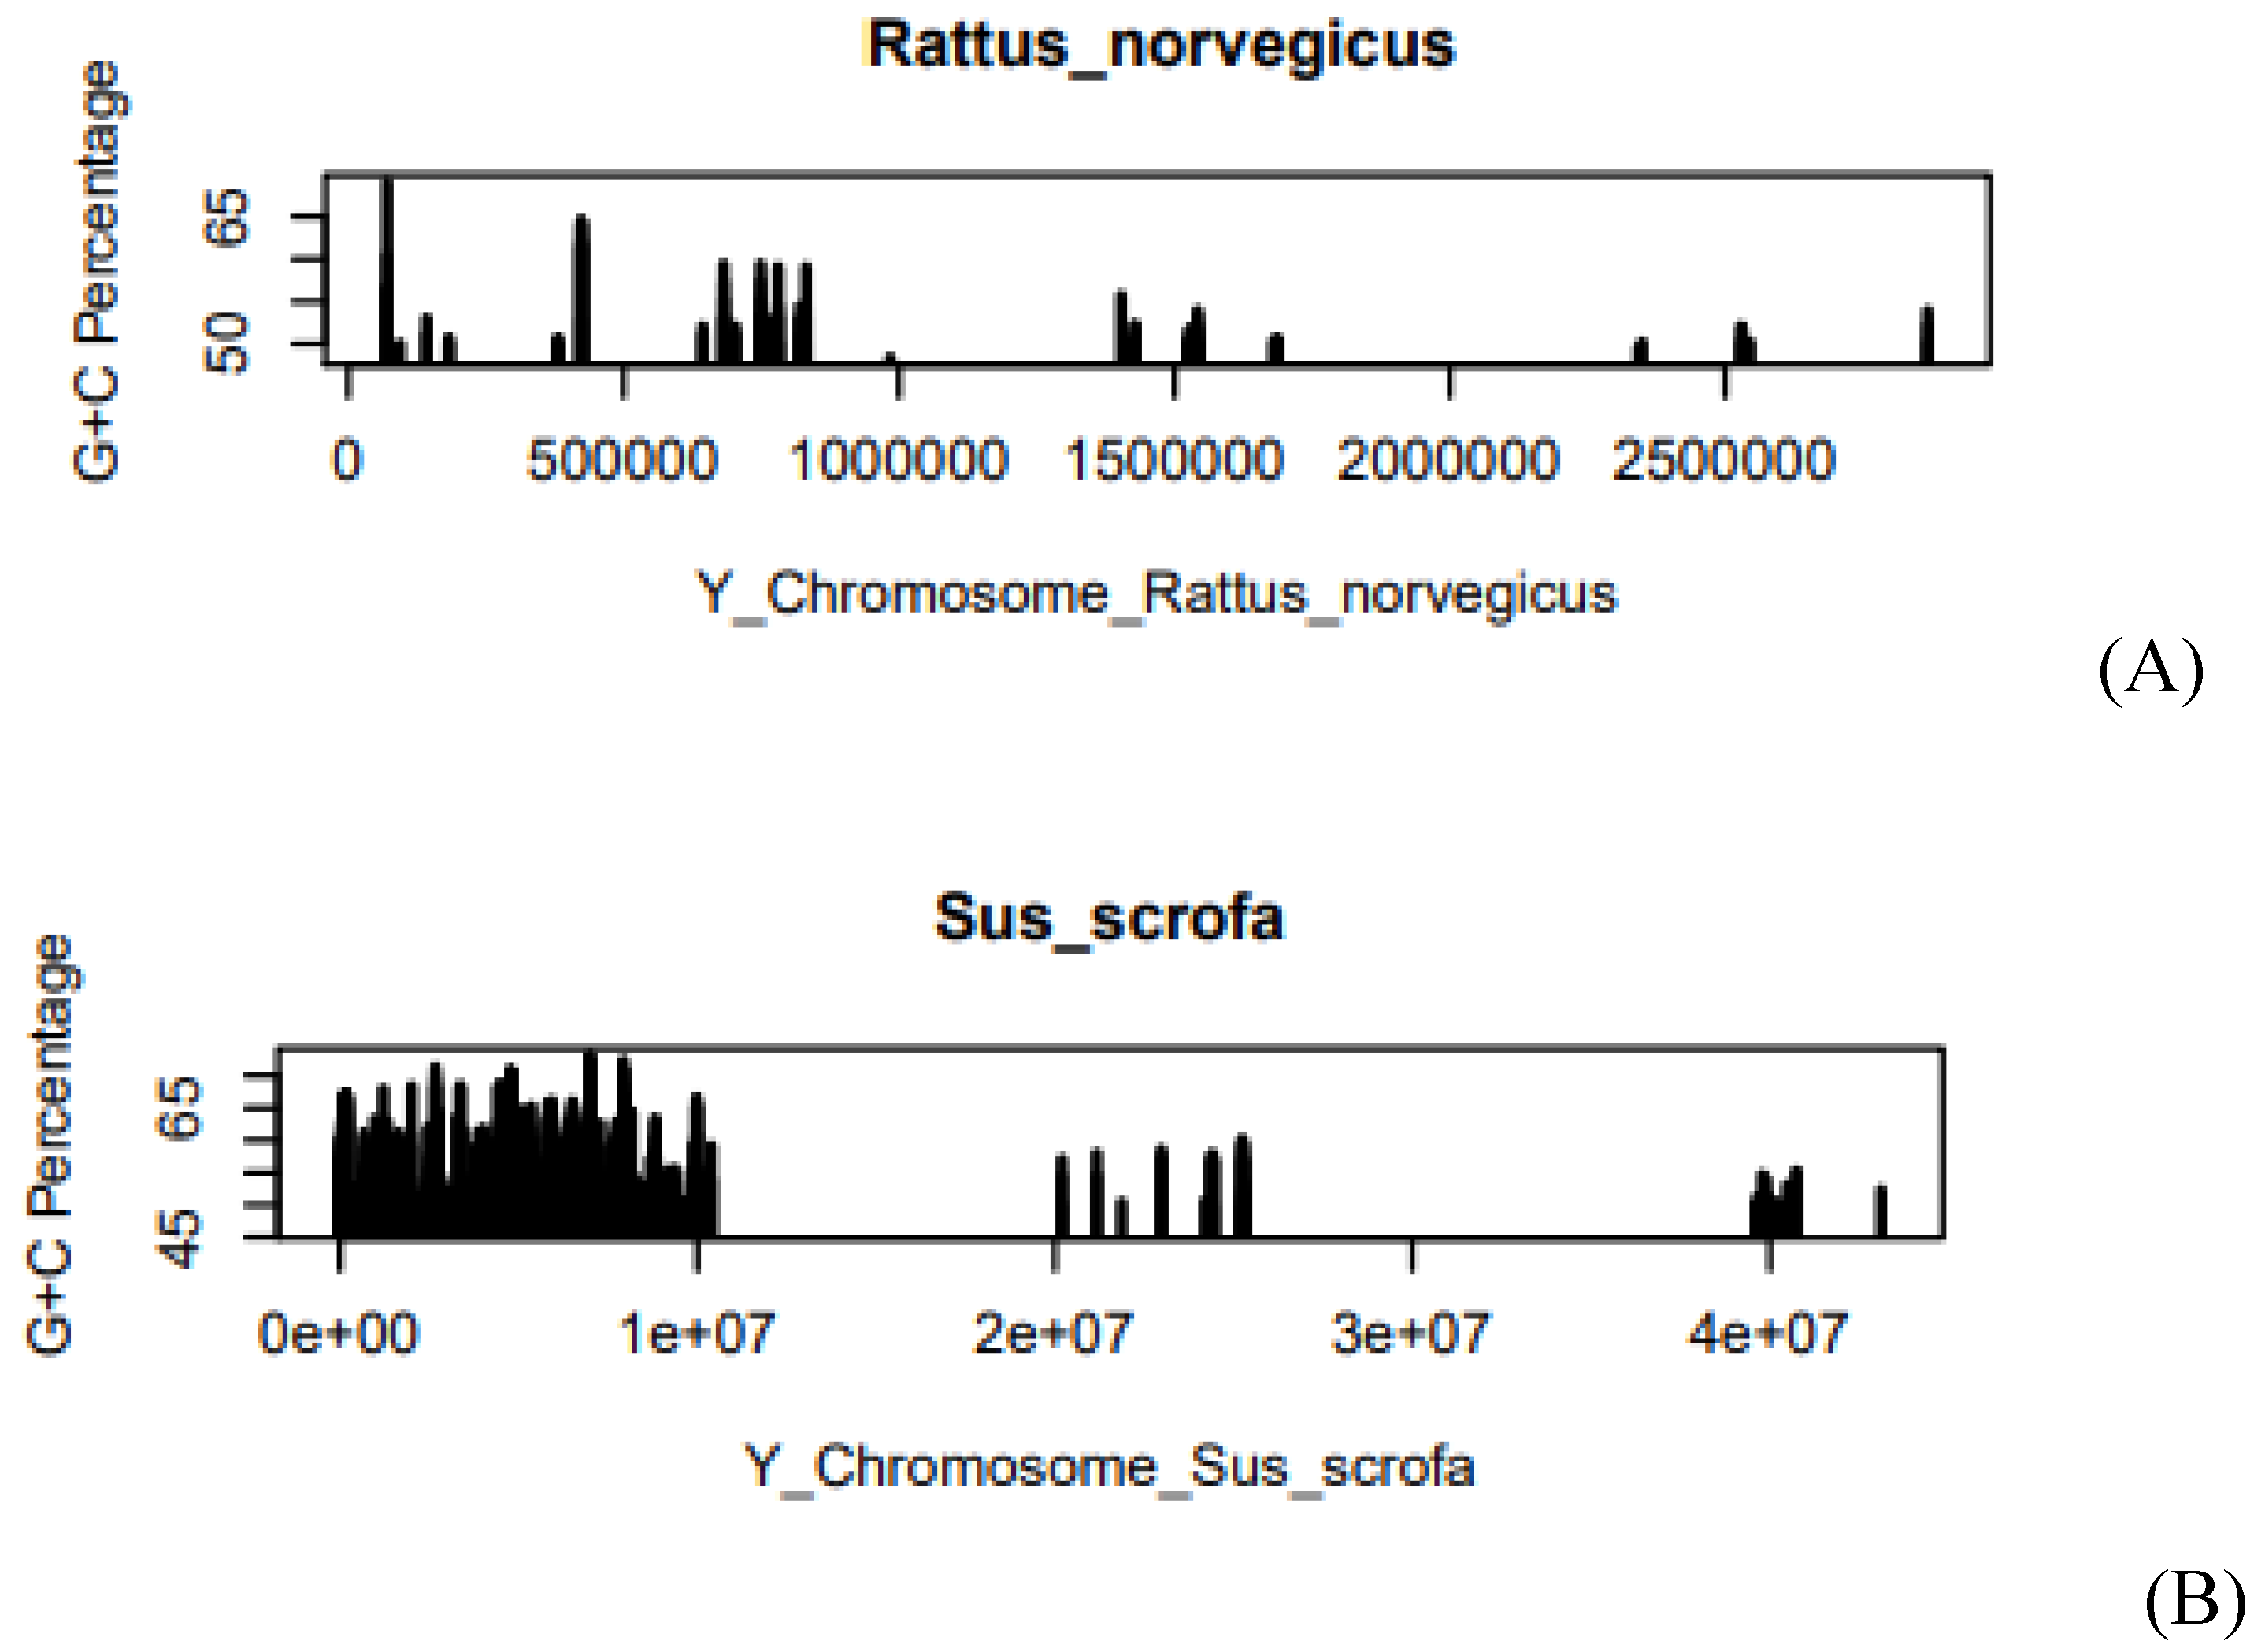
Figure 3.
(A) CpG Percentage of Rattus norvegicus in X-chromosome, (B) CpG Percentage of Sus scrofa in X-chromosome. The X-axis of the graph describes the length of the chromosome. Where e is the exponential constant, for example, 5.0e+07 can be written as 5*107. On the Y-axis, the graph shows the CpG Percentage.
Figure 3.
(A) CpG Percentage of Rattus norvegicus in X-chromosome, (B) CpG Percentage of Sus scrofa in X-chromosome. The X-axis of the graph describes the length of the chromosome. Where e is the exponential constant, for example, 5.0e+07 can be written as 5*107. On the Y-axis, the graph shows the CpG Percentage.
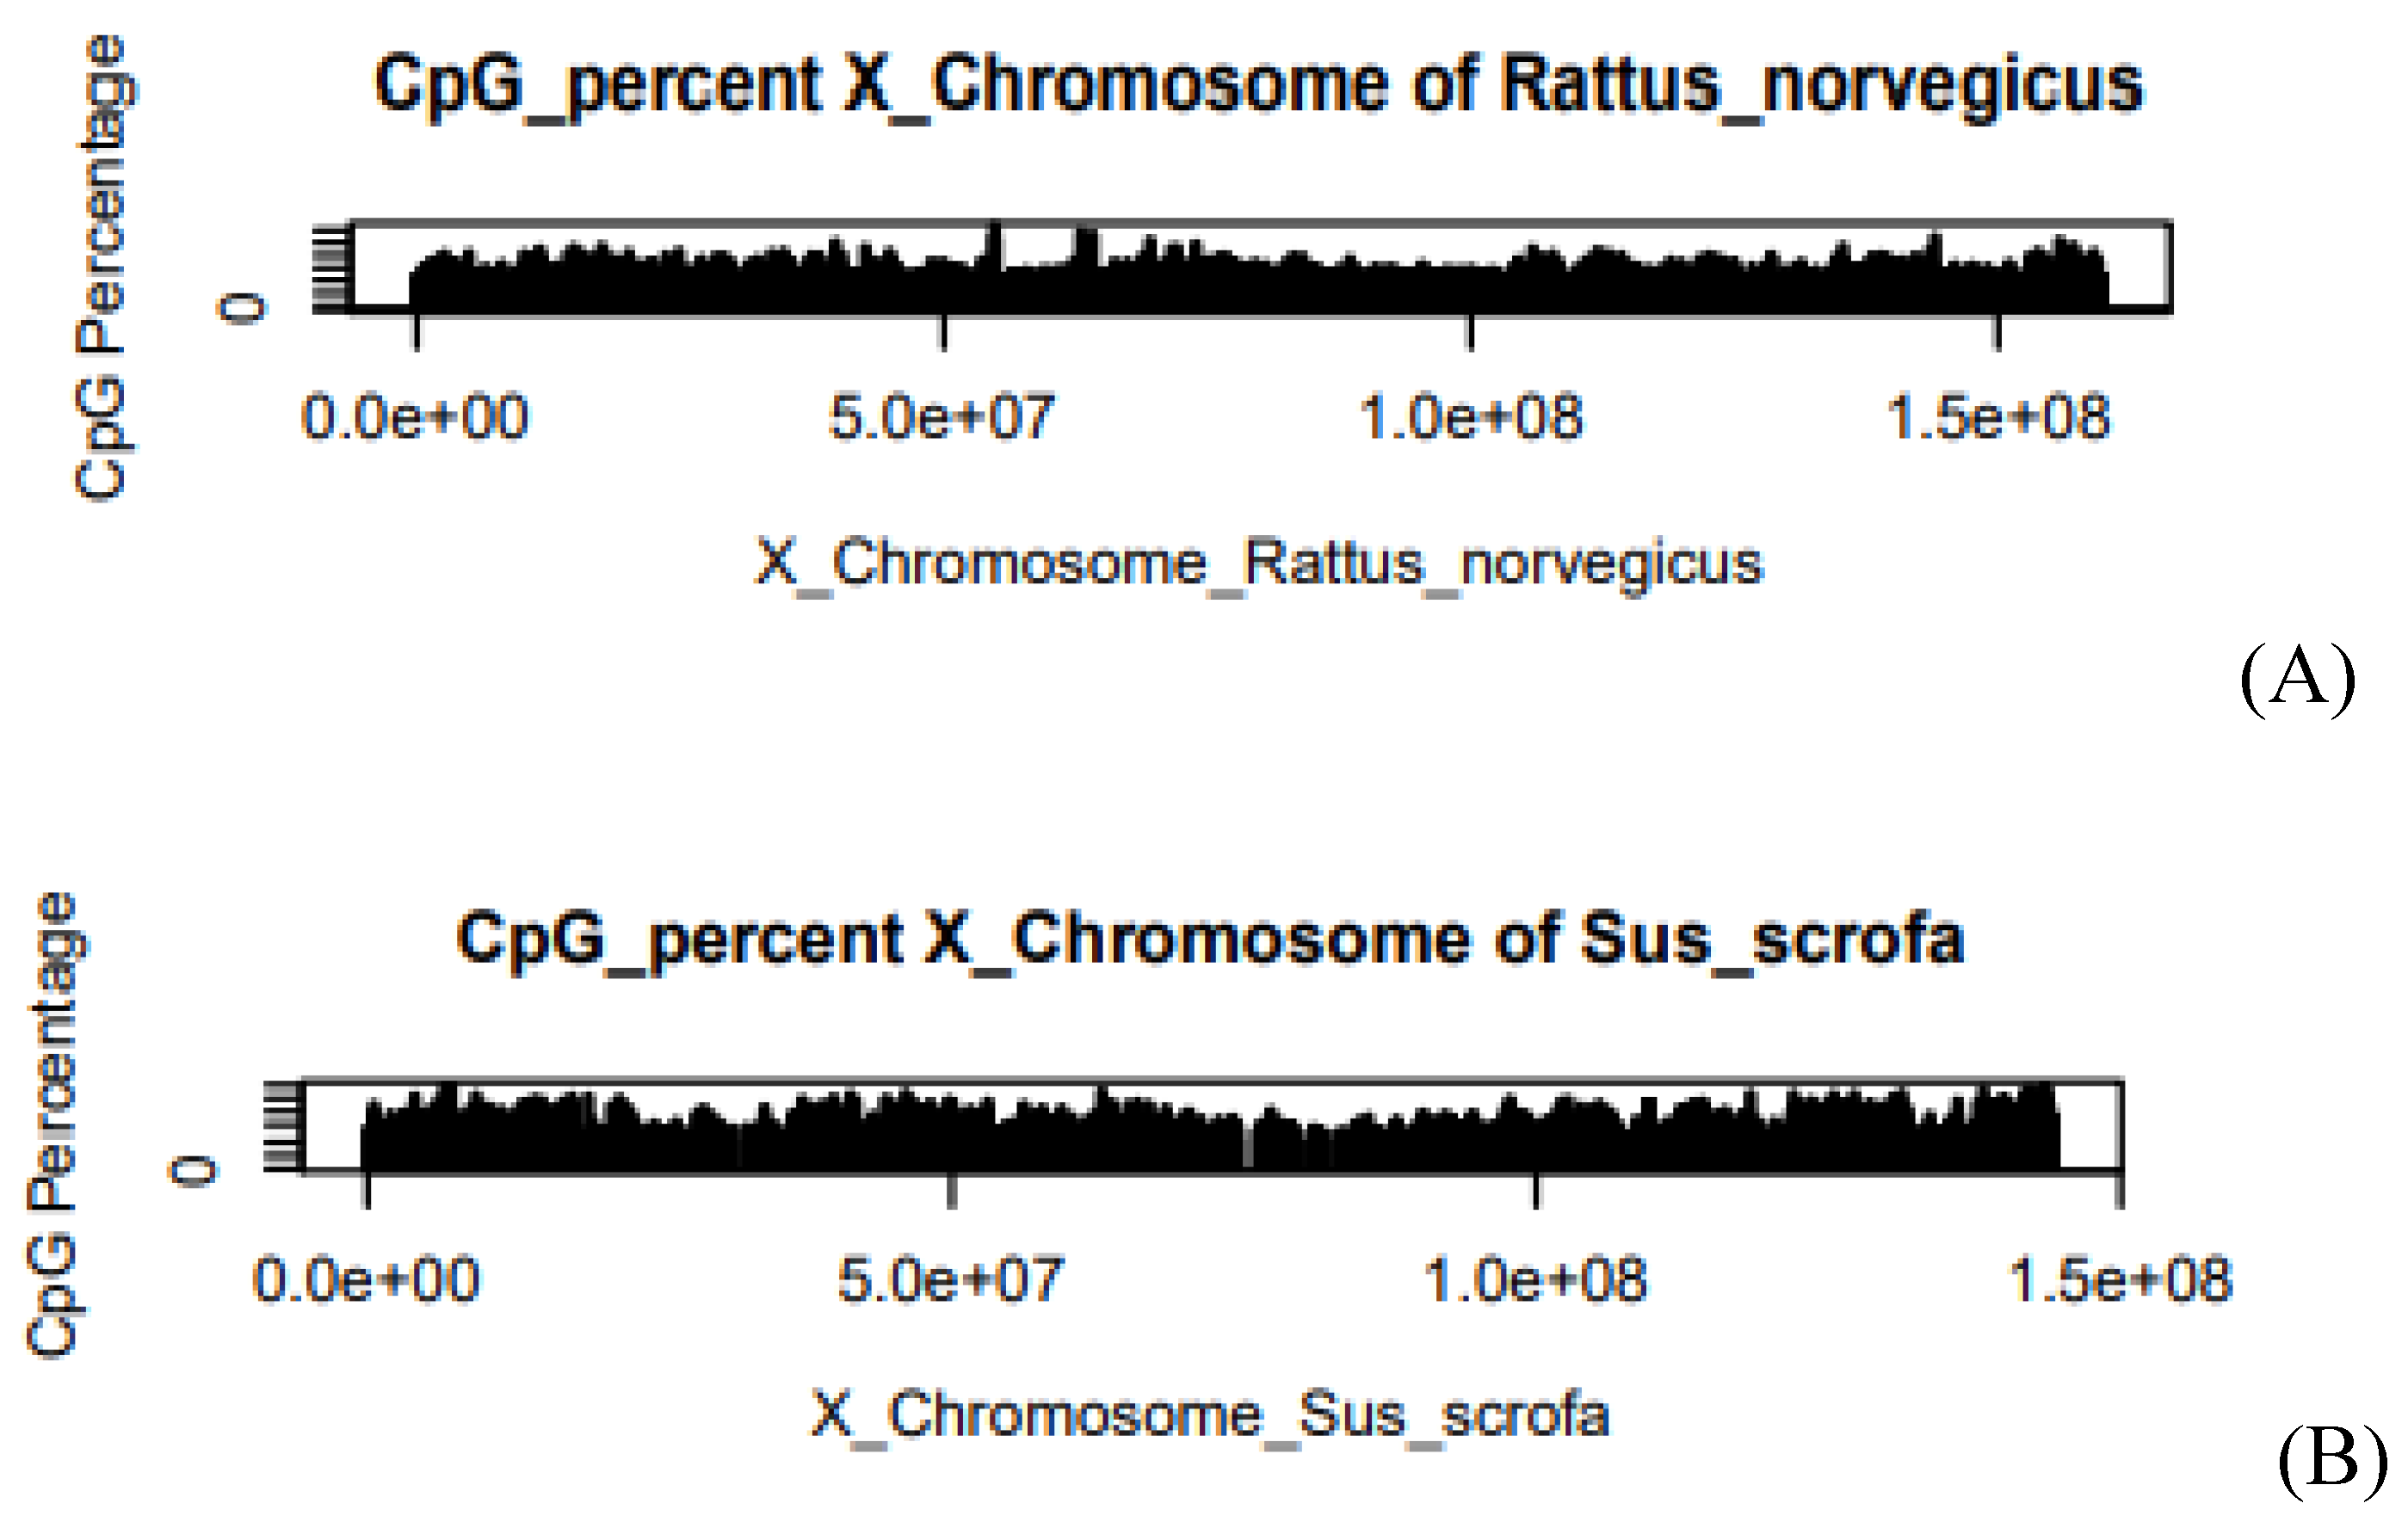
Figure 4.
(A) CpG Percentage of Rattus norvegicus in Y-chromosome, (B) CpG Percentage of Sus scrofa in Y-chromosome. The X-axis of the graph describes the length of the chromosome. Where e is the exponential constant, for example, 5.0e+07 can be written as 5*107. On the Y-axis, the graph shows the CpG Percentage.
Figure 4.
(A) CpG Percentage of Rattus norvegicus in Y-chromosome, (B) CpG Percentage of Sus scrofa in Y-chromosome. The X-axis of the graph describes the length of the chromosome. Where e is the exponential constant, for example, 5.0e+07 can be written as 5*107. On the Y-axis, the graph shows the CpG Percentage.
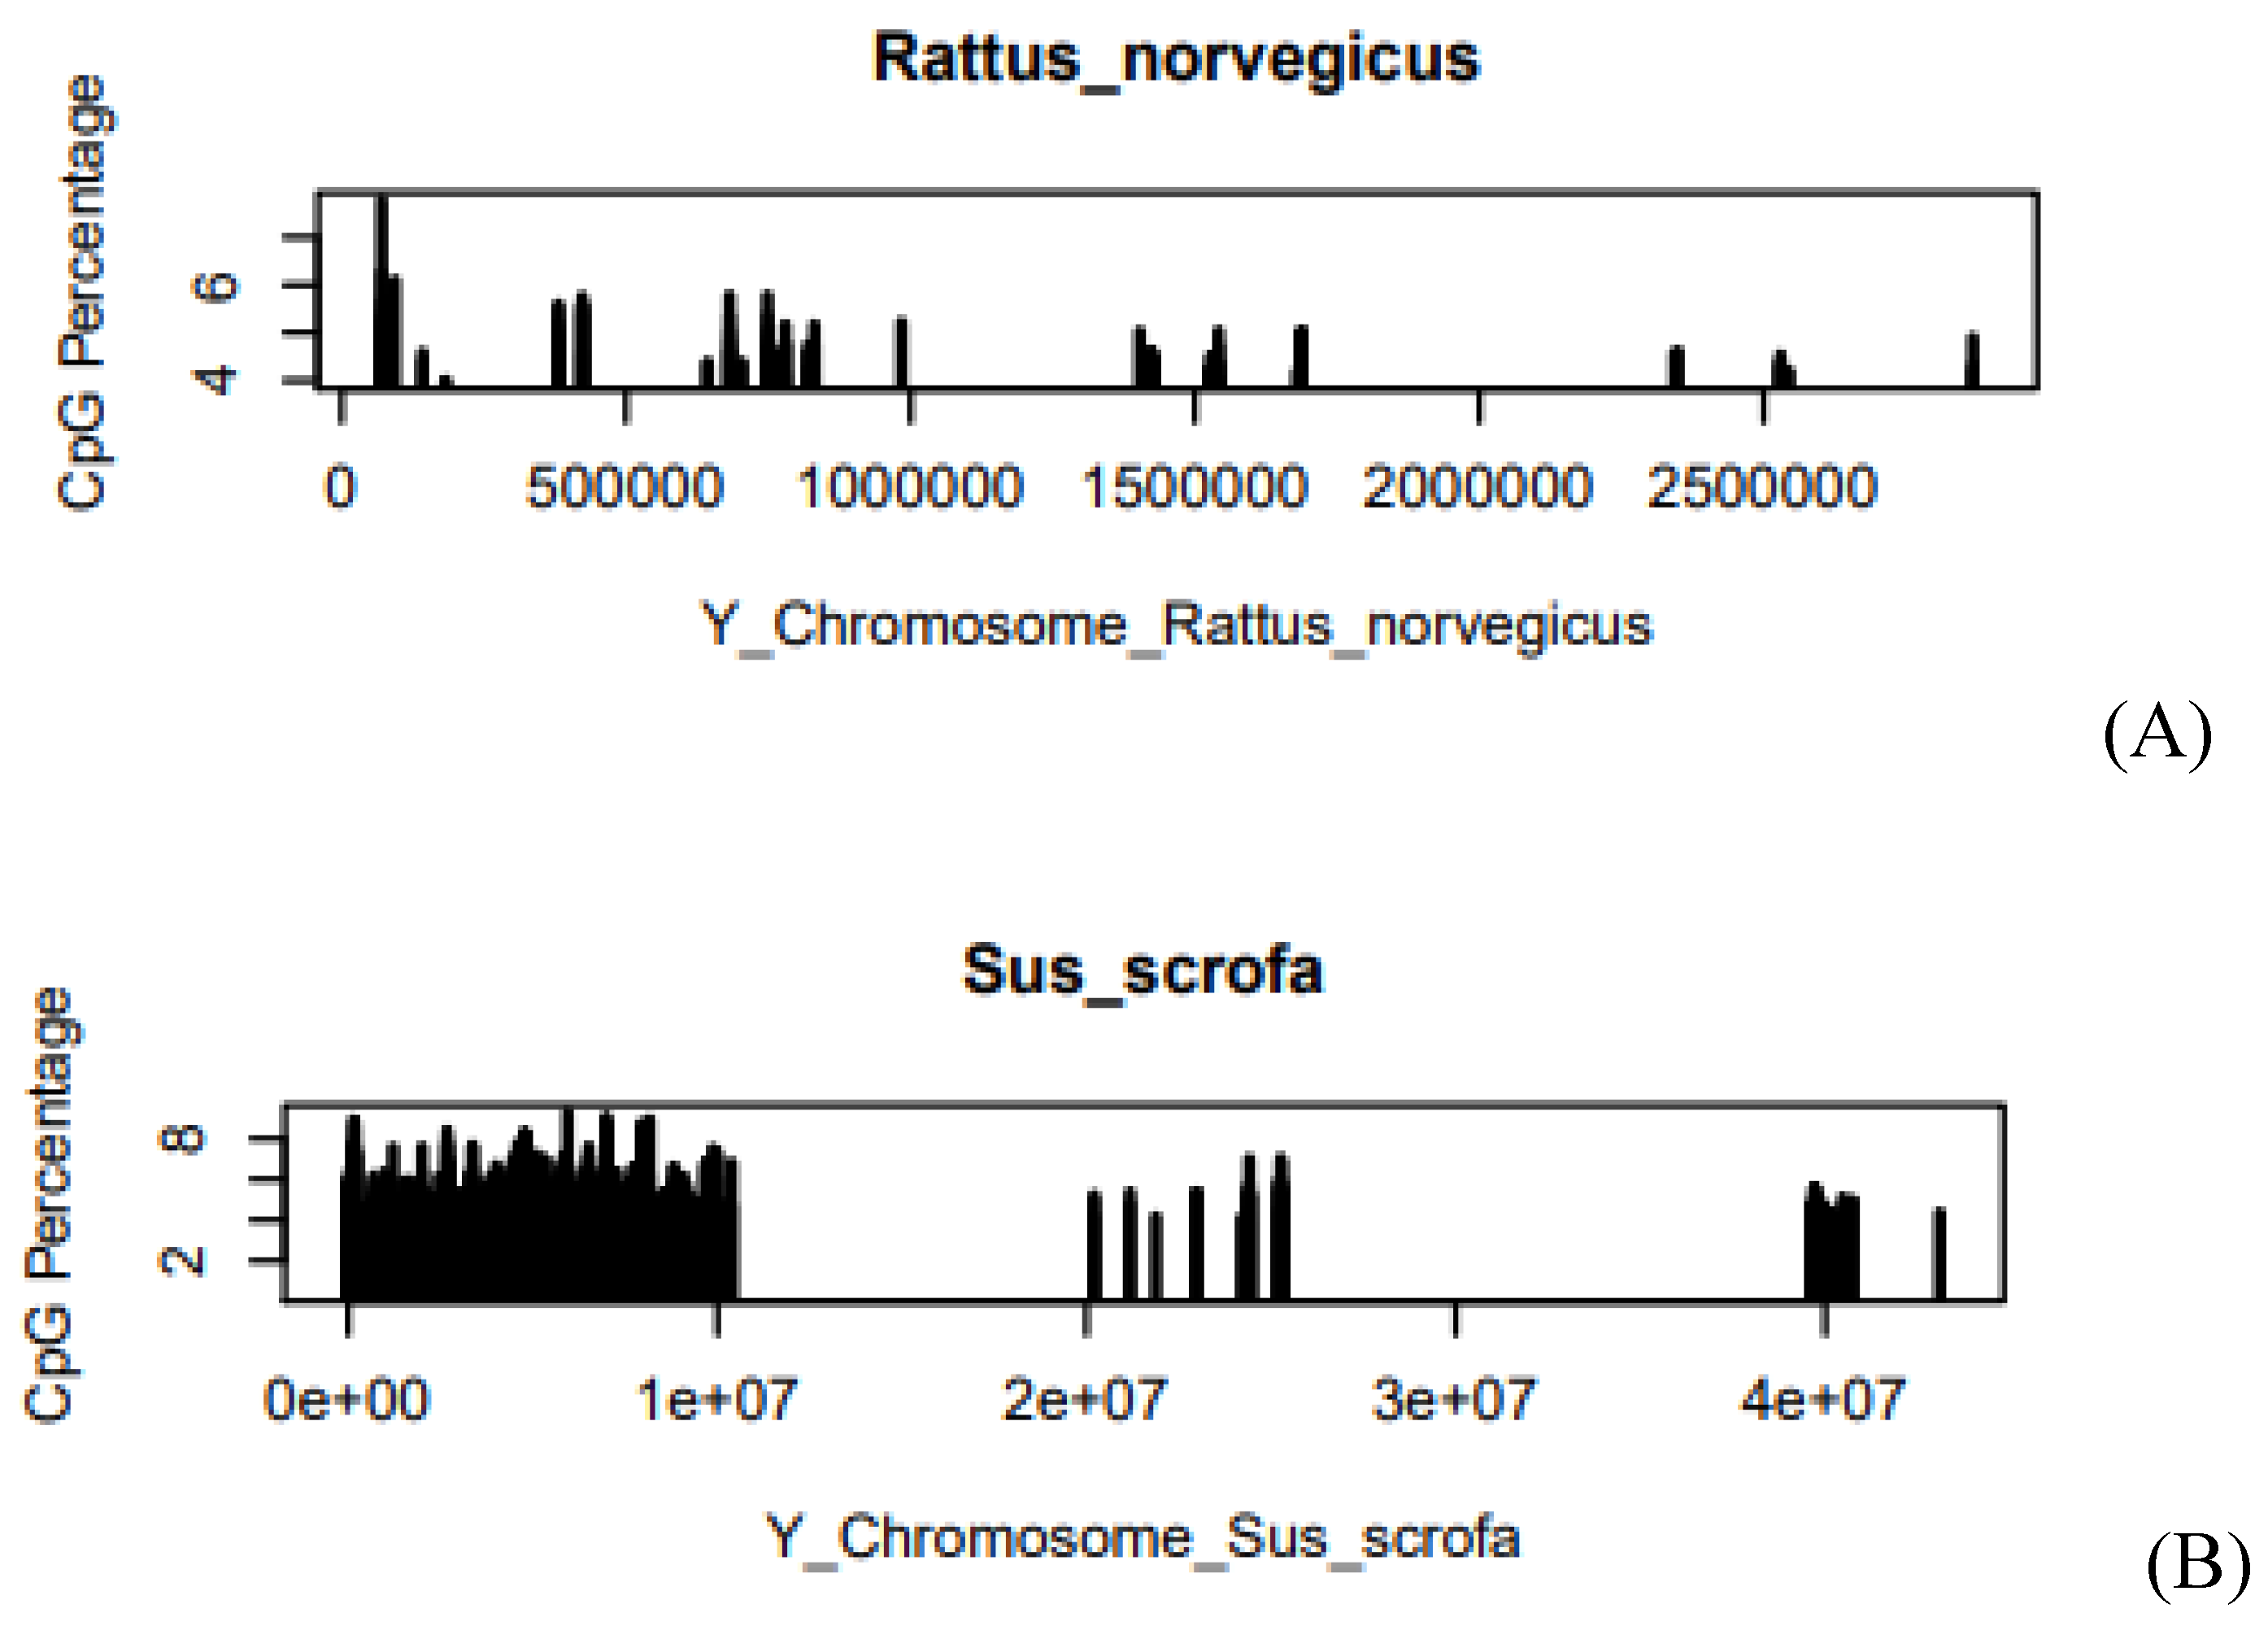
Figure 5.
(A) Island Length of Rattus norvegicus in X-chromosome, (B) Island Length of Sus scrofa in X-chromosome. The X-axis of the graph describes the length of the chromosome. Where e is the exponential constant, for example, 5.0e+07 can be written as 5*107. On the Y-axis, the graph shows the Island Length.
Figure 5.
(A) Island Length of Rattus norvegicus in X-chromosome, (B) Island Length of Sus scrofa in X-chromosome. The X-axis of the graph describes the length of the chromosome. Where e is the exponential constant, for example, 5.0e+07 can be written as 5*107. On the Y-axis, the graph shows the Island Length.
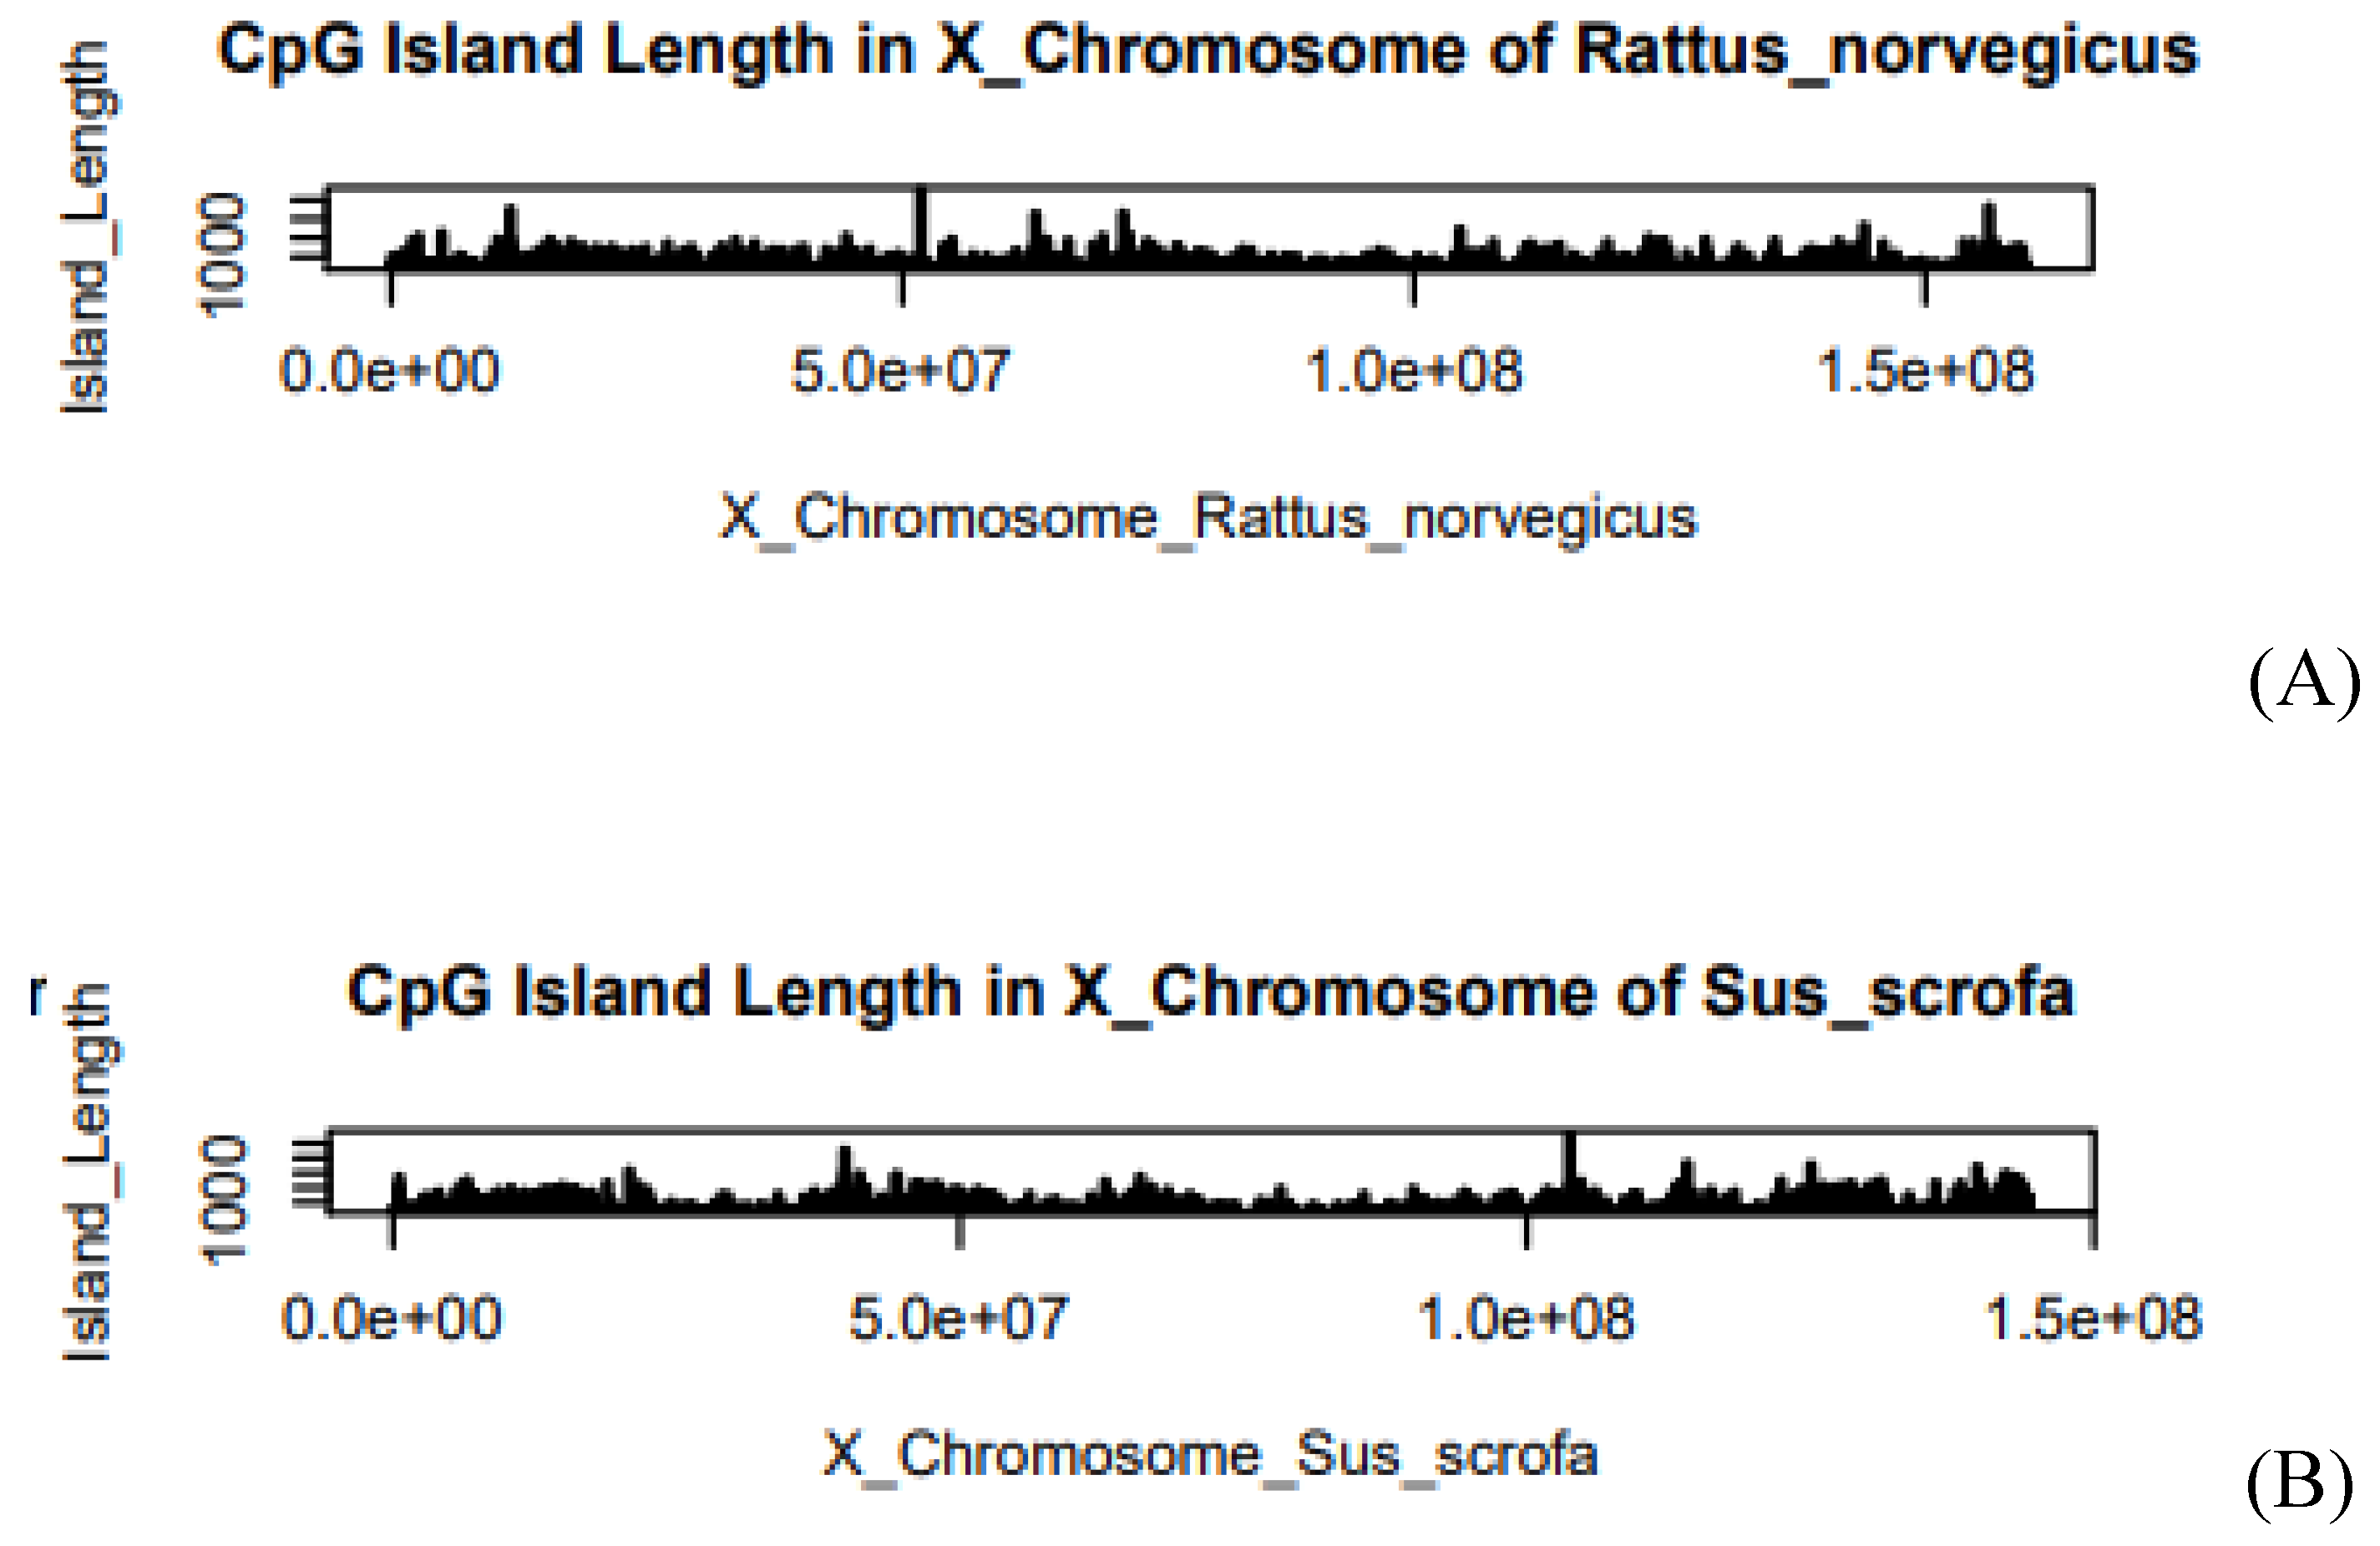
Figure 6.
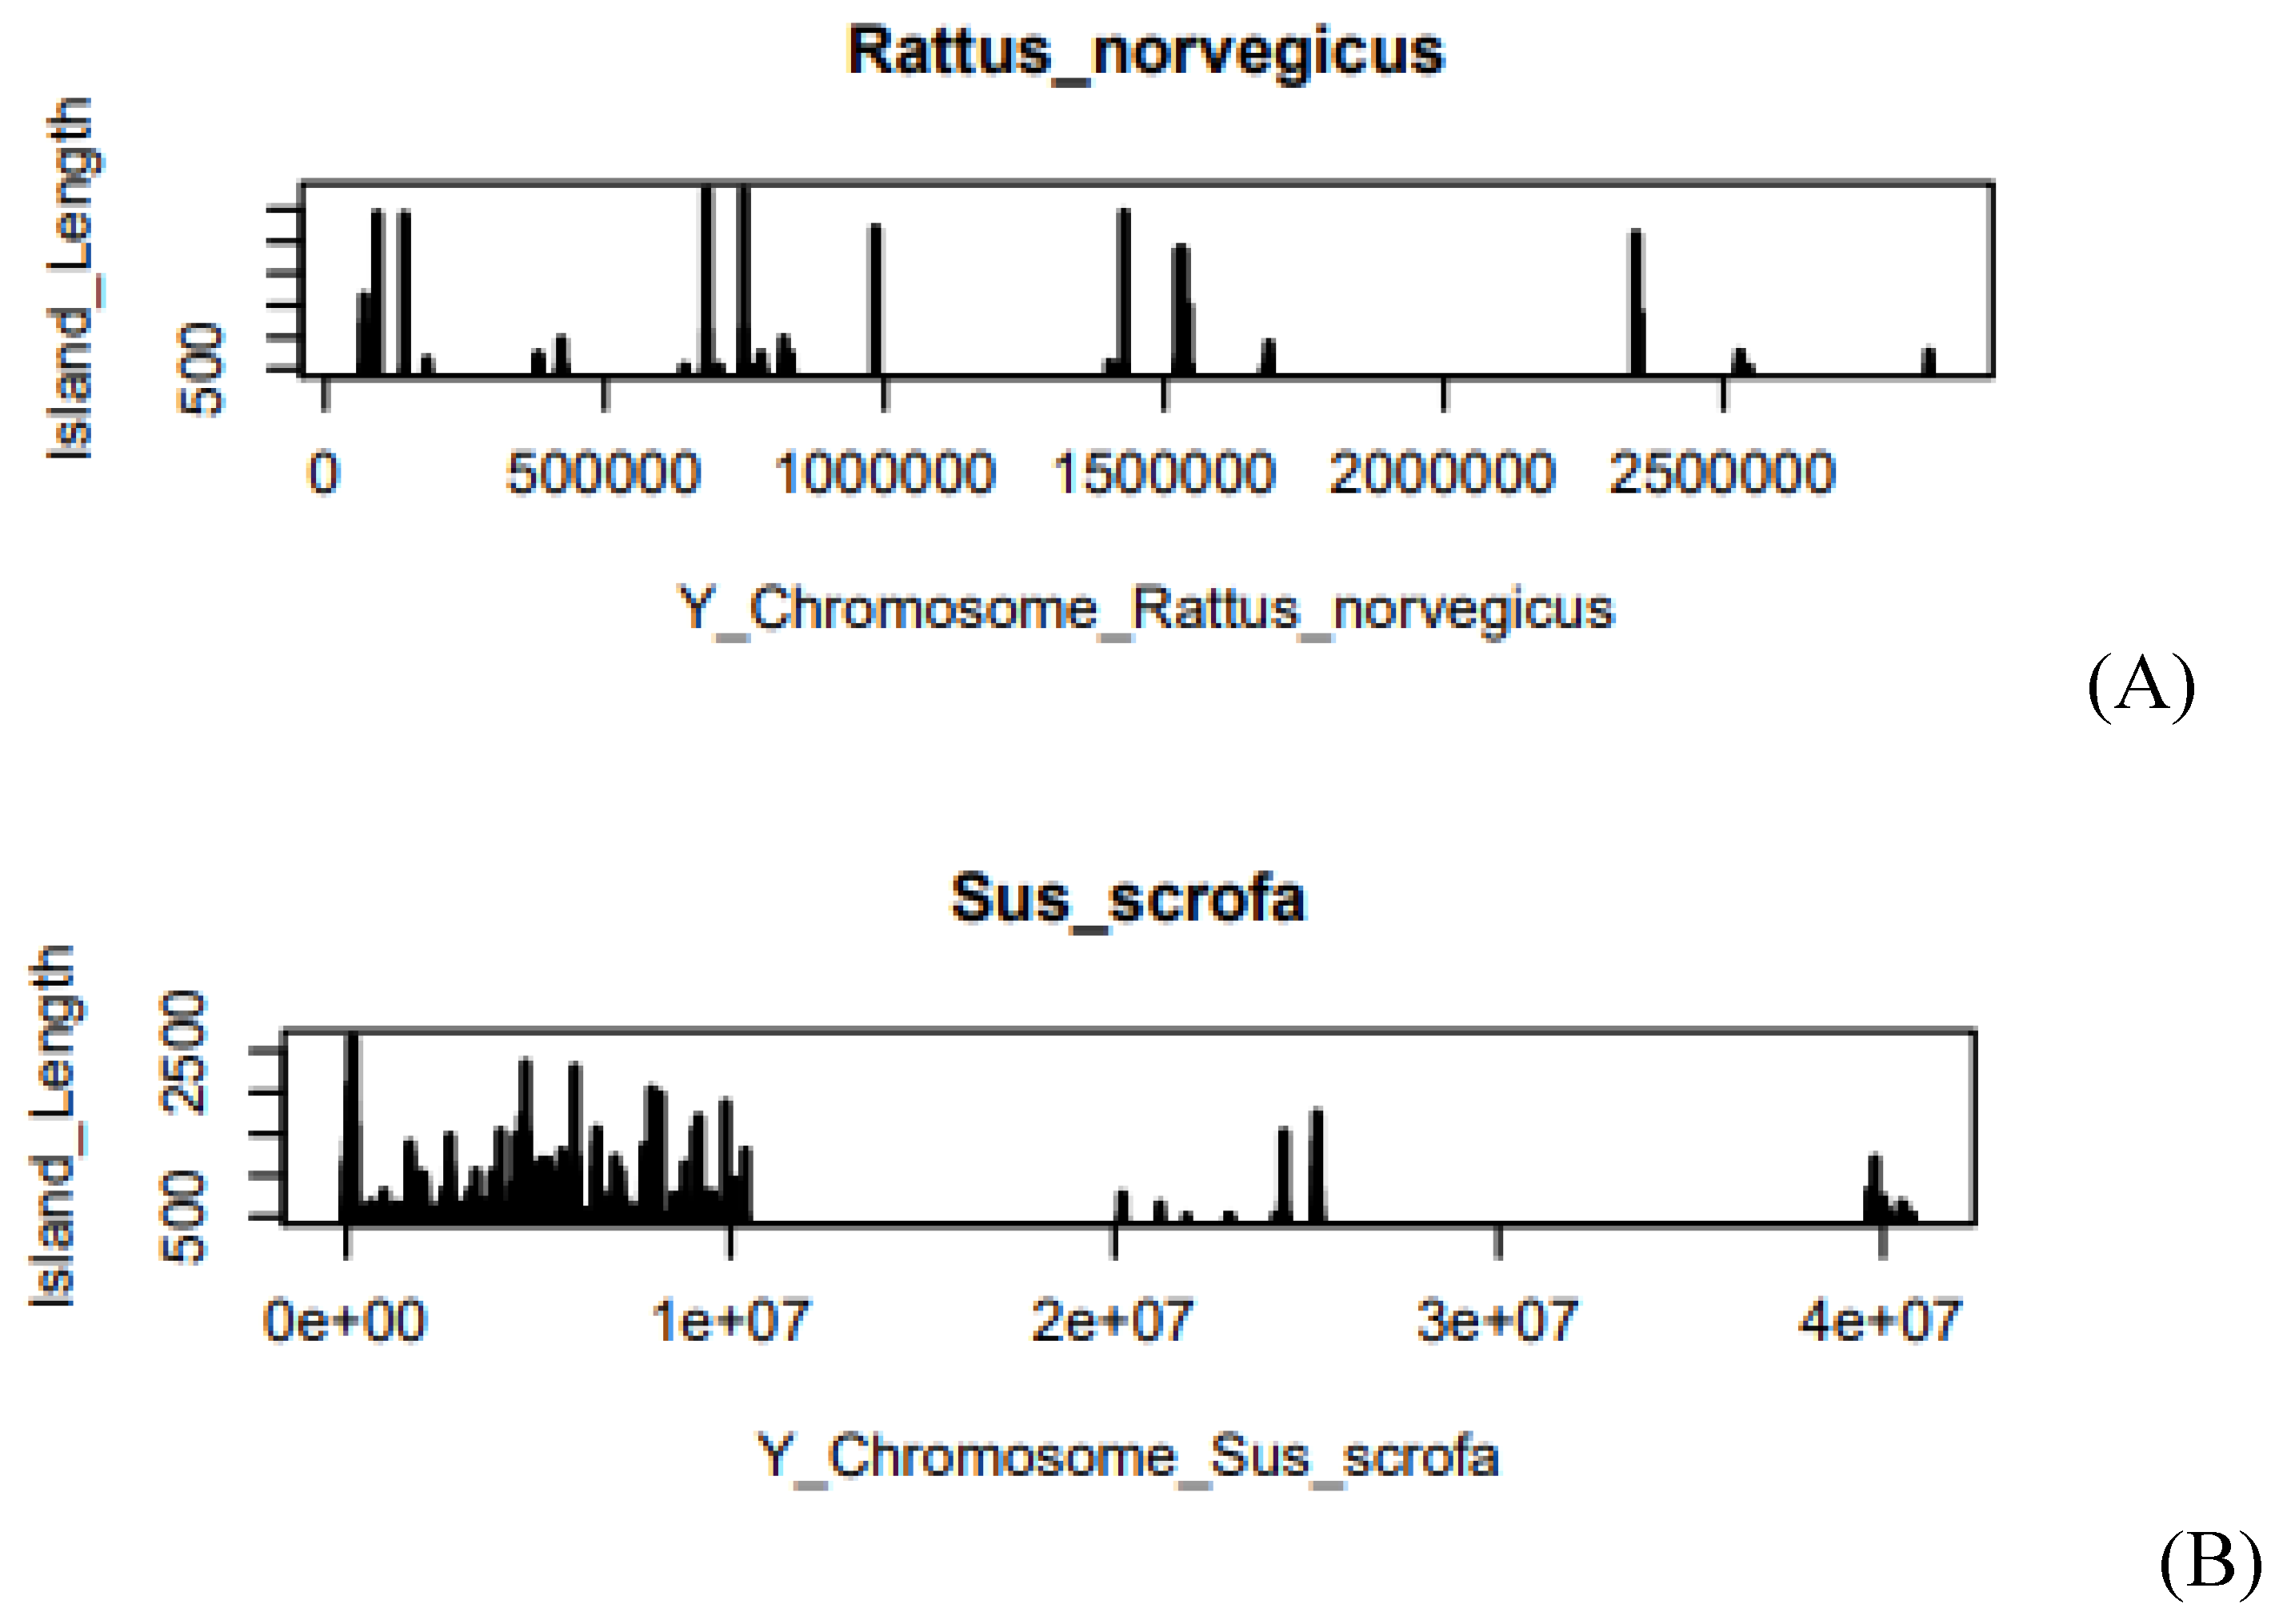
(A) Island Length of Rattus norvegicus in the Y-chromosome, (B) Island Length of Sus scrofa in the Y-chromosome. The x-axis of the graph describes the length of the chromosome. Where e is the exponential constant, for example, 5.0e+07 can be written as 5*107. On the Y-axis, the graph shows the Island Length.
Figure 6.
(A) Island Length of Rattus norvegicus in the Y-chromosome, (B) Island Length of Sus scrofa in the Y-chromosome. The x-axis of the graph describes the length of the chromosome. Where e is the exponential constant, for example, 5.0e+07 can be written as 5*107. On the Y-axis, the graph shows the Island Length.
In prokaryotes it is associated with restriction-modification systems, targeting short palindromic or nearly palindromic sites. DNA methylation is used as a signal for the regulation of a particular DNA protein interaction. Methylation systems typically comprise of a DNA methylase and one or more DNA binding proteins which will overlap the target methylation site on DNA, subsequently blocking methylation of that site.The laboratory rat (Rattus norvegicus) have incalculable benefits to human health it is mostly used in experimental medicine and drug production. The diploid number chromosome is 42 in Rattus norvegicus and has an autosomal complement consisting of seven pairs of metacentrics, three pairs of submetacentric, and 10 pairs of acrocentrics. The X-chromosome is an acrocentric of medium size and the Y is the smallest acrocentric of the complement (Duncan and Van Peenen 1971). Rattus norvegicus, has multiple copies of Sry Y-chromosome while the maximum mammals have only a single copy (Turner et al. 2007). Pigs (Sus scrofa) have been domesticated in the old world since antiquity. Pig provides valuable products to humans; including fertilizer, leather, pork, and a variety of medicines an indigenous pig has a diploid number of chromosomes (2n) of 38, which includes 18 pairs of autosomes and one pair of allosomes or sex-chromosomes. First, 5 pairs of autosomes are submetacentric, the next 2 pairs are subtelocentric, a subsequent 5 pairs are metacentrics, the remaining six pairs are telocentric and sex-chromosomes are metacentrics in nature. The first chromosome was the longest pair and a thirteenth pair was the second largest, while a Y-chromosome was the smallest in the karyotype of the pig (Vishnu et al. 2015).
References
- Antequera F. and Bird A. 1993. Number of CpG islands and genes in human and mouse. Proceedings of the National Academy of Sciences 90(24): 11995 11999. [CrossRef]
- Dindot, S. V., Person, R., Strivens, M., Garcia, R., & Beaudet, A. L. (2009). Epigenetic profiling at mouse imprinted gene clusters reveals novel epigenetic and genetic features at differentially methylated regions. Genome research, 19(8), 1374 1383. [CrossRef]
- Duncan, J. F., & Van Peenen, P. F. D. (1971). Karyotypes of ten rats (Rodentia: Muridae) from Southeast Asia. Caryologia, 24(3), 331 346. [CrossRef]
- Futscher, B. W., Oshiro, M. M., Wozniak, R. J., Holtan, N., Hanigan, C. L., Duan, H., & Domann, F. E. (2002). Role for DNA methylation in the control of cell type specific maspin expression. Nature genetics, 31(2), 175 179. [CrossRef]
- Illingworth, R., Kerr, A., DeSousa, D., Jørgensen, H., Ellis, P., Stalker, J., & Bird, A. (2008). A novel CpG island set identifies tissue specific methylation at developmental gene loci. PLoS biology, 6(1),e22. [CrossRef]
- Suzuki, M. M., & Bird, A. (2008). DNA methylation landscapes: provocative insights from epigenomics. Nature reviews genetics, 9(6), 465 476. [CrossRef]
- Turner, M. E., Martin, C., Martins, A. S., Dunmire, J., Farkas, J., Ely, D. L., & Milsted, A. (2007). Genomic and expression analysis of multiple Sry loci from a single Rattus norvegicus Y-chromosome. BMC Genetics, 8(1), 1 11. [CrossRef]
- Vishnu, P. G., Punyakumari, B., Ekambaram, B., Prakash, M. G., & Subramanyam, B. V. (2015). Chromosomal profile of indigenous pig (Sus scrofa). Veterinary World, 8(2), 183. [CrossRef]
Disclaimer/Publisher’s Note: The statements, opinions and data contained in all publications are solely those of the individual author(s) and contributor(s) and not of MDPI and/or the editor(s). MDPI and/or the editor(s) disclaim responsibility for any injury to people or property resulting from any ideas, methods, instructions or products referred to in the content. |
© 2024 by the authors. Licensee MDPI, Basel, Switzerland. This article is an open access article distributed under the terms and conditions of the Creative Commons Attribution (CC BY) license (http://creativecommons.org/licenses/by/4.0/).
Copyright: This open access article is published under a Creative Commons CC BY 4.0 license, which permit the free download, distribution, and reuse, provided that the author and preprint are cited in any reuse.


