Submitted:
11 September 2024
Posted:
13 September 2024
You are already at the latest version
Abstract
The integration of digital technologies in managing technical and design information is trans-forming the fields of architecture and construction. This article presents a website developed to compile detailed information on the construction processes of buildings at Pontificia Universidad Javeriana (PUJ) campus. The site offers comprehensive construction records and interviews with designers, engineers and other professionals who collaborated to align design approaches with technical construction requirements. A chronological record of the construction processes was maintained, from inception to completion of the buildings. Digital tools include interactive modules that facilitate access and data updates, improving coordination and efficiency for man-aging future projects. Gamification elements and social media dissemination boost user engage-ment. The study also assesses the impact of the website on the university community, analyzing usability and user (N=235), among students, teachers, and staff members. Findings indicate that digital technologies optimize construction processes and improve the management of technical and design information, and reveal opportunities for future projects and research, benefiting both internal and external stakeholders.
Keywords:
Digital Technologies
; Community impact
; Construction Processes
; Information Management
; Interactive Tools
; Interdisciplinarity
; Sustainability
1. Introduction
In the context of construction, interdisciplinary collaboration between design and structural engineering is fundamental to the successful delivery of architectural projects. This collaboration is essential in balancing design approaches and architectural program requirements with structural engineering needs.
In addition, project management plays a critical role in facilitating this interdisciplinary collaboration. Effective project management practices ensure that all stakeholders, including designers, engineers, and construction managers, work together seamlessly to achieve project goals [1]. Digital technologies have become increasingly important in architecture, engineering, and construction (AEC). Tools such as Building Information Modeling (BIM), Virtual Reality (VR), and Augmented Reality (AR) have become invaluable in coordinating design and construction activities, facilitating better communication, and reducing errors [2]. For example, integrating an existing digital model can significantly improve the efficiency and accuracy of secondary designs by optimizing the use of information and reducing the margin for error [3]. Digital technologies have also become powerful tools for improving project management by providing immersive and interactive experiences that simulate real-world scenarios [4]. For example, the use of digital supply chain management can streamline processes and enhance collaboration among stakeholders, improving project outcomes [5]. In addition, engaging suppliers, contractors, and strategic partners on a common digital platform can strengthen the relationship between industry and academia. This collaboration can be further enhanced by using these digital tools to facilitate communication between stakeholders [6]. In addition, the detailed recording of construction processes adds significant value to project management. Analysis of these construction processes helps to identify best practices, lessons learned, and areas for improvement, contributing to the continuous improvement of project management methodologies on university campuses and beyond. For example, documentation and analysis of the construction lifecycle can provide valuable insights and benchmarks [7]. By fostering interdisciplinary collaboration through the digital supply chain, documenting the building lifecycle and its construction processes, and using innovative teaching methods that allow for second design opportunities, stakeholders and educational institutions can create more engaging, emotional, effective, and relevant learning environments [8] by providing comprehensive digital platforms that bridge the gap between theoretical knowledge and practical application.
Based on the background presented above, the integration of digital technologies in the management of technical and design information is currently transforming the fields of architecture and construction. This article provides a comprehensive overview of a web platform developed to compile detailed information about the construction processes of the buildings on the campus of the Pontificia Universidad Javeriana (PUJ) in Bogotá, Colombia. This platform, known as CAMPUS 2.0, aims to improve the management of technical and design information through advanced digital tools. The CAMPUS 2.0 project was born from the need to create a method for learning construction processes in the fields of architecture and civil engineering, since the learning methods used for years are still not sufficiently interactive, practical, or adapted to the technologies that the newer generations are more connected to. CAMPUS 2.0 integrates various digital technologies such as construction videos, photos, BIM models, virtual and augmented reality, and infographics to improve learning outcomes. CAMPUS 2.0 also addresses the urgent need to integrate digital technologies in the management of technical and design information within the construction processes of the Pontificia Universidad Javeriana campus.
The construction of the Pontificia Universidad Javeriana campus represents a significant effort to create a state-of-the-art academic and educational environment. Located in Bogotá, Colombia, the campus was developed with a vision that integrates modernity, functionality, and sustainability. With architecture that blends traditional and contemporary elements, the campus offers not only advanced infrastructure facilities, but also green spaces and common areas that contribute to the well-being of the university community. This comprehensive approach ensures that the campus is a dynamic and enriching environment that reflects the values of academic excellence and social commitment that characterize Pontificia Universidad Javeriana.
The Pontificia Universidad Javeriana covers an area of approximately 350,000 square meters and has a student population of approximately 24,000, including undergraduate and postgraduate students. The campus has several notable new buildings from the last 10 years that enhance its infrastructure and support its academic and research activities. Four prominent new buildings are the Gerardo Arango S.J. Building (School of Arts), the Jose Gabriel Maldonado Building (Laboratories of Engineering School), School of Sciences Building, and the Sapience Tower.
By examining the construction processes and information management practices of these new buildings, this study aims to demonstrate the benefits of integrating advanced digital technologies into construction management. These buildings not only enhance the functional capabilities of the campus, but also serve as examples of modern construction practices, setting a benchmark for future projects at PUJ and other educational institutions.
Furthermore, the interdisciplinary collaboration between building designers and structural engineers in the Campus 2.0 project highlights the importance of mediating design approaches with architectural program requirements, usability, and conceptual aesthetics, in addition to technical and structural needs. In addition to its role in managing construction information, the campus itself serves as a formative educational tool. Beyond containing buildings and infrastructure, the campus contributes to student learning and serves as a medium for the entire university community to gain insights from the campus environment itself. It supports the educational process by integrating practical knowledge with the physical and operational aspects of the campus. CAMPUS 2.0 is poised to set a precedent for educational institutions using digital technologies to improve construction management, increasing efficiency, accuracy and collaboration with stakeholders. This project is a testament to the potential of digital innovation to transform traditional construction practices.
The novelty of the present research is to use the university campus as a dynamic educational tool by integrating real construction and project management practices into the learning environment. In addition, the study aims to provide students and the university community with practical insights and hands-on experience, thereby enriching their educational experience. An important aspect of the study is the creation of comprehensive documentation of the construction process. This documentation will provide valuable historical records and insights for future projects and will contribute to the advancement of construction management knowledge by identifying best practices and areas for improvement. Finally, the research aims to set a precedent for digital innovation in educational institutions.
The article is divided into several sections, beginning with an introduction to the project and its goals. The first section discusses the general context and relevance of digital technologies in the architecture, engineering, and construction (AEC) industry, emphasizing the importance of interdisciplinary collaboration and the role of project management in facilitating these interactions. This section also highlights the need for efficient information management to improve construction processes and outcomes. The framework for innovation in construction emphasizes the evolutionary nature of the industry, focusing on the adoption of new technologies, methods, and materials to improve efficiency, sustainability, and quality. The methodology section details the process used to develop the CAMPUS 2.0 platform, including planning and requirements analysis, technical design, UX/UI design, and implementation of various plug-ins to enhance functionality. The findings and discussion section presents the results of the usability and user experience studies and provides insight into the impact of the platform on the university community.
2. Background Review
2.1. Innovation and Development in the Construction Industry
Construction innovation management is a dynamic field that has evolved significantly over the last few decades. In the current context, innovation refers not only to the adoption of new technologies but also to the implementation of new methods, materials, and practices that improve the efficiency, sustainability, and quality of construction projects. According to Slaughter [9] innovation in construction can be classified into five types: incremental, modular, architectural, systemic, and radical. Each type of innovation involves different levels of change and adaptation within traditional existing construction practices.
One of the major challenges in managing innovation in this sector is resistance to change, which often stems from the conservative nature of the industry and the fragmentation of its processes. As a result, innovation in the construction industry requires a change in organizational culture [10]. Companies that have adopted a culture of innovation have managed not only to improve their operational results but also to gain significant competitive advantages [11]. According to Berardi [12], organizations that invest in the training and development of their employees have a greater capacity to adapt to new technologies and practices and implement them effectively.
The adoption of digital technologies has played a crucial role in the transformation of the sector [13]. Various technologies are revolutionizing the way buildings are designed and constructed, as they not only allow for greater precision and cost reduction but also open new possibilities for the design and customization of projects [14]. The integration of these innovations requires a flexible and adaptive approach to project management, as well as continuous training of professionals in the sector. Tools such as Building Information Modeling (BIM) and cloud-based project management systems have enabled greater collaboration and coordination between the different stakeholders involved in a construction project. This has improved efficiency, and significantly reduced errors and rework. [15] highlight that BIM facilitates 3D visualization, simulation, and analysis, improving decision-making and optimizing resources.
In terms of sustainability, innovations in construction have allowed the development of more energy-efficient buildings with a lower environmental impact. Technologies such as energy management systems, green building or eco-friendly construction materials, and sustainable construction practices are revolutionizing the way buildings are designed and constructed. Berardi [12] states that the integration of sustainable practices in construction benefits the environment and can also result in significant long-term savings.
Innovation management in construction also includes the adoption of advanced construction methods such as prefabrication and 3D printing. These methods allow for faster and more accurate construction, reducing construction time and associated costs. According to Barbosa et al., [16] prefabrication can significantly improve the productivity and quality of construction projects.
Finally, collaboration between industry and academia is essential to foster innovation in construction. The research and development of new technologies and methods require close cooperation between universities, research centers, and construction companies. According to Osman et al., [17] , this collaboration can accelerate technology transfer and the implementation of innovations in the construction field.
2.2. Digital Transformation in Construction Information Management
Information management in the construction industry has traditionally been a manual and error-prone process, that has limited the efficiency and effectiveness of projects due to the complexity and large amount of data generated during the project lifecycle. Innovation in this area has been driven primarily by the development of digital technologies that facilitate the collection, storage, analysis and distribution of information more efficiently and accurately. Building Information Modeling (BIM), has radically transformed this landscape, enabling more accurate and collaborative management of data throughout the project lifecycle [15].
BIM is one of the most prominent technologies in construction information management. BIM allows the creation of a digital model of the project that integrates geometric, material, cost, and time information. According to Azhar [18] BIM not only improves project visualization but also facilitates collaboration among various stakeholders and informed decision-making.
In addition to BIM, other digital tools such as the Internet of Things (IoT), big data, artificial intelligence, or real-time collaboration platforms are revolutionizing information management in construction. These technologies enable real-time data collection from various sources, such as sensors, drones, and mobile devices installed at the construction site, in addition to more efficient communication and better data integration, resulting in greater transparency and control over the project [19]. Meng et al., [20] say the use of IoT in construction can improve project safety, efficiency, and quality by providing real-time information and predictive analytics.
The implementation of cloud-based information management systems has also been a key factor in the innovation of information management in construction. These systems allow data to be accessed and updated in real-time from any location, facilitating collaboration and coordination between different work teams. According to Oke et al., [21] cloud-based systems can significantly improve efficiency and transparency in construction project management. Another important innovation in information management is the use of digital twins. Digital twins are virtual replicas of buildings that are updated in real time with data obtained from sensors and other devices. Tao et al. [22], states digital twins can improve building operations and maintenance by providing accurate and up-to-date information on building conditions.
In summary, innovations in construction information management are transforming the way construction projects are managed. The adoption of digital technologies is enabling more efficient and accurate information management, improving collaboration and decision-making. The integration of these technologies into construction projects not only improves the efficiency and quality of projects but also contributes to sustainability and cost reduction.
2.3. Innovation Cases for the Consolidation of Technical Information in Construction
The AEC industry has always been seeking methods to cut costs, increase efficiency, enhance visualization, improve data sharing, reduce building waste, increase productivity, improve sustainable performance, boost safety and quality, all while trying to decrease delivery time. However, the industry still heavily depends on traditional drawings and procedures to operate [23].
Manzoor et al. [24] indicate the use of Digital Technologies (DTs) in the AEC industry is transforming the relationship between the construction process and human behavior, and their impact on user behavior is becoming increasingly important to assess. DTs such as Building Information Modeling (BIM), Augmented Reality (AR), Virtual Reality (VR), Photogrammetry, Radio Frequency Identification Devices (RFID), Geographic Information Systems (GIS), Global Positioning Systems (GPS), Wearable Safety Devices, Quick Response Code (QR), Artificial Intelligence (AI), Robotics, Block Chain, Onsite Mobile Devices, and Laser Scanning Devices are all seen as promising in the AEC industry. The advantages of using DTs in the AEC industry are immense, including increased collaboration, improved project documentation and architecture management, enhanced safety, and increased efficiency. However, there is a lack of comprehensive reviews of state-of-the-art research covering all aspects of DTs in the AEC industry.
Industry 4.0 is leading to digital transformation in industrial sectors, but the construction industry has been slow to adopt the different emerging technologies. Increased safety technology adoption could improve productivity and jobsite safety in the construction industry, which has a poor safety record. However, the utilization rate of technologies such as BIM, wearable sensing devices, and drones for safety management in construction is still low. There are several examples of the use of technological disruptions in the AEC sector, some of them successful, others with opportunities for improvement in implementation, according to Dosumu et al. [25] the adoption of Internet of Things (IoT) technologies in the Rwandan construction industry is still low, with only a few technologies being adopted for project management, production of site plans, transportation efficiency, environmental monitoring, BIM, security control, smart communication, information sharing, general surveying, time management and power, fuel and energy savings. The study also found that there is no significant difference in the adoption of IoT technologies between consultants and contractors, or between engineers, architects and quantity surveyors and recommends raising awareness of the benefits and challenges of adopting IoT technologies and including the adoption of IoT technologies in government policies. Also, in a study surveyed 133 Malaysian construction practitioners found that conventional safety management practices are insufficient to prevent accidents and injuries. The majority of practitioners believe that technology applications can improve safety performance. The five most influential predictors of technology adoption are expertise and skill of project team, proven technology effectiveness, top management support, government promotion and initiative, and technology reliability. Four underlying dimensions of these predictors were identified: organizational commitment/technology orientation, supporting technological attributes, personal perception/performance expectancy, and government support [26]. There are also cases involving XR, such as the Northwestern NASA-Mars habitat project, which concluded that the integration of BIM and XR could improve the performance of architecture, engineering, and construction projects in terms of time, cost, quality, and safety. However, there are also significant challenges related to content creation, access to the technology, and user acceptance. The AEC sector will change significantly in the coming years due to advances in XR, cloud computing, machine learning, artificial intelligence, and cognitive computing technologies. The introduction of fifth-generation (5G) wireless technology is also expected to improve the speed and latency of XR data transfer, enabling more remote and co-located creative and interactive collaboration [27].
It is important to emphasize the importance of digital transformation for sustainable market success and competitiveness in the digital age, companies should consider some facts to remain competitive in the digital age. These include how to further develop existing business models, how to use real-time product and machinery usage data, the impact of artificial intelligence on corporate culture and organizational development, where digital methods can be used in products and services, the extent to which parts of the value chain can be fully digitalized, and who could be suitable partners for platform-based collaboration [28].
In addition to the above, not only is digital transformation crucial but the construction industry for future adoption needs to plan eco-innovative practices to continue adopting them. In the Hazarika et al., study [29] are examined the factors influencing the adoption of eco-innovative practices in the construction industry in Hong Kong, using data from 140 construction firms, revealed that regulatory instruments, managerial consent, and organizational measures significantly influence firms to adopt eco-innovative practices. The analysis provides valuable information for future research in environmental innovation in construction. Hong Kong’s efforts to diversify and innovate the construction industry require enhanced public-private partnerships to analyze bottlenecks. The construction industry’s slow pace of change necessitates ‘bottleneck thinking’ to address issues and barriers. The government needs to be more flexible and decisions on eco-innovative practices should involve dialogue and consensus with stakeholders. Astronomical property prices locking the market into conventional practices are a policy problem that the government must resolve. For eco-innovations to succeed in Hong Kong’s construction industry, bottlenecks of consumer demand, economic incentives, flexible regulations, and public-private partnership for decision-making need to be addressed. These findings, though focused on one region and sector, provide realistic insights for practitioners to implement in their decision-making processes. Eco-innovative practices also strongly mediate the relationship between these factors and future adoption likelihood, and they are positively related to financial profitability [29]. These findings support the [30] hypothesis and demonstrate path dependency where innovation breeds innovation.
2.4. The adoption of Industry 4.0 Technologies Has Far-Reaching Implications for the Construction Industry, Including Economic Benefits, Improved Safety, and Sustainability. However, There Are Political, Economic, Social, Technological, Environmental, and Legal Challenges to Be Addressed. Innovation Cases of Technical Information Consoloditation in Universties Context
The integration of advanced technologies in university campuses is revolutionizing the way these spaces are managed, maintained, and experienced. Implementing cloud-based information management systems and utilizing digital twins (DTs) such as Building Information Modeling (BIM), Augmented Reality (AR), Virtual Reality (VR), Robotics, Blockchain, Onsite Mobile Devices, and Laser Scanning Devices have the potential to significantly enhance operational efficiency, user experience, and sustainability. These cutting-edge technologies provide valuable tools for monitoring, analyzing, and optimizing various aspects of campus infrastructure and facilities, ultimately leading to improved decision-making, resource allocation, and overall campus performance. By embracing these innovations, universities can create smarter, more connected campuses that cater to the needs of students, schools and staff while promoting environmental stewardship and long-term sustainability. There are several cases that show the results based on the use of technological strategies for the management of university campuses, efficient processes in buildings and development of strategies that promote technology inside classrooms.
Ullah et al. [31] investigates the building performance optimization strategies based on BIM digital technology, with a focus on assessing carbon emissions in prefabricated buildings through digital means with a detailed case study on C-House at Southeast University, Nanjing, China. Using a high-accuracy BIM model, the study simulates building performance and calculates carbon emissions throughout design, production, construction, operation, and maintenance phases. The research uses C-House, a building with multiple life-cycle stages, as a case study to build a component-based BIM model for comprehensive carbon emission calculations. Results show that extending the life cycle of the building and increasing component durability significantly reduce carbon emissions, emphasizes long-term environmental sustainability in design decisions and the potential of digital tools like BIM for promoting smart, green construction strategies, paving the way for energy-efficient, socially sustainable buildings through low-carbon practices. Future studies should enhance simulation modeling and explore machine learning and IoT sensors for real-time data validation.
Another case is De Oliveira Faria et al., [32] who redefine a campus tour with virtual reality (VR) for Virginia Tech to engage prospective students. The showcase concludes that VR is an effective tool for prototyping and that discrete-event simulation helped determine a design that accommodates visitors. Using qualitative research methods, the study gathered insights from current students and stakeholders to design an immersive VR experience. The project provides a sensorial experience, showcase campus locations, and market the university effectively. Multiple qualitative research methods were employed to define the characteristics of the VR experience. Focus group interviews with undergraduate students identified key elements such as scenic campus locations, social events, and emotional experiences. Stakeholder interviews with a web developer, marketing executive, and third-party collaborator provided technical considerations, historical information, and marketing strategies. Individual student interviews confirmed the desire for major-specific building tours and the sense of belonging to the Virginia Tech community. Participants generally praised the design but suggested improvements such as interactive tables and clearer category names. The study used VR to prototype the experience, which was well-received by participants. Challenges included distractions in the virtual world and the need for teleportation due to limited physical space.
The implementation of energy-saving action plans for Taiwan Tech, a university campus in Taiwan is another case. The research focuses on designing a systematic approach to reduce energy consumption and carbon emissions, while considering economic benefits and actual demands. The study proposes eight energy-saving action plans, including the installation of smart energy management systems, elevator power recovery devices, circulating fans, lighting delay switches, and the replacement of old air-conditioners, fluorescent lamps, and high-sodium streetlights with more energy-efficient alternatives. The effectiveness of these action plans is verified through real implementations, with estimated electricity savings of up to 16% of annual electricity consumption and a payback period of about 5.22 years. The research highlights the importance of integrating digital technologies and innovative strategies to enhance energy efficiency and sustainability. The study provides a comprehensive framework for universities to implement energy-saving measures, considering both economic benefits and environmental impact [33].
The research of [34] examines the implementation of green building concepts in the design and determine optimal design strategies for a sustainable mosque in Trisakti University Nagrak Campus using simulation methods with Autodesk Revit. The study found that a square bowl roof design optimizes the maximum power obtained from photovoltaic systems and can harvest many liters of rainwater annually. Additionally, the surrounding parks incorporate integrated bio-pores and composters to increase rainwater absorption and groundwater reserves, enhancing the mosque’s sustainability. The research highlights the importance of green building criteria such as energy efficiency, water conservation, and passive design elements like shading devices and natural lighting. The use of Building Information Modeling (BIM) software facilitated accurate integration and simulation of these design elements.
Digital Twins offer significant potential for improving efficiency and decision-making in various industries, challenges such as data integration, complexity, and ongoing maintenance must be addressed. The research of Ye et al. [35] highlights the challenges associated with Digital Twins (DTs) on the Texas A&M University Campus, including cost, complexity, interoperability, and data integration. The proposed system addresses these issues by creating a robust data integration framework, representing data in a spatial-temporal format, and developing user-friendly interfaces and dashboards for data visualization and analytics. The study demonstrates the system’s effectiveness, adaptability, and real-world applicability through case studies in domains such as fire accident management and urban planning. The system’s interactive features allow users to explore, visualize, and analyze data related to class distribution and building capacity, supporting data-driven decision-making.
Another case is that of the Pontificia Universidad Javeriana in Colombia, in which investigates the effectiveness of alternative teaching methods and digital technologies in the education of architecture and construction engineering students. The research focuses on the use of a mobile application (CAMPUS Javeriana) that integrates various digital technologies such as construction videos, photos, Building Information Modeling (BIM) models, virtual and augmented reality, and infographic images to enhance learning outcomes. The study employed a quasi-experimental design with pretest and posttest evaluations to compare the performance of control groups (traditional teaching) and experimental groups (self-directed learning with the app). The results showed significant improvements in learning outcomes and perceptions among students who used the mobile app, particularly in understanding construction processes and applying theoretical knowledge [36].
3. Methodology
To effectively convey the collected information to students, we developed a web-based content management system. The entire process of building this platform and its subsequent validation is depicted in Figure 1.
The methodology comprises several phases:
- Planning and Requirement Analysis:
The process commenced with a thorough planning and requirement analysis phase. This involved identifying the essential features for the platform, such as user authentication, quiz creation, and form submissions. To gather input, we conducted comprehensive surveys and focus groups with students and professors, aimed at understanding what information about campus buildings would be most valuable and in what formats. A strong interest was shown in learning about the designers and their intentions behind the projects.
- b.
- Material Collection:
The material collection phase was pivotal in sourcing the foundational content for the CAMPUS 2.0 platform. Collaborating closely with the Office of Infrastructure Development of PUJ, we identified four of the newest and most significant buildings (Figure 2), each with extensive technical information:
- Gerardo Arango S.J. Building: School of Arts
- Jose Gabriel Maldonado Building: Laboratories of the School of Engineering
- School of Sciences Building
- Sapiencia Tower
Then, we engaged with key members of the design teams, including architectural and structural designers, and construction managers to gain deeper insights into these buildings. Through detailed interviews, we produced over 12 thematic videos covering various topics such as general, architectural and structural descriptions, challenges and solutions, and sustainability initiatives. Extensive visual documentation, including photographs and videos of construction processes, sustainability certifications, awards, and more, complemented these interviews. This phase also involved consolidating architectural and structural drawings, forming a rich, engaging content base for the CAMPUS 2.0 platform.
The structured and systematic approach to material collection not only facilitated the creation of high-quality educational content but also ensured that the platform provided a holistic view of the campus buildings, combining technical details with personal insights from the designers. This integration of diverse materials and perspectives is expected to significantly enhance the learning experience for students and other users of the CAMPUS 2.0 platform.
- c.
- Technical Design:
This phase focused on selecting the appropriate tools for deployment. Unlike the previous version of CAMPUS, which involved a mobile app with a WordPress [37] backend, CAMPUS 2.0 was developed exclusively as a web-based application to enhance accessibility across devices while reducing the need for frequent updates. This required a dedicated development team to ensure compatibility with different ver-sions of operating systems and devices. In addition, ensuring the security of user data is crucial. This includes protection against malware, phishing and other types of attacks.
WordPress was selected as the core content management system due to its cost-effectiveness and the seamless migration it offered from the previous version.
To extend the functionality of WordPress, several key plugins were integrated. Elementor was used to create visually engaging and easily editable content pages. WP Forms Lite[38] plugin enabled custom form submissions, essential for gathering feedback, while Quiz Maker [39] facilitated the creation of interactive quizzes to assess student learning. Security was also a priority, so plugins like AuthLDAP [40] and Loginizer [41] were implemented to ensure secure user authentication and protect against potential threats. Finally, Simple Page Access Restriction [42] plugin, to control access to some pages; and, WP Mail SMTP [43], to facilitate email delivery configuration.
All components were thoroughly tested on a private server before the platform’s full deployment to ensure a stable and secure environment for users.
- d.
- UI/UX Design:
Using Elementor, the design team created visually appealing and functional layouts for the platform. The drag-and-drop interface of Elementor facilitated rapid prototyping and design adjustments based on user feedback, ensuring an intuitive and engaging user experience.
- e.
- Construction:
In this phase, team uploaded the teaching materials collected during the material collection phase using WordPress content management features. The Quiz Maker plugin enabled the creation of 15 “Learning Capsules,” which are quizzes designed to assess student comprehension. These quizzes provided immediate feedback and allowed students to retake them if necessary, enhancing the learning experience.
- f.
- Deployment:
After thorough testing, the site was transferred form the test server to a production server, wich made it accessible to the public. This critical step was carried out by the University’s TIC (Technology, Information and Communication) teams, ensuring that the platform was securely hosted and accesible online. Continuous monitoring was implemented post-deployment to quickly address any issues and make necessary adjustments, ensuring the platform’s reliability and user satisfaction.
- g.
- Validation:
The validation phase was designed to rigorously assess the effectiveness and usability of the CAMPUS 2.0 platform. To achieve this, a semantic differential study [44] was employed, a methodology well-regarded for its ability to capture nuanced user perceptions across a range of bipolar attributes, such as “Efficient - Inefficient” and “Intuitive - Confusing.” The study targeted a representative sample of students, professors and administrative staff, deliberately chosen to encompass varying levels of technological proficiency who utilized the platform during a trial period. In this case, students who were in each class at the time of the study were selected, which means that a group of participants was selected that already existed in the educational environment.
This approach ensured a comprehensive evaluation of the platform’s usability and user experience, reflecting the diverse capabilities and expectations of its intended audience. Testing process and the evaluation criteria that were based on [45].
The validation process involved designing a questionnaire) with seven-point bipolar scales (e.g. Efficient - Inefficient,” “Intuitive - Confusing”), which was administered online via Google Forms. The collected data was analyzed to identify trends and areas for improvement, offering valuable insights into the platform’s usability and user experience.
The validation process was structured around the design and administration of a detailed questionnaire, which was distributed online using Google Forms. The questionnaire consisted of seven-point bipolar scales that measured key criteria related to usability, such as efficiency, intuitiveness, and relevance, as well as factors influencing user experience, including content quality, interactivity, and overall learning impact. This method allowed for the systematic collection of quantitative data, providing a clear and measurable understanding of how well the platform met its educational objectives.
Data analysis was conducted using statistical techniques to interpret the feedback collected. By averaging responses across the scales, the research team was able to identify trends and pinpoint areas requiring further refinement. This rigorous analysis not only validated the platform’s strengths but also provided actionable insights for continuous improvement. The findings from this validation phase underscore the platform’s potential to significantly enhance user experiences and guide its future development.
4. Results
4.1. Website
The website consists of nine distinct sections, as observed in the top part of Figure 3, each designed to provide a comprehensive range of informational and educational resources. The primary goal of this website is to create an innovative digital space that facilitates the storage, management, and dissemination of technical data and detailed information about the buildings on the Pontificia Universidad Javeriana (PUJ) campus. This digital approach allows a greater accessibility for students, professors, and the broader educational community, as well as external individuals interested in the architectural and infrastructural developments at PUJ.
At the heart of the site is a Navigation Menu that directs users to key sections, including “CAMPUS 2.0” (Figure 3), which outlines the evolution of the Research-Creation Project form its first stage as Campus 1.0, along with the main objectives of the Learning Laboratory in Structures and Construction. A video further elaborates on the technologies and innovative strategies used in learning about the construction processes at the University.
A summary of all contents created and organized on the website is presented in Figure 4.
In the “buildings” section, detailed content on general, architectural, structural, and sustainability aspects of 4 buildings: 1) Gerardo Arango Puerta, S.J. Building; 2) School of Sciences Building; 3) Laboratories of Engineering School Building; 4) The Sapience Tower Building. Each building’s section includes a general overview with technical description, a brief approach to its architectural design and structural system, significant engineering and construction elements, and unique challenges and interesting facts about its development.
Additional sections like “Micro activities” has a compilation of content from different phases of the construction processes, providing universally applicable insights that are vital for any construction project. The “Laboratories” section highlights three practical laboratory sets on campus related with the construction industry: the six laboratories of the Architecture and Design School, the Engineering Laboratories, and the Design Factory, an innovation hub connected to a global network of over 42 universities. The “Lab Tests” section offers over 20 video demonstrations of practices conducted in the Civil Engineering Laboratory, while the “Field Trips” section provides guidelines for organizing and executing educational site visits.
The final section introduces the team behind Campus 2.0, comprising professors, practitioners, and strategic allies who have contributed to the project’s success. While the platform offers open access to most of its content, it is important to highlight that over one hundred unique resources have been developed. Of these, eight exclusive materials are restricted to members of the Pontificia Universidad Javeriana (Figure 5), ensuring that exclusive materials are available to the university community.
The website’s content is structured around three key pillars: a) Building Life Cycle, b) Building Supply Chain, and c) Second Design Opportunities. These concepts are integral to the digital integration of the AEC industry and its project management within an educational context, promoting virtual spaces that elucidate the complexities of construction process through effective information management. The following paragraphs and figures demonstrate how these concepts are integrated into the website’s content:
- Building Life Cycle
The site provides an exploration of the building life cycle, illustrating the journey of a building, from conceptual plans to final completion. Through a series of interconnected videos, plans, drawings and images, the content highlights the critical role of sustainability, efficiency, and coordination at each stage of a building’s life. This approach emphasizes the importance of managing a building’s lifecycle to ensure long-term value and responsible project management.
Figure 6 provides an example of this type of content, focusing on the construction process of the Laboratories of Engineering School (pouring of a concrete floor). The videos and images associated with this building show the integration of design and digital technologies, and how these elements contribute to the overall construction process.
- b.
- Building Supply Chain
The Building Supply Chain section of the website visually explains the flow of materials, tools, personnel, information, and other resources essential to the construction of a building. This content demonstrates the coordination between suppliers, manufacturers, and contractors, that is critical to maintaining project schedules and ensuring quality. An infographic as shown in Figure 7 , illustrates the operational processes involved in various construction activities were
This figure shows the work crews, materials, and procedures necessary to carry out a specific construction process. It also includes the work tools, the moments in which they should be used, and how to use them. Finally, the infographic description is accompanied by videos that allow you to listen and observe the experience of the construction process on-site.
The importance of supply chain management is also evident in the designer interviews available on the site, where stakeholders are frequently mentioned. In addition, to provide users with a deep understanding of the project participants, each building section includes detailed information about the key stakeholders involved, as shown in Figure 8.
Figure 8 shows an example from the Science School Building, where the contributions of the architect, structural engineer, and other contractors are prominently displayed.
- c.
- Second Design Opportunities
The Second Design Opportunities segment brings the concept of rethinking and repurposing existing structures to life by allowing users to explore architectural and structural processes. For example, in Figure 9, an image of a construction process for a steel structure in the Science School Building can be viewed (¡Error! No se encuentra el origen de la referencia.) and contrasted with information presented in plan drawings (¡Error! No se encuentra el origen de la referencia.).
This capability illustrates how buildings can be redesigned or retrofitted to meet new needs or improve sustainability. Users are provided with original plans and insights into the construction processes that support these transformations. This approach emphasizes the conservation of resources and the creation of innovative solutions to extend the life and functionality of buildings, consistent with the design, engineering, construction, sustainability, and economic goals for the lessons teach in architecture and engineering.
4.2. By providing Access to Detailed Plans, Construction Processes, and Examples of Successful Retrofits, the Website Not Only Highlights the Potential for Sustainable and Innovative Design, But Also Serves as a Valuable Educational Resource for Students and Professionals Alike, Reinforcing Key Principles of Modern Architecture and Engineeringuser Perception: Usability and Experience
This section presents a detailed analysis of the results obtained from the usability and user experience assessments of the Campus 2.0 platform, evaluated through a semantic differential method. A total of 235 participants, including 183 students, 34 faculty members (teachers from architecture and civil engineering), and 18 administrative staff members, rated various aspects on a scale from 1 to 7, with 1 representing the polar opposite concept “LOW” and 7 representing “HIGH”. The results indicate generally favorable perceptions of the platform across all user groups, though some significant differences were observed.
The usability of Campus 2.0 received favorable ratings across all user groups, as shown in Figure 11. However, a more nuanced analysis reveals that these perceptions are not uniform across the groups. For example, students remark that contents are more relevant to them than other criteria evaluated due to the complexity of the information presented on the site. On the other hand, university’s staff and teachers found less meaningful content in comparison with other aspects considering that the information is intended for undergraduates.
4.2.1. Usability
The usability ratings reveal that teachers and staff generally have a more positive view of Campus 2.0 compared to students, as shown in Figure 10. On average, teachers rated the platform as more “relevant” (6.56), “efficient” (6.53) and “easy to use” (6.24), while students gave lower ratings for efficiency (5.76) and found the platform more “complicated” (5.63) and “difficult” to use (5.68).
The evaluation of the Campus 2.0 usability by teachers is more favorable, with particular emphasis placed on the aspects of “efficiency” (6.11), “interactivity” (5.06), “immersion” (5.47), and “stimulation” (6.61). This suggests they view Campus 2.0 as a valuable and engaging instrument. In contrast, students have a slightly negative perception, rating the platform less on “efficiency” (5.56), “interactivity” (5.29), and “stimulation” (5.49), and more on “difficulty” (5.76) and lack of “clarity” (5.63). This indicates that their perception is complex and unappealing.
For example, “efficiency” received an average rating of 6.10, reflecting a generally favorable perception. However, the breakdown of this rating shows that students gave a lower average of 5.76, while teachers rated it significantly higher at 6.53, and staff gave a mid-range rating of 6.00. This may suggest that students had difficulty using the platform efficiently, possibly due to a less intuitive interface or a steeper learning curve compared to teachers and staff. Teachers and staff, who may have more experience with similar tools or more specialized needs, perceive the platform to work well.
In terms of “simplicity” and “ease to use”, a similar pattern emerges. Students rated the platform as more “complicated” (5.63) and “difficult” (5.68), while faculty members gave higher ratings for both: 6.24 and 6.09, respectively. The higher ratings from teachers and staff may indicate that these groups find the platform’s design and interface in line with their expectations or usage patterns, while students may require more guidance or that additional training might be necessary. Aspect that seems made sense, because the validation time with students was shorter than the other users, because of availability.
Related with “relevance” and “obviousness”, the analysis highlights usability concerns, particularly for students. The relevance of the platform’s features was rated lower by students (5.56), compared to the significantly higher ratings from teachers (6.53) and staff (6.56). Similarly, the “obviousness” of the platform—how easily users can navigate and locate information—was rated lower by students (5.29) than by teachers (6.09) and staff (6.00). This indicates that students may find some of the content of the platform less relevant to their needs or may find it challenging to identify the most pertinent features.
Overall, the usability analysis shows a clear trend: all user group have a positive view of the Campus 2.0 platform. Some discrepancies suggest that while the platform is functional and effective for experienced users like teachers and staff, students may struggle with the interface and find it less intuitive. This could be due to differences in experience, expectations, or the specific use cases of each group. The lower scores (but not bad) from students across various categories highlight potential areas for improvement, particularly in making the platform more intuitive, accessible, and relevant to their needs or suggest that additional user support for students may be needed to bridge this usability gap.
4.2.2. User Experience
The evaluation of the Campus 2.0 experience shows a more diverse and complex landscape compared to its usability. Figure 11 shows that staff members generally gave the most positive ratings, while students consistently rated the platform lower on various aspects. The highest rating across all groups is “attractive,” with staff giving the highest rating (6.25), followed closely by faculty (6.24), indicating a strong appreciation for the visual or structural appeal of the platform. Among students, the highest rating was for “effectiveness” (5.89), suggesting that despite some usability concerns, they find it less intuitive and more challenging to navigate.
Figure 11.
Semantic Differential Averages by Groups for Campus 2.0 User Experience.
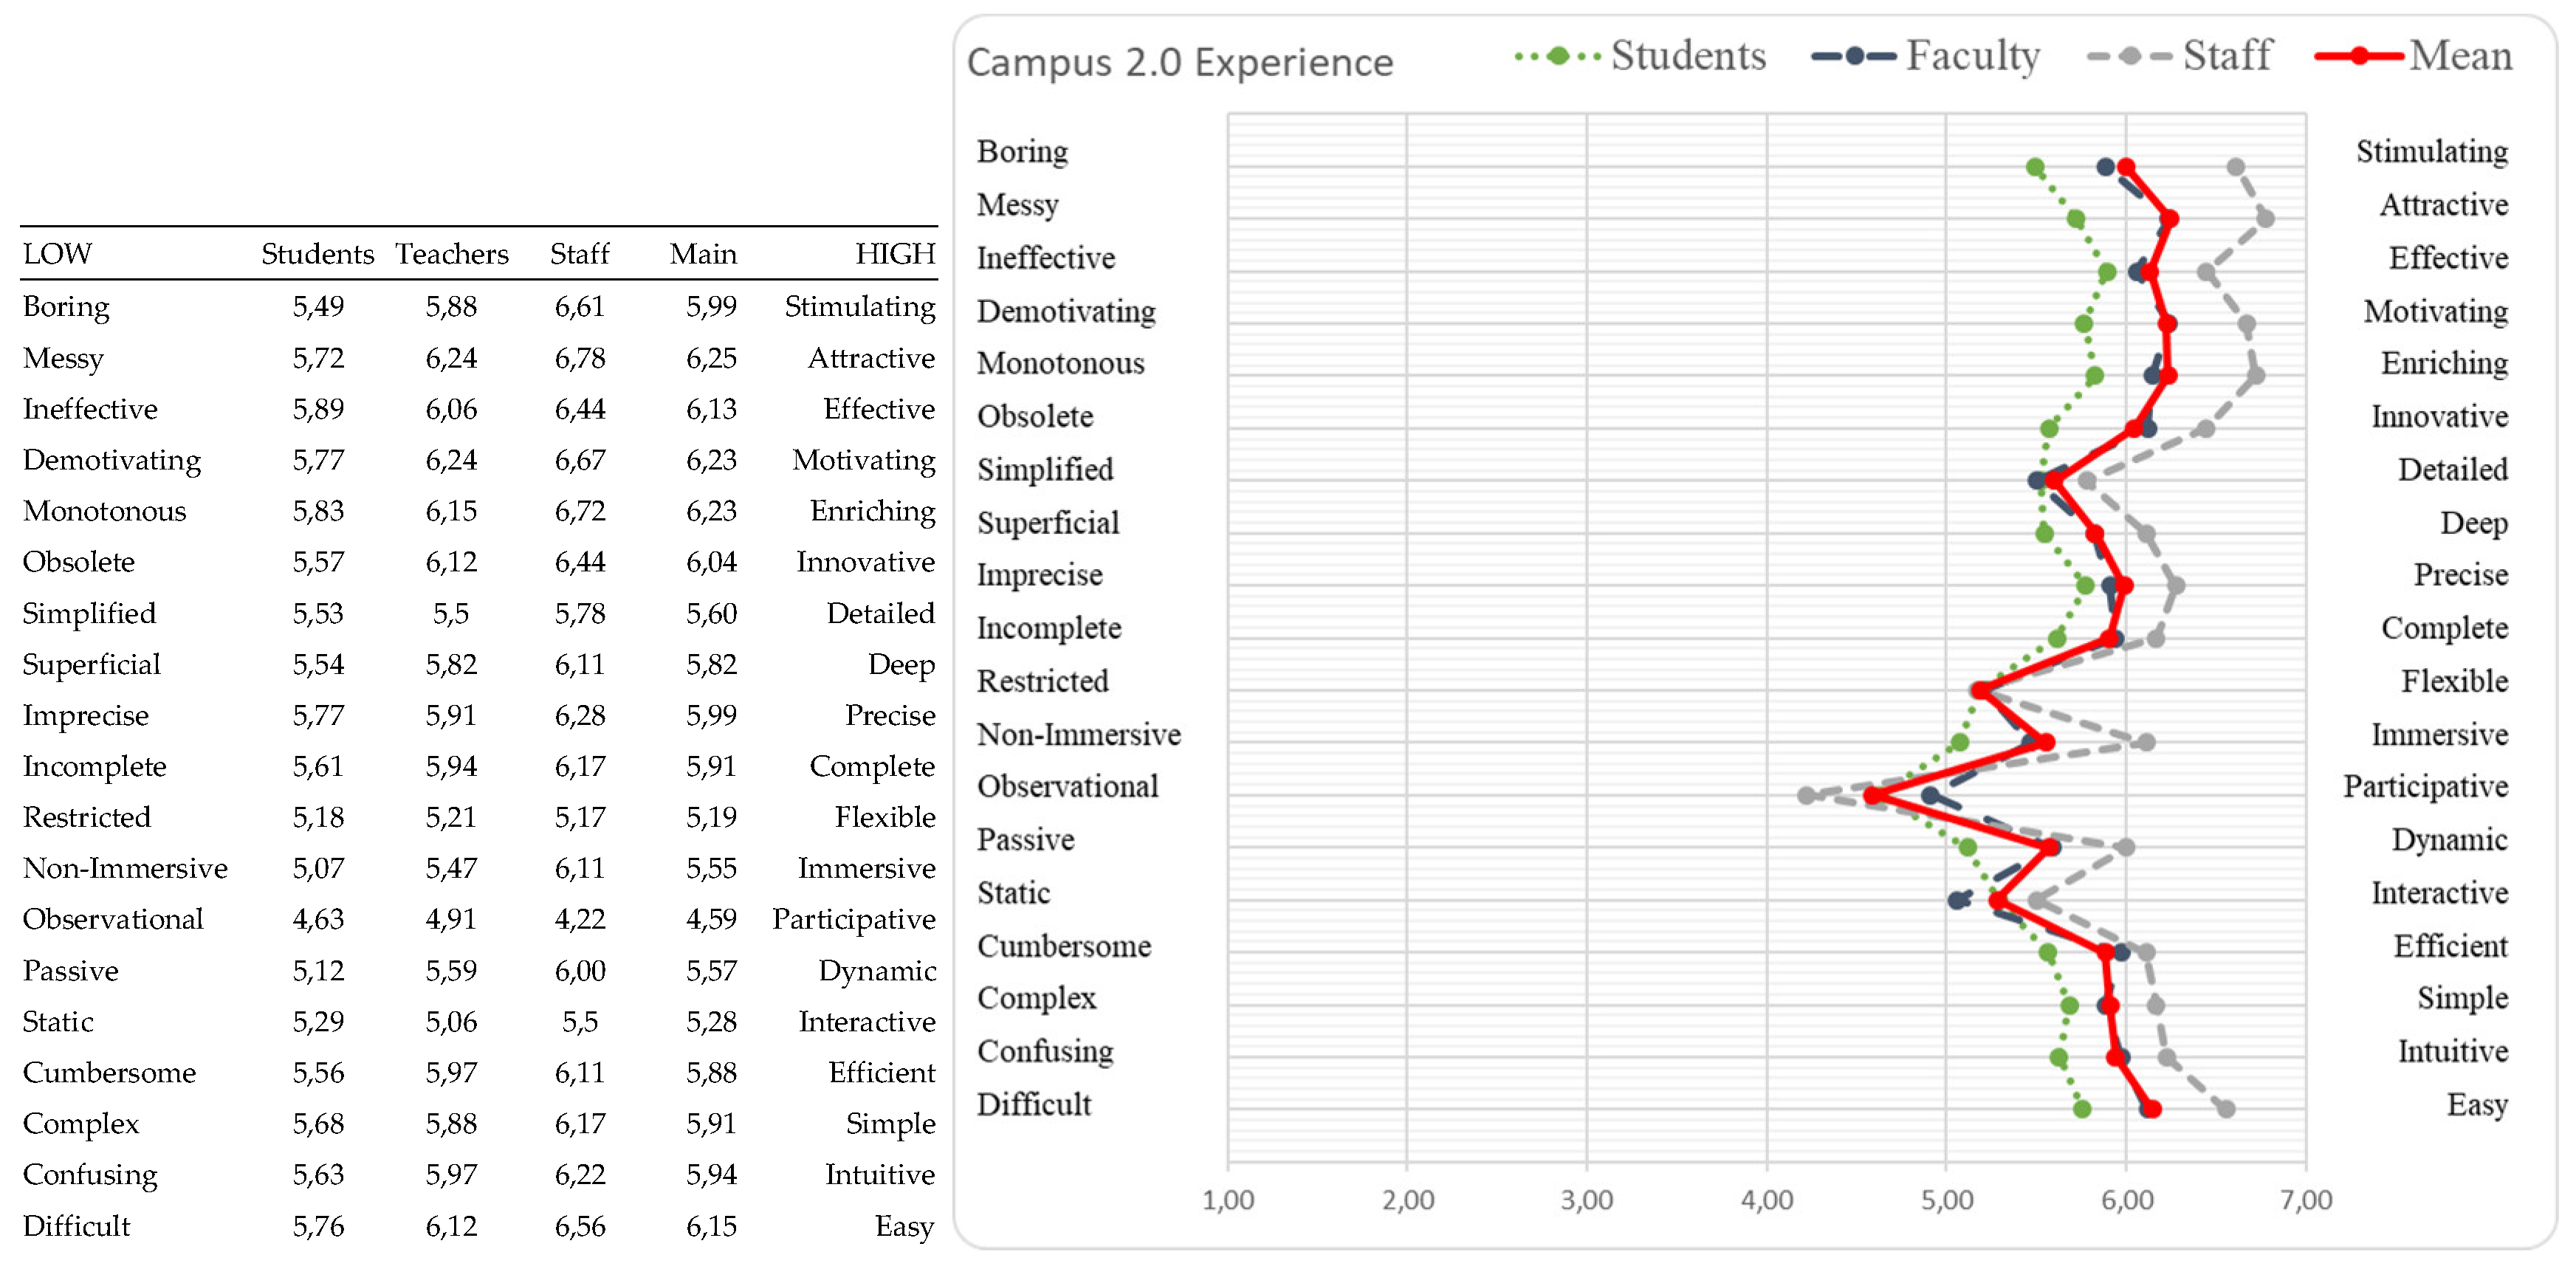
General results suggest that teachers find Campus 2.0 to be a valuable, engaging and well-designed tool. However, the lowest ratings across all groups were in the “participation/observation” aspect, with students giving the lowest score (4.63), followed by teachers (4.91), and staff members (4.22). This highlights a significant area for improvement, as it shows that the platform may not be sufficiently engaging or participatory, especially for students.
Examining data in Figure 11, several positive aspects emerge. “Attractiveness” received the highest average (6.25), with particularly strong rating from staff and teachers (6.78 and 6.24), indicating that design and aesthetics of the platform are highly appreciated across user groups, specially by those with more experience. The cases of “motivation” and “stimulation” (6.23 and 5.99) are aspects with strong positive perceptions, reflecting high levels of engagement (mainly in teachers and staff), which reveal that platform effectively meets the professional needs and expectations in general but is suggested a need to improve the platform’s ability to captivate and inspire student users.
On the other hand, students perceive the campus as more difficult (5.76) and confusing (5.63) than other groups, suggesting that the interface may not be intuitive enough for them. This reinforces the need for additional support to ease their learning curve. The ratings for “interactivity” and “dynamism” show a similar pattern. The lower ratings from students for “interactivity” (5.29) and “dynamism” (5.12) compared to teachers (5.59 and 5.59) and staff (6.00 and 6.00) indicates that students may not be fully engaging with interactive features of site or might find the platform less dynamic and engaging compared to the other groups.
In conclusion, results about user experience of Campus 2.0’s highlights strengths and opportunities for improvement. The platform is well received by every user group, especially teachers and staff, suggesting that it effectively meets their needs. However, the lower ratings from students, particularly in terms of difficulty, confusion, and interactivity, may indicate that the platform may require adjustments to better supply to their needs.
4.2.3. Comparative Analysis and Correlation of Perceptions
The previous results were further examined using Pearson’s correlation analysis to determine the relationships between the different user groups’ perceptions. As shown in Table 1, the analysis yielded high positive correlations, with coefficients of 0.77 for usability and 0.76 for user experience between the groups.
Additionally, the p-values for these correlations are significantly less than 0.05, indicating that the correlations are statistically significant. These findings suggest a strong alignment in the perceptions of students, faculty, and staff regarding the strengths and weaknesses of Campus 2.0, despite some differences in specific aspects.
5. Conclusions
This study aimed to evaluate the experience and usability of Campus 2.0 among its users at the Pontificia Universidad Javeriana, as part of a broader investigation into the digital transformation of university architecture. The platform was recognized for its ability to improve the educational experience within the PUJ, with average ratings consistently about 5 on the scale. This reflects a generally positive perception among students, teachers, and staff, with certain aspects such as the attractiveness, motivation, and enrichment potential of the platform being particularly well received. These strengths highlight the platform role as an effective tool for managing building information in a university context.
Campus 2.0 ability to present building life cycle data allows users to track the development, maintenance and eventual decommissioning of university infrastructure. This is critical for long term planning and sustainability, ensuring that buildings are managed throughout their lifetime. Similarly, the integration of the building supply chain into the platform facilitates efficient procurement and resource management, reorganizing processes and improving transparency. The emphasis on second design opportunities further distinguishes Campus 2.0, offering users the ability to explore renovation, adaptation, and reuse opportunities within the campus environment, encouraging innovative approaches to infrastructure development.
However, the study also identified several limitations that must be considered when interpreting the results. One important limitation is the educational focus that shaped the validation conducted with students. As a digitally native generation, students tend to expect highly interactive and dynamic platforms, and view these features as critical for effective learning. These expectations contrast with those of other user groups, who often prioritize stability and the practical utility of information for documenting construction processes and managing data. These different expectations led to varied evaluations of the Campus 2.0, highlighting the need to consider these differences when analyzing usability and planning future enhancements.
Another limitation is the narrow contextual scope of the study, which was limited to a single university environment. While the findings are relevant to Pontificia Universidad Javeriana, they may not be directly applicable to other institutions or educational settings. Different universities may have unique needs and expectations, suggesting that Campus 2.0 may require adaptations to be effective in other contexts.
In addition, the technology choices that support Campus 2.0, such as the WordPress based content management system and various plugins, while facilitating its implementation, also impose certain constraints. Future enhancements aimed at increasing interactivity, integrating augmented reality (AR) and virtual reality (VR), or introducing new functionalities may require a thorough technology review and a restructuring of the platform.
To improve Campus 2.0 in the future, several options should be explored. Integrating emerging technologies such as AR and virtual reality VR could increase user engagement by providing more interactive and dynamic experiences. Improving interactivity through intuitive interfaces and features such as real time simulations could better meet student expectations and boost engagement. Customizing content to individual user needs with personalized profiles could increase relevance and satisfaction, and expanding the platform functionality to serve different educational contexts and user groups could broaden its impact.
Despite limitations, Campus 2.0 stands as an innovative and usable tool for building information management within the university context, effectively supporting infrastructure management across the building lifecycle, supply chain, and design opportunities. By focusing on these pillars and adapting the platform to better meet these diverse needs could ensure that it remains a vital tool in the university digital transformation efforts, driving both educational and operational excellence.
Author Contributions
Conceptualization: D.C.-B., C.V.-B., A.S., and R.C.P., methodology: D.C.-B., C.V.-B., A.S., J.P.-M., C.G.-L., and R.C.P.; software: J.P.-M.; formal analysis: D.C.-B., C.V.-B., A.S., J.P.-M., R.C.P., and C.G.-L.; writing—original draft: D.C.-B., C.V.-B., A.S., J.P.-M., R.C.P., and C.G.-L.; writing—review and editing: D.C.-B., C.V.-B., A.S., J.P.-M., and R.C.P; project administration, D.C.-B. All authors have read and agreed to the published version of the manuscript.
Funding
This research was funded by Pontificia Universidad Javeriana, through the call “Apoyo a proyectos de creación e investigación+creación (VRI10-2021)” with the project entitled “CAMPUS – Fase 2 (ID 20436)” and The APC was funded by Pontificia Universidad Javeriana, Colombia.
Data Availability Statement
Data supporting reported results are available on request from the corresponding author.
Acknowledgments
We gratefully acknowledge the financial support from the Pontificia Universidad Javeriana, Colombia. We would also like to express our sincere appreciation to Gloria Mercedes Zuloaga for her invaluable support and dedicated work during the development of the website and the testing phase with students. Additionally, we thank the “ Dirección de Recursos Físicos” and Laboratory of the School of Engineering of Pontificia Universidad Javeriana, architects and designers, for their support and collaboration in collecting technical information about the buildings. We are also grateful to all professors who contributed to the development of the contents.
Declaration of Generative AI and AI-assisted technologies in the writing process
During the preparation of this paper, the authors used Deeply and Grammarly in order to improve readability, spelling and grammar. After using this tool, the authors reviewed and edited the content as needed and take full responsibility for the content of the publication.
Conflicts of Interest
The authors
References
- Azhar, S. Building information modeling (BIM): Trends, benefits, risks, and challenges for the AEC industry. Leadership and Management in Engineering 2011, 11, 241–252. [Google Scholar] [CrossRef]
- Hajirasouli, A.; Banihashemi, S. Augmented reality in architecture and construction education: state of the field and opportunities. International Journal of Educational Technology in Higher Education 2022, 19, 1–28. [Google Scholar] [CrossRef]
- Ding, Z.; Liu, S.; Liao, L.; Zhang, L. A digital construction framework integrating building information modeling and reverse engineering technologies for renovation projects. Autom Constr 2019, 102, 45–58. [Google Scholar] [CrossRef]
- Wu, Y.C.; Yang, J.C. The Effects of the Social Media-Based Activities and Gaming-Based Learning in Construction Education. in Proceedings - 2015 IIAI 4th International Congress on Advanced Applied Informatics, IIAI-AAI 2015, Institute of Electrical and Electronics Engineers Inc., Jan. 2016, pp. 323–328. [CrossRef]
- Yang, T.; Gra, J. Optimising Project Management Performance Through Digital Supply Chain Management. pp. 63–77, 2023. [CrossRef]
- Salem, T.; Dragomir, M. Options for and Challenges of Employing Digital Twins in Construction Management. Applied Sciences (Switzerland) 2022, 12. [Google Scholar] [CrossRef]
- Araszkiewicz, K. Digital Technologies in Facility Management - The state of Practice and Research Challenges. Procedia Eng 2017, 196, 1034–1042. [Google Scholar] [CrossRef]
- Norman, D. , Emotional Design: why we love (or hate) everyday things. Cambridge: Basic Books, 2004.
- Slaughter, E.S. Models of Construction Innovation. J Constr Eng Manag 1998, 124, 226–231. [Google Scholar] [CrossRef]
- Shojaei, R.S.; Oti-Sarpong, K.; Burgess, G. Enablers for the adoption and use of BIM in main contractor companies in the UK. Engineering, Construction and Architectural Management 2023, 30, 1726–1745. [Google Scholar] [CrossRef]
- Davies, A.; Lenfle, S.; Loch, C.H.; Midler, C. Introduction: building bridges between innovation and project management research. in Handbook on Innovation and Project Management, Edward Elgar Publishing, 2023, pp. 1–34. [CrossRef]
- Berardi, U. Clarifying the new interpretations of the concept of sustainable building. Sustain Cities Soc 2013, 8, 72–78. [Google Scholar] [CrossRef]
- Omar, H.; Dulaimi, M. Solutions for effective diffusion of BIM for BIM late adopters: case study of UAE AEC industry. International Journal of Construction Management 2023, 23, 1484–1493. [Google Scholar] [CrossRef]
- Loo, B.P.Y.; Wong, R.W.M. Towards a Conceptual Framework of Using Technology to Support Smart Construction: The Case of Modular Integrated Construction (MiC). Buildings 2023, 13, 372. [Google Scholar] [CrossRef]
- Sacks, R.; Eastman, C.; Lee, G.; Teicholz, P.; Wiley, B.I.H. , 2018. [CrossRef]
- Barbosa, F.; et al. Reinventing construction: A route to higher productivity.. Brussles, Feb. 2017.
- Osman, A.M.; Liu, Y.; Wang, Z. Influence of Organizational Culture on Construction Firms’ Performance: The Mediating Roles of Innovation and Marketing Capabilities. Buildings 2023, 13, 308. [Google Scholar] [CrossRef]
- Azhar, S. Building Information Modeling (BIM): Trends, Benefits, Risks, and Challenges for the AEC Industry. Leadership and Management in Engineering 2011, 11, 241–252. [Google Scholar] [CrossRef]
- Khosrowshahi, F.; Arayici, Y. Roadmap for implementation of BIM in the UK construction industry. Engineering, Construction and Architectural Management 2012, 19, 610–635. [Google Scholar] [CrossRef]
- Meng, Q.; Peng, Q.; Li, Z.; Hu, X. Big Data Technology in Construction Safety Management: Application Status, Trend and Challenge. Buildings 2022, 12, 533. [Google Scholar] [CrossRef]
- Oke, A.; Kineber, A.; Albukhari, I.; Othman, I.; Kingsley, C. Assessment of Cloud Computing Success Factors for Sustainable Construction Industry: The Case of Nigeria. Buildings 2021, 11, 36. [Google Scholar] [CrossRef]
- Tao, F.; Zhang, M.; Nee, A.Y. Digital twin driven smart manufacturing, Academic Press. London: Matthew Deans, 2019.
- Lavikka, R.; Kallio, J.; Casey, T.; Airaksinen, M. Digital disruption of the AEC industry: technology-oriented scenarios for possible future development paths. Construction Management and Economics 2018, 36, 635–650. [Google Scholar] [CrossRef]
- Manzoor, B.; Othman, I.; Pomares, J.C. Digital technologies in the architecture, engineering and construction (Aec) industry—a bibliometric—qualitative literature review of research activities. Int J Environ Res Public Health 2021, 18. [Google Scholar] [CrossRef]
- Dosumu, O.S.; Mahame, C.; Niyitegeka, S.; Hahiirwuwambaza, J.A. Applications and Challenges of Adopting the Internet of Things (IoT) in the Rwandan Construction Industry. Journal of Construction in Developing Countries 2023, 28, 81–100. [Google Scholar] [CrossRef]
- Yap, J.B.H.; Lee, K.P.H.; Skitmore, M.; Lew, Y.L.; Lee, W.P.; Lester, D. PREDICTORS TO INCREASE SAFETY TECHNOLOGY ADOPTION IN CONSTRUCTION: AN EXPLORATORY FACTOR ANALYSIS FOR MALAYSIA. Journal of Civil Engineering and Management 2023, 29, 157–170. [Google Scholar] [CrossRef]
- Alizadehsalehi, S.; Hadavi, A.; Huang, J.C. From BIM to extended reality in AEC industry. Autom Constr 2020, 116. [Google Scholar] [CrossRef]
- Winter, J. Business Model Innovation in the German Industry: Case Studies from the Railway, Manufacturing and Construction Sectors. Journal of Innovation Management 2023, 11, 1–17. [Google Scholar] [CrossRef]
- Hazarika, N.; Zhang, X. Factors that drive and sustain eco-innovation in the construction industry: The case of Hong Kong. J Clean Prod 2019, 238. [Google Scholar] [CrossRef]
- Porter, M.E.; Van Der Linde, C. Toward a New Conception of the Environment-Competitiveness Relationship. 1995.
- Ullah, H.; Zhang, H.; Huang, B.; Gong, Y. BIM-Based Digital Construction Strategies to Evaluate Carbon Emissions in Green Prefabricated Buildings. Buildings 2024, 14, 1689. [Google Scholar] [CrossRef]
- De Oliveira Faria, N.; et al. Redefining a campus tour with virtual reality Virginia Tech students base their interactive design on survey feedback. 2021. [Online]. Available: www.iise.org/ISEmagazine.
- Wai, R.J. Systematic Design of Energy-Saving Action Plans for Taiwan Campus by Considering Economic Benefits and Actual Demands. Energies (Basel) 2022, 15. [Google Scholar] [CrossRef]
- Perdana, A. Optimizing green sustainable mosque criteria : A case study of Trisakti University nagrak campus mosque design. in IOP Conference Series: Earth and Environmental Science, Institute of Physics, 2024. [CrossRef]
- Ye, X.; Jamonnak, S.; Van Zandt, S.; Newman, G.; Suermann, P. Developing campus digital twin using interactive visual analytics approach. Frontiers of Urban and Rural Planning 2024, 2. [Google Scholar] [CrossRef]
- Valbuena-Bermúdez, C.; Lozano-Ramírez, N.E.; Serrano-Sierra, A.; Granados-León, C. CAMPUS: A mobile app for construction processes learning and teaching in higher education. Computer Applications in Engineering Education 2024. [Google Scholar] [CrossRef]
- WordPress, “WordPress.com: Build a Site, Sell Your Stuff, Start a Blog & More.” Accessed: Jul. 16, 2024. [Online]. Available: https://wordpress.com/.
- WPForms, L. WPForms – Easy Form Builder for WordPress – Contact Forms, Payment Forms, Surveys, & More – WordPress plugin | WordPress.org.” Accessed: Jul. 16, 2024. [Online]. Available: https://wordpress.org/plugins/wpforms-lite/.
- Plugins, A.Y.P. Quiz Maker – WordPress plugin | WordPress.org Corsu.” Accessed: Jul. 16, 2024. [Online]. Available: https://co.wordpress.org/plugins/quiz-maker/.
- Heigl, A. authLdap – WordPress plugin | WordPress.org.” Accessed: Jul. 16, 2024. [Online]. Available: https://wordpress.org/plugins/authldap/.
- Loginizer, “Loginizer – WordPress plugin | WordPress.org.” Accessed: Jul. 28, 2024. [Online]. Available: https://co.wordpress.org/plugins/loginizer/.
- Plugins & Snippets, “Simple Page Access Restriction – WordPress plugin | WordPress.org.” Accessed: Jul. 16, 2024. [Online]. Available: https://wordpress.org/plugins/simple-page-access-restriction/.
- WPForms, L. WP Mail SMTP by WPForms – The Most Popular SMTP and Email Log Plugin – WordPress plugin | WordPress.org.” Accessed: Jul. 16, 2024. [Online]. Available: https://wordpress.org/plugins/wp-mail-smtp/.
- Osgood, C.E.; Suci, G.J.; Tannenbaum, P.H. The Measurement of Meaning. Language (Baltim) 1957, 35, 58. [Google Scholar] [CrossRef]
- Stoklasa, J.; Talášek, T.; Stoklasová, J. Semantic differential for the twenty-first century: scale relevance and uncertainty entering the semantic space. Qual Quant 2019, 53, 435–448. [Google Scholar] [CrossRef]
Figure 1.
Methodology.
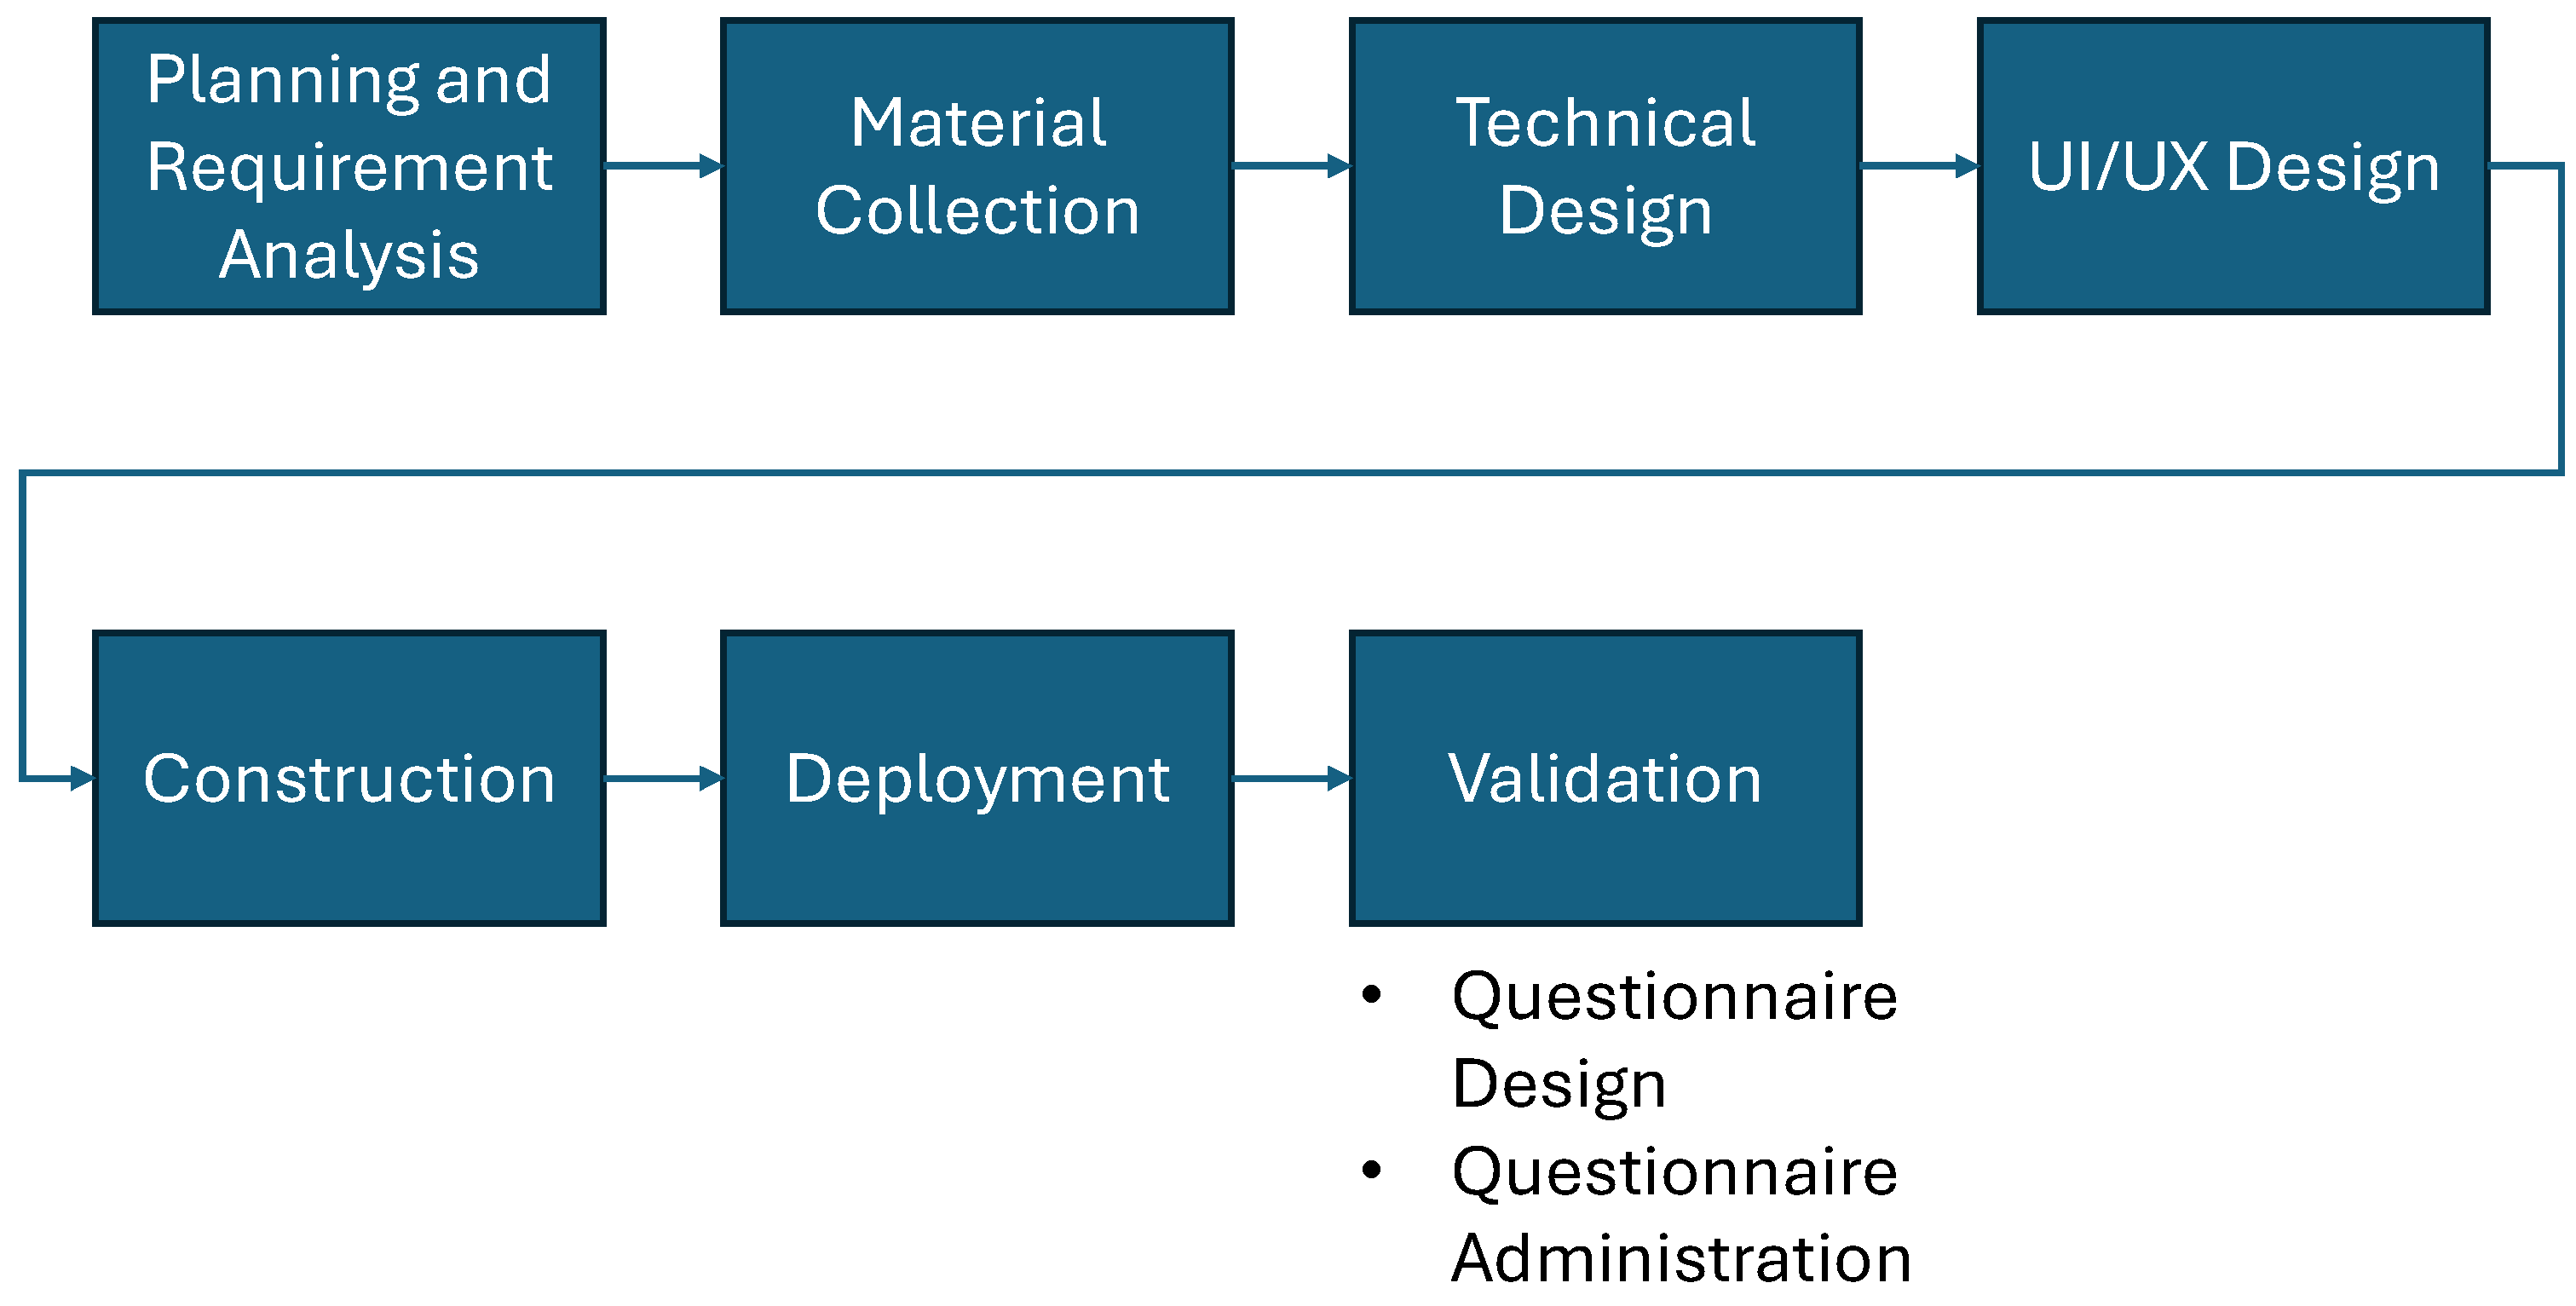
Figure 2.
List of Buildings incorporated in Campus Web.
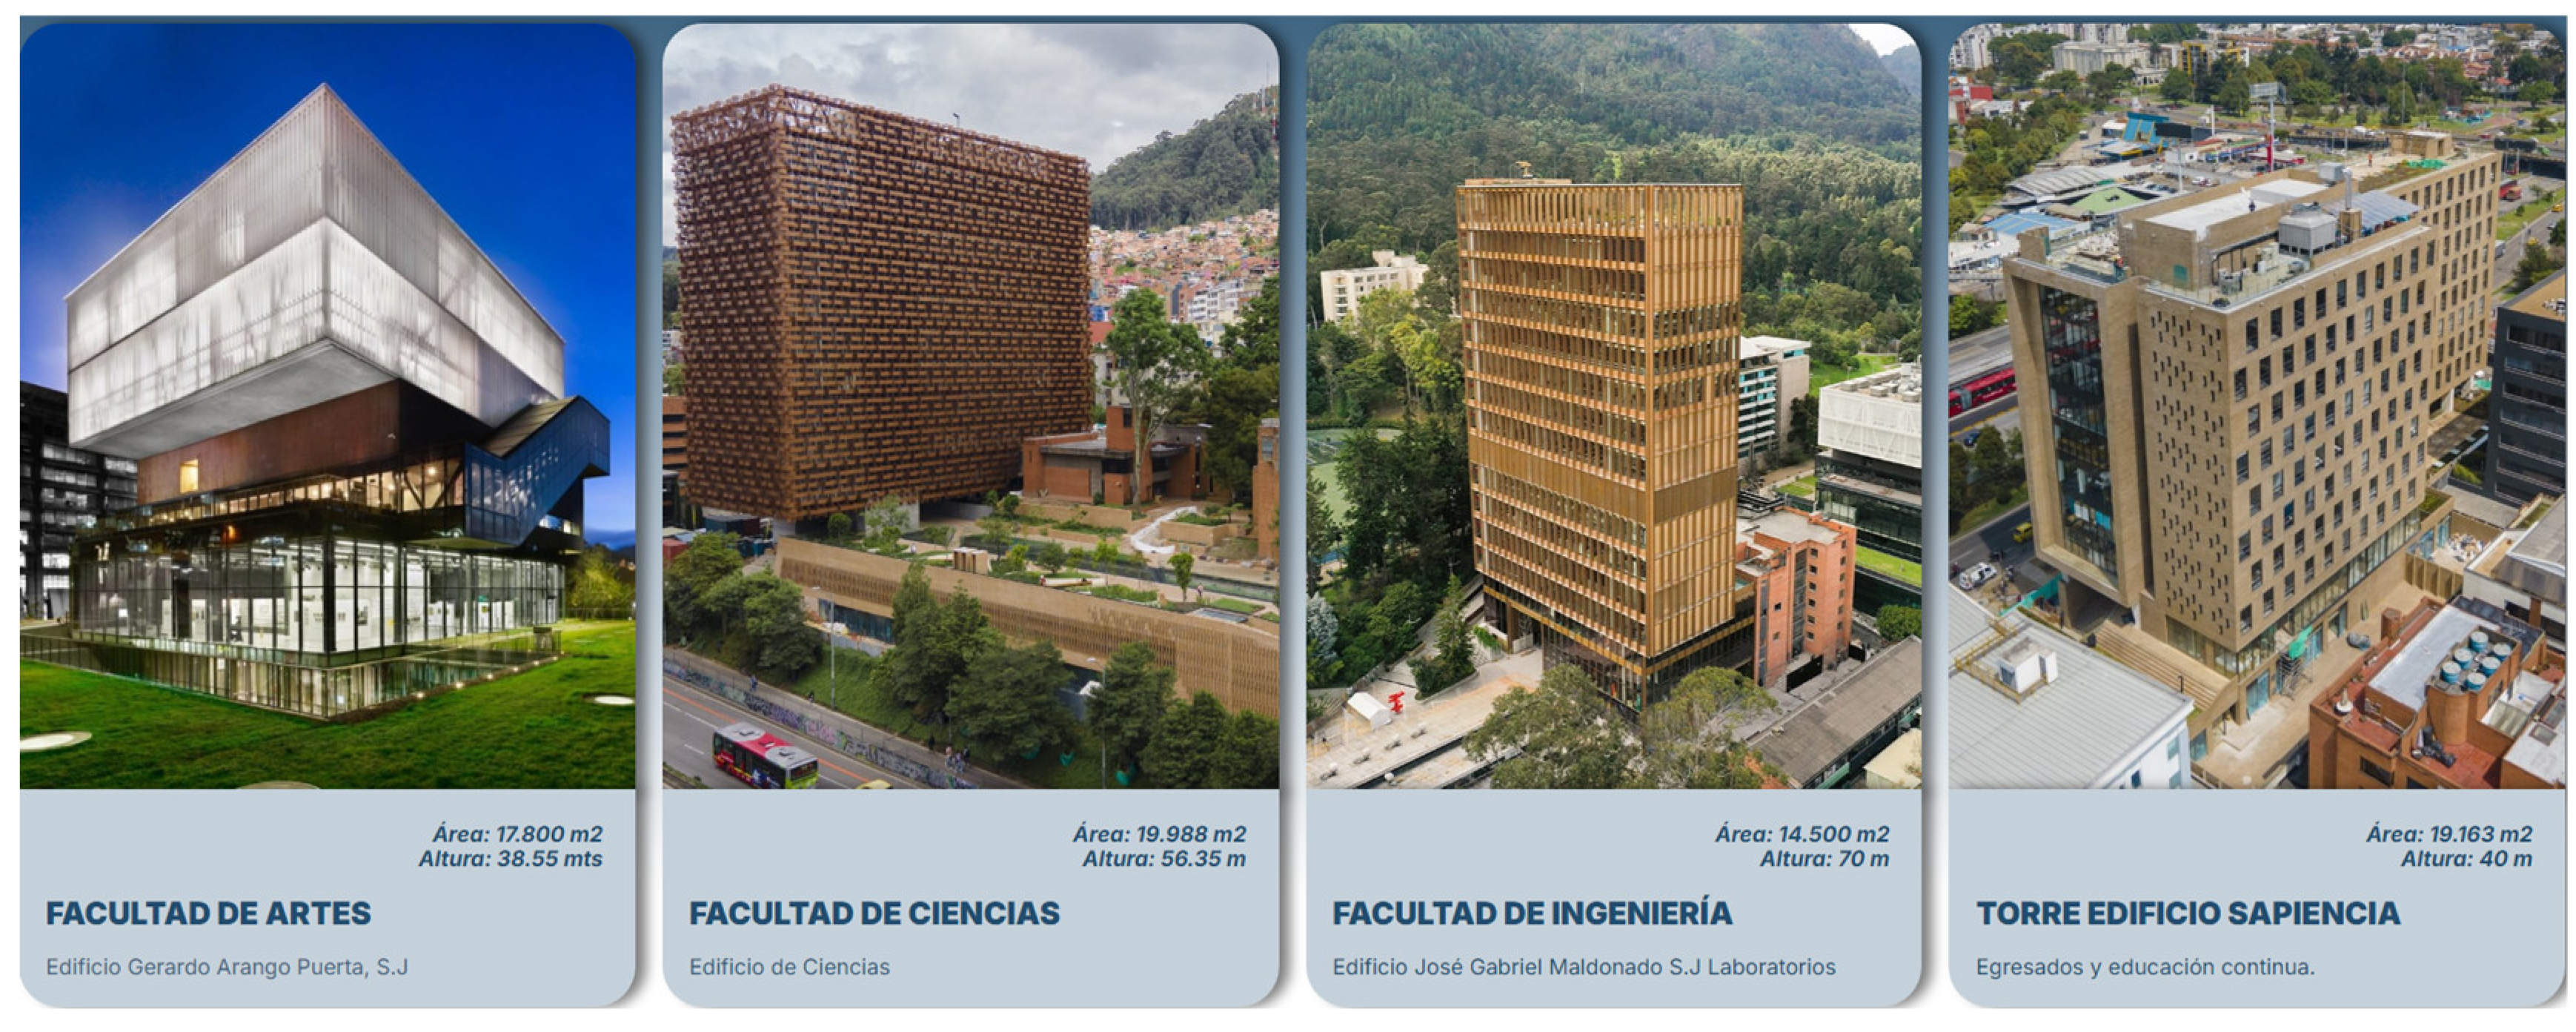
Figure 3.
Homepage Campus Web 2024.
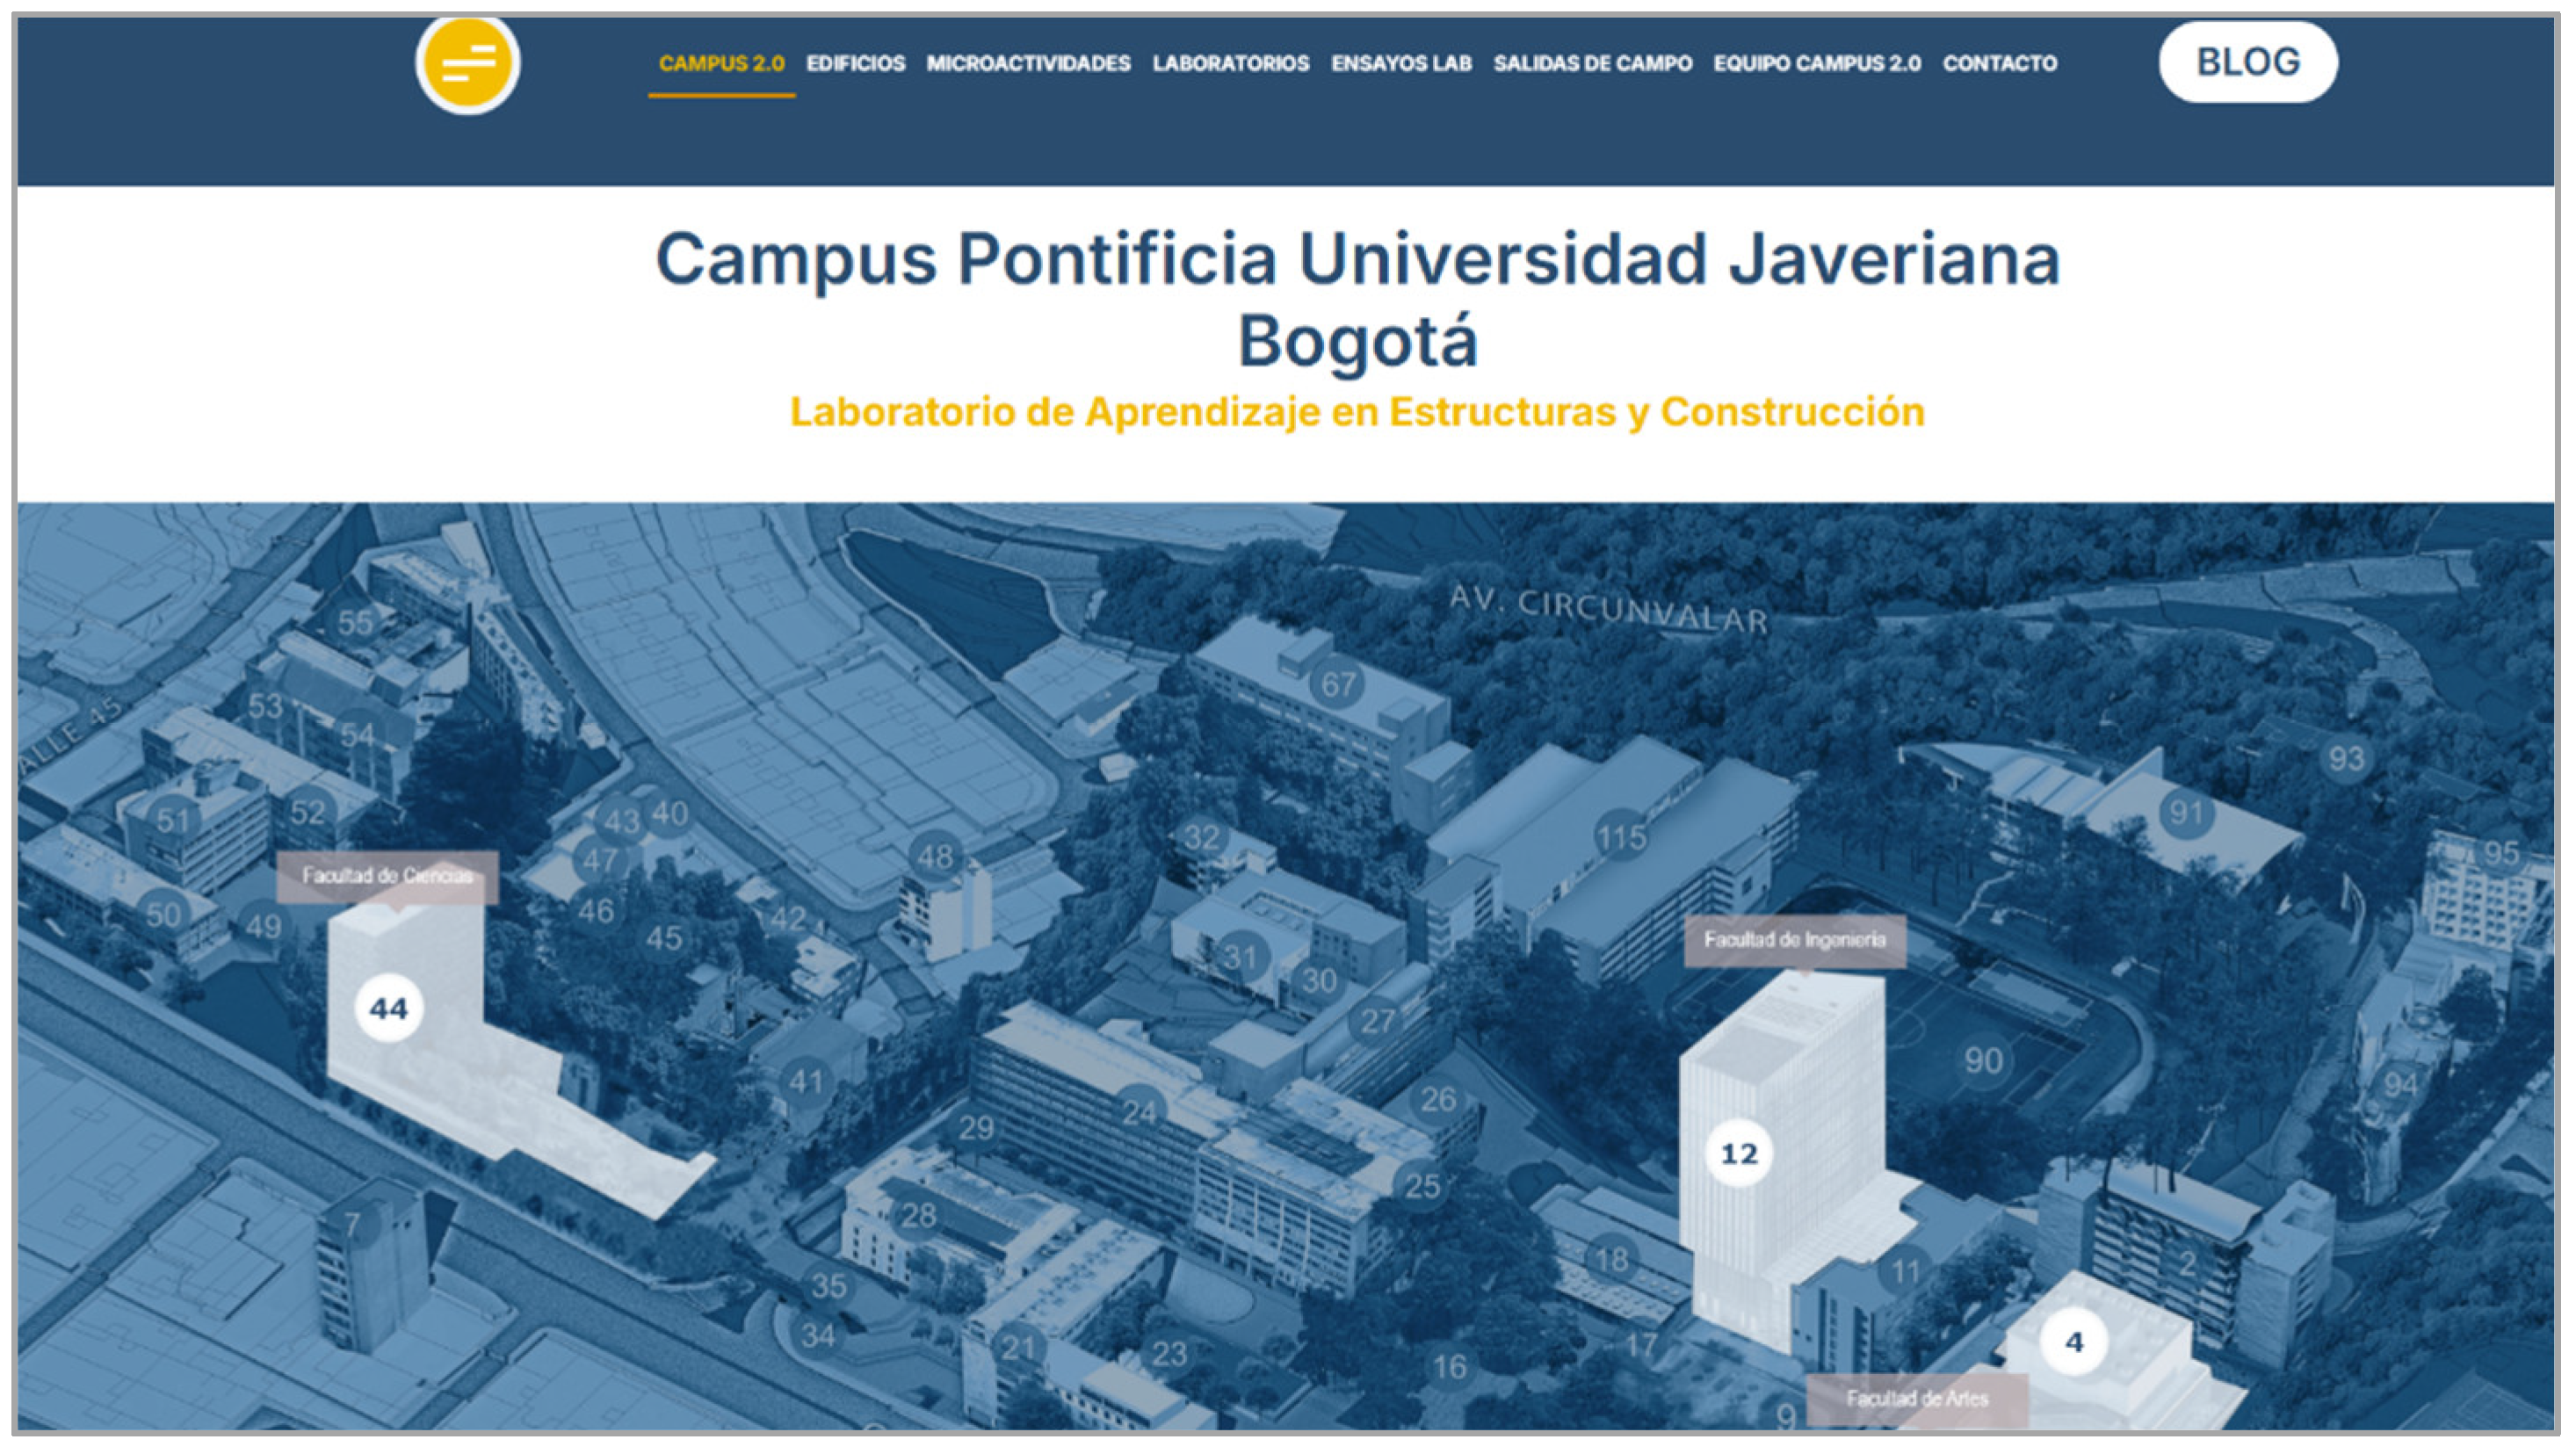
Figure 4.
Conceptual Frame summarizing all contents developed.

Figure 5.
Main Menu, School of Science Building’s planimetry restrictive content. Access the website here: https://www.javeriana.edu.co/construlab/.
Figure 5.
Main Menu, School of Science Building’s planimetry restrictive content. Access the website here: https://www.javeriana.edu.co/construlab/.
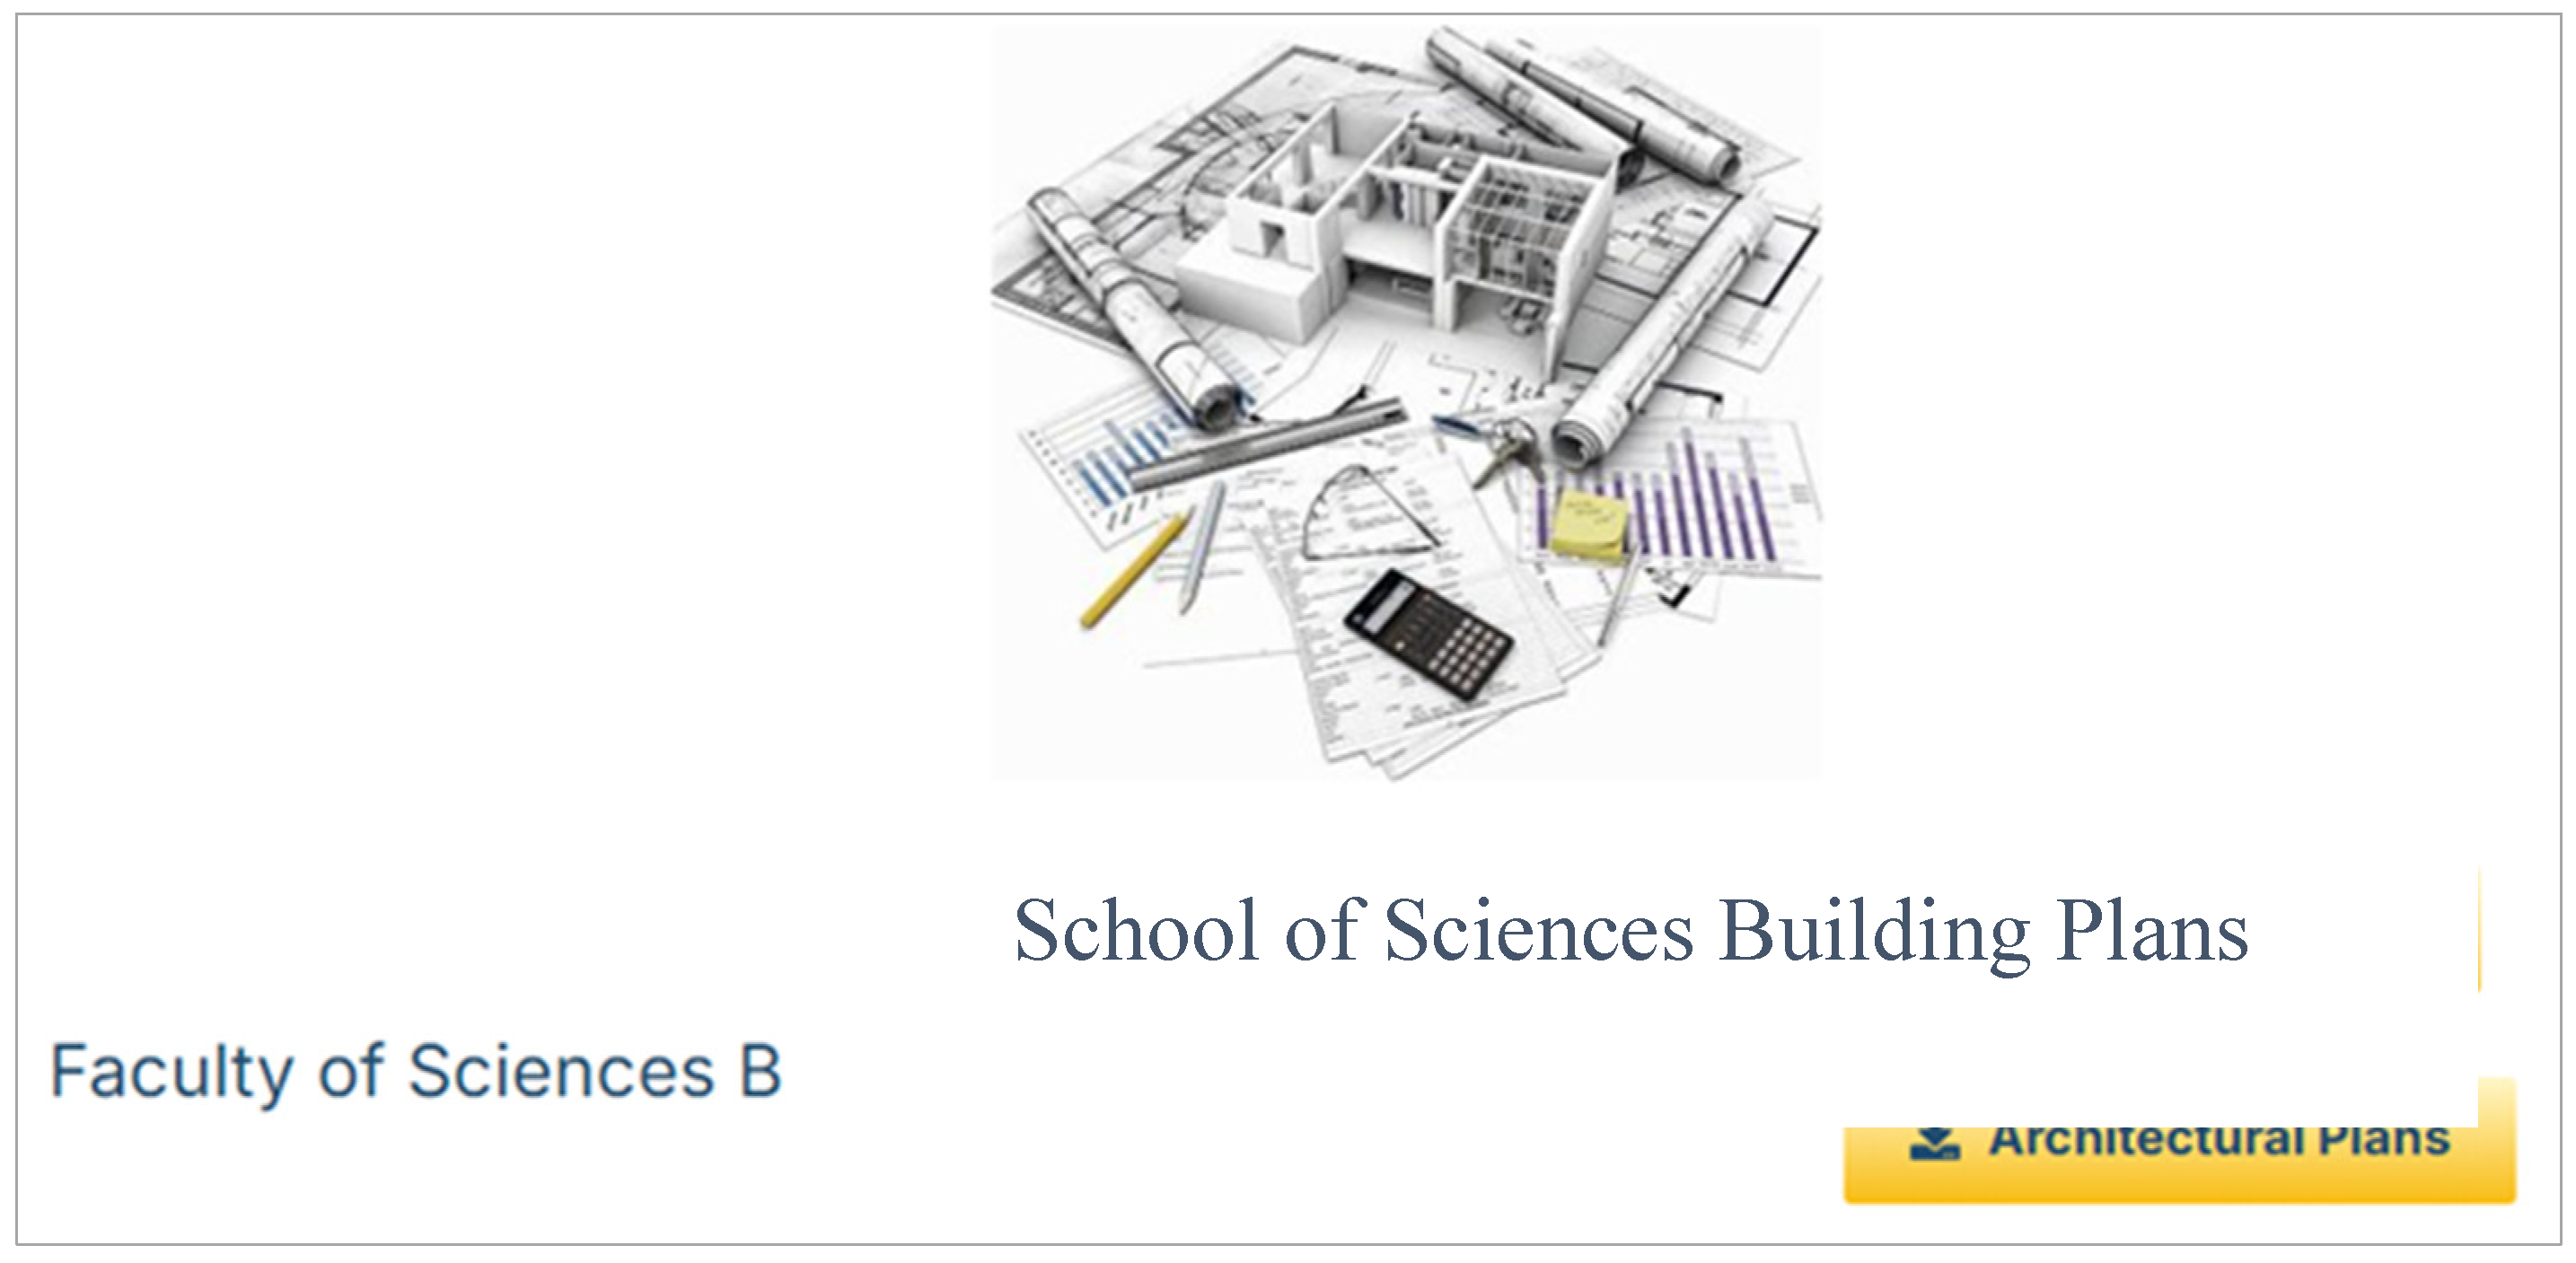
Figure 6.
Videos on the Campus 2.0 Website: Pouring of a concrete floor.
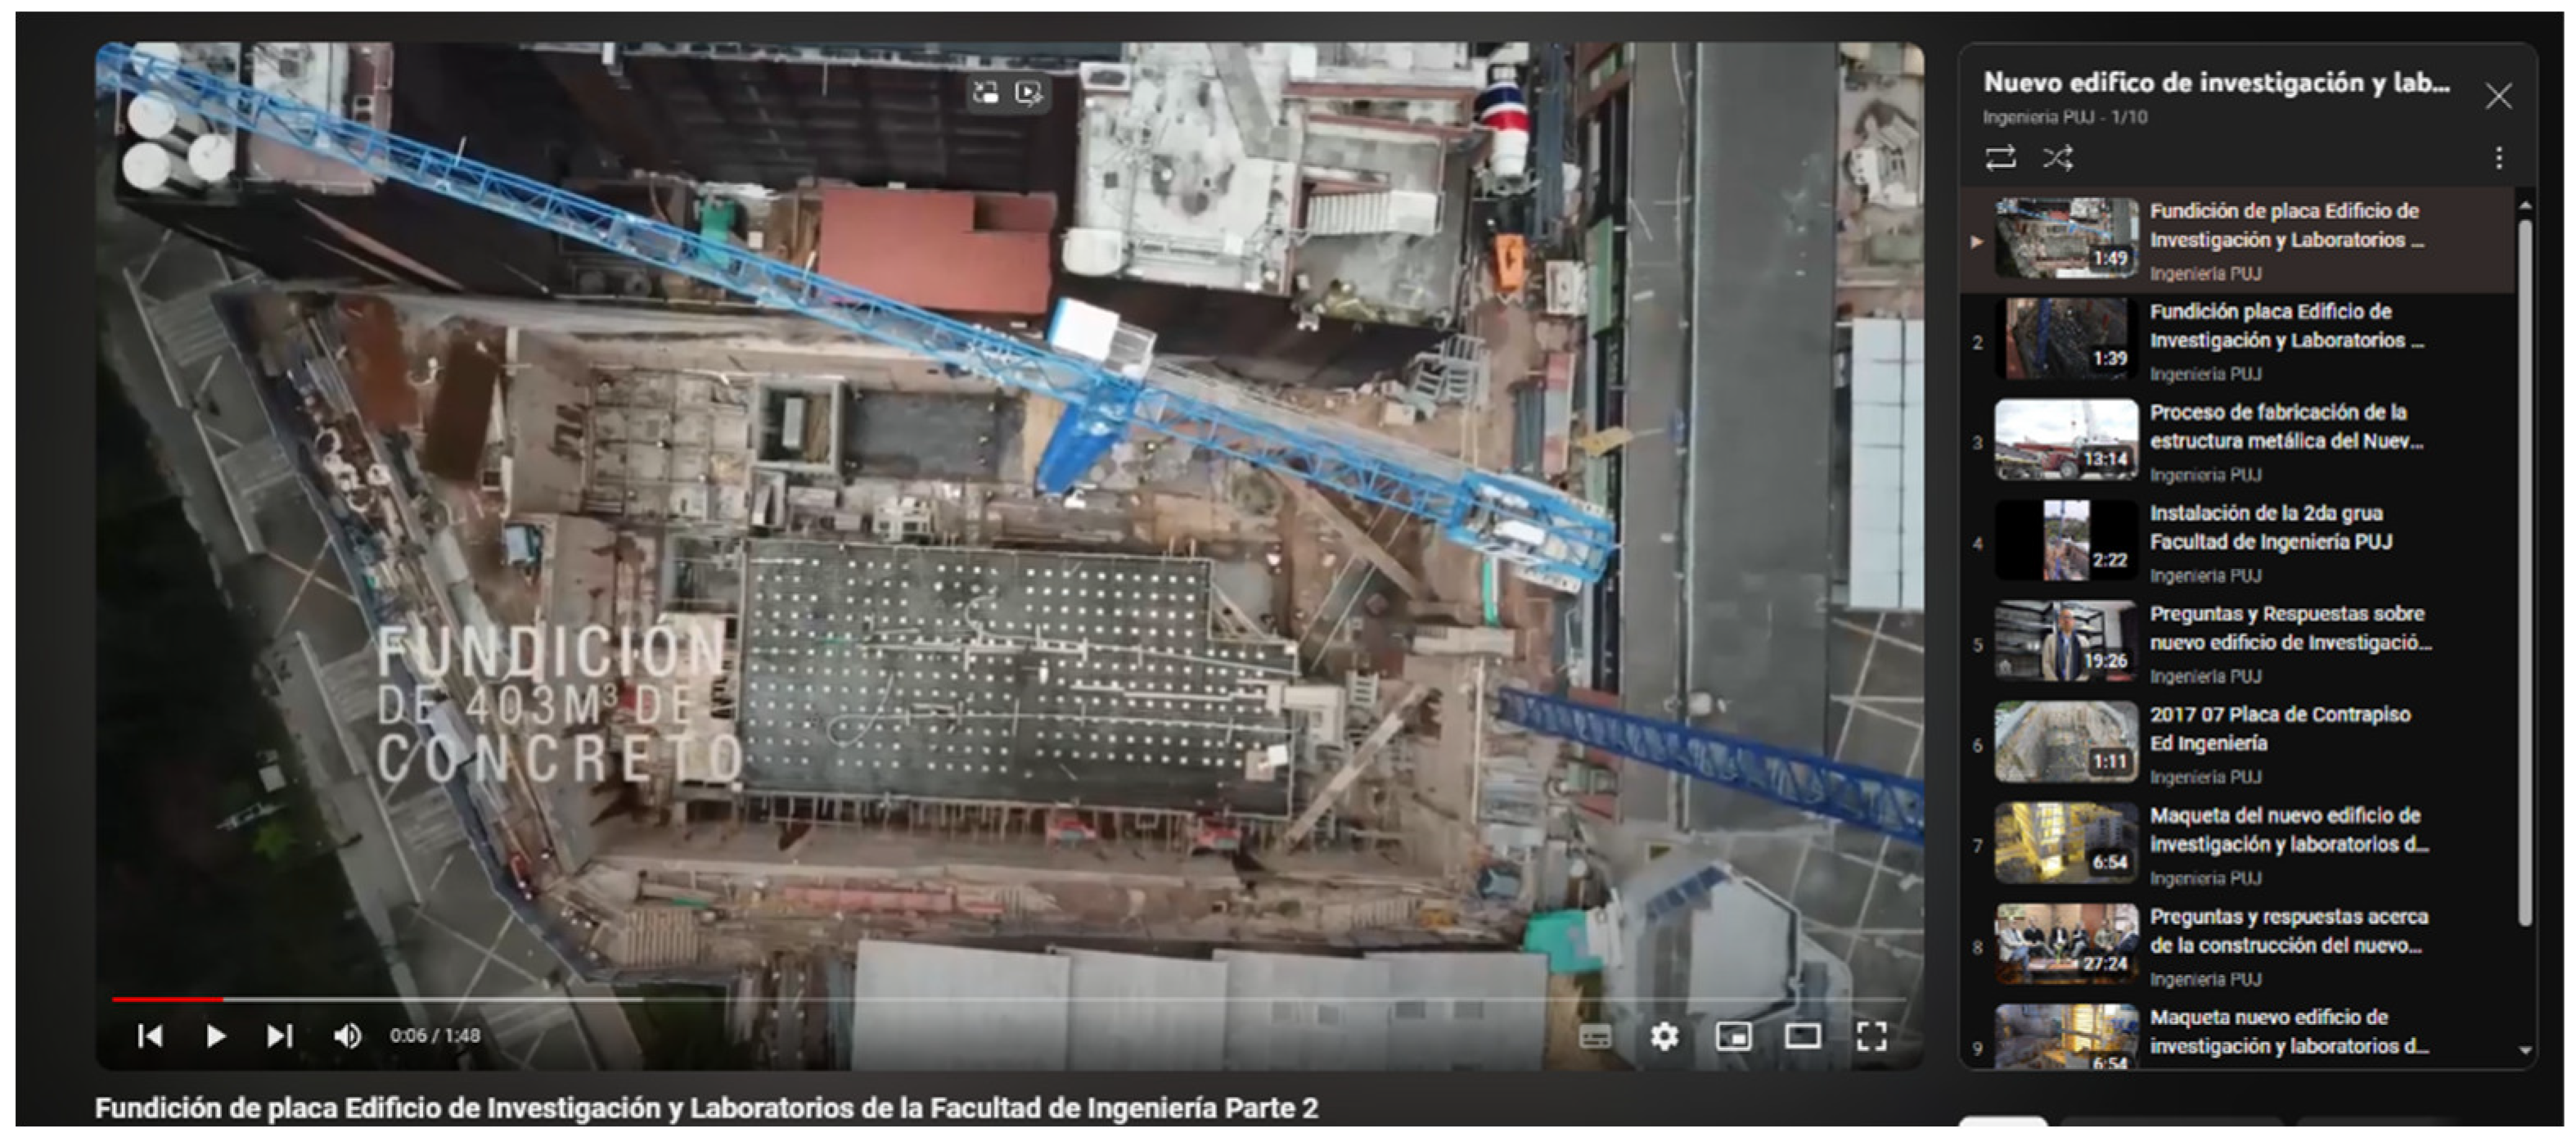
Figure 7.
Building materials, tools, and personnel for construction processes.
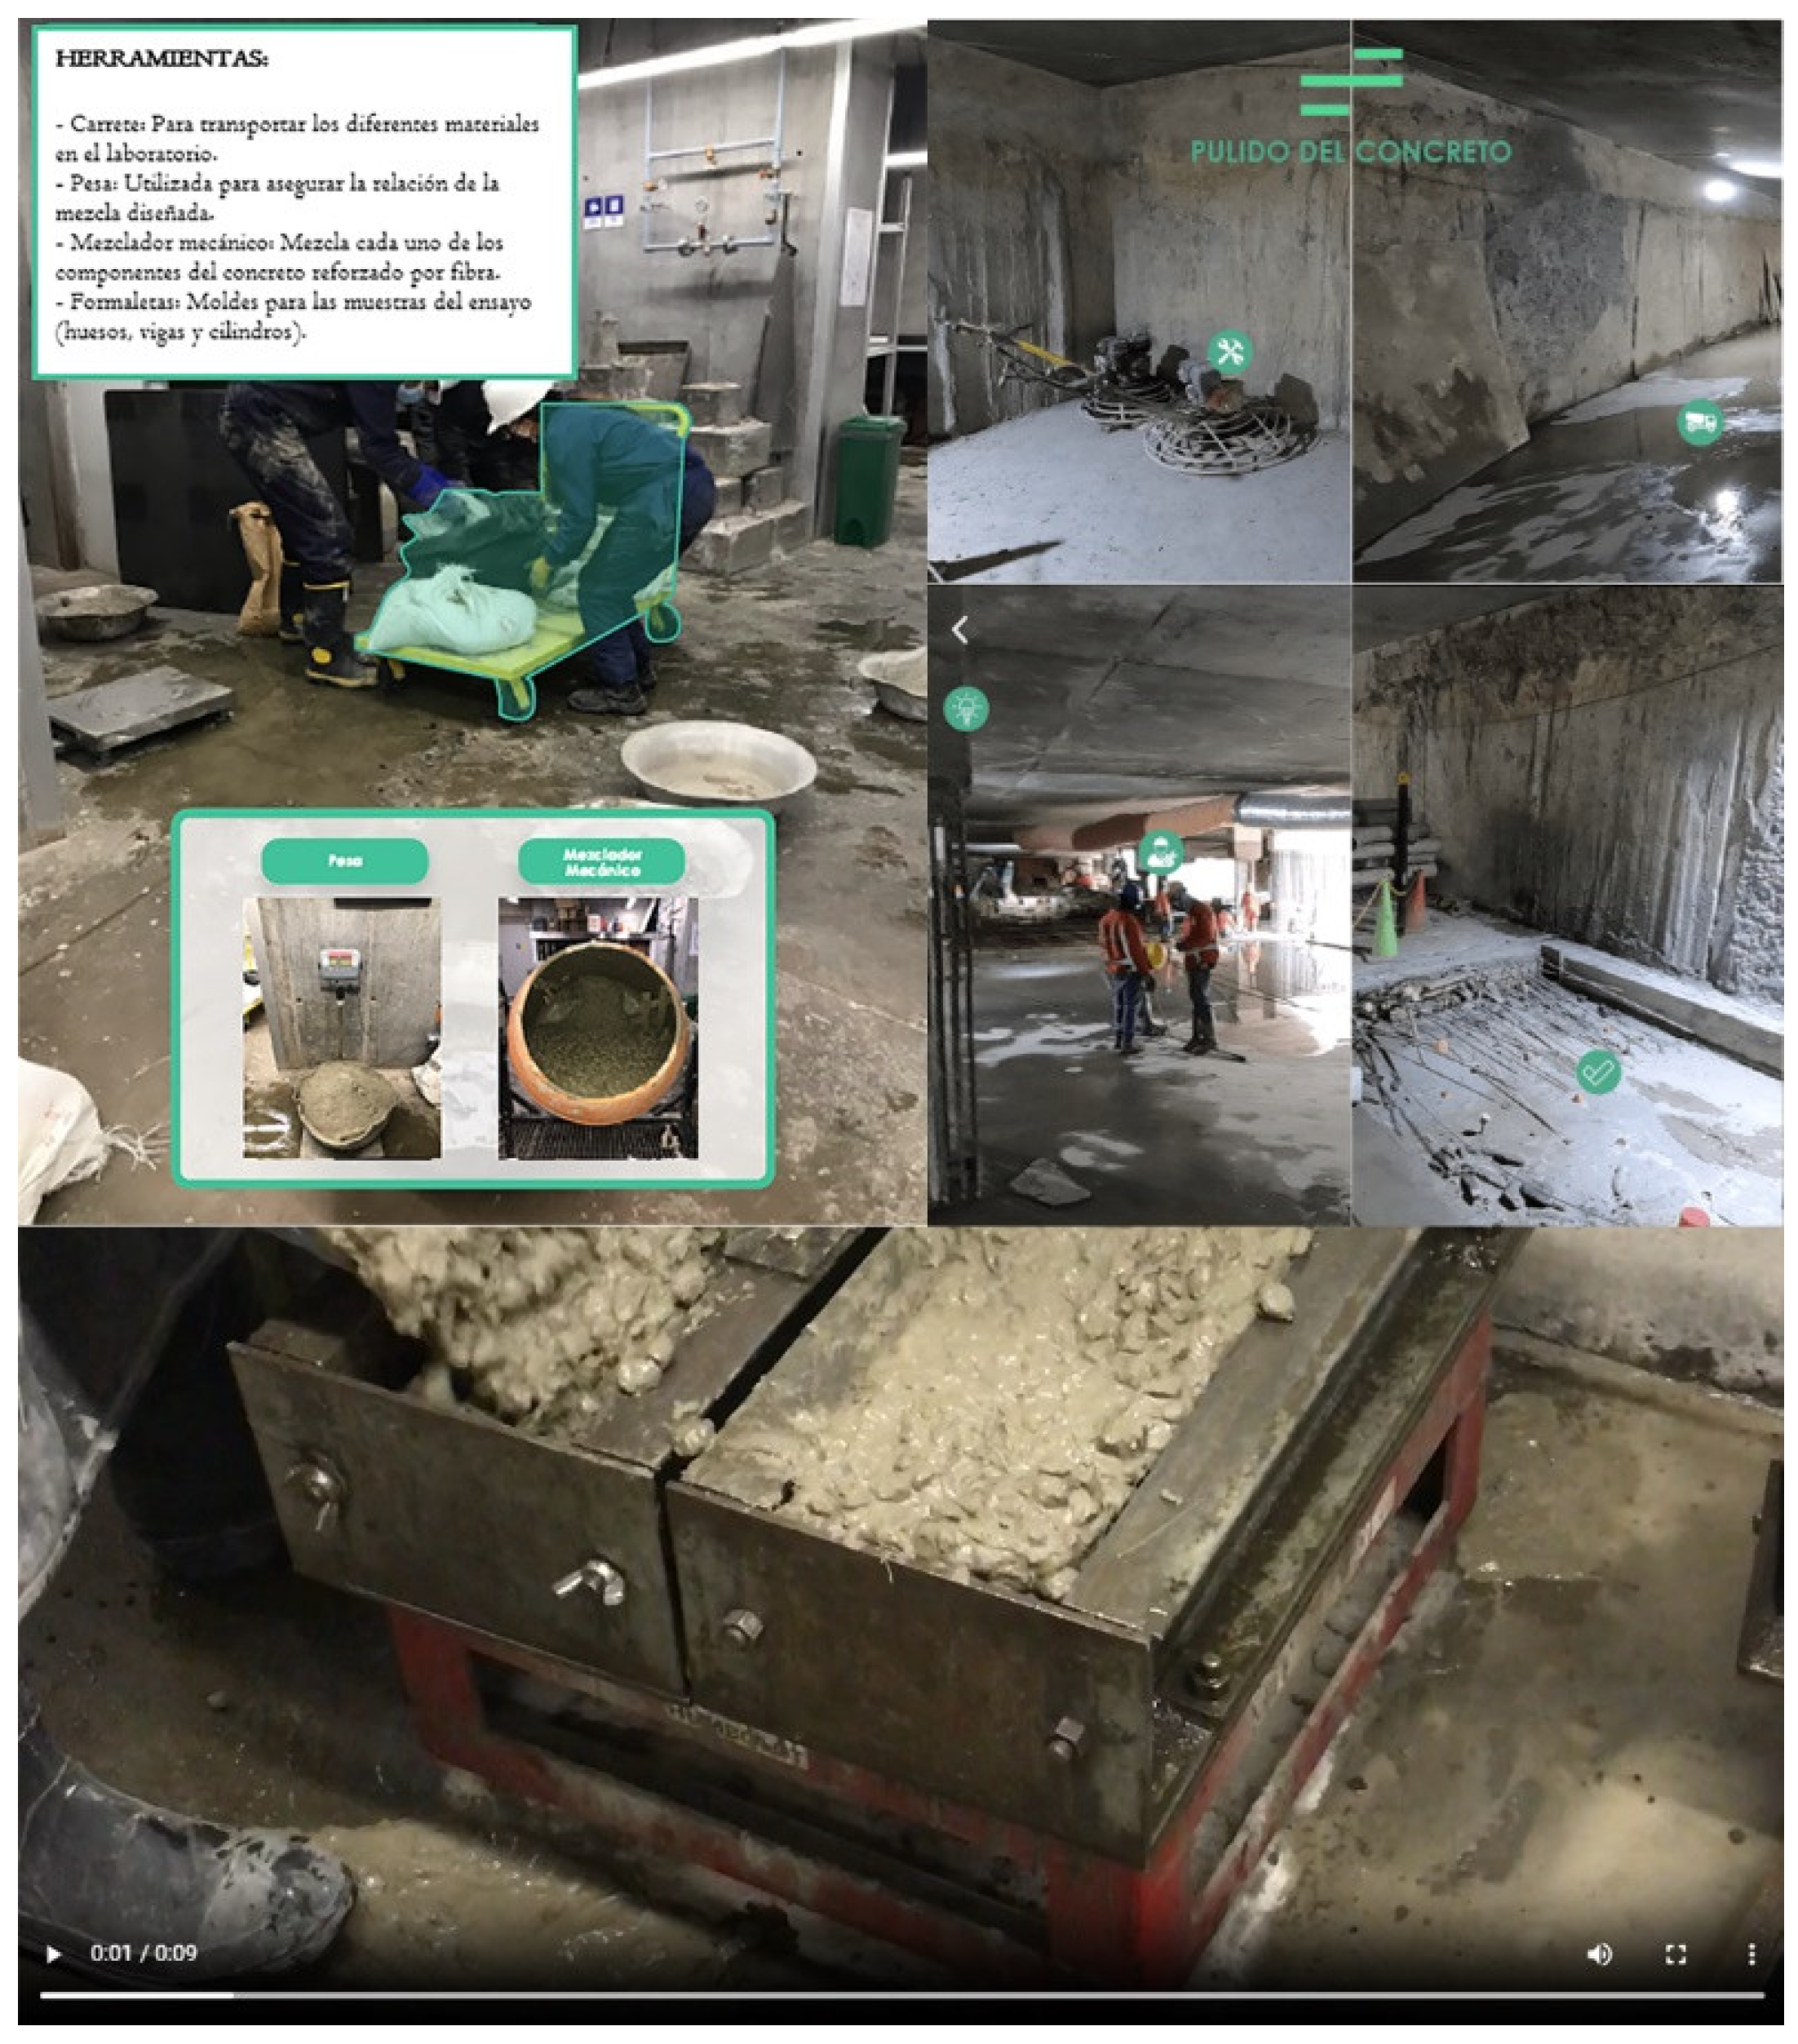
Figure 8.
Stakeholders list included in each building description.
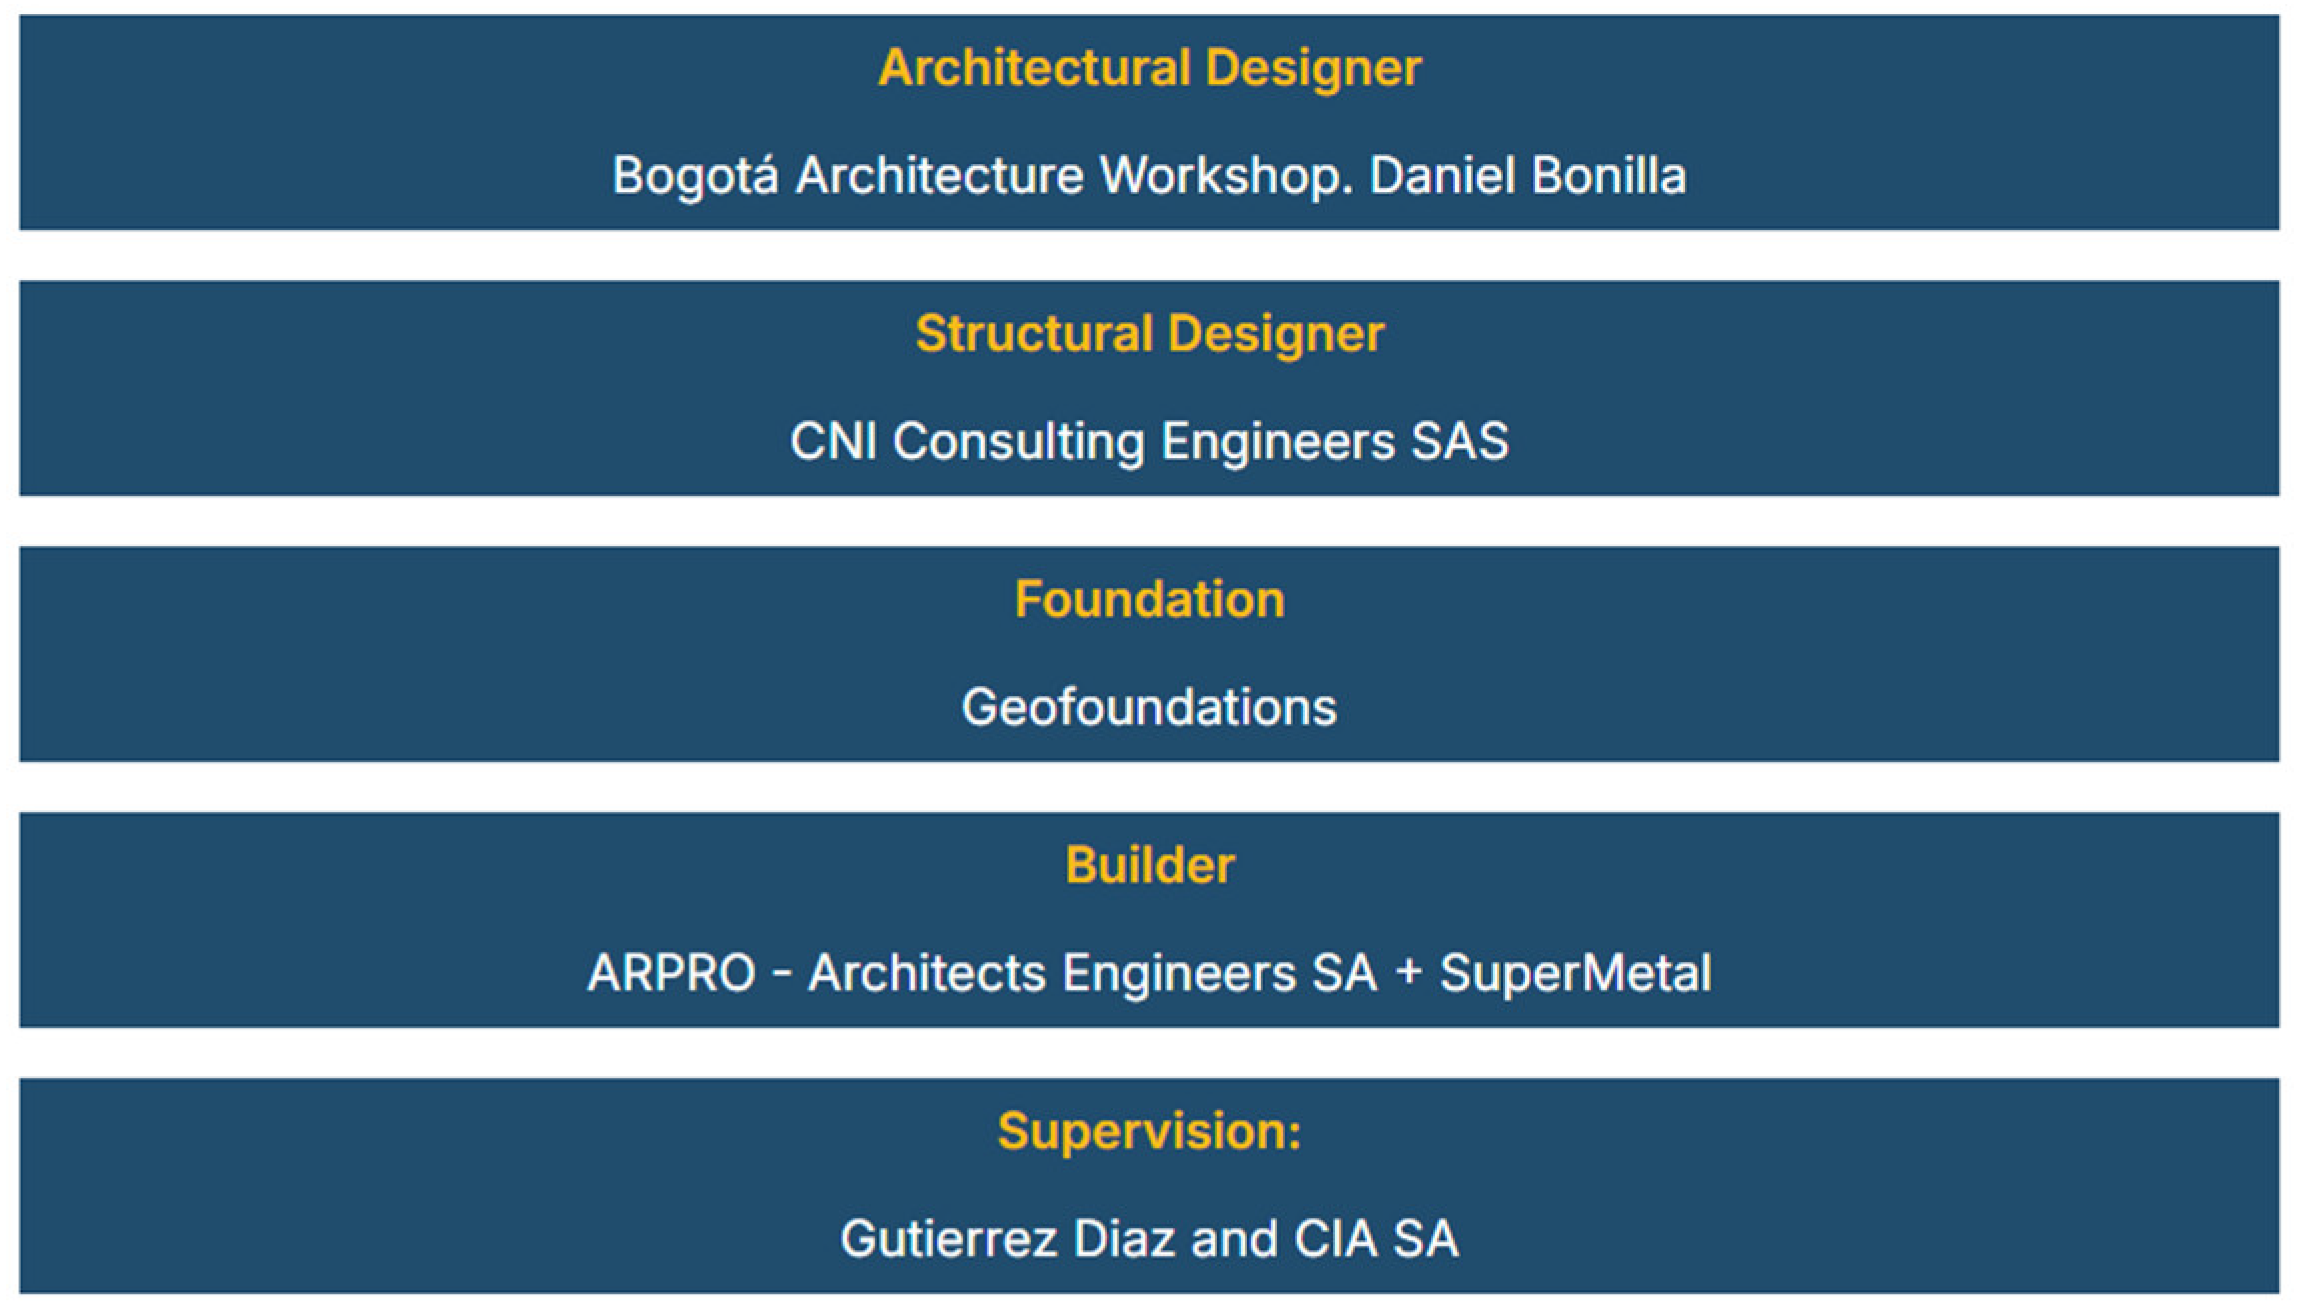
Figure 9.
Example of buildings’ structural composition.
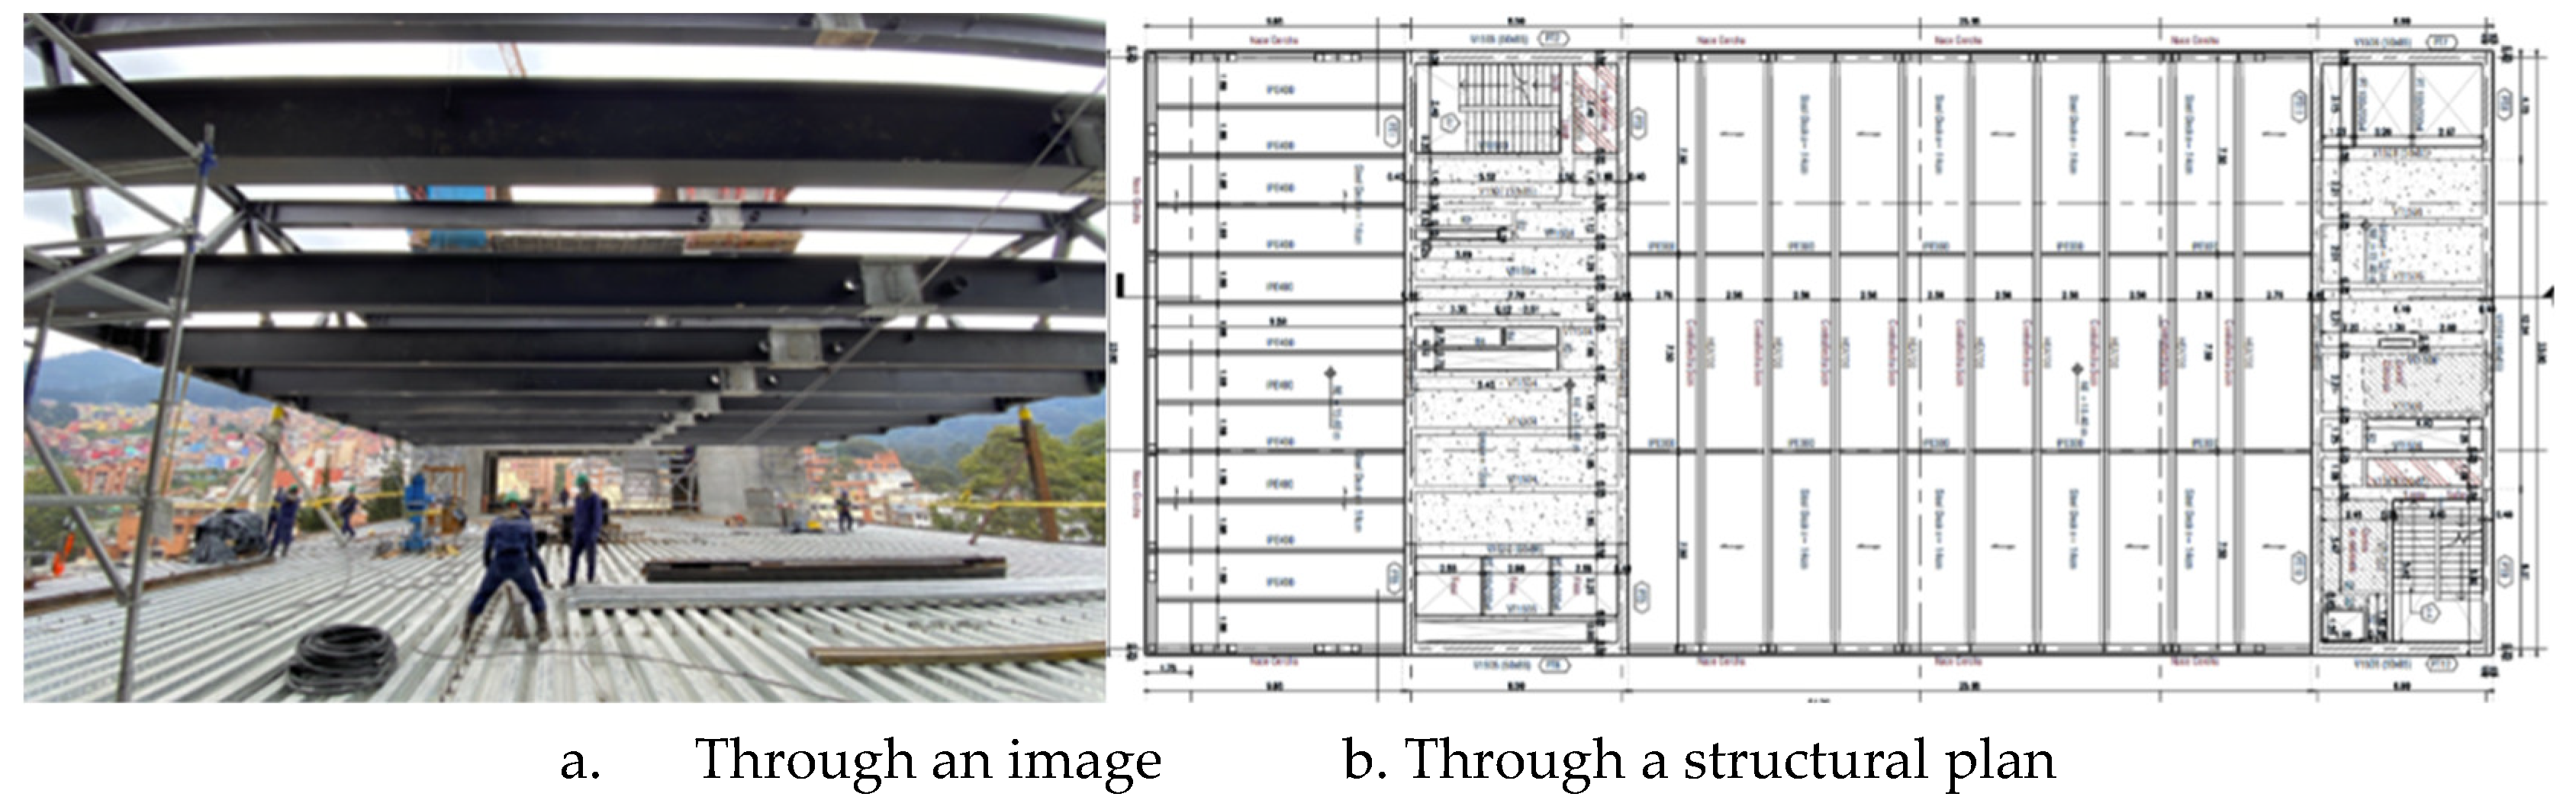
Figure 10.
Semantic Differential Averages by Groups for Campus 2.0 Usability.
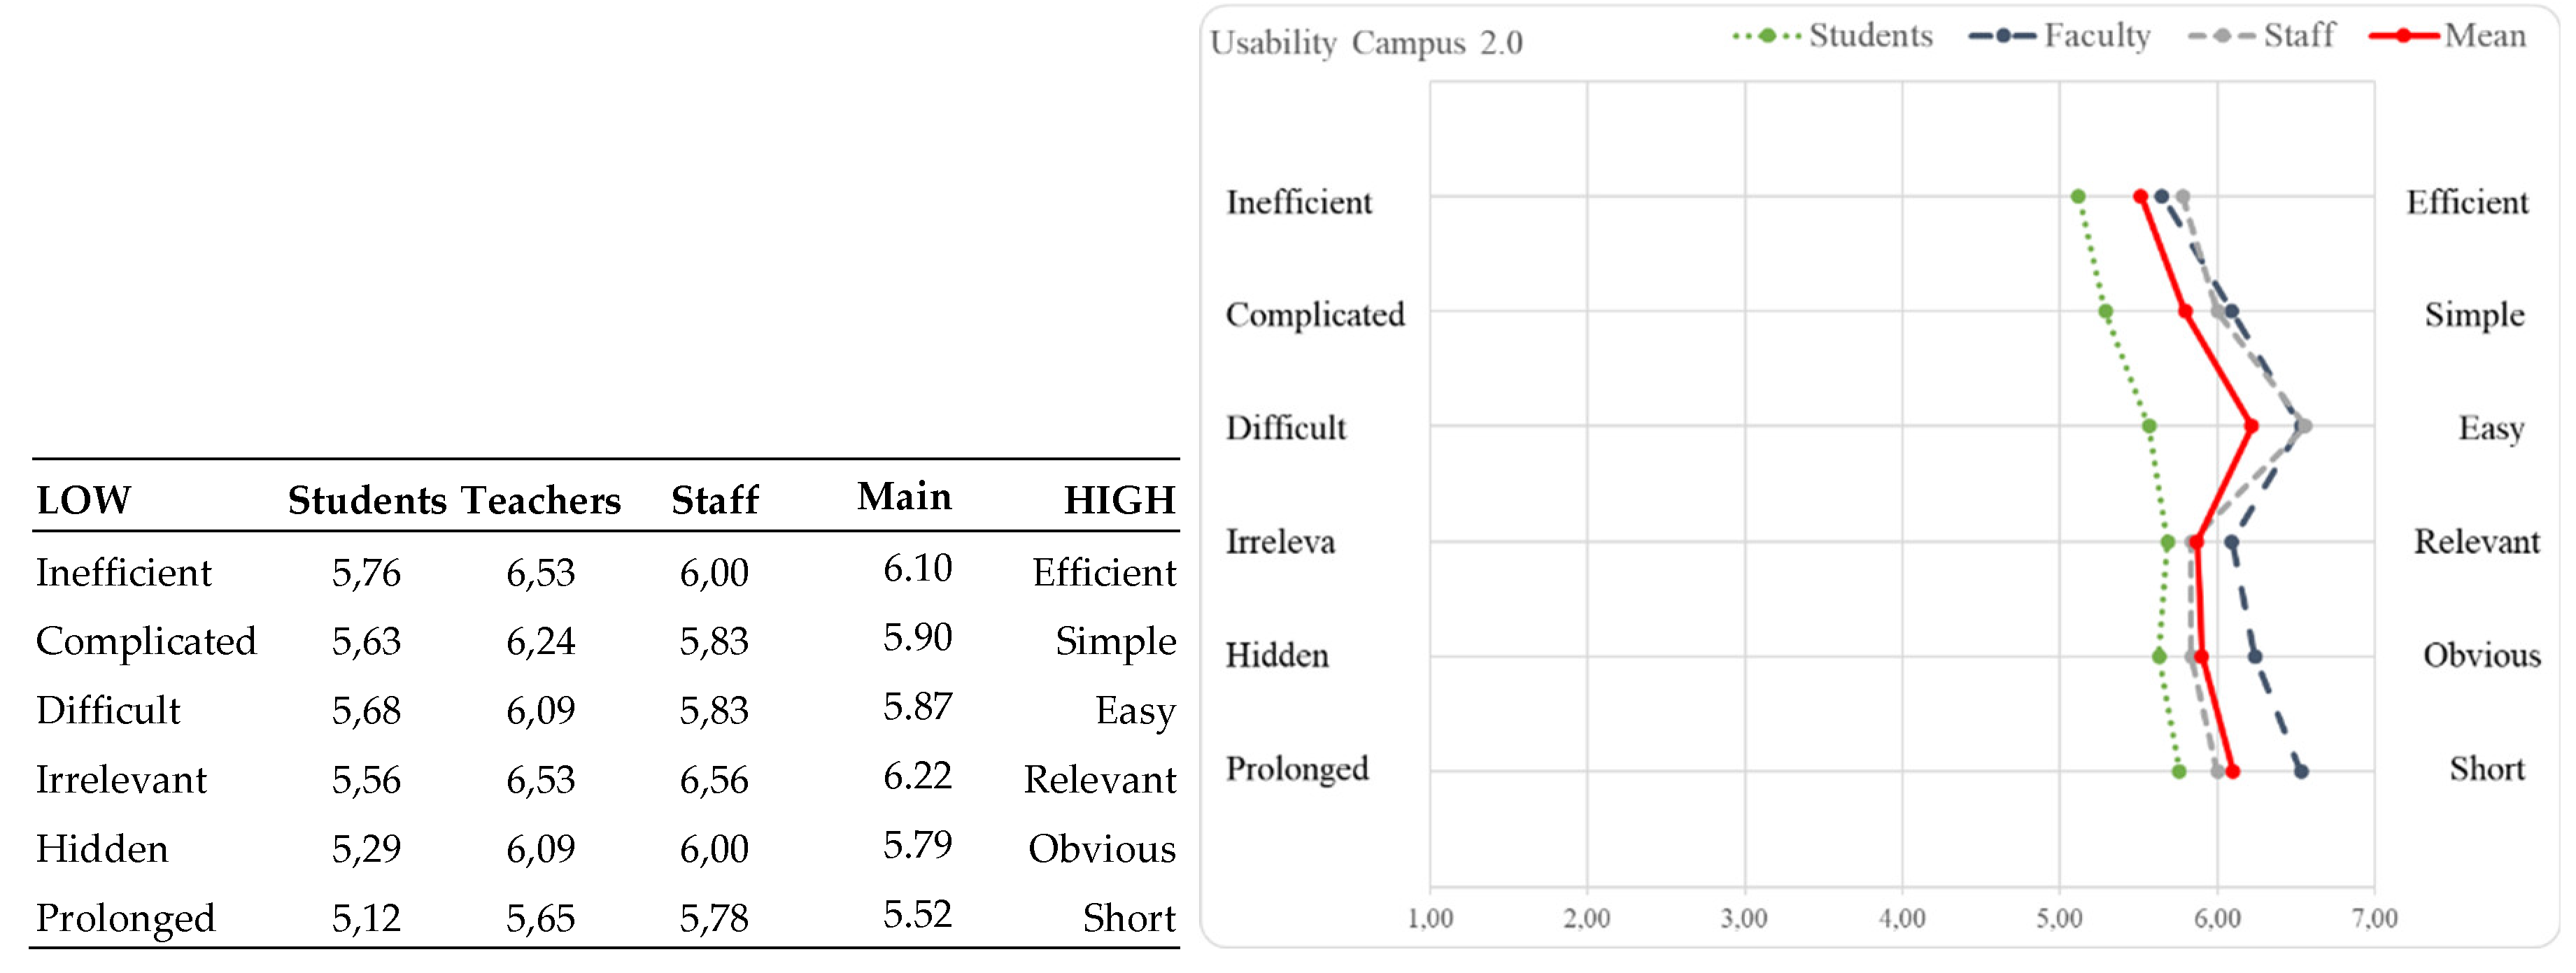

Table 1.
Pearson’s correlation between user groups.
| Variable | Students | Teachers | Staff | |
| Students | Pearson’s r | — | ||
| p-value | — | |||
| Teachers | Pearson’s r | 0.77 | — | |
| p-value | < .001 | — | ||
| Staff | Pearson’s r | 0.76 | 0.76 | — |
| p-value | < .001 | < .001 | — |
Note. All tests one-tailed, for positive correlation.
Disclaimer/Publisher’s Note: The statements, opinions and data contained in all publications are solely those of the individual author(s) and contributor(s) and not of MDPI and/or the editor(s). MDPI and/or the editor(s) disclaim responsibility for any injury to people or property resulting from any ideas, methods, instructions or products referred to in the content. |
© 2024 by the authors. Licensee MDPI, Basel, Switzerland. This article is an open access article distributed under the terms and conditions of the Creative Commons Attribution (CC BY) license (http://creativecommons.org/licenses/by/4.0/).
Copyright: This open access article is published under a Creative Commons CC BY 4.0 license, which permit the free download, distribution, and reuse, provided that the author and preprint are cited in any reuse.


