
Submitted:
10 September 2024
Posted:
10 September 2024
You are already at the latest version
Abstract
To analyze the impact of weather factors on the resilience of airport flight operations, particularly on flight operation, economic performance, and transportation capacity, Kolmogorov-Arnold Network (KAN) model was used to identify key weather features and establish the mapping relationship between weather factors and airport operational resilience. Taking Xi'an Xianyang International Airport as an example, the weights of each route were determined using the Grey Relational Analysis method considering average daily flight volume, flight distance, and airport flow stability indicators. Flight operation records and weather data were utilized to calculate the importance of key weather factors on the resilience of critical flight operation indicators. The results indicate significant differences in average daily flight volume, flight distance, and airport flow stability across different routes, with routes in economically developed areas having a greater impact on airport flow stability. Temperature and wind speed changes are the key factors affecting flight operation and economic indicators, with importance values of 0.35 and 0.32 respectively. Wind direction change and wind speed change have the greatest impact on flight transportation capacity, with importance values of 0.7 and 0.65 respectively. Therefore, when conducting flight scheduling and risk assessment, special attention should be paid to key weather factors such as temperature and wind speed, while also considering the weight of each route to ensure flight safety, efficiency, and economic benefits.
Keywords:
Airport Operations
; Resilience Assessment
; Weather Factors
; Grey Relational Analysis
; Kolmogorov-Arnold Network
1. Introduction
Air transportation plays an indispensable role in connecting the world, facilitating the movement of goods and people, and driving global economic and social activities. With the continued growth of the aviation industry, airports have become essential hubs of economic development, especially in regions where air travel is the primary means of long-distance transportation. However, one of the persistent challenges facing the aviation industry is flight delays, which not only disrupt passengers’ plans but also impose operational and financial burdens on airlines and airports. Among the many causes of these delays, weather conditions stand out as a dominant factor, contributing to significant disruptions in flight schedules. Extreme weather events such as strong winds, heavy rain, snowstorms, and low visibility can severely affect flight operations by reducing airport capacity, delaying departures, and extending the time required for landing procedures [1].
The impact of weather on aviation networks is not limited to individual flights or specific airports. Given the highly interconnected nature of air traffic networks (ATNs), disruptions in one location can trigger a cascade of delays throughout the network. These networks are characterized by a small number of hub airports that manage the majority of connections, while smaller airports typically serve fewer flights. This scale-free structure provides robustness against random disruptions but leaves the system vulnerable to targeted failures, particularly at hub airports [2,3,4]. Consequently, it becomes critical to understand how weather-related disruptions at key airports can affect overall network resilience and the steps that can be taken to mitigate these impacts [5,6].
The National Academy of Sciences has defined resilience as the ability of a system to plan for, absorb, recover from, and adapt to adverse events [7]. Within the context of air traffic, resilience refers to the capacity of the system to prevent or minimize disruptions caused by various factors, including weather, and to recover from such events effectively. Bruneau et al. extended this concept by introducing four dimensions for evaluating the resilience of critical infrastructure: detection, resistance, recovery, and adaptability [8]. These dimensions are particularly relevant for airports, which must remain operational during adverse conditions and recover quickly from disruptions to minimize the impact on passengers and airlines [9].
To assess the resilience of airport operations, researchers have developed various Key Performance Indicators (KPIs) that measure the system’s capacity, efficiency, and environmental performance. These KPIs, set by the International Civil Aviation Organization (ICAO), include metrics such as airport capacity (e.g., demand, traffic complexity, and air traffic control workloads), operational efficiency (e.g., flight delays and associated costs), and environmental factors (e.g., fuel consumption and greenhouse gas emissions due to delays) [10,11]. These indicators provide a framework for quantifying the impact of disruptions on airport operations, helping stakeholders evaluate the effectiveness of mitigation strategies.
Despite the development of sophisticated models to predict flight delays, including Artificial Neural Networks (ANNs), there are still significant gaps in predicting the impact of weather on aviation resilience. Most studies have focused on extreme weather events, such as hurricanes, thunderstorms, and snowstorms, which are well-documented and often predictable [12,13]. However, gradual weather changes, which occur more frequently, can also significantly impact airport operations by reducing runway capacity and increasing delays. For example, changes in wind direction and speed, temperature fluctuations, and variations in visibility due to fog or cloud cover can disrupt the scheduling and operation of flights [14]. These types of weather changes are often more challenging to predict and manage because they do not trigger immediate emergency responses but can gradually erode the efficiency of airport operations [15].
In China, the impact of weather on airport operations is particularly relevant, given the country’s rapid growth in air traffic and the increasing importance of its major airports. Xi’an Xianyang International Airport, one of the largest airports in Northwest China, plays a crucial role in connecting the region to both domestic and international destinations. However, due to its geographical location, the airport is exposed to a wide range of weather conditions, including extreme temperatures, dust storms, and fog [16,17]. These weather events pose significant challenges to airport operations, leading to frequent delays and cancellations. Despite the importance of Xi’an Xianyang International Airport as a regional hub, there has been relatively little research on the resilience of its operations in the face of weather-related disruptions.
This study aims to address this gap by applying an advanced predictive model, the Kolmogorov-Arnold Network (KAN), to assess the impact of weather on the resilience of airport flight operations. The KAN model is particularly suited for tasks involving time-series predictions and function approximation, making it ideal for analyzing how weather patterns affect flight schedules. Unlike traditional neural networks, which rely on fixed activation functions at nodes, the KAN model employs learnable, spline-based activation functions along the edges of the network, allowing it to capture nonlinear relationships more effectively [18]. This unique architecture not only enhances the accuracy of predictions but also improves the interpretability of the results, making it easier to identify the key weather factors influencing flight operations [19].
By using the KAN model to analyze weather data and flight operation records from Xi’an Xianyang International Airport, this study seeks to provide a comprehensive understanding of how weather conditions impact the resilience of airport operations. Specifically, the study focuses on identifying the key weather variables that influence flight delays, cancellations, and overall airport capacity. The Grey Relational Analysis (GRA) method is used to quantify the importance of different weather factors, such as wind speed, temperature, and visibility, in determining the resilience of flight operations [20].
Previous studies have highlighted the importance of weather factors such as wind speed and direction, temperature, and visibility in influencing airport capacity and flight delays [21]. For example, Janić found that extreme weather events are the primary cause of flight delays at major U.S. airports [22]. Similarly, Rodríguez-Sanz et al. used a Bayesian Network approach to analyze the impact of extreme weather on flight delays at Madrid-Barajas Airport, demonstrating that different stages of flight operations, such as final approach and taxiing, are affected to varying degrees by weather conditions [23]. However, these studies largely focus on extreme events, leaving a gap in understanding how gradual weather changes affect airport resilience.
In addition to its focus on gradual weather changes, this study also addresses the broader issue of systemic resilience in aviation networks. As noted earlier, most existing research has concentrated on individual flights or specific airports, with limited attention paid to the broader network effects of weather disruptions [24,25]. This is particularly important for scale-free networks like ATNs, where disruptions at hub airports can have far-reaching consequences for the entire system [25]. By analyzing how weather-related delays at Xi’an Xianyang International Airport affect the overall network, this study provides valuable insights into the systemic resilience of China’s aviation infrastructure.
The findings of this study have important implications for both policymakers and industry stakeholders. First, the identification of key weather factors affecting airport resilience can inform the development of more effective flight scheduling and risk management strategies. For example, airports may choose to prioritize certain flights or adjust schedules in response to anticipated weather changes, reducing the likelihood of cascading delays throughout the network [26,27]. Second, the use of advanced machine learning models like KAN can improve the accuracy of weather impact predictions, enabling airports and airlines to make more informed decisions about resource allocation and emergency response planning [28,29]. Finally, by focusing on Xi’an Xianyang International Airport, this study provides a valuable case study for other regional airports facing similar challenges.
The rest of the paper is organized as follows. In Section 2, we provide a detailed description of the problem, focusing on the impact of weather factors on flight delays and cancellations. Section 3 outlines the methodology, including the resilience assessment model and the key performance indicators (KPIs) used to quantify flight resilience. It also introduces the Kolmogorov-Arnold Network (KAN) for time-series prediction of airport resilience and the Grey Relational Analysis (GRA) to evaluate the importance of weather factors. Section 4 presents the case study of Xi’an Xianyang International Airport. Section 5 concludes the study by summarizing the main findings, discussing the implications for airport management, and suggesting areas for future research.
2. Problem Description
As shown in Figure 1, flight delays at airports mainly occur during the take-off and landing phases. Airport weather is the main influencing factor. When calculating the resilience of flight operations and the degree of weather impact, the following two aspects of change need to be considered, leading to changes in resilience calculation and the importance of various weather factors:
1) Flight Delays and Cancellations
Weather changes leading to flight delays and cancellations cause time and economic losses for various stakeholders such as passengers, airlines, and airports. The estimation of losses varies depending on the perspective and bearing capacity of different stakeholders.
2) Airport Operation Network Weight Calibration
Besides considering the flight distance and the number of flights operating on each route within a day to determine the weight of each route in the airport network, the impact of the route on airport transportation capacity also determines its importance in the network.
This research is based on the following assumptions:
- All other operational factors remain normal except for weather changes;
- Pilots fly with the aim of minimizing delays while ensuring safety;
- Flight delays at a certain airport include delays caused during both takeoff and landing at that airport.
3. Methodology
3.1. Resilience of Air Flights
The calculation method considers the resilience of key performance indicators (KPIs) of air flights when delays occur. KPIs include operational performance, economic performance, and airport capacity. Resilience refers to the process of air flights at an airport within an operational day from “suffering losses - losses continuing - losses recovering”.
3.1.1. Key Performance Indicators (KPIs)
Based on the independence of airport delays and airport capacity, and the KPIs set by the International Civil Aviation Organization (ICAO) for affected areas and surrounding areas, the key indicators of air flights are divided into the following three categories:
1) Operational Performance Indicators
Numbers of delayed and canceled flights within a time period are and , respectively.
2) Economic Performance Indicators
- Profit loss caused by delays within a time period :where (d_31 (∆t_i)) ̅ is the average delay of each flight in , C_(31/d) is the unit cost of delay per flight.
- Profit loss caused by flight cancellations within a time period :where is the average profit loss caused by a flight cancellation during time , which equals the total value of the flight tickets lost due to the flight cancellation.
In Equation (1), the profit loss due to delay can be regarded as the increase in costs. consists of direct and indirect costs. The direct costs include the aircraft’s operational costs and the airport ground service costs. Let be the delay time, the aircraft’s hourly operational cost (which includes fuel, maintenance, crew wages), and the hourly cost of airport ground services. Therefore, the direct cost can be expressed as Equation (3):
The indirect costs mainly consist of the passengers’ time value. Let represent the number of affected passengers and the average hourly time value per passenger. The indirect cost can thus be expressed as Equation (4):
The time value is equal to the region’s per capita GDP divided by the average working hours per year. It is assumed that people work 240 days a year, with 8 hours of work per day.
3) Airport Capacity Estimation
The definition proposed by the Airport Cooperative Research Program (ACRP) states that capacity is defined as the maximum sustainable throughput that can be accommodated per unit of time under varying local capacity constraints [30]. According to the construction stages of airports, capacity can be categorized into pre-planning capacity, pre-operational planning capacity, and operational capacity. The focus of this paper is on airports that are already in operation; thus, the study aims to analyze the resilience of their operational capacity. Moreover, the bottleneck affecting flight operations under various factors is primarily the runway capacity of the airport. This capacity can be understood as a trade-off optimization between arrival and departure capacities. For such bi-objective optimization problems, the Pareto frontier method can be applied for calculation.
3.1.2. Weights of Airport Routes
The weights of each route for an airport hub are determined based on the average daily flight volume, route length, and the reduction in airport capacity due to the absence of a particular route.
1) Average Daily Flight Volume
The average daily flight volume for each route is calculated based on an airport’s daily operating time of 16 hours, as shown in Equation (5):
2) Flight Distance
The flight distance from the starting node to the destination node can be obtained from actual flight data.
3) Flow Stability
The flow stability of each route considers the impact of reduced route capacity on the maximum airport traffic flow, as expressed in Equation (6).
Based on the definition of robustness, RAI evaluates and quantifies the impact of localized (node-level) capacity reductions on the maximum network traffic flow [31]. In Equation (6), is the degradation parameter which represents the potential reduction in node capacity. is the maximum network traffic flow of an airport when the capacity of route reduces . The process of finding the maximum network traffic flow for a given degradation is equivalent to solving a linear optimization problem. Let the capacity of route be , and the objective function for the airport’s maximum traffic flow is given by:
Constraints:
(1) Traffic volume of each route
The volume of each route must be less than or equal to the route capacity:
(2) Non-negativity
The traffic volume of flights on each route must be greater than or equal to 0:
where represents the flight of the airport on one operating day.
is a 0-1 binary variable used to determine whether a flight belongs to route
, which is expressed in Equation (10):
3.1.3. Resilience of Airport Flight Operation
Based on the flight operations at the airport during an operational day, once delay occurs, the airport would suffer from profit losses until the delay dissipates. This duration is quantified by the resilience of flights on route over time periods in one operational day. An example of the flight resilience is shown in Figure 2.
The real-time flight information primarily refers to the planned departure time, planned arrival time, actual departure time, and actual arrival time. The origin-destinations (ODs) of each flight and the airport’s flight volume can be statistically obtained using real-time information. The method for calculating operational resilience of flight delays is detailed as follows:
where, refers to the cumulative delay from to in statistical period , is the time when the flight delay reaches an inflection point or zero during the statistical period , is the maximum delay from to in statistical period , is the recovery rate of delay during the period to in , is the interruption rate of delay rate during the period to in , is the maximum delay in , is the number of flights which do not delay or advance in .
As mentioned in Section 3.1.1, the resilience of flight operation involves metrics for operations, economics, and capacity. In calculating these metrics, this paper uses Equations (11) and (12), where only the parameters related to delays need to be replaced.
3.2. The Importance of Weather on Airport Flight Resilience
3.2.1. Establishing the Mapping Relationship between Weather and Airport Resilience
This paper introduces an innovative approach by exploring the regression accuracy of Kolmogorov-Arnold Networks (KANs) in relation to weather conditions and flight resilience. KANs leverage the Kolmogorov-Arnold representation theorem for tasks such as time series prediction and function approximation. Unlike traditional neural networks, KANs utilize learnable univariate spline-based activation functions along the edges of the network, rather than relying on fixed activation functions at the nodes. This unique architecture not only enhances the accuracy of predictions under varying weather conditions but also offers advantages like faster neural scaling laws and improved interpretability. The methodology based on KAN principles for time series forecasting is outlined in Figure 3.
Step 1. Problem Formulation
We frame the prediction of airline operational resilience as a time series forecasting task. The goal is to predict the resilience index , which reflects the operational status of an airline at a future time step , based on historical weather data from the airport and operational conditions. The operational resilience is influenced by key weather parameters.
Let the historical weather data at the airport over an operational day (time range to ) be represented by the vector , where each corresponds to a set of weather features at time . The future resilience values to be predicted are represented by . The objective is to find a function such that . This function will be approximated using a Kolmogorov-Arnold Network (KAN).
Step 2. Kolmogorov-Arnold Network (KAN) Architecture
The KAN model is based on the Kolmogorov-Arnold representation theorem, which allows the decomposition of multivariate functions into compositions of univariate functions. Unlike traditional neural networks, where weights are linear, KANs employ learnable activation functions along the edges, making them better suited for capturing nonlinear relationships in the data.
We use a multi-layer KAN architecture where the inputs are the historical weather data points, and the outputs are the predicted resilience indices. The model layers can be described as follows:
- Input Layer: The input layer consists of nodes corresponding to the number of weather features over the time range to .
- Hidden Layers: The hidden layers employ spline-based activation functions (e.g., B-splines) along the edges. These splines allow the network to capture the nonlinear dependencies between weather conditions and airline operational resilience. Each hidden layer applies a transformation to the inputs from the previous layer.
- Output Layer: The output layer generates the predicted resilience values for the future time steps to . The final layer combines the outputs of the previous layers using summation operations.
We define the shape of a KAN by , where denotes the number of layers of the KAN. The general form of the network can be expressed as:
where each is a layer transformation based on the spline-based activation functions.
Step 3. Training Procedure
The KAN is trained in a supervised manner using historical weather and resilience data. The training process involves optimizing the spline-based activation functions and network parameters using backpropagation. The loss function used for optimization is the Mean Absolute Error (MAE) between the predicted and actual resilience values over the prediction horizon .
The model parameters are updated using the Adam optimizer with an initial learning rate of . We conduct the training for 500 epochs, ensuring that the model converges to an optimal solution.
Step 4. Model Evaluation
The model’s performance is evaluated using a test dataset consisting of unseen weather and operational data. The prediction accuracy is measured using standard evaluation metrics such as Mean Squared Error (MSE), Root Mean Squared Error (RMSE), and MAE. A comparative analysis with traditional models such as MLPs (Multi-Layer Perceptrons) is performed to highlight the effectiveness of KANs in capturing the complex relationships between weather conditions and operational resilience.
This algorithm combines the KAN architecture’s ability to model complex, nonlinear relationships with airport weather data to predict flight resilience. The choice of spline-based activations in KAN makes it highly effective for this time series forecasting task.
3.2.2. Importance Calculation of Input Features
The importance of features is computed using the Permutation Importance (PI) method from the MLxtend machine learning extension package in Python. This method measures the importance of a feature by calculating the increase in prediction error of the KAN model after permuting (shuffling) the feature vector.
The trained KAN model, which was saved after the completion of the training process, produced a baseline prediction result denoted as . To assess the importance of a specific feature, all values of that feature were merged into a single vector. Using this vector, the resilience of airport flight operations was predicted, resulting in a prediction denoted as . The prediction loss due to the feature’s data merge was calculated as:
The dataset of input features was then restored to its original order, and the prediction losses caused by data merges were computed for each input feature vector. This process enabled the evaluation of the importance of key weather features to the resilience of airport flight operations in response to delays.
Numbered lists can be added as follows:
- 4.
- All other operational factors remain normal except for weather changes;
- 5.
- Pilots fly with the aim of minimizing delays while ensuring safety;
- 6.
- Flight delays at a certain airport include delays caused during both takeoff and landing at that airport.
The text continues here.
4. Case Study
The route layout centered around Xi’an Xianyang International Airport is shown in Figure 4. The airport is marked with the abbreviation of each airport, and the actual flight distance is generally greater than the straight-line distance.
4.1. Basic Data
To better reflect the dynamic changes in traffic demand and travel time, the study period selected is from February 23, 2023, to April 15, 2023. The model involves basic data, including hourly airport weather data, flight OD, scheduled departure time, actual departure time, scheduled arrival time, and actual arrival time.
1) Hourly Airport Weather Reports
The collection of airport weather data includes the airport name, observation time, surface wind direction, wind speed, wind direction variation range, visibility, cloud type and altitude, temperature, corrected sea level pressure, and a two-hour weather forecast. After quantifying the collected airport weather report information, one-dimensional vectors are created for each of the K weather elements over R time periods in one operational day, forming an R*K two-dimensional vector. Table 1 shows a portion of the weather data for Xi’an Xianyang International Airport.
The quantified variables for airport weather reports include:
- VRB represents variable wind direction, meaning the wind direction changes by more than 180 degrees or the average wind speed is less than 2 meters per second. In this case, the average wind direction value can be interpolated using the stable wind direction values from before and after the observation. Additionally, a binary variable is set: 0 for variable wind direction and 1 for stable wind direction.
- CAVOK indicates good weather and visibility, with visibility greater than 10 kilometers. This is quantified as the minimum value in this case, 10,001 meters.
- For cloud thickness, FEW represents 1/8 to 2/8 cloud cover, SCT represents 3/8 to 4/8 cloud cover, BKN represents 5/8 to 7/8 cloud cover, OVC represents 8/8 cloud cover, SKC indicates clear skies, NSC represents no clouds above 5,000 feet, TCU represents towering cumulus clouds, and CB represents cumulonimbus clouds. For quantification, the maximum value of each cloud type’s thickness is used, and two binary variables are set for towering cumulus and cumulonimbus clouds: 0 represents the absence of these clouds, and 1 represents their presence.
- For the two-hour weather forecast, an ordinal categorical variable is set: TEMPO indicates temporary weather changes, BECMG indicates gradual weather changes, and NOSIG indicates no significant changes in the weather.
2) Flight OD Data
Based on the flight’s origin-destination (OD), scheduled departure time, actual departure time, scheduled arrival time, and actual arrival time, the operational delay time for each route can be obtained. As an example, the delay times from 6:00 to 12:00 on February 23, 2023, are shown in Figure 5.
3) Route Flow Stability Indicator
In response to weather changes, the Pareto frontier is used to statistically analyze the number of flight arrivals and departures, estimating the airport’s hourly transportation capacity, as shown in Figure 6. In Figure 6, the larger the radius of the circle, the higher the frequency of flight arrivals and departures at the corresponding point within the statistical period.
When the number of arriving flights is zero, the frequency of various departing flight numbers is relatively high, indicating that the airport’s dispatch and management efficiency for departing flights is higher in this scenario. When the number of arriving flights is between 6 and 8, the corresponding number of departing flights is mainly concentrated between 4 and 10, and the frequency is relatively balanced. This reflects the typical performance of the airport under normal operational dispatch. Through this analytical method, the hourly transportation capacity of each flight can be systematically estimated, providing data support for optimizing flight scheduling and improving airport operational efficiency.
4.2. Results and Discussion
4.2.1. Weights of Flight Routes
After applying Min-Max normalization to the data for average daily flight volume, flight distance, and airport traffic stability (RAI), as shown in Figure 7, it can be observed that the higher the average daily flight volume on a route, the greater its impact on the airport’s traffic stability. Flight distance, on the other hand, is influenced by the geographical locations of the origin and destination. For example, routes with the longest flight distance (Aksu, AKU, 3159.45 km) and the shortest flight distance (Ankang, AKA, 62.52 km) both have relatively low average daily flight volumes and little impact on airport traffic stability, indicating a lower correlation between flight distance and variations in other indicators.
This relationship is verified through correlation analysis, as shown in Table 2. The correlation between average daily flight volume and airport traffic stability (RAI) is very high (0.94), indicating that routes with higher average daily flight volumes have a greater impact on airport traffic stability. The correlation between flight distance and average daily flight volume is low (-0.16), showing no significant relationship between flight distance and daily flight volume. Similarly, the correlation between flight distance and airport traffic stability (RAI) is also low (-0.18), indicating no significant relationship between flight distance and airport traffic stability.
Since the Grey Relational Analysis (GRA) is a method used to analyze the degree of correlation between factors in a system, it is particularly suitable for the analysis of small samples and uncertain systems. Therefore, in this paper, the GRA method is used to determine the total weight of each route. After normalizing the data, the reference sequence (ideal value) is set to 1, and the absolute difference between the reference sequence and the comparison sequence is calculated, as shown in Equation (14):
The correlation coefficient is calculated according to the formula for Grey Relational Degree, as shown in Equation (15):
where is the distinguishing coefficient, generally taken as 0.5. The correlation coefficients are then weighted and summed to obtain the Grey Relational Degree of each comparison sequence, as shown in Equation (16):
The route weights between representative airports in different regions and Xi’an Xianyang Airport are listed, as shown in Table 3.
Based on the results of the Grey Relational Degree calculation, it can be observed that there are significant differences in the total weight of different routes across indicators such as average daily flight volume, flight distance, and airport traffic stability (RAI). Routes in economically developed regions (such as Shanghai and Guangzhou) have higher Grey Relational Degrees, indicating a greater impact on airport traffic stability. In contrast, routes in remote areas (such as Lhasa and Aksu) have lower Grey Relational Degrees, confirming the conclusion that flight distance has a lower correlation with other indicator variations.
4.2.2. Values of Route Resilience
According to the changes in the daily operational resilience values for routes in the eastern region shown in Figure 8, it can be observed that when the average daily flight volume is high, the resilience values for eastern routes fluctuate within a small range, indicating a relatively stable operational state. Specifically, during daily operations, the resilience values are mainly distributed between 0.00 and 3.50, suggesting that airports in the eastern region can maintain operational stability well under high flight volumes. This phenomenon can be attributed to the well-developed airport facilities, high management standards, and effective flight scheduling systems in the eastern region.
Figure 9 shows the changes in daily operational resilience values for routes in the western and remote regions. Compared to the eastern region, the resilience values for routes in the western and remote regions fluctuate more significantly and have higher values, mainly ranging between 2.4 and 10.0. This indicates that airports in the western and remote regions have relatively lower operational resilience and higher volatility when faced with changes in average daily flight volumes. This phenomenon could be related to relatively underdeveloped airport facilities, fewer flight volumes, and less sophisticated scheduling and management systems in these regions.
By comparing the operational resilience values of routes in the two regions, the following conclusions can be drawn: airports in the eastern region have higher operational resilience, with smaller fluctuations in resilience values, and can better maintain operational stability under high flight volumes. In contrast, airports in the western and remote regions have lower operational resilience, with greater fluctuations in resilience values, indicating poorer stability when facing changes in flight volumes.
4.2.3. Prediction Effectiveness of KAN Model
The effectiveness of the KAN prediction model was evaluated by comparing the predicted values against the actual values using multiple performance metrics. Figure 10 presents a side-by-side comparison of the real and predicted values over the test set. Visually, the model closely follows the trend and fluctuations of the real data, with minor deviations in a few points. This indicates that the KAN model effectively captures both upward and downward trends.
In addition to the visual inspection, the quantitative evaluation of the prediction performance is presented in Table 4. The key performance metrics include Mean Squared Error (MSE), Root Mean Squared Error (RMSE), Mean Absolute Error (MAE), Mean Absolute Percentage Error (MAPE), and the R-Squared value (R²).
The MSE and RMSE are relatively low, indicating that the predictions deviate minimally from the actual values. The MAE of 60.669 further supports the model’s precision, with the average prediction error being small. The MAPE of 2.3% demonstrates that the KAN model’s prediction errors are negligible in relative terms, making it highly effective in real-world applications where percentage accuracy is crucial. Most notably, the R² value of 99.806% signifies that the KAN model explains almost all of the variance in the actual data, which points to an excellent model fit.
These metrics confirm that the KAN model performs exceptionally well, providing predictions that are both accurate and reliable. The small errors and high correlation between the predicted and actual values make it an excellent candidate for forecasting tasks in similar datasets.
4.2.4. Analysis of the Importance of Weather Impact
According to Figure 11, Figure 12 and Figure 13, the impact of weather factors on flight operation metrics, economic metrics, and transportation capacity shows significant differences. Figure 11 indicates that among all weather factors affecting flight operation metrics, temperature_point and wind_direction_speed have the highest importance, at 0.35 and 0.32, respectively. This suggests that temperature and wind speed are the key factors determining flight operational performance. Other factors, such as FEW, visibility, and wind_direction_change, also have some impact, but their importance is relatively lower.
Figure 12 illustrates the importance of weather factors on economic metrics. Temperature_point and wind_direction_speed remain the most important factors, with importance scores of 0.32 and 0.30, respectively. These results indicate that temperature and wind speed are not only critical for normal flight operations but also have a direct impact on the economic benefits of flights. In comparison, the importance of FEW, visibility, and SCT has decreased, but they still warrant attention.
Figure 13 reveals the impact of weather factors on flight transportation capacity. Among all weather factors, wind_direction_change and wind_direction_speed have the highest importance, at 0.7 and 0.65, respectively. This suggests that changes in wind direction and wind speed are the main factors affecting flight transportation capacity. Other factors, such as SCT, FEW, and BR, also significantly impact transportation capacity, while temperature_point and visibility have relatively lower importance.
In summary, wind_direction_speed and temperature_point are the key weather factors influencing flight operation and economic metrics, while wind_direction_change has the greatest impact on flight transportation capacity. These findings have important implications for flight scheduling and management, indicating that airlines should pay particular attention to these key weather factors when planning flights and assessing risks to ensure the safety, efficiency, and economic performance of flights.
5. Conclusions
This study investigates the effects of weather factors on the resilience of airport flight operations, with a focus on operational performance, economic efficiency, and transportation capacity. Using the Kolmogorov-Arnold Network (KAN) model, we successfully predicted flight resilience based on weather data and flight operation records from Xi’an Xianyang International Airport. The model’s excellent predictive performance, reflected in metrics such as a high R² value of 99.806%, demonstrates its ability to effectively capture the nonlinear relationships between weather conditions and operational resilience.
The results show significant differences in resilience across different routes and regions. Routes in economically developed regions, such as those in the eastern part of China, exhibit higher resilience and lower fluctuations, maintaining operational stability even under high flight volumes. Conversely, routes in western and remote areas experience greater fluctuations in resilience values, reflecting lower operational stability and greater vulnerability to disruptions.
In terms of operational resilience, routes in the eastern region of China show more consistent and stable resilience metrics, suggesting that better infrastructure and more sophisticated management systems help mitigate the impact of adverse weather conditions. In contrast, routes in the western and remote regions are less resilient, highlighting the need for improved airport facilities and flight scheduling mechanisms in these areas.
Key weather factors were identified as major determinants of flight resilience. Temperature and wind speed emerged as the most influential factors on operational and economic performance, with importance values of 0.35 and 0.32, respectively. On the other hand, wind direction change and wind speed were the primary contributors to variations in transportation capacity, with importance values of 0.7 and 0.65, respectively.
These findings provide valuable insights for airport and airline managers, who can leverage this data to enhance flight scheduling, minimize delays, and improve airport resilience to weather disruptions. The use of advanced models like KAN for predictive analysis enables more accurate forecasting of flight disruptions, ultimately improving operational efficiency and the overall resilience of the aviation network. Future studies could focus on expanding the predictive capabilities of the KAN model to include additional factors, while investing in infrastructure upgrades and enhanced real-time data monitoring systems would provide a significant boost to the resilience of airport operations.
Author Contributions
Conceptualization, M.S.; methodology, M.S. and R.L.; software, M.S. and R.L.; writing—original draft preparation, M.S. and J.W.; writing—review and editing, J.W. and R.L.; project administration, J.W. All authors have read and agreed to the published version of the manuscript.
Funding
This research was funded by the Fundamental Research Funds for the Central Universities, CHD (300102344901).
Institutional Review Board Statement
Not applicable.
Informed Consent Statement
Not applicable.
Data Availability Statement
Not applicable.
Conflicts of Interest
The authors declare no conflicts of interest.
References
- Zhou, Y.M.; Kundu, T.; Qin, W.; Goh, M.; Sheu, J.B. Vulnerability of the worldwide air transportation network to global catastrophes such as COVID-19. Transp. Res. Part E Logist. Transp. Rev. 2021, 154, 102469. [CrossRef] [PubMed]
- Huang, C.N.; Liou, J.J.; Lo, H.W.; Chang, F.J. Building an assessment model for measuring airport resilience. J. Air. Transp. Manag. 2021, 95, 102101. [CrossRef]
- Reitmann, S.; Alam, S.; Schultz, M. Advanced Quantification of Weather Impact on Air Traffic Management. In 13th USA/Europe ATM Research and Development Seminar, 2019.
- Jakšić, Z.; Janić. M. Modeling resilience of the ATC (Air Traffic Control) sectors. J. Air. Transp. Manag. 2020, 89, 101891. [CrossRef]
- Zhou, L.; Chen, Z. Measuring the performance of airport resilience to severe weather events. Transp. Res. Part D Transp. Environ. 2020, 83, 102362. [CrossRef]
- Chen, L.; Miller Hooks, E. Resilience: An Indicator of Recovery Capability in Intermodal Freight Transport. Transport. Sci. 2012, 46, 109-123. [CrossRef]
- Schultz, M.; Lorenz, S.; Schmitz, R; Delgado, L. Weather Impact on Airport Performance. Aerospace 2018, 5, 109. [CrossRef]
- Bruneau, M.; Chang, S.E.; Eguchi, R.T.; Lee, G.C.; O’Rourke, T.D.; Reinhorn, A.M.; Shinozuka, M.; Tierney, K.; Wallace, W.A.; von Winterfeldt, D. A Framework to Quantitatively Assess and Enhance the Seismic Resilience of Communities. Earthq. Spectra. 2003, 19, 733-752. [CrossRef]
- Bao, D.; Zhang, X. Measurement methods and influencing mechanisms for the resilience of large airports under emergency events. Transportmetr. A Transp. Sci. 2018, 14, 855-880. [CrossRef]
- Filippone, E.; Gargiulo, F.; Errico, A.; Di Vito, V.; Pascarella, D. Resilience management problem in ATM systems as a shortest path problem. J. Air. Transp. Manag. 2016, 56, 57-65. [CrossRef]
- ICAO. Doc, 9883—Manual on Global Performance of the Air Navigation System. 2009.
- EUROCONTROL. Performance review report – an assessment of air traffic management in europe during the calendar year 2019. In Technical Report, 2020.
- Schultz, M.; Reitmann, S.; Alam, S. Classification of Weather Impacts on Airport Operations. In 2019 Winter Simulation Conference (WSC), 2019.
- Schultz, M.; Reitmann, S.; Alam, S. Predictive classification and understanding of weather impact on airport performance through machine learning. Transp. Res. Part C Emerg. Technol. 2021, 131, 103119. [CrossRef]
- Borsky, S.; Unterberger, C. Bad weather and flight delays: The impact of sudden and slow onset weather events. Econ.Transp. 2019, 18, 10-26. [CrossRef]
- Wang, Y.J.; Zhan, J.M.; Xu, X.H.; Li, L.S.; Chen, P.; Hansen, M. Measuring the resilience of an airport network. Chinese. J. Aeronaut. 2019, 32, 2694-2705. [CrossRef]
- Bucchignani, E.; Zollo, A.L.; Montesarchio, M. Analysis of Expected Climate Extreme Variability with Regional Climate Simulations over Napoli Capodichino Airport: A Contribution to a Climate Risk Assessment Framework. Earth 2021, 2, 980-996. [CrossRef]
- Vaca-Rubio, C.J.; Blanco, L.; Pereira, R.; Caus, M. Kolmogorov-arnold networks (kans) for time series analysis. ArXiv [Preprint] 2024, arXiv:2405.08790.
- Liu, Z.; Wang, Y.; Vaidya, S.; Ruehle, F.; Halverson, J.; Soljačić, M.; Hou, T.Y.; Tegmark, M. Kan: Kolmogorov-arnold networks. ArXiv [Preprint] 2024. arXiv:2404.19756.
- Krozel, J. Survey of Weather Impact Models used in Air Traffic Management. In 10th AIAA Aviation Technology, Integration, and Operations (ATIO) Conference, 2010.
- Tielrooij, M. Predicting Arrival Time Uncertainty from Actual Flight Information, 2015.
- Janić, M. Analysis and modelling of airport resilience, robustness, and vulnerability: impact of COVID-19 pandemic disease. The Aeronautical Journal 2022, 1-30. [CrossRef]
- Rodríguez-Sanz, Á.; Cano, J.; Rubio Fernández, B. Impact of Weather Conditions on Airport Arrival Delay and Throughput. IOP Conference Series: Materials Science and Engineering 2021, 1024, 012107. [CrossRef]
- Mueller, E.; Chatterji, G. Analysis of Aircraft Arrival and Departure Delay Characteristics. In AIAA’s Aircraft Technology, Integration, and Operations (ATIO) 2002 Technical Forum, 2002.
- Ali, H.; Guleria, Y.; Alam, S.; Schultz, M. A Passenger-Centric Model for Reducing Missed Connections at Low Cost Airports With Gates Reassignment. IEEE Access 2019, 7, 179429-179444. [CrossRef]
- Thompson, K.H.; Tran, H.T. Operational Perspectives Into the Resilience of the U.S. Air Transportation Network Against Intelligent Attacks. IEEE. T. Intell. Transp. 2020, 21, 1503-1513. [CrossRef]
- Chen, Z.; Rose, A. Economic resilience to transportation failure: a computable general equilibrium analysis. Transportation 2018, 45, 1009-1027. [CrossRef]
- Wong, A.; Tan, S.; Chandramouleeswaran, K. R.; Tran, H. T. Data-driven analysis of resilience in airline networks. Transp. Res. Part E Logist. Transp. Rev. 2020, 143, 102068. [CrossRef]
- Köpke, C.; Srivastava, K.; Miller, N.; Branchini, E. Resilience Quantification for Critical Infrastructure: Exemplified for Airport Operations. In Computer Security. ESORICS 2021 International Workshops, 2022.
- Gentry, J.; Duffy, K.; Swedish, W.J. Airport Capacity Profiles. Federal Aviation Administration, 2014.
- Pien, K.C.; Han, K.; Shang, W.L.; Majumdar, A.; Ochieng, W. Robustness analysis of the European air traffic network. Transportmetr. A Transp. Sci. 2015, 11, 772-792. [CrossRef]
Figure 1.
Delays of European flights from 2008–2015 regarding variability of flight phases [8].
Figure 1.
Delays of European flights from 2008–2015 regarding variability of flight phases [8].
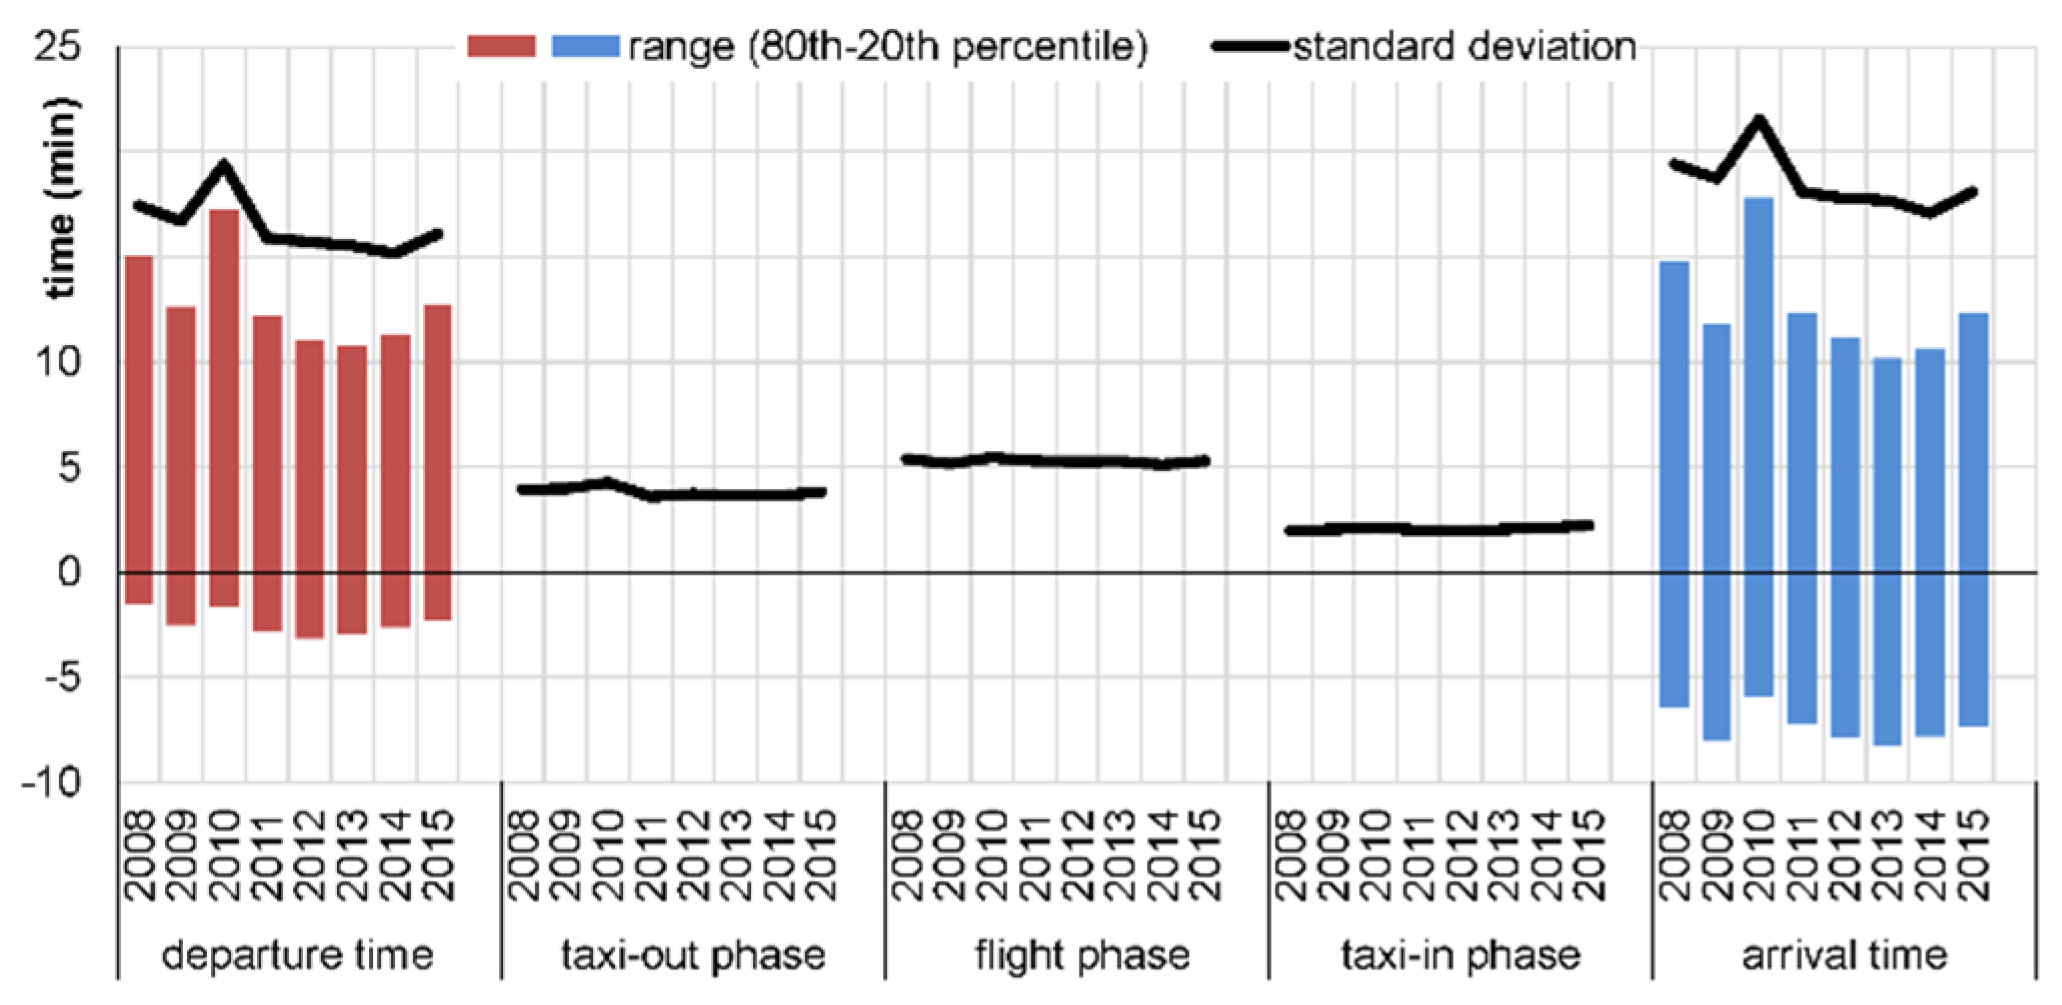
Figure 2.
Airport flight resilience calculation using delay as an example.
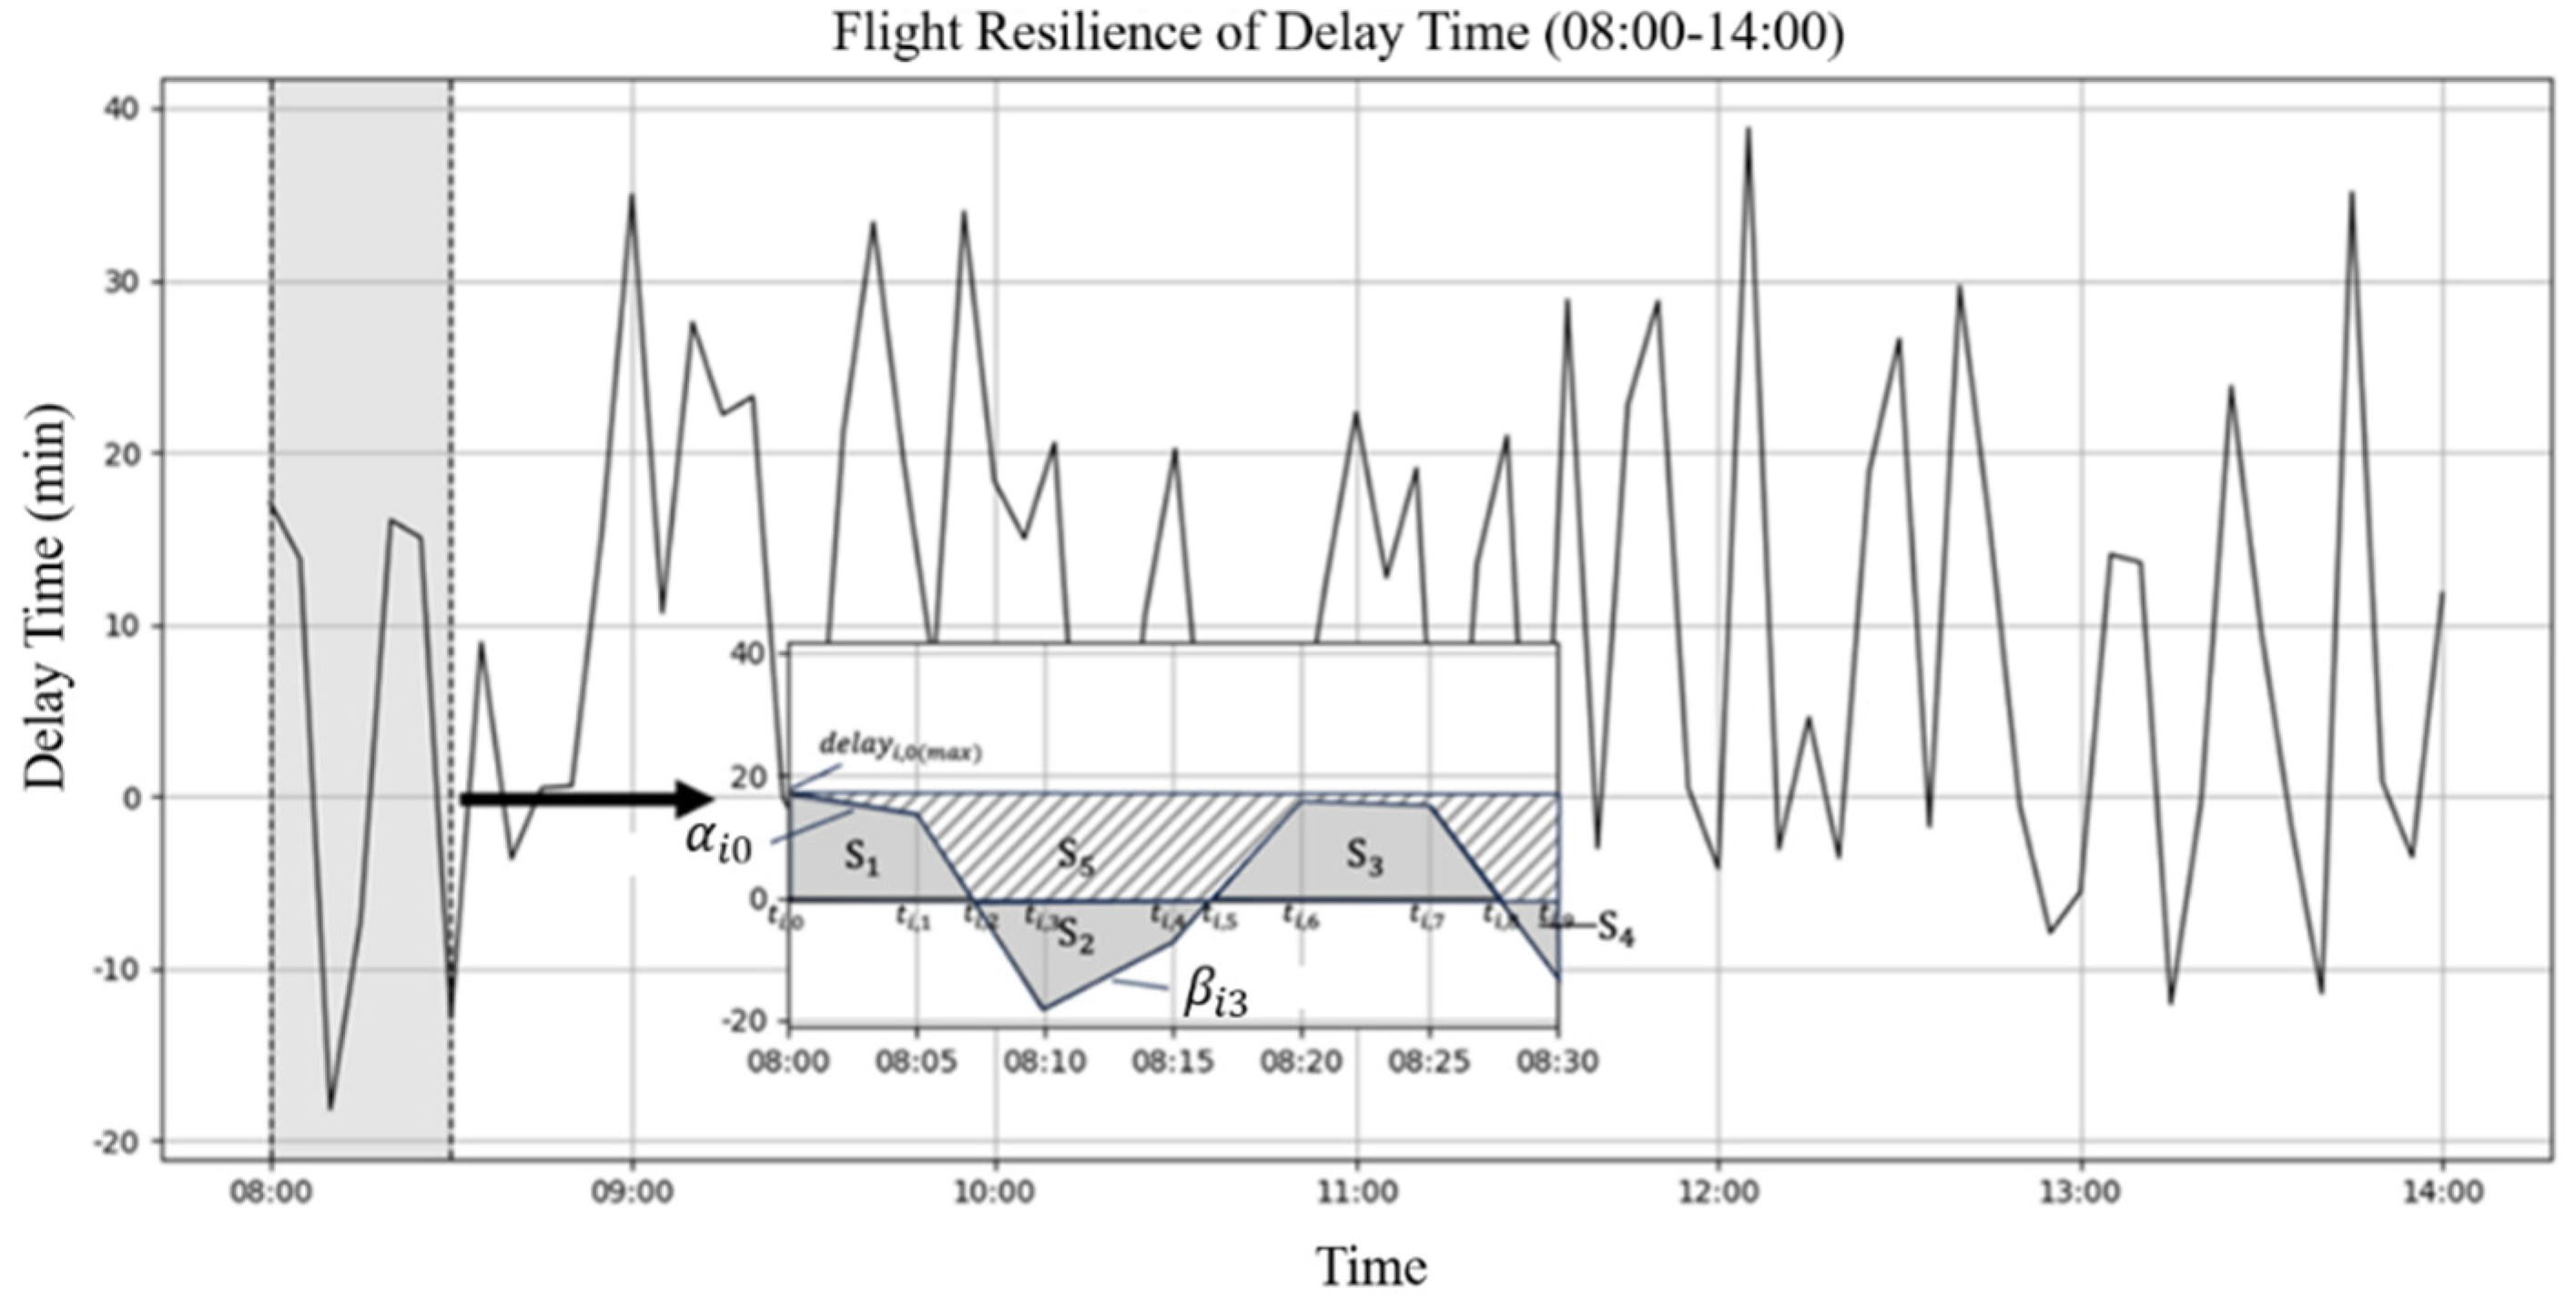
Figure 3.
Flow chart of KAN algorithm.
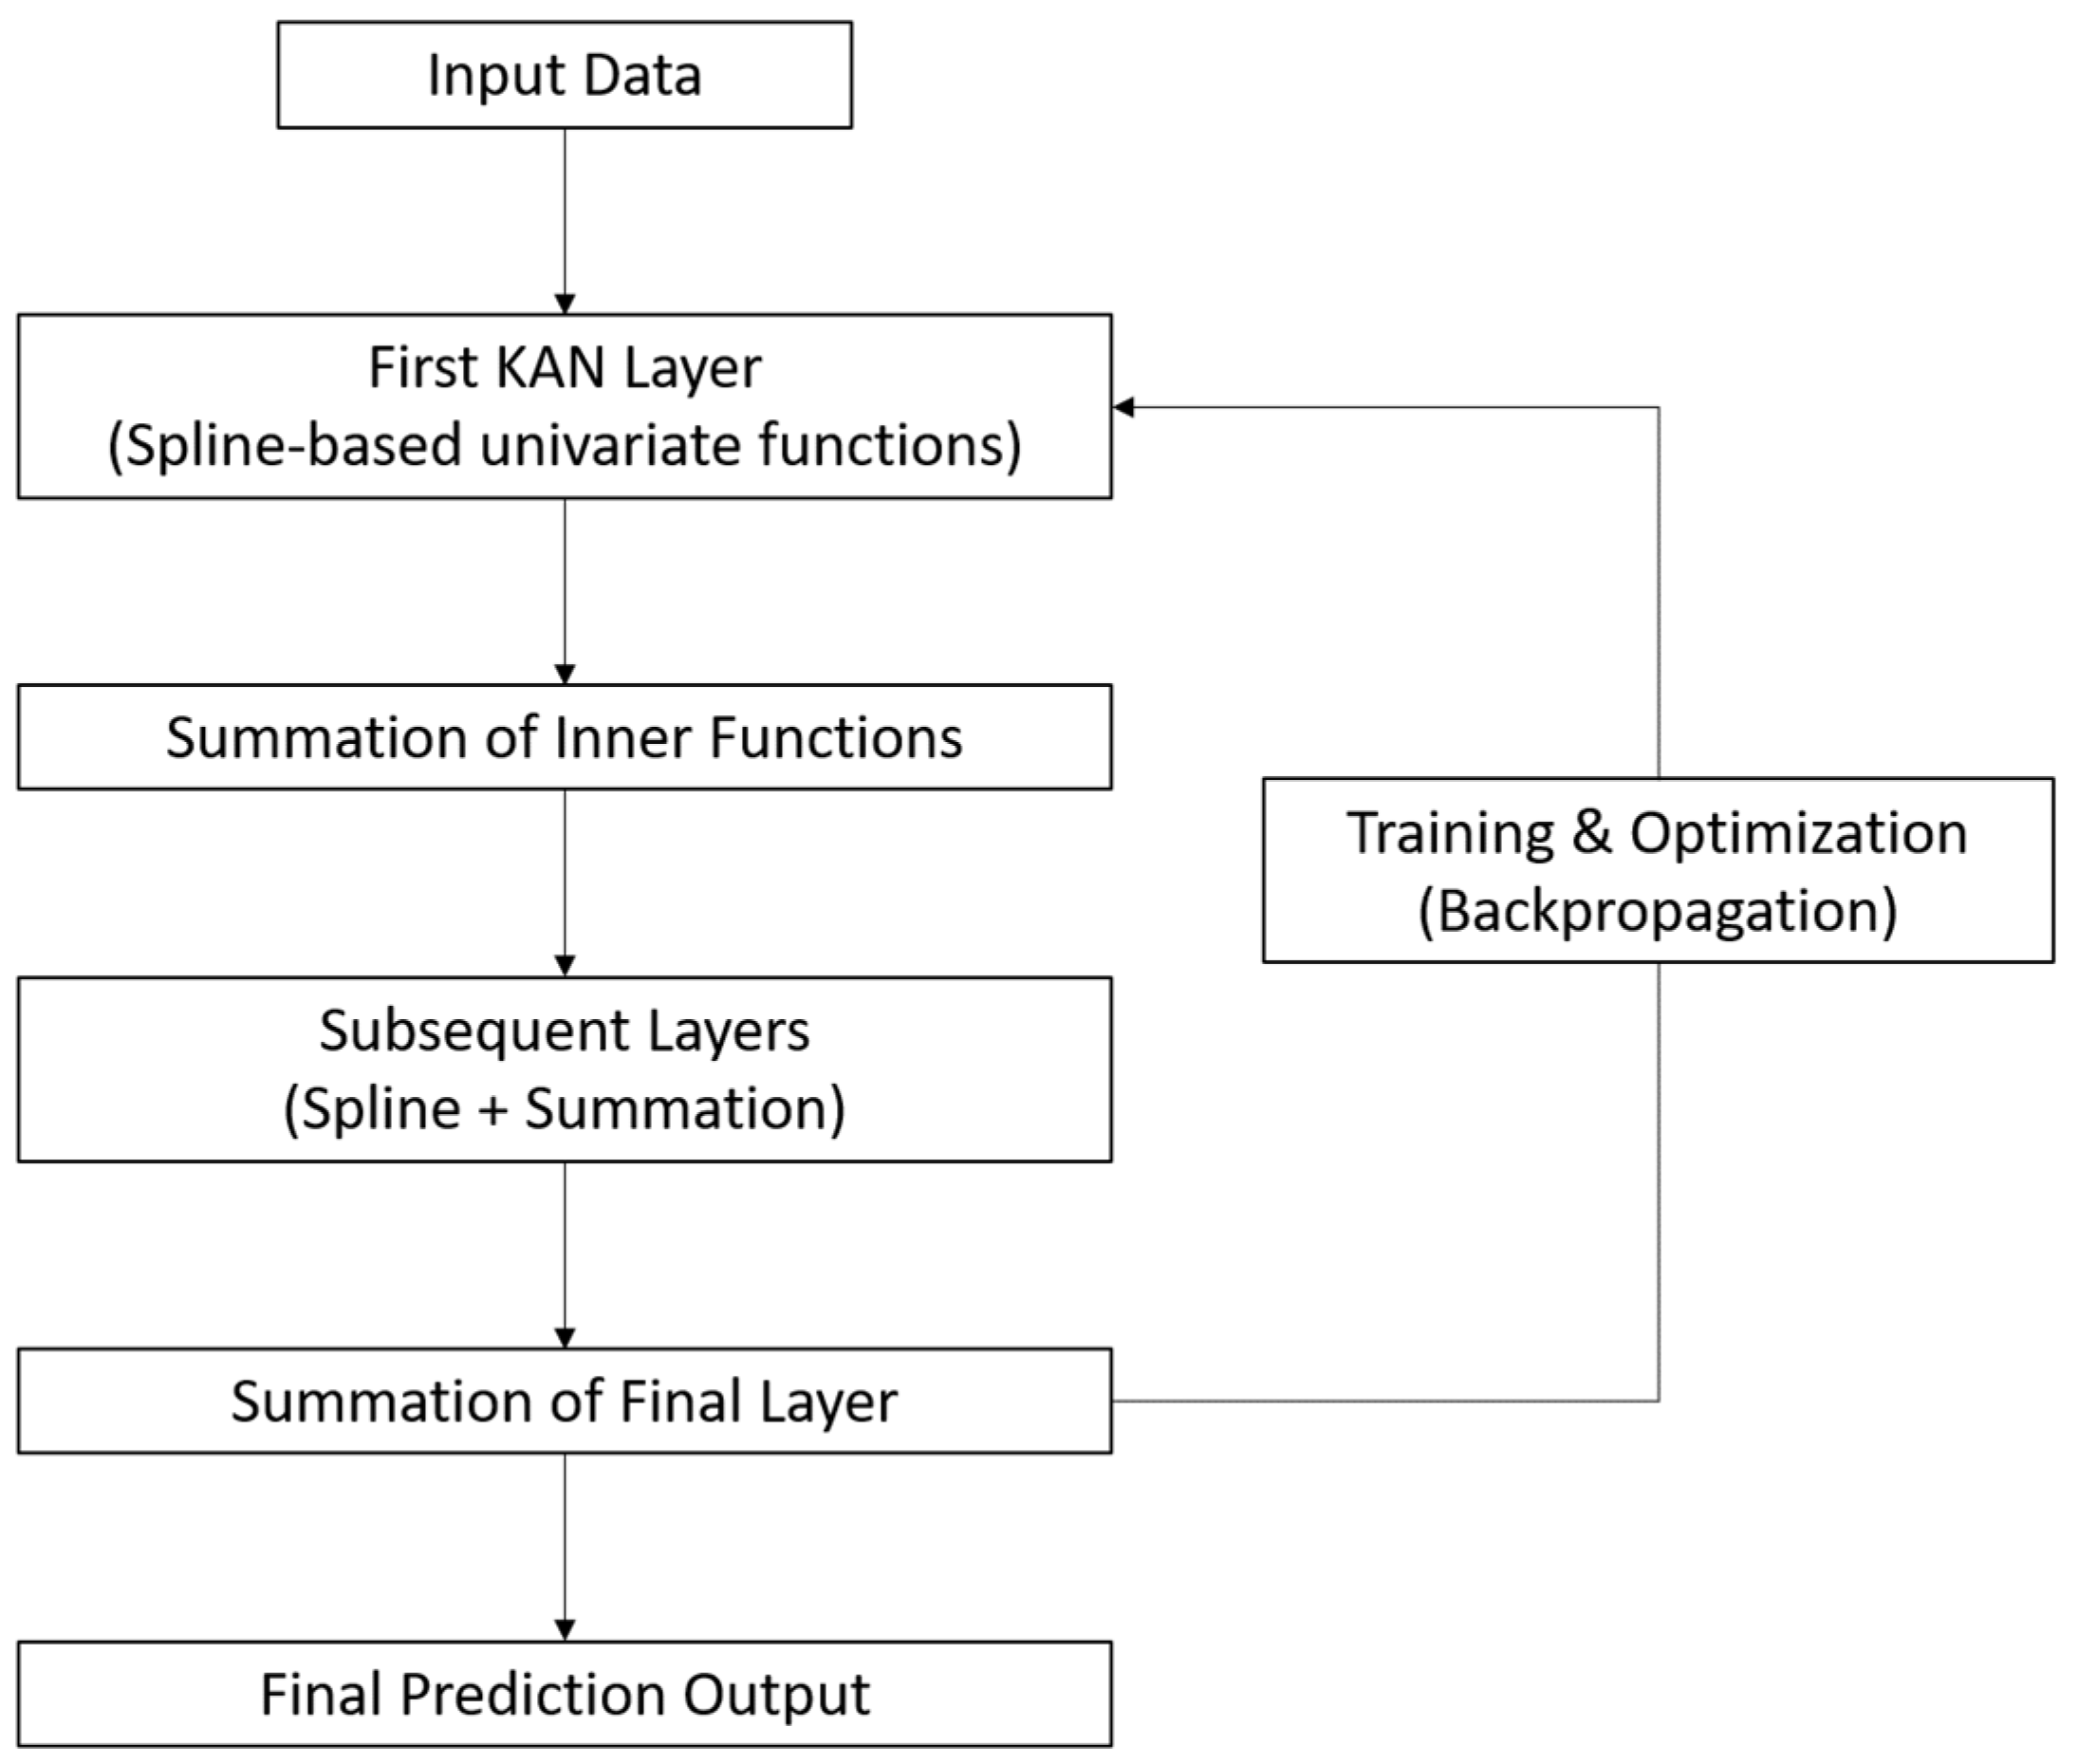
Figure 4.
Layout of routes in Xianyang airport.
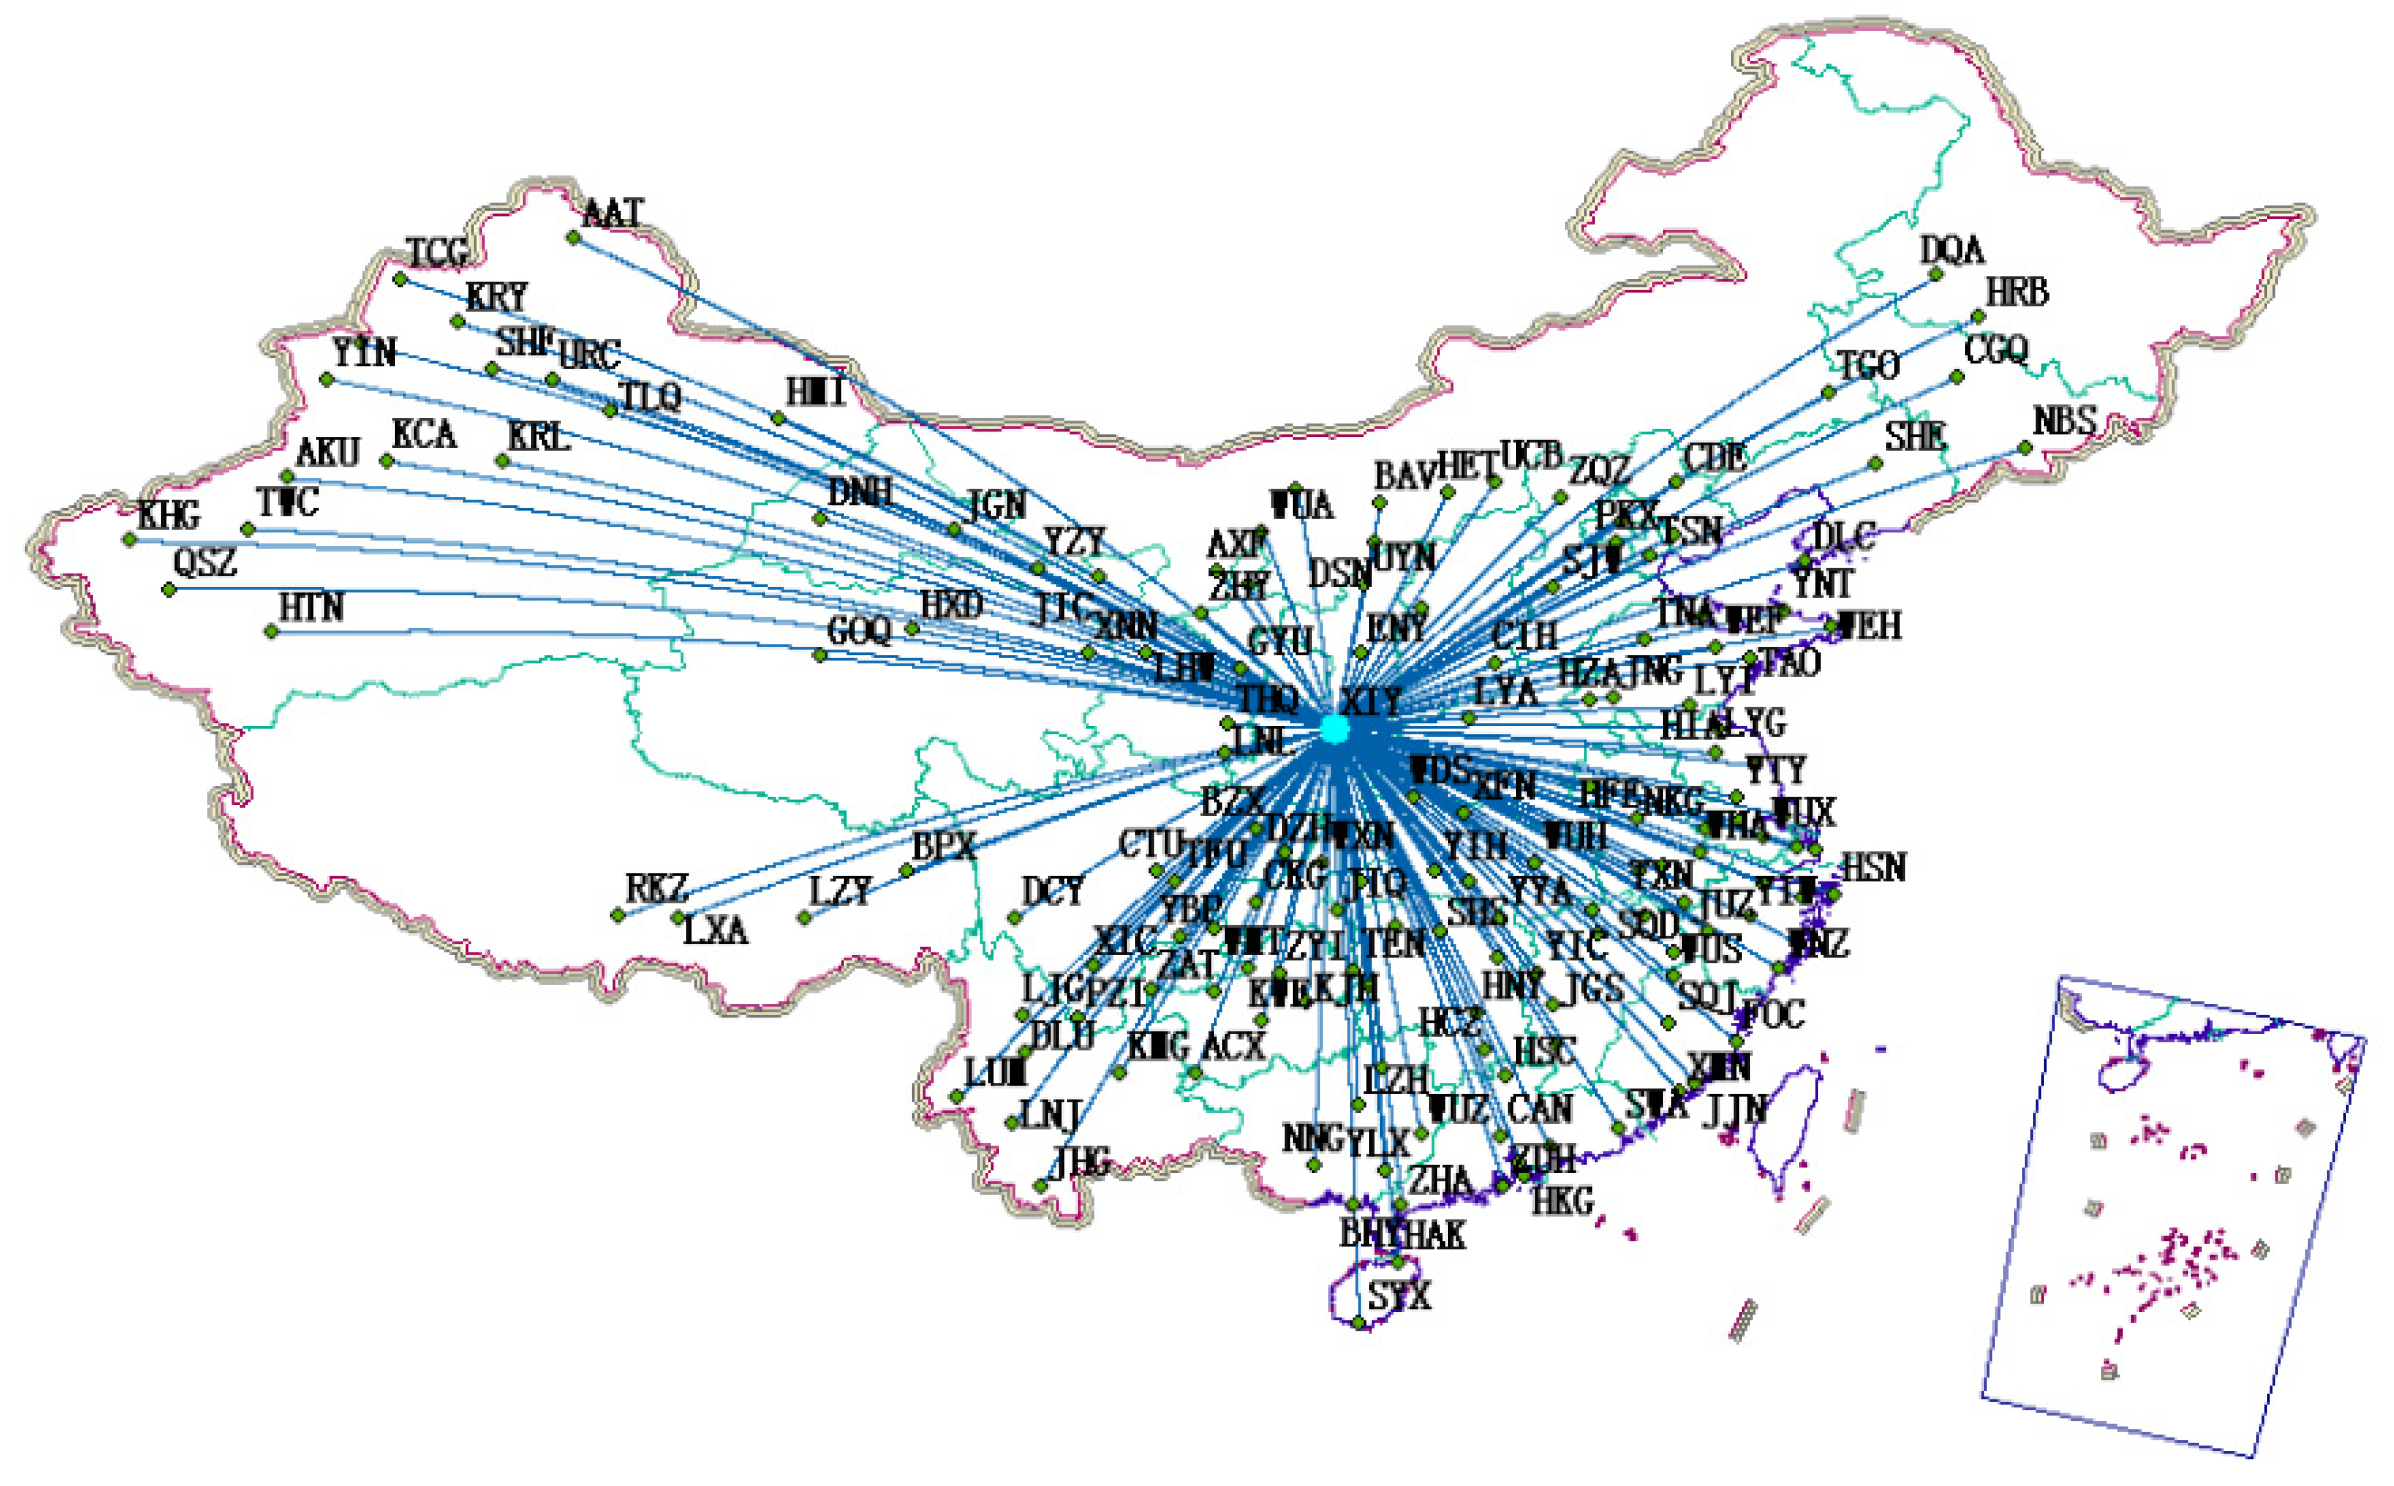
Figure 5.
Flights delay in 2023/2/23 from 6:00 to 12:00.
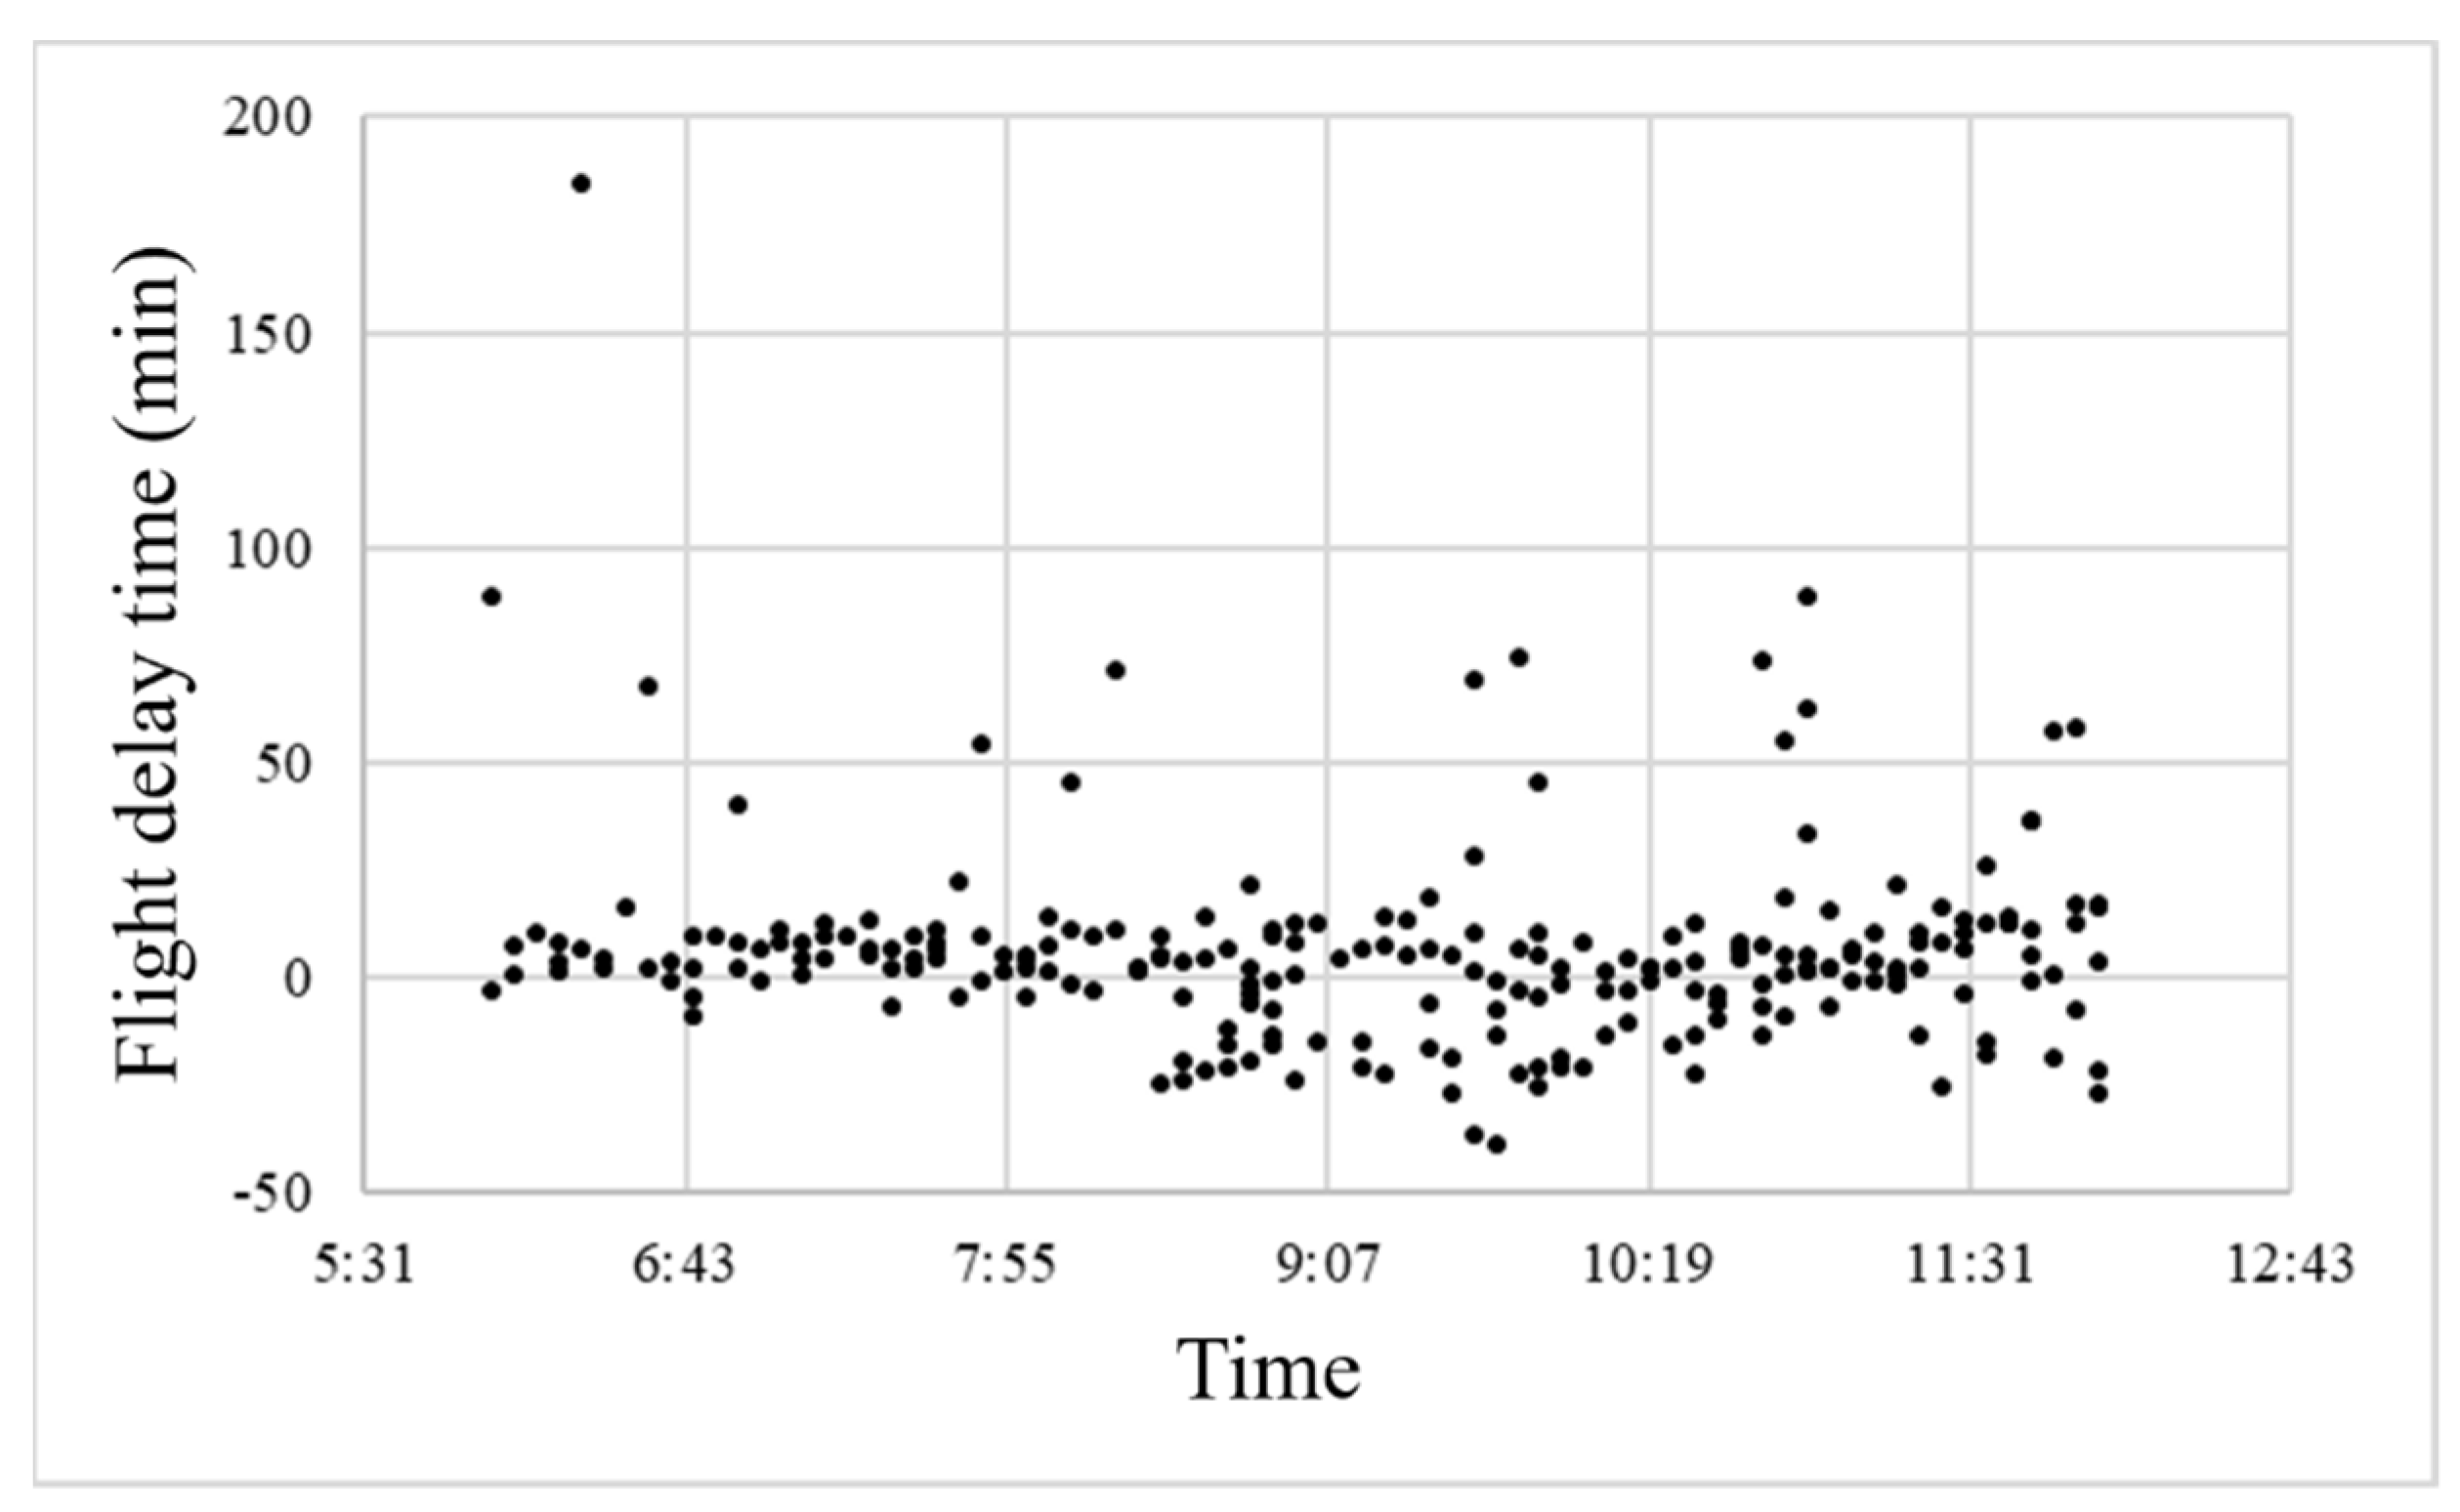
Figure 6.
Pareto frontier of the airport capacity every 15 minutes.
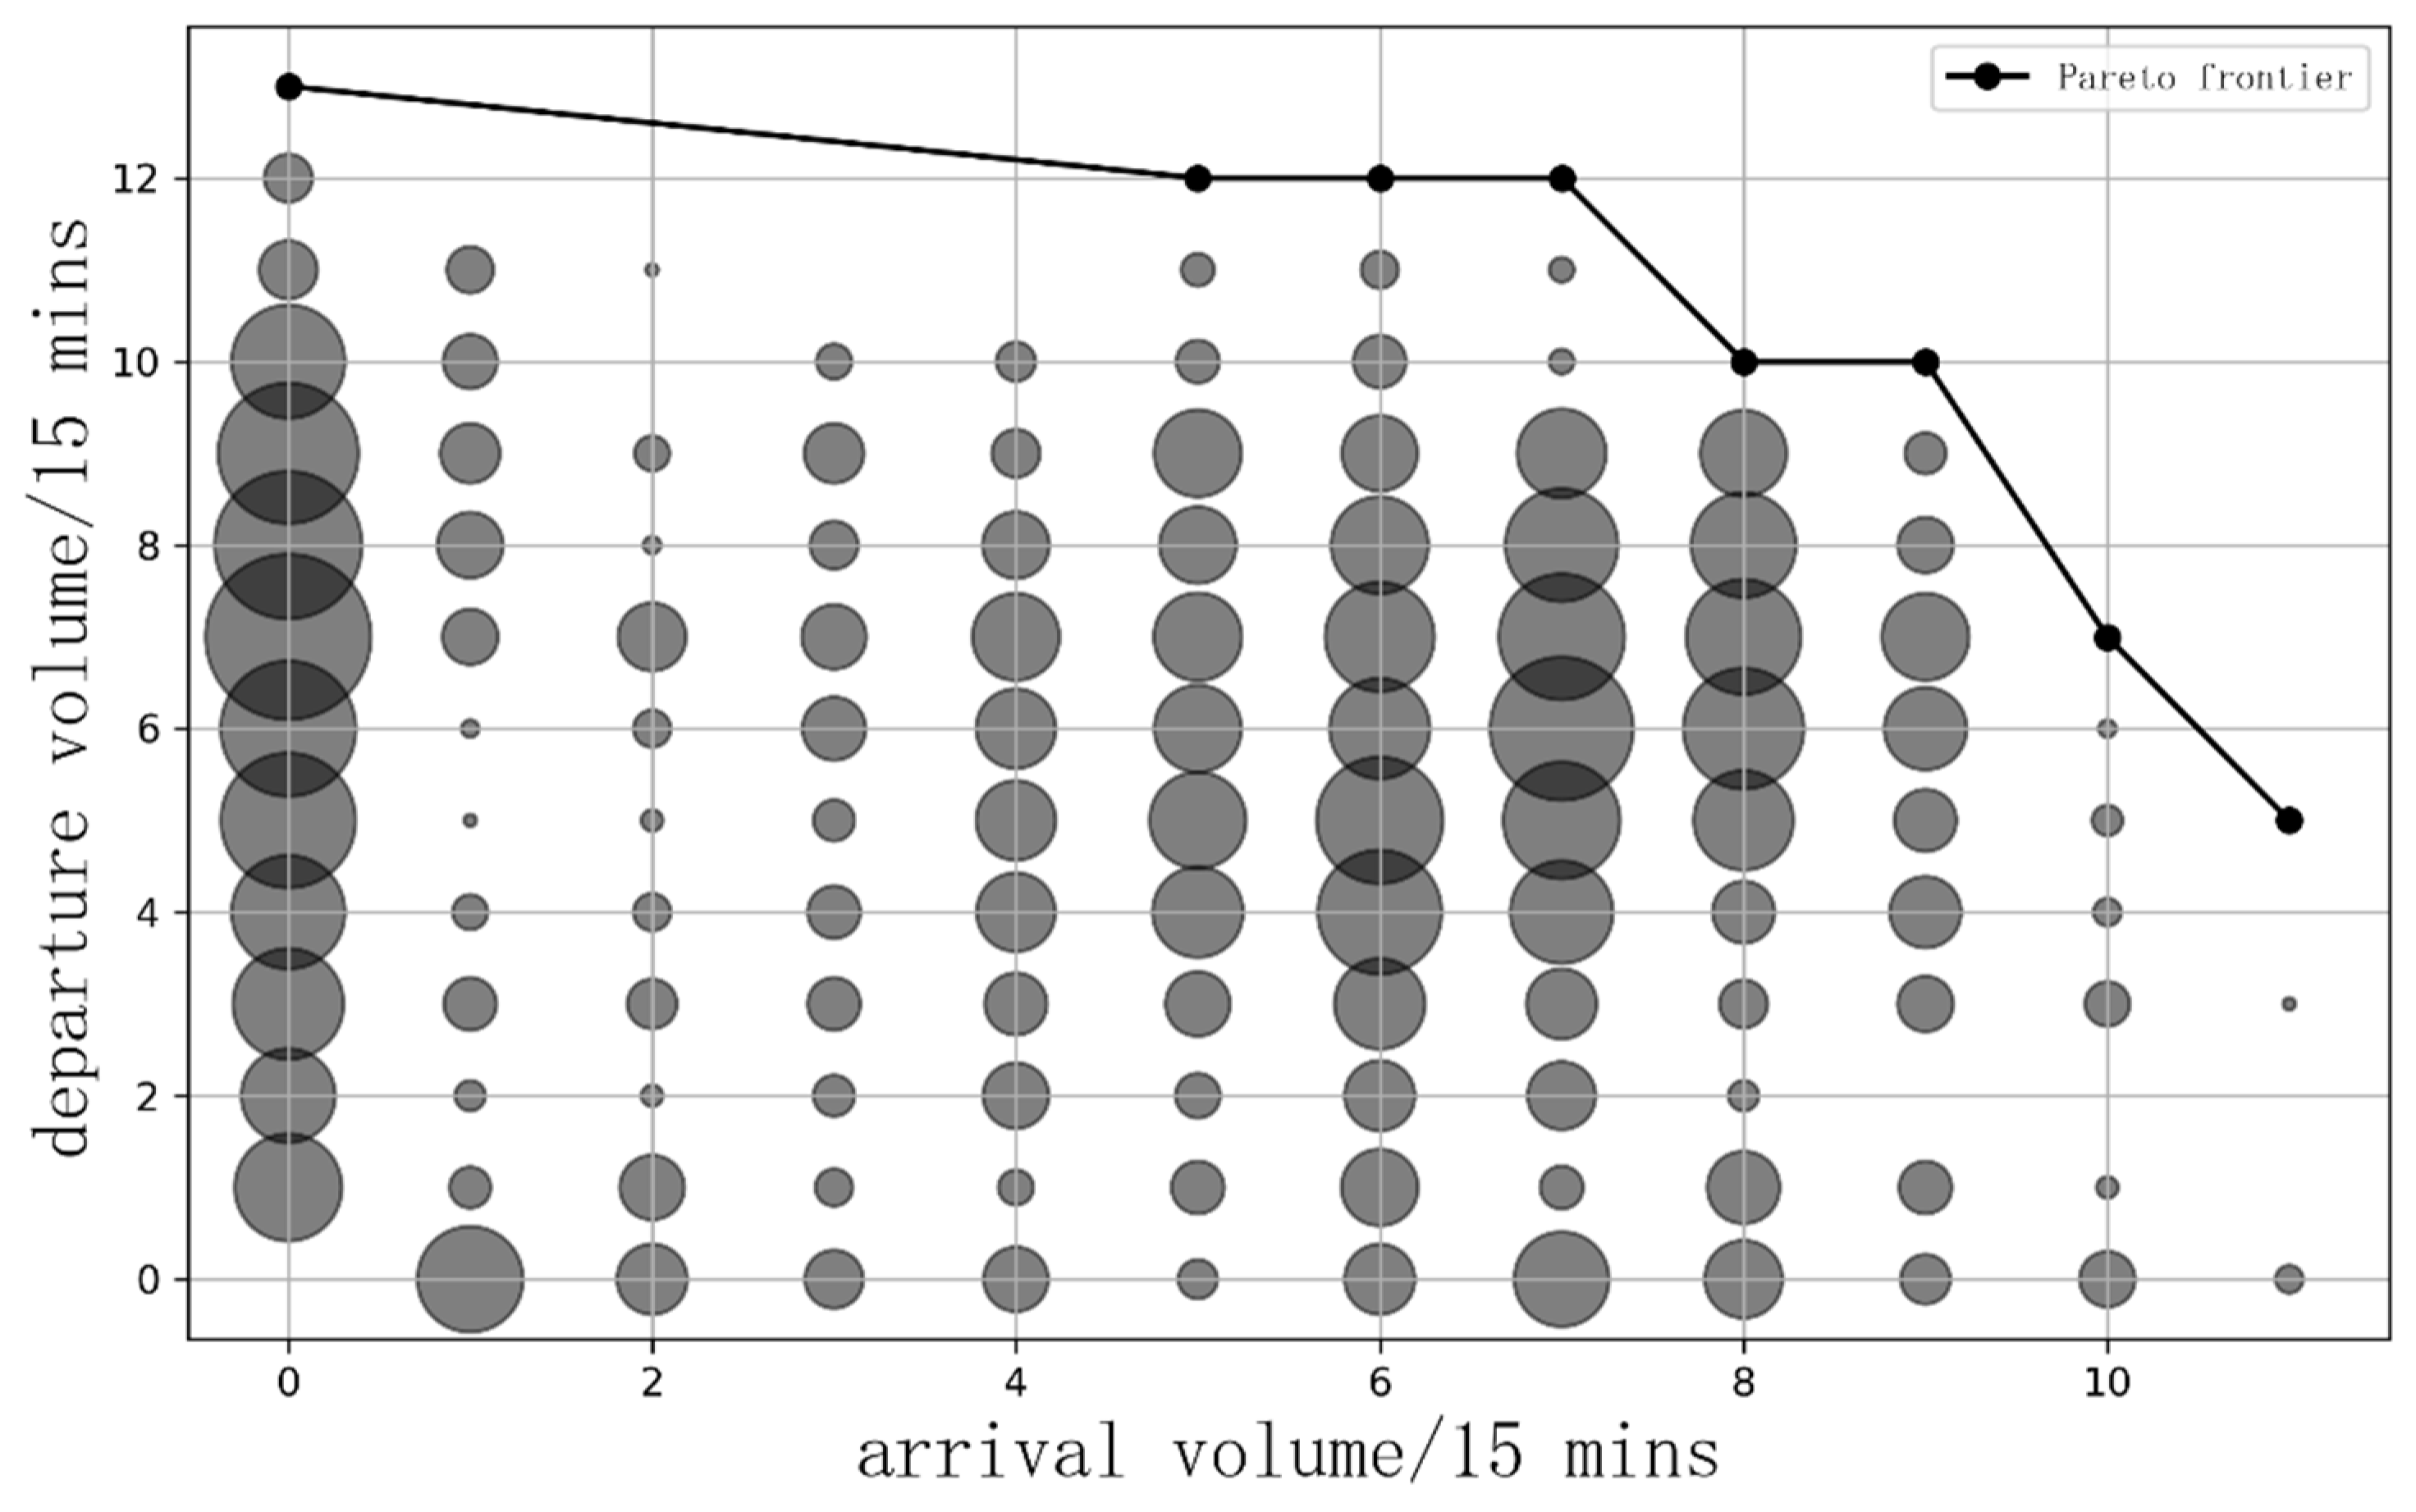
Figure 7.
Average daily flight volume, flight distance and RAI of each route.
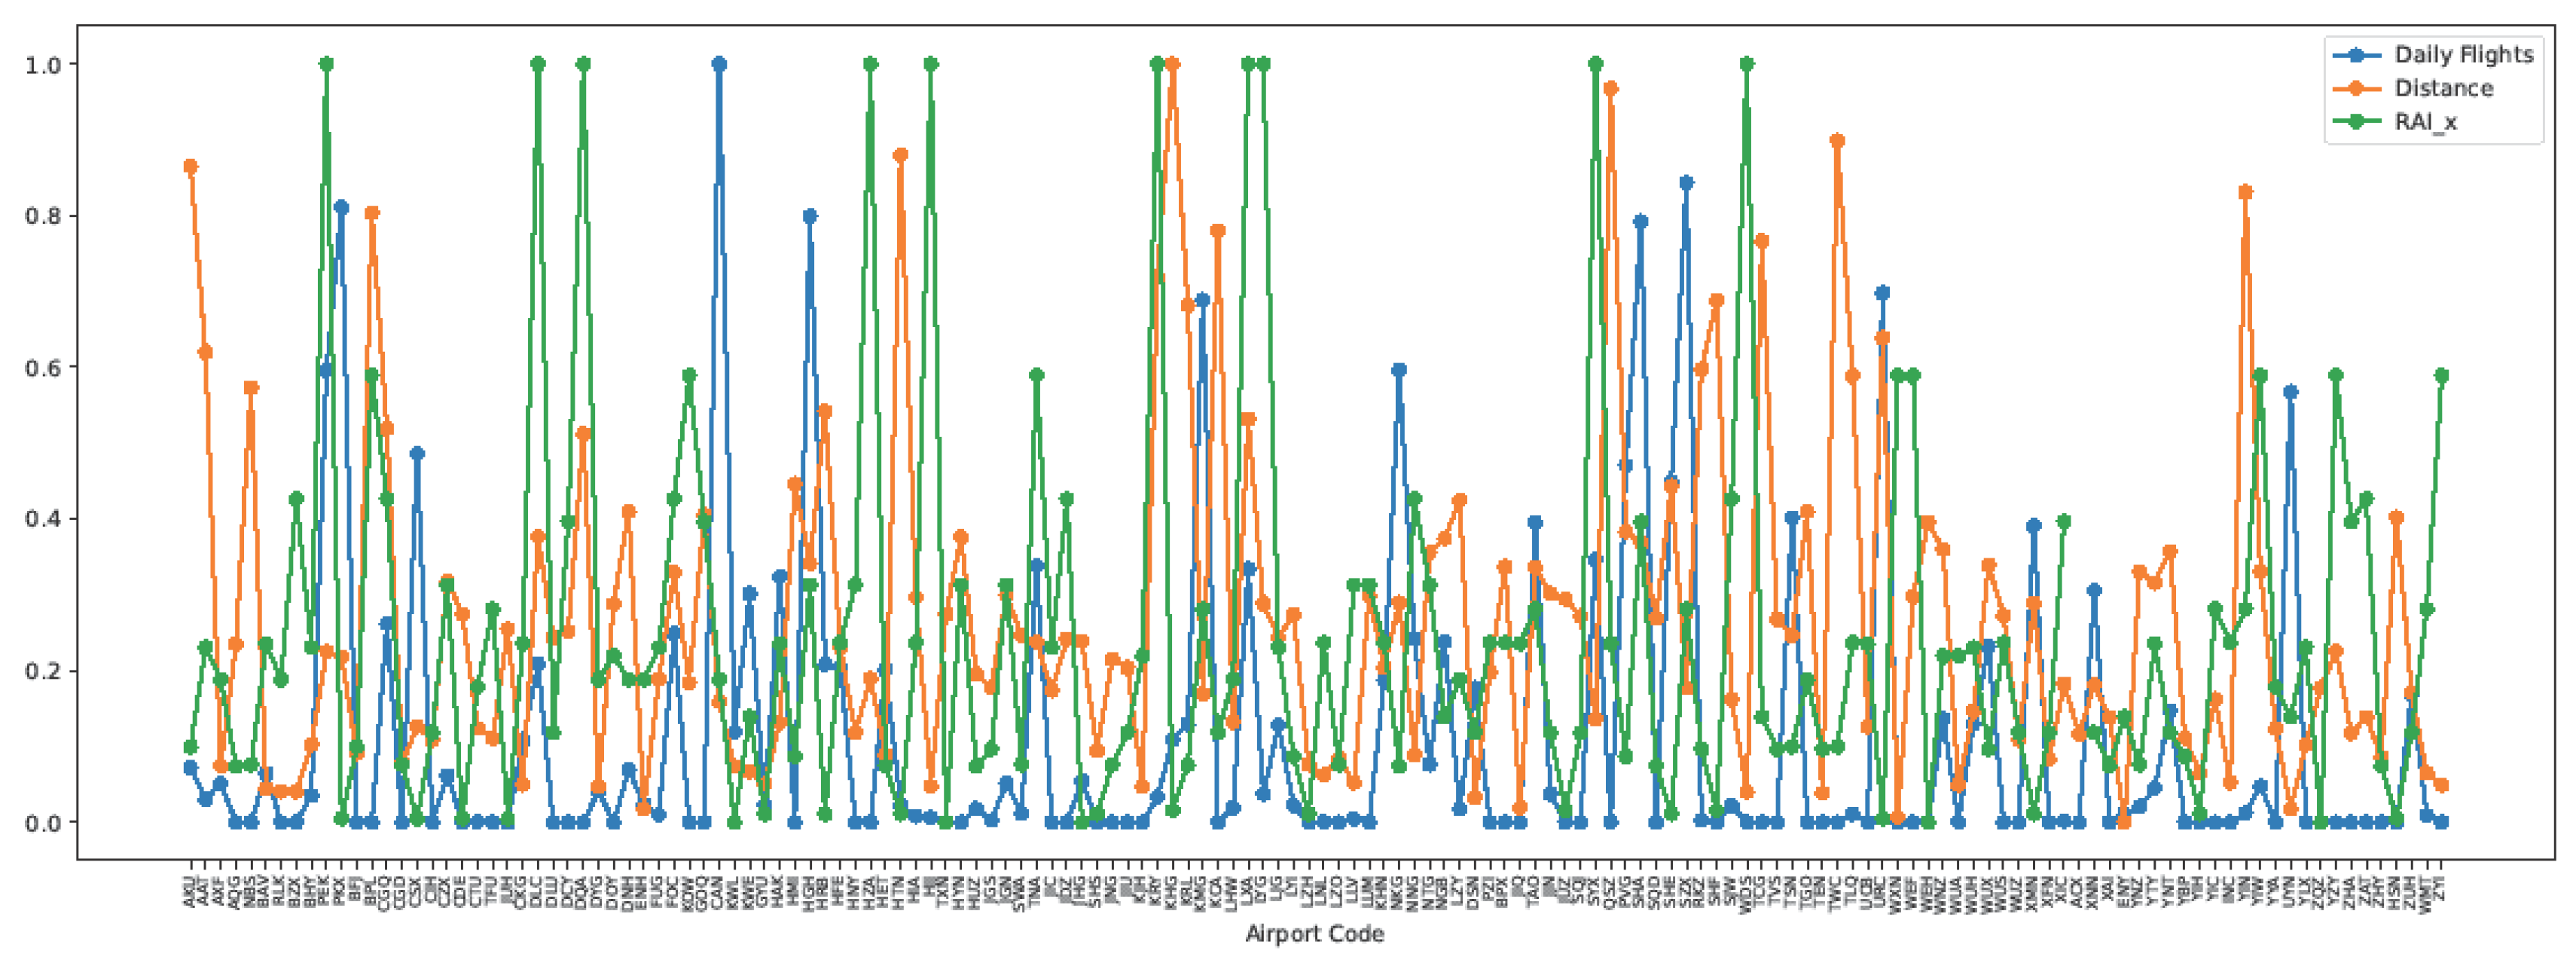
Figure 8.
Changes in daily operational resilience values of routes in the central and eastern regions.
Figure 8.
Changes in daily operational resilience values of routes in the central and eastern regions.
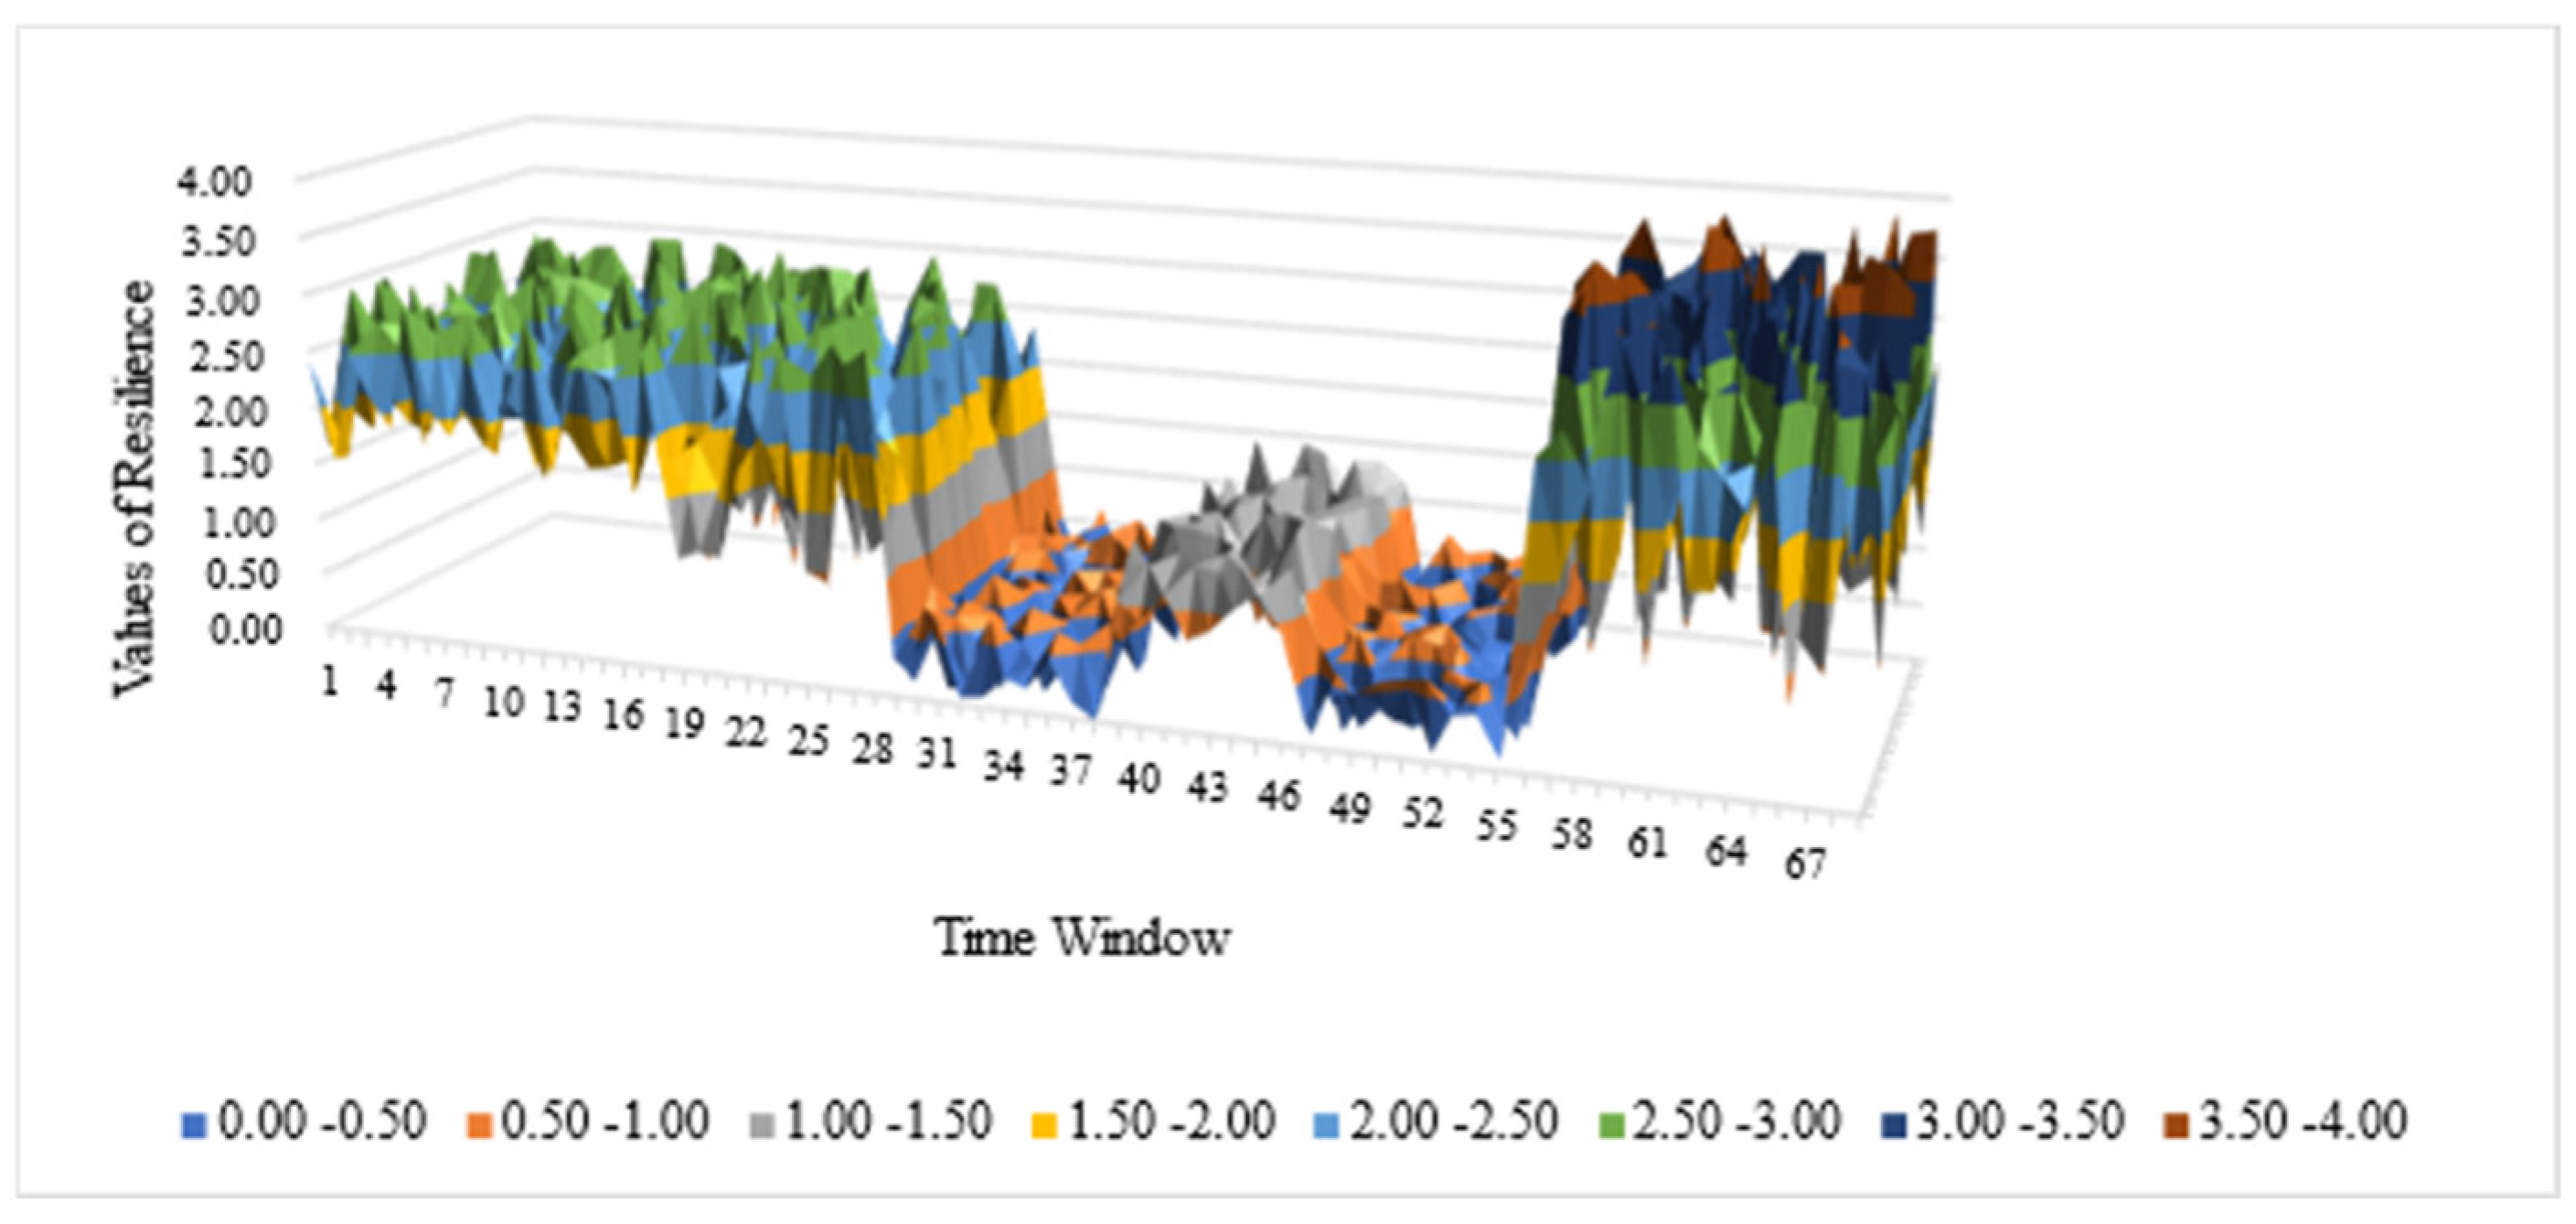
Figure 9.
Changes in daily operational resilience values of routes in western and remote areas.
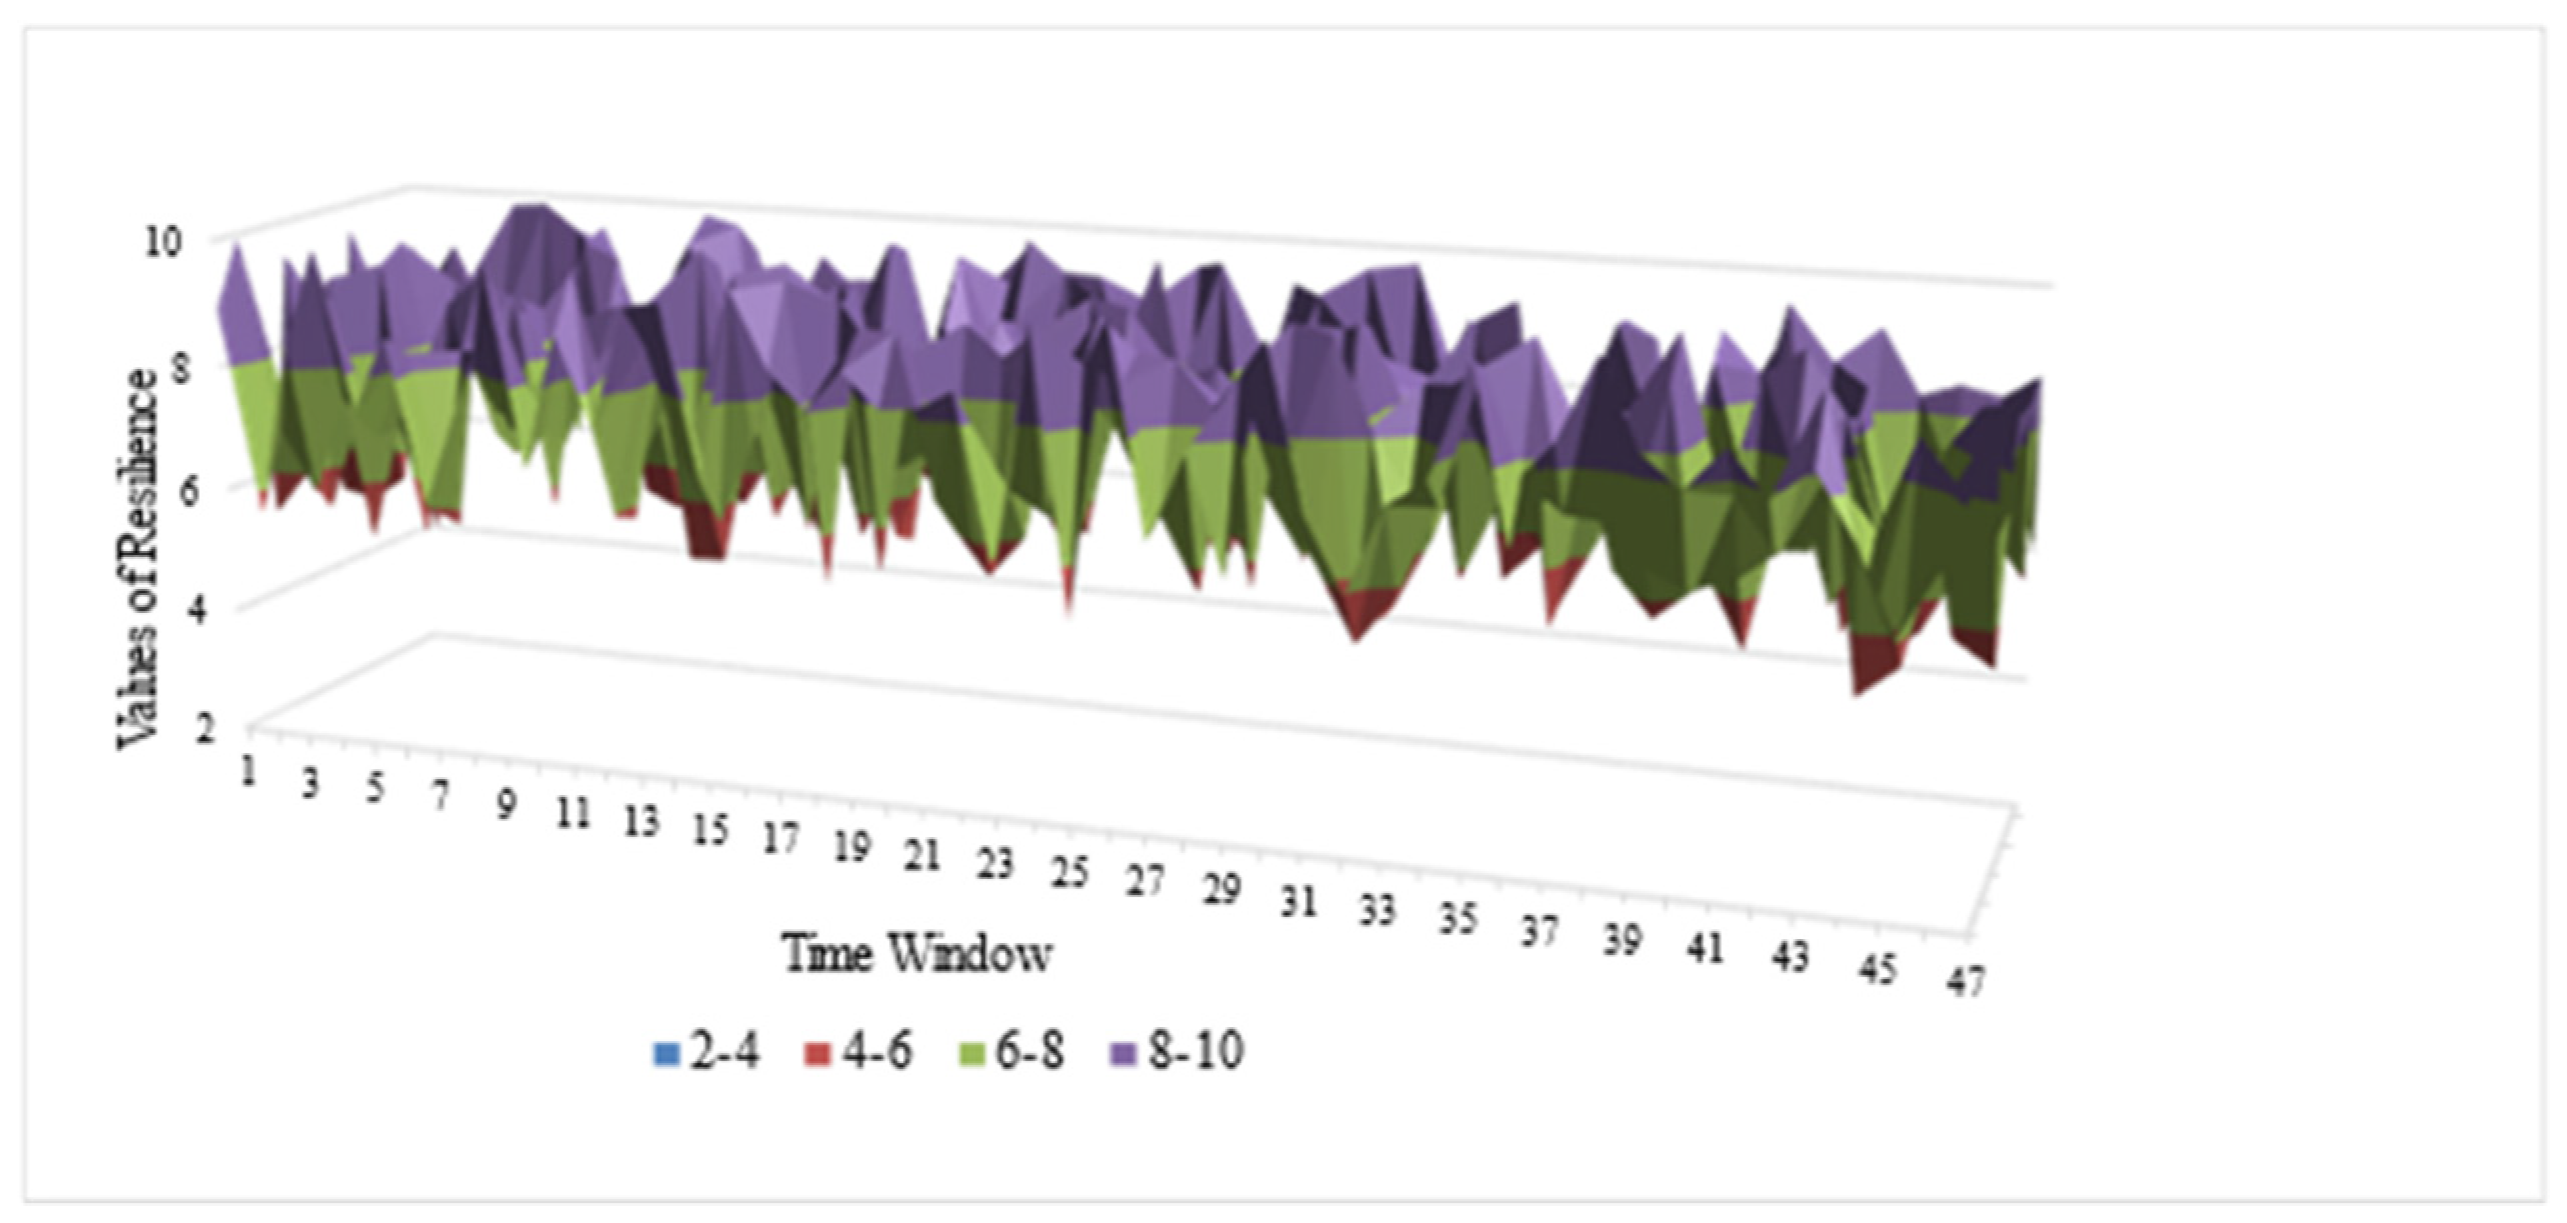
Figure 10.
Flight resilience with predicted values using KAN.
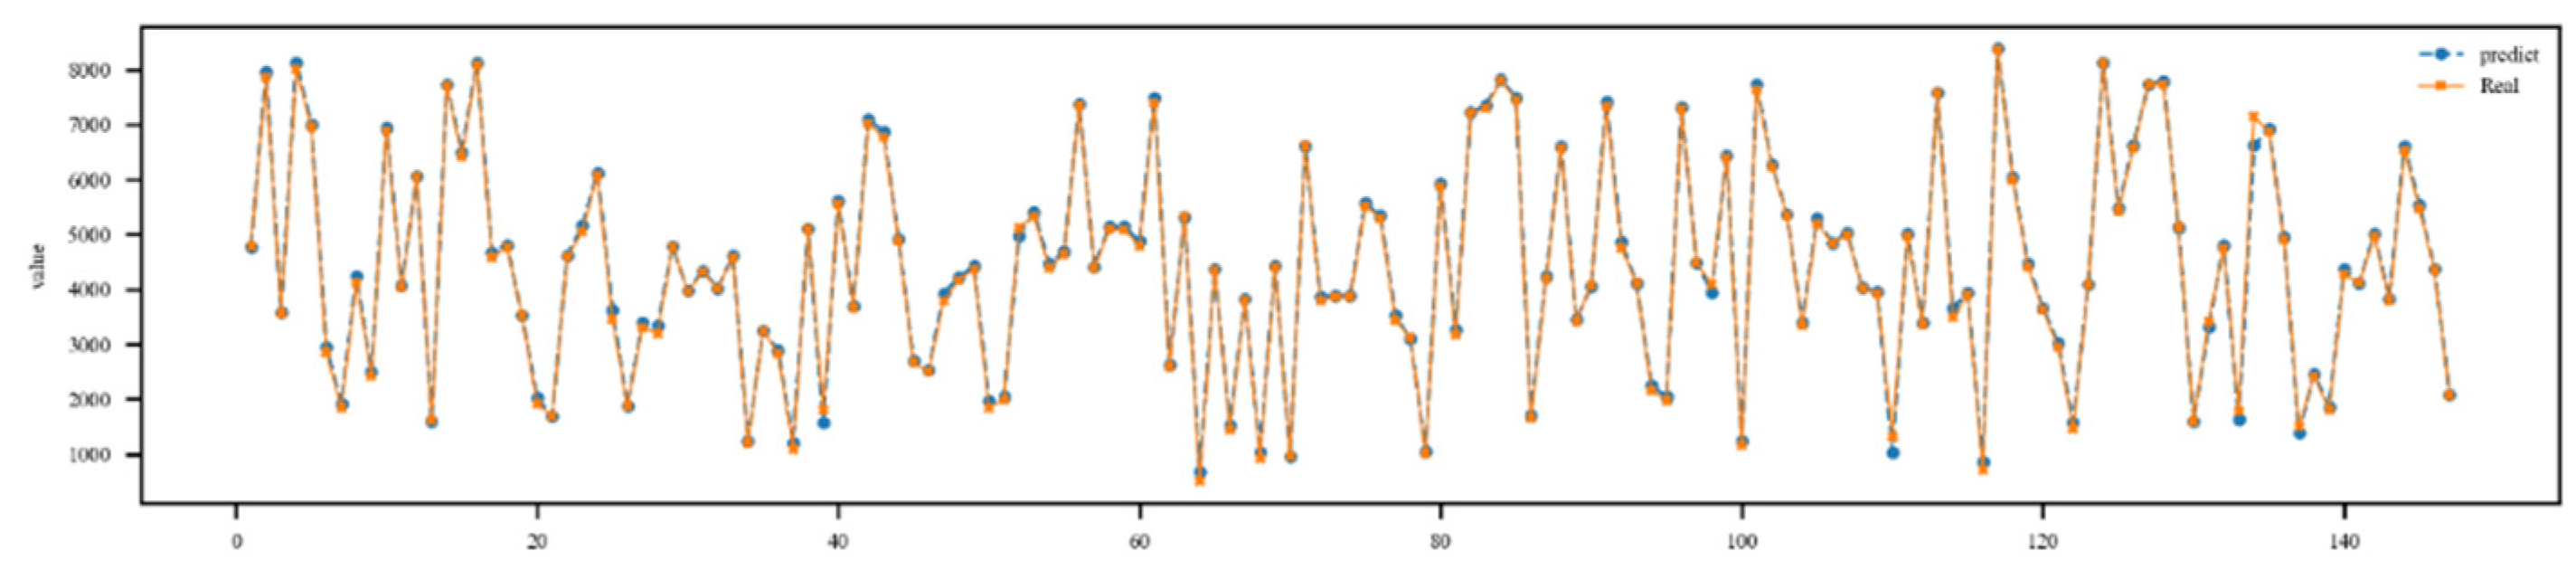
Figure 11.
The importance of weather factors to flight operation indicators.
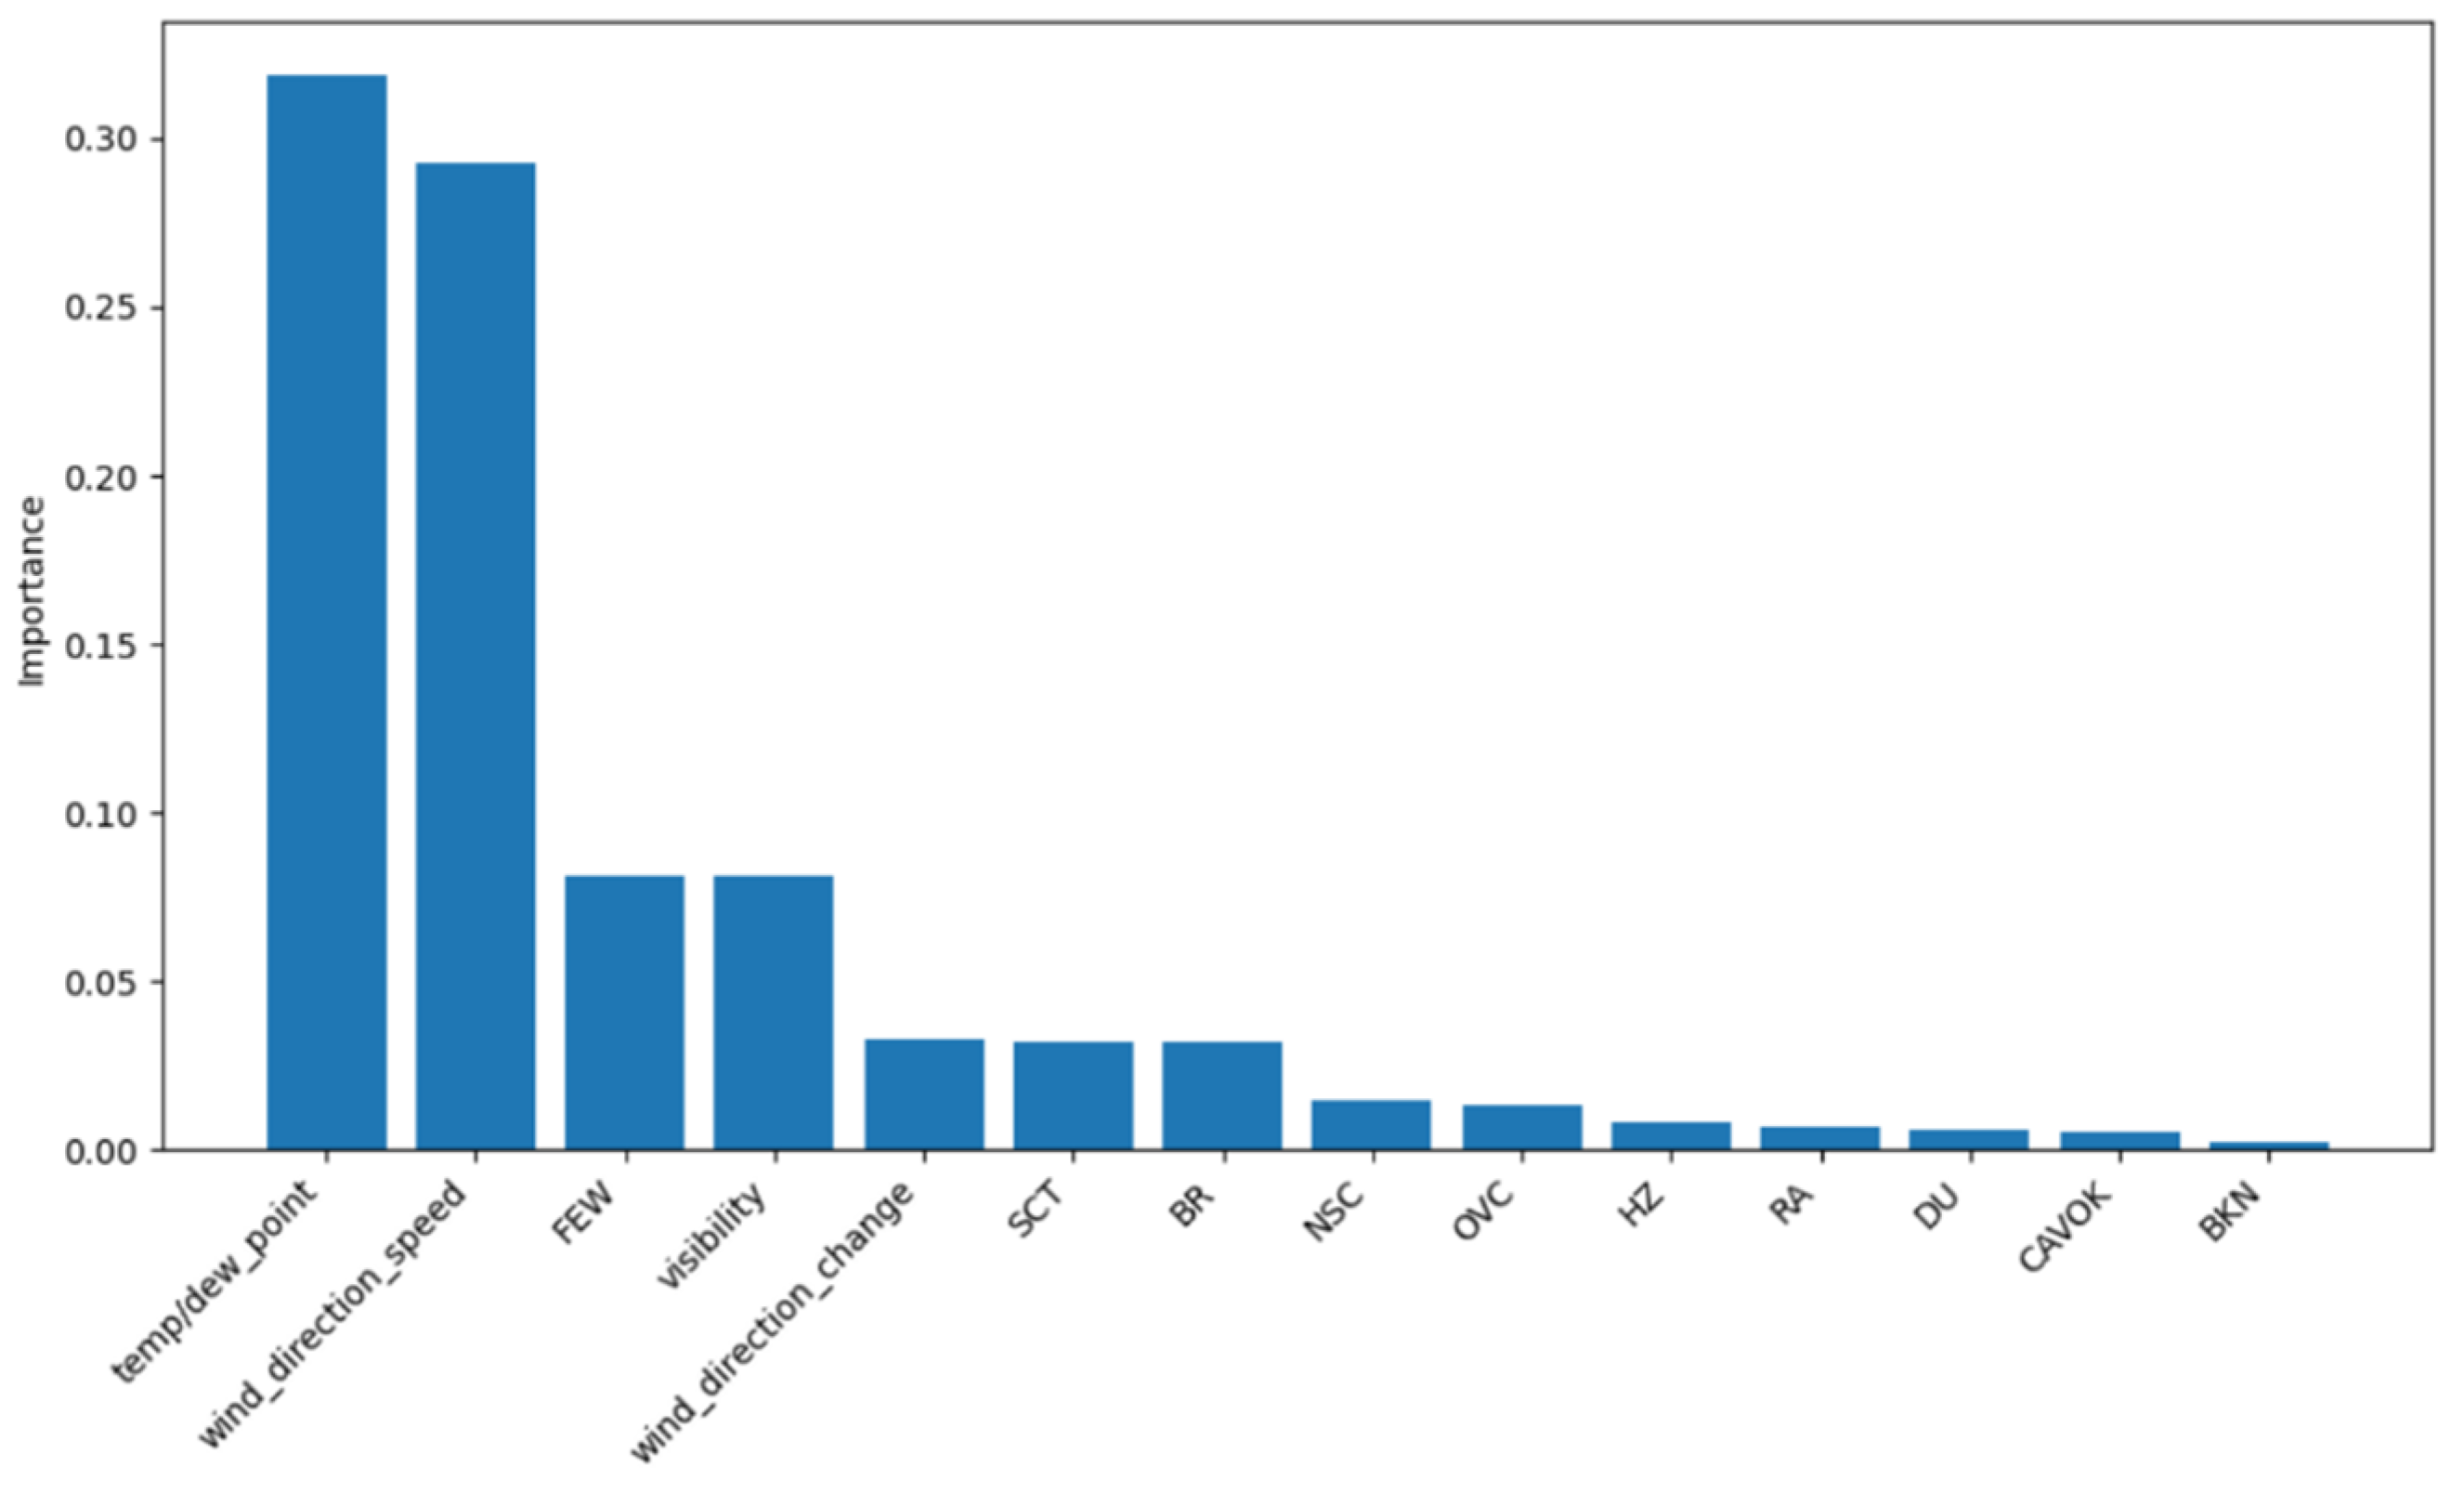
Figure 12.
The importance of weather factors to flight economic indicators.
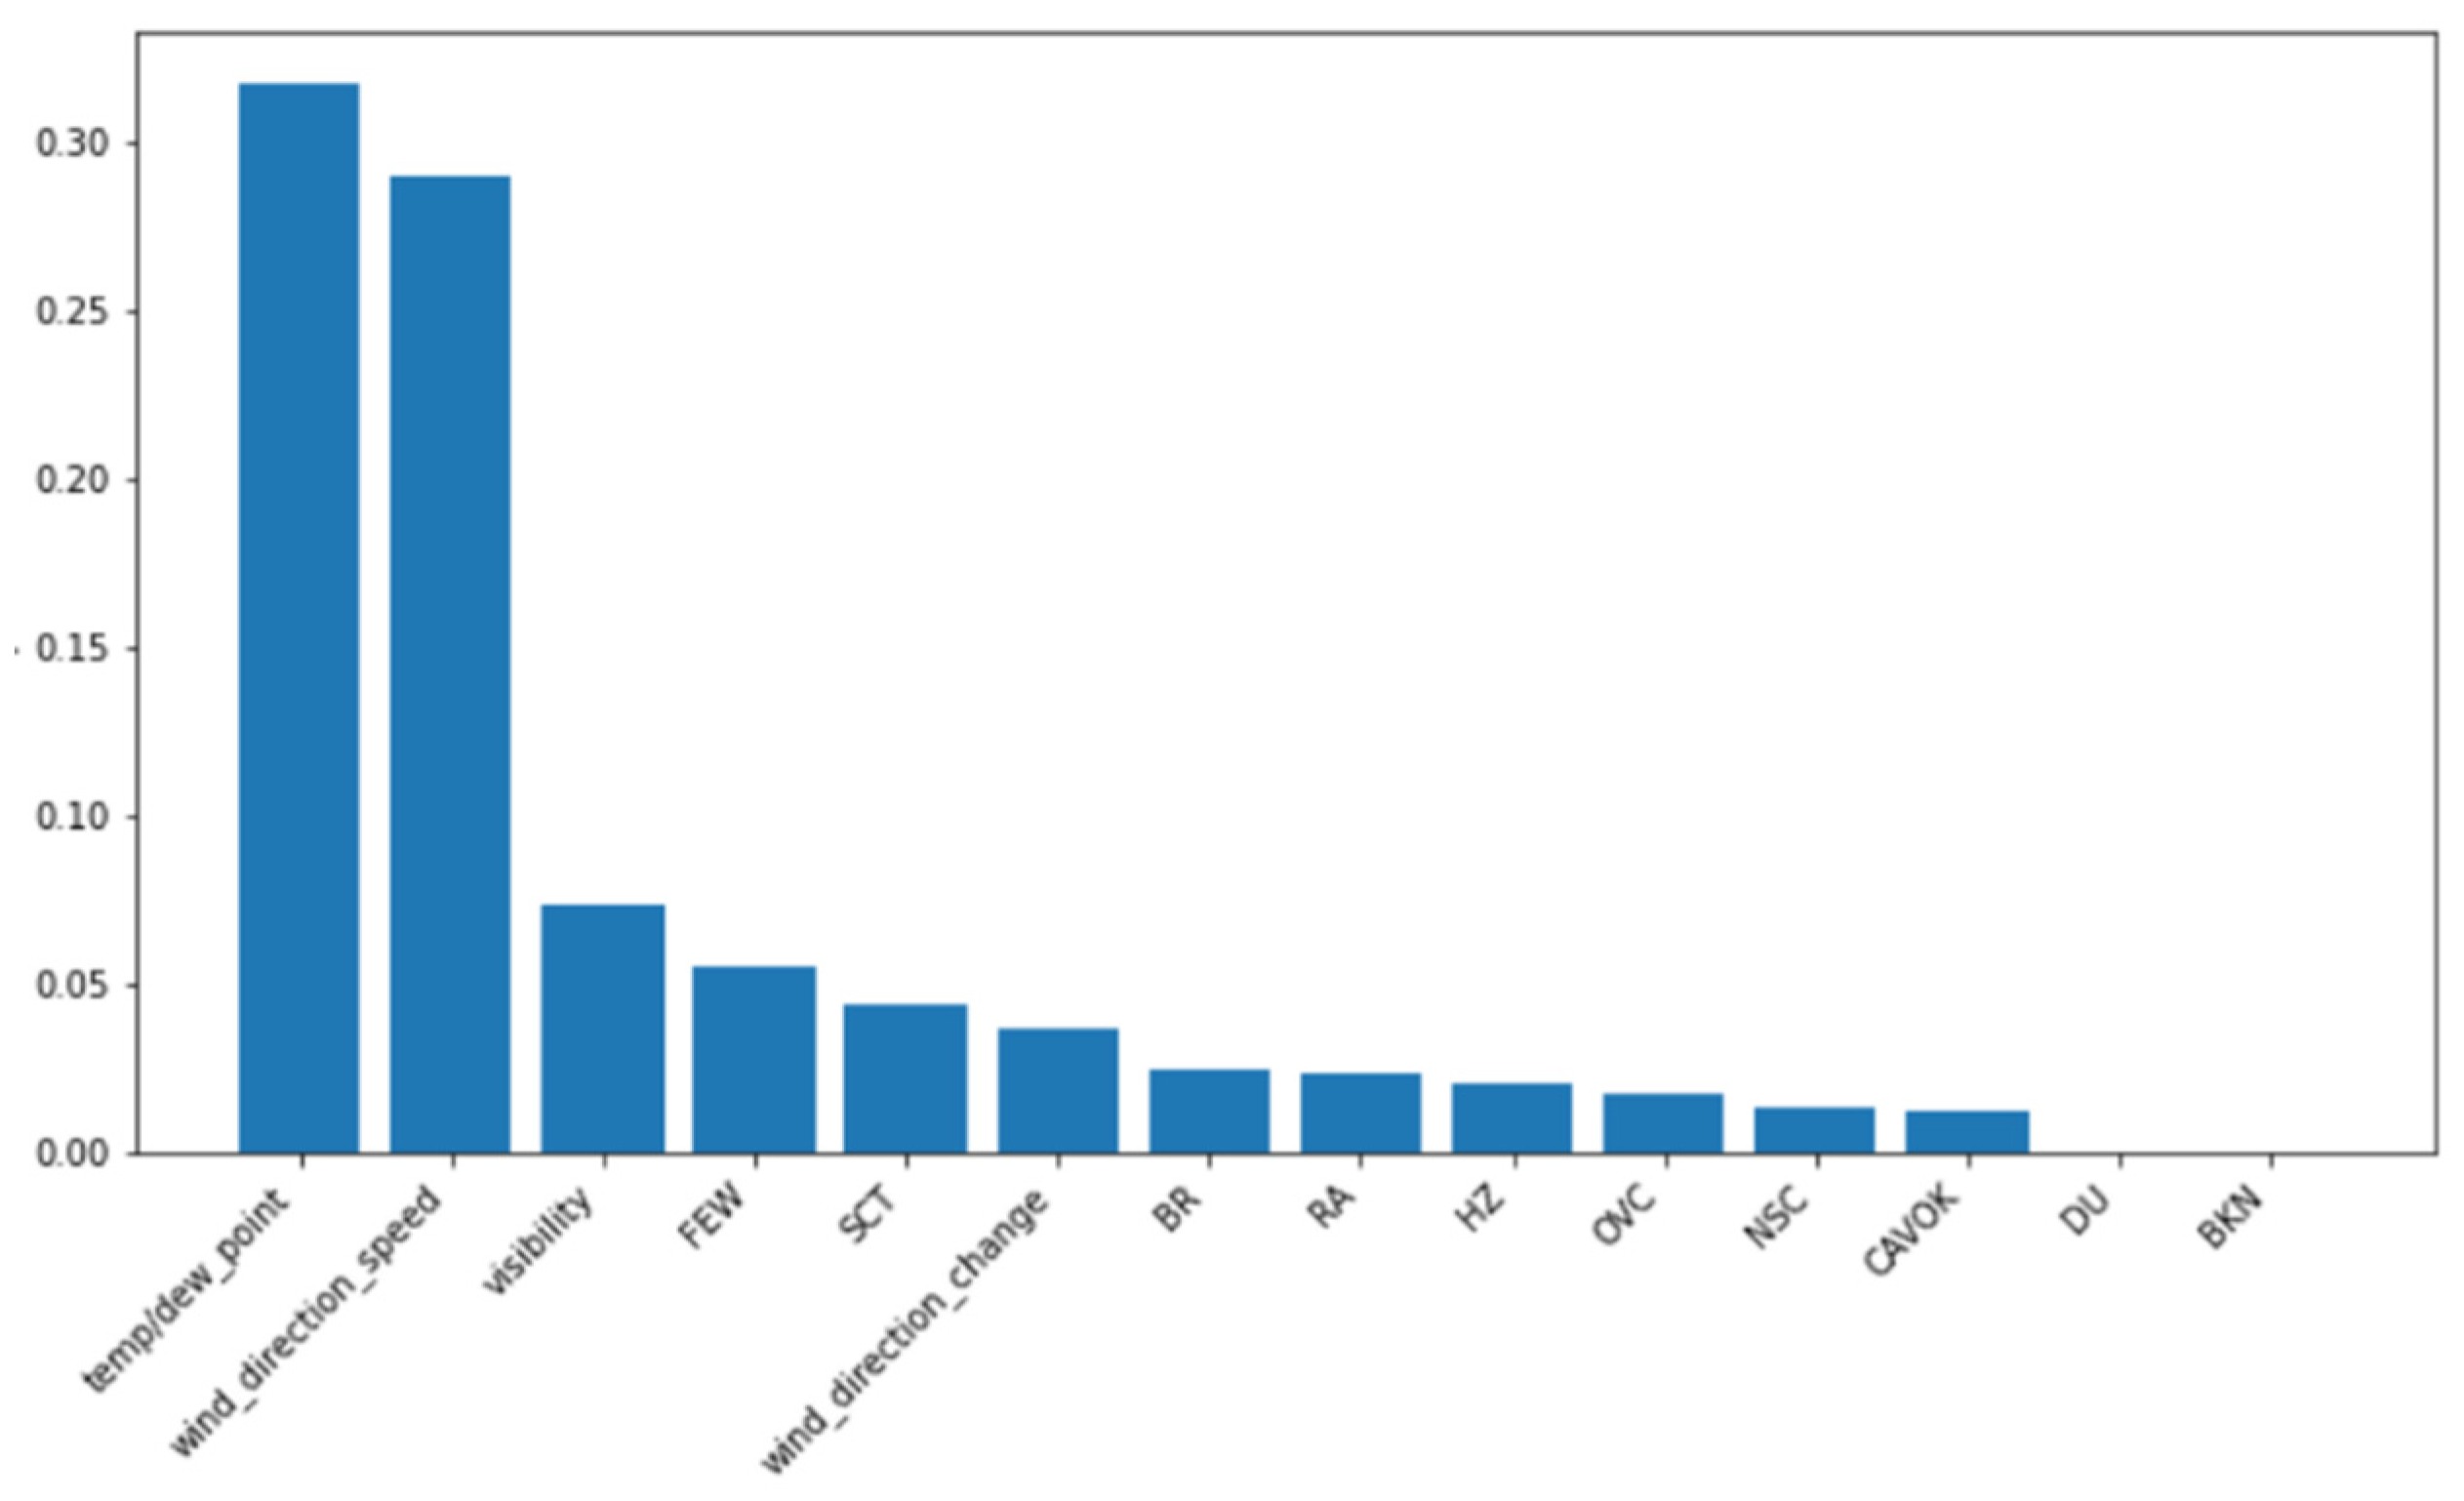
Figure 13.
The importance of weather factors to flight transportation capacity.
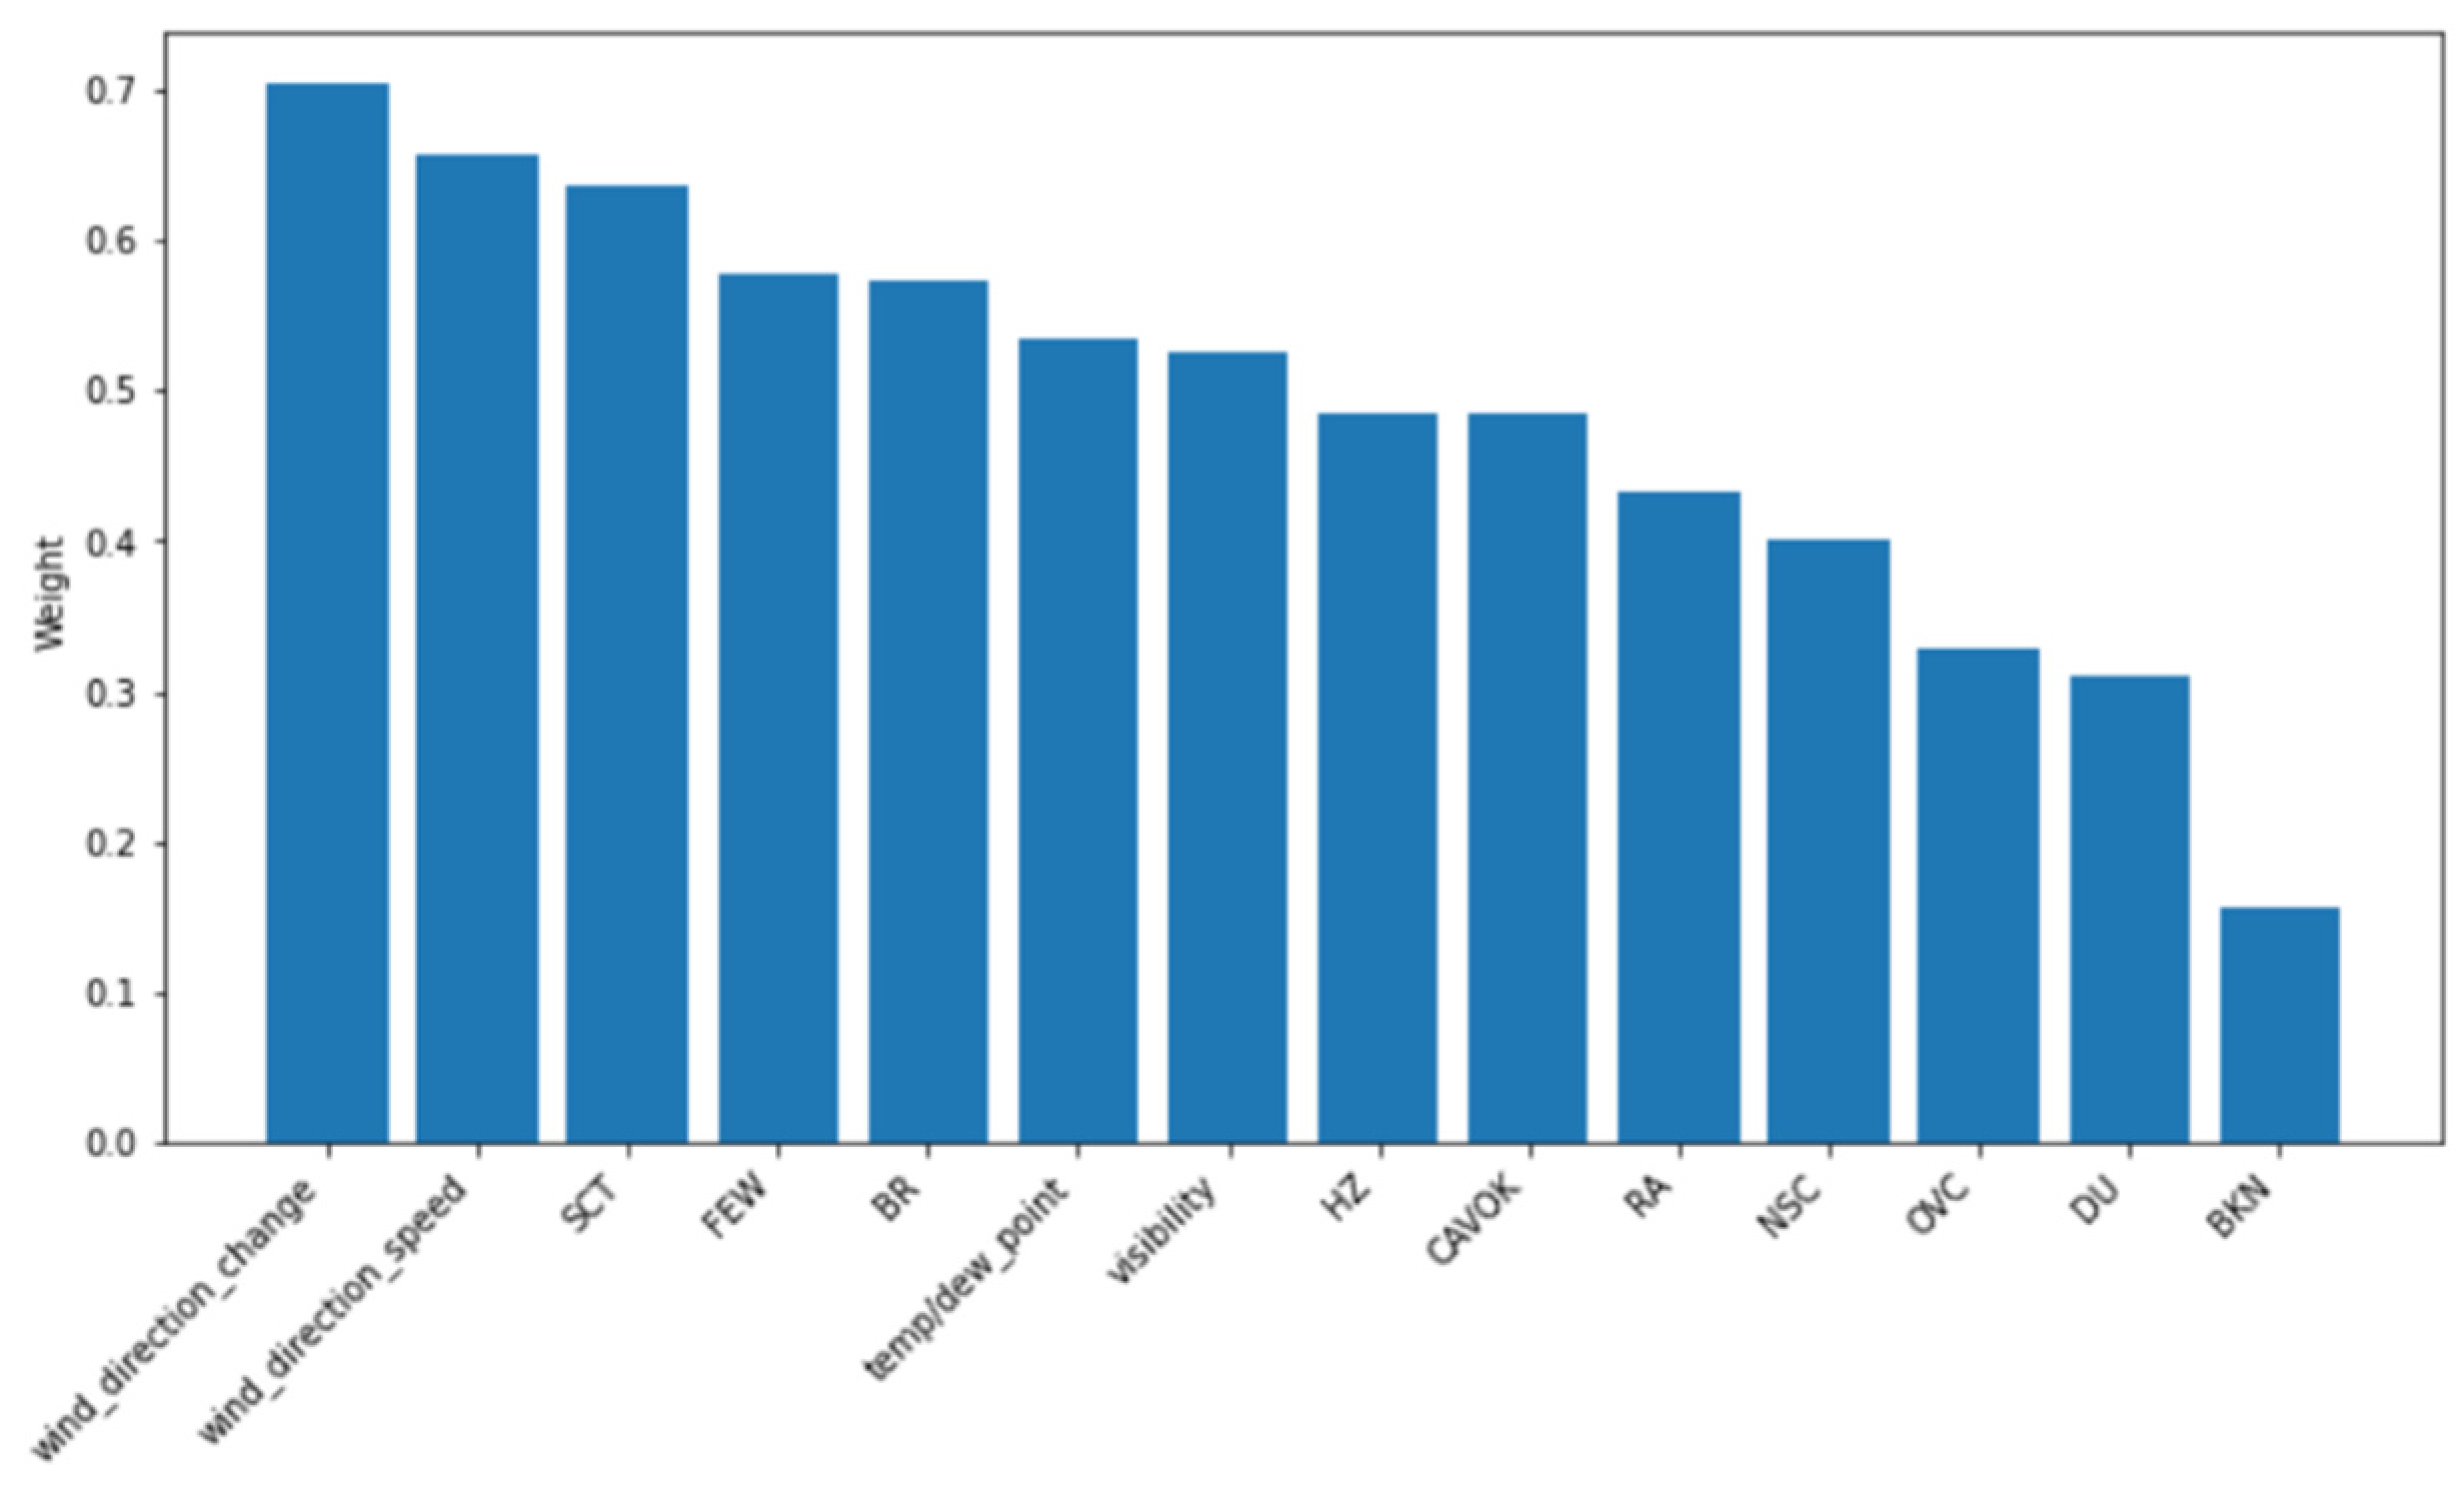

Table 1.
Weather data per hour (portion).
| Variables | Time | ||||
|---|---|---|---|---|---|
| 2/23/5:00- 6:00 |
2/23/6:00- 7:00 |
… | 4/15/22:00- 23:00 |
4/15/23:00- 24:00 |
|
| Wind stability | 0 | 1 | … | 1 | 1 |
| Average wind direction (°) | 0 | 210 | … | 360 | 360 |
| Average wind speed (m/s) | 1 | 2 | … | 1 | 1 |
| Visibility (m) | 3000 | 3000 | … | 10001 | 10001 |
| Cloud width 1 | 0 | 0 | … | 0 | 0 |
| Cloud height 1 (feet) | 0 | 0 | … | 0 | 0 |
| Cloud width 2 | 0 | 0 | … | 0 | 0 |
| Cloud height 2 (feet) | 0 | 0 | … | 0 | 0 |
| Cloud width 3 | 0 | 0 | … | 0 | 0 |
| Cloud height 3 (feet) | 0 | 0 | … | 0 | 0 |
| TCU | 0 | 0 | … | 0 | 0 |
| CB | 0 | 0 | … | 0 | 0 |
| Temperature (°) | 10 | 8 | … | 18 | 17 |
| Dew point (°) | 3 | 4 | … | 6 | 9 |
| Corrected sea level pressure (hpa) | 1023 | 1022 | … | 1004 | 1003 |
| Weather forecast | 0 | 0 | … | 0 | 0 |
Table 2.
Correlation analysis of route weight indicators.
| Indices | Average daily flight volume | Flight distance | RAI |
|---|---|---|---|
| Average daily flight volume | 1 | -0.16 | 0.94 |
| Flight distance | -0.16 | 1 | -0.18 |
| RAI | 0.94 | -0.18 | 1 |
Table 3.
Weights of representative routes in different regions.
| Region | Route OD | Route Weight |
| Eastern Coastal Area | Guangzhou Baiyun Airport | 0.9 |
| Eastern Coastal Area | Shanghai Pudong Airport | 0.85 |
| Central Area | Wuhan Tianhe Airport | 0.75 |
| Western Area | Chengdu Shuangliu Airport | 0.7 |
| Western Area | Urumqi Airport | 0.5 |
| Northeastern Area | Harbin Airport | 0.65 |
| Remote Western Area | Lhasa Gonggar Airport | 0.4 |
Table 4.
Evaluation metrics of prediction accuracy.
| Metrics of test set | MSE | RMSE | MAE | MAPE | R2 |
|---|---|---|---|---|---|
| Prediction result | 7424.093 | 86.163 | 60.669 | 0.023 | 99.806% |
Disclaimer/Publisher’s Note: The statements, opinions and data contained in all publications are solely those of the individual author(s) and contributor(s) and not of MDPI and/or the editor(s). MDPI and/or the editor(s) disclaim responsibility for any injury to people or property resulting from any ideas, methods, instructions or products referred to in the content. |
© 2024 by the authors. Licensee MDPI, Basel, Switzerland. This article is an open access article distributed under the terms and conditions of the Creative Commons Attribution (CC BY) license (http://creativecommons.org/licenses/by/4.0/).
Copyright: This open access article is published under a Creative Commons CC BY 4.0 license, which permit the free download, distribution, and reuse, provided that the author and preprint are cited in any reuse.


