
Submitted:
06 September 2024
Posted:
09 September 2024
You are already at the latest version
Abstract
We propose a novel optimization approach for determining the envelopes of thin-film transmittance spectra. This method can be coupled with the Swanepoel algorithm to determine the optical properties of the thin films.
Keywords:
Thin solid films
; Spectroscopy
; Swanepoel method
; Envelopes
; Optical Properties
; Optimization
Thin solid films are essential in modern technologies, including metal coatings for protection or applications in the dielectric and semiconductor industries (such as transistors and photodiodes). Precisely determining their optical functions, specifically the refractive index (n) and the attenuation coefficient (k), is fundamental for understanding their opto-electrical properties. The continuous pursuit of improved properties leads to the development of advanced new-generation technologies. For instance, significant progress has been made in the creation of more efficient optical sensors and solar energy cells [1].
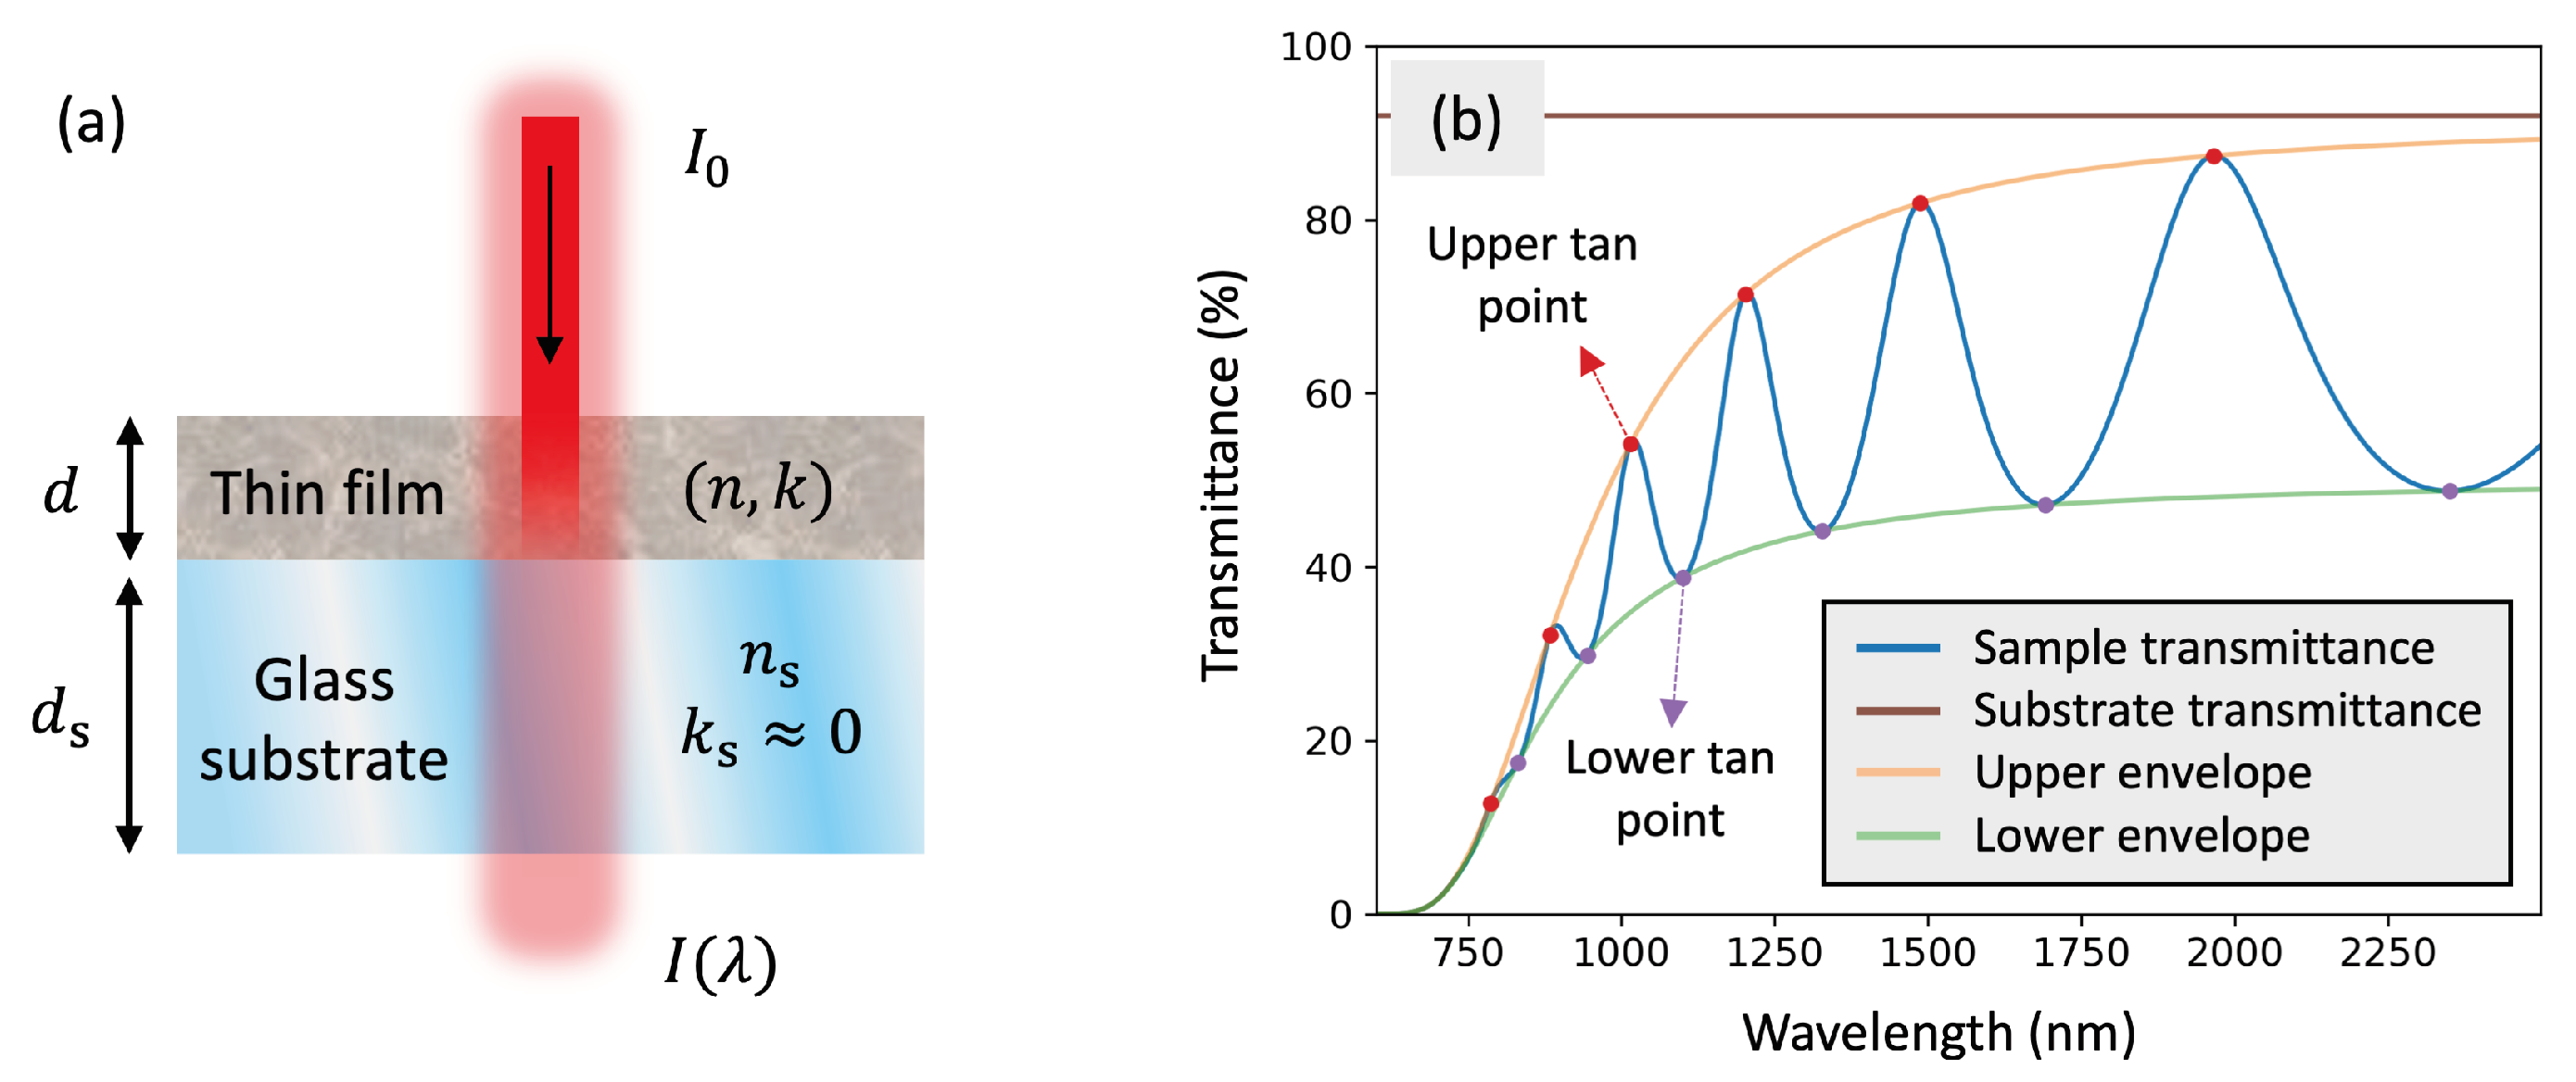
In order to perform the optical characterization, the thin films are often deposited on a transparent glass substrate (see Figure 1a) with known optical properties, and . Spectroscopic measurements provide a reliable method for determining the optical functions of thin films across a wide spectral range, usually within the UV-VIS-NIR region. Specifically, normal-incidence transmission spectroscopy stands out as a cost-effective and straightforward alternative [2]. The transmittance (), defined as the ratio of transmitted to input intensity, is plotted for different wavelengths in Figure 1b.
The Swanepoel Method [3,4,5] enables the determination of the two optical functions, but only at specific discrete wavelengths known as tangent points, , for . By definition, these tangent points are the intersections of the transmission spectra with its upper and lower envelopes. These points satisfy the Fabry-Perot interference formulas, , where d is the film thickness and are integers for the upper points and half-integers for the lower points. Thus, tangent points correspond to wavelengths of completely constructive and destructive interferences (see Figure 1b), which occur between the multiple interreflected waves within the thin film.
Once the envelopes and tangent points are determined, the Swanepoel Method provides an algebraic approach for rapid retrieval (often in milliseconds) of , , and d. However, the method does not specify how to find the envelopes. One major drawback of the method is that errors in estimating the envelope propagate through the algorithm [6,7], leading to significant inaccuracies in the optical properties.
Various alternatives exist to find these envelopes, such as a modern deep learning approach [8] or the classical McClain algorithm [9]. The latter technique first assumes these points to be near the spectrum maxima and minima and then iteratively fixes them. Here, we propose a new alternative based on direct optimization. First, we identify the concave regions , where the lower points must reside, and the convex regions , where the upper points are. Observe that for any upper points we identify, we can construct an approximate upper envelope using B-splines interpolation (and similarly for the lower envelope, using the lower tangent points). The upper envelope should always be greater than or equal to the transmission curve, and the lower envelope should always be less than or equal to the transmission curve. Therefore, we can formulate the following optimization problem:
We look for the optimal upper (or lower) tangent points by minimizing the cost function (or respectively), With the rectified linear unit function (ReLu), we effectively measure the error between the interpolated envelope () and the experimental transmittance T at all the different measured wavelengths . These two global optimization problems can be solved using the Simulated Annealing optimizer, typically in less than a minute on a conventional computer.
We have validated this methodology using fifty different simulated spectra in which the actual ground-truth envelopes are known. The root mean square error was found to be 0.25% for the upper envelope and 0.15% for the lower envelope. Our method competes with state-of-the-art alternatives and generally provides similar or lower errors, albeit with a slightly higher computational cost. The method has also been tested with a real sample of amorphous silicon analyzed in [10], resulting in errors of 0.6% for the upper envelope and 0.5% for the lower envelope (still within an acceptable range, below 1%).
It should be emphasized that this is a work in progress. Further research will focus on validation with additional experimental measurements and a systematic comparison with existing state-of-the-art methodologies.
References
- Marquez, E.; Ballester, M.; Garcia, M.; Cintado, M.; Marquez, A.; Ruiz, J.; Fernández, S.; Blanco, E.; Willomitzer, F.; Katsaggelos, A. Complex dielectric function of H-free a-Si films: Photovoltaic light absorber. Materials Letters 2023, 345, 134485. [Google Scholar] [CrossRef]
- Bass, J.; Ballester Matito, M.; Fernández, S.; Katsaggelos, A.; Marquez, E.; Willomitzer, F. Increasing the Precision of Transmission Spectroscopy by Optimization of Thin Film Surface Shapes. Optica Open 2024. Preprint.
- Manifacier, J.; Gasiot, J.; Fillard, J. A simple method for the determination of the optical constants n, k and the thickness of a weakly absorbing thin film. Journal of Physics E: Scientific Instruments 1976, 9, 1002. [Google Scholar] [CrossRef]
- Swanepoel, R. Determination of the thickness and optical constants of amorphous silicon. Journal of Physics E: Scientific Instruments 1983, 16, 1214. [Google Scholar] [CrossRef]
- Swanepoel, R. Determination of surface roughness and optical constants of inhomogeneous amorphous silicon films. Journal of Physics E: Scientific Instruments 1984, 17, 896. [Google Scholar] [CrossRef]
- Ballester, M.; Márquez, A.P.; Banerjee, S.; Ruíz-Pérez, J.J.; Cossairt, O.; Katsaggelos, A.K.; Willomitzer, F.; Márquez, E. Comparison of optical characterization methods for transmission spectroscopy. Computational Optical Sensing and Imaging. Optica Publishing Group, 2022, pp. JW5D–4.
- Minkov, D. Errors made in the computation of the optical constants of a thin dielectric layer from the envelopes of the reflection spectrum at inclined incidence of the light. Optik (Stuttgart) 1991, 87, 137–140. [Google Scholar]
- Ballester, M.; Marquez, E.; Marquez, A.P.; Lopez-Tapia, S.; Cossairt, O.; Willomitzer, F.; Katsaggelos, A.K. Deep Learning Method to Find Swanepoel Envelopes in Transmission Spectroscopy. Computational Optical Sensing and Imaging. Optica Publishing Group, 2023, pp. CTh2A–5.
- McClain, M.; Feldman, A.; Kahaner, D.; Ying, X. An algorithm and computer program for the calculation of envelope curves. Computers in Physics 1991, 5, 45–48. [Google Scholar] [CrossRef]
- Ballester, M.; García, M.; Márquez, A.P.; Blanco, E.; Fernández, S.M.; Minkov, D.; Katsaggelos, A.K.; Cossairt, O.; Willomitzer, F.; Márquez, E. Application of the holomorphic tauc-lorentz-urbach function to extract the optical constants of amorphous semiconductor thin films. Coatings 2022, 12, 1549. [Google Scholar] [CrossRef]
Figure 1.
(a) Scheme of the transmission spectroscopy experiment. (b) Transmittance spectrum and envelopes.
Figure 1.
(a) Scheme of the transmission spectroscopy experiment. (b) Transmittance spectrum and envelopes.
Disclaimer/Publisher’s Note: The statements, opinions and data contained in all publications are solely those of the individual author(s) and contributor(s) and not of MDPI and/or the editor(s). MDPI and/or the editor(s) disclaim responsibility for any injury to people or property resulting from any ideas, methods, instructions or products referred to in the content. |
© 2024 by the authors. Licensee MDPI, Basel, Switzerland. This article is an open access article distributed under the terms and conditions of the Creative Commons Attribution (CC BY) license (http://creativecommons.org/licenses/by/4.0/).
Copyright: This open access article is published under a Creative Commons CC BY 4.0 license, which permit the free download, distribution, and reuse, provided that the author and preprint are cited in any reuse.


