
Submitted:
08 November 2024
Posted:
11 November 2024
You are already at the latest version
Abstract
This paper describes the design and fabrication of a portable optomechatronic system based on the theta-2theta system that explores different optical characterization techniques of transparent materials and dielectric thin films, such as Brewster and Abelès-Brewster angle measurements, critical angle measurements, and surface plasmon resonance technique. The system consists of a mechanical system of rotating stages, a semiconductor laser, a photodiode with a data acquisi-tion card, and a user interface to control stepper motor rotation stages. After measuring with different samples, it is demonstrated that the system can perform fast, precise, non-invasive measurements and, being portable, it can be used in different environments and applications.
Keywords:
surface plasmon resonance
; thin film
; refractive index
; optical sensor
; optical instrumentation
1. Introduction
To characterize transparent materials and dielectric thin films, great efforts have been made in recent years to develop optical sensors [1,2,3,4], using a wide variety of optical techniques with reliable and accurate measurements [5,6,7,8]. Recent advances in mechatronics, in collaboration with optics as a measuring instrument, automate existing processes and systems to improve their accuracy and efficiency when characterizing samples. It also allows multidisciplinary research to be carried out to improve measurement techniques and engineering [9,10,11,12].
Reflectometry with linearly p-polarized light (also called transverse magnetic, TM, where the electric field is parallel to the plane that generates the incident, transmitted, and reflected beam) is commonly used in the optical characterization of materials, whether in bulk, thin film form or monitoring of immunoreactive processes, is of utmost importance in the real world in sensing applications since thin films normally work as a transducer medium with selectivity for a specific analyte, whether gaseous, liquid or solid. This requires expensive and specialized equipment, usually in laboratory conditions, which makes it time-consuming and requires specialized human resources.
Transparent bulk materials can be characterized by estimating their refractive index by the Brewster angle employing a goniophotometer and using linearly p-polarized light, where the refractive index of the incident medium is lower than that of the transmitted medium, e.g., air-glass interface [13,14]. This technique is fast, simple, and precise, all that is needed is a flat surface that coincides with the axis of rotation of the Ɵ-2Ɵ system and to find the Brewster angle, the angle of minimum reflectance, and simply apply to estimate its refractive index.
The measurement of the critical angle has been applied to the characterization of transparent materials with real refractive index [15], and absorbent materials with complex refractive index [16]. This method consists of measuring the reflectivity at an interface of an incident medium with a refractive index greater than that of the transmitted medium to find the critical angle, which is the angle where total internal reflection begins. This technique’s main problem is applying a good mathematical model of theoretical experimental curve fitting since it involves the Fresnel equations and/or Mie Theory for colloidal systems. The surface plasmon resonance technique based on a prism in the Kretschmann configuration is widely used to characterize liquid [17], solid [18], or gaseous [19], substances, and is most popularly used to monitor molecular reactions in real-time without the need for labels [20].
In this work, we present the development of a portable instrument that uses a Ɵ-2Ɵ optomechatronic system with two motorized rotation stages of 0.01 degrees of angular resolution to scan the reflected light from the sample, using light “p” polarized of a diode laser centered at 639 nm, control and data acquisition with Arduino, for reflectometry use, which includes critical angle measurement, Brewster angle measurement, Abelès-Brewster, surface plasmon resonance in the prism-based Kretschmann configuration, scattering Surface plasmon resonance, for the characterization of thin films that can be determined using a MATLAB and LabVIEW algorithms for fitting the experimental and theoretical reflectance curves, bulk materials, particles in colloidal suspension and real-time monitoring of molecular reactions.
2. Materials and Methods
2.1. Theory: Matrix Method
The matrix method is a mathematical design based on Fresnel equations that facilitates the optical design of thin films due to its simplicity and understanding of the physical phenomena around thin films [21]. Each layer added to the array is represented as a 2x2 matrix, making it easy and simple to design and simulate the propagation of an electromagnetic wave on a boundary between two media or a multilayer system. The theoretical reflectance of a thin film or a multilayer system is expressed as “R”.
where:
and:
where r is the value of the reflection coefficient, n0 is the refractive index of the incident medium and Y is the admittance of the multilayer system, H and E represents the amplitude of the tangential magnetic and electric fields respectively, the optical admittance of the j-th thin film is nj = nj /cosθj for P polarization. δj represents the phase thickness and is given by δj = 2δjπnjdj (cosθj)/λ, dj is the physical thickness, nj is the refractive index of the thin film, λ is the wavelength, ns is the refractive index from the substrate or output medium, and θj is the angle for the incident medium in the j medium. The electric and magnetic fields are expressed as a column vector; each thin film is a 2x2 transfer matrix. The calculation consists of successive multiplications of the column vector by the transfer matrix.
2.1.1. Critical Angle
For a media boundary where the incident medium, n1, has a higher refractive index than the second medium, n0, we have that after a certain angle (critical angle) a total internal reflection [22]. The critical angle reflectance curve can be generated from Equation (1) by setting the thickness of any layer to zero, the incident medium, for example, =1.5149 for glass and =1 for air for the exit medium, (see Figure 1).
2.1.2. Brewster Method
For a boundary of two media where the incident medium has a lower refractive index than the second medium and doing an angular scan in the reflectivity of p-polarized illumination, we will have an angle where the reflectance will be null, which will be the Brewster angle, , and it is related to the refractive index of thematerial, [23]. The reflectivity curve can be generated with equation 1 making and setting the thickness equal to zero for any layer, for example =1 and =1.5149, for air and BK7 glass, as shown in Figure 2.
2.1.3. The Abelès-Brewster
This technique consists in illuminating a substrate with and without a dielectric film coating with p-polarized laser light. Two curves of the intensity of light reflected by the substrate with and without coating are obtained and, the angle where the curves intersect, corresponds to the Brewster angle of the film, the refractive index of the dielectric film can be determined by , Figure 3 [24]. Regardless of the thickness of the dielectric thin film, it always keeps the same Brewster angle value.
2.1.4. Surface Plasmon Resonance
Surface plasmon resonance (SPR) is a phenomenon that occurs when electrons in a metallic thin film are excited and travel in parallel at a metal-dielectric interface with charge density oscillations, where the resonance angle () is related to the dielectric material. The is detected as a dip in the reflectance curve [25].
The plasmon resonance curve can be simulated from equation 1 by making several considerations; a) the illumination must be p-polarization, b) the refractive index of the prism must be higher than the refractive index of the material adjacent to the metal film (analyte), c) the interface between the metal film and the dielectric material must have opposite dielectric constants [21], for example ε=n2 for glass is (1.5149)2 and for gold is , where is the complex refractive index, k is the extinction coefficient, εr and εi are the real and imaginary parts of the dielectric constant of the metal film, Figure 4.
2.1.5. Surface Plasmon Resonance and Scattering
When plastic particles are added to the dielectric medium, the phenomenon of Rayleigh scattering (the wavelength of the beam is greater than the diameter of the particles) or Mie scattering (the wavelength of the beam is smaller than the diameter of the particles) occurs, where the light is re-emitted in different directions when it hits each particle. In studies carried out on scattering, the concentrations, diameters of the particles, and/or the effective refractive index () of the sample were determined:
Tuoriniemi et al. [26] calculated the effective refractive index () using coherent scattering theory (CST) as a function of the filling fraction () and the particle diameter (). The followed a unique curve for each (), as a function of the number concentration () of the polystyrene (PS) particle, so it was possible to simultaneously determine both the and the number concentration () by fitting the CST to the values measured by SPR for a series of colloid dilutions. The effective refractive index was calculated with the next formula:
where is the refractive index of the medium, is the wave vector in the sample, λ is the wavelength of the coherent light, is the propagation angle in the sample (calculated from by sequentially applying Snell’s law at the interfaces), is the refractive index of the particle, and are the scattering elements calculated with Mie theory [27] for p-polarized light using the Mätzler Matlab code package [28].
Figure 5 shows the scattering simulation for a NK7 prism with gold film (N=0.1736-3.4930i) and a distilled water sample (n=1.3314) containing polystyrene (PS, n=1.5870) particles at different concentrations (0%, 5%, 10%, 15%, 20%, 25%).
=61.5070, the initial angle from full width to half maximum (FWHM) is and the resonance angle is =71.5820° and =π/2+ i|-0.3963| is calculated by Snell’s law. (b) calculated from the filling percentage (0%, 5%, 10%, 15%, 20%, 25%) of the spherical particles ( = 100 nm) of PS added to the distilled water. (c) corresponding to the number concentration. (d) Reflectance for the first three calculated .
2.2. Materials and Methods
2.2.1. Optomechatronic System Fundamentals
Optomechatronic is a discipline that integrates optical components and technology into mechatronic systems., it is important to find the right communication devices and protocols to integrate a system able to synchronize and provide a response with the best precision and resolution as possible, without sacrificing size and cost. The prototype (Figure 6) consists of a laser diode with a wavelength of 639 nm at 30 mW (Figure 6A), a linear polarizer, a sample mount (transparent optical samples such as prisms, flat substrates and dielectric thin films), a silicon photodiode (mod. S1226-8BK, Hamamatsu) with a spectral response range of 320 to 1000 nm and maximum sensitivity wavelength of 720 nm, two rotation stages with stepper motor (Standa Rotary Stage 8MR108) with a rotation range of 360 degrees with a full step resolution of 0.01 degrees, and sheet metal cabinet with the power and control electronics. The stepper motors are controlled by an Adafruit Motor Shield for Arduino board that allows to control up to 2 stepper motors. In addition, the Arduino board is used for data acquisition, through an analog input, providing 10 bits of resolution. The optomechatronic design uses a control system with a graphical user interface in LabVIEW. For this stage, the LabVIEW 2020 [29] programs from National Instruments were used with the VISA serial communication library to establish communication with the Arduino Mega 2560 data acquisition card [30].
The laser diode module is the light source that will pass through the sample before reaching the photodiode for acquiring real-time light intensity values as digital data which are then subjected to analysis and visualization with the help of programming. The laser diode intensity is controlled with a user-defined PWM (Pulse Width Modulation) digital signal through a user interface containing a wide variety of controls and indicators. Specifically, the laser light intensity is controlled from 0-100%, where 0%=0 VDC and 100%=5 VDC. The PWM digital signal corresponds to a square pulse width modulation, so a circuit is added to smooth these square waves into more stable signals that help the photodiode to more accurately determine the intensity of the light provided by the laser.
The photodiode captures the reflected light from the sample (prism or substrate) illuminated by the diode laser andconverts this incident light into a flow of electric current, which can be measured to give a reading of the intensity of the incident light. However, for the signal to be detected, it is necessary to design a circuit with a signal amplification stage from 0 to 12 volts.
The Arduino card acquires the data from the photodiode in real-time and displays it on the user interface. The display of the light intensity in real-time allows for observing the changes that occur throughout the manipulation of the system. Although the manufacturing of the enclosure containing the photodiode greatly decreases the amount of spurious light perceived by the photodiode, placing the system in a laboratory with controlled lighting will always provide better measurements and results than operating in uncontrolled lighting conditions and with reflections from the floor, walls, and other surfaces. The control program can retain and use this data to analyze and process it. The main function of the Arduino board is to acquire, control, and process the system’s data. The board is powered by an USB connection to the computer. Its digital and analog pins are used to control the intensity of the laser light, acquire data from the photodiode, and monitor when the limit switches on each motor are pressed, indicating the 0° position.
The rotary stages are controlled digitally, using a bipolar stepper motor (included). Stepper motors operating in the bipolar scheme require changing the direction of the current flow through their coils in an appropriate sequence to cause constant rotational motion. Typically, the current handled by the coils is very high for the values handled by the data acquisition and control cards, so it is necessary to include an H bridge [31] per coil. The stepper motors are controlled with the help of the Adafruit Motor Shield v2.3 card [32] which contains the H bridges necessary to control up to two stepper motors. This card, as its name indicates, is placed on the Arduino Mega 2560 card as if it were a shield. The Motor Shield v2.3 card is powered with the same voltage provided by the Arduino card. In the same way, the motors connected to its terminals can be powered with this voltage, however, it has the option of an external power supply with up to 12 VDC to give sufficient power to the motors.
The main components of the system and the operation are shown in the diagram in Figure 7. The computer controls the Arduino which in turn reads and writes data from electronic components such as the light source, motors, and photodiode sensor. The intensity of the light source is variable; the light passes through a linear polarizer and the sample, whose reflection is detected by the photodiode. The photodiode detects the light intensity in real-time, and this is recorded in Arduino and displayed in the user interface in normalized reflectance units. The stepper motors move the sample and the photodiode, their position, speed, step type, and other parameters are defined by the user interface on the computer to carry out their digital control.
Figure 8 shows the alignment process performed to prepare the sample for angular scanning and measuring its angle of minimum reflectance. The sample is positioned at 0° (Figure 8A) with its flat face perpendicular to the light source and the reflection of the sample is aligned with the light source. A second alignment is performed by rotating the sample 90 degrees (Figure 8B) and verifying that the flat face is parallel to the light beam. The sample is moved so that the light beam impinges the flat face without passing through the sample. After proper alignment, the sample is moved to 30° (Figure 8C), and the position of the photodiode is adjusted based on the reflection of the sample.
The National Instruments LabVIEW graphical programming environment [33] was chosen to develop the control of the electronic components, mathematical analysis, acquisition, real-time data display, and the main user interface of the presented project. Due to its extensive library content, LabVIEW offers us different tools, such as the VISA serial communication to have reliable communication links with the Arduino Mega 2560 data acquisition card [30] and the Adafruit Motor Shield v2.3 motor controller.
Figure 9 shows the user interface with the program enabled and a real-time measurement being performed, the data is being saved and the current position of both motors is updated in real-time. This interface facilitates the user’s interaction with the system and it can control and visualize the behavior of the system components. On the left side, the controls can be seen, and the indicators necessary to operate the system. On the right side are the measurement tools, analysis of results as well as important information for its correct operation. The “Graphics” tab has the light intensity controller of the laser diode to avoid saturation of the photodetector, which has an indicator that works in real-time.
3. Results
The complete system has the main objective of characterizing transparent optical samples (prisms and flat substrates) as well as dielectric thin films. To verify the system, were performed: a) critical angle measurement on BK7 prism was realized; b) Brewster angle measurements were performed on four prisms: FK5 (n=1.4858), BK7 (n=1.5149), SK16 (n=1.6180) and SF6 (n=1.7981) [34] for a λ=639 nm; c) measurements on substrates of BK7 with MgF2 dielectric thin film (n=1.3769) using the Abelès-Brewster technique; d) SPR measurements with a BK7prism/Au(50nm)/air and Bk7 prism/Cr(3nm)/Au(50nm)/air, and a sensogram of an immobilization of lacasses on a BK7prism/Cr/Au; e) SPR measurements of FK5prism/Ag(50nm)/colloidal suspension of water/0.1µm and 1µm.
3.1. Critical Angle Measurement
The measurement of the critical angle is a very simple technique since it only requires a glass prism—for example, BK7- where a beam of light is made to hit the prism/sample interface. From the curve generated with angular scanning the critical angle is obtained and employing Snell’s law the real refractive index of the sample is estimated, although some works have used this technique to calculate the complex refractive index [35,36]. Figure 10 shows the reflectometric curve of a BK7 prism, obtaining the critical angle of 41.3140. Applying Snell’s law (n1 sin θ1 = n2 sin θ2), but θ2 is 90 degrees, so the refractive index of the prism would be n1 = 1/sin(θ2) = 1/sin (41. 3140) = 1.5147.
3.2. Brewster Angle Measurement
If we consider the reflectance concerning the angle of a thin film on a glass substrate we have that the angle of minimum reflectance would be the Brewster angle, , of the substrate, we can determine the refractive index of the bulk material by applying equation Once the measurements of the four prisms were carried out, the analysis was performed using the Brewster angle analysis tab, which can be found within the same program used to operate the system. In this tab, the samples can be quickly characterized, and it can be determined whether the measurement was correct or if there is an error involved.
Figure 11 shows a summary of the reflectance graphs obtained for the FK5, BK7, SF6, and SK16 prisms. It can be seen that the glass with the lowest minimum angle and therefore the lowest refractive index is FK5, followed by BK7, SK16, and SF6 with the highest refractive index among this group.
3.3. Abelès-Brewster Technique
This is probably the simplest of all methods for measuring the refractive index of a film. No difficult calculations are required, and the measurement is independent of a knowledge of the refractive index of the substrate and the thickness of the film. It is therefore of no consequence if the substrate is itself covered by a film or is optically inhomogeneous at the surface. No absolute intensity measurements are required if the refractive index only is required. The film must, however, be isotropic and homogeneous [37]. Figure 12 shows the Abeles-Brewster technique with the intersection point at at at (tan ).
3.4. Surface Plasmon Resonance with Angular Interrogation and Sensorgram
The most common glass used in SPR is BK7 because it can be used with a cover glass coated with a thin metallic film and adhered to the prism by its flat face utilizing an index-matching oil with the same refractive index as the prism glass and the cover glass. Figure 13a shows an experimental SPR curve of a BK7 prism coated with a 50 nm thick gold film on a flat surface. This system is adequately used with angular interrogation to estimate the refractive index of substances attached to the metal film, but when it is desired to monitor molecular reactions, the SPR system is used at a fixed position which is half the slope of the SPR curve (sensorgram), and a film of chromium or titanium dioxide is adhered to the gold film between the prism and the gold because the gold film has poor adhesion to the glass, (see Figure 13b).
In the case of sensing with angular interrogation, the angular sensitivity is 1720 / RIU, using a prism BK7 as a coupling system, a Cr/Au thin film, and at λ= 639 nm of a polarized diode laser source. In biosensing applications, changes in the refractive index are usually caused by the accumulation of mass (i.e., proteins) on the surface of the sensor. The SPR curve of the immobilization of laccases in water is used to determine the fixed angle (the angle at which the middle of the steepest falling slope of the SPR curve is located: FWHM-L) to realize the sensogram in real time, Figure 14. At thisexperimental fixed angle (), each biochemical reaction will be shown in the SPR system as a change in the intensity of the light reflected through the prism and arriving in the photodetector.
In this study, the immobilization process of laccases was based on the methodology of previous works [20]: first, the surface of the chip was functionalized with the alkanethiols MHDA: MUD (250 µM in ethanol), so the groups are available for binding with enzymes. Then, an activation was performed by using EDC/NHS crosslinkers (0.05 M/0.2 M) mixed in a MES buffer, concentration 0.01 M, and pH 5.0. During the activation reaction, esters carbodiimide were generated, which served as binding sites for the enzyme by forming an amide bond with the amino acids of its structure.
3.5. SPR and Scattering Measurements
To estimate the effective refractive index of a colloidal suspension of distilled water with polystyrene particles of 0.1 and 1 microns, SPR measurements and scattering theory were made. Figure 15 shows the results of an experiment using a FK5 prism (n=1.4858) with a ~50 nm thick silver film (N=0.054801-4.3241i) and a water sample (n=1.3314) with polystyrene (n=1.5870) particles with a diameter of 100 nm. Initially, with the known values, we use the matrix equation (Equation (3)) to obtain the reflectance (Equation (1)) and the resonance angle =70.3570°. Equation (2) is then used to obtain =1.3313 and determine the error==0.0001 RIU. The experimental reflectances of the water and the water with PS are then adjusted to the theoretical reflectance to determine the angle of reflectance of the water sample with PS and calculate the (Equation (5)) and see its corresponding percentage (Equation (4)). As can be seen in Figure 15 (b), there is a linear correlation between the filling fraction and the neff calculated.
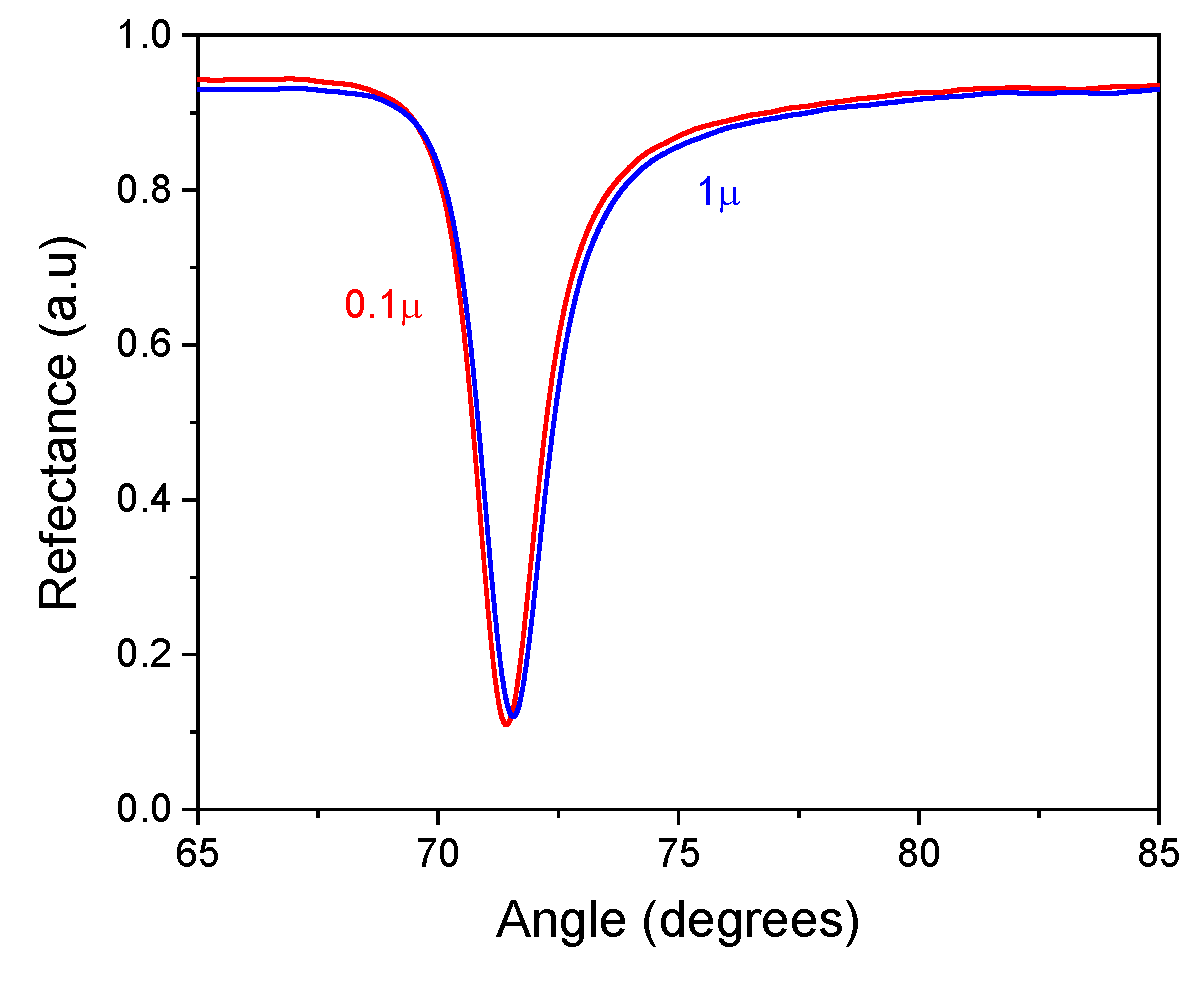
The experimental reflectance result, for a distilled water sample with polystyrene particles of 0.1 y 1 micron in diameter (Figure 16), has a resonance angle of =71.42° and =71.56°, very close to the reference sample (distilled water). Therefore, to the result calculated in Equation (5), for this experimental sample, the error is added as an adjustment, giving as a result: =1.3391+0.0001(Adjustment)=1.3392 and =1.3401+0.0001 (Adjustment)= 1.3402, respectively.
4. Conclusions
The system has a fast performing, accuracy, and noninvasive measurements of the optical properties of thin dielectric films, transparent materials (FS, FK5, BK7, SK16, SF6), and biosensing processes (laccases). Being portable (200 mm x 450 mm x 220 mm, 13 kg), the system can be used in different environments and applications, such as characterization of materials, monitoring of pollutants, food and pharmaceutical industry, in the field, or laboratories with limited space. This tool could facilitate the research and development of transparent materials and thin films by providing accessibility and efficiency in obtaining relevant optical information.
The mechatronic development of the system has wide applications in related subjects. The integration of mechanics, electronics, and programming in an optimized way contributed greatly to the quality and accuracy of the results obtained in the known characterized samples.
It is intended to enable the system for surface plasmon resonance measurement to characterize broader samples such as liquids, solids, or gases, with applications in chemistry and medicine.
Author Contributions
Conceptualization, D.L.M, O.R.Q, A.S.A. and O.J.S.H.; methodology, D.L.M, O.R.Q, A.S.A., G.E.Q.V. and O.J.S.H. software, O.R.Q. and A.S.A; formal analysis D.L.M, O.R.Q, A.S.A. and O.J.S.H; investigation D.L.M, O.R.Q, A.S.A., G.E.Q.V., M.M.R.D., J.F.V.C. and O.J.S.H; resources, D.L.M., A.S.A.; data curation, O.R.Q. and O.J.S.H. ; writing—original draft preparation, D.L.M, O.R.Q, A.S.A., G.E.Q.V. and O.J.S.H; writing—review and editing D.L.M, O.R.Q, A.S.A., G.E.Q.V., M.M.R.D., J.F.V.C. and O.J.S.H; visualization D.L.M. A.S.A, O.R.Q., G.E.Q.V. and O.J.S.H.; supervision, D.L.M. and A.S.A.; project administration, D.L.M. and A.S.A; funding acquisition, G.E.Q.V. and O.R.Q. All authors have read and agreed to the published version of the manuscript.
Funding
The authors want to thank the Consejo Nacional de Humanidades Ciencias y Tecnologías (CONAHCYT) for the funding, through the program Estancias Postdoctorales por México, CVU 740156 and CVU 101368.
Data Availability Statement
The data The datasets generated and analyzed during the current study are available from generated and analyzed during the current study are available from the correspondence author.
Acknowledgments
The authors would like to thank Diego Armenta for his support in programming LabView and the design of the mechanical system.
Conflicts of Interest
The authors declare no conflicts of interest.
References
- Laksono, F. D.; Supardianningsih, Arifin, M.; Abraha, K. “Development of low cost and accurate homemade sensor system based on Surface Plasmon Resonance (SPR),” J. Phys.: Conf. Ser. 1011 012043 (2018). [CrossRef]
- Andrushchak, N.; Karbovnyk, I. LabVIEW-Based Automated Setup for Interferometric Refractive Index Probing, SLAS Technol., 25(3), (2020) 286-292. [CrossRef]
- Abdullah, M.; Harun, R.; Wahab, N. H;., Ibrahim; Jamilan S. N; Rahim, N. A. S, Development of Low-Cost Plasmonic Tracker Via a Microstepping with PC Based System, International Conference on Engineering Technology and Technopreneurship (ICE2T), IEEE (2023) 161-166. [CrossRef]
- Shukla, N.; Chetri, P.; Boruah, R.; Gogoi, A.; Ahmed, G. A. Surface plasmon resonance biosensors based on Kretschmann configuration: basic instrumentation and applications. In Recent Advances in Plasmonic Probes: Theory and Practice (2022) 191-222. Cham: Springer International Publishing. [CrossRef]
- Oates, T. W.; Wormeester, H.; Arwin, H. Characterization of plasmonic effects in thin films and metamaterials using spectroscopic ellipsometry. Progress in Surface Science, (2011) 86(11-12), 328-376. [CrossRef]
- Guo, W. Temperature dependence of Brewster’s angle, JOSA A, Vol. 35, No. 1 (2018) 98-102. [CrossRef]
- Sukma, F. O. R.; Hanif, M. A.; Santjojo, D. J.; Apsari, R.; Susanto, H.; Tazi, I. Effects of thickness and roughness on plasmonic characteristics of gold thin films deposited on polished optical fiber, Mater. Res. Express, 11(1), (2024) 016201. [CrossRef]
- Rakhmatulin, I.; Risbridger, D.; Carter, R. M.; Esser, M. D.; Erden, M. S. A review of automation of laser optics alignment with a focus on machine learning applications, Opt. Lasers Eng, 173 (2024) 107923. [CrossRef]
- Kostyukevych, S. A.; Shirshov, Y. M.; Matsas, E.; Stronski, A. V.; Subbota, Y. V.; Chegel, V. I.; Shepeljavi, P. E., Application of surface plasmon resonance for the investigation of ultrathin metal films, Proceedings volume 2648, International Conference on Optical Diagnostics of Materials and Devices for Opto-, Micro-, and Quantum Electronics (1995). [CrossRef]
- Fontanot, T.; Bhaumik, U.; Kishore, R.; Meuret, Y. (2023). POCAL: a Python-based library to perform optical coating analysis and design. Optics Continuum, 2(4), 810. [CrossRef]
- Hu, J.; Cao, B.; Wang, S.; Li, J.; Wei, W.; Zhao, Y.; Hu, X.; Zhu, J.; Jiang, M.; Sun, X.; Chen, R.; Liuzheng, M. Design and fabrication of an angle-scanning based platform for the construction of surface plasmon resonance biosensor, Opt. Lasers Eng. 78, (2016) 1-7. [CrossRef]
- Bonal, V.; Quintana, J. M.; Muñoz-Mármol R.; Villalvilla, J. M.; Boj, P. G.; Díaz-García, M. A. Sub-400 nm film thickness determination from transmission spectra in organic distributed feedback lasers fabrication, Thin Solid Films, 692 (2019) 137580. [CrossRef]
- Hönig, D.; Möbius, D. Reflectometry at the Brewster angle and Brewster angle microscopy at the air-water interface, Thin Solid Films 210 (1992) 64-68. [CrossRef]
- Luna-Moreno, D.; De la Rosa-Cruz, E.; Cuevas F.J.; Regalado, L.E.;. Salas, P.; Rodríguez, R.; Castaño, V.M., Refractive index measurement of pure and Er3þ-doped ZrO2–SiO2 sol-gel film by using the Brewster angle technique, Optical Materials 19 (2002) 275–281. [CrossRef]
- Li, H.; Xie, S., Measurement method of the refractive index of biotissue by total internal reflection, Appl. Opt. Vol. 35, No. 10, (1996) 1793-1795. [CrossRef]
- Calhoun, W. R.; Maeta, H.; Roy, S.; Bali, L. M.; Bali, S., Sensitive real-time measurement of the refractive index and attenuation coefficient of milk and milk-cream mixtures, J. Dairy Sci. 93 (2010) 3497–3504. [CrossRef]
- Luna-Moreno, D.; Monzón-Hernández, D.; Noé-Arias, E.; L. E. Regalado, Determination of quality and adulteration of tequila through the use of surface plasmon resonance, Appl. Opt. Vol. 51, No. 21 (2012) 5161-5167. [CrossRef]
- Espinosa-Sánchez, Y. M.; Luna-Moreno, D.; Rodríguez-Delgado, M. M.; Sánchez-Álvarez, A. Determination of optical parameters of organic and inorganic thin films using both surface plasmon resonance and Abelès- Brewster methods, Optik 142 (2017) 426–435. [CrossRef]
- Espinosa-Sanchez, Y. M.; Luna-Moreno, D.; Monzon- Hernández, D., Detection of aromatic compounds in tequila through the use of surface plasmon resonance, Appl. Opt. Vol. 54, No. 14 (2015) 4439-4446. [CrossRef]
- Luna-Moreno,D.; Sánchez-Álvarez,A.; Islas-Flores, I.; Canto-Canche, B.; Carrillo-Pech, M.; Villarreal-Chiu, J.F.; Rodríguez-Delgado, M. Early Detection of the Fungal Banana Black Sigatoka Pathogen Pseudocercospora fijiensis by an SPR Immunosensor Method, Sensors 19, (2019) 464. [CrossRef]
- H.A. Mcleod, in: Thin Film Optical Filters, second ed., Adam Hilger, Bristol, 1986, p. 519.
- Reyes-Coronado, A.; Garcia-Valenzuela, A.; Sanchez-Perez, C.; Barrera, R. G., Measurement of the effective refractive index of a turbid colloidal suspension using light refraction, N. J. Phys. 7 (2005):1–22. [CrossRef]
- Wu, Q. H.; Hodgkinson, I. Precision of Brewster-angle methods for optical thin films, J. Opt. Soc. Am. A, Vol. 10, No. 9 (1993) 2072-2075. [CrossRef]
- H. E. Bennet, J. M. Bennet, Precision measurements in thin films optics, in: Georg Hass, Rudolf E. Thun (Eds.), Physics of Thin Films, vol. 4, Academic Press, New York and London, 1967 (Chap. 1).
- J. Homola (Ed.), Electromagnetic Theory of Surface Plasmons, in Chemical Sensor Biosensor, Springer-Verlag, Berlin, 2006. [CrossRef]
- Tuoriniemi, J.; Moreira, B.; Safina G. Determining Number Concentrations and Diameters of Polystyrene Particles by Measuring the Effective Refractive Index of Colloids Using Surface Plasmon Resonance, Langmuir, Vol. 32, (2016) 10632−10640. [CrossRef]
- Bohren, C. F.; Huffman, D. R., Absorption and Scattering of Light by Small Particles, John Wiley & Sons Inc., Hoboken, NJ, 1983.
- Christian Mätzler, “MATLAB Functions for Mie Scattering and Absorption,” Research Report No. 2002-08; Institute of Applied Physics, University of Bern: Bern, Switzerland, 2002.
- Karadeniz, A.; Alkayyali, M.; Szemes, P. T. Modeling and Simulation of Stepper Motor for Position Control Using LabVIEW. Recent Innovations in Mechatronics, 5(1.) (1970). [CrossRef]
- Arduino—Home. (s. f.). https://www.arduino.cc.
- Muñoz-Galeano, N.; Quintero, J. B.; López-Lezama, J. M. Enseñando el Funcionamiento de los Inversores Puente H: Análisis del Intercambio de Potencia entre Bobinas y Condensadores. Formación universitaria, 9(1), (2016) 117-124. [CrossRef]
- Industries, A. (s. f.). Adafruit Industries, Unique & fun DIY electronics and kits. https://www.adafruit.com.
- Marvin I. Minsky, Computation: Finite and Infinite Machines, Prentice-Hall, Englewood Clifts, N. J. 1967, Prentice–Hall Series in Automatic Computation.
- https://www.schott.com/pt-br/special-selection-tools/interactive-abbe-diagram, ( 5/nov/2024).
- García-Valenzuela A.; Peña-Gomar, M.; García-Segundo, C.; Flandes-Aburto, V. Dynamic reflectometry near the critical angle for high-resolution sensing the index of refraction, Sens. Actuators B: Chem. 52, (1998) 236-242. [CrossRef]
- Meeten, G.H.; North, A.N.; Refractive index measurement of absorbing and turbid fluids by reflection near the critical angle, Meas. Sci. Tecnol. 6 (1995) 214-225. [CrossRef]
- Georg Hass and Rudolf E. Thun, Editor, Physics of Thin Films, Chap.1, Precision Measurement in thin film optics, H.E. Bennet and Jean M. Bennet, vol. 4, Academic Press, 1967.
Figure 1.
Reflectance curve for a BK7 glass prism (n=1.5149 for λ=639 nm), the critical angle () is at 41.3082 degrees, and SF6 glass prism (n=1.7981), with =33.7894.
Figure 1.
Reflectance curve for a BK7 glass prism (n=1.5149 for λ=639 nm), the critical angle () is at 41.3082 degrees, and SF6 glass prism (n=1.7981), with =33.7894.
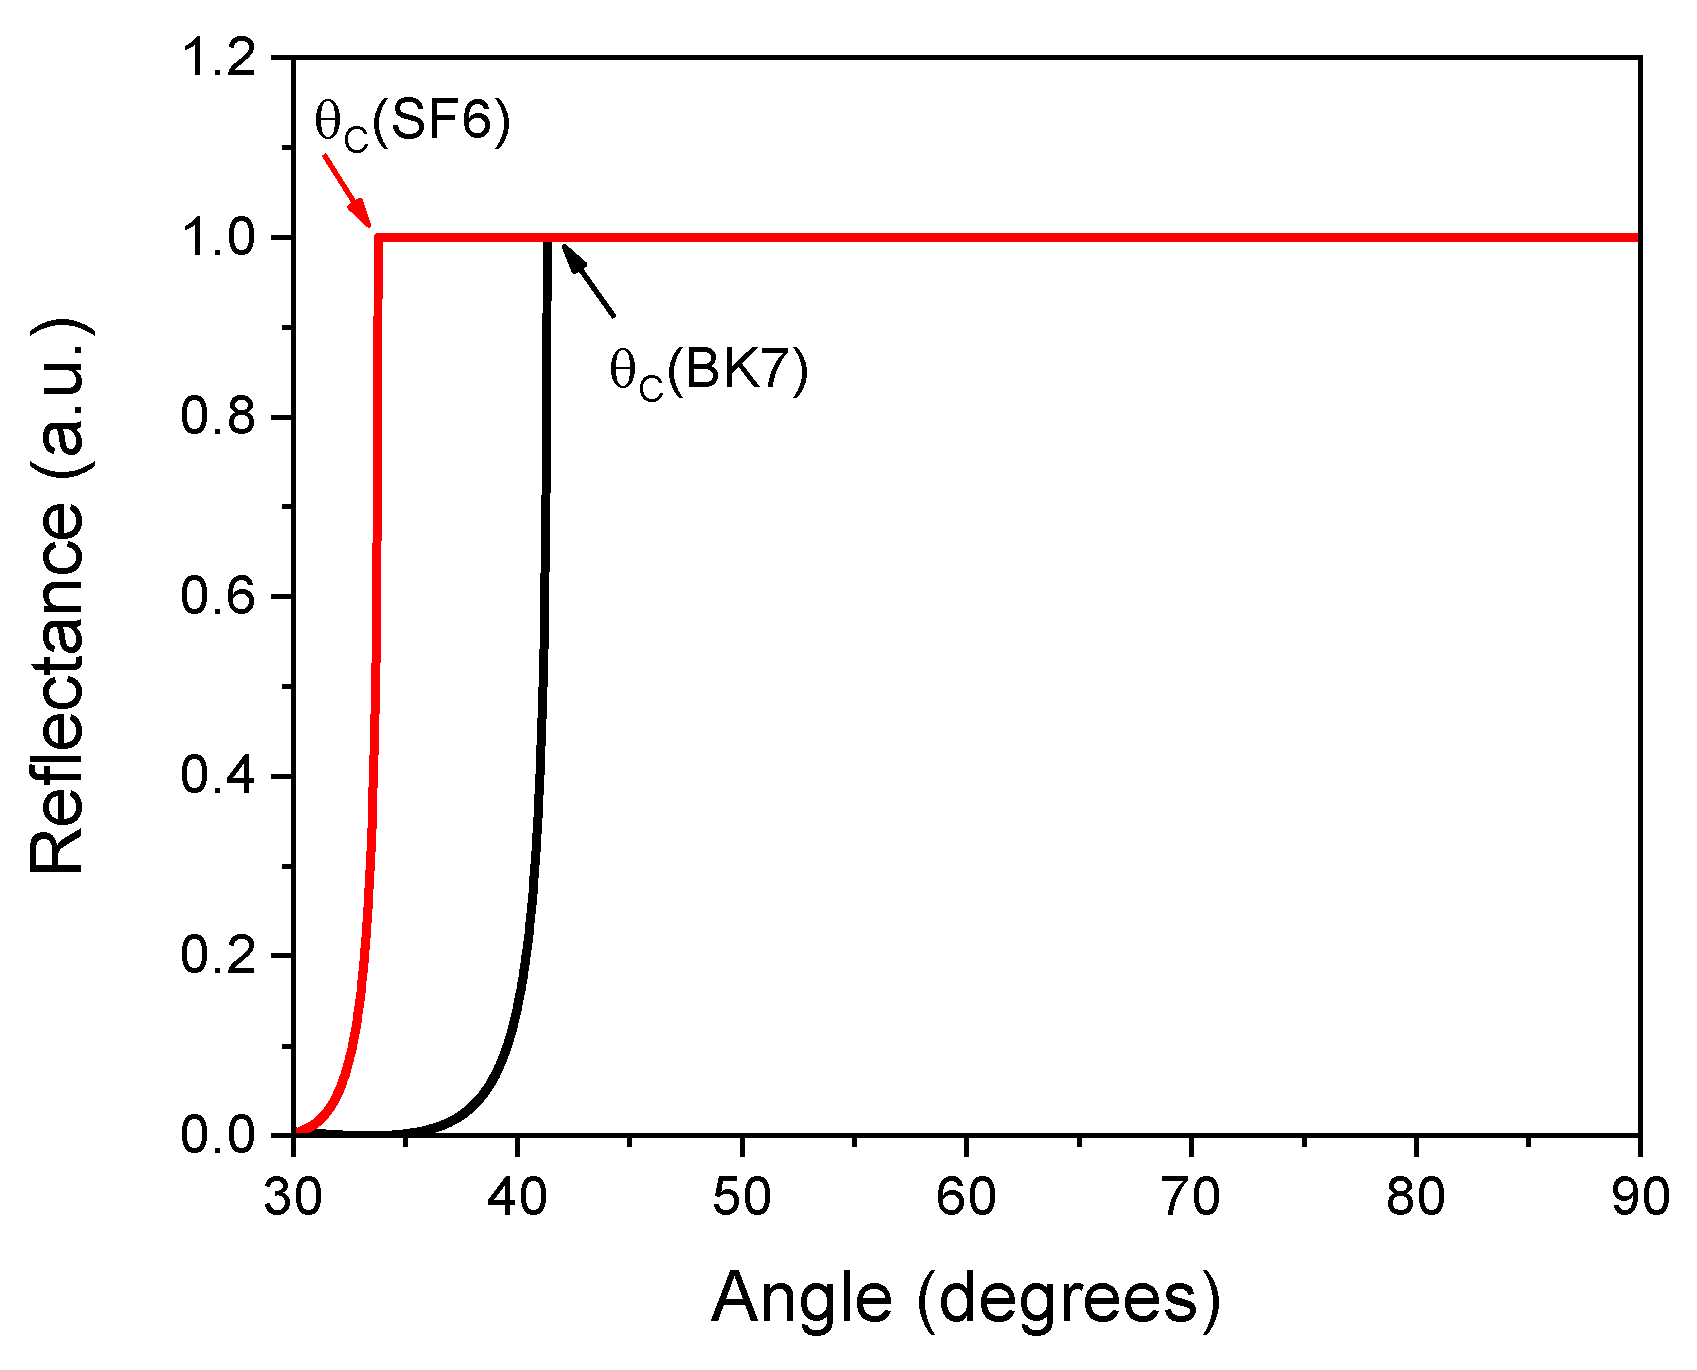
Figure 2.
Reflectance curve of an interface of air (n=1) / glass FS (fused silica, n=1.4568), BK7 (n=1.5149), SK16 (n=1.6180) and SF6 (n=1.7981), and where the refractive index is related by the minimum reflectance angle (Brewster angle), at 55.53°, 56.57°, 58.28° and 60.92°, respectively.
Figure 2.
Reflectance curve of an interface of air (n=1) / glass FS (fused silica, n=1.4568), BK7 (n=1.5149), SK16 (n=1.6180) and SF6 (n=1.7981), and where the refractive index is related by the minimum reflectance angle (Brewster angle), at 55.53°, 56.57°, 58.28° and 60.92°, respectively.
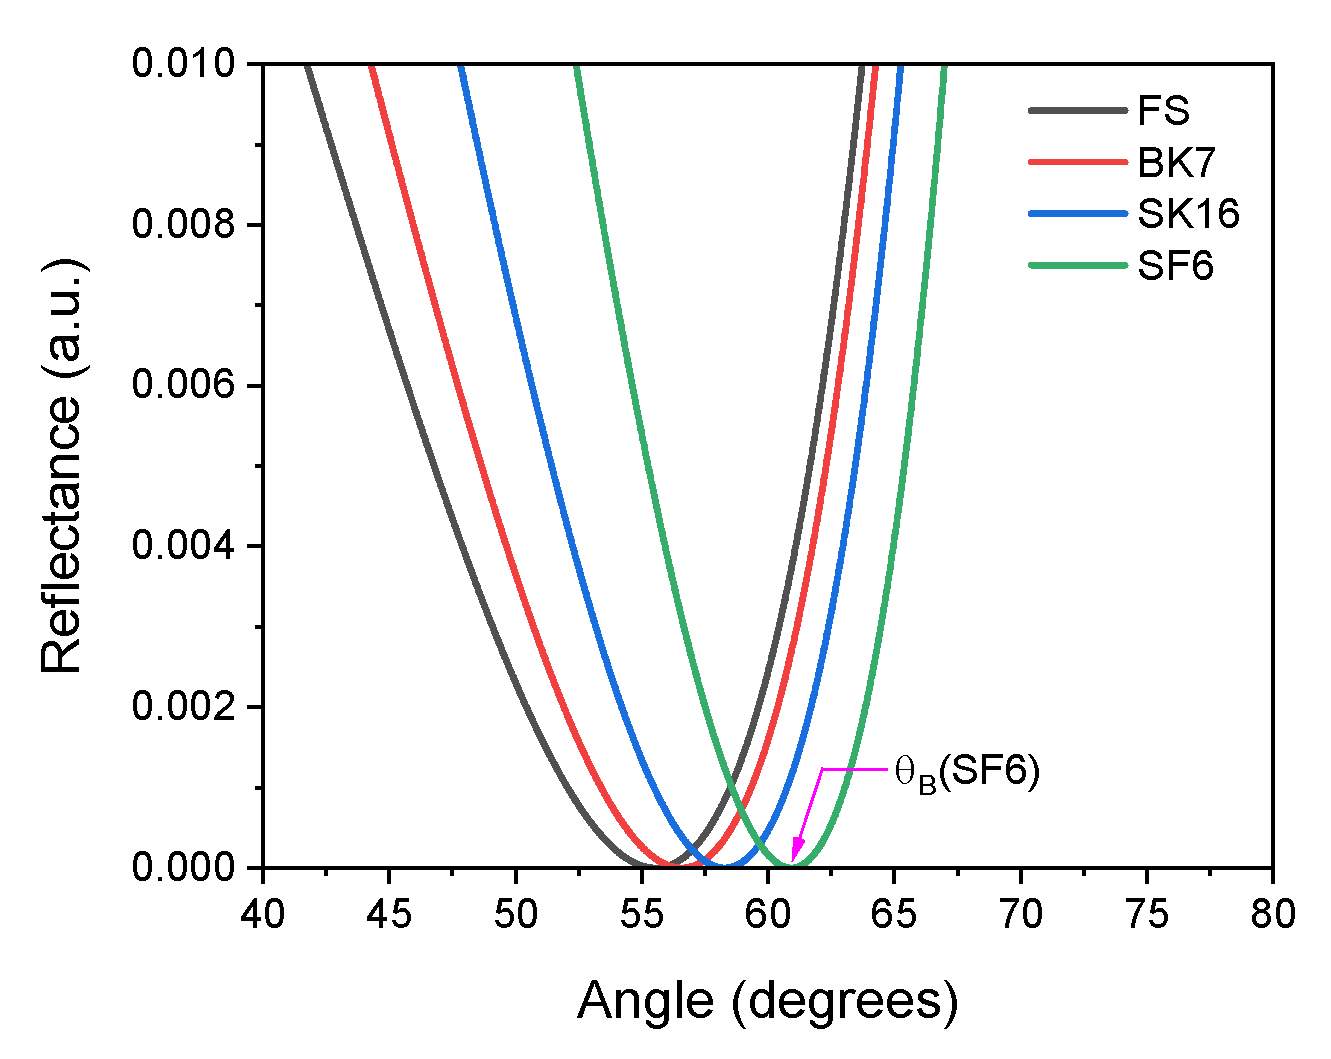
Figure 3.
Reflectance curve of a BK7 glass substrate and a step-shaped layer of MgF2 (n=1.3769 at λ= 639 nm) coating with thicknesses of 100, 250 and 500 nm. The intersection of the curves is at .
Figure 3.
Reflectance curve of a BK7 glass substrate and a step-shaped layer of MgF2 (n=1.3769 at λ= 639 nm) coating with thicknesses of 100, 250 and 500 nm. The intersection of the curves is at .
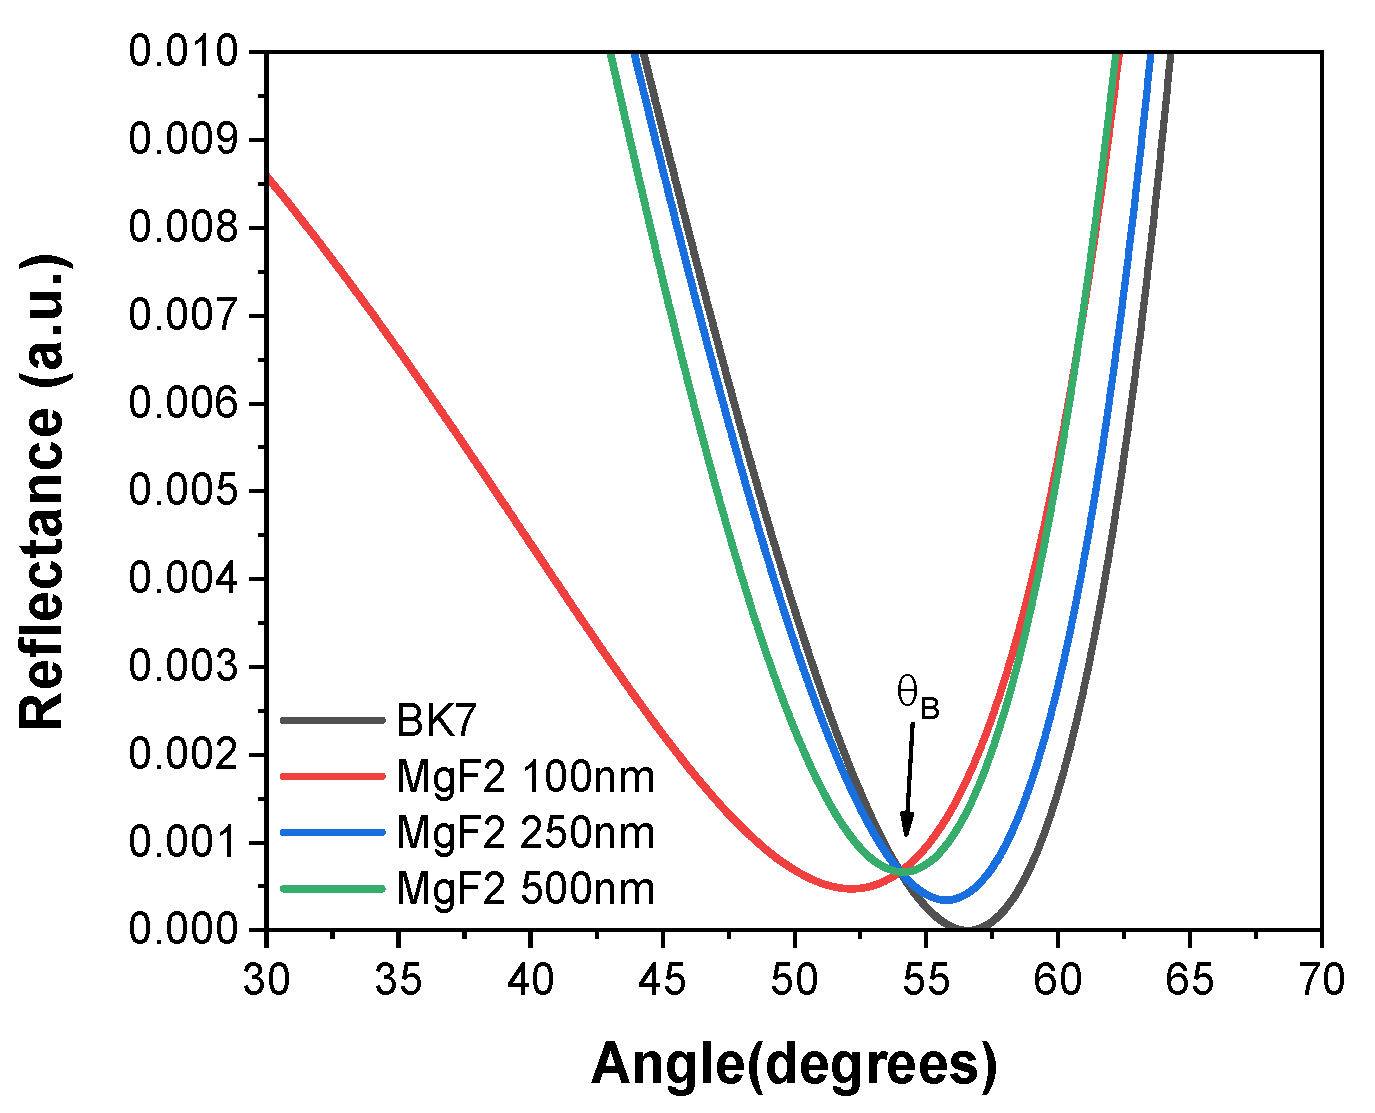
Figure 4.
SPR curve for different prisms (FS, BK7, SK16, SF6) with a 50 nm thickness gold coating (N=0.1736-i3.4930), with air and distilled water sample (n=1.3314 at λ=639 nm) each.
Figure 4.
SPR curve for different prisms (FS, BK7, SK16, SF6) with a 50 nm thickness gold coating (N=0.1736-i3.4930), with air and distilled water sample (n=1.3314 at λ=639 nm) each.
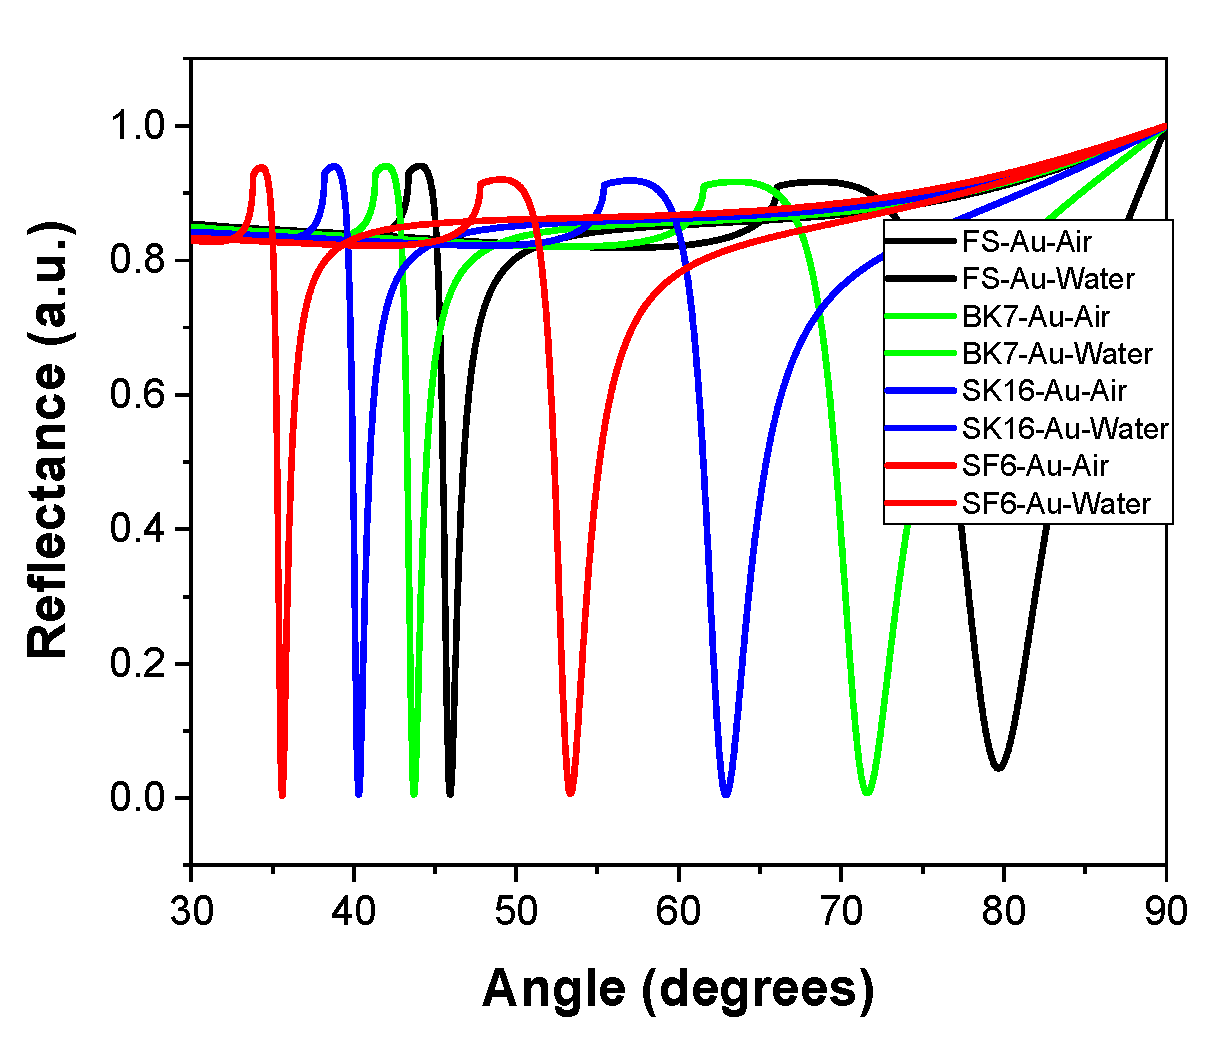
Figure 5.
(a) Reflectance of an SPR sensor having a laser at 639 nm, a BK7 prism, a gold film (50 nm), and a distilled water sample. The edge angle of total internal reflection is =61.5070, the initial angle from full width to half maximum (FWHM) is and the resonance angle is =71.5820° and =π/2+ i|-0.3963| is calculated by Snell’s law. (b) calculated from the filling percentage (0%, 5%, 10%, 15%, 20%, 25%) of the spherical particles ( = 100 nm) of PS added to the distilled water. (c) corresponding to the number concentration. (d) Reflectance for the first three calculated .
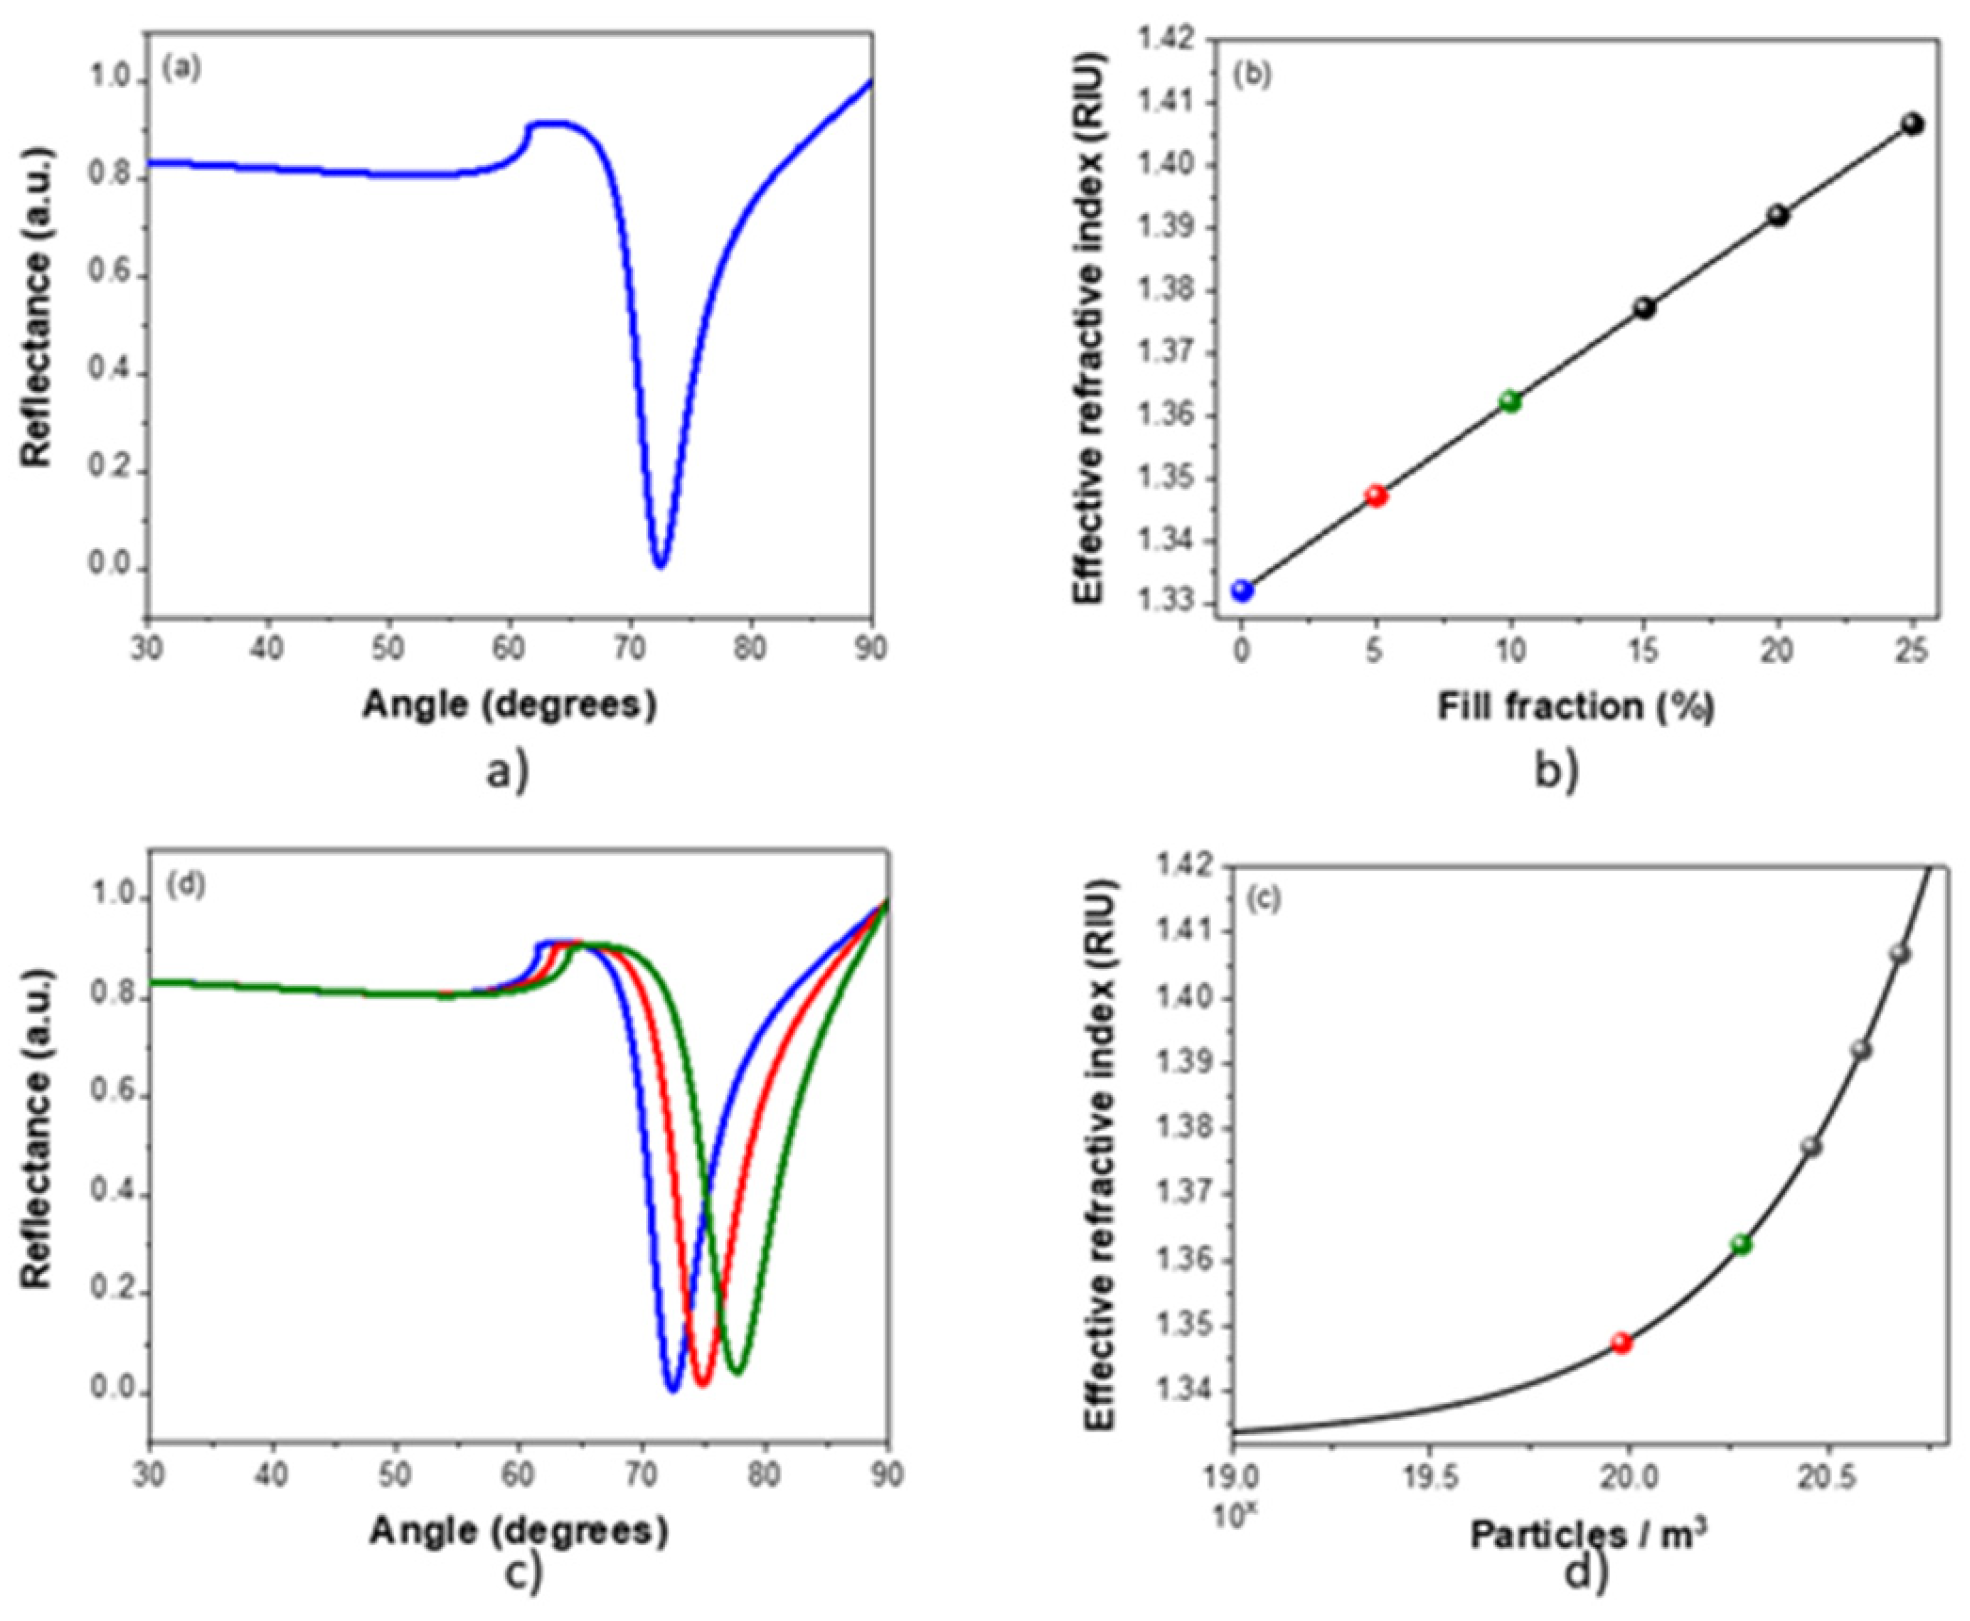
Figure 6.
SPR system. (a) Portable optomechatronic system; A, diode laser, B, linear polarizer, C, sample mount, D, phoptodiode container, E, motorized rotary stages, F, sheet metal cabinet, (b) photography of the SPR system.
Figure 6.
SPR system. (a) Portable optomechatronic system; A, diode laser, B, linear polarizer, C, sample mount, D, phoptodiode container, E, motorized rotary stages, F, sheet metal cabinet, (b) photography of the SPR system.
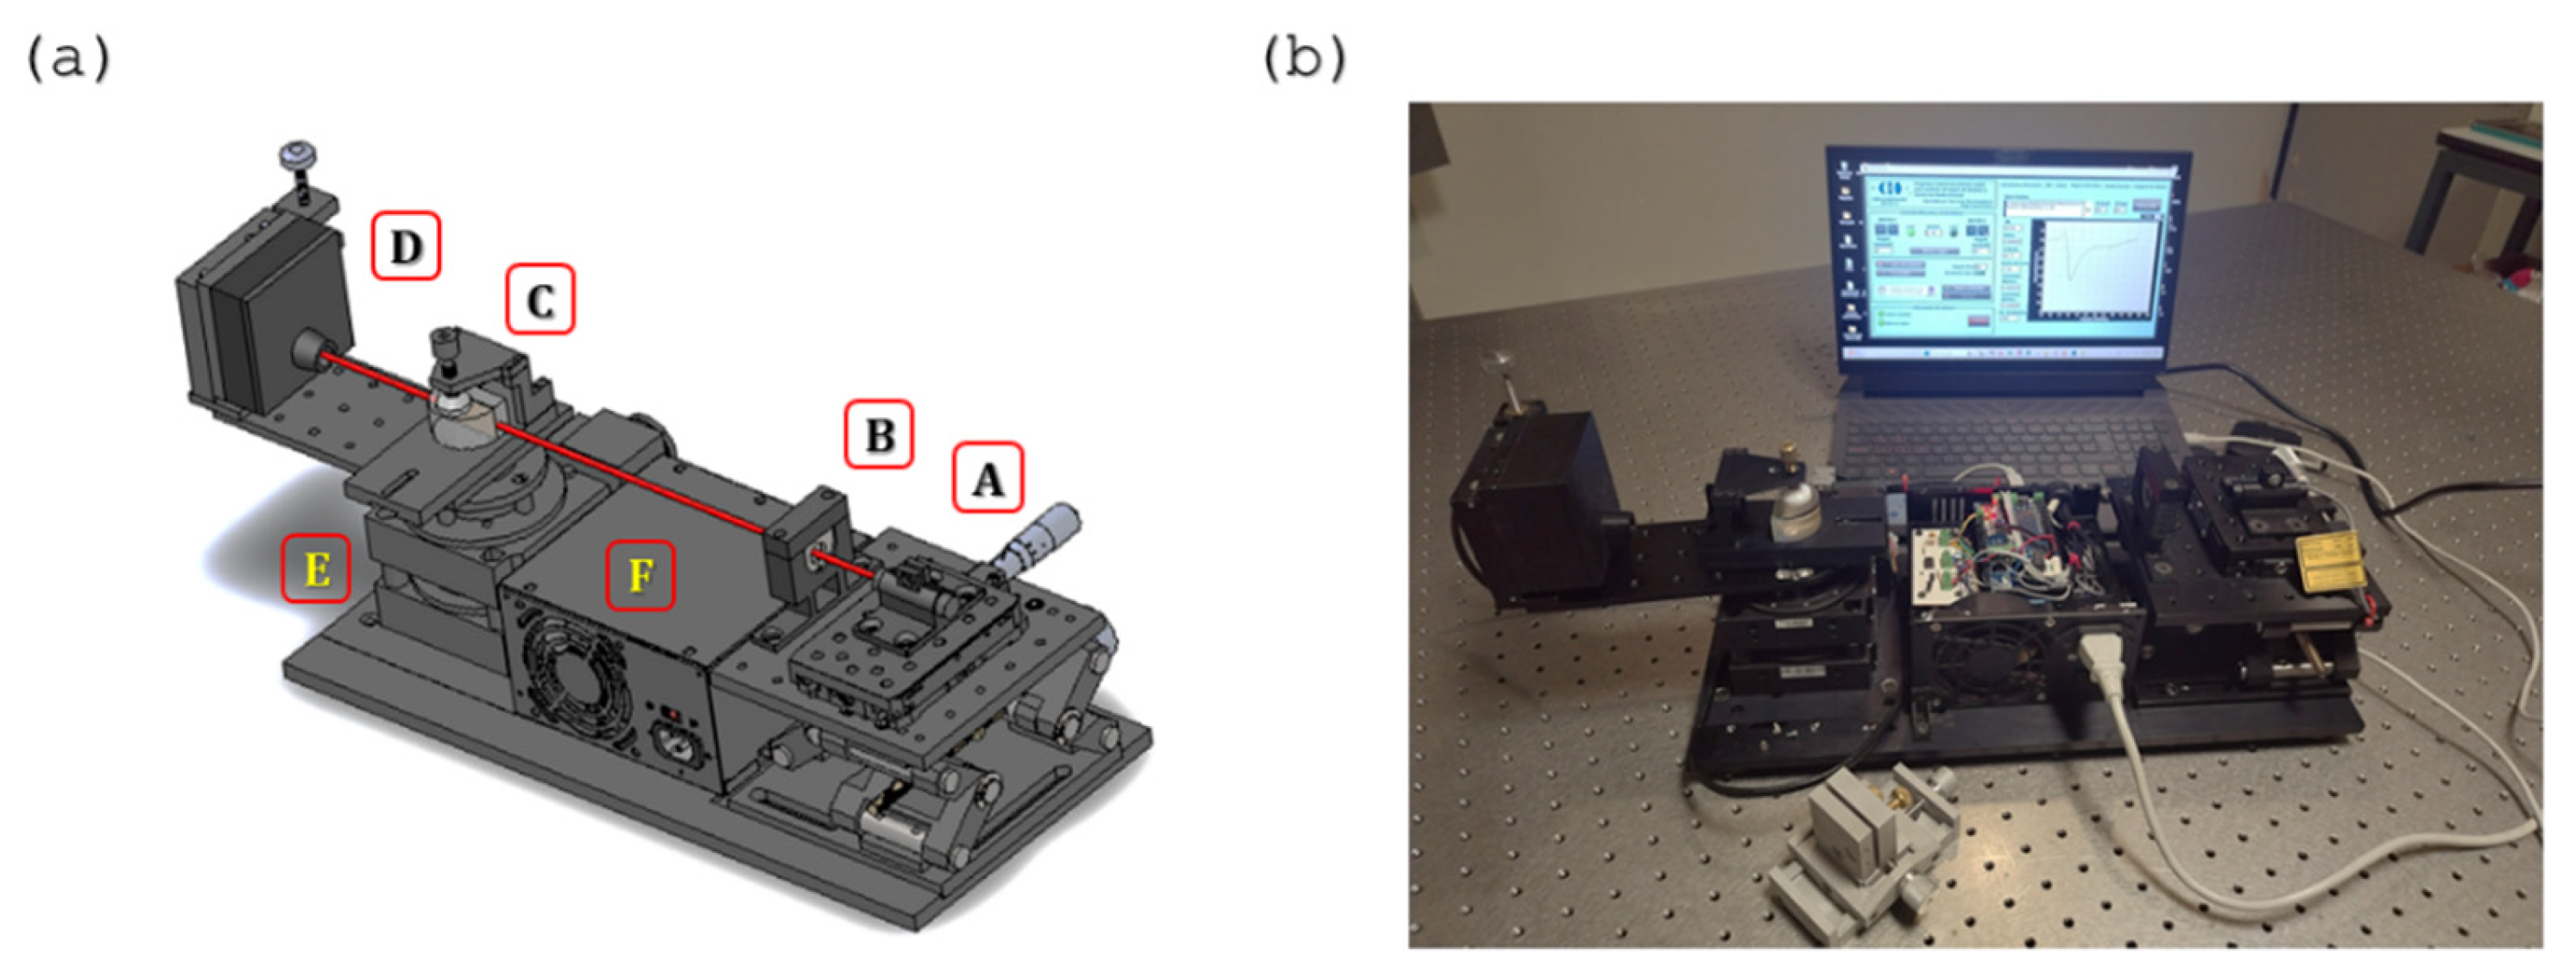
Figure 7.
General system architecture.
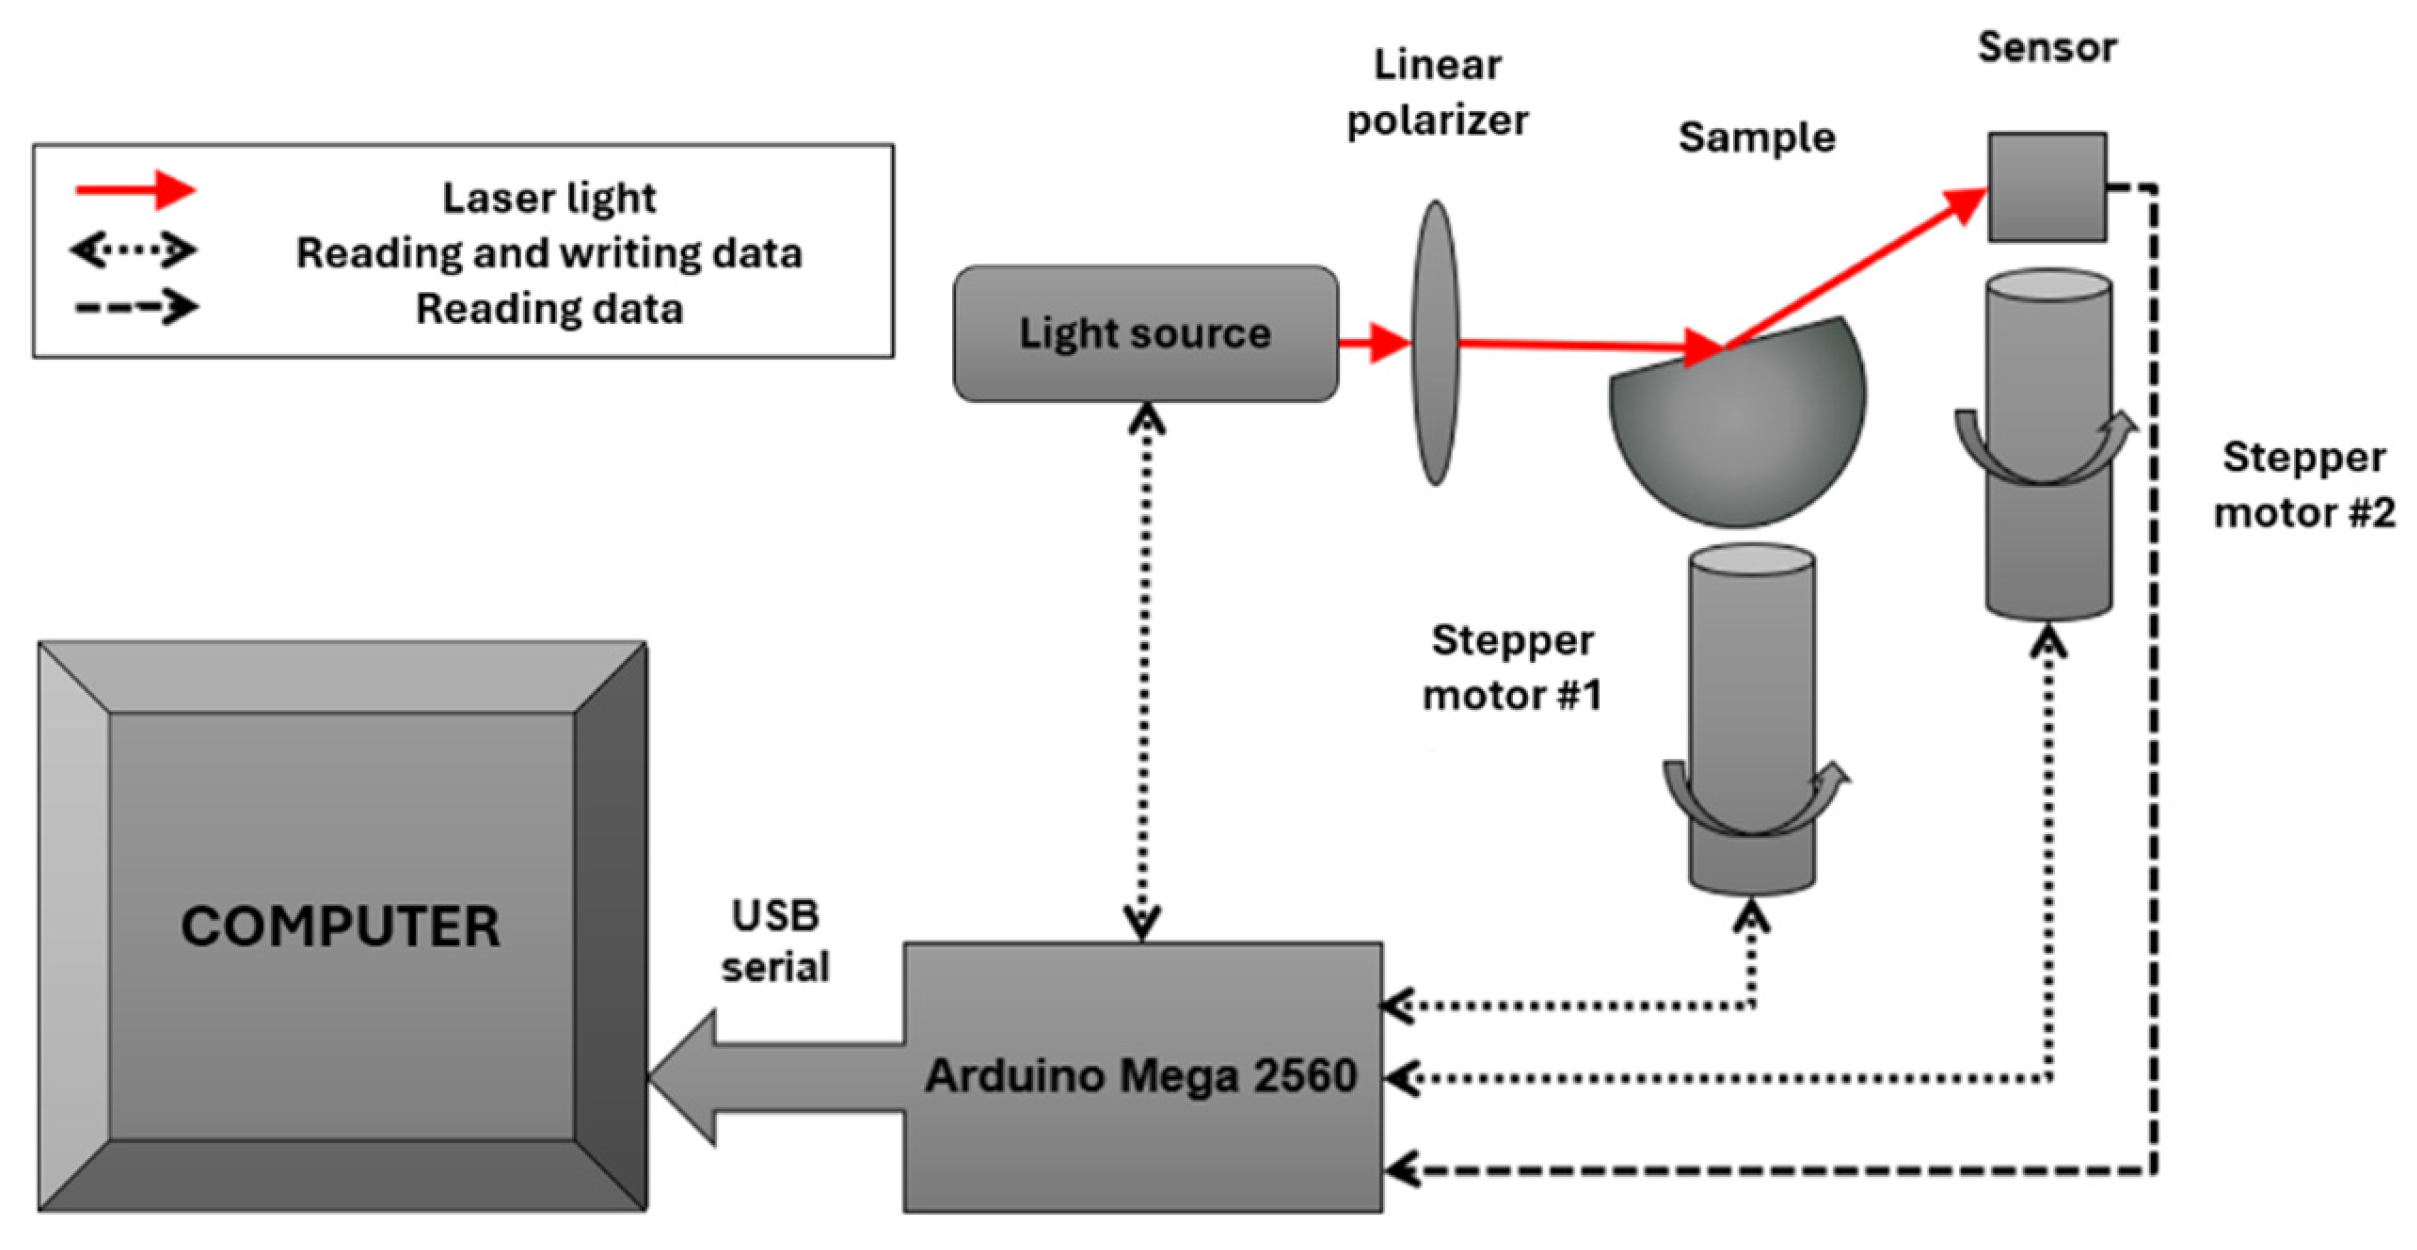
Figure 8.
The alignment process.
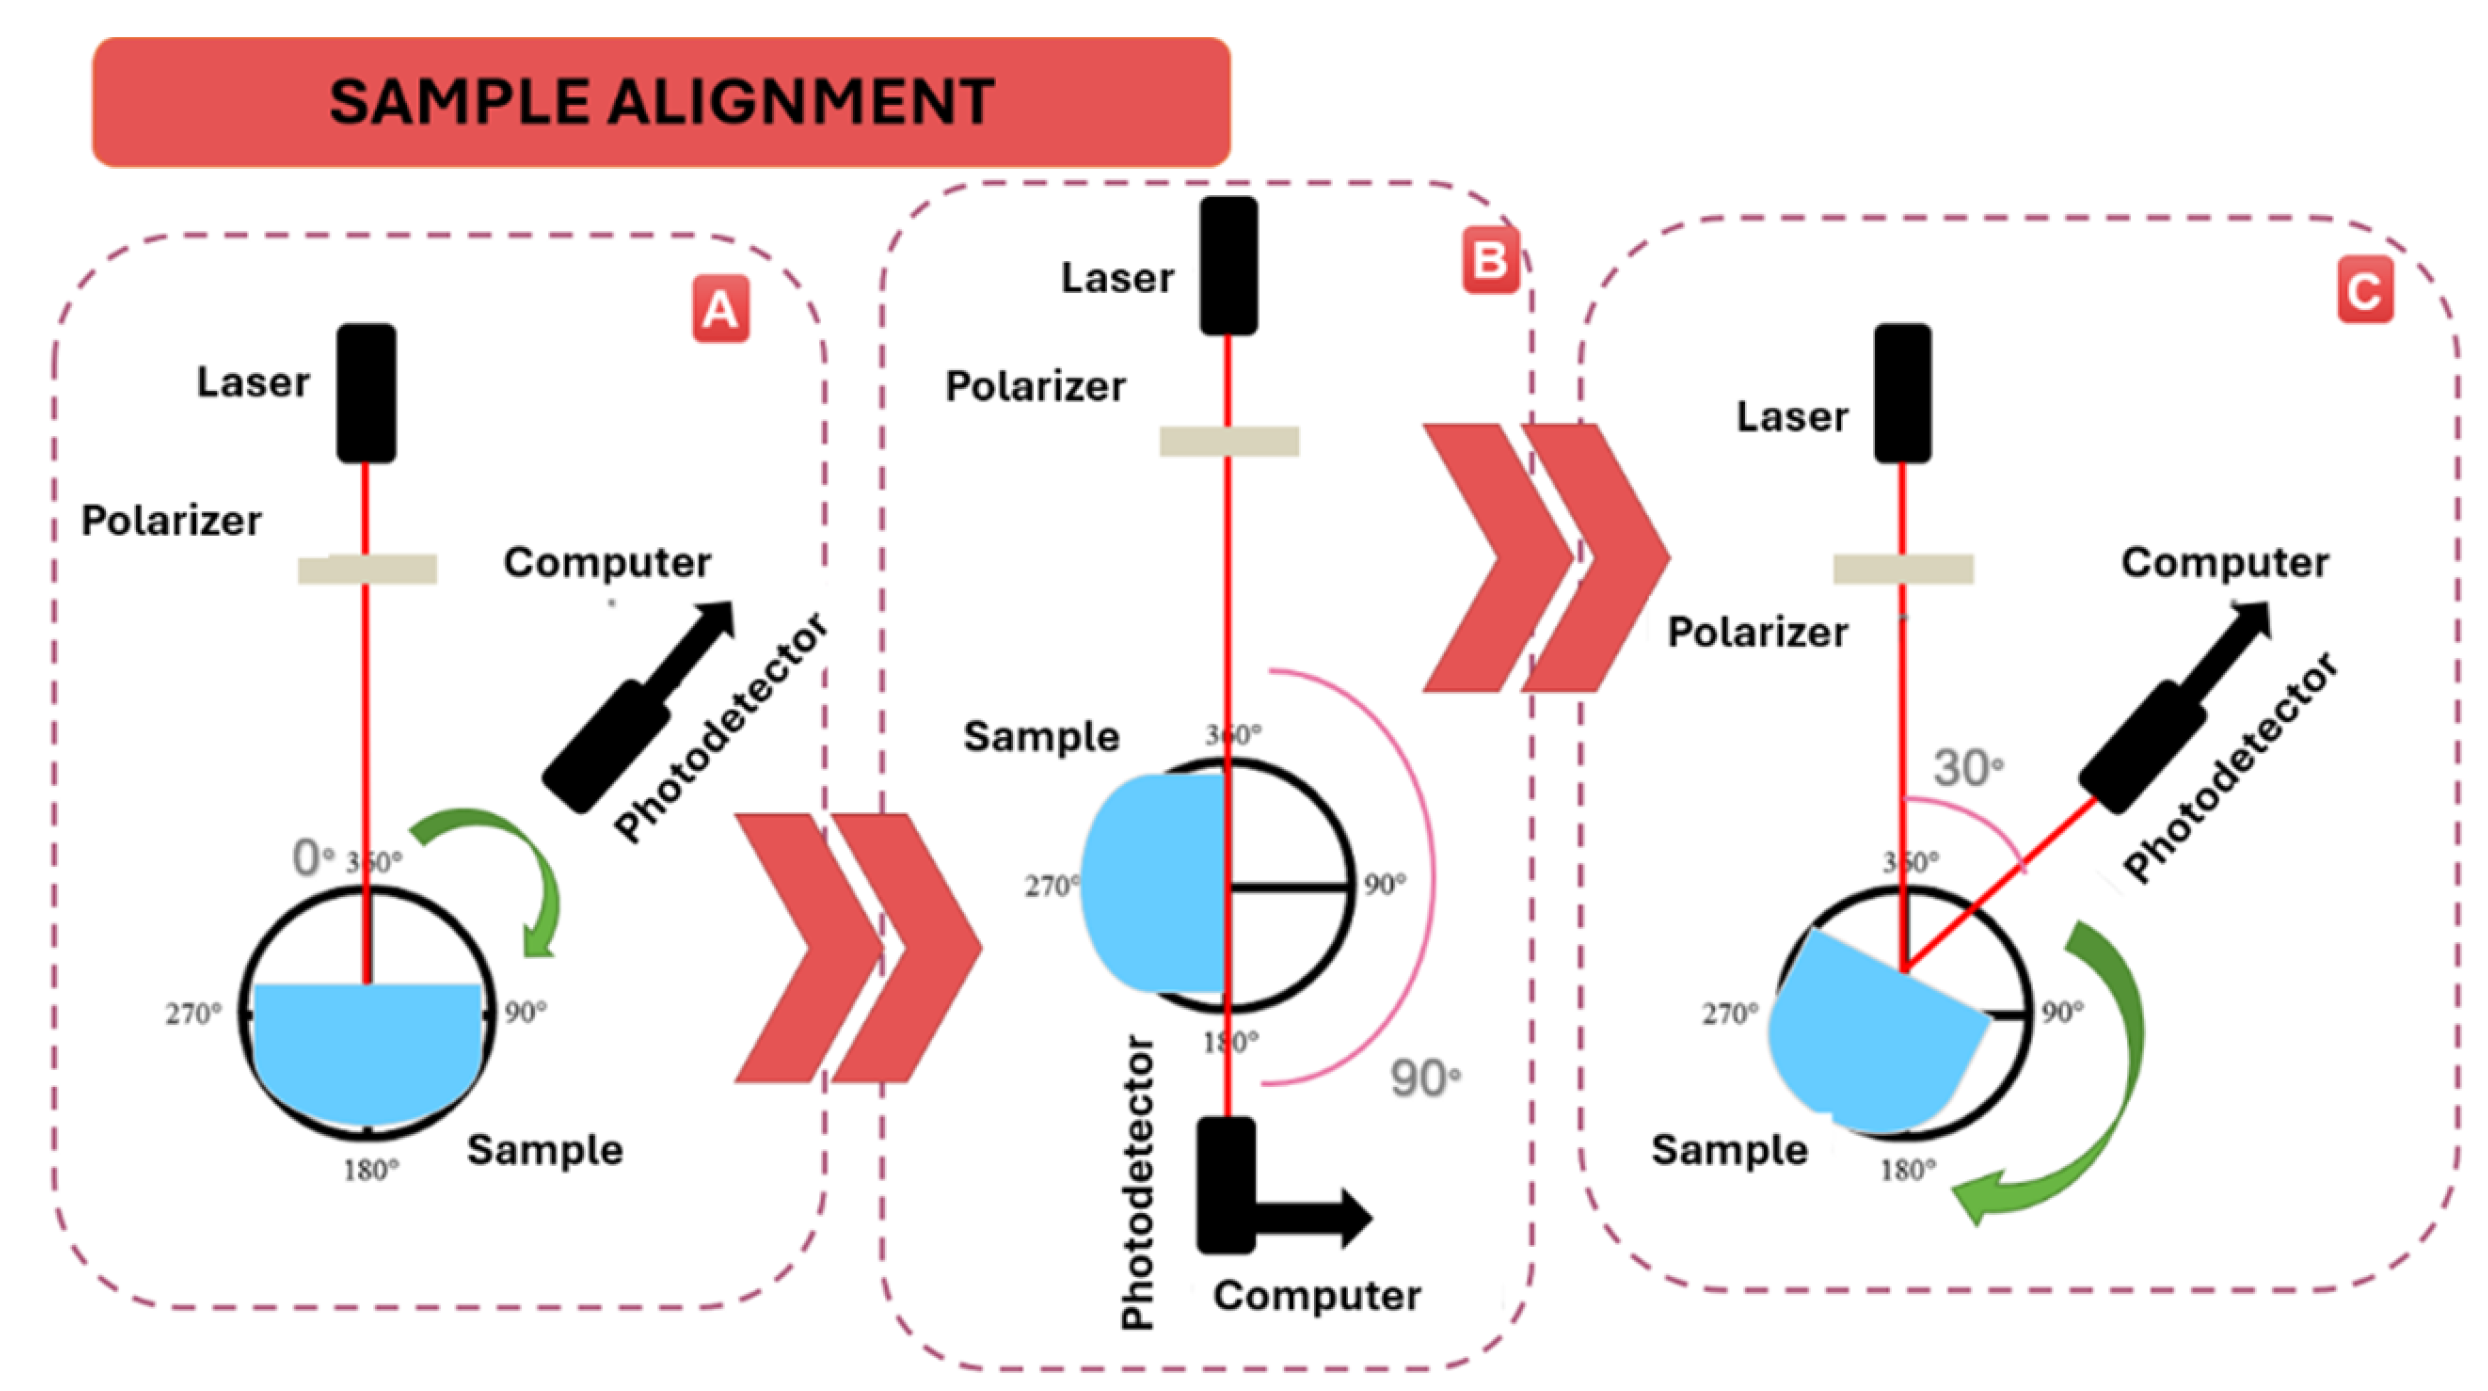
Figure 9.
User interface. Real-time graph of reflected light of the flat surface of a BK7 prism.
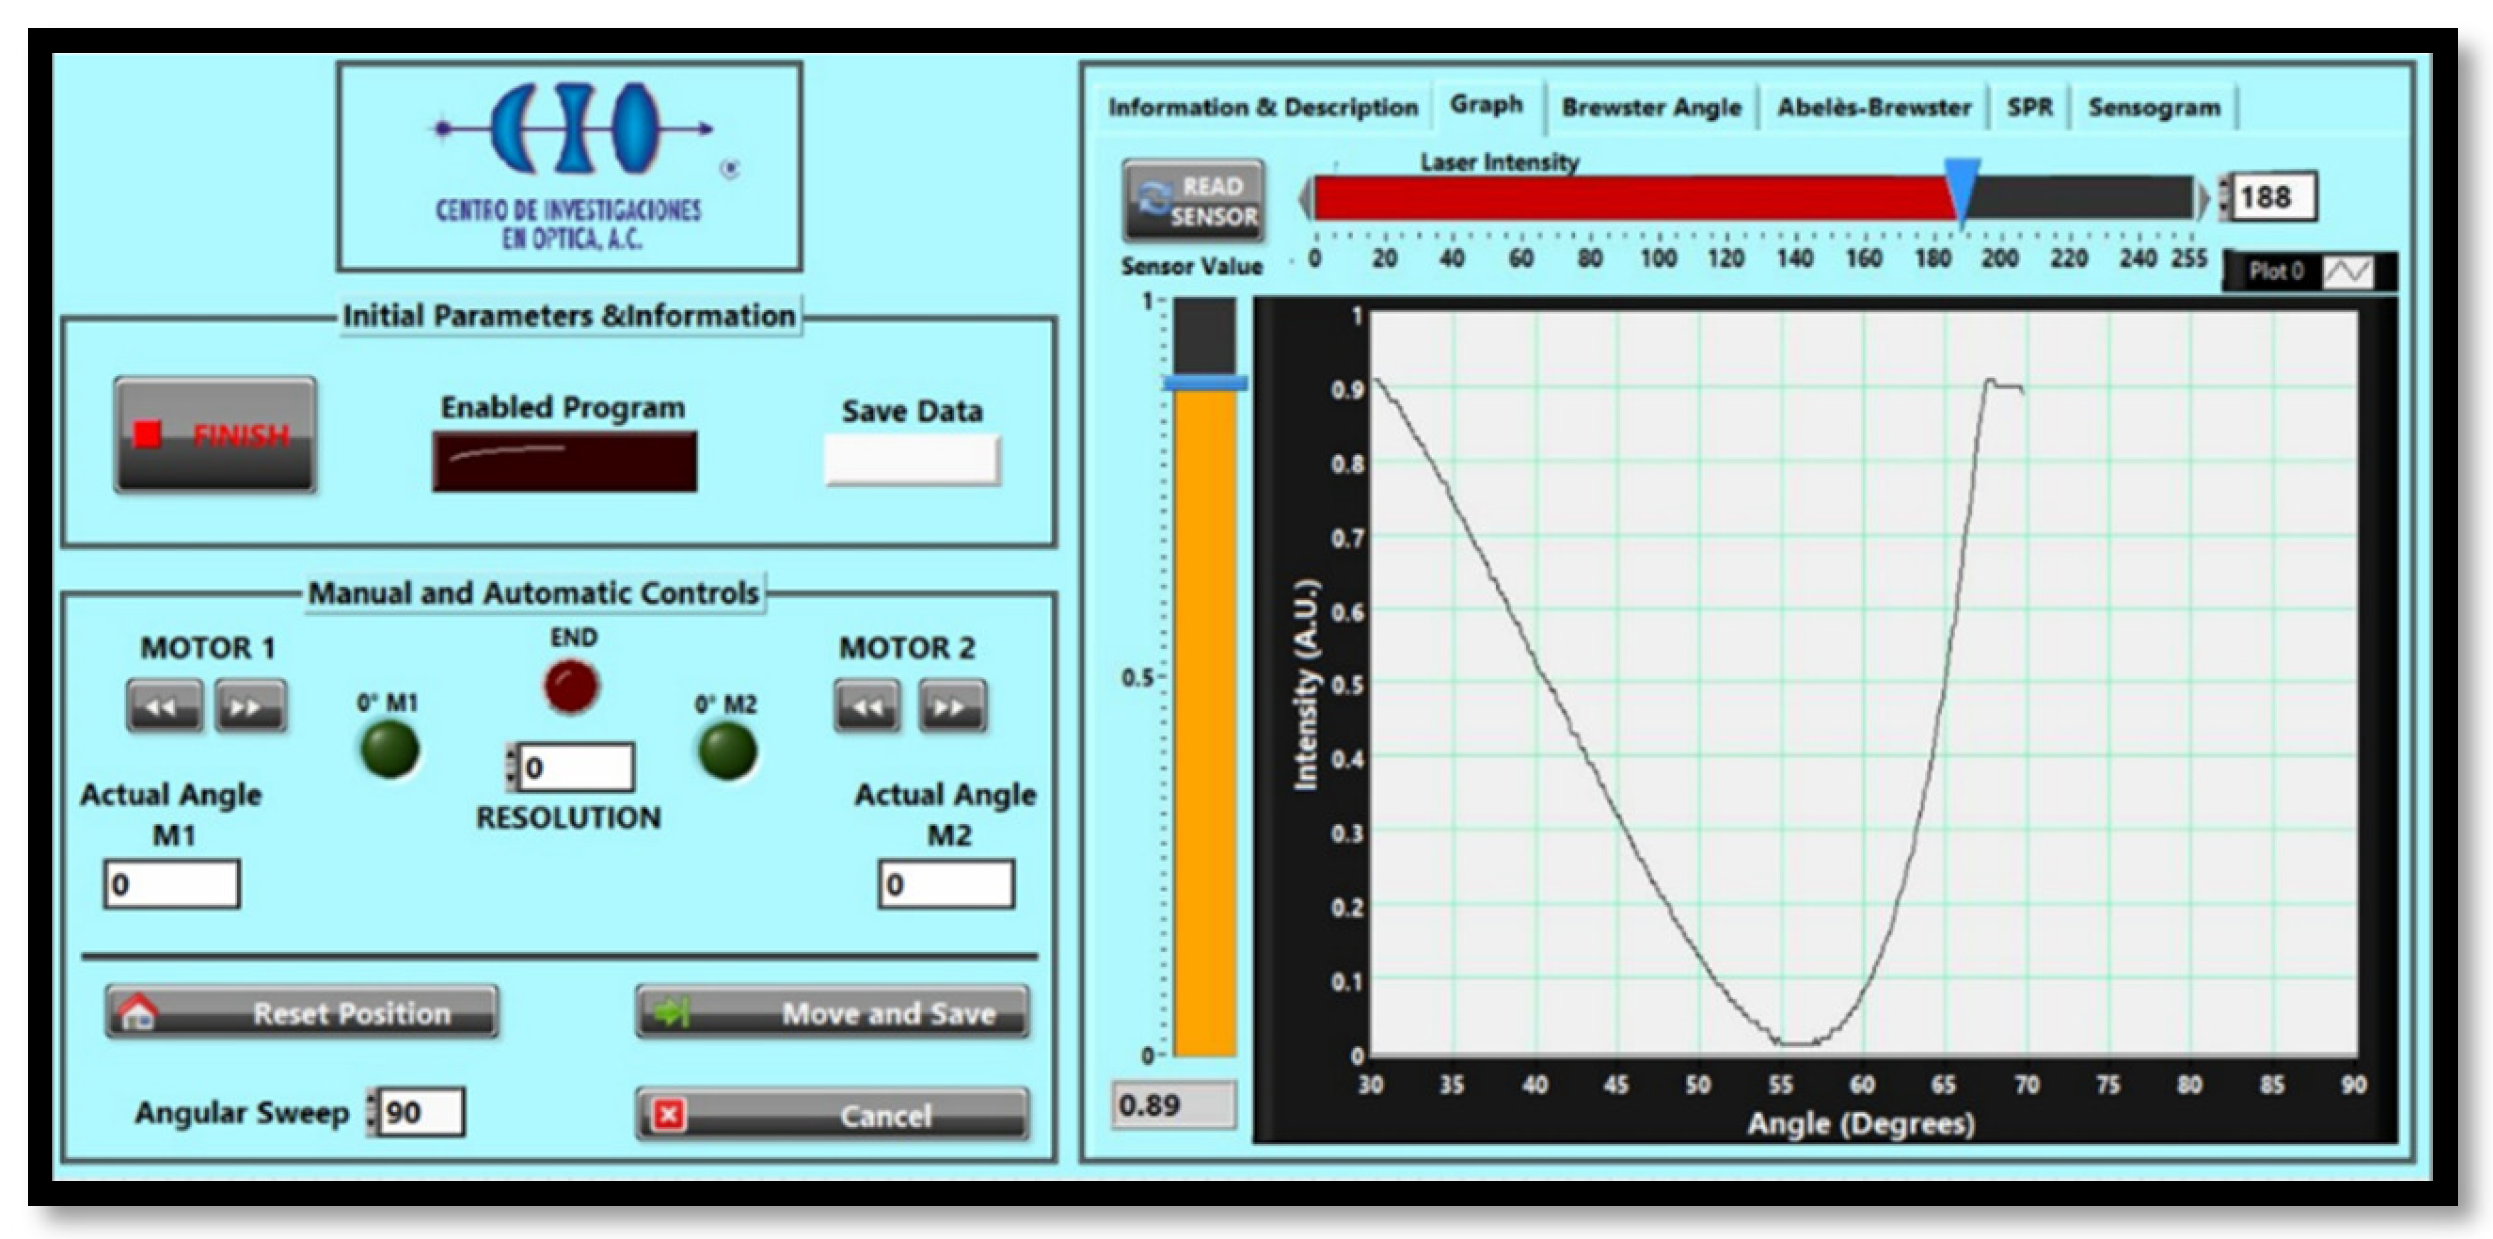
Figure 10.
Critical angle measurements for a BK7 prism.
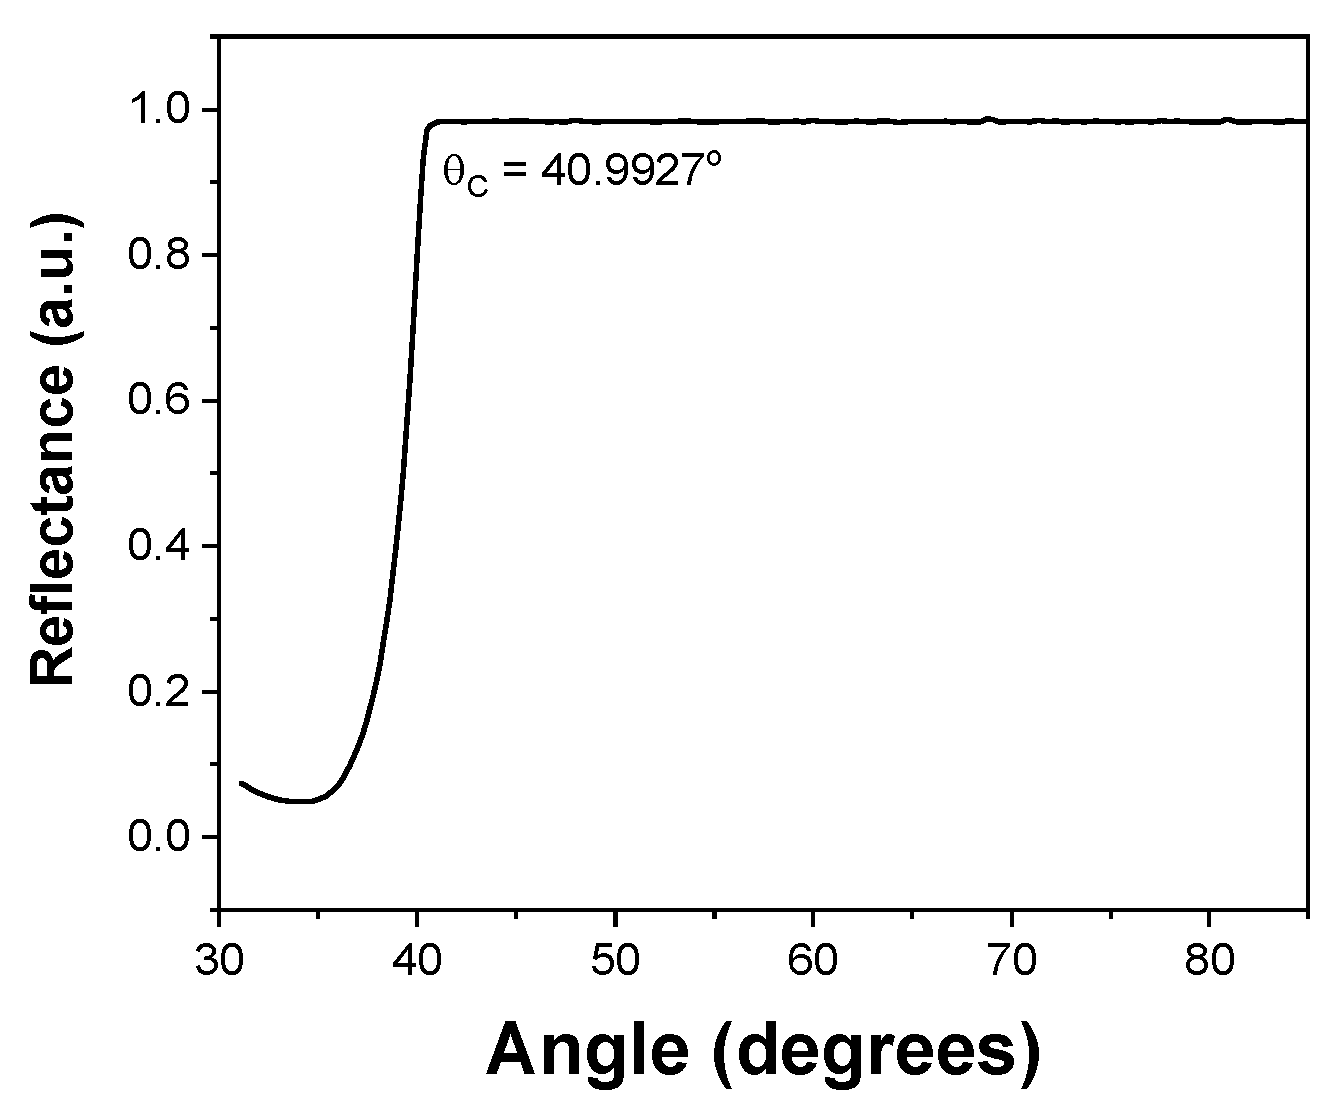
Figure 11.
Experimental Brewster angle measurement of FK5 (56.07°), BK7 (56.55°), SK16 (58.21°) and SF6 (60.82°) Prisms and the estimation of their refractive index (1.4865, 1.5137, 1.6135, 1.7908, respectively).
Figure 11.
Experimental Brewster angle measurement of FK5 (56.07°), BK7 (56.55°), SK16 (58.21°) and SF6 (60.82°) Prisms and the estimation of their refractive index (1.4865, 1.5137, 1.6135, 1.7908, respectively).
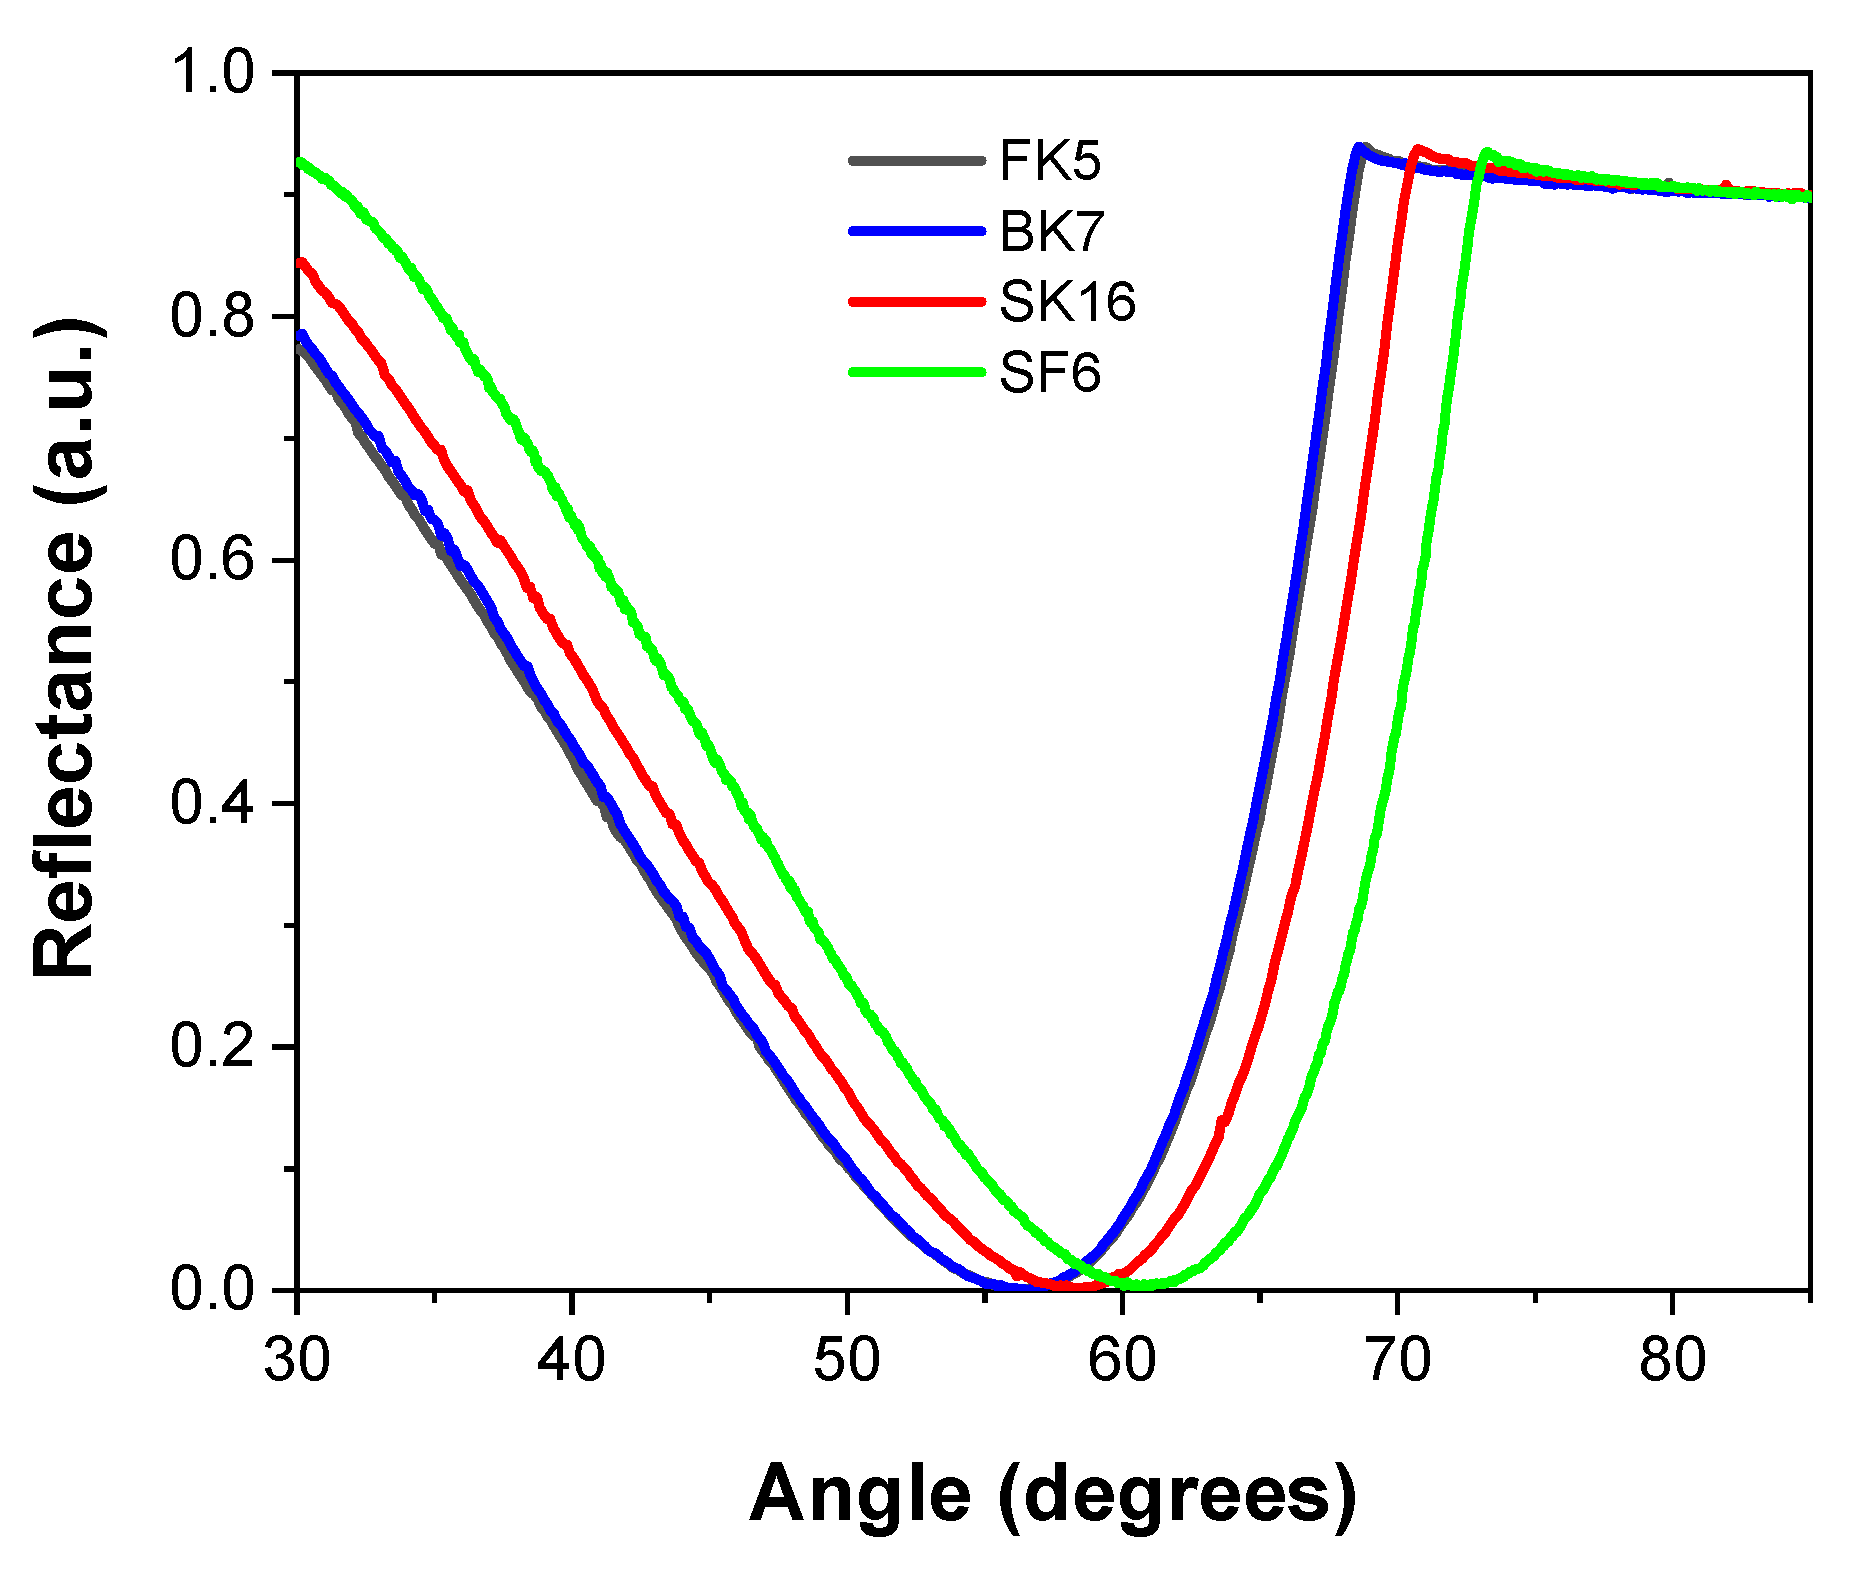
Figure 12.
Reflectance measurement of a BK7 glass substrate and a step with MgF2 coating. The Brewster angle of the MgF2 film is the point where the reflectance curves coincide.
Figure 12.
Reflectance measurement of a BK7 glass substrate and a step with MgF2 coating. The Brewster angle of the MgF2 film is the point where the reflectance curves coincide.
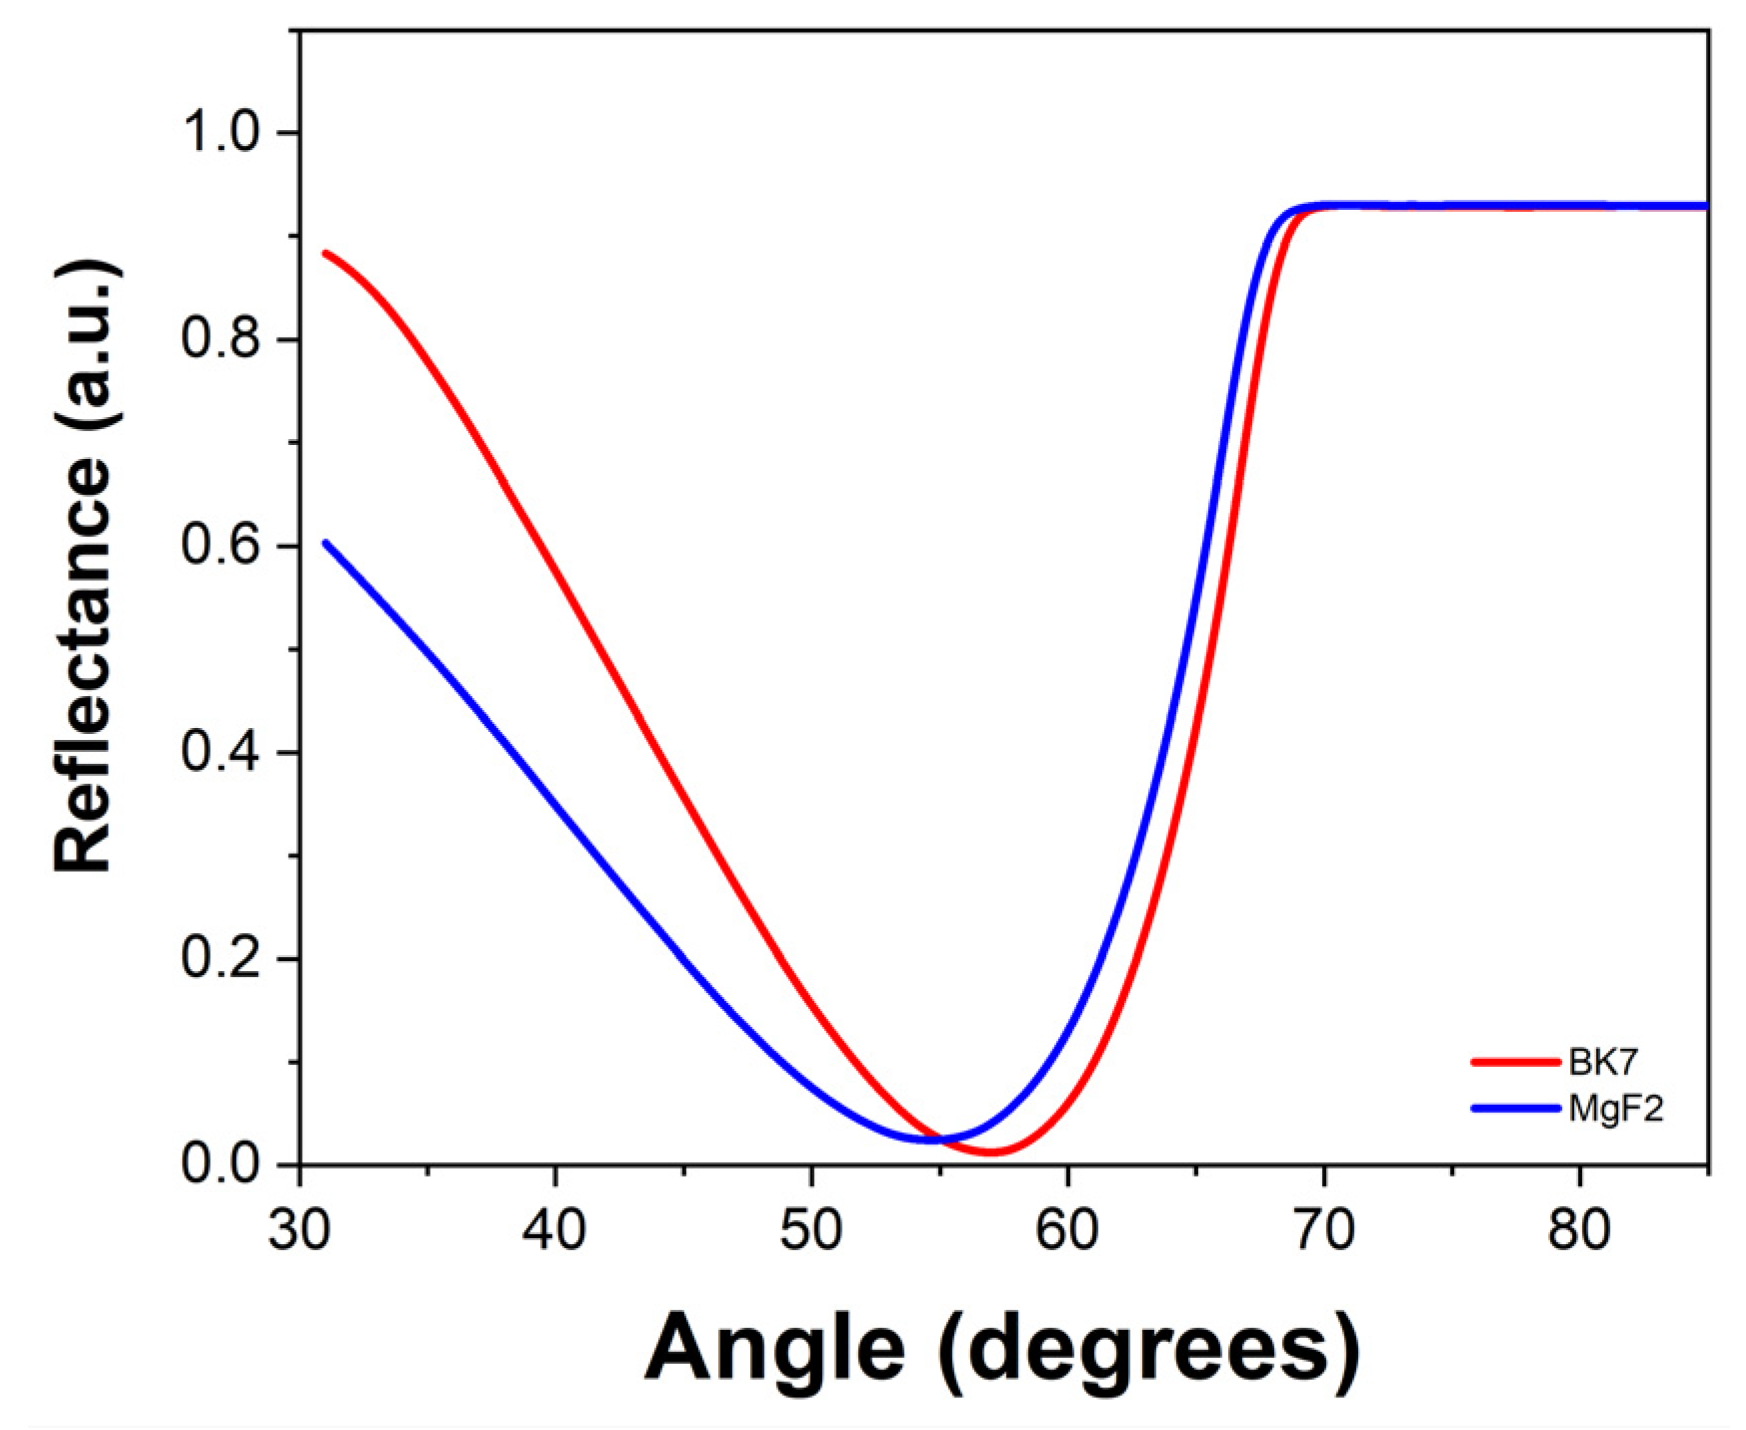
Figure 13.
Experimental SPR curves for; a) BK7 prism/Au(50nm)/air and b) Bk7 prism/Cr(3nm)/Au(50nm)/air.
Figure 13.
Experimental SPR curves for; a) BK7 prism/Au(50nm)/air and b) Bk7 prism/Cr(3nm)/Au(50nm)/air.
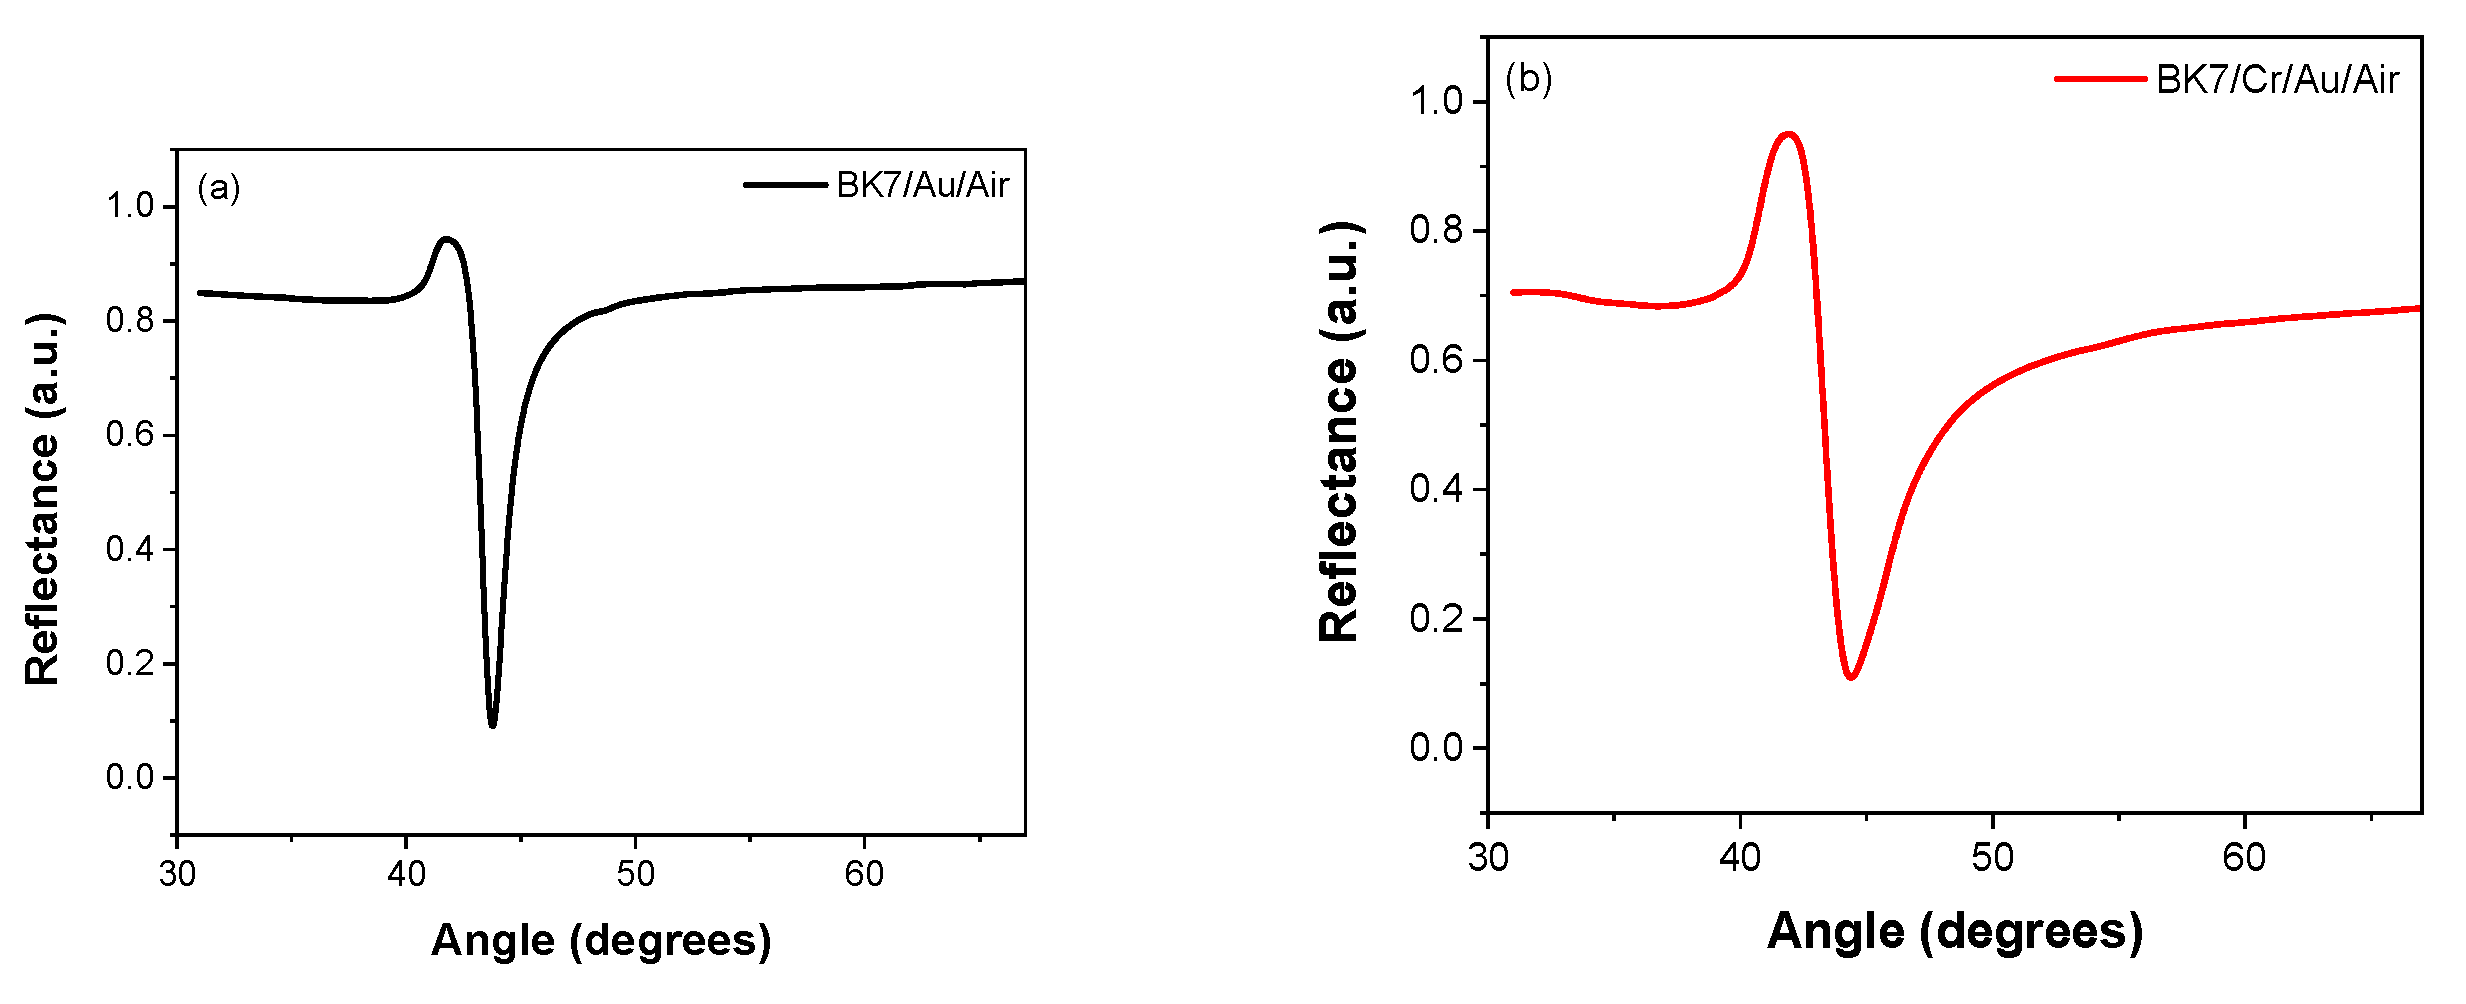
Figure 14.
Immobilization of laccases of BK7 prism with a Cr/Au coating.
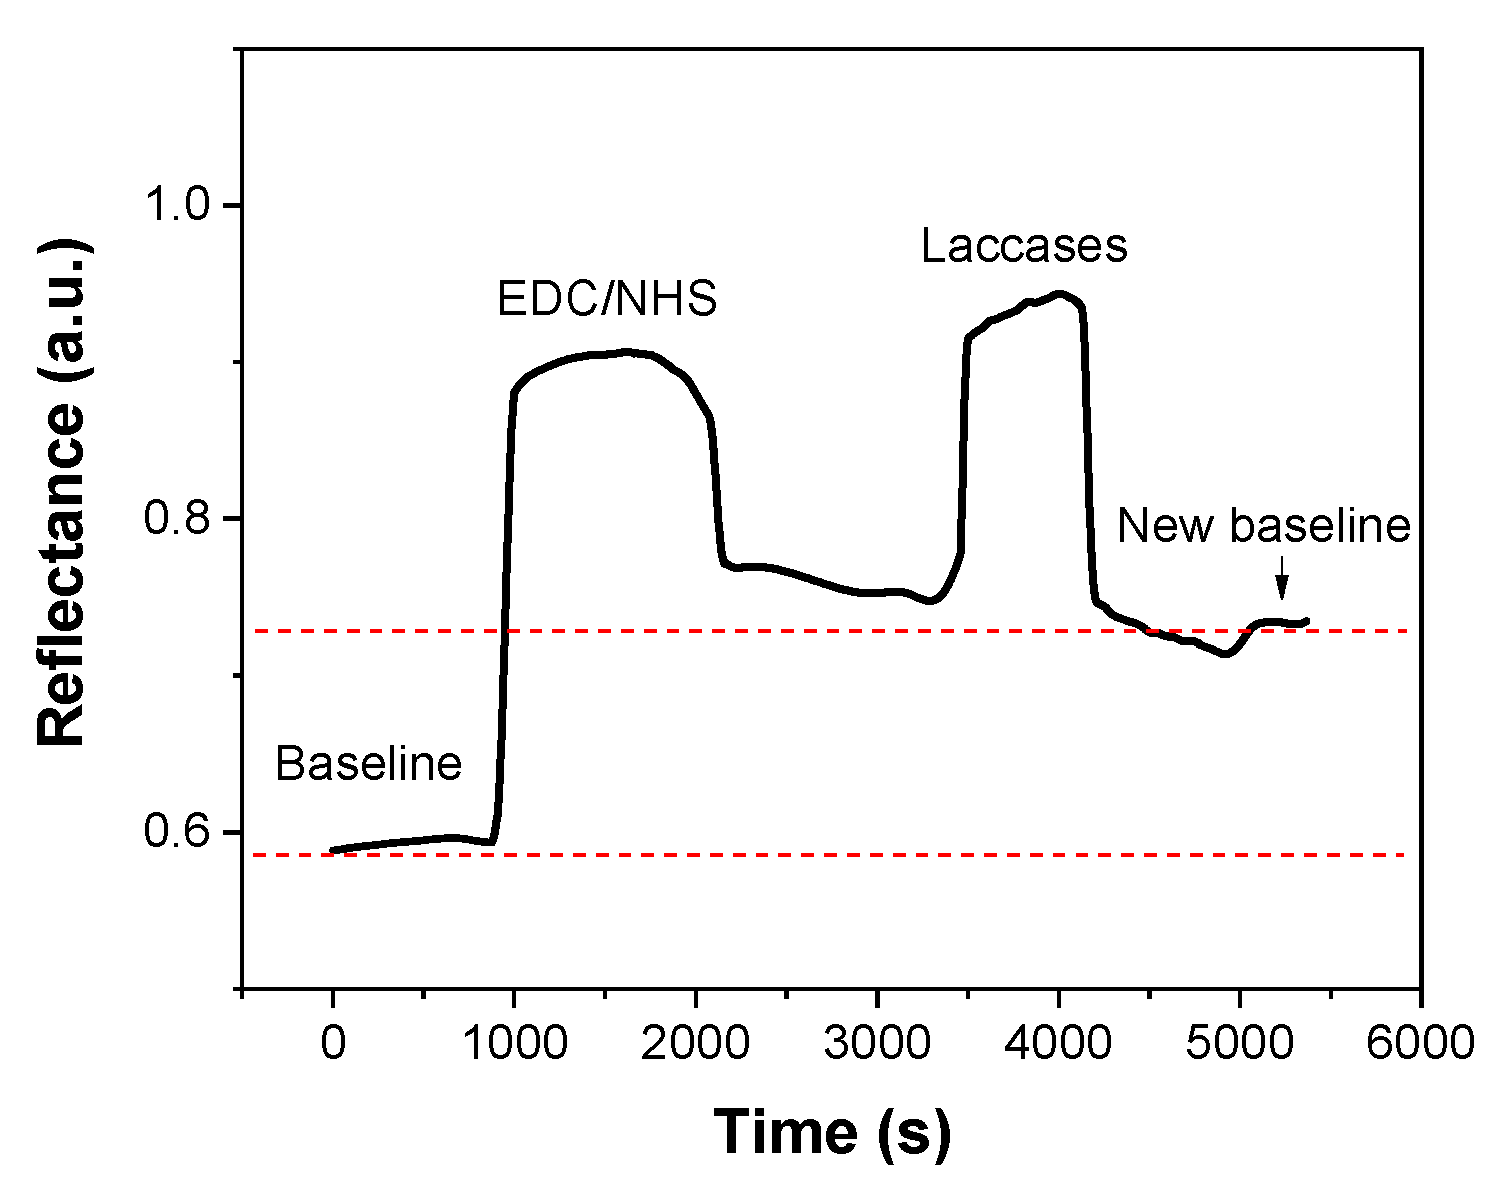
Figure 15.
(a) Theoretical distilled water sample (dotted blue line), experimental distilled water sample as reference (red line), and experimental sample of water with 100 nm diameter polystyrene particles (magenta line). (b) Obtaining the filling fraction (4.08 %) from =1.3418 RIU calculated from =71.7920°. Note: The experimental signals are aligned with the theoretical reference signal of distilled water.
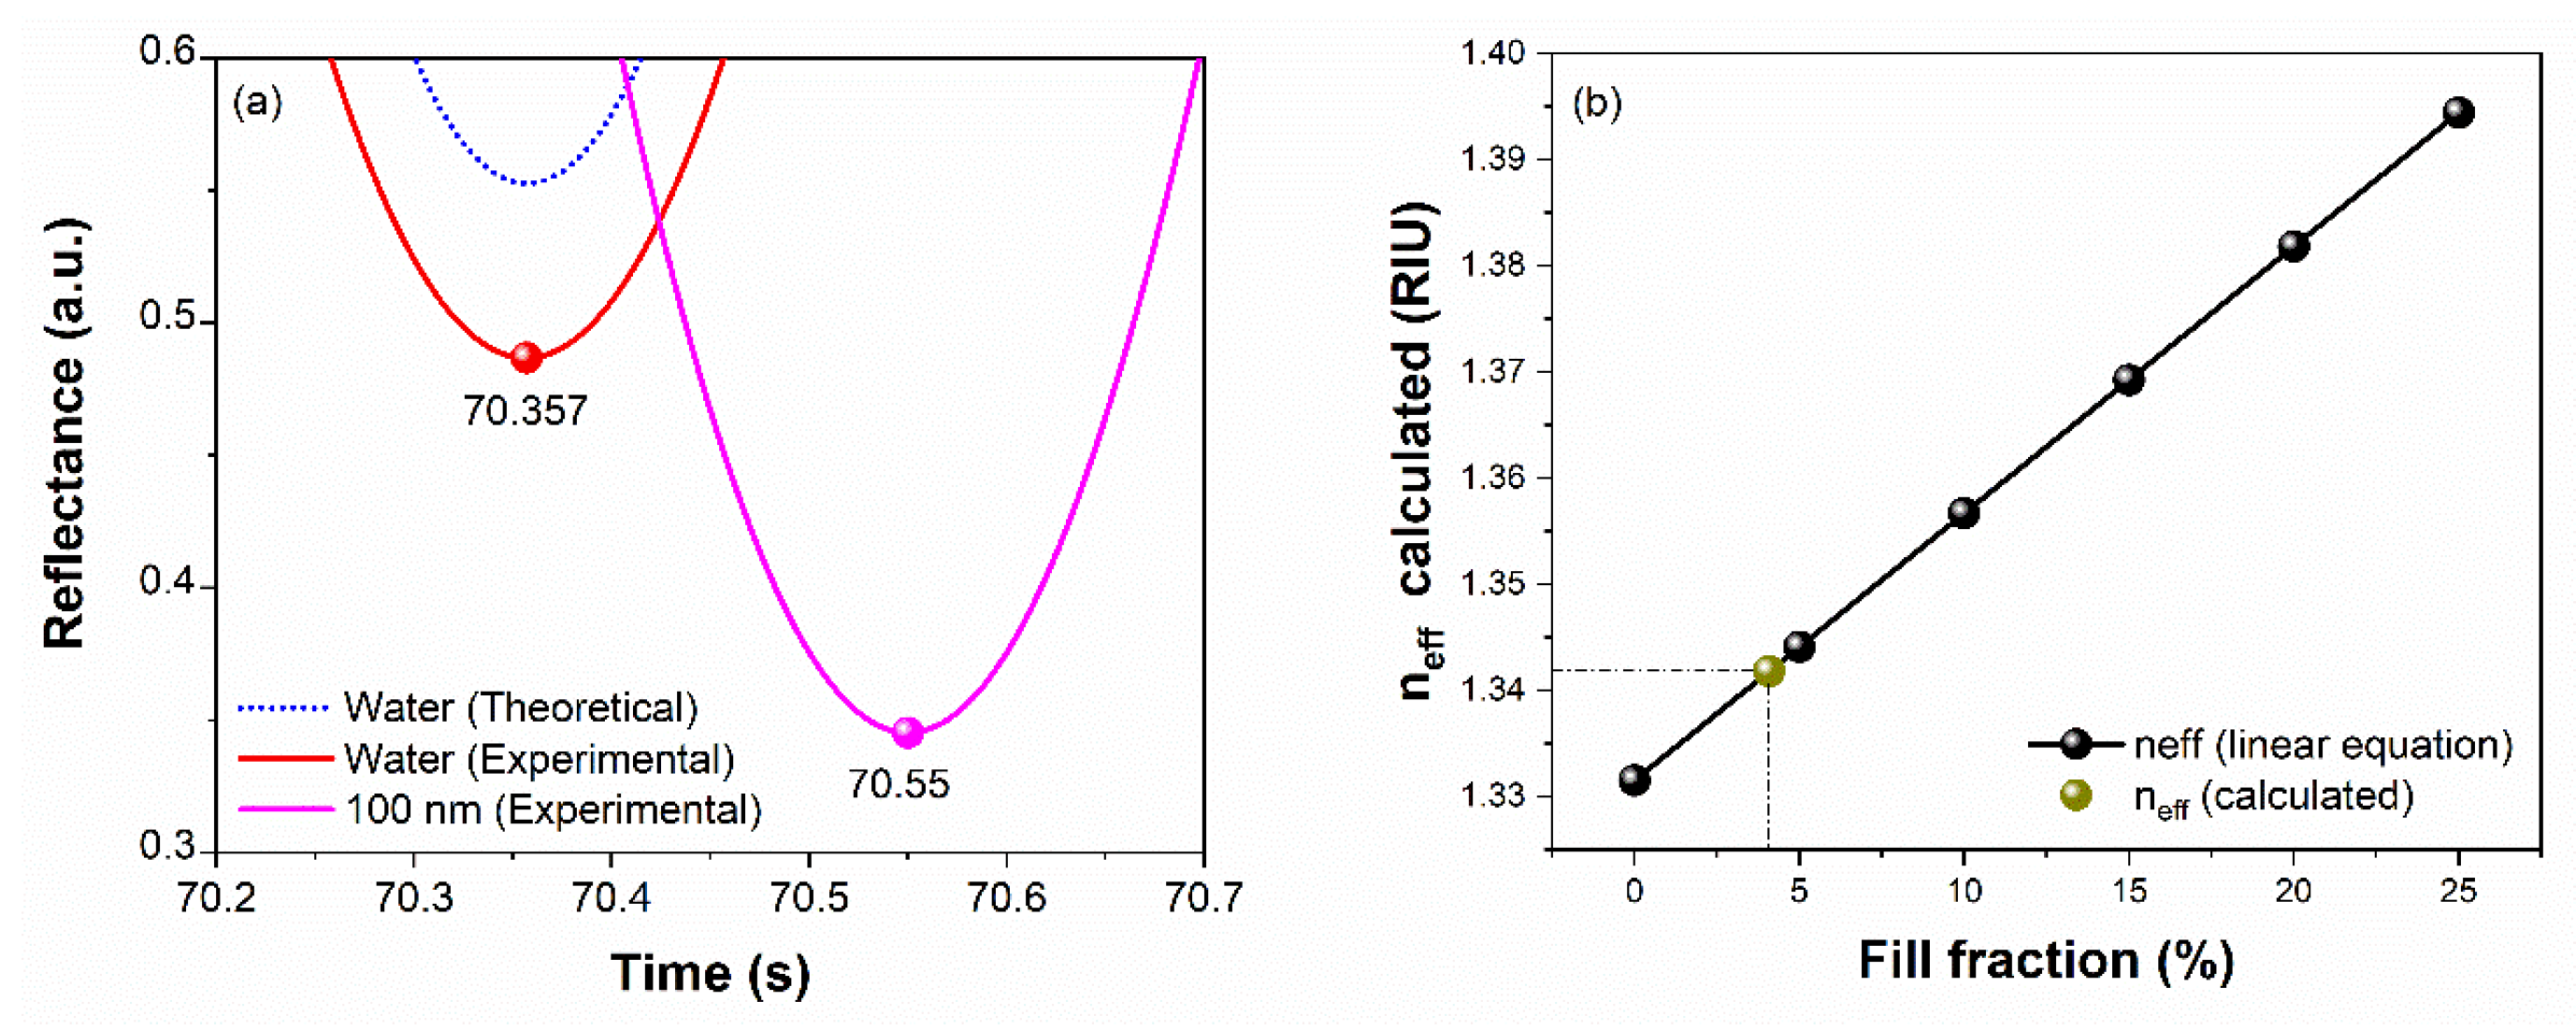
Figure 16.
SPR curve related to FK5 prism with Ag coating and a solution of microplastic of 0.1 y 1 µm of diameter.
Figure 16.
SPR curve related to FK5 prism with Ag coating and a solution of microplastic of 0.1 y 1 µm of diameter.
Disclaimer/Publisher’s Note: The statements, opinions and data contained in all publications are solely those of the individual author(s) and contributor(s) and not of MDPI and/or the editor(s). MDPI and/or the editor(s) disclaim responsibility for any injury to people or property resulting from any ideas, methods, instructions or products referred to in the content. |
© 2024 by the authors. Licensee MDPI, Basel, Switzerland. This article is an open access article distributed under the terms and conditions of the Creative Commons Attribution (CC BY) license (http://creativecommons.org/licenses/by/4.0/).
Copyright: This open access article is published under a Creative Commons CC BY 4.0 license, which permit the free download, distribution, and reuse, provided that the author and preprint are cited in any reuse.


