Submitted:
07 September 2024
Posted:
09 September 2024
You are already at the latest version
Abstract
The electrochemical investigation of 1,2- and 1,4-dihydroxybenzenes was carried out with platinum macro- and microelectrode by using the square wave and cyclic voltammetry techniques. On the other hand the effect of the two solvents acetic acid and ethyl acetate were compared. By using square wave voltammetry signals showed up only at lower frequencies and in excess of supporting electrolyte as it was expected due to the relatively low permittivities of the used solvents. The behaviour of hydroquinone and catechol did not differ significantly from that of their derivatives (dihydroxybenzaldehydes, dihydroxybenzoic acids and 2’,5’-dihydroxyacetophenone). When the cyclic voltammetric examinations with microelectrode were extended to higher anodic potentials the electrode fouling was very significant in ethyl acetate after the potential region of steady-state oxidation to the corresponding quinone. The substituent effect was not significant also here rather the position of the two hydroxyl groups in the benzene ring. Contrarily, the positions had dramatic influence on the susceptibility to electropolymerization as 1,2-dihydroxybenzenes independently on the nature of substituent in the benzene ring deactivated the electrode while 1,4-dihydroxybenzenes did not possibly due to the different solubilities of polymers formed from the primary oxidation product quinones.
Keywords:
dihydroxybenzenes
; acetic acid
; ethyl acetate
; mcroelectrode
; voltammetry
1. Introduction
The derivatives of dihydroxybenzenes have been examined in many applications due to their favourable redox properties especially when the two hydroxyl groups are in 1,2 and 1,4 positions. The role of substituent in the benzene rings is highlighted in the solvation properties of the substrate and its electropolymer. For example the presence of carboxyl group in dihydroxybenzoic acids makes possible their investigations in aqueous environments. The reason is their pKa values which are predominantly between 2 and 3 making possible high degree of dissociation. Generally, 1,2- and 1,4-dihydroxybenzenes undergo a reversible two-electron oxidation-reduction reaction followed by transfer of protons but the proton number depends on the pH thus their reaction becomes pH-independent in strongly basic conditions. This was shown in a work for dihydroxybenzoic acids [1] and furthermore the oxidation product quinones can be oxidized further to hydroxylated derivative on glassy carbon electrode. As dihydroxybenzoic acids can be soluted in water in significant amount analytical methods have been developed for their quantification with modified electrodes [2,3,4,5,6,7]. The carboxy derivatives of dihydroxybenzenes also serve as starting materials for electrosynthesis reactions like as in the presence of acetylacetone they offer a possibility for green synthesis of benzofuran derivatives [8].
In the electropolymerization reactions phenols have predominant role mainly the compounds having only one hydroxyl group in the benzene ring. Therefore the literature of phenols is very large thanks to the many possibilities of applications like corrosion barrier deposits, size exclusion polymer and electrode modifying layer in determination of compounds. On the other hand, dihydroxybenzenes containing the two hydroxyl groups in the 1,3 positions relative to each other are resorcinol and its derivatives and they are very susceptible to electrode fouling when they are electrochemically oxidized. In a recent work we investigated 3,5-dihydroxybenzoic acid and 2’,6’-dihydroxyacetophenone as resorcinol derivatives in dimethyl sulfoxide and the latter formed only a deposit showing the high importance of solvent in solvation of the formed oligomers on the electrodes [9]. The layer formed from the acetophenone derivative proved very useful in alleviating the current noise originating from the stirring of solution so reliable amperometric methods can be developed by utilizing it as modifying layer.
Generally, when phenols undergo anodic oxidation for initialization of polymerization the presence of a phenol or resorcinol part is required inside of the monomer. As in each case not only the nature of monomer and solvent but monomer concentration, solution pH and presence of additives can also influence the process leading to deposit growth on electrodes therefore these reactions must be optimized. By using cyclic voltammetry changing the number of cycles and by using potentiostatic methods changing the electrolysis time the thickness of coverages are controlled and this is also a factor necessary for the optimization. The natural antioxidants are widely examined in polymer formation and polymeric coverages of p-coumaric acid and naringin have electroactive behavior [10,11]. For the electrochemical activity the catechol fragment found in both molecules is responsible and appearance of peak pair reinforced it and by each scan rates anodic and cathodic peaks had practically the same height. These deposits usually have electocatalytic property as the quinone moieties in the oxidized form may act as redox mediator in case of numerous analytes.
The solubilities of dihydroxybenzaldehydes are highly limited in aqueous phases but it significantly depends also on the solution pH. When it is basic this allows their utilization in water. As their electropolymers have very scarce solubility in aqueous environment their excellent capability in redox mediated processes are utilized especially 3,4-dihydroxybenzaldehyde. The latter compound is electrochemically polymerized on the surface of glassy carbon electrode and the modified electrodes showed analytical usefulness in quantification of NADH [12,13,14], fructose [15], ascorbic acid [16], L-lactate [17], formiate and glucose-6-phosphate [18], L-phenylalanine [19], NADH and ascorbate [20], hydrazines [21,22]. The electron transfer between electrode and solution due to covalently bound 2,5-dihydroxybenzaldehyde part elevated also the development of a glucose fuel cell containing bioanode which was the modified electrode [23].
For more decades low permittivity solvents have been studied due to more reasons and acetic acid has a relative permittivity of 6.2, furthermore for ethyl acetate it is 6.0814 [24]. These two solvents readily dissolve hydrophobic compounds and their apolar matrix if necessary and have relatively wide potential window for oxidation reactions. Glacial acetic acid serves an appropriate environment for utilization of favourable properties of acetate salts as acetate ion is a strong base in this condition and its addition to acetic acid contributes to the significant improvement of analytical techniques. For example in the work of Michalkiewicz et. al. acetate electrolyte served as an excellent choice in determination of apocynin [25]. The increase of molar fraction of acetic acid in acetic acid-water mixtures leads to the increase of oxidation potential of benzylamines suggesting that the transition state is polar [26]. The permittivity can be increased by mixing acetic acid with a higher permittivity solvent so in this way the preservation of favourable solvation properties for apolar compounds parabens elevated their voltammetric determination in acetic acid-acetonitrile mixture [27]. The acetic acid as solvent proved also useful for the electroanalysis of α-tocopherol [28]. Ethyl acetate has limited miscibility with water so in the work of Hardcastle et. al. this solvent was utilized in solvent extraction for determination of copper ions in aqueous samples with the aid of a complexing ligand [29]. However acetic acid showed its useful properties in anodic reactions of numerous soluted materials, in the cathodic potential range it has electroactivity and here its concentration can be determined due to the reduction of its acidic proton. Through this cathodic reaction investigation of its adsorption on activated carbon was possible [30].
However, previous studies focused mainly on the electrocatalytic properties of dihydroxybenzenes and on their analysis, in this work a procedure is provided how to make estimations regarding the composition of a solvent mixture by using the voltammograms of a redox active compound.
2. Materials and Methods
In the entire work HPLC grade solvents were used and solute materials has analytical reagent grade. For the voltammetric experiments tetrabutylammonium perchlorate (TBAP) was used as the supporting electrolyte. Platinum electrodes (1 mm in diameter Pt disc macro- and 25 μm microelectrode) served as working electrodes, a platinum-iridium wire was the counter electrode and a silver wire was the reference electrode. The three electrodes were comprised in a voltammetric cell which was always a glass vial and they were connected to a Dropsens potentiostat (Spain, Oviedo).
Before each measurement the surfaces of working electrodes were polished with an aqueous suspension of alumina presenting on a polishing cloth. After thorough washing with deionized water they were ultrasonicated to remove the residual contaminants arising from polishing. Finally the electrodes were dried with thorough washing with dry acetone to remove water traces for minimizing the introduction of water into the studied solutions.
3. Results and Discussion
3.1. Square Wave Voltammetric Investigations of Dihydroxybenzenes in Acetic Acid and Ethyl Acetate
In electroanalytical chemistry the technique square wave voltammetry is widely used due to its relatively high sensitivity. The utilization of square wave potential program led to the development of powerful analytical procedures. As a matter of fact square wave voltammetry developed to a powerful technique to minimize the disturbance of the background current, in other words to reduce markedly the signal to noise ratio. For example in the work of Hooper et. al. such a potential program was used for time dependent amperometric detection of selected analytes coupled with capillary electrophoresis [31]. The used technique ensured a high degree of separation of signal from the disturbance caused by the electric field attributable to the electrophoresis being necessary for the analyte separation.
The dependence of heights of current signals on the frequencies are revealed in Figure 1. Obviously, only very low frequencies can provide useful curves for the characterization and analysis of compounds. At higher frequencies than 10 Hz each information will be lost. This phenomenon can be elucidated by knowledge of low permittivity of the examined solvents as a consequence, solution resistance will be enhanced. Usually, if we want to increase the sensitivity as possible setting the height of pulse potential Epulse to the maximum value is advantageous due to the elevated diffusion flux to the electrode. Thus by applying a potential pulse at high frequencies the time will be shortened for it leading to increased condenser currents compared with the cases when very low frequencies are applied. On the other hand due to the high solution resistance by reading from the exponential expression of the time constant e-t/RC the whole expression takes a low value (R is solution resistance, C is electrode capacitance). As a result, the condenser current drops slowly in time as it is proportional to it. In this technique immediately after the application of the first pulse a reverse pulse is applied leading to practically the same condenser current by taking the differences of their absolute values. As at higher frequencies these differences are large we can see them comprised into a flat curve. As a further contribution to these observations the oxidized product can be reduced very fast back to the analyte.
As a further verification of the above investigations square wave measurements were carried out with macroelectrode in both solvents by varying the concentration of supporting electrolyte and setting 1 Hz frequency. The concentration of the redox active compound 2,5-dihydroxybenzoic acid was increased to 5 mM so the voltammetric peak will be more visible. As Figure 2 shows the low supporting electrolyte concentration leads to flat curves and the peak becomes more and more sharper when its concentration is enhanced. The solution resistance decreased and consequently the ohmic potential drop so more and more higher pulse potential could be imposed to the electrode. Meanwhile The pulse heights entered the diffusion controlled range thus leading to sharper peaks. Basically, between acetic acid and ethyl acetate there is not significant difference, only the peak potentials shifted a little to more positive values in ethyl acetate. The reason is possibly for that the reduced solvation ability of ethyl acetate molecules for the transition state. The other difference is that curves begin to have a peak only around 40 mM TBAP concentration. This suggests that this is an appropriate solvent of the associated ionic pairs of supporting electrolyte thus decreasing the degree of dissociation.
3.2. Microelectrode Studies of 1,2- and 1,4-Dihydroxybenzenes in Acetic Acid and Ethyl Acetate
The reduction of the electrode size to the micrometer dimensions provides numerous advantages in low permittivity solvents. For decades there has been a considerable interest in application of microelectrodes which make possible the examination of electrochemical reactions in such media and moreover in conditions where no supporting electrolyte is added purposely. In the latter case an “excess electrolyte zone” develops in front of electrode from the presenting ionic impurities. The most important advantage of the use of microelectrodes in such conditions the significant reduction of ohmic potential drop. Its magnitude depends on the solution resistance and the expected current signal. Regarding the shape there exist more types of micrometer sized electrodes for example microdisc, cylindrical and microband electrodes. In electroanalytical procedures the cylindrical microelectrodes are frequently used whose diameter is in the micrometer range and their length is generally some millimeter. The reason is the minimized influence of imperfections in the interface between the sealing insulating material and electrode. The carbon microfiber electrode was applied successfully in two works of Pingarrón’s research group in determination of vanillin [32] and the pesticide thiram in ethyl acetate [33]. Platinum microelectrodes provided a good option for determination of tocopherols and α-tocopheryl acetate in acetic acid [34] and furthermore in the same solvent the antioxidants tert-butylhydroquinone, tert-butyl-4-hydroxyanisole and butylated hydroxytoluene were successfully quantified with pulsed voltammetric techniques [35].
It could be observed in the previous section that by using square wave voltammetry with macroelectrode there was not significant difference between curves in acetic acid and ethyl acetate. Therefore, it would be very difficult to make consequences for solvent composition. As by using square wave voltammetry the studies result in peaks always in excess of supporting electrolyte independently on the electrode size and of course, if the frequency is sufficiently low. Therefore cyclic voltammetry was applied. If there is no complication and the scan rate is not too high we obtain a sigmoidal curve. Its shape can be distorted if as a consequence of electrode reaction surface blocking occurs. Platinum microdisc electrode was used as this type can be renewed by polishing if necessary. The microelectrode voltammetric curves are displayed in Figure 3 for more 1,2- and 1,4-dihydroxybenzenes by varying the substrate concentration between 5 and 25 mM incrementally with 5 mM by the steady 50 mM supporting electrolyte concentration and extending the potential window to 3.5 V with 100 mV/s scan rate. The derivatives bearing formyl, carboxyl and acetyl groups and the bare substrates are compared. Basically, by taking a look onto the figures the nature of substituents resulted practically no differences and their absence, neither. The visible difference could be observed in shape of curves between dihydroxybenzenes where position of the two hydroxyl groups differed mainly in ethyl acetate solvent. For the 1,4-dihydroxybenzenes sigmoidal shaped voltammograms could be recorded in ethyl acetate independently on the concentration. In contrast, in case of the 1,2-dihydroxybenzenes well developed peaks appeared in the same solvent. Additionally, the ohmic potential drops increase very significantly in ethyl acetate with substrate concentration as plateaus are shifted very visibly to higher potentials where such signals appeared which is well noticeable by hydroquinone and its derivatives.
However, in acetic acid plateaus appeared also by studying the 1,2-dihydroxybenzenes, small current drops showed up after them indicating that a surface blocking process began but after that the background current of solvent could be seen with similarly sharp enhancement as in case of 1,4-dihydroxybenzenes. These findings are predominantly due to the Kolbe reaction of solvent molecules leading to decarboxylation. Overall the extension of the potential window made possible the better differentiation between the two low permittivity solvent. For the appearance of plateaus the oxidation reaction producing quinones is responsible and this product can be further oxidized to polymeric products. As formation of radicals leading to organic deposit occurs simultaneously with the formation of acetyl radicals from acetic acid they can also terminate and therefore inhibit the deactivation of electrode. Analyzing the shape of voltammograms there is not any sign of polymer formation from quinones of 1,4-dihydroxybenzenes. Where hydroxyl groups were in 1,2-position in the backward scan small peaks appeared more visibly in ethyl acetate suggesting the rupture of deposits allowing the penetration for more reactant as their potentials are in the range of their diffusion controlled process. These observations are in accorbance with the earlier results with 3,4-dihydroxybenzaldehyde as catechol derivative.
3.2. Effect of Composition of Acetic Acid-Ethyl Acetate Mixtures on the Microelectrode Voltammograms of Catechol
In the earlier section it could be established that the curvature of microelectrode voltammograms of 1,2-dihydroxybenzenes were very different especially in ethyl acetate from that of 1,4-dihydroxybenzenes. Therefore the simplest 1,2-dihydroxybenzene catechol was chosen for the further studies. Furthermore the peak sharpness reached the highest value at 25 mM substrate concentration of the studied ones therefore this concentration was chosen as steady value by 50 mM supporting electrolyte.
The procedure involves the cleaning of microelectrode before each experiment as described in Materials and methods section. After the preparation of the stock solutions the necessary volumes were pipetted into clean vials and the volumes were completed with pure acetic acid and ethyl acetate to obtain finally the desired solvent composition in v/v%. Then the voltammetric curves were recorded in each solutions using the platinum microelectrode as working electrode.
The obtained voltammograms are displayed in Figure 4 in solutions where the solvent compositions were varied between 0 and 100 % for both solvents. In accordance with the previous findings in solutions where the ethyl acetate content was high anodic peaks appeared. The height and sharphess of these peaks decreased elevating the acetic acid content. In compositions where acetic acid content exceeded the amount of ethyl acetate similar voltammograms could be measured with plateaus as in acetic acid. In the concentration range between 50 and 100 % for acetic acid simply the dependence on the viscosity of solutions could be seen in the decreasing of plateau current heights.
It is noteworthy to emphasize the high difference of peak potential in ethyl acetate between that of curves taken in acetic acid containing mixtures. This suggests that the microenvironment of transition state of charge transfer reaction consists mainly of acetic acid molecules making easier it. This shift in ethyl acetate could be observed previously by all derivatives of catechol compared with acetic acid.
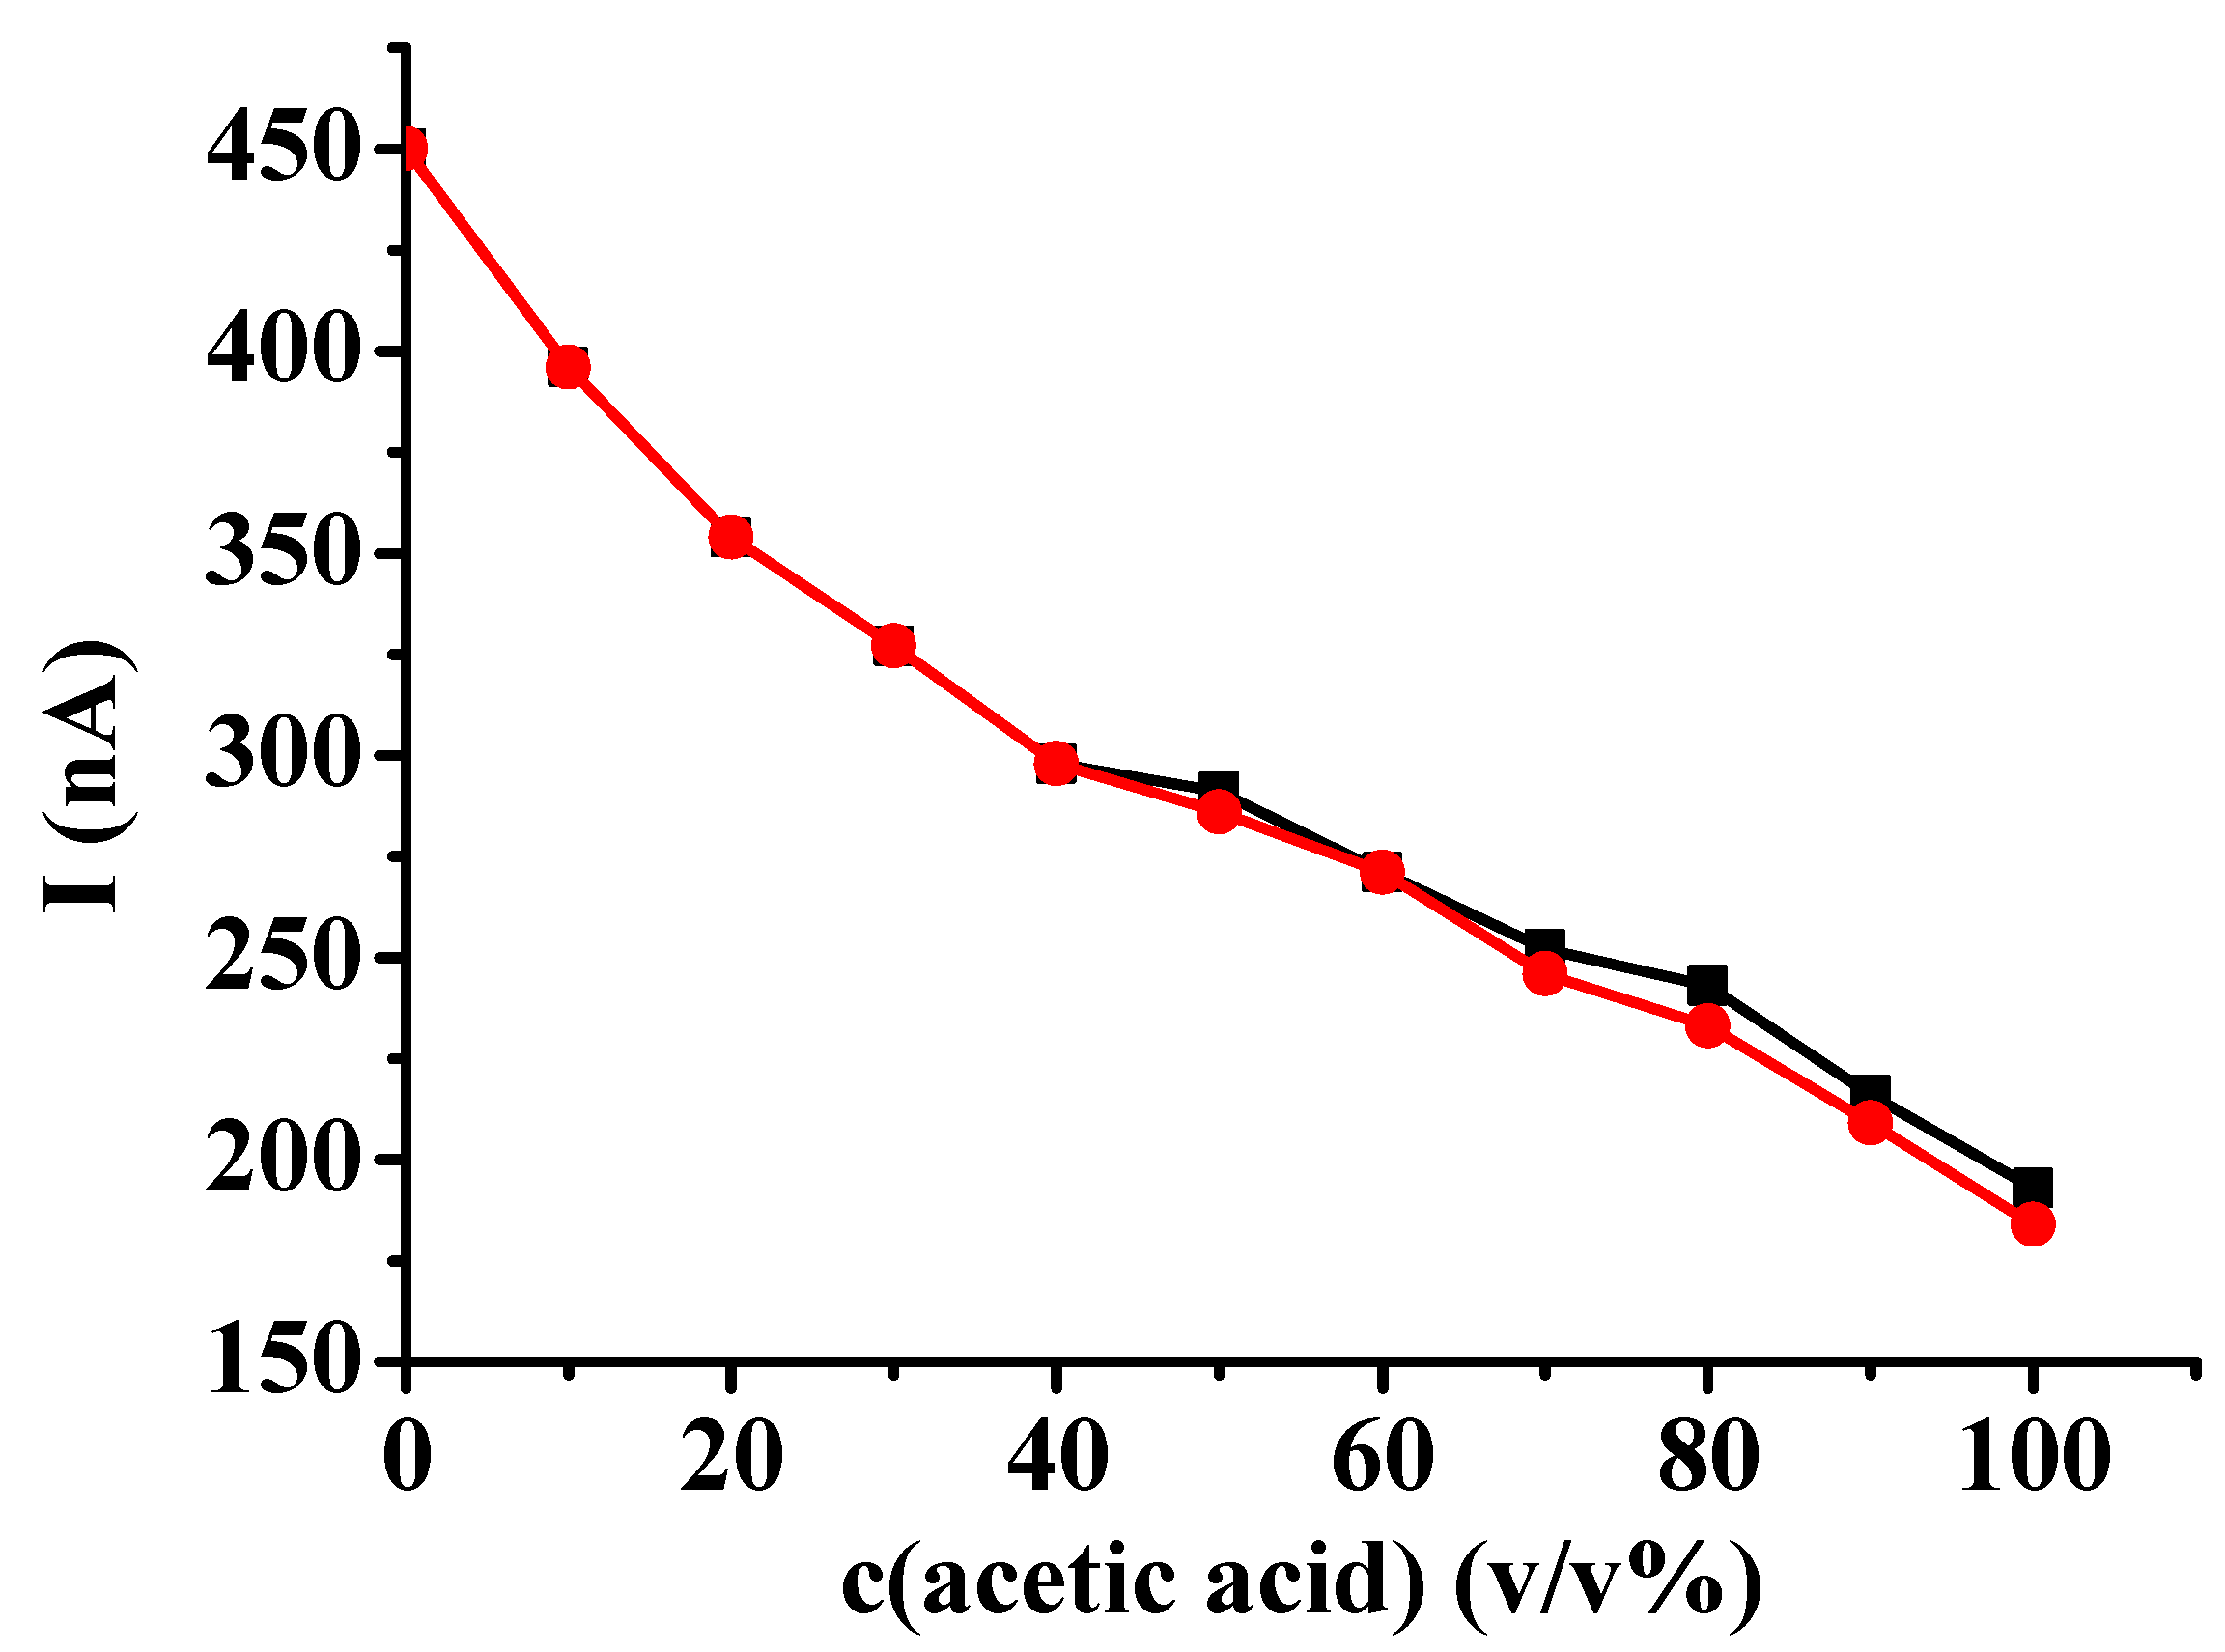
Two types of calibrations were used to decide which shows more sensitively the changes. One of the data series comprised the maximum currents and the other one involved the plateau currents instead of the maximum currents where they appeared. As it can be seen in Figure 5 the latter showed higher differences between the different compositions. It clearly shows also that the electropolymerization reaction has high sensitivity towards the presence of acetic acid when its percentage was smaller. The two curves run together in this range as of course only peaks appeared.
As a summary, the cyclic voltammetric studies highlight that in many cases the degree of deviation from the regular voltammograms helps in estimating the solvent composition and electropolymerization reactions are also appropriate to trigger such characteristic curvature of curves.
4. Conclusions
As it was shown here the mostly undesired process electrode deactivation caused by polymerization can be utilized in an analytical procedure. The differences in the solvation abilities of the two solvents towards products can have usefulness so the appropriate choice of a redox active molecule having some degree of susceptibility to polymerization may provide possibility to make composition estimations in other mixtures.
Author Contributions
Conceptualization, methodology, investigation, writing—original draft preparation, supervision, L.K. All authors have read and agreed to the published version of the manuscript.
Funding
This research was funded by the Hungarian National Research Development and Innovation Office (NKFI), grant number NKFI-137793, Fundamental Research Funds for the Central Univer-sities of China (20720230012) and by the New National Excellence Program of the Ministry for In-novation and Technology Project no. TKP2021-EGA-17.
Institutional Review Board Statement
Not applicable.
Data Availability Statement
The data presented in this study are available on request from the corresponding author.
Conflicts of Interest
The authors declare no conflicts of interest.
References
- Beginejad, H.; Nematollahi, D.; Varmaghani, F.; Shayani-Jam, H. Investigation of the electrochemical behavior of some dihydroxybenzoic acids in aqueous solution. Monatsh. Chem. 2013, 144, 1481–1488. [Google Scholar] [CrossRef]
- Zhu, M.; Ye, H.; Lai, M.; Ye, J.; Li, R.; Zhang, W.; Liang, H.; Zhu, R.; Fan, H.; Chen, S. The gold nanoparticle sensitized pRGO-MWCNTs grid modified carbon fiber microelectrode as an efficient sensor system for simultaneous detection of three dihydroxybenzoic acid isomers. Electrochim. Acta 2019, 322, 134765. [Google Scholar] [CrossRef]
- Zhou, H.; Cui, M.; Zhao, Y.; Wang, C.; Song, Q. Preparation of Nitrogen and FeP Doped Carbon Nanotubes for Selective and Simultaneous Electrochemical Detection of Dihydroxybenzoic Acid Isomers. Electrochim. Acta 2017, 242, 107–116. [Google Scholar] [CrossRef]
- Van Berkel, G.J.; Kertesz, V. Expanded Electrochemical Capabilities of the Electrospray Ion Source Using Porous Flow-Through Electrodes as the Upstream Ground and Emitter High-Voltage Contact. Anal. Chem. 2005, 77, 8041–8049. [Google Scholar] [CrossRef]
- Sun, W.; Jiang, Q.; Xi, M.; Jiao, K. Determination of 3, 4-dihydroxybenzoic acid by electrocatalytic oxidation at an ionic liquid modified electrode. Microchim. Acta 2009, 166, 343–348. [Google Scholar] [CrossRef]
- Moghaddam, A.B.; Ganjali, M.R.; Dinarvand, R.; Razavi, T.; Riahi, S.; Rezaei-Zarchi, S.; Norouzi, P. Fabrication and electrochemical behavior of single-walled carbon nanotube/graphitebased electrode. Mater. Sci. Eng. C 2009, 29, 187–192. [Google Scholar] [CrossRef]
- Islam, M.A.; Lam, S.C.; Li, Y.; Mostafa, A.A.; Mahbub, P.; Nesterenko, P.M.; Paull, B. ; Macka, M Capillary gap flow cell as capillary-end electrochemical detector in flow-based analysis. Electrochim. Acta 2019, 303, 85–93. [Google Scholar] [CrossRef]
- Nematollahi, D.; Rafiee, M. Diversity in electrochemical oxidation of dihydroxybenzoic acids in the presence of acetylacetone. A green method for synthesis of new benzofuran derivatives. Green Chem. 2005, 7, 638–644. [Google Scholar] [CrossRef]
- Kiss, L.; Li, H.; Y. Hui, Kunsági-Máté, S. Comparison between Electropolymers of 3,5-Dihydroxybenzoic Acid and 2′,6′-Dihydroxyacetophenone in Dimethyl Sulfoxide and Their Analytical Performance towards Selected Analytes with the Role of the Washing Liquid. Molecules 2024, 29, 3972. [Google Scholar] [CrossRef]
- Ziyatdinova, G.K.; Guss, E.; Budnikov, H. Selective electrochemical sensor based on the electropolymerized p-coumaric acid for the direct determination of L-cysteine. Electrochim. Acta 2018, 270, 369–377. [Google Scholar] [CrossRef]
- Ziyatdinova, G.K.; Guss, E.V.; Yakupova, E.N.; Budnikov, H.C. An electrode based on electropolymerized naringin for voltammetry. Uchenye Zap. Kazan. Univ. Seriya Estestv. Nauk. 2019, 161, 5–19. [Google Scholar] [CrossRef]
- Ding, W.; Si, M.R.; Zhang, W.P.; Zhang, Y.L.; Chen, C.; Zhang, L.; Lu, Z.Q.; Chen, S.L.; Shen, X.H. Functional characterization of a vanillin dehydrogenase in Corynebacterium glutamicum. Sci. Rep. 2015, 5, 8044. [Google Scholar] [CrossRef] [PubMed]
- Délécouls-Servat, K.; Bergel, A.; Basséguy, R. Surface-modified electrodes for NADH oxidation in oxidoreductase-catalysed synthesis. J. Appl. Electrochem. 2001, 31, 1095–1101. [Google Scholar] [CrossRef]
- Manjón, A.; Obón, J.M.; Casanova, P.; Fernández, V.M.; Ilborra, J.L. Increased activity of glucose dehydrogenase co-immobilized with a redox mediator in a bioreactor with electrochemical NAD+ regeneration. Biotechnol. Lett. 2002, 24, 1227–1232. [Google Scholar] [CrossRef]
- Antiochia, R.; Lavagnini, I.; Magno, F. Amperometric Mediated Carbon Nanotube Paste Biosensor for Fructose Determination. Anal. Lett. 2004, 37, 1657–1669. [Google Scholar] [CrossRef]
- Delbem, M.F.; Baader, W.J.; Serrano, S.H.P. Mechanism of 3,4-dihydroxybenzaldehyde electropolymerization at carbon paste electrodes – catalytic detection of NADH. Quim. Nova 2002, 25, 741–747. [Google Scholar] [CrossRef]
- Hong, M.; Chang, J.; Yoon, H.C.; Kim, H. Development of a screen-printed amperometric biosensor for the determination of L-lactate dehydrogenase level. Biosens. Bioelectron. 2002, 17, 13–18. [Google Scholar] [CrossRef]
- Tzang, C.; Yuan, R.; Yang, M. Voltammetric biosensors for the determination of formate and glucose-6-phosphate based on the measurement of dehydrogenase-generated NADH and NADPH. Biosens. Bioelectron. 2001, 16, 211–219. [Google Scholar] [CrossRef] [PubMed]
- Naghib, S.M.; Rabiee, M.; Omidinia, E.; Khoshkenar, P. Investigation of a Biosensor Based on Phenylalanine Dehydrogenase Immobilized on a Polymer-Blend Film for Phenylketonuria Diagnosis. Electroanal. 2012, 24, 407–417. [Google Scholar] [CrossRef]
- Pamidi, P.V.A.; Wang, J. Electrocatalysis and Measurements of Hydrazine Compounds at Glassy Carbon Electrodes Coated with Electropolymerized 3,4-Dihydroxybenzaldehyde Films. Electroanal. 1996, 8, 244–247. [Google Scholar] [CrossRef]
- Pariente, F.; Tobalina, F.; Moreno, G.; Hernández, L.; Lorenzo, E.; Abruna, H.D. Mechanistic Studies of the Electrocatalytic Oxidation of NADH and Ascorbate at Glassy Carbon Electrodes Modified with Electrodeposited Films Derived from 3,4-Dihydroxybenzaldehyde. Anal. Chem. 1997, 69, 4056–4075. [Google Scholar] [CrossRef] [PubMed]
- Wang, J.; Chen, Q.; Cepria, G. Electrocatalytic modified electrode for remote monitoring of hydrazines. Talanta 1996, 43, 1387–1391. [Google Scholar] [CrossRef]
- Yu, C.; Yen, M.; Chen, L. A bioanode based on MWCNT/protein-assisted co-immobilization of glucose oxidase and 2,5-dihydroxybenzaldehyde for glucose fuel cells. Biosens. Bioelectron. 2010, 25, 2515–2521. [Google Scholar] [CrossRef]
- Hayness, W. M. CRC Handbook of Chemistry and Physics, 95th ed., CRC Press, Taylor and Francis Group, USA, 2014-2015, Chapter 6, pp. 190–192.
- Michalkiewicz, S.; Skorupa, A.; Jakubczyk, M.; Bebacz, K. Application of a Carbon Fiber Microelectrode as a Sensor for Apocynin Electroanalysis. Materials, 2024, 17, 1593. [Google Scholar] [CrossRef]
- Thitumoorthi, A.; Elango, K.P. Electrochemical oxidation of substituted benzylamines in aquo-acetic acid medium: substituent and solvent effects. J. Chem. Sci. 2007, 119, 289–294. [Google Scholar] [CrossRef]
- Michalkiewicz, S. Anodic oxidation of parabens in acetic acid–acetonitrile solutions. J. Appl. Electrochem. 2013, 43, 85–97. [Google Scholar] [CrossRef]
- Malyszko, J.; Karbarz, M. Electrochemical oxidation of trolox and a-tocopherol in acetic acid: A comparative study. J. Electroanal. Chem. 2006, 595, 136–144. [Google Scholar] [CrossRef]
- Hardcastle, J.L.; Compton, R.G. The electroanalytical detection and determination of copper in heavily passivating media: ultrasonically enhanced solvent extraction by N-benzoyl-N-phenyl-hydroxylamine in ethyl acetate coupled with electrochemical detection by sono-square wave stripping voltammetry analysis. Analyst 2001, 126, 2025–2031. [Google Scholar]
- Li, T.; Xu, J.; Zhou, L.; Wang, L.; Sun, Y.; Cheng, J.; Yuan, M.; Wang, L.; Yue, Y.; Wang, J. Voltammetric Determination of the Adsorption Kinetics of Acetic Acid on Activated Carbon. J. Electrochem. Soc. 2013, 160, H568–H572. [Google Scholar] [CrossRef]
- Hooper, S.E.; Roach, D.; Anderson, M.R. Application of a Square-Wave Potential Program for Time-Dependent Amperometric Detection in Capillary Electrophoresis. Electroanal. 2008, 20, 102–106. [Google Scholar] [CrossRef]
- Agűi, L.; López-Guzmán, J.E.; González-Cortés, A.; Yánez-Sedeno, P.; Pingarrón, J.M. Analytical performance of cylindrical carbon fiber microelectrodes in low-permittivity organic solvents: determination of vanillin in ethyl acetate. Anal. Chim. Acta 1999, 385, 241–248. [Google Scholar] [CrossRef]
- Hernández-Olmos, M.A.; Agüí, L.; Yánez-Sedeno, P.; Pingarrón, J.M. Analytical voltammetry in low-permittivity organic solvents using disk and cylindrical microelectrodes. Determination of thiram in ethyl acetate. Electrochim. Acta 2000, 46, 289–296. [Google Scholar] [CrossRef]
- Michalkiewicz, S.; Tutaj, M.; Kaczor, M.; Malyszko, J. Electrochemical Behavior of Tocopherols on Microelectrodes in Acetic Acid Medium. Electroanal. 2002, 14, 297–302. [Google Scholar] [CrossRef]
- Michalkiewicz, S.; Mechanik, M.; Malyszko, J. Voltammetric Study of Some Synthetic Antioxidants on Platinum Microelectrodes in Acetic Acid Medium. Electroanal. 2004, 16, 588–595. [Google Scholar] [CrossRef]
Figure 1.
Square wave voltammetric curves in 1 mM solutions of 2,5-dihydroxybenzoic acid prepared with acetic acid (a) and ethyl acetate (b) by different frequencies by using 1 mm Pt macroelectrode (supporting electrolyte 50 mM TBAP, Estep=0.03 V, Epulse=0.25 V).
Figure 1.
Square wave voltammetric curves in 1 mM solutions of 2,5-dihydroxybenzoic acid prepared with acetic acid (a) and ethyl acetate (b) by different frequencies by using 1 mm Pt macroelectrode (supporting electrolyte 50 mM TBAP, Estep=0.03 V, Epulse=0.25 V).
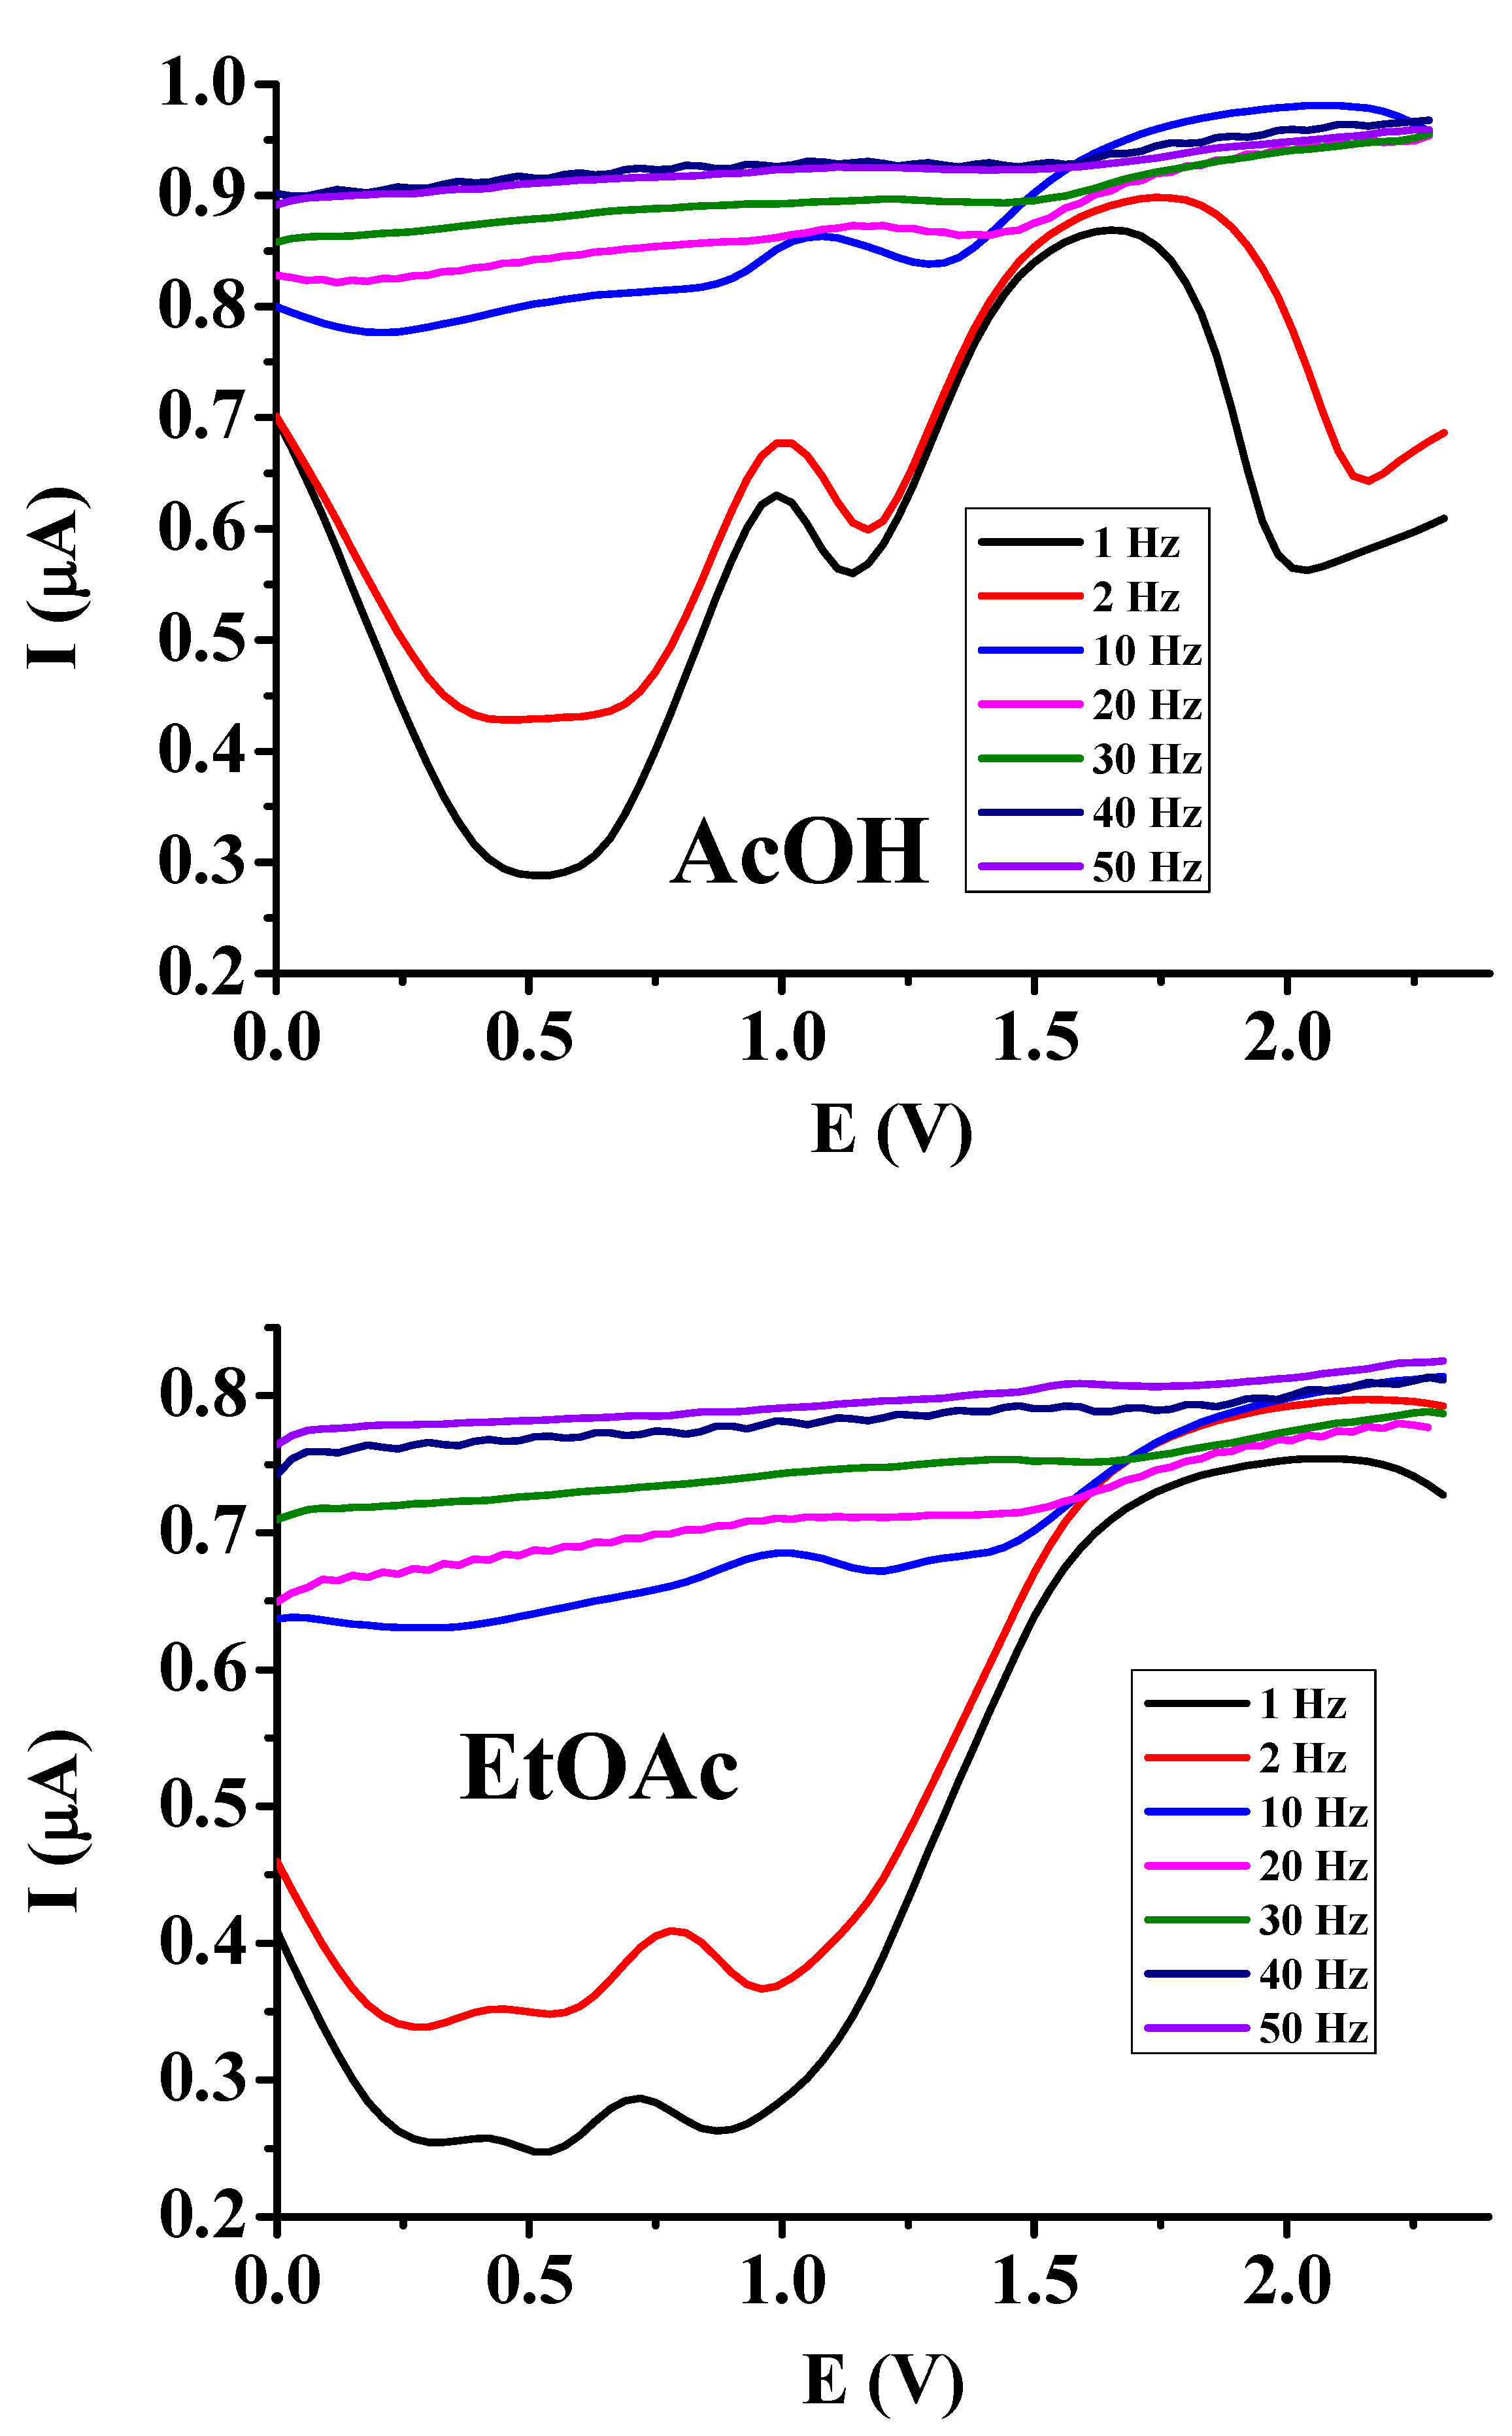
Figure 2.
Dependence of the square wave voltammetric signal of 5 mM 2,5-dihydroxybenzoic acid by different TBAP concentrations in both studied low permittivity solvents, respectively (black: 10, red: 20, blue: 30, magenta: 40, green: 50 mM).
Figure 2.
Dependence of the square wave voltammetric signal of 5 mM 2,5-dihydroxybenzoic acid by different TBAP concentrations in both studied low permittivity solvents, respectively (black: 10, red: 20, blue: 30, magenta: 40, green: 50 mM).
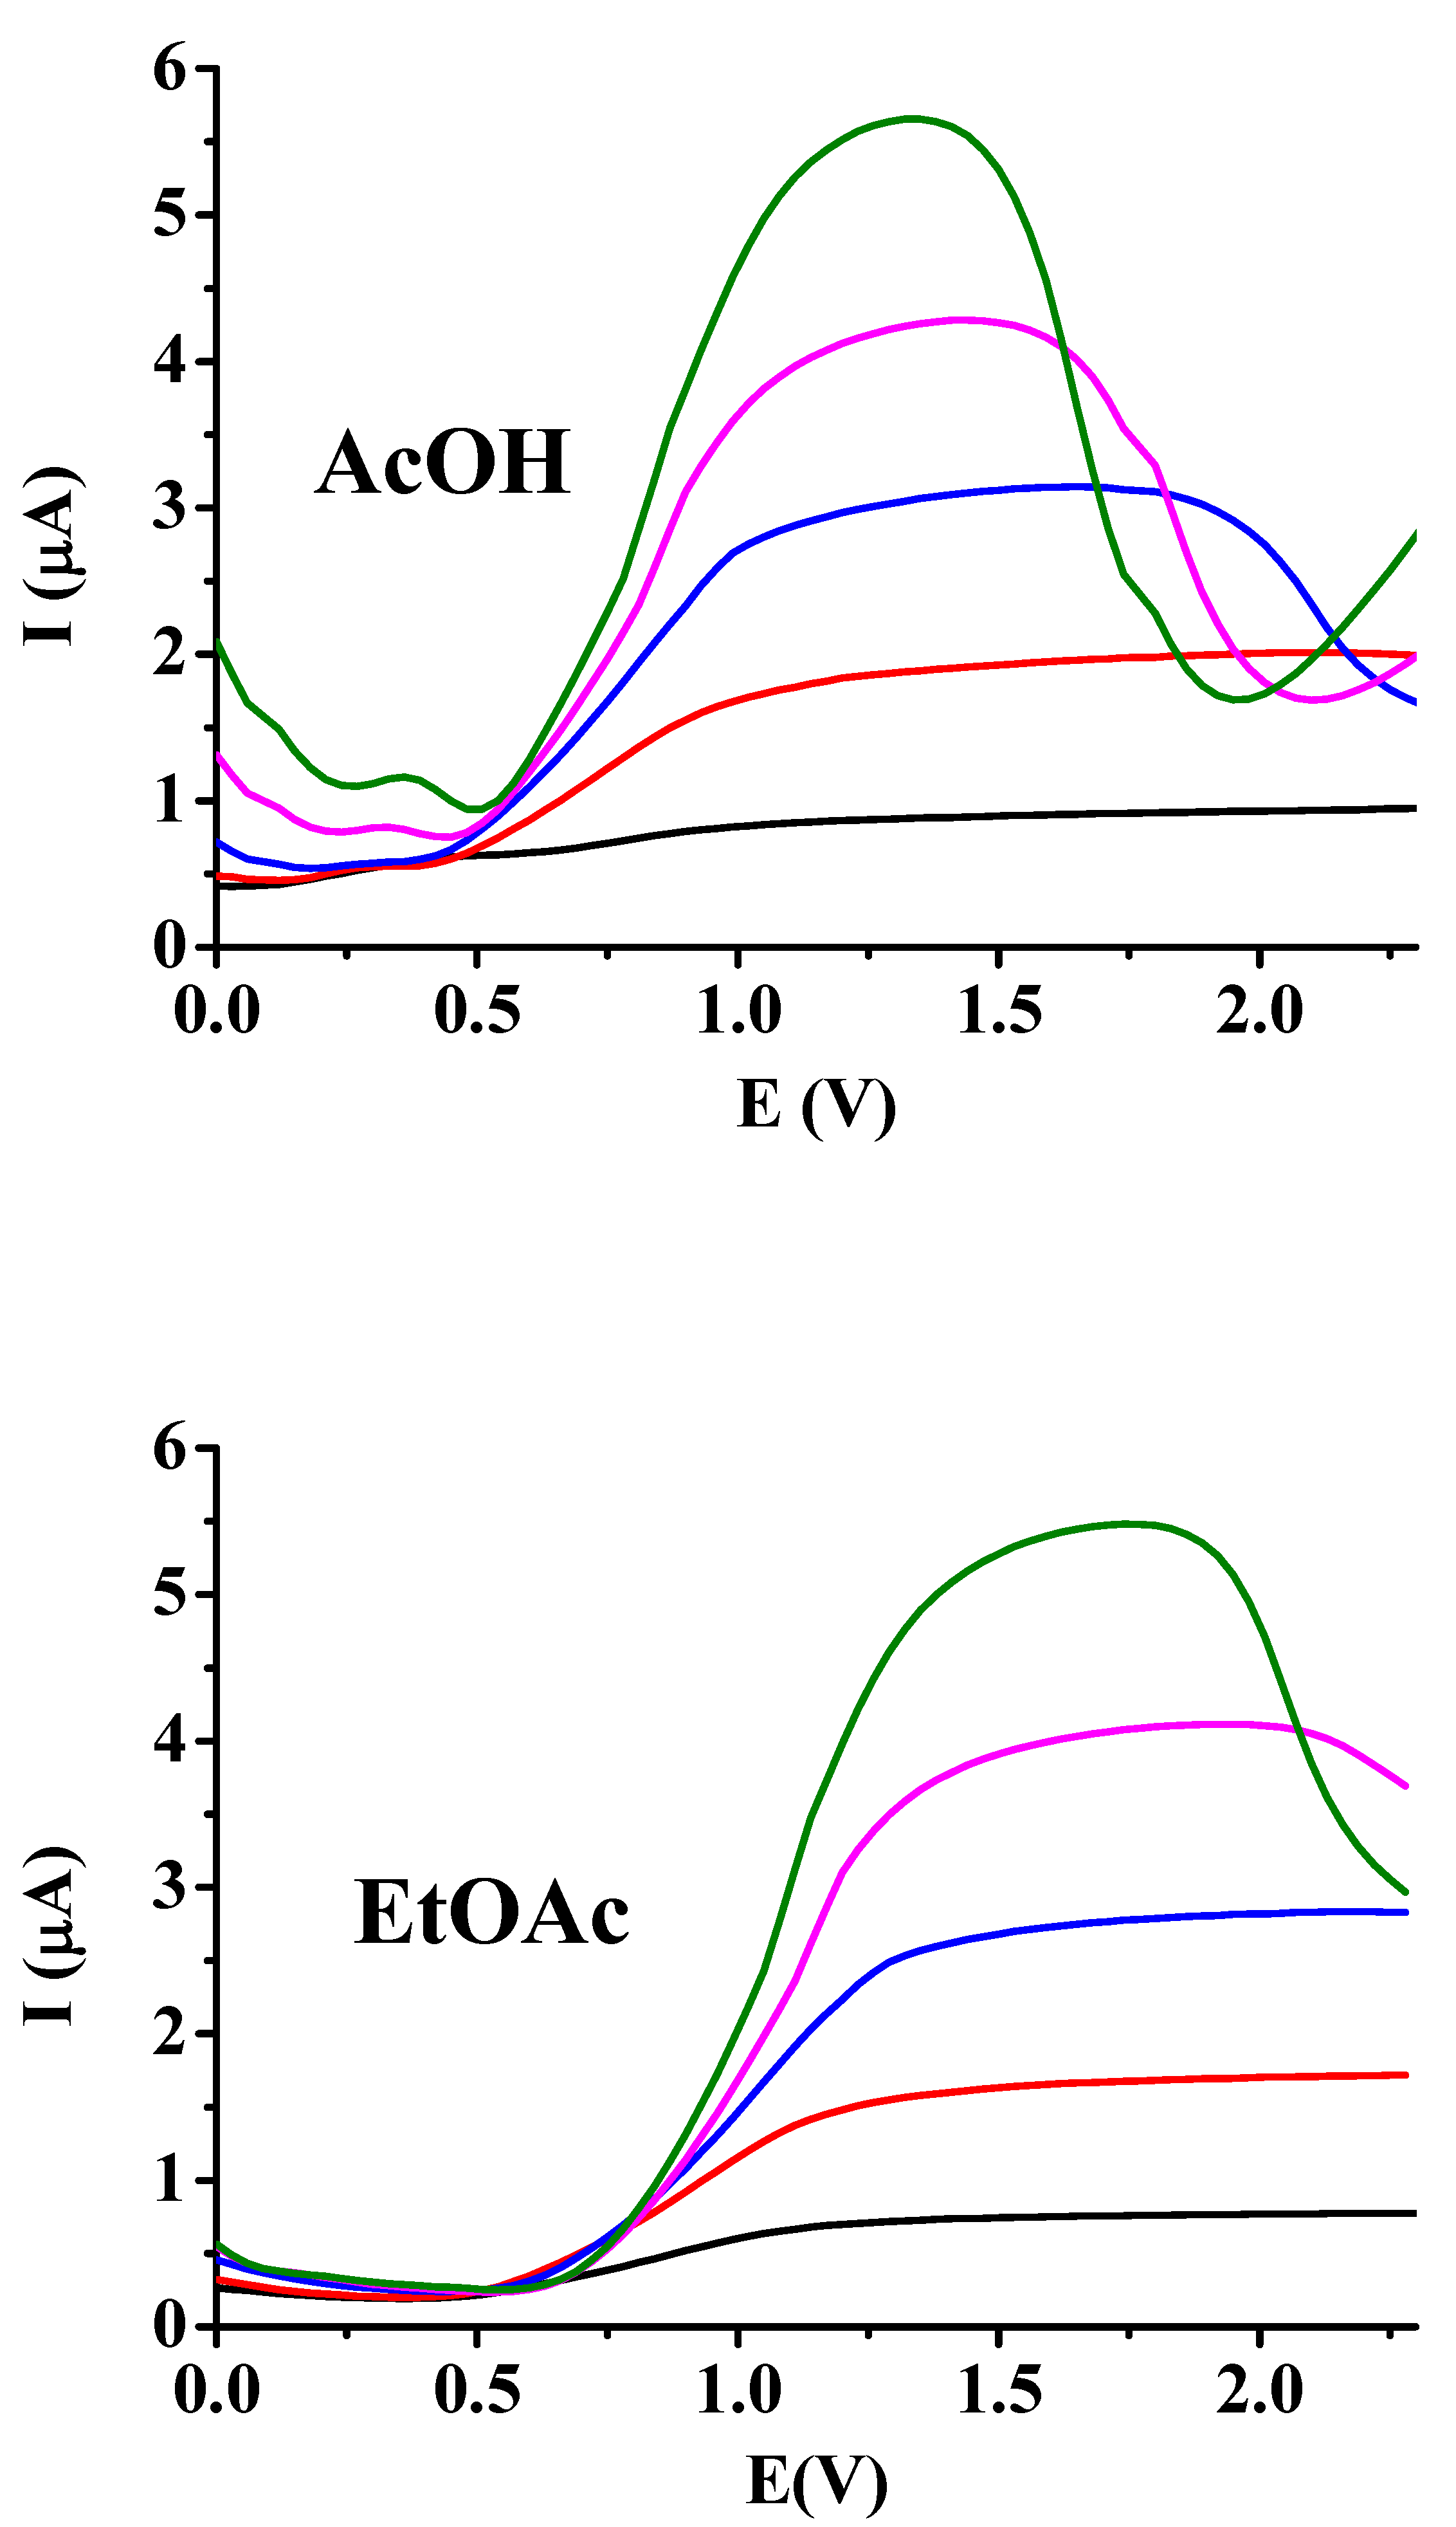
Figure 3.
Effect of substituent and position of hydroxyl groups on the microelectrode voltammograms of 2,5-dihydroxyacetophenone (a), 2,5-dihydroxybenzaldehyde (b), 2,5-dihydroxybenzoic acid (c), hydroquinone (d), 2,3-dihydroxybenzaldehyde (e), 2,3-dihydroxybenzoic acid (f), catechol (g) in acetic acid (main graph) and ethyl acetate (inset graphs).
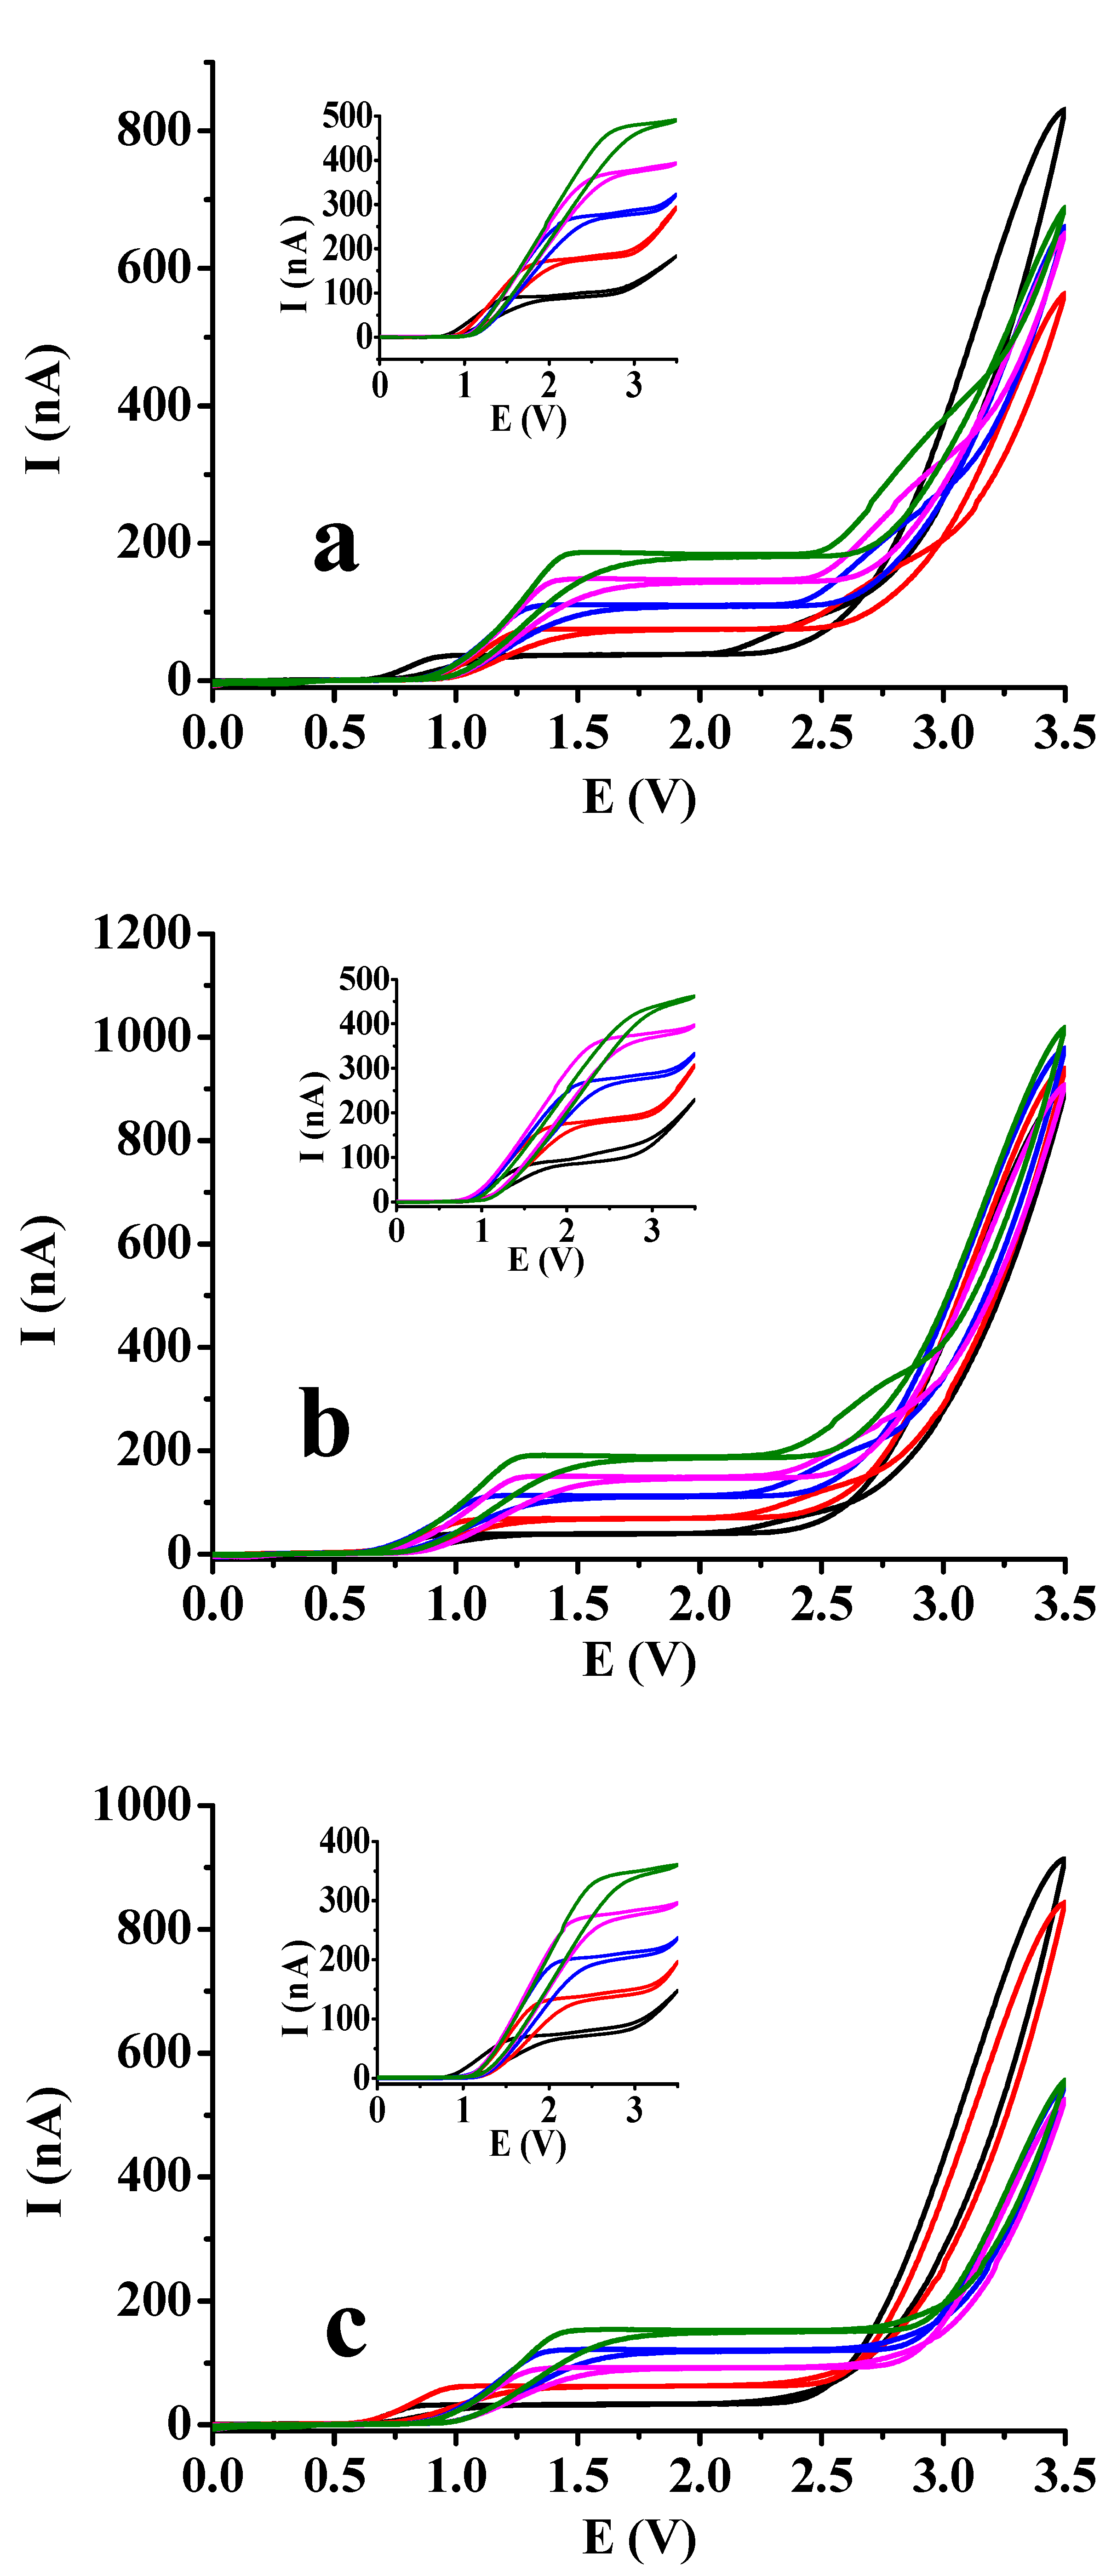
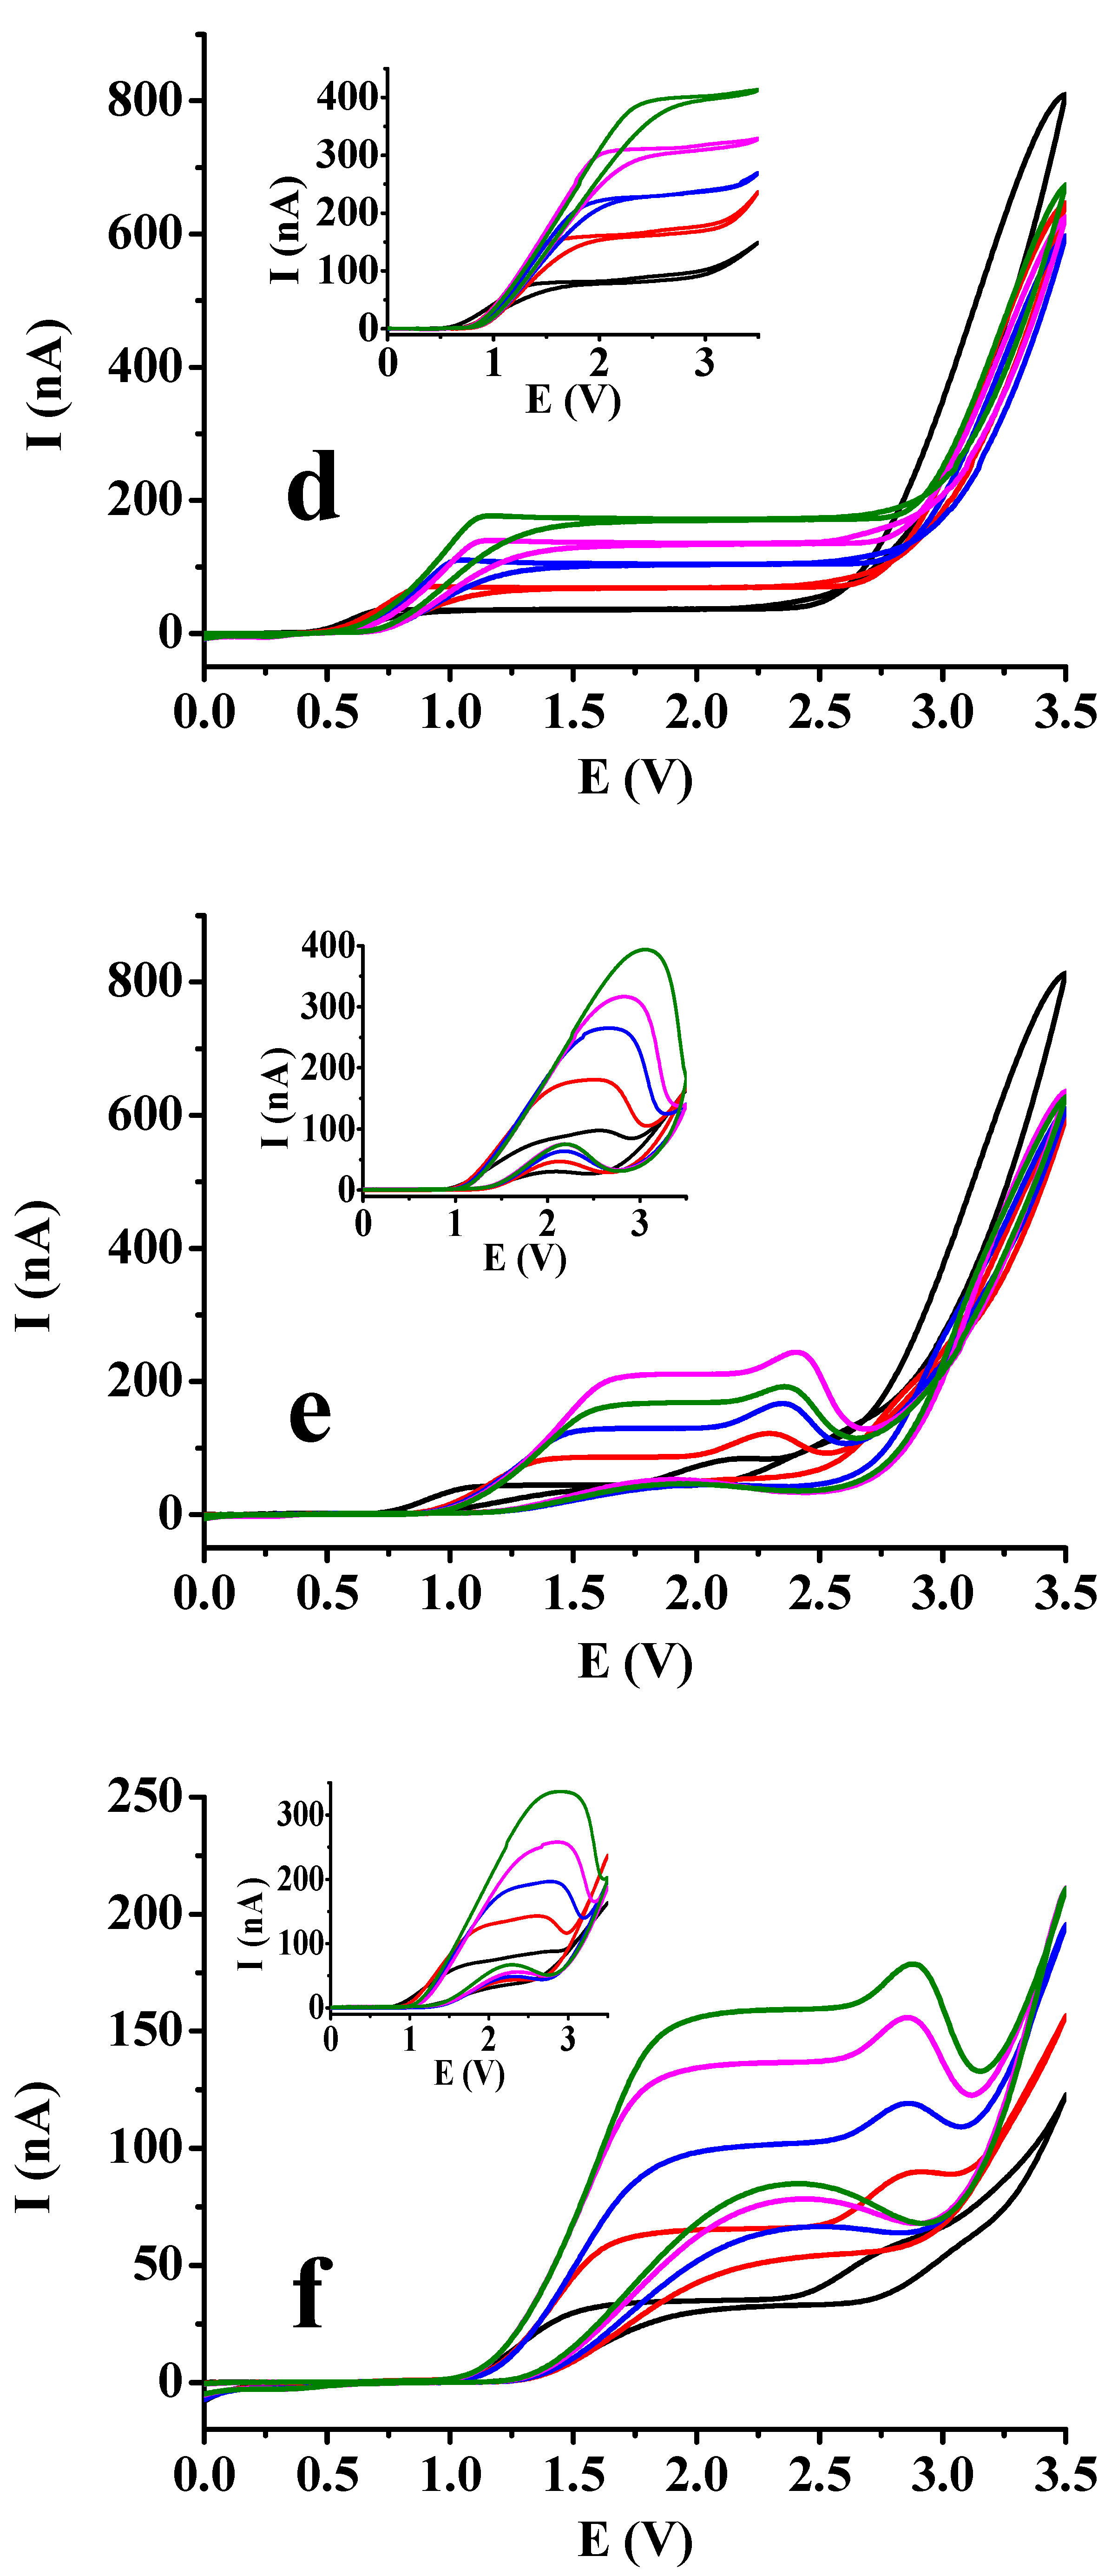
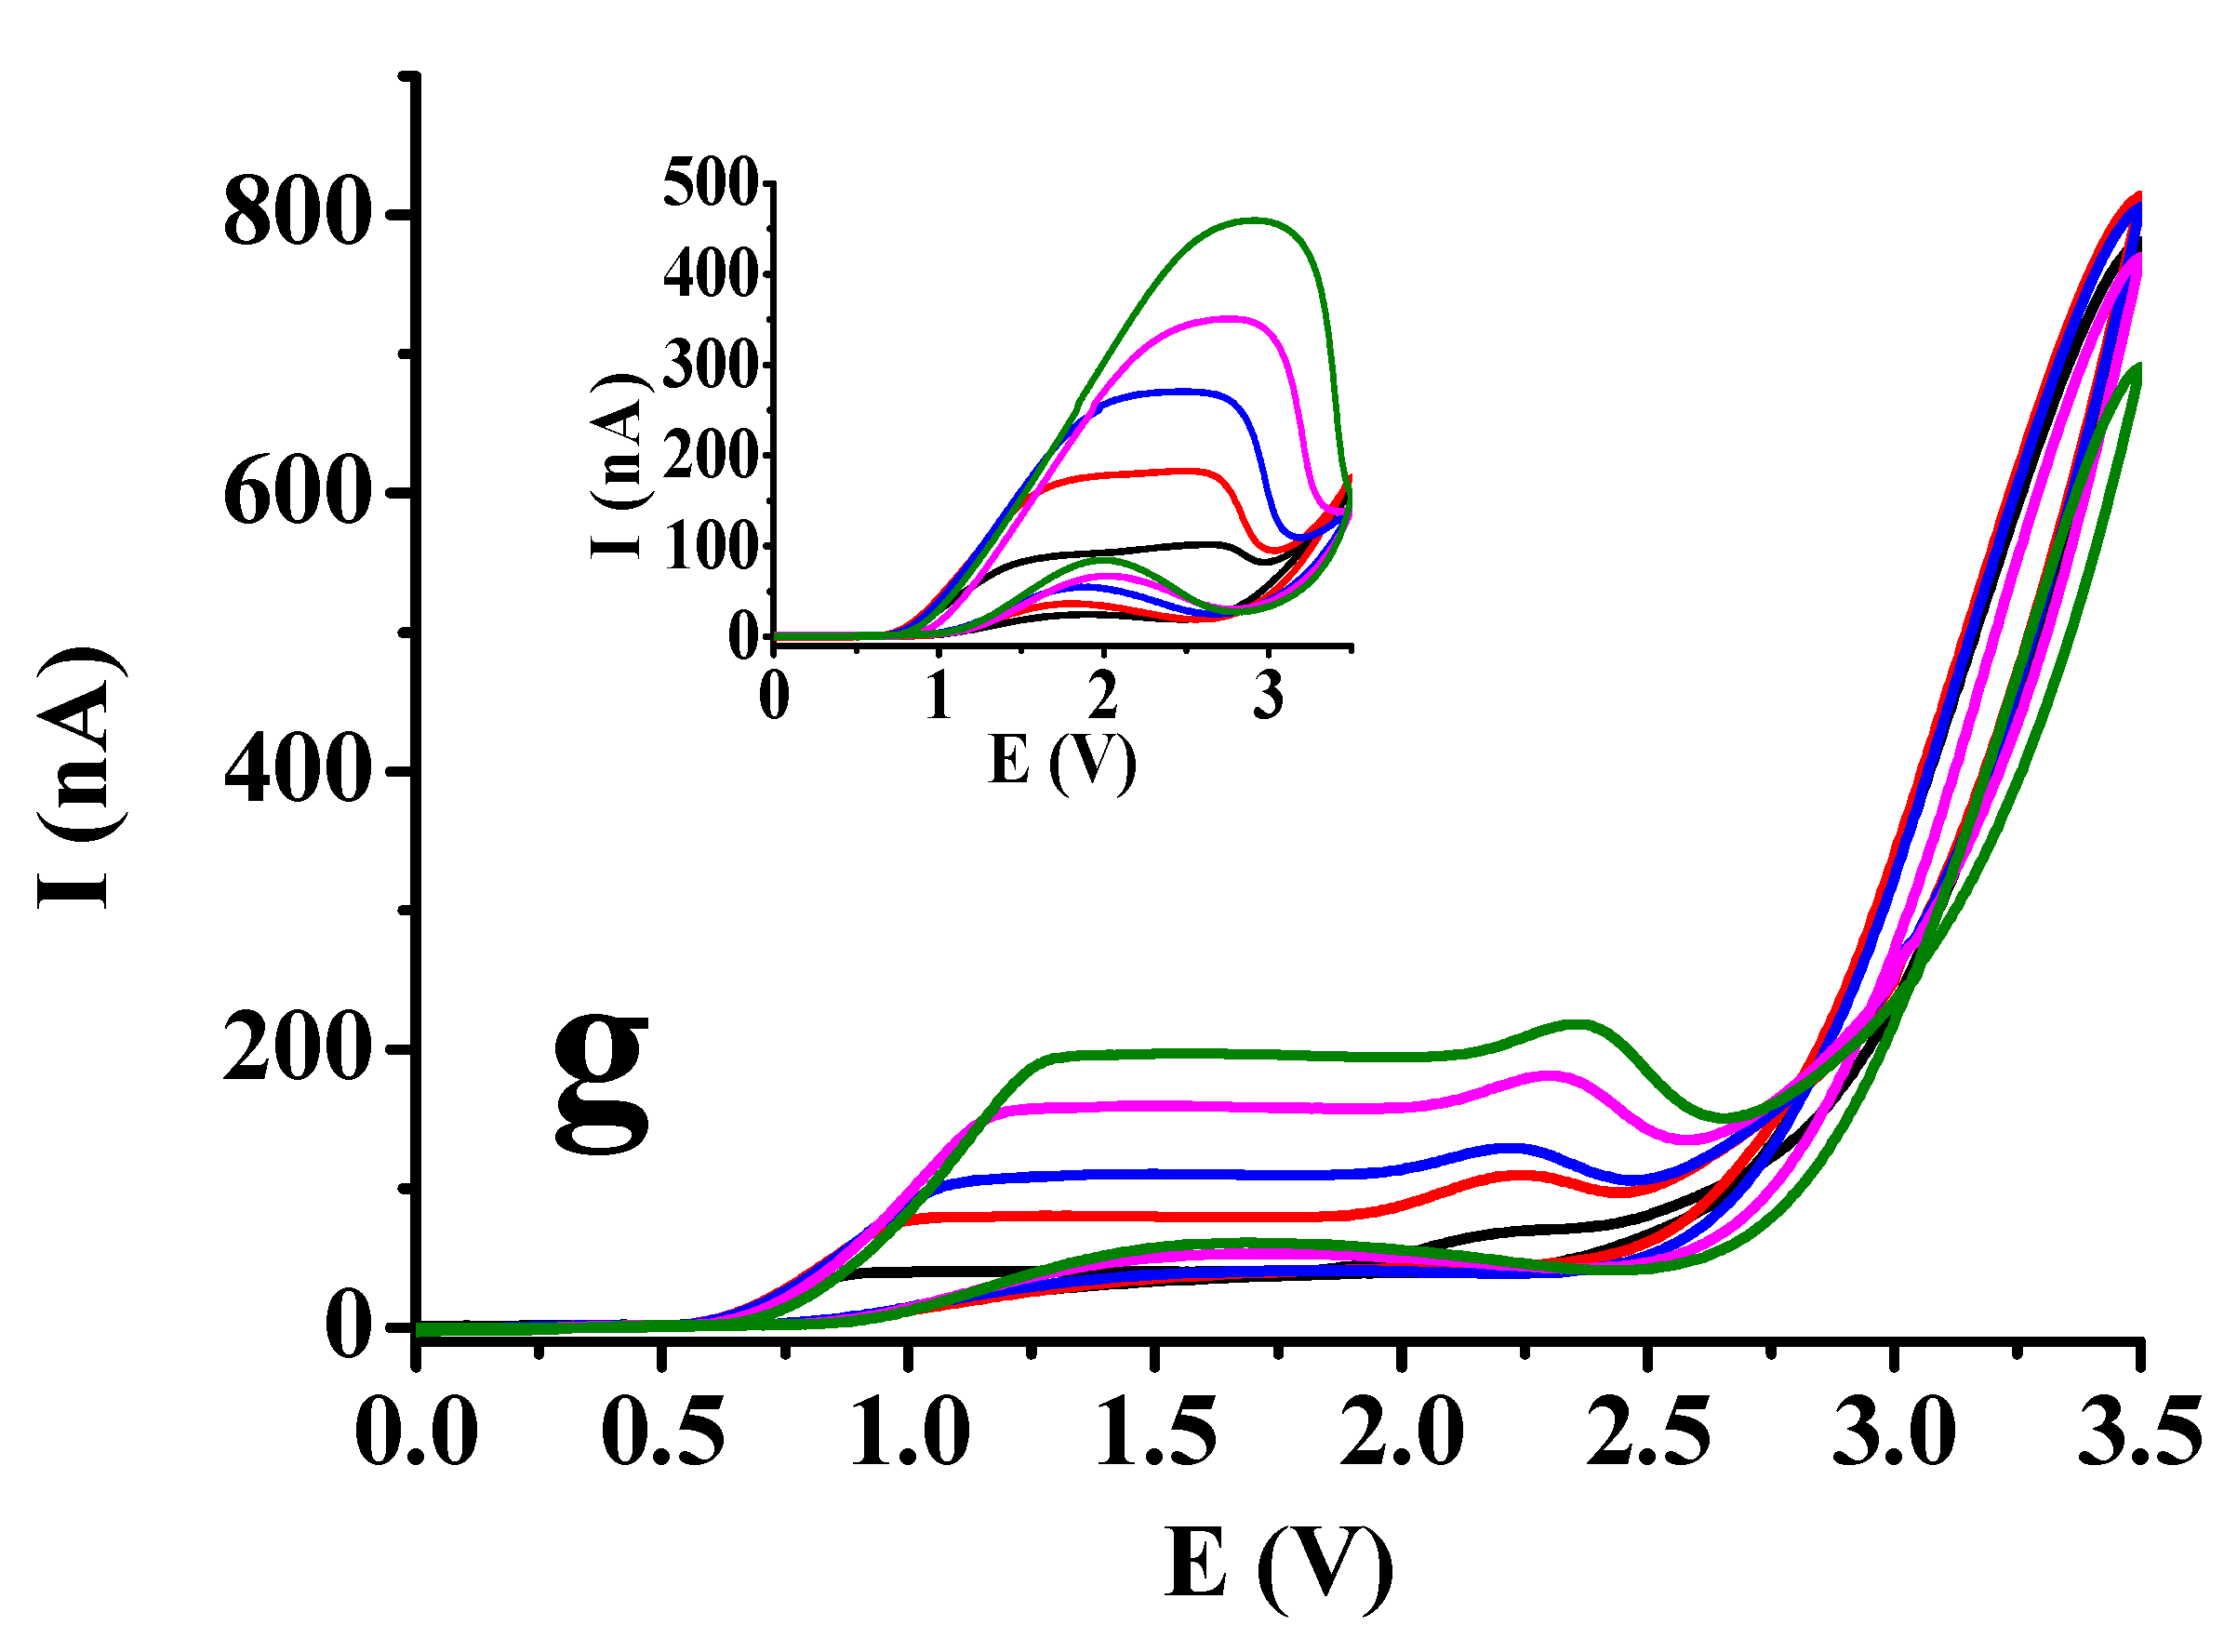
Figure 4.
Dependence of the voltammograms of 25 mM catechol on the solvent composition (scan rate 100 mV/s, supporting electrolyte 50 mM TBAP).
Figure 4.
Dependence of the voltammograms of 25 mM catechol on the solvent composition (scan rate 100 mV/s, supporting electrolyte 50 mM TBAP).
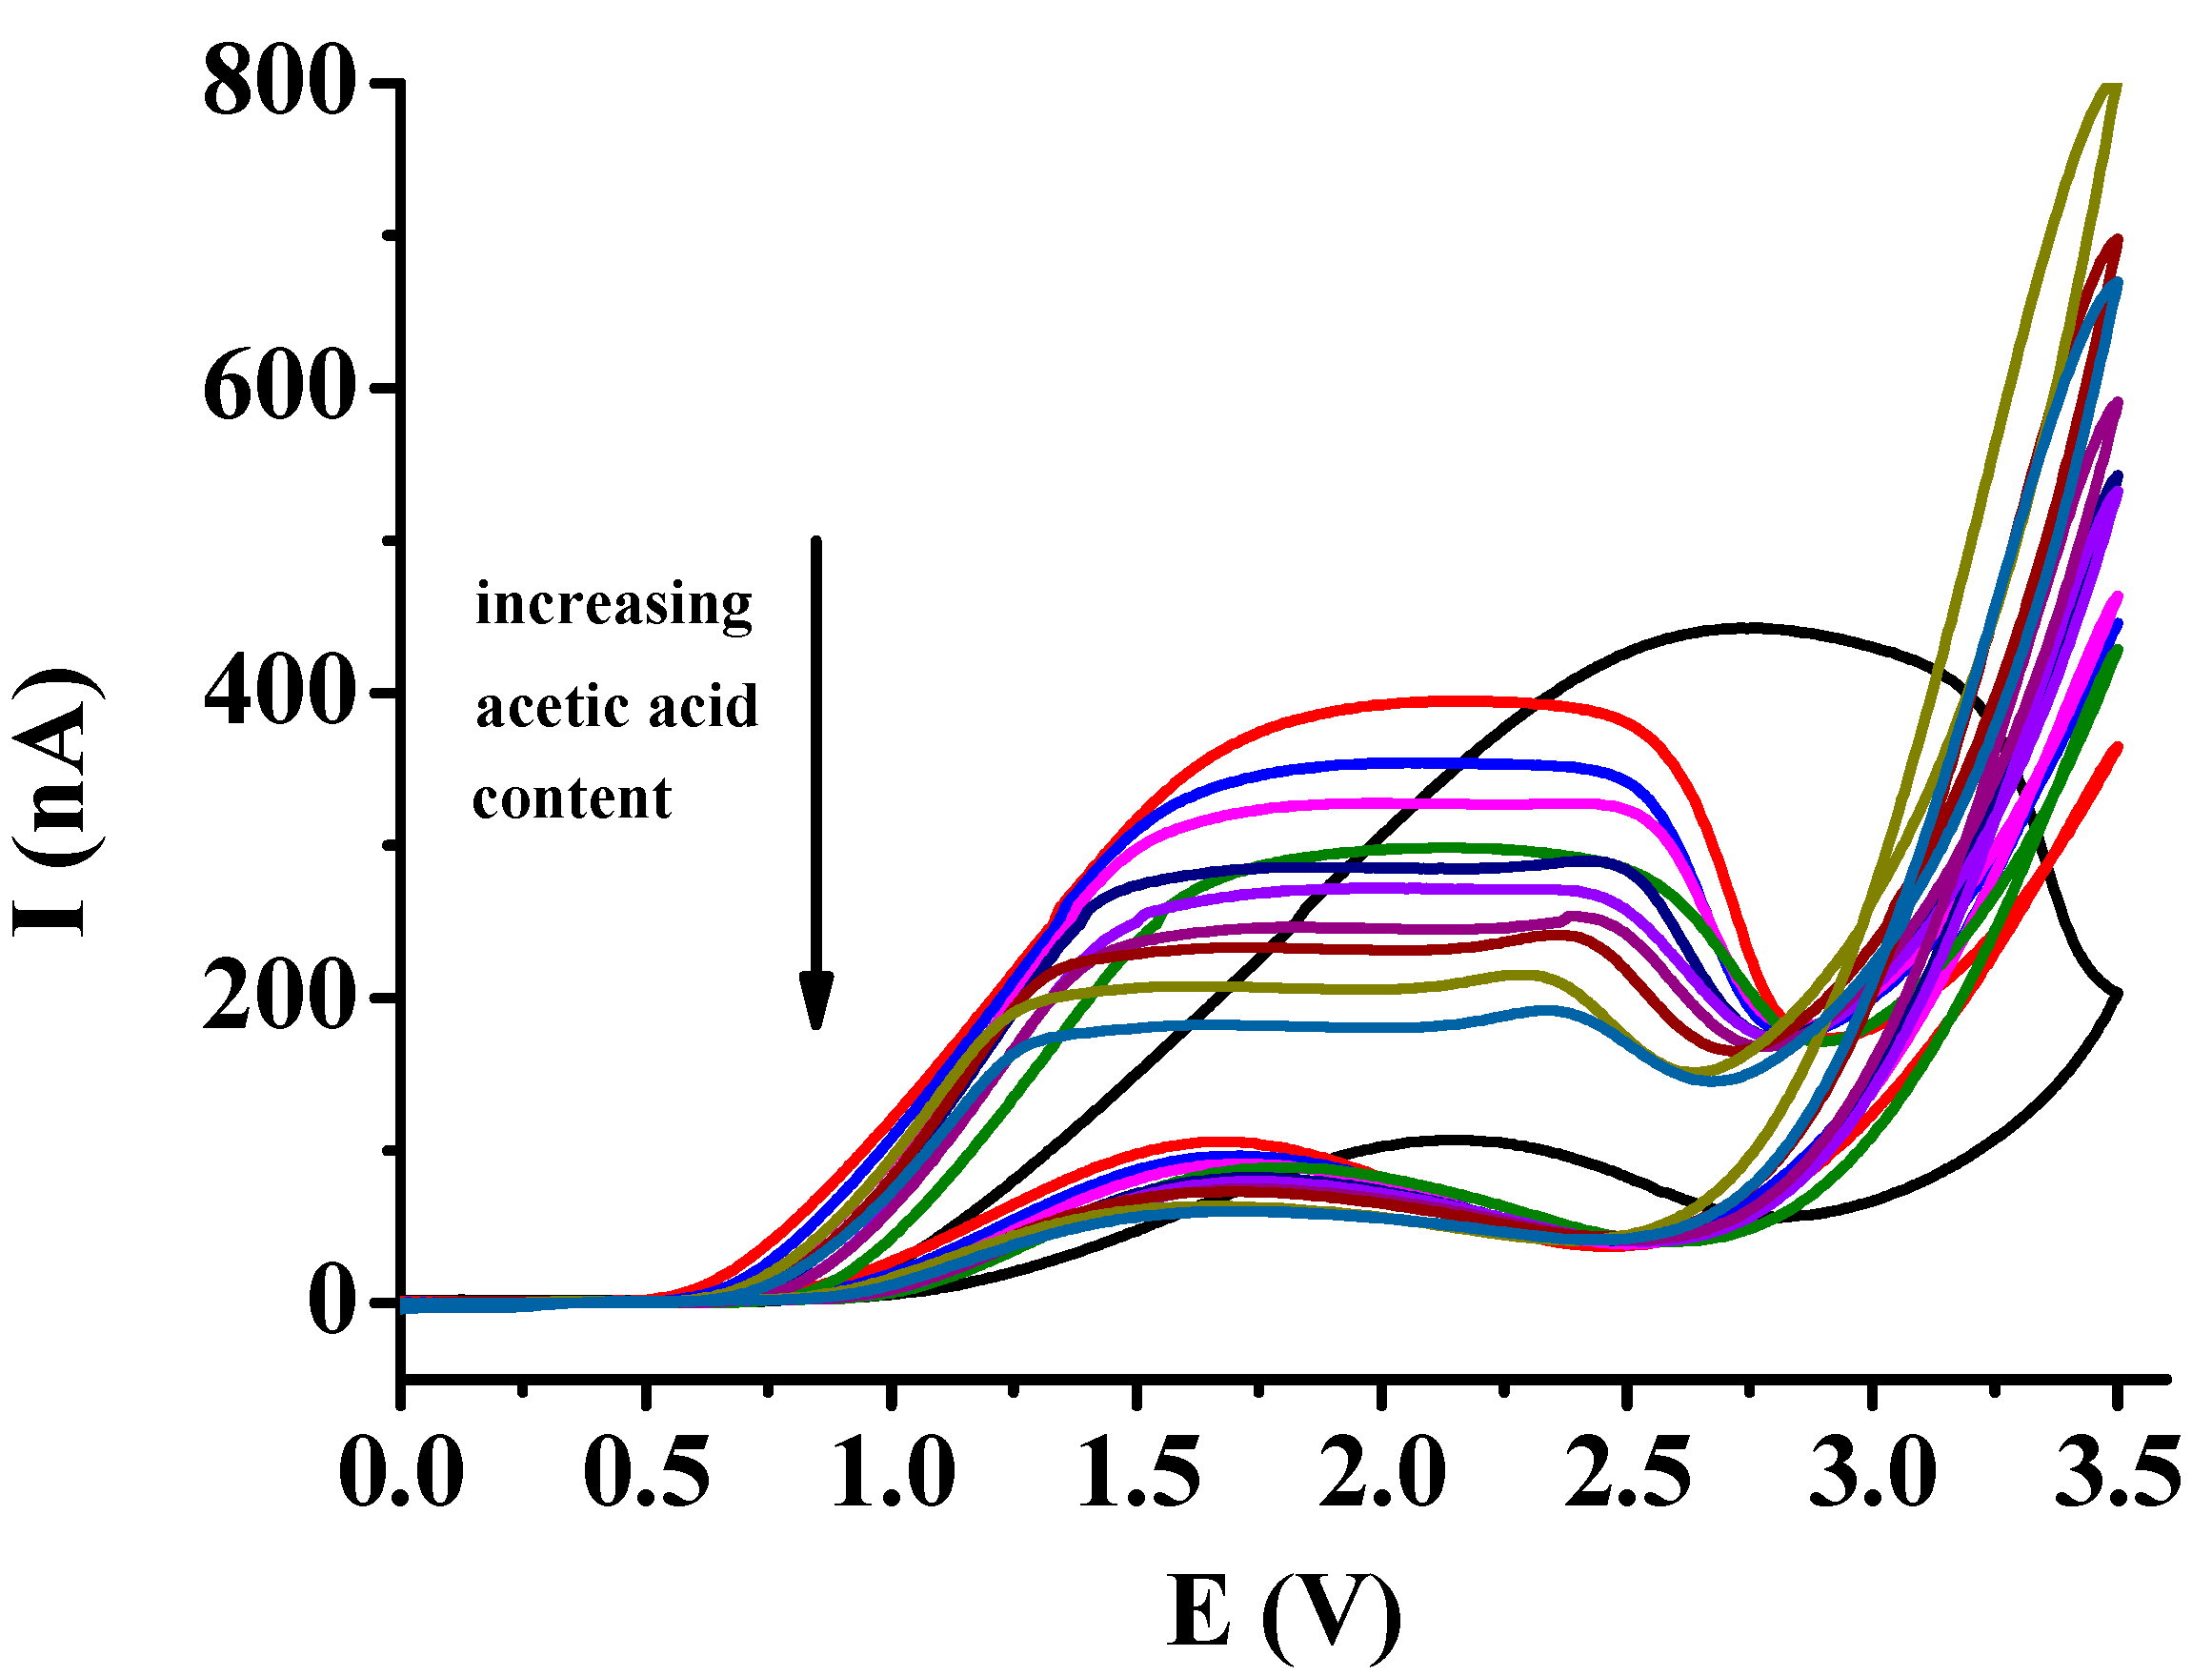
Figure 5.
Calibration plots of solvent composition by using the voltammetric signal of catechol (black: maximum current signals, red: maximum current signals and where plateaus appeared their height).
Figure 5.
Calibration plots of solvent composition by using the voltammetric signal of catechol (black: maximum current signals, red: maximum current signals and where plateaus appeared their height).
Disclaimer/Publisher’s Note: The statements, opinions and data contained in all publications are solely those of the individual author(s) and contributor(s) and not of MDPI and/or the editor(s). MDPI and/or the editor(s) disclaim responsibility for any injury to people or property resulting from any ideas, methods, instructions or products referred to in the content. |
© 2024 by the authors. Licensee MDPI, Basel, Switzerland. This article is an open access article distributed under the terms and conditions of the Creative Commons Attribution (CC BY) license (http://creativecommons.org/licenses/by/4.0/).
Copyright: This open access article is published under a Creative Commons CC BY 4.0 license, which permit the free download, distribution, and reuse, provided that the author and preprint are cited in any reuse.


