Submitted:
06 September 2024
Posted:
09 September 2024
You are already at the latest version
Abstract
Accordingly, a lot of dry direct seeding rice would be dense planted, that the initial seedling quantity could approach or even exceed the targeted effective panicle number. While limit information is available to evaluate the effects of involved novel nitrogen application methods, that total nitrogen once applied at a determined leaf age stage, on the yield formation traits of such dense planted dry direct seeding rice. The two-year experiments with total 180 kg ha-1 nitrogen once applied time treatments at sixth (L6), seventh (L7), eighth (L8), ninth (L9) and tenth (L10) leaf age stages were carried out. Results showed that the above-ground dry matter weight at maturity and grain yield of L8 was 2.1% ~ 11.8% and 4.0% ~ 9.9% higher than those of other treatments. Compared to other treatments, the higher above-ground dry matter weight after heading stage, bigger mean leaf area index with higher leaf area index at heading stage, increased leaf area duration, crop growth rate and net assimilation rate from jointing to heading period were important traits of higher grain yield formation of L8. In addition, the L8 had relative higher grain-leaf ratio traits than other treatments. Overall, a total 180 kg ha-1 nitrogen with mixed urea and compound fertilizer once applied at eighth leaf age stage would be suggest a useful high yield cultivation method for dense planted dry direct seeding rice in rice-wheat rotation system.
Keywords:
nitrogen
; applied time
; leaf age
; dense planted
; yield
; direct seeding rice
1. Introduction
With the reduction of agricultural labor force, the increasing labor costs, and the expansion of large-scale crop production in China, the direct seeding rice, which eliminates the need for seedling raising and transplanting, has gained increasing favor among rice farmers [1,2]. The direct seeding rice is widely distributed across most rice-growing regions in China, with the largest planting area found in the middle and lower reaches of the Yangtze River, estimated to exceed 3 million hectares [2]. This region is situated in the transitional zone between the subtropical and northern temperate zones. The paddy fields here have a high multiple cropping index, and are dedicated to rice-wheat, rice-oilseed, and double cropping rice cropping systems [3]. Investigations into direct seeding rice under this multi-cropping system have revealed that as the yield of the preceding crop increases, the amount of straw returned to the field also rises. However, due to the low degree of straw chopping and uneven straw spraying of mechanical harvesting, it is often challenging to improve the quality of mechanical tillage and achieve thorough tillage, which affects the uniformity and consistency of direct seeding rice [4,5]. Specifically, for the dry direct seeding rice, the uniformity and depth of seeds placement tend to be inconsistent, which can easily result in adverse conditions for many seeds during the germination stage [4,6]. At the same time, the limited time of agricultural operations during crop rotation period and the unforeseen rainy weather during the rice sowing period would exacerbate the extent of extensive soil preparation and sowing, resulting in delayed and uneven emergence of direct seeding rice, which is detrimental to early seedlings growth. Consequently, the sowing rate of direct seeding rice in production is often more than 1.5 times higher than the recommended sowing rate in experimental research, to ensure that the entire field is seeded evenly with no gaps or breaks, and to minimize the labor required for replanting and leveling seedlings [4,5,7,8]. The initial seedling quantity of this type of direct seeding rice often approaches or even exceeds the targeted effective panicle number, resulting in a final effective panicle that is predominantly composed of the main stem [4,7,9]. This type of direct seeding rice differs from the previous studies on the population construction and yield formation characteristics of high-yield cultivation methods, such as reducing the number of initial seedlings, increasing the proportion of tiller earing, and promoting strong stems and large panicles. Following traditional nitrogen application rates and multiple fertilization methods can easily cause the rice population increased rapidly in the early growth period, and decreased rapidly in the later growth period due to fierce competition among individuals and more ineffective tillers [10,11,12]. And it would weaken individual growth and intensify competition for solar, temperature, and nutrients, which would be detrimental to achieving high yields.
For dense direct seeding rice, that the initial seedling quantity would approach or even exceed the targeted effective panicle number, our research team innovated a simplified fertilization method involving reduced nitrogen application, specifically by non-nitrogen availability in the early growth period to restrict the growing and tillering of direct-seeded rice seedlings, and then supplementing nitrogen was applied in the middle growth period [4,13,14,15]. This approach significantly improved the nitrogen absorption and increased the grain yield [13,16,17,18]. However, it remained unclear how total nitrogen once applied at different leaf age stages during the mid-to-late tillering period affected the dry matter accumulation traits of dense planted dry direct seeding rice, leading to higher yield [13,14,15,16,17,18]. Therefore, we systematically compared the effects of total nitrogen once applied at different leaf age stages during the mid-to-late tillering period on the dry matter accumulation traits of dense planted dry direct seeding rice. Our objective was to provide a total nitrogen once application mode for dense planted dry direct seeding rice to facilitate the development of nitrogen reduction and high yield cultivation in a rice-wheat cropping system.
2. Results
2.1. Leaf Area Index (LAI)
The LAIs at determined growth stages varied among treatments (Table 1). At tenth-leaf and jointing stages, the LAIs showed the same trend of L6 > L7 > L8 > L9 > L10. Compared to that of L8, the LAIs of L9, L10, L7 and L6 were smaller at booting and heading stages, and significant difference was observed between L8 and L6. With the delay of total nitrogen once applied time, the LAI was increased at maturity stage in the order L10 > L9 > L8 > L7 > L6.
2.2. Mean Leaf Area Index (MLAI)
The obvious differences were observed in MLAIs among treatments (Figure 1). The MLAIs showed the same trend of L8 > L7 > L6 > L9 > L10. Compared to that of L8, the MLAIs of L9 and L10 were on average 5.3% and 7.1% significantly smaller.
2.3. Effective Leaf Area Rate (ELAR) and High Effective Leaf Area Rate (HELR) at Heading Stage
2.4. Leaf Area Duration (LAD)
The delay of total nitrogen once applied time induced a decrease in the LADs before jointing stage with the trend of L6 > L7 > L8 > L9 > L10, and significant difference was between L6 and L10 (Table 2). During the jointing to heading stage, the LAD of L8 was 1.1%~7.3 higher than other treatments. The LADs of L6, L7 and L8 were significantly lower than L9 and L10 during heading to maturity stage in 2019. In addition, the LADs of L8, L9 and L10 were showed insignificant difference and higher than L7 and L6 during heading to maturity stage in 2020.
2.5. Above-Ground Dry Matter Weight (ADW) at Mian Growth Stage
The ADWs showed the same order of L6 > L7 > L8 > L9 > L10 at tenth-leaf and jointing stages among different nitrogen application stages (Table 3). At heading, milky and maturity stages, the ADWs were increased by 3.8%~16.9, 6.5%~18.0% and 2.1%~11.8% in L8 relative to that in other treatments, respectively.
2.6. Above-Ground Dry Matter Weight (ADW) in Determined Growth Period
The ADW during jointing to heading stage of L8 was 7.4%~23.5% higher than other treatments in the two experimental years (Table 4). The ADWs during heading to maturity stage led the trend of L10 > L9 > L8 > L7 > L6, and that of L8 was 5.1% ~ 18.5% higher than L6 and L7, and was 5.4% ~ 12.6% lower than L9 and L10, respectively. With the delay of total nitrogen once applied time, the ratios of ADW before jointing stage were in the order of L6 > L7 > L8 > L9 > L10, and that during heading to maturity stage were in the opposite law. The L8 was of a higher ratio of ADW during jointing to heading stage to total.
2.7. Crop Growth Rate (CGR) and Net Assimilation Rate (NAR)
The delayed total nitrogen once applicated time increased the CGR and NAR before jointing stage with the order of L6 > L7 > L8 > L9 > L10, and decreased those during heading to maturity stage with the order of L10 > L9 > L8 > L7 > L6, respectively (Table 5). The CGR and NAR of L8 during jointing to heading stage were 7.4% ~ 23.5% and 2.2% ~ 21.2% bigger than other treatments, respectively.
2.8. Grain-Leaf Ratio Traits
With the delay of total nitrogen once applicated time, the ratio of total spikelets to leaf area index at booting stage (RTSL), ratio of total grains to leaf area index at booting stage (RTGL) and ratio of total grain weight to leaf area index at booting stage (RGWL) of Nanjing 9108 showed the same order of L8 > L7 > L6 > L9 > L10 in the two experimental years (Table 6). The RTSL, RTGL and RGWL of Yangnongxiang 28 had higher values in L8 than those in other treatments. Compared with L8, the values of RTSL, RTGL and RGWL of other treatments were 4.3%~18.3%, 2.7~18.7% and 0.1%~4.5% lower, respectively. Insignificant difference was determined in RGWL among total nitrogen once applied time treatments.
2.9. Grain Yield and Harvest Index
The grain yield of L8 was 4.0% ~ 9.9% higher than that of other treatments (Figure 4). The significant difference was in grain yield between L6 and L8. The harvest indexes of rice were in the order of L6 > L7 > L8 > L9 > L10 in response to the delayed nitrogen application stage, and insignificant differences were surveyed among L6, L7 and L8.
3. Discussion
3.1. The Above-Ground Dry Matter Accumulation Trait
Rice biological yield formation was fundamentally intertwined with the processes of above-ground dry matter production and accumulation across the plant population [20]. Rice yield was determined by both biological yield and harvest index. Theoretically, increasing biological yield or economic coefficient could increase the yield, but it was reported that enhancing rice yield hinged on increasing the dry matter accumulation of the rice population, as different opinions were present in the increasing of harvest index [21,22]. It was a true fact that while ensuring biological yield, increasing the harvest index could effectively increase the rice yield, however, even if the new cultivation technology or product significantly increased the rice yield, there may be still a limit to the increase in the rice harvest index [23,24]. In addition, if the harvest index was too high, it was easy to aggravate the contradiction between source and sink and cause lodging [22,25]. As for the extreme of rice harvest index remained to be further confirmed. So, in order to further improve rice yield, it might be necessary to cultivate rice populations with more reasonable population structure and higher biological yield, so as to lay a material foundation for high yield [26,27]. In this study, the harvest index was in the order of L6 > L7 > L8 > L9 > L10, and insignificant differences were surveyed among L6, L7 and L8, while the biological yield of L8, namely the above-ground dry matter weight at maturity, was 2.1%~11.8% higher than other treatments. Thus, it indicated that higher biological yield was one of the key characteristics for high yield of L8.
The previous studies were more consistent that, under high-yield conditions, the above-ground dry matter weight from the jointing to heading stage and from heading to maturity had a positive impact on biological yield, and in contrast, the dry matter weight before the jointing stage tended to have a negative effect [20,28]. This indicated that the accumulation and distribution of dry matter during the mid-to-late growth stages are critical for enhancing the overall biological yield of crops [29]. And a quadratic parabola relationship was lead between the above-ground dry matter weight at heading stage and biological yield. As the amount and application time of nitrogen fertilizer played a significant role in promoting and controlling photosynthetic matter production, then in the rice cultivation, nitrogen fertilizer was usually applied to properly control the above-ground dry matter weight in the rice early growth period to form a proper small amount of strong plant populations at jointing stage, and to appropriately increase an efficient photosynthetic matter production in the rice middle growth period to form a high-quality population with sufficient quantity and optimized structure at heading stage, and to greatly increased the dry matter accumulation in the rice late growth period was to form a high biological yield with source-sink coordinated population [22,26,30,31,32,33]. In this study, a new approach was explored to nitrogen fertilization management for dense-planted dry direct-seeded rice, of which the initial seedling density was almost the suitable effective panicle number of this rice type under high yield direct seeding cultivation. The novel nitrogen application method involved applying the total nitrogen at a specific leaf age stage for such dry direct-seeded rice [7,13]. And the results of dry matter accumulation traits for biological yield in this study were almost consistent with previous research [11,33,34,35]. Without basal fertilizer, one-time application of total nitrogen at leaf age during tillering period had significant effects on dry matter accumulation of rice. The dry matter accumulation of L8 was at a disadvantage in the early rice growth period in compared to L6 and L7, owing to the late nitrogen application time and the relative adversity of nitrogen starvation for the plant growth, but the above-ground dry matter weights showed insignificant difference among L6, L7 and L8. Then the dry matter accumulation after jointing stage increased obviously with the plant obtaining much-needed nitrogen nutrition, and the maximum dry matter accumulation was observed in L8 at heading, milky and maturity stages. Although the L6 and L7 had more dry matter accumulation in the early rice growth stage, but the dry matter accumulation was low after jointing, because ineffective tillers were promoted by earlier nitrogen application. Nevertheless, the nitrogen was too late applicated for L9 and L10 to form strong plant population at heading stage and high biological yield with the weakness of insufficient above-ground accumulation in the early rice growth period. Thus, the one-time application of total nitrogen too early or too late was not conducive to the accumulation of dry matter and grain yield formation of dense direct seeding rice [36]. And the nitrogen application at the eight-leaf age was more suitable, which could effectively regulate the dry matter accumulation and proportion in the main growth periods, and moderately increase the dry matter accumulation in the middle and late rice growth periods on the basis of obtaining sufficient dry matter accumulation in the early rice growth period, so as to lay a material foundation for higher biological yield and grain yield formation [37].
3.2. The Above-Ground Dry Matter Production Trait
The photosynthesis was the source of above-ground dry matter production, and the LAI, ELAR, HELR, LAD, CGR, NAR, et al. were important indexes to characterize the photosynthetic matter capacity of plant population [38,39]. The researches on the traits of rice above-ground dry matter production had consistently shown that high-yielding rice generally had higher optimal leaf area, ELAR and HELR at heading stage, as well as higher LAI, CGR, NAR from jointing to maturity stages [24,37]. In this study, with the delay of nitrogen application leaf age, the L8 had a smaller LAI than L6 and L7 in the early rice growth period, bigger LAIs at booting and heading stages, and a smaller LAI than L9 and L10 at maturity stage. In addition, the HELR at heading stage and the MLAI across the whole growth duration got higher values of L8 than other treatments. These above laid the high photosynthetic efficiency population foundation for the high-efficiency dry matter production in a comprehensive view [29,37]. The LAD, CGR and NAR showed the same trend that the L8 obtained intermediate values in the early and late growth period, and higher values in the middle growth period among treatments. This indicated that the strong photosynthetic dry matter production capacity in the middle growth period was an important feature for L8 to obtain high biological yield. From the view of grain-leaf ratio, all the RTSL, RTGL and RGWL had relative higher values in L8 among treatments. It meant that the rice population of L8 could better balance the vegetative growth and reproductive growth, so that the photosynthetic matter of leaves was more used for grain formation and enrichment, thereby increasing yield [40,41,42]. However, the CGR and NAR during heading to maturity stage of L8 were lower than L9 and L10, and the LADs during heading to maturity stage were insignificant among L8, L9 and L10. On the one hand, due to the late total nitrogen application of L9 and L10 than L8, the early growth of rice was weak, and the fertilizer effect was mainly concentrated in the middle and late growth period, then the leaves stayed green for a longer time and produced more dry matter. On the other hand, this suggest that improving the plant growth in the late growth period of L8 by cultivation technology might further increase the dry matter accumulation and yield of rice.
4. Materials and Methods
4.1. Experiment Condition and Plant Material
Field experiments were conducted in 2019 and 2020 at Jiangyan experimental station, Taizhou city, Jiangsu province, China (32°61′ N, 120°12′ E, 1.2 m altitude), and the meteorological data of rice growing season was shown in Figure 5. The experimental field soil was clay loam with 31.52 and 30.68 g kg−1 organic matter, 1.85 and 1.93 g kg−1 total nitrogen, 29.86 and 32.27 mg kg−1 available phosphorus, 148.35 and 162.13 mg kg−1 available potassium in 2019 and 2020, respectively. Nanjing 9108 and Yangnongxiang 28, the Japonica conventional rice with good taste, were used in the experiment. The test field led a rice-wheat rotation system, and the wheat yields were 7.25 and 7.46 t ha-1 in 2019 and 2020, respectively.
4.2. Experiment Design and Cultivation
The randomized block design was adopted for the experiment with total nitrogen once applied time treatments at sixth (L6), seventh (L7), eighth (L8), ninth (L9) and tenth (L10) leaf age stages. Total 180 kg ha-1 nitrogen was once applied at the leaf growth initial stage of each treatment with 150 kg ha-1 urea (N content was 46%) and 740 kg ha-1 compound fertilizer (N, P2O5 and K2O contents were 15%, 15% and 15%, respectively).
According to the local rice cultivation experience, rice was seeded by the multifunctional integrated dry direct seeding machine (2BFMZ-10, Yangzhou Huilong Machinery Technology Co., Ltd. Yangzhou, China) on June 14th and June 11th in 2019 and 2020. The row spacing was 25 cm, and the sowing rate was 195 kg ha-1. At the third leaf age stage, the seedlings of each plot were artificial set to 380 × 104 ha-1, which was based on the suitable effective panicle number of this type rice under high yield direct seeding cultivation. The treatment was repeated 3 times with plot area of 25 m2. The earth ridges covered with black plastic films were isolated between the plots to ensure that each plot was irrigated separately. The management of water, disease, pests and weeds were carried out according to the guidance of local agricultural experts.
4.3. Sampling and Measurements
The above-ground dry matter weight and leaf area index (LAI) were measured at the sixth-leaf, tenth-leaf, jointing, booting, heading, milky, Maturity stages. Sixty plants of three points in each plot were tagged for recording tiller number. Twelve plants, randomly selected from three points in the middle of each plot were sampled. The green leaf area was measured by a leaf area meter (LI-3100, LI-COR, USA) to calculate the LAI. The calculation method of mean leaf area index (MLAI) was described by Hirooka et al. (2016) [43]. All samples were oven-dried at 80°C to a constant weight to calculate the above-ground dry matter weight.
At heading stage, except green leaf area of total stems and tillers (TLA), the green leaf area of panicle-stems and panicle-tillers was measured as effective leaf area (ELA), and the top three leaf area of panicle-stems and panicle-tillers was measured as high effective leaf area (HELA). The effective leaf area rate (ELAR) and high effective leaf area rate (HELR) were calculated using the following formulas:
ELAR (%) = ELA / TLA × 100
HELR (%) = HELA / TLA × 100
Crop growth rate (CGR), leaf area duration (LAD) and net assimilation rate (NAR) were calculated using the following formulas:
CGR (g m-2 d-1) = (W2−Wl) / (t2−t1)
LAD (m2 d m-2) = 1/2 × (L1+L2) × (t2−t1)
NAR (g m-2 d-1) = [ln (L2) − ln (L1)] / (L2−L1) × (W2−W1) / (t2−t1)
Where, W1 and W2 were the first and second measurements of above-ground dry matter (g m-2), L1 and L2 were the first and second measurements of LAI (m2 m-2), and t1 and t2 represented the first and second days, of measurement, respectively.
The number of panicles was determined from three representative 1 m2 in the middle of each plot. The number of spikelets and filled grains per panicle and filled grain weight were determined from three rows in 0.5 m in each plot. All rice plants in an area of 10 m2 at the center of each plot were hand-harvested, and grain yield was calculated. The final rice yield was adjusted to 14.5%.
The grain-leaf ratio traits, namely ratio of total spikelets to LAI at booting stage (RTSL), ratio of total grains to LAI at booting stage (RTGL) and ratio of total grain weight to LAI at booting stage (RGWL), were calculated using the following formulas:
RTSL (cm-2) = PN × SN / L / 10000
RTGL (cm-2) = PN × GN / L / 10000
RTGL (mg cm-2) = GY / L × 10
Where, PN was the number of panicles per hectare (×104 ha-1), SN was the number of spikelets per panicle, GN was the number of filled grains per panicle, GY was the total grain weight (t ha-1), and L was LAI at booting stage (m2 m-2).
4.4. Statistical Analysis
Data were analyzed using IBM SPSS Statistics 22 (SPSS, Chicago, IL, USA). Means were tested by least significant difference at P < 0.05 (LSD0.05). Graphs were prepared by Excel 2013 (Microsoft Corporation, Washington, DC, USA), and all error bars indicated standard errors of means.
5. Conclusions
For the dense planted dry direct seeding rice, of which the initial seedling density was almost the suitable effective panicle number of this rice type under high yield direct seeding cultivation, total nitrogen once applied at eight leaf age stage got the highest grain yield in this study. The higher above-ground dry matter weight after heading stage, bigger MLAI with higher LAI at heading, increased photosynthetic matter production capacity from jointing to heading period and the effective photosynthetic matter production capacity from heading to maturity period, were important traits of high grain yield formation and higher biological yield formation of L8. This study proposed a novel nitrogen fertilization method for the dense planted direct seeding rice based on the idea of total nitrogen one-time fertilization at specific leaf age of the rice middle or late tillering period. However, whether this investigated nitrogen application leaf age was suitable for different growth types of rice varieties, different types of soil, and different soil fertility levels remained to be scientifically compared. In addition, the performance of this nitrogen application mode in long-term production practice should be carried out long-term fixed-point experiments for in-depth and detailed comparative analysis.
Author Contributions
Conceptualization, H.Z.; formal analysis, H.Z. and Z.X.; investigation, Z.X., D.F., F.C., J.Z. and M.S.; writing—original draft preparation, Z.X.; writing—review and editing, Z.X.; project administration, D.F. and J.Z. and funding acquisition, H.Z. All authors have read and agreed to the published version of the manuscript.
Funding
This study was jointly supported by the Key R&D Program of Jiangsu Province (BE2022338), the Jiangsu Agricultural Science and Technology Innovation Fund (CX (20) 1012) and the Project Funded by the Priority Academic Program Development of Jiangsu Higher Education Institutions (PAPD).
Institutional Review Board Statement
Not applicable.
Informed Consent Statement
Not applicable.
Data Availability Statement
All data are included in the present study.
Conflicts of Interest
The authors declare no conflict of interest.
References
- Farooq, M.; Siddique, K.H.M.; Rehman, H.; Aziz, T.; Lee, D.J.; Wahid, A. Rice direct seeding: experiences, challenges and opportunities. Soil Tillage Res. 2011, 111, 87–98. [Google Scholar] [CrossRef]
- Liu, H.Y.; Hussain, S.; Zheng, M.M.; Peng, S.B.; Huang, J.L.; Cui, K.H.; Nie, L.X. Dry direct-seeded rice as an alternative to transplanted-flooded rice in central China. Agron. Sustain. Dev. 2015, 35, 285–294. [Google Scholar] [CrossRef]
- Jiang, M; Li, X. B.; Xin, L.J.; Tan, M.H. Paddy rice multiple cropping index changes in southern China: impacts on national grain production capacity and policy implications. J. Geogr. Sci. 2019, 29, 1773–1787. [Google Scholar] [CrossRef]
- Zhang, H.C.; Xing, Z.P.; Weng, W.A.; Tian, J.Y.; Tao, Y.; Cheng, S.; Hu, Q.; Hu, Y.J.; Guo, B.W.; Wei, H.Y. Growth characteristics and key techniques for stable yield of growth constrained direct seeding rice. Sci. Agric. Sin. 1322. [Google Scholar]
- Xing, Z.P.; Huang, Z.C.; Yao, Y.; Hu, Y.J.; Guo, B.W.; Zhang, H.C. Comparison of crop yield and solar thermal utilization among different rice–wheat cropping systems. J. Agric. Sci. 2023, 161, 40–50. [Google Scholar] [CrossRef]
- Pratap, V.; Dass, A.; Dhar, S.; Babu, S.; Singh, V.K.; Singh, R.; Krishnan, P.; Sudhishri, S.; Bhatia, A.; Kumar, S.; et al. Co-implementation of tillage, precision nitrogen, and water management enhances water productivity, economic returns, and energy-use efficiency of direct-seeded rice. Sustainability. 2022, 14, 11234. [Google Scholar] [CrossRef]
- Tian, J.Y.; Li, S.P.; Cheng, S.; Liu, Q.Y.; Zhou, L.; Tao, Y.; Xing, Z.P.; Hu, Y.J.; Guo, B.W.; Wei, H.Y.; et al. Increasing the appropriate seedling density for higher yield in dry direct-seeded rice sown by a multifunctional seeder after wheat-straw return. J. Integr. Agric. 2023, 22, 400–416. [Google Scholar] [CrossRef]
- Wu, L.M.; Yu, K.R.; Zou, J.X.; Bao, X.Z.; Yang, T.T.; Chen, Q.C.; Zhang, B. Management of seeding rate and nitrogen fertilization for lodging risk reduction and high grain yield of mechanically direct-seeded rice under a double-cropping regime in south China. Agronomy-Basel. 2024, 14, 522. [Google Scholar] [CrossRef]
- Bueno, C.S.; Carandang, R.B.; Motilla, J.K.L.; Cruz, P.C.S. Yield component compensation as affected by seeding rates in dry direct seeded rice. Philipp. Agric. Sci. 2023, 106, 263–272. [Google Scholar] [CrossRef]
- Fu, Y.Q.; Huang, N.R.; Zhong, X.H.; Mai, G.X.; Pan, H.R.; Xu, H.Q.; Liu, Y.Z.; Liang, K.M.; Pan, J.F.; Xiao, J.; et al. Improving grain yield and nitrogen use efficiency of direct-seeded rice with simplified and nitrogen-reduced practices under a double-cropping system in south China. J. Sci. Food Agric. 2023, 103, 5727–5737. [Google Scholar] [CrossRef]
- Li, Y.; Yang, X.L.; Zhang, Z.L.; Lin, Y.Y.; Wang, B.F.; Zhang, Z.S.; Liu, C.Y.; Cheng, J.P. Delaying first fertilization time improved yield and N utilization efficiency on direct seeding rice. J. Plant Growth Regul. 2024, 43, 423–433. [Google Scholar] [CrossRef]
- Ma, P.; Zhang, K.Y.; Liao, X.H.; Aer, L.S.; Yang, E.L.; Deng, J.; Zhou, L.; Zhang, R.P. Effects of nitrogen application rate on dry matter weight and yield of direct-seeded rice under straw return. Agronomy-Basel. 2023, 13, 3058. [Google Scholar] [CrossRef]
- Zhao, J.; Li, S.P.; Cheng, S.; Tian, J.Y.; Xing, Z.P.; Tao, Y.; Zhou, L.; Liu, Q.Y.; Hu, Y.J.; Guo, B.W.; et al. Effects of nitrogen fertilizer in whole growth duration applied in the middle and late tillering stage on yield and quality of dry direct seeding rice under ‘solo-stalk’ cultivation mode. Acta Agron. Sin. 1162. [Google Scholar]
- Xie, X.B.; Shan, S.L.; Wang, Y.M.; Cao, F.B.; Chen, J.N.; Huang, M.; Zou, Y.B. Dense planting with reducing nitrogen rate increased grain yield and nitrogen use efficiency in two hybrid rice varieties across two light conditions. Field Crop. Res. 2019, 236, 24–32. [Google Scholar] [CrossRef]
- Luo, K.; Zeng, Y.J.; Wu, Z.M.; Guo, L.; Xie, X.B.; Shi, Q.H.; Pan, X.H. Nutrient utilization and double cropping rice yield response to dense planting with a decreased nitrogen rate in two different ecological regions of south China. Agriculture-Basel. 2022, 12, 871. [Google Scholar] [CrossRef]
- Fu, Y.Q.; Zhong, X.H.; Zeng, J.H.; Liang, K.M.; Pan, J.F.; Xin, Y.F.; Liu, Y.Z.; Hu, X.Y.; Peng, B.L.; Chen, R.B.; et al. Improving grain yield, nitrogen use efficiency and radiation use efficiency by dense planting, with delayed and reduced nitrogen application, in double cropping rice in south China. J. Integr. Agric. 2021, 20, 565–580. [Google Scholar] [CrossRef]
- Chen, J.; Zhu, X.C.; Xie, J.; Deng, G.Q.; Tu, T.H.; Guan, X.J.; Yang, Z.; Huang, S.; Chen, X.M.; Qiu, C.F.; et al. Reducing nitrogen application with dense planting increases nitrogen use efficiency by maintaining root growth in a double-rice cropping system. Crop J. 2021, 9, 805–815. [Google Scholar] [CrossRef]
- Zhu, X.C.; Zhang, J.; Zhang, Z.P.; Deng, A.X.; Zhang, W.J. Dense planting with less basal nitrogen fertilization might benefit rice cropping for high yield with less environmental impacts. Eur. J. Agron. 2016, 75, 50–59. [Google Scholar] [CrossRef]
- Liang, C.; Li, Y.M.; Zhang, K.H.; Wu, Z.Z.; Liu, J.X.; Liu, J.F.; Zhou, C.C.; Wang, S.; Li, F.H.; Sui, G.M. Selection and yield formation characteristics of dry direct seeding rice in northeast China. Plants-Basel. 2023, 12, 3496. [Google Scholar] [CrossRef]
- Ying, J.F.; Peng, S.B.; He, Q.R.; Yang, H.; Yang, C.D.; Visperas, R.M.; Cassman, K.G. Comparison of high-yield rice in tropical and subtropical environments: I. determinants of grain and dry matter yields. Field Crop. Res. 1998, 57(1), 71–84. [Google Scholar] [CrossRef]
- Katsura, K.; Maeda, S.; Lubis, I.; Horie, T.; Cao, W.X.; Shiraiwa, T. The high yield of irrigated rice in Yunnan, China- ‘A cross-location analysis’. Field Crop. Res. 2008, 107, 1–11. [Google Scholar] [CrossRef]
- Tang, L.; Gao, H.; Yoshihiro, H.; Koki, H.; Tetsuya, N.; Liu, T.S.; Tatsuhiko, S.; Xu, Z.J. Erect panicle super rice varieties enhance yield by harvest index advantages in high nitrogen and density conditions. J. Integr. Agric. 2017, 16, 1467–1473. [Google Scholar] [CrossRef]
- Peng, S.B.; Tang, Q.Y.; Zou, Y.B. Current status and challenges of rice production in China. Plant. Prod. Sci. 2009, 12, 3–8. [Google Scholar] [CrossRef]
- Wang, F.; Peng, S.B. Yield potential and nitrogen use efficiency of China’s super rice. J. Integr. Agric. 2017, 16, 1000–1008. [Google Scholar] [CrossRef]
- Cheng, F.W.; Bin, S.Y.; Iqbal, A.; He, L.J.; Wei, S.Q.; Zheng, H.; Yuan, P.L.; Liang, H.; Ali, I.; Xie, D.J.; et al. High sink capacity improves rice grain yield by promoting nitrogen and dry matter accumulation. Agronomy-Basel. 2022, 12, 1688. [Google Scholar] [CrossRef]
- Zheng, H.B.; Chen, Y.W.; Chen, Q.M.; Li, B.; Zhang, Y.S.; Jia, W.; Mo, W.W.; Tang, Q.Y. High-density planting with lower nitrogen application increased early rice production in a double-season rice system. Agron. J. 2020, 112, 205–214. [Google Scholar] [CrossRef]
- He, H.B.; Hu, C.; Xu, H.C.; Yang, R.; You, C.C.; Ke, J.; Zhang, Q.Q.; Wu, L.Q. High yield, good eating quality, and high N use efficiency for medium hybrid indica rice: from the perspective of balanced source-sink relationships at heading. Eur. J. Agron. 2024, 159, 127281. [Google Scholar] [CrossRef]
- Yao, F.X.; Huang, J.L.; Cui, K.H.; Nie, L.X.; Xiang, J.; Liu, X.J.; Wu, W.; Chen, M.X.; Peng, S.B. Agronomic performance of high-yielding rice variety grown under alternate wetting and drying irrigation. Field Crop. Res. 2012, 126, 16–22. [Google Scholar] [CrossRef]
- Li, H.W.; Liu, L.J.; Wang, Z.Q.; Yang, J.C.; Zhang, J.H. Agronomic and physiological performance of high-yielding wheat and rice in the lower reaches of Yangtze River of China. Field Crop. Res. 2012, 133, 119–129. [Google Scholar] [CrossRef]
- Chen, Y.; Peng, J.; Wang, J.; Fu, P.; Hou, Y.; Zhang, C.; Fahad, S.; Peng, S.; Cui, K.; Nie, L.; et al. Crop management based on multi-split topdressing enhances grain yield and nitrogen use efficiency in irrigated rice in China. Field Crop. Res. 2015, 184, 50–57. [Google Scholar] [CrossRef]
- He, B.; Li, C.; Yao, L.; Cui, H.Y.; Tian, Y.J.; Sun, X.; Yu, T.H.; He, J.Q.; Wang, S. Effects of dynamic nitrogen application on rice yield and quality under straw returning conditions. Environ. Res. 2024, 243, 117857. [Google Scholar] [CrossRef]
- Zou, Y; Zhang, Y. C.; Cui, J.H.; Gao, J.C.; Guo, L.Y.; Zhang, Q. Nitrogen fertilization application strategies improve yield of the rice cultivars with different yield types by regulating phytohormones. Sci Rep. 2023, 13, 21803. [Google Scholar] [CrossRef]
- Sun, T.; Yang, X.; Tan, X.L.; Han, K.F.; Tang, S.; Tong, W.M.; Zhu, S.Y.; Hu, Z.P.; Wu, L.H. Comparison of agronomic performance between japonica/indica hybrid and japonica cultivars of rice based on different nitrogen rates. Agronomy-Basel. 2020, 10, 171. [Google Scholar] [CrossRef]
- Yuan, S.; Nie, L.X.; Wang, F.; Huang, J.L.; Peng, S.B. Agronomic performance of inbred and hybrid rice cultivars under simplified and reduced-input practices. Field Crop. Res. 2017, 210, 129–135. [Google Scholar] [CrossRef]
- Guo, C.C.; Yuan, X.J.; Wen, Y.F.; Yang, Y.G.; Ma, Y.M.; Yan, F.J.; Li, B.; Wang, Z.L.; Xing, M.W.; Zhang, R.P.; et al. Common population characteristics of direct-seeded hybrid indica rice for high yield. Agron. J. 2023, 115, 1606–1621. [Google Scholar] [CrossRef]
- Cheng, S.; Xing, Z.P.; Tian, C.; Weng, W.A.; Hu, Q.; Zhang, H.C. Optimization of one-time fertilization scheme achieved the balance of yield, quality and economic benefits of direct-seeded rice. Plants-Basel. 2023, 12, 2047. [Google Scholar] [CrossRef]
- Tian, J.Y.; Li, S.P.; Xing, Z.P.; Cheng, S.; Guo, B.W.; Hu, Y.J.; Wei, H.Y.; Gao, H.; Liao, P.; Wei, H.H.; et al. Differences in rice yield and biomass accumulation dynamics for different direct seeding methods after wheat straw return. Food Energy Secur. 2022, 11, e425. [Google Scholar] [CrossRef]
- Pan, Y.H.; Cao, Y.W.; Chai, Y.X.; Meng, X.S.; Wang, M.; Wang, G.J.; Guo, S.W. Identification of photosynthetic parameters for superior yield of two super hybrid rice varieties: a cross-scale study from leaf to canopy. Front. Plant Sci. 2023, 14, 1110257. [Google Scholar] [CrossRef]
- Chen, K.W.; Ma, T.; Ding, J.H.; Yu, S.E.; Dai, Y.; He, P.R.; Ma, T. Effects of straw return with nitrogen fertilizer reduction on rice (Oryza sativa L.) morphology, photosynthetic capacity, yield and water-nitrogen use efficiency traits under different water regimes. Agronomy-Basel. 2023, 13, 133. [Google Scholar] [CrossRef]
- Horie, T.; Ohnishi, M.; Angus, J. F.; Lewin, L.G; Tsukaguchi, T.; Matano, T. Physiological characteristics of high-yielding rice inferred from cross-location experiments. Field Crop. Res. 1997, 52, 55–67. [Google Scholar] [CrossRef]
- Li, X.X.; Zhou, Y.J.; Shuai, P.; Wang, X.Y.; Peng, S.B.; Wang, F. Source-sink balance optimization depends on soil nitrogen condition so as to increase rice yield and N use efficiency. Agronomy-Basel.
- Wang, J.J.; Xie, R.Q.; He, N.A.; Wang, W.L.; Wang, G.L.; Yang, Y.J.; Hu, Q.; Zhao, H.T.; Qian, X.Q. Five years nitrogen reduction management shifted soil bacterial community structure and function in high-yielding 'super' rice cultivation. Agric. Ecosyst. Environ. 2024, 360, 108773. [Google Scholar] [CrossRef]
- Hirooka, Y.; Homma, K.; Shiraiwa, T.; Kuwada, M. Parameterization of leaf growth in rice (Oryza sativa L.) utilizing a plant canopy analyzer. Field Crop. Res. 2016, 186, 117–123. [Google Scholar] [CrossRef]
Figure 1.
Mean leaf area indexes of rice under different total nitrogen once applied time treatments. L6, L7, L8, L9 and L10 represented that total nitrogen was once applied at sixth, seventh, eighth, ninth and tenth leaf age stages, respectively. Vertical bars represented ± standard error of the mean (n = 3). Different letters above the column indicated statistical significance at the 0.05 probability level.
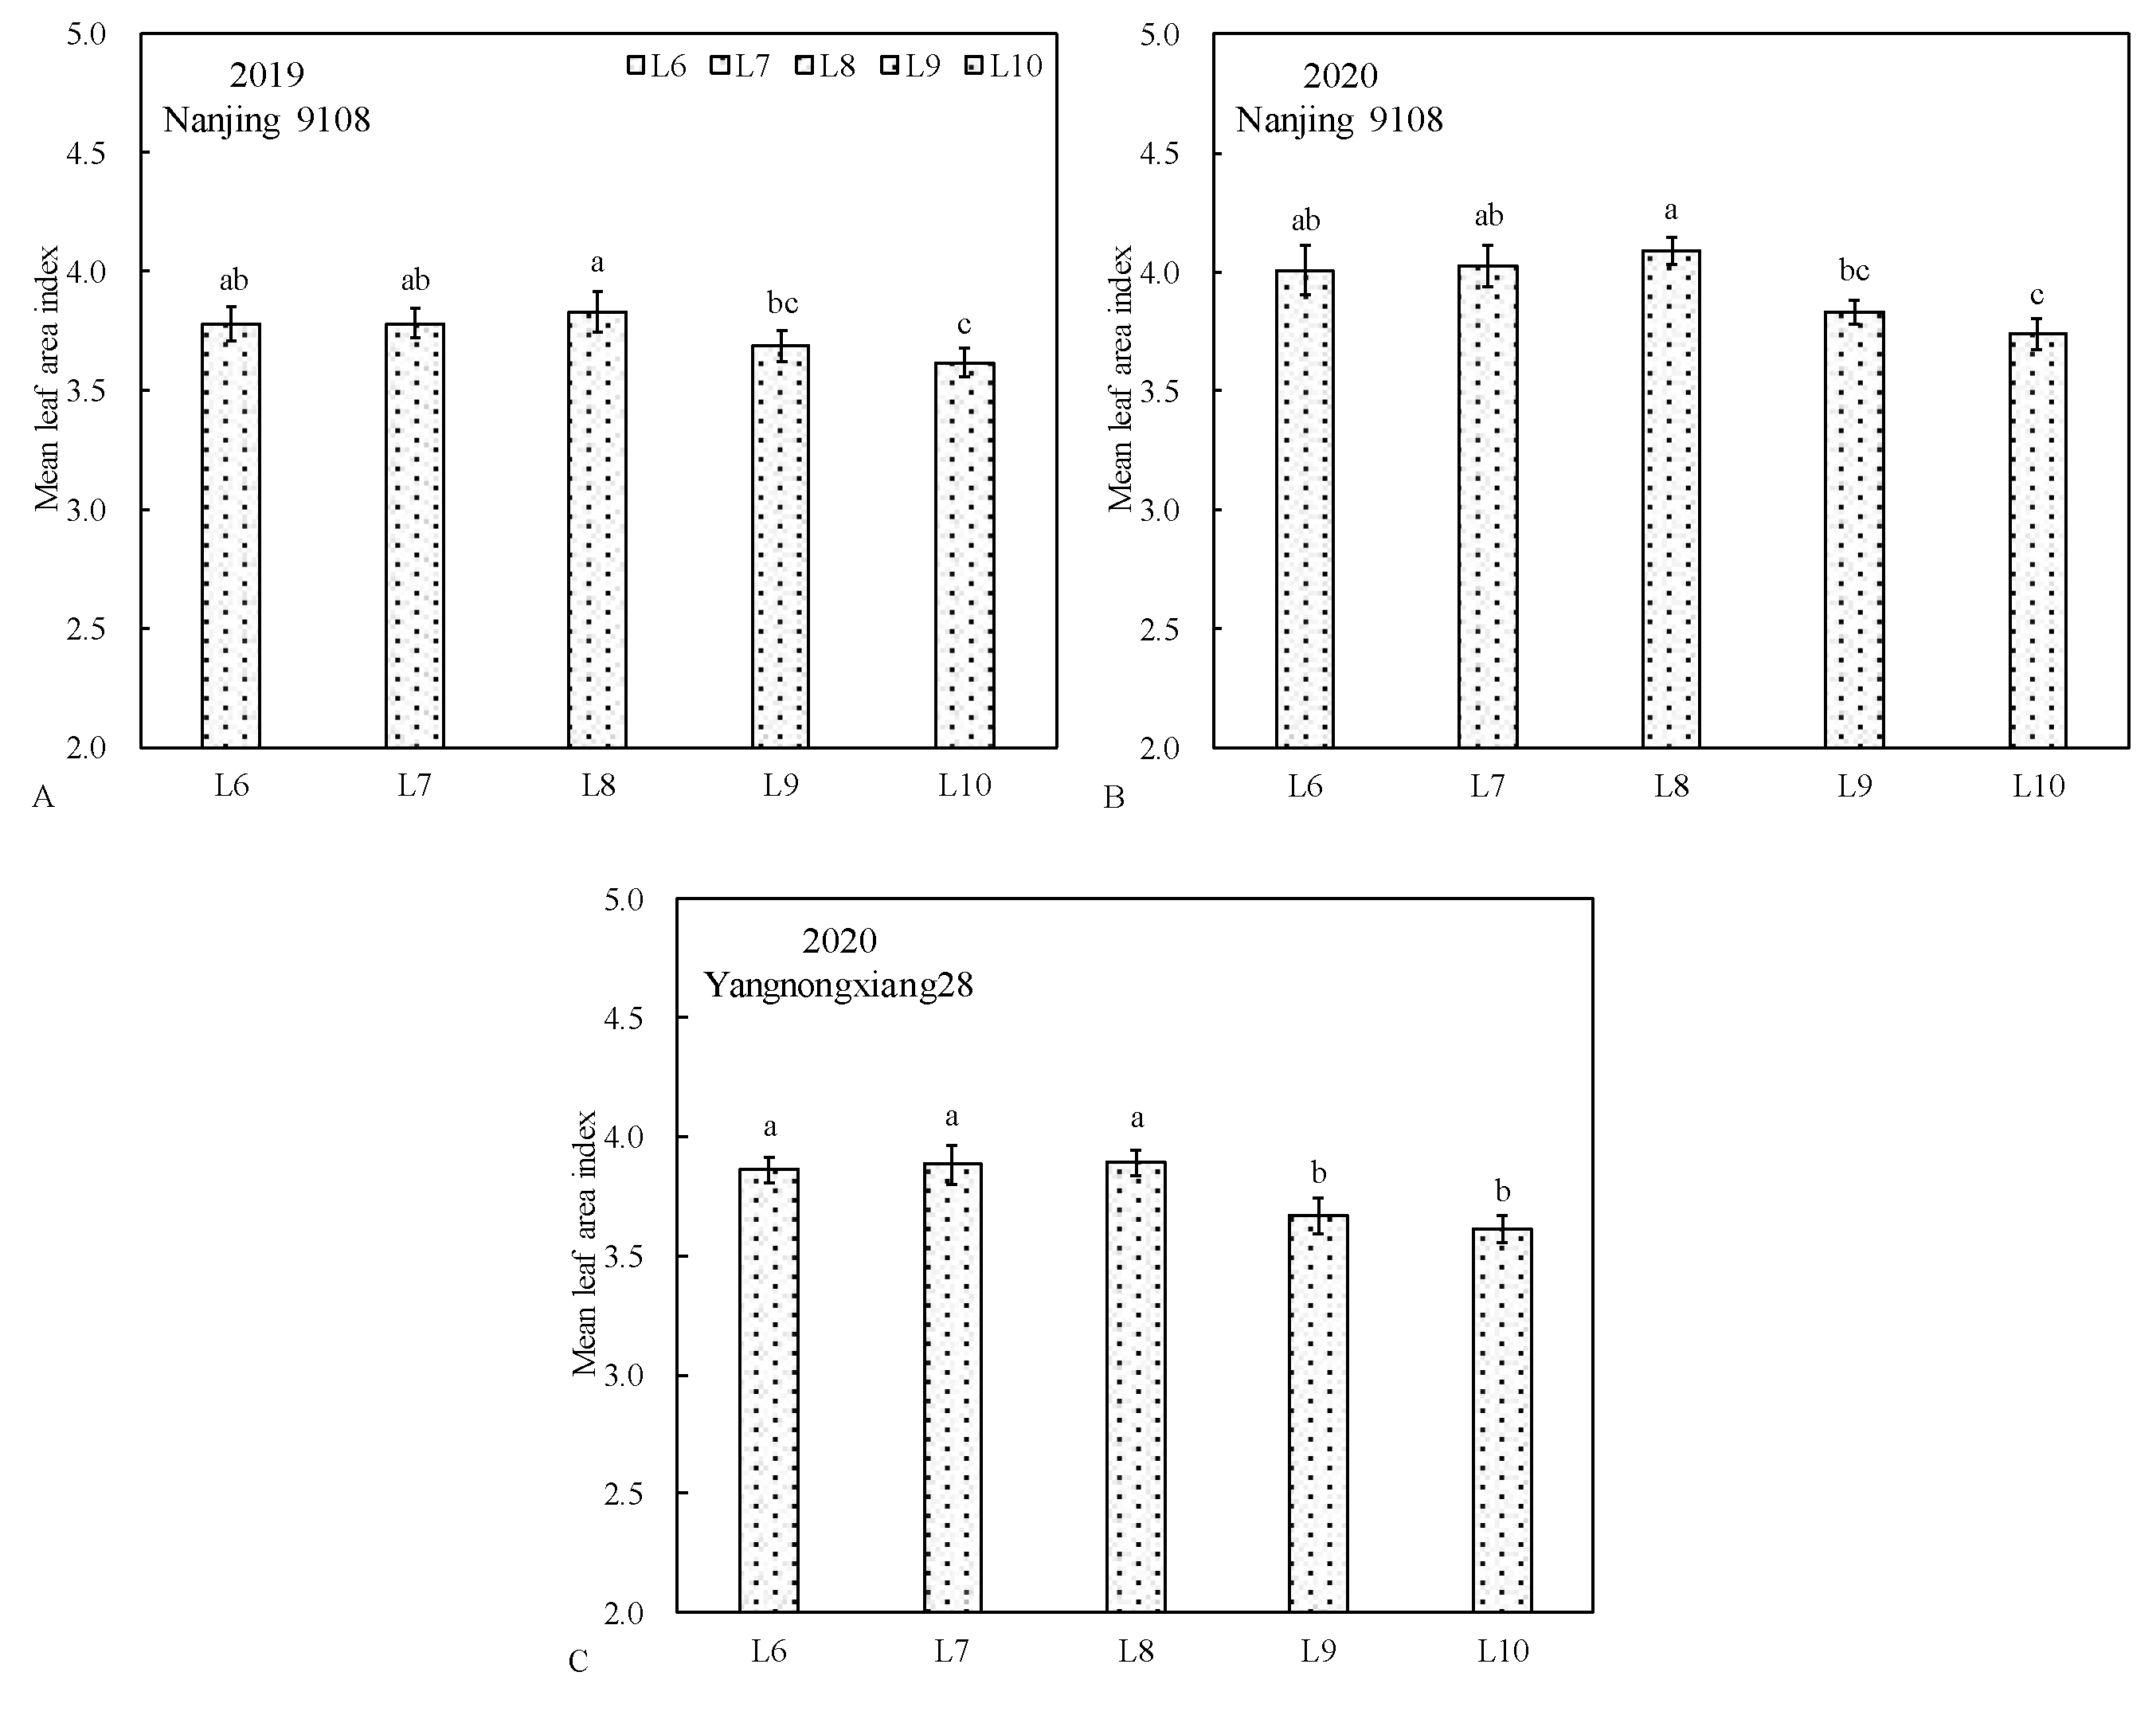
Figure 2.
Effective leaf area rates at heading stage of rice under different total nitrogen once applied time treatments. L6, L7, L8, L9 and L10 represented that total nitrogen was once applied at sixth, seventh, eighth, ninth and tenth leaf age stages, respectively. Vertical bars represented ± standard error of the mean (n = 3). Different letters above the column indicated statistical significance at the 0.05 probability level.
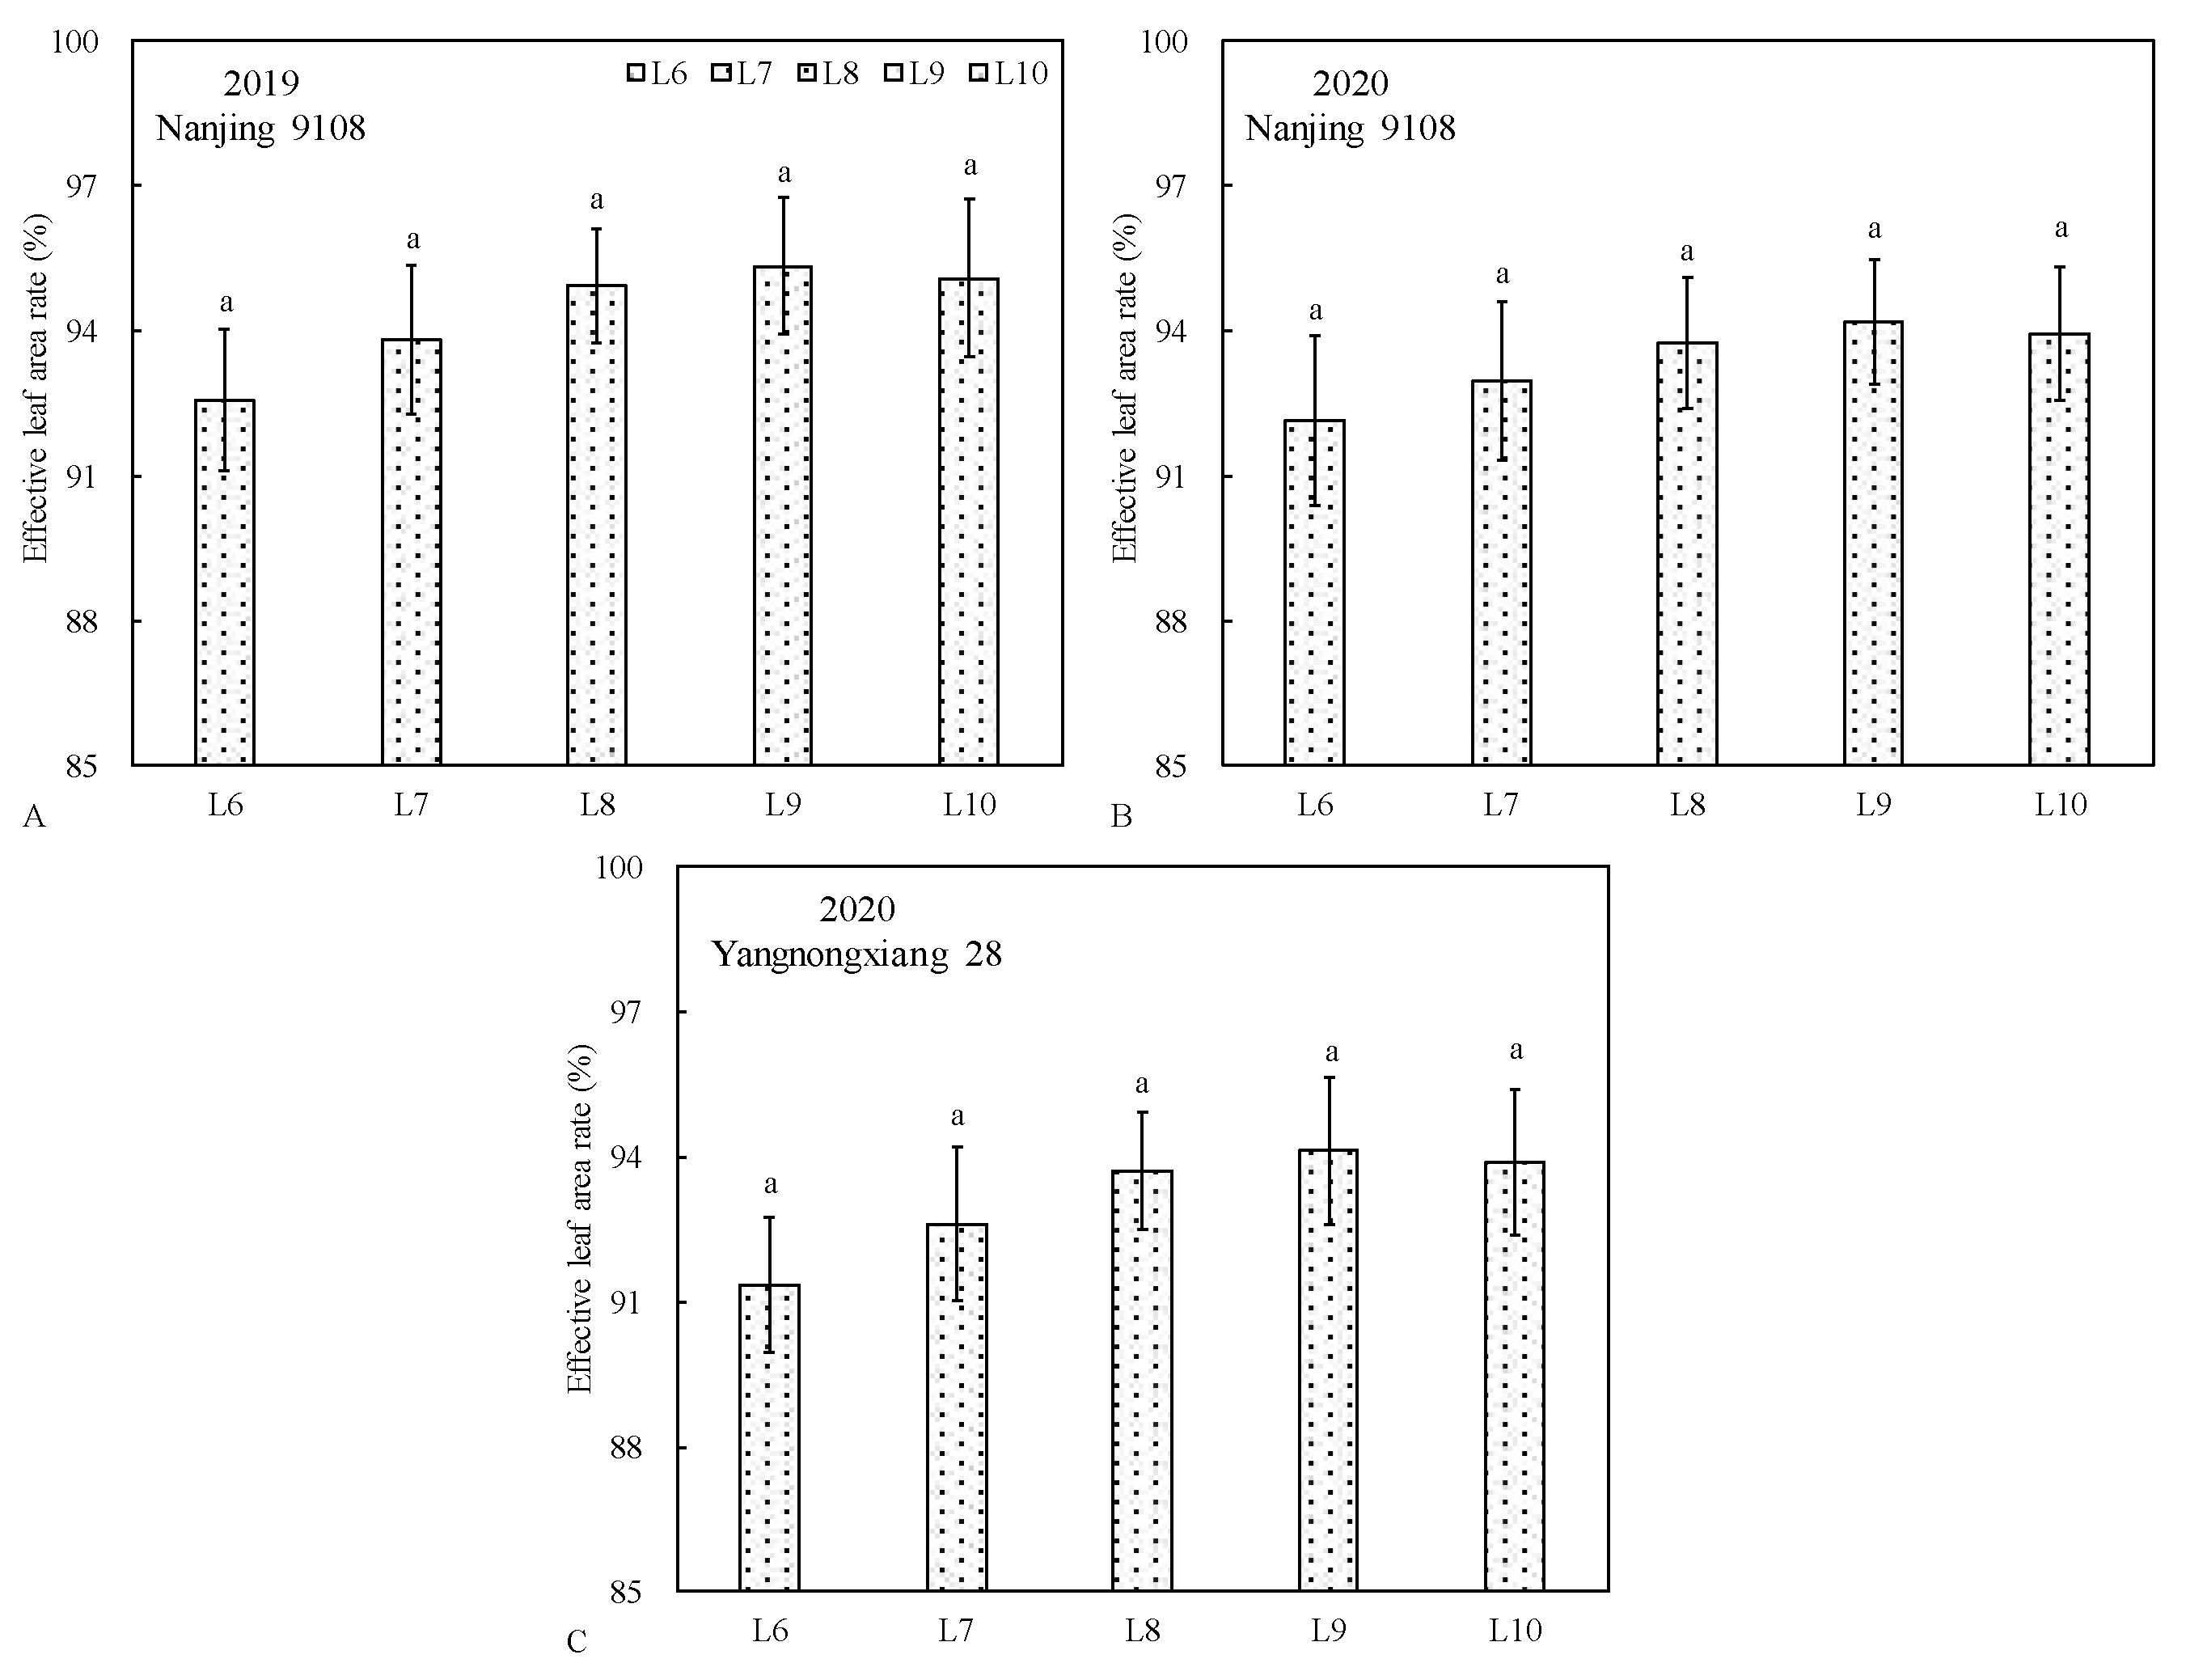
Figure 3.
High effective leaf area rates at heading stage of rice under different total nitrogen once applied time treatments. L6, L7, L8, L9 and L10 represented that total nitrogen was once applied at sixth, seventh, eighth, ninth and tenth leaf age stages, respectively. Vertical bars represented ± standard error of the mean (n = 3). Different letters above the column indicated statistical significance at the 0.05 probability level.
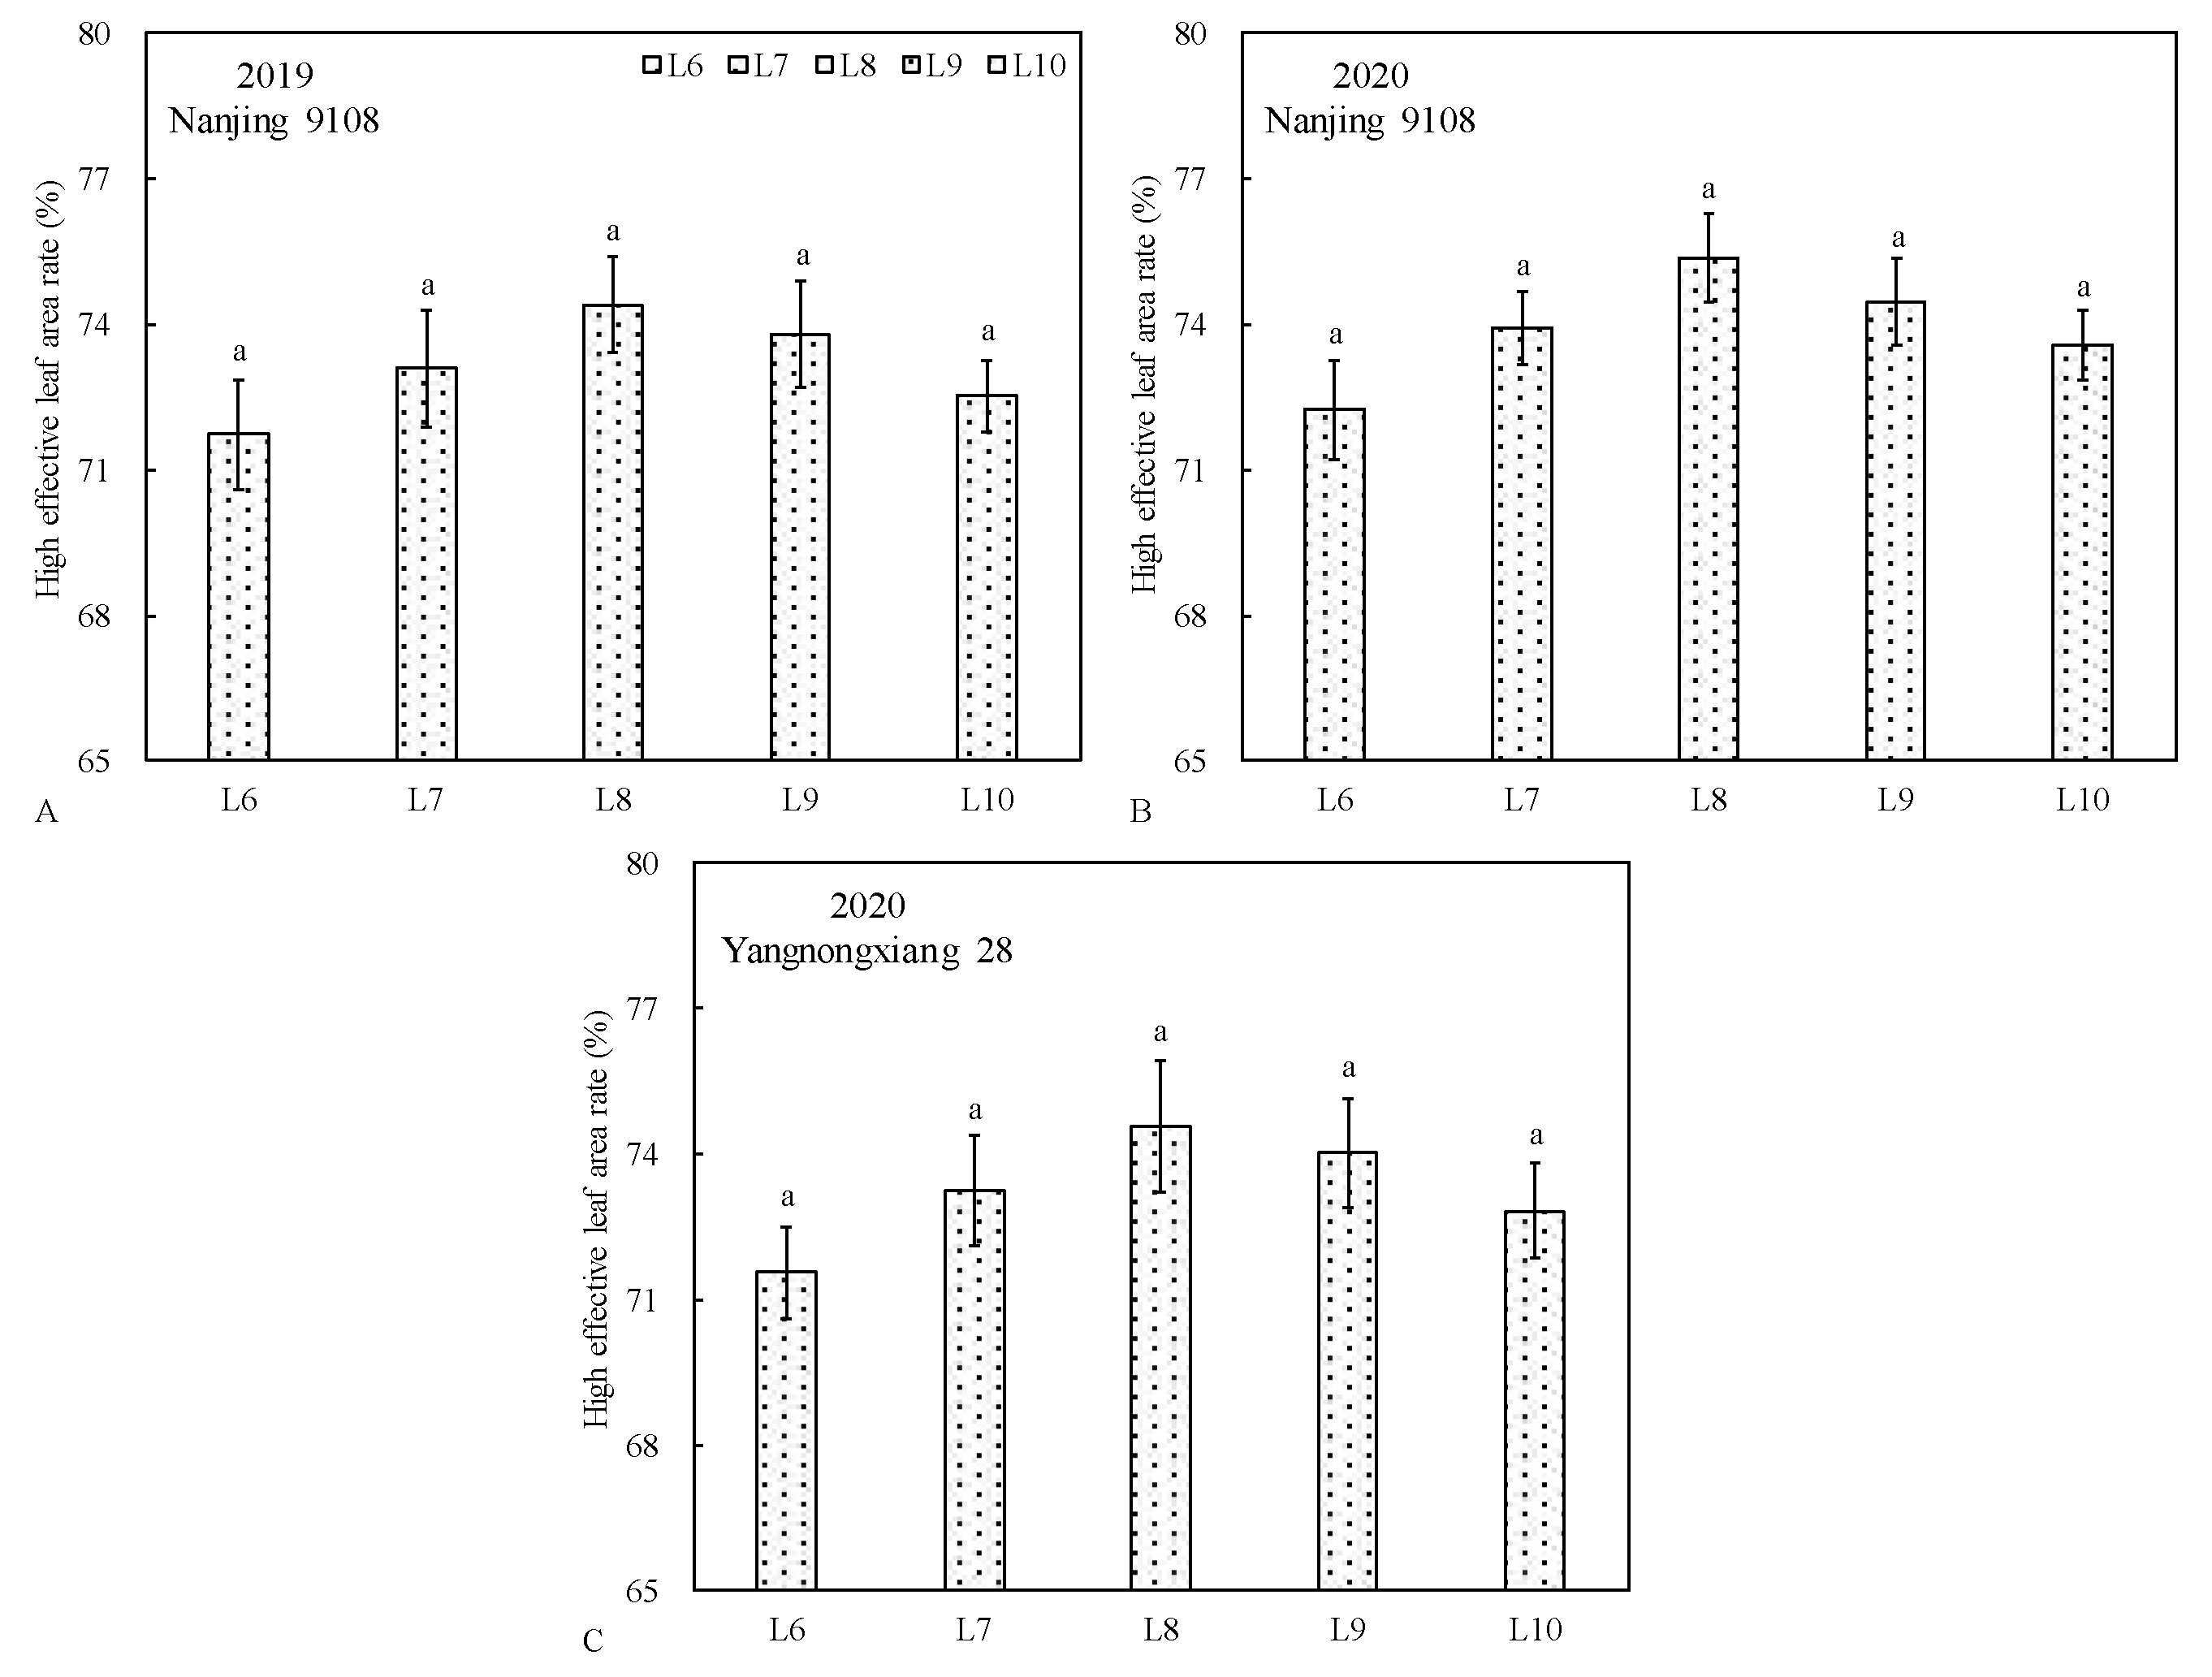
Figure 4.
Grain yield and harvest index of rice under different total nitrogen once applied time treatments. L6, L7, L8, L9 and L10 represented that total nitrogen was once applied at sixth, seventh, eighth, ninth and tenth leaf age stages, respectively. Vertical bars represented ± standard error of the mean (n = 3). Different letters above the column indicated statistical significance at the 0.05 probability level.
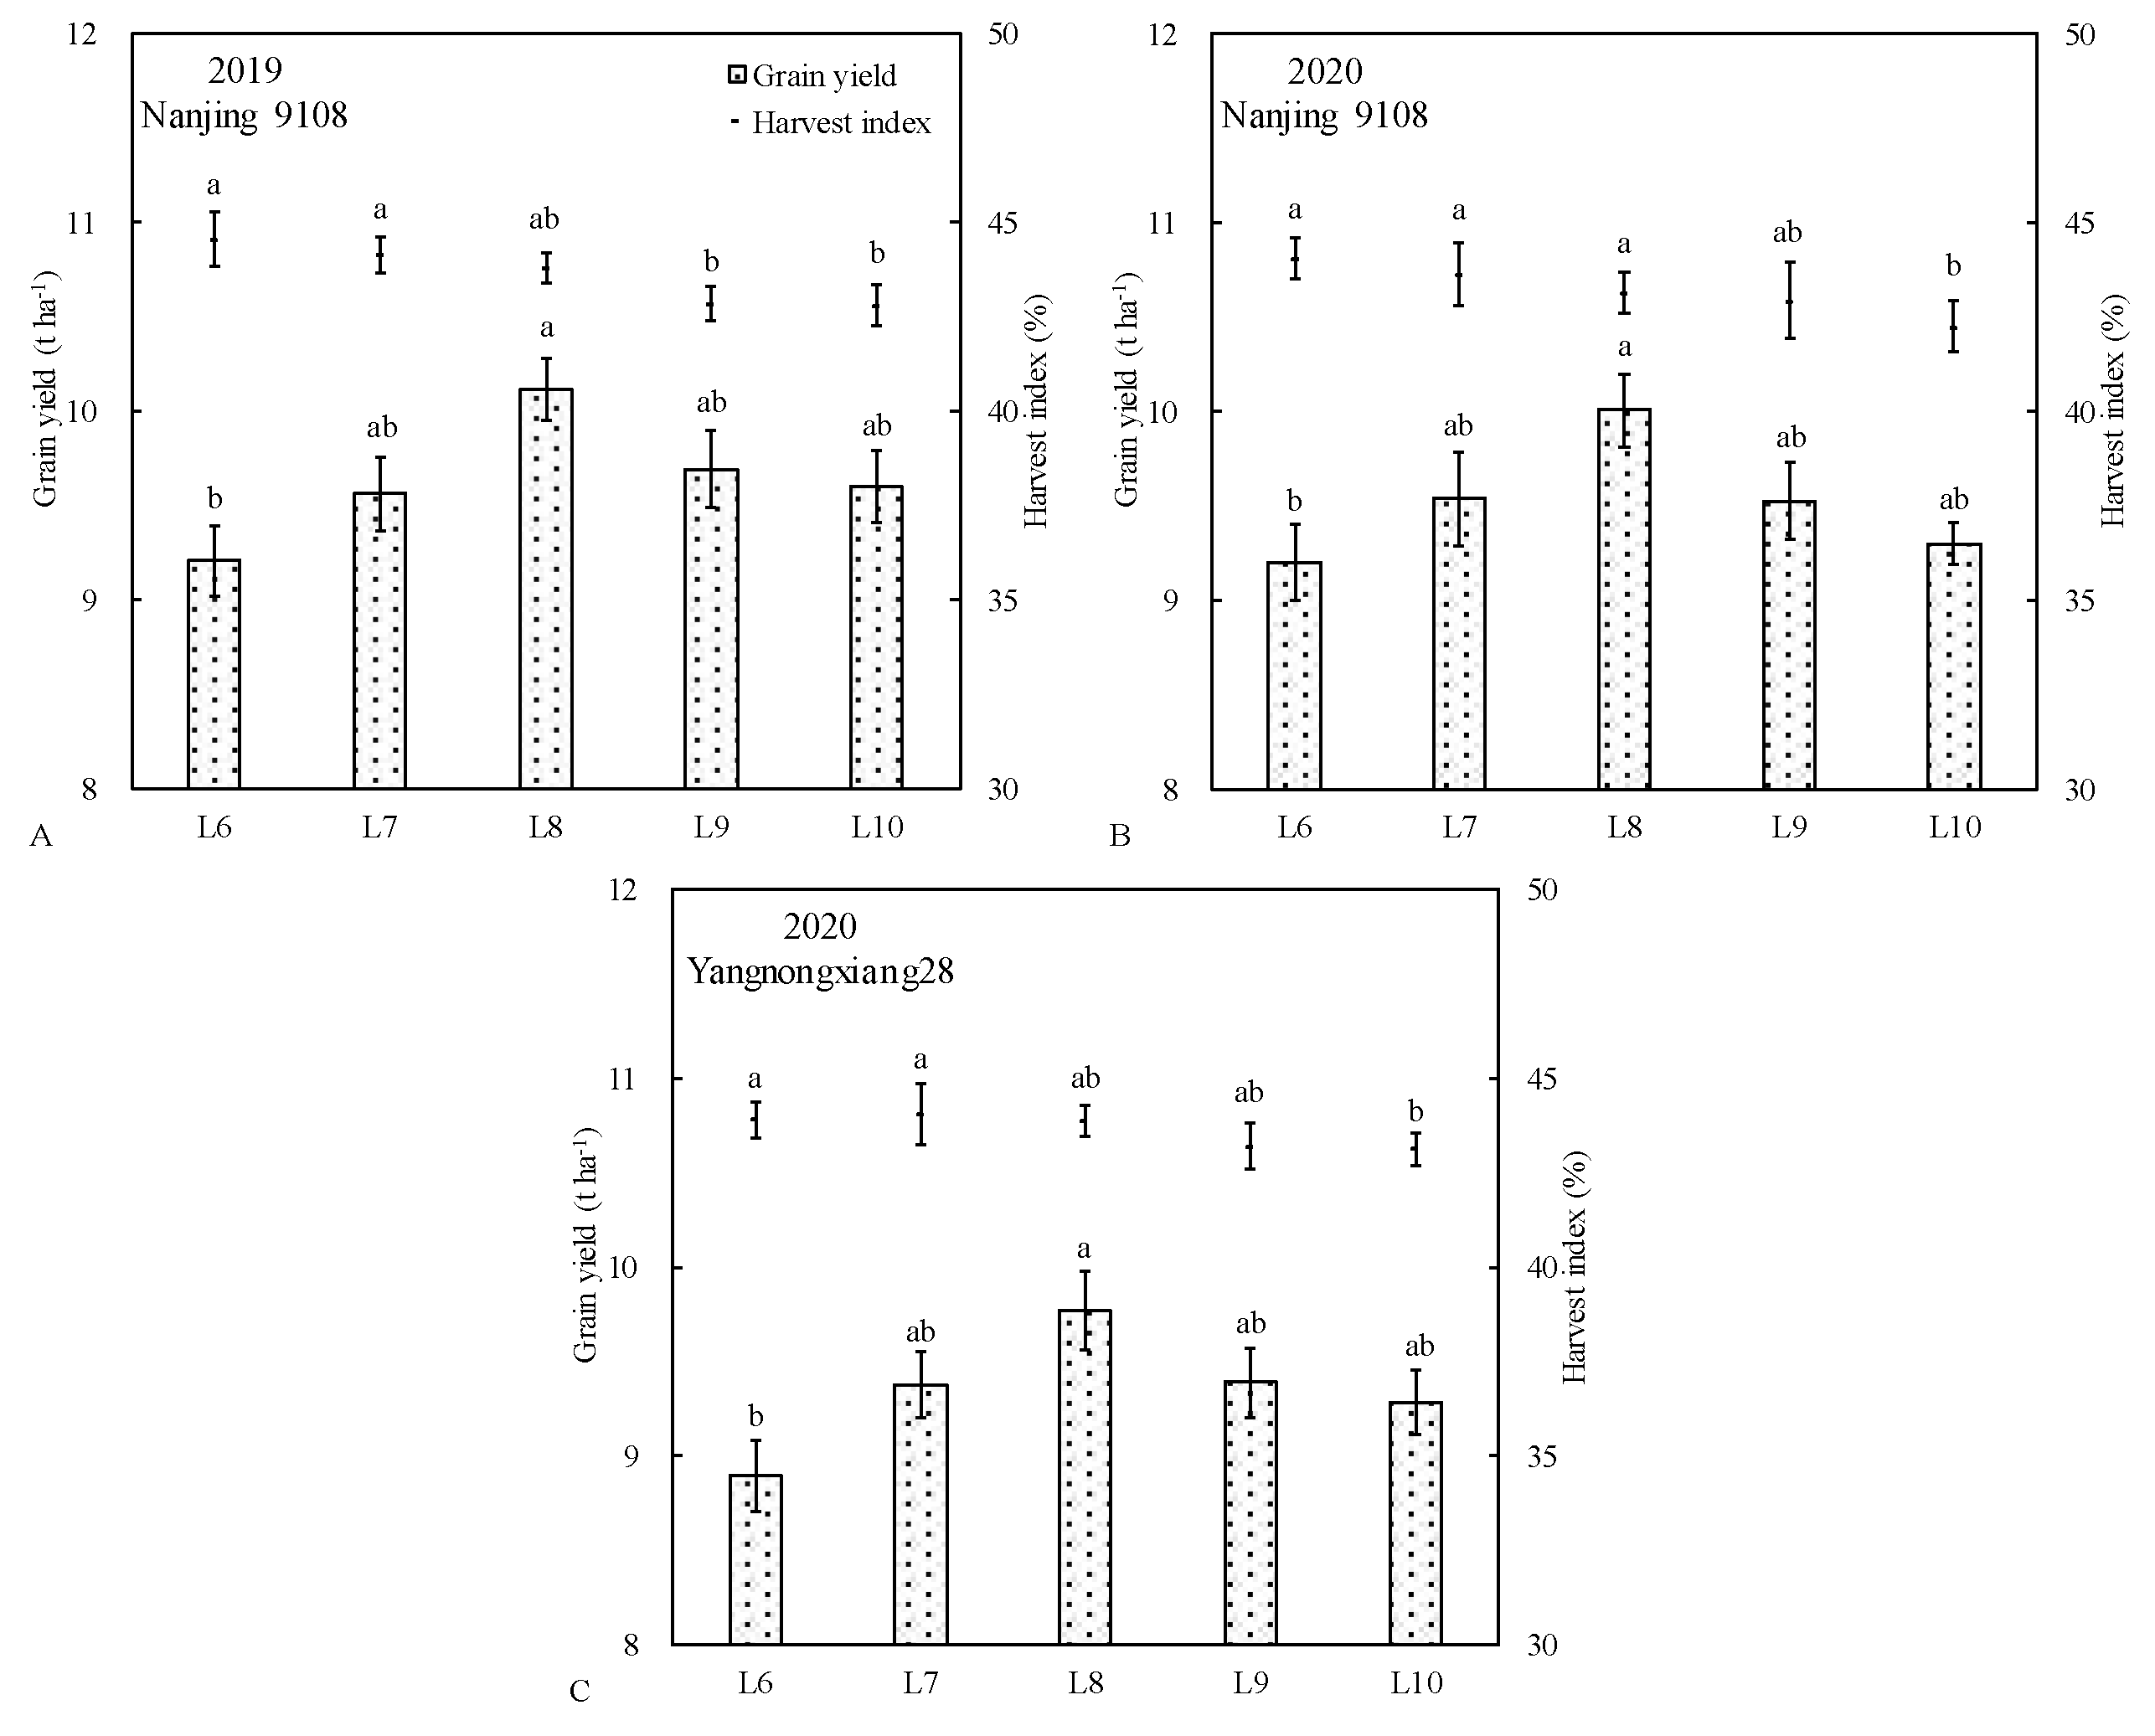
Figure 5.
The daily average temperature and solar radiation of rice growing season in 2019 (A) and 2020 (B) at Jiangyan experimental station of Yangzhou University, China.
Figure 5.
The daily average temperature and solar radiation of rice growing season in 2019 (A) and 2020 (B) at Jiangyan experimental station of Yangzhou University, China.
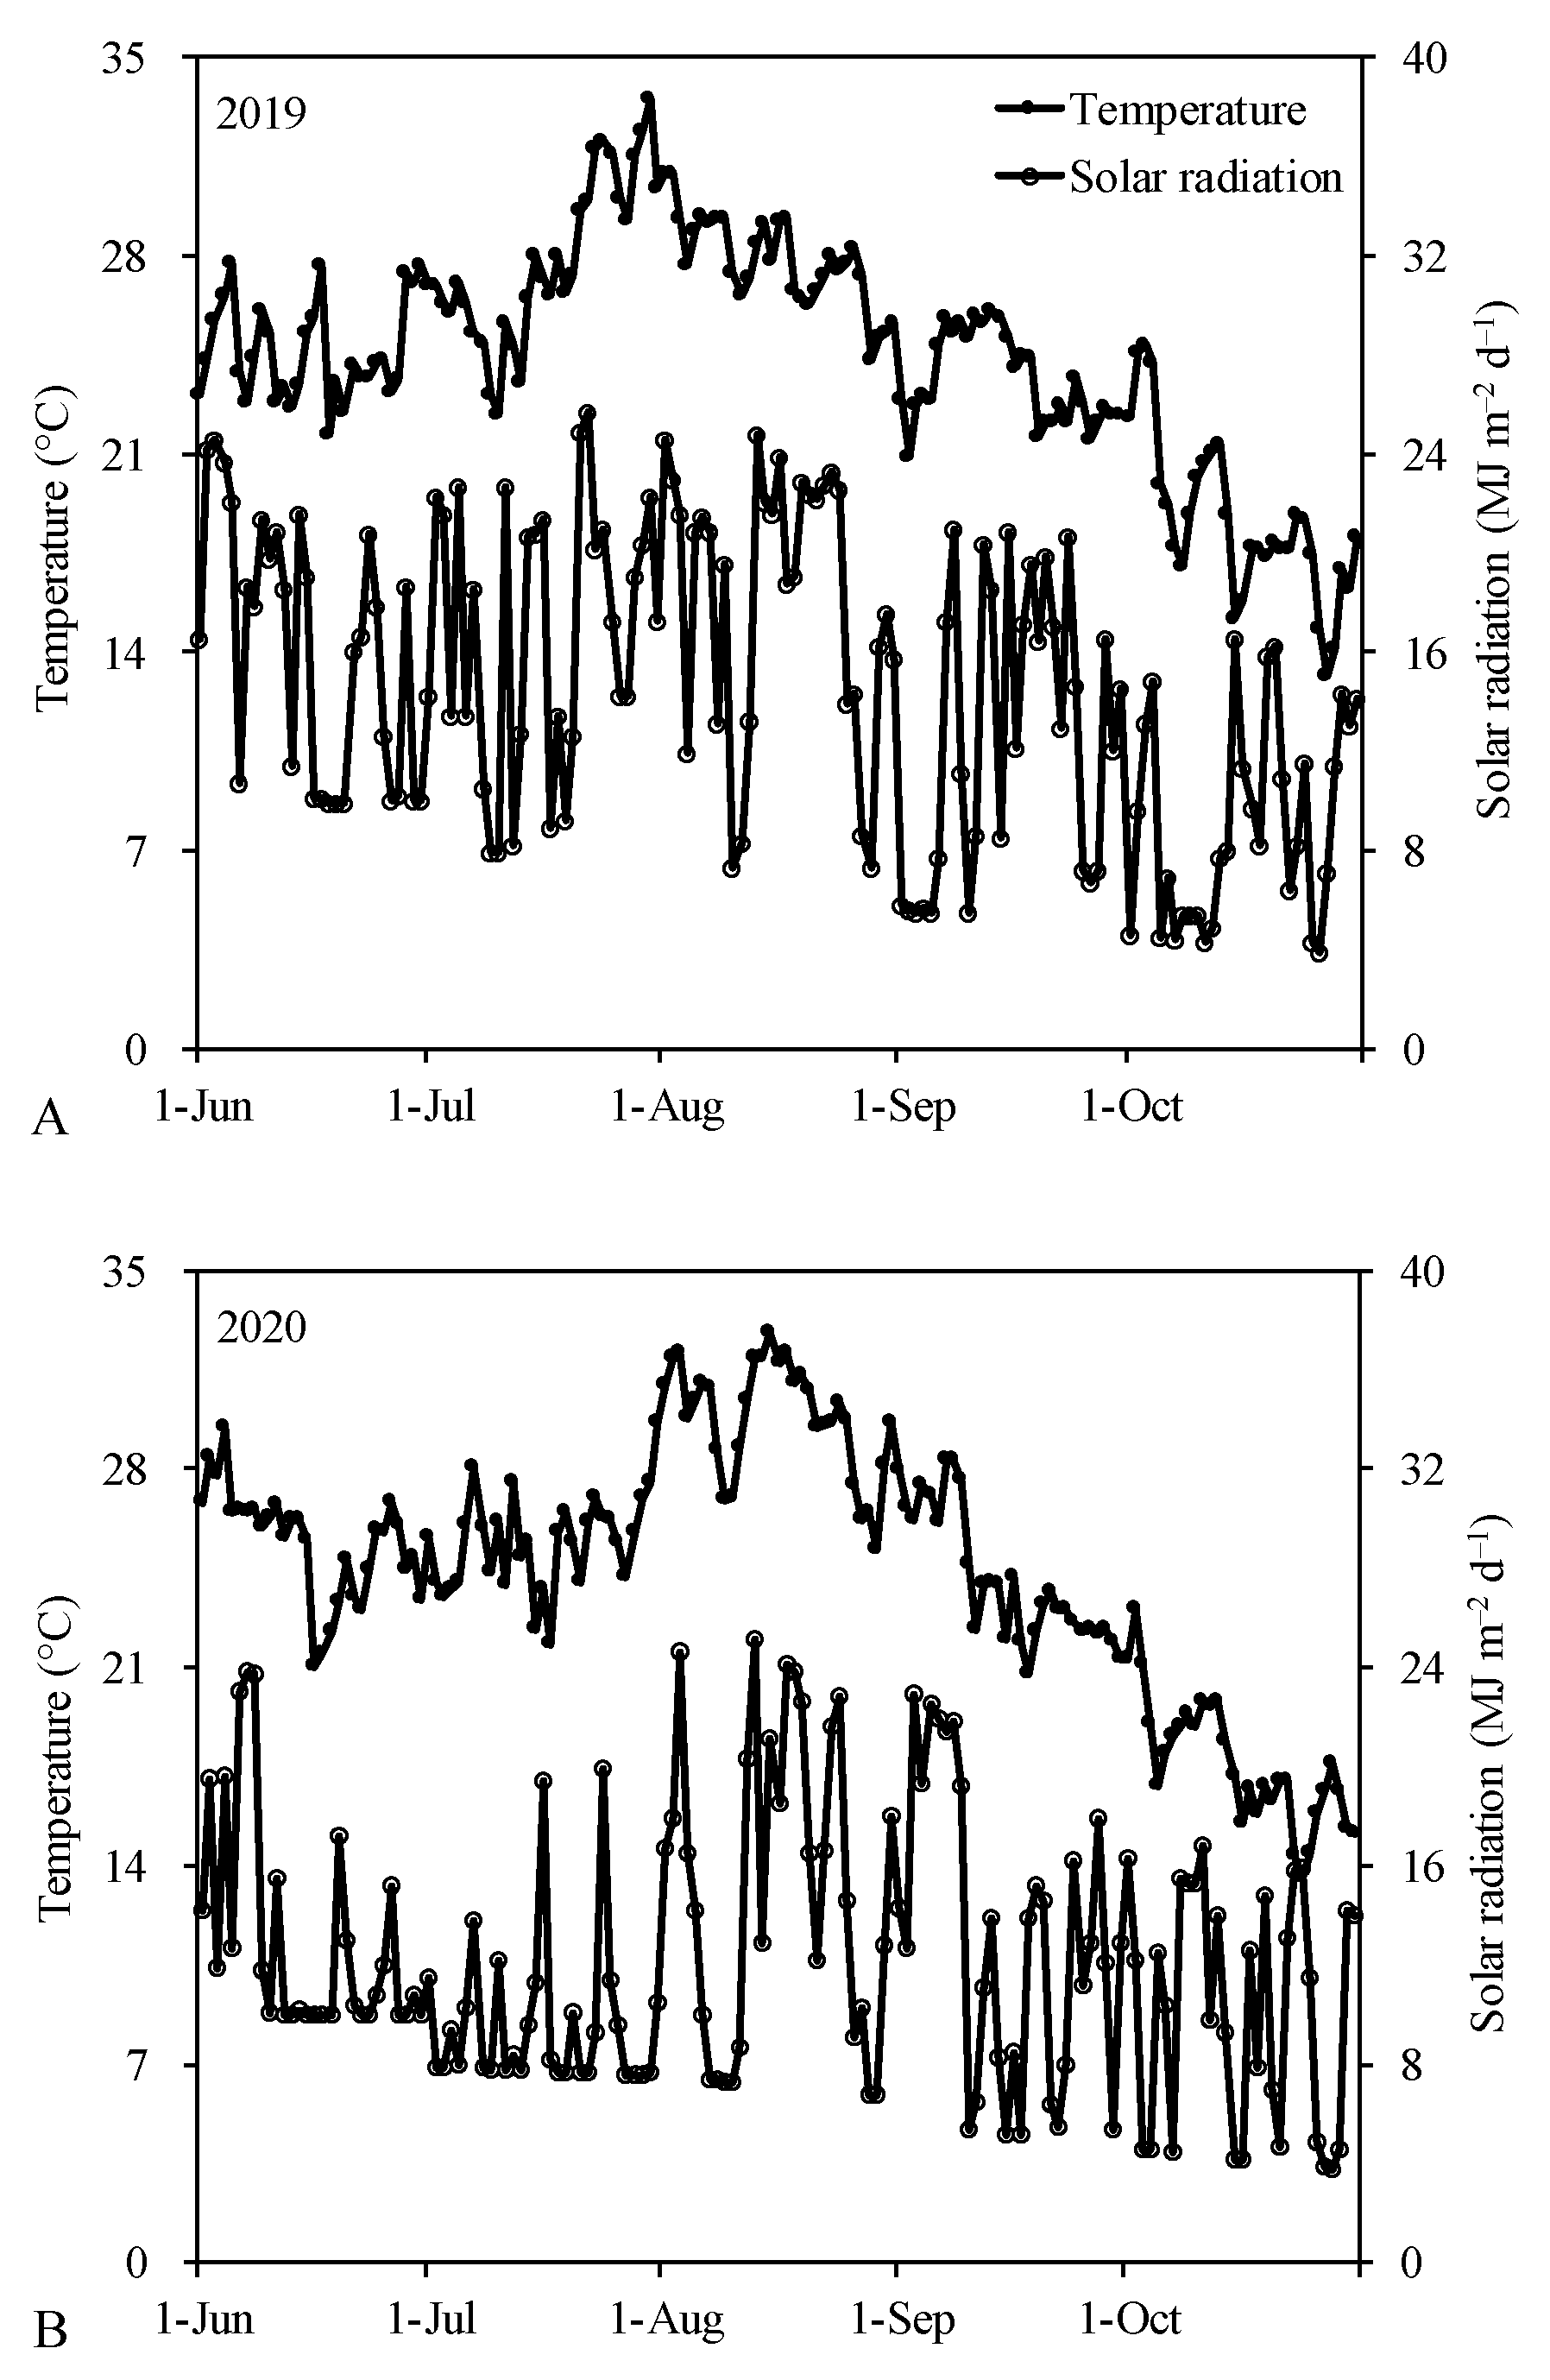

Table 1.
Leaf area indexes of rice under different total nitrogen once applied time treatments.
| Year/Cultivar | Treatment | Tenth-leaf stage |
Jointing stage |
Booting stage |
Heading stage |
Maturity stage |
|---|---|---|---|---|---|---|
| 2019 | ||||||
|
Nanjing 9108 |
L6 | 2.84a | 4.18a | 7.39b | 6.82b | 3.02c |
| L7 | 2.48b | 4.08a | 7.63ab | 7.13ab | 3.17bc | |
| L8 | 2.28b | 3.87a | 7.95a | 7.54a | 3.46b | |
| L9 | 1.76c | 3.44b | 7.82ab | 7.46a | 3.92a | |
| L10 | 1.75c | 3.29b | 7.79ab | 7.31a | 4.08a | |
| 2020 | ||||||
|
Nanjing 9108 |
L6 | 2.89a | 4.39a | 7.52b | 6.84b | 3.20c |
| L7 | 2.49ab | 4.22ab | 7.73ab | 7.32ab | 3.33bc | |
| L8 | 2.29b | 3.97abc | 8.07a | 7.67a | 3.64ab | |
| L9 | 1.69c | 3.63bc | 7.96ab | 7.56a | 3.79a | |
| L10 | 1.67c | 3.42c | 7.89ab | 7.30ab | 3.86a | |
|
Yangnong xiang 28 |
L6 | 2.80a | 4.17a | 7.58b | 7.04b | 3.44b |
| L7 | 2.34b | 4.08a | 7.71ab | 7.44ab | 3.63ab | |
| L8 | 2.21b | 3.92ab | 8.02a | 7.65a | 3.78ab | |
| L9 | 1.69c | 3.71b | 7.95ab | 7.55ab | 3.86ab | |
| L10 | 1.68c | 3.58b | 7.91ab | 7.39a | 3.92a |
Note: L6, L7, L8, L9 and L10 represented that total nitrogen was once applied at the sixth, seventh, eighth, ninth and tenth leaf age stages, respectively. Different letters indicated statistical significance at the 0.05 probability level within the same column.
Table 2.
Leaf area durations of rice under different total nitrogen once applied time treatments.
| Year/Cultivar | Treatment | Before jointing stage (m2 m–2 d–1) |
Jointing to heading stage (m2 m–2 d–1) |
Heading to maturity stage (m2 m–2 d–1) |
|---|---|---|---|---|
| 2019 | ||||
|
Nanjing 9108 |
L6 | 110.77a | 159.48ab | 236.13b |
| L7 | 108.15a | 162.52a | 247.06b | |
| L8 | 106.54a | 165.57a | 264.10b | |
| L9 | 94.47b | 158.02ab | 273.11a | |
| L10 | 93.72b | 153.64b | 273.21a | |
| 2020 | ||||
|
Nanjing 9108 |
L6 | 118.43a | 168.42ab | 251.00b |
| L7 | 115.92a | 172.98ab | 266.18b | |
| L8 | 109.22ab | 174.63a | 282.77a | |
| L9 | 103.32ab | 167.73ab | 283.64a | |
| L10 | 97.45b | 160.83b | 278.96a | |
|
Yangnong xiang28 |
L6 | 120.83a | 151.36b | 262.10b |
| L7 | 118.35ab | 161.35a | 276.92ab | |
| L8 | 117.54ab | 161.92a | 285.61a | |
| L9 | 114.86ab | 157.52ab | 285.14a | |
| L10 | 110.85b | 153.57ab | 282.89a |
Note: L6, L7, L8, L9 and L10 represented that total nitrogen was once applied at sixth, seventh, eighth, ninth and tenth leaf age stages, respectively. Different letters indicated statistical significance at the 0.05 probability level within the same column.
Table 3.
Above-ground dry matter weights of rice at main growth stages under different total nitrogen once applied time treatments.
Table 3.
Above-ground dry matter weights of rice at main growth stages under different total nitrogen once applied time treatments.
| Year/Cultivar | Treatment | Tenth-leaf stage (t ha-1) |
Jointing stage (t ha-1) |
Heading stage (t ha-1) |
Milky stage (t ha-1) |
Maturity stage (t ha-1) |
|---|---|---|---|---|---|---|
| 2019 | ||||||
|
Nanjing 9108 |
L6 | 2.17a | 4.53a | 11.10abc | 14.02c | 17.67b |
| L7 | 1.99ab | 4.47a | 11.52ab | 15.36b | 18.53ab | |
| L8 | 1.83bc | 4.38ab | 11.96a | 16.54a | 19.75a | |
| L9 | 1.74c | 3.84bc | 10.67bc | 15.76ab | 19.35a | |
| L10 | 1.74c | 3.71c | 10.28c | 15.54b | 19.19a | |
| 2020 | ||||||
|
Nanjing 9108 |
L6 | 2.19a | 5.03a | 11.23abc | 14.95c | 17.86b |
| L7 | 2.01b | 5.00a | 11.54ab | 15.56bc | 18.69ab | |
| L8 | 1.80c | 4.47a | 12.13a | 17.02a | 19.83a | |
| L9 | 1.71c | 3.70b | 10.83bc | 15.97b | 18.98ab | |
| L10 | 1.71c | 3.59b | 10.38c | 15.62bc | 18.83ab | |
|
Yangnong xiang28 |
L6 | 2.11a | 4.75a | 10.92bc | 14.48b | 17.34b |
| L7 | 1.91b | 4.68a | 11.24ab | 14.97b | 18.22ab | |
| L8 | 1.79bc | 4.17ab | 11.71a | 16.54a | 19.05a | |
| L9 | 1.69c | 3.73b | 10.72bc | 15.23b | 18.58a | |
| L10 | 1.69c | 3.57b | 10.26c | 14.98b | 18.41ab |
Note: L6, L7, L8, L9 and L10 represented that total nitrogen was once applied at sixth, seventh, eighth, ninth and tenth leaf age stages, respectively. Different letters indicated statistical significance at the 0.05 probability level within the same column.
Table 4.
Above-ground dry matter weight of rice in determined periods under different total nitrogen once applied time treatments.
Table 4.
Above-ground dry matter weight of rice in determined periods under different total nitrogen once applied time treatments.
| Year/ Cultivar |
Treatment | RAPT before jointing stage (%) | Jointing to heading stage | Heading to maturity stage | ||
|---|---|---|---|---|---|---|
| ADW (t ha-1) | RCPT (%) | ADW (t ha-1) | RAPT (%) | |||
| 2019 | ||||||
|
Nanjing 9108 |
L6 | 25.6a | 6.58c | 37.2b | 6.57c | 37.2d |
| L7 | 24.1a | 7.05b | 38.1ab | 7.01c | 37.8d | |
| L8 | 22.2b | 7.58a | 38.4a | 7.79b | 39.4c | |
| L9 | 19.8c | 6.84bc | 35.4c | 8.67a | 44.8b | |
| L10 | 19.3c | 6.57c | 34.2d | 8.91a | 46.4a | |
| 2020 | ||||||
|
Nanjing 9108 |
L6 | 28.2a | 6.20c | 34.7b | 6.63d | 37.1b |
| L7 | 26.7a | 6.54bc | 35.0b | 7.14cd | 38.2b | |
| L8 | 22.5b | 7.66a | 38.6a | 7.71bc | 38.9b | |
| L9 | 19.5c | 7.13ab | 37.7ab | 8.14ab | 42.9a | |
| L10 | 19.1c | 6.78bc | 36.0ab | 8.45a | 44.9a | |
|
Yangnong xiang28 |
L6 | 27.4a | 6.17c | 35.6b | 6.42d | 37.0b |
| L7 | 25.7a | 6.55bc | 36.0b | 6.98cd | 38.3b | |
| L8 | 21.9b | 7.54a | 39.5a | 7.34bc | 38.5b | |
| L9 | 20.1b | 6.99ab | 37.6ab | 7.86ab | 42.3a | |
| L10 | 19.4b | 6.69bc | 36.3b | 8.15a | 44.3a | |
Note: L6, L7, L8, L9 and L10 represented that total nitrogen was applied at sixth, seventh, eighth, ninth and tenth leaf age stages, respectively. ADW was above-ground dry matter weight. RAPT was ratio of above-ground dry matter weight in a determined phase to total. Different letters indicated statistical significance at the 0.05 probability level within the same column.
Table 5.
Crop growth rate and net assimilation rate of rice under different total nitrogen once applied time treatments.
Table 5.
Crop growth rate and net assimilation rate of rice under different total nitrogen once applied time treatments.
| Year/ Cultivar |
Treatment | Before jointing stage (g m–2 d–1) |
Jointing to heading stage (g m–2 d–1) |
Heading to maturity stage (g m–2 d–1) |
|||
|---|---|---|---|---|---|---|---|
| CGR | NAR | CGR | NAR | CGR | NAR | ||
| 2019 | |||||||
|
Nanjing 9108 |
L6 | 8.54a | 2.92a | 22.67c | 4.21c | 13.69c | 2.94c |
| L7 | 8.43a | 2.90a | 24.32b | 4.45b | 14.60c | 2.99c | |
| L8 | 7.96ab | 2.78ab | 26.14a | 4.75a | 16.23b | 3.10bc | |
| L9 | 6.97bc | 2.50bc | 23.58bc | 4.54ab | 18.07a | 3.28ab | |
| L10 | 6.51c | 2.36c | 22.64c | 4.50b | 18.57a | 3.36a | |
| 2020 | |||||||
|
Nanjing 9108 |
L6 | 9.31a | 3.14a | 20.68c | 3.75b | 13.26d | 2.77b |
| L7 | 9.09ab | 3.10a | 21.81bc | 3.89b | 14.29cd | 2.82ab | |
| L8 | 8.12b | 2.82a | 25.53a | 4.55a | 15.41bc | 2.85ab | |
| L9 | 6.49c | 2.30b | 23.78b | 4.45a | 16.29ab | 2.99ab | |
| L10 | 6.31c | 2.27b | 22.61bc | 4.42a | 16.91a | 3.13a | |
|
Yangnong xiang28 |
L6 | 8.19a | 2.80a | 22.86b | 4.17b | 12.83d | 2.56b |
| L7 | 8.07a | 2.78ab | 23.41b | 4.19b | 13.96cd | 2.64ab | |
| L8 | 6.96b | 2.42bc | 26.92a | 4.83a | 14.68bc | 2.68ab | |
| L9 | 6.02bc | 2.12c | 24.98ab | 4.63ab | 15.72ab | 2.86ab | |
| L10 | 5.76c | 2.05c | 23.88b | 4.55ab | 16.30a | 2.98a | |
Note: L6, L7, L8, L9 and L10 represented that total nitrogen was once applied at sixth, seventh, eighth, ninth and tenth leaf age stages, respectively. CGR and NAR were crop growth rate and net assimilation rate, respectively. Different letters indicated statistical significance at the 0.05 probability level within the same column.
Table 6.
Grain-leaf ratio traits of rice under different total nitrogen once applied time treatments.
Table 6.
Grain-leaf ratio traits of rice under different total nitrogen once applied time treatments.
| Year/Cultivar | Treatment | RTSL (cm-2) | RTGL (cm-2) | RGWL (mg cm-2) |
|---|---|---|---|---|
| 2019 | ||||
|
Nanjing 9108 |
L6 | 0.474bc | 0.454b | 12.45a |
| L7 | 0.495b | 0.465b | 12.53a | |
| L8 | 0.540a | 0.502a | 12.73a | |
| L9 | 0.472bc | 0.433bc | 12.41a | |
| L10 | 0.443c | 0.411c | 12.33a | |
| 2020 | ||||
|
Nanjing 9108 |
L6 | 0.487bc | 0.462ab | 12.23a |
| L7 | 0.519ab | 0.486a | 12.34a | |
| L8 | 0.543a | 0.500a | 12.40a | |
| L9 | 0.465bc | 0.422b | 11.97a | |
| L10 | 0.443c | 0.406b | 11.80a | |
|
Yangnong xiang28 |
L6 | 0.449bc | 0.427b | 11.74a |
| L7 | 0.478b | 0.444b | 12.16a | |
| L8 | 0.520a | 0.478a | 12.18a | |
| L9 | 0.455bc | 0.413bc | 11.81a | |
| L10 | 0.429c | 0.393c | 11.74a |
Note: L6, L7, L8, L9 and L10 represented that total nitrogen was once applied at sixth, seventh, eighth, ninth and tenth leaf age stages, respectively. RTSL, RTGL and RGWL indicated the ratio of total spikelets to leaf area index at booting stage, ratio of total grains to leaf area index at booting stage and ratio of total grain weight to leaf area index at booting stage, respectively. Different letters indicated statistical significance at the 0.05 probability level within the same column.
Disclaimer/Publisher’s Note: The statements, opinions and data contained in all publications are solely those of the individual author(s) and contributor(s) and not of MDPI and/or the editor(s). MDPI and/or the editor(s) disclaim responsibility for any injury to people or property resulting from any ideas, methods, instructions or products referred to in the content. |
© 2024 by the authors. Licensee MDPI, Basel, Switzerland. This article is an open access article distributed under the terms and conditions of the Creative Commons Attribution (CC BY) license (http://creativecommons.org/licenses/by/4.0/).
Copyright: This open access article is published under a Creative Commons CC BY 4.0 license, which permit the free download, distribution, and reuse, provided that the author and preprint are cited in any reuse.


