
Submitted:
04 September 2024
Posted:
04 September 2024
You are already at the latest version
Abstract
Background: Having a laboratory renal profile for medical imaging examinations requiring contrast media (CM) administration is strongly advised. Creatinine helps identify patients at risk of contrast-induced nephropathy (CIN). GEM® Premier™ ChemSTAT (Werfen) is a point-of-care (POC) analyzer with 12 emergency parameters including creatinine assay. The aim of this study consists to compare ChemSTAT with the central analytical solution of the University Hospital of Clermont-Ferrand and to evaluate the interest of the POC creatinine in the emergency department (ED) in optimizing the flow of patients, especially if CM used.
Methods: More than 200 whole blood (WB) samples from the ED were evaluated on the ChemSTAT analyzer. As comparative methods, the plasma aliquots from the same samples were assayed on an Atellica® CH (Siemens Healthineers). The clinical concordance was assessed ac-cording the decision cut-offs of the French Society of Radiology for the risk of CIN. The availability times of biological results between ChemSTAT and the central laboratory were studied.
Results: WB results from ChemSTAT correlated well with those from Atellica® CH, except for tCO2 (known bias between Siemens and Cobas Roche methods predicting ChemSTAT values). The results of creatinine assay allow to have identical medical decisions compared to the renal risk cut-offs. The availability of biological results is reduced by 50 min on average with ChemSTAT vs the central laboratory. Computed tomography was performed for 44.7% of patients including the injection of the CM in 68% of cases. For these patients, the availability of creatinine results relative to imaging time is faster with the ChemSTAT on average of 45.2 min.
Conclusions: Great analytical and clinical correlations for creatinine assay allow safe iden-tification of patients at risk of CIN and improve patient flow in ED especially for those requiring computed tomography with use of CM.
Keywords:
contrast media
; creatinine
; contrast-induced nephropathy
; point-of-care
; ChemSTAT
; emergency
1. Introduction
Emergency department (ED) overcrowding has become a growing problem common around the world with significant public health problems [1]. Therefore, the relevance of early decision, which refers to the availability of reliable biological results, has become a challenge in overloaded emergency services. The point-of-care (POC) systems make it possible to obtain the biological results more quickly and accelerate the overall management of the patient. In addition to blood gases measurements, the availability of partial ionogram (sodium, potassium, chloride and ionized calcium) and some substrates (glucose, creatinine, urea and lactates) in POC make it possible to quickly diagnose and easily monitor acid-base and hydro-electrolytic disorders in whole blood (WB). The availability of creatinine allows quickly assessing the kidney function of patients in ED, especially in order to decrease the risk of contrast-induced nephropathy (CIN), but also improving the organization of access to imaging procedures. The installation of such a POC system should therefore improve the flow of patients. It is above all necessary to ensure that the accuracy of point-of-care tests is equivalent to laboratory assays. Additionally, the turnaround time improvements are not always clinically relevant and the data in the literature are not all consistent [2]. In this study, we evaluated GEM® Premier™ ChemSTAT, a point-of-care system that measures multiple parameters (creatinine, urea, tCO2, electrolytes, glucose, hematocrit, pH and pCO2) from a single sample of WB. These analytical performances have been confirmed by several studies [3,4], especially in our laboratory [5].
The present study focused on the comparison of methods for all analytes and the clinical concordance of the estimated glomerular filtration rate (eGFR) derived from creatinine assay of GEM® Premier™ ChemSTAT with our current laboratory analytical solution. The impact of ChemSTAT implementation on the flow of patients in the G. Montpied University Hospital (Clermont-Ferrand, France) ED was also evaluated for his potential future use.
2. Materials and Methods
2.1. Study Design
A prospective monocentric observational study was performed in the ED of the University Hospital of Clermont-Ferrand, France. GEM® Premier™ ChemSTAT was installed for 3 weeks in a dedicated study room. More than 200 remnant WB samples from the ED patients requiring the chemistry panel were evaluated on the GEM® Premier™ ChemSTAT analyzer. As comparative methods, the plasma aliquots from the same samples were assayed on Atellica® CH (Siemens Healthineers) in the core lab. As the biochemistry residents trained by the Werfen staff carried out the analyses on ChemSTAT, the results were not reported to the referring clinician. Only the results of the core lab were used for clinical decisions.
2.2. Data Collection
The following data were collected:
- Patient demographic data: age, sex
- The reason for ED admission
- Times related to blood collection: time of collection, time of availability of ChemStat and core lab results
- Data relevant to imaging exams: type, use of CM, time between availability of serum creatinine results and onset of imaging, need for analyses other than creatininemia (β-HCG) for imaging decision
- Final diagnosis
- Total ED time for each patient
- Patients outcomes
- Biological assays results on GEM® Premier™ ChemSTAT and Atellica® CH for Na +, K +, Cl−, tCO2, urea, creatinine, glucose and eGFR estimation.
2.3. Study of the Clinical Concordance
In order to evaluate the clinical concordance with the decision cut-offs of the French Society of Radiology (SFR) for the risk of CIN, the comparisons for Chronic Kidney Disease Epidemiology Collaboration (CKD-EPI) clearances between GEM® Premier™ ChemSTAT and Atellica® CH values were performed. The eGFR values were calculated with Chronic Kidney Disease Epidemiology Collaboration (CKD-EPI) race-free equation (ethnicity data were not collected). The impact on clinical decisions based on 30 ml/min/1.73m2 and 45 ml/min/1.73m2 cut-offs was studied with the method of Snaith et al. [6].
2.4. Impact Analysis of POC Creatininemia in ED
The availability of the GEM® Premier™ ChemSTAT and central laboratory biological results was compared, especially for patients who require medical imaging in ED. The difference of the delay compared to the beginning of imaging was evaluated.
2.5. Statistical Analysis
Continuous data were expressed as median and interquartile range for continuous data. Normality was assessed using the Shapiro-Wilk test. Median time from patient admission in ED to blood sampling was calculated. The comparison between the delays of the results with GEM® Premier™ ChemSTAT versus central laboratory was conducted using Wilcoxon paired test. Relationships between continuous data were analyzed using correlation coefficients (Pearson or Spearman, depending on the statistical distribution; noted r). Agreement between GEM® Premier™ ChemSTAT WB and Atellica® CH plasma samples was assessed for each analyte using the Lin concordance correlation coefficient. The results were interpreted in relation to literature recommendations: <0.4: no agreement, 0.4-7: poor agreement, >0.7: moderate to strong agreement. Bland-Altman plots were also plotted. Mean bias and 95% limits of agreement were calculated. In addition, for the creatinine comparison, linear regression was performed to establish a correspondence formula between creatinine Atellica® CH and creatinine GEM® Premier™ ChemSTAT. The agreement between the methods was also examined for creatinine categorized according to the renal risk cut-offs for CIN established by the French Society of Radiology. More precisely, for the eGFR evaluation, the clinical concordance of WB POC results (eGFR cut-off = 30 mL/min/1.73 m2 and eGFR cut-off=45 mL/min/1.73 m2) vs plasma central laboratory results was assessed. A two-tailed P value of less than 0.05 was considered statistically significant. Statistical analyses were performed using Stata software, version 15.0 (StataCorp, College Station, TX). Analysis of method comparisons and graphical presentation of study results were carried out using Plever Viscali software version 6.2.
3. Results
3.1. Characteristic of the Population
Samples from 217 ED critical care patients were analyzed. Median patient age was 64 years (IQR 44-80), 94 women (43.3%) and 123 men (56.7%). General categories of admission reason leading to an ED visit included 193 (88.9%) medical causes, 16 (7.4%) related to psychiatric pathology and 8 (3.7%) patients admitted for surgical problem. Final diagnosis following emergency management was medical for 186 (85.7%) patients, psychiatric in 20 (9.2%) cases and surgical for 11 (5.1%) patients. The patient’s outcome after ED was as follows: hospitalization for 110 (50.9%) patients, discharge at home for 105 (48.2%) patients, death in two (0.9%) cases.
3.2. Method Comparison Study
The number of samples, sample range, regression slope, Pearson correlation coefficient (r), estimated bias and 95% limits of agreement (Bland-Altman) were calculated for each analyte and are summarized in Table 1. WB results from the GEM® Premier™ ChemSTAT correlated well with those from Atellica® CH (Siemens Healthineers) and Table 1 summarizes the regression results. Analyte biases were estimated at each medical decision level per analyte and were all within manufacture’s claims except for:
- tCO2, the bias between comparative methods Siemens and Roche Cobas (ChemSTAT predicate) may attributed to observed low slope and negative bias
- Sodium and Chlorine, the known bias between comparative methods Siemens and ChemSTAT, due to the difference between direct and indirect ion selective electrodes (ISE).

Table 1.
Summary of method comparison between GEM® Premier™ ChemSTAT WB and Atellica® CH plasma samples.
Table 1.
Summary of method comparison between GEM® Premier™ ChemSTAT WB and Atellica® CH plasma samples.
| Analyte | n | Min | Max | r | Slope | Mean Bias (SD) | 95% Limits of Agreement |
|---|---|---|---|---|---|---|---|
| Creatinine (µmol/l) | 217 | 39.4 | 422 | 0.983 | 1,197 | 19.214 (12.344) | -4.979-43.407 |
| Urea (mmol/L) | 206 | 1.7 | 37.54 | 0.982 | 1,237 | 1.587 (1.286) | -0.934-7.109 |
| Na+ (mmol/L) | 217 | 118 | 145 | 0.799 | 1.051 | -2.023(2.276) | -6.484-2.438 |
| K+(mmol/L) | 211 | 2.4 | 7.6 | 0.906 | 1.161 | 0.191(0.273) | -0.344-0.725 |
| Cl- (mmol/L) | 171 | 80 | 114 | 0.888 | 1.232 | 1.129(2.38) | -3.537-5.794 |
| Glucose (mmol/L) | 205 | 3.1 | 52.56 | 0.971 | 0.899 | -0.027(1.140) | -2.261-2.207 |
| tCO2(mmol/L) | 216 | 14.1 | 38.4 | 0,856 | 0.919 | -2.984(1.561) | -6.043-0.075 |
3.2. Focus on Method Comparison Study for Creatinine
The relationship between the two methods can be expressed as follows: (Creatinine Atellica® CH = 1,197 x Creatinine GEM® Premier™ ChemSTAT +3.007 (Figure 1a). Lin’s concordance correlation coefficient was calculated at 0.912 and indicate strong concordance between the two methods. The Bland-Altman plot presented the mean bias ±1.96 SD between Atellica® CH and GEM® Premier™ ChemSTAT for three creatinine ranges (Figure 1b). Despite the positive bias, this graphic analysis reveals good agreement between two methods. The mean difference for low creatinine (40-53 µmol/L) sample range is -13.591 µmol/L; for normal creatinine (54-97 µmol/L) sample range is -17.051 µmol/L; high creatinine (98-422 µmol/L) sample range is -33.329 µmol/L. The biases estimated are all within ±1.96 SD limits of agreement except some creatinine values for which their differences do not influence the decision of the CM administration.
3.3. Clinical Concordance Study: eGFR Evaluation
The correlation between the Atellica® CH and GEM® Premier™ ChemSTAT creatinine methods for the eGFR values (n=128) was: r=0.904, slope = 1.080, intercept=-23.097 mL/min/1.73m² (Figure 2a). Lin’s coefficient of concordance between the two methods was calculated at 0.708 so a moderate to strong positive correlation. Additionally, a Bland-Altman plot illustrated lower values for WB eGFR of GEM® Premier™ ChemSTAT, with a mean difference between the two methods of 15.051 mL/min/1.73m² (Figure 2b). These results are a consequence of the systematic overestimation of WB creatinine compared to plasma samples and due to the inverse relationship between creatinine and eGFR values.
The results obtained for the creatinine assay allow making identical medical decisions compared to the renal risk cut-offs for CIN established by the French Society of Radiology (SFR). Error grid analysis [6] for eGFR, identifies the impact of differences of results between WB and plasma calculated eGFR. The results are classified into 4 zones as described by Snaith [6] and presented according to two SFR risk stratification cut-offs. Figure 3 illustrates the error grid analysis for CKD-EPI.
The results of the concordance study summarized in Table 3 indicates that WB creatinine on GEM® Premier™ ChemSTAT aligned well with the core lab for assigning a patient to a risk category. There is potential overprophylaxis with POC creatinine for 2.3% of patients only for the cut-off of 45 mL/min/1.73 m2 (Zone C, Figure 3b et Table 3). No patient is misclassified for high risk of CIN (Zone D, Figure 3 et Table 3).
Table 3.
Clinical concordance and risk stratification between WB GEM® Premier™ ChemSTAT and plasma Atellica® CH eGFR.
Table 3.
Clinical concordance and risk stratification between WB GEM® Premier™ ChemSTAT and plasma Atellica® CH eGFR.
| Number of patients (%) | ||
|---|---|---|
| Zonea | 30 mL/min/1.73 m2b | 45 mL/min/1.73 m2c |
| Zone A: Correct risk classification–appropriate management | 114 (89.1%) | 114 (89.1%) |
| Zone B: Incorrectly classified, but no implication for clinical management. | 14 (10.9%) | 11 (8.6%) |
| Zone C: Incorrect classification, potential for unnecessary prophylaxis, or withholding of contrast. | 0 (0%) | 3 (2.3%) |
| Zone D: Incorrect classification and potential for increased risk of CIN owing to insufficient prophylaxis. | 0 (0%) | 0 (0%) |
a Performance zones for risk categorization based on the CKD-EPI eGFR calculations as defined by Snaith et al [6]. b Renal risk cut-off eGFR < 30 mL/min/1.73 m2: preventive measures are recommended before intravenous and intra-arterial CM administration with second-pass renal exposure [7,8]. c Renal risk cut-off eGFR < 45 mL/min/1.73 m2: preventive measures are recommended before intra-arterial CM administration with first-pass renal exposure and for Intensive Care Unit patients. [7,8].
3.4. Study of the Organizational Impact of the POC Creatinine Implementation in ED
Data on the prescription of medical imaging examinations for patients admitted in ED are described in Table 4.
Table 4.
Summary of imaging techniques in ED.
| Imaging exams | N patients (%) | % |
|---|---|---|
| No prescribed | 74 | 34.10 |
| Radiography | 46 | 21.20 |
| Computed Tomography: | 97 | 44.70 |
| -CM administration | 66 | 68.04 |
| -without CM | 31 | 31.96 |
Median time from patient admission in ED to blood sampling was 15 minutes (min: 0; max: 207; EI: 10–21). A statistically significant difference was found between the delays of the results with GEM® Premier™ ChemSTAT versus central laboratory (p<0.001) (Table 5).
Table 5.
Summary of the turnaround time data for POC analyzer and core lab.
| Interval between blood sampling and result available for viewing |
Median, in minutes (IQR) | Mean, in minutes (SD) |
|---|---|---|
| GEM® Premier™ ChemSTAT | 26 (17;37) | 36.2 (36.7) |
| Central laboratory | 67 (53;94) | 86.1 (60.0) |
Improvement of the turnaround time for creatinine results compared to the timing of the imaging performed was noted. The availability of creatinine results for patients who requiring CT is faster with ChemStat. The mean difference was 45.2 minutes (SD 75.6). The median difference was 38 minutes (EI: 19-66).
However, it must be considered that POC creatinine is not always sufficient to allow X-ray imaging. In our study, the availability of the result of the β-HCG analysis by the core lab was necessary in 9 cases (6.29%) to authorize the CT scan.
4. Discussion
The contrast-induced nephropathy (CIN) or contrast-induced acute injury (CI-AKI) remain significant in both ambulatory and hospitalized patients. CIN is defined as a creatinine level increase of ≥ 0.3 mg/dl (26.5 μmol/L) above baseline value within 48 h of contrast media exposure, or an increase of at least 1.5 times the baseline value within 7 days [9,10,11] in the absence of alternative etiologies [11,12]. It is therefore important to prevent it in ED patients. Indeed, in the case of home discharge monitoring of renal function for 7 days after the CM administration is difficult. As demonstrated by our study, medical imaging in the emergency room are very frequent in an aging population with risk factors. Pre-existing compromised renal function is a sufficient and almost necessary condition for the development of kidney aggression by CM [13,14,15]. The rapid availability of serum creatinine results with eGFR calculation is an integral part of CIN prevention in ED. It helps to organize peri-procedural management of patients (hydration, pharmacological agents) or even alternative imaging modalities leading to shorter hospital stay and better outcomes [11]. The CM administration in vital emergency is performed without knowing the renal profile, but the sample for the creatinine assay must be done with validated measures enterprises posteriori according to the results [14].
Previous studies have confirmed the analytical performances of GEM® Premier™ ChemSTAT [3,4,5,11]. The effectiveness of the POC solution to improve the triage of patients in ED has been demonstrated [16]. POC creatinine can play the role of CIN prevention in different urgent clinical situations in accordance to several studies [6,17].
As highlighted by several authors [3,4,18], the difference in methods and blood matrices leads to a bias between POC and core lab analyzers. So, before adapting a new POC analyzer it is important to evaluate its analytical performance against the existing laboratory method [4]. Comparison of GEM® Premier™ ChemSTAT versus Atellica® CH was not available in literature. This study revealed that WB results from the GEM® Premier™ ChemSTAT correlated well with plasma samples on Atellica® CH across the tested samples ranges. We have been particularly interested in the comparability of creatinine assay. Current study confirmed our comparisons with the previous Siemens method of the central laboratory [19]: there is a slight overestimation of creatininemia with ChemSTAT method, accentuated as already mentioned by sample matrix effect [4]. It is therefore primordial to study the clinical concordance of POC creatinine eGFR results with the central method. The concordance between eGFR risk stratification POC ChemSTAT creatinine vs laboratory creatinine assay was evaluated by applying the error grid analysis first proposed by Snaith et al. [6], the method adopted by authors studying the same subject [3,19,20]. Unlike other studies, we evaluated two eGFR thresholds for stratification of CIN risk in order to meet current recommendations: 30 ml/min/1.73m2 and 45 ml/min/1.73m2 [7,8]. The analysis indicates the safety of creatinine assay with GEM® Premier™ ChemSTAT for eGFR risk stratification. There were a small number of misclassified samples for two cut-offs with no impact on CM administration decision. If the threshold of 45 ml/min/1.73m2 must be considered, 2.3% of patients risk a potential delay because an unnecessary prophylaxis. In addition, this study demonstrates that no patient presents the increased risk of CIN with GEM® Premier™ ChemSTAT creatinine assay.
In our study POC method decrease turnaround time for biological results by approximately 50 minutes compared to the central laboratory. This is the first study that analyzes the impact of GEM® Premier™ ChemSTAT in ED, but this result is similar to other POC analyzers [20,21]. We were particularly interested in the impact of the availability of WB creatinine for risk stratification of patients before CT with CM administration. In our conditions, the result expectation for eGFR has been reduced by an average of 45 minutes allowing the reduction of the waiting time to schedule the CT and to plan preventive measures if necessary. In a previous study, this time was estimated to be 20 minutes [22], the authors deduced the possibility of 1 to 3 additional scanners per day. This result is very individual depending on the laboratory organization and clinical practices. Certainly, this potential optimization of the organization of medical imaging warrants an evaluation under our conditions. In addition, the availability of POC creatinine is important to reduce the incidence of cancelled or CT scans [20].
The main limitation of our study lies in the small number of patients with severe (plasma eGFR < 30 ml/min/1.73m2) renal insufficiency, but this population is representative of the ED patients.
5. Conclusions
GEM® Premier™ ChemSTAT can be safely used to stratify the risk of CIN in patients admitted to the emergency department requiring medical imaging with contrast media injection. The availability of WB creatinine can improve the flow of patients in ED by optimizing access to medical imaging. Further studies are needed to validate the cost-effectiveness on the use of POC creatinine in our emergency care setting.
Author Contributions
Conceptualization, J.S., V.S. and M.B.; methodology, B.P.; software, B.P.; validation, J.S., V.S. and M.B.; formal analysis, J.R.; investigation, M.A.; resources, V.S.; data curation, B.P.; writing—original draft preparation, M.B.; writing—review and editing, JB.B., D.B.; visualization, J.S.; supervision, M.B.; project administration, V.S.; funding acquisition, M.B., V.S.
Funding
This research received no external funding.
Institutional Review Board Statement
The study was conducted in accordance with the Declaration of Helsinki. None approved by the Institutional Review Board in link with French research medical legislation.
Informed Consent Statement
Patients were informed of their right to express the non-objection regarding the use of the residual of their tubes for medical research projects.
Data Availability Statement
Data supporting results can be obtained from the authors.
Acknowledgments
The authors would like to thank Werfen society for their help in supporting the project.
Conflicts of Interest
The authors declare no conflicts of interest.
References
- S. Di Somma, L. Paladino, L. Vaughan, I. Lalle, L. Magrini, M. Magnanti, Intern Emerg Med. 2015, 10 (2), 171–175. [CrossRef]
- P.-G. CLARET, X. BOBBIA, J.-E. DE LA COUSSAYE, n.d.
- S. A. Love, K. Schulz, P. Stack, S. Abdirizak, M. Souriyayong, R. Malhotra, C. Xu, P. V. A. Pamidi, The Journal of Applied Laboratory Medicine. 2019, 4 (2), 180–192. [CrossRef]
- A. E. García-Fernández, R. Barquín, M. Martínez, R. Ferrer, E. Casis, C. Xu, Practical Laboratory Medicine. 2022, 31, e00297. [CrossRef]
- C. Aussel, H. Delacour, M. Merzouk, R. Cohen, N. Oueidat, P. Hausfater, V. Planche, L. Satre-Buisson, M. Wehler, F. Blanchecotte, et al., Annales de Biologie Clinique. 2021, 79 (3), 277–299. [CrossRef]
- B. Snaith, M. A. Harris, B. Shinkins, M. Jordaan, M. Messenger, A. Lewington, Clinical Chemistry and Laboratory Medicine (CCLM). 2018, 56 (8), 1269–1276. [CrossRef]
- SFR-CIRTACI, 2022.
- L. De Laforcade, M. Bobot, M.-F. Bellin, O. Clément, S. Grangé, N. Grenier, A. Wynckel, D. Guerrot, Néphrologie & Thérapeutique. 2021, 17 (2), 80–91. [CrossRef]
- A. Khwaja, Nephron Clin Pract. 2012, 120 (4), c179–c184. [CrossRef]
- Kidney International Supplements. 2012, 2 (1), 69–88. [CrossRef]
- R. Chandiramani, D. Cao, J. Nicolas, R. Mehran, Cardiovasc Interv and Ther. 2020, 35 (3), 209–217. [CrossRef]
- R. Mehran, E. Nikolsky, Kidney International. 2006, 69, S11–S15. [CrossRef]
- M. R. Nouh, M. A. El-Shazly, WJR. 2017, 9 (9), 339–349. [CrossRef]
- T. HANNEDOUCHE, T. KRUMMEL, n.d.
- É. Pillebout, F. Martinez, Néphrologie & Thérapeutique. 2021, 17 (3), 191–198. [CrossRef]
- O. A. Soremekun, E. M. Datner, S. Banh, L. B. Becker, J. M. Pines, The American Journal of Emergency Medicine. 2013, 31 (2), 291–296. [CrossRef]
- E. Lee-Lewandrowski, C. Chang, K. Gregory, K. Lewandrowski, Clinica Chimica Acta. 2012, 413 (1–2), 88–92. [CrossRef]
- V. Sapin, et al., 2021 AACC Annual Scientific Meeting & Clinical Lab Expo 2022.
- M. Brailova, 2021.
- M. Corbett, A. Duarte, A. Llewellyn, J. Altunkaya, M. Harden, M. Harris, S. Walker, S. Palmer, S. Dias, M. Soares, Health Technol Assess. 2020, 24 (39), 1–248. [CrossRef]
- A. J. Singer, M. Taylor, D. LeBlanc, K. Meyers, K. Perez, H. C. Thode, J. M. Pines, The Journal of Emergency Medicine. 2018, 55 (2), 172–178. [CrossRef]
- N. L. Korpi-Steiner, E. E. Williamson, B. S. Karon, American Journal of Clinical Pathology. 2009, 132 (6), 920–926. [CrossRef]
Figure 1.
Correlation between the WB samples analyzed on GEM® Premier™ ChemSTAT vs. plasma samples analyzed on Atellica® CH for creatinine: (a) Linear regression; (b) Bland-Altman difference plots. The red line represent the absolute mean difference (µmol/L). The green lines represent the limit of agreement (±1.96 SD of the differences).
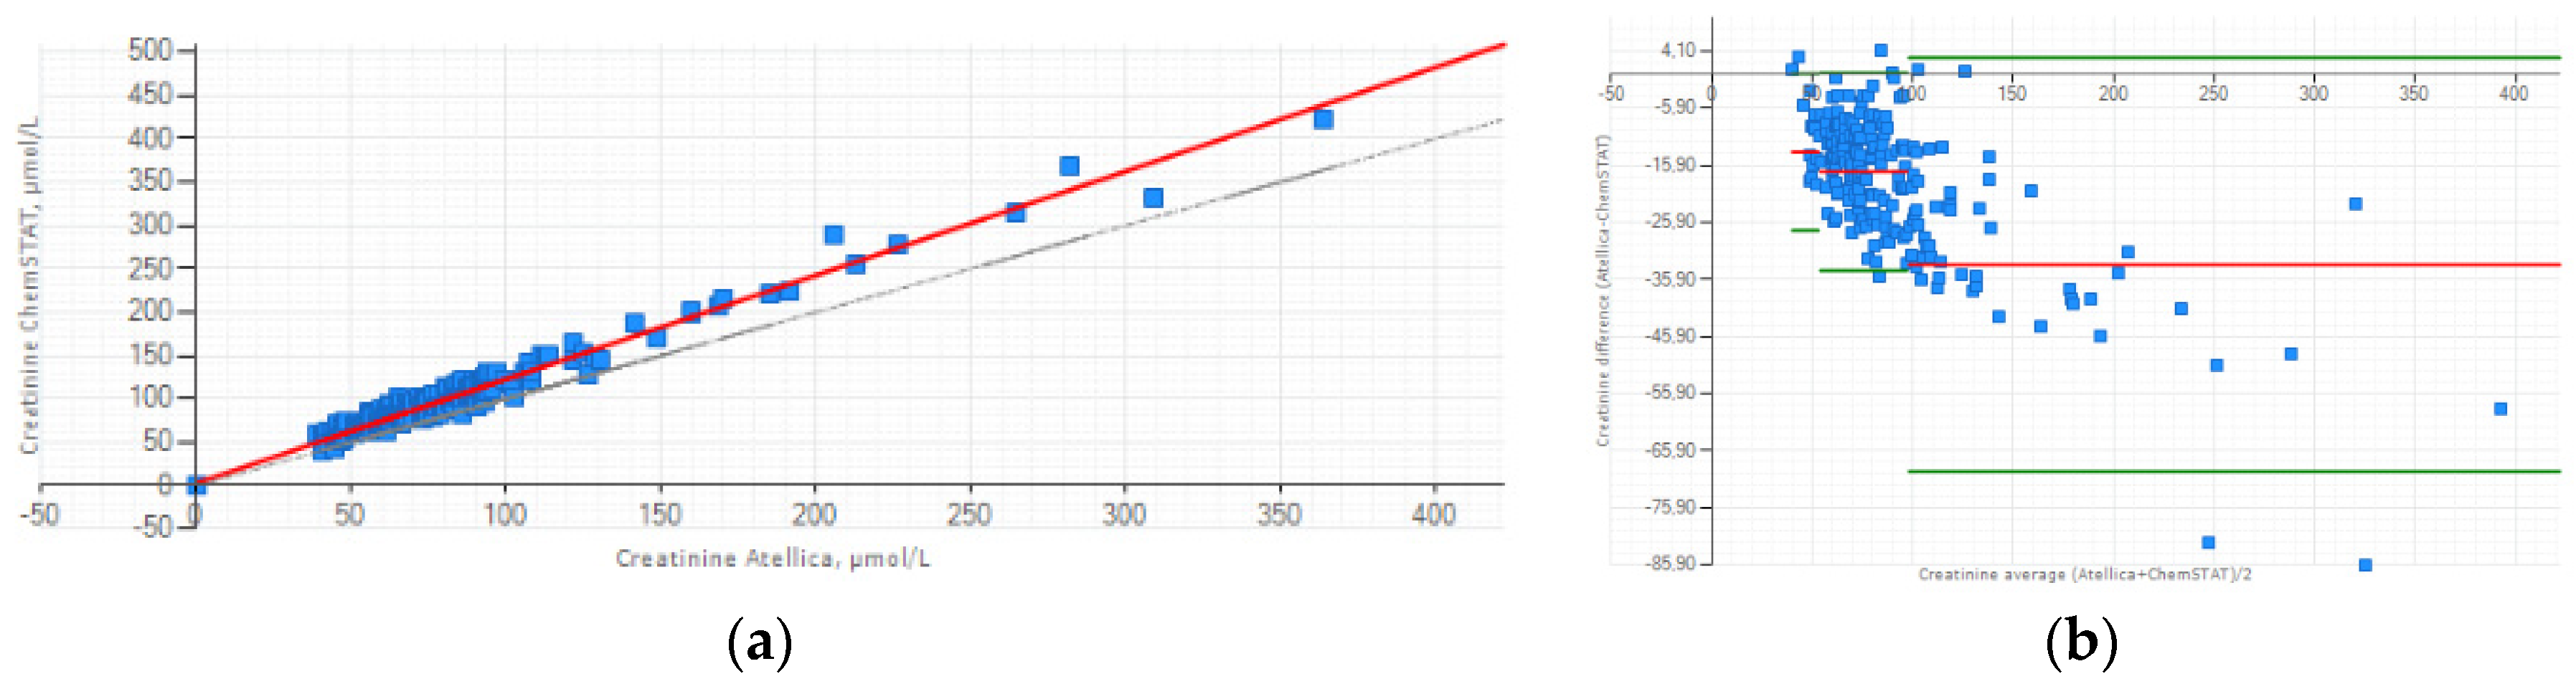
Figure 2.
Correlation between the Atellica® CH and GEM® Premier™ ChemSTAT creatinine methods for the eGFR values: (a) linear regression; (b) Bland-Altman plot.
Figure 2.
Correlation between the Atellica® CH and GEM® Premier™ ChemSTAT creatinine methods for the eGFR values: (a) linear regression; (b) Bland-Altman plot.
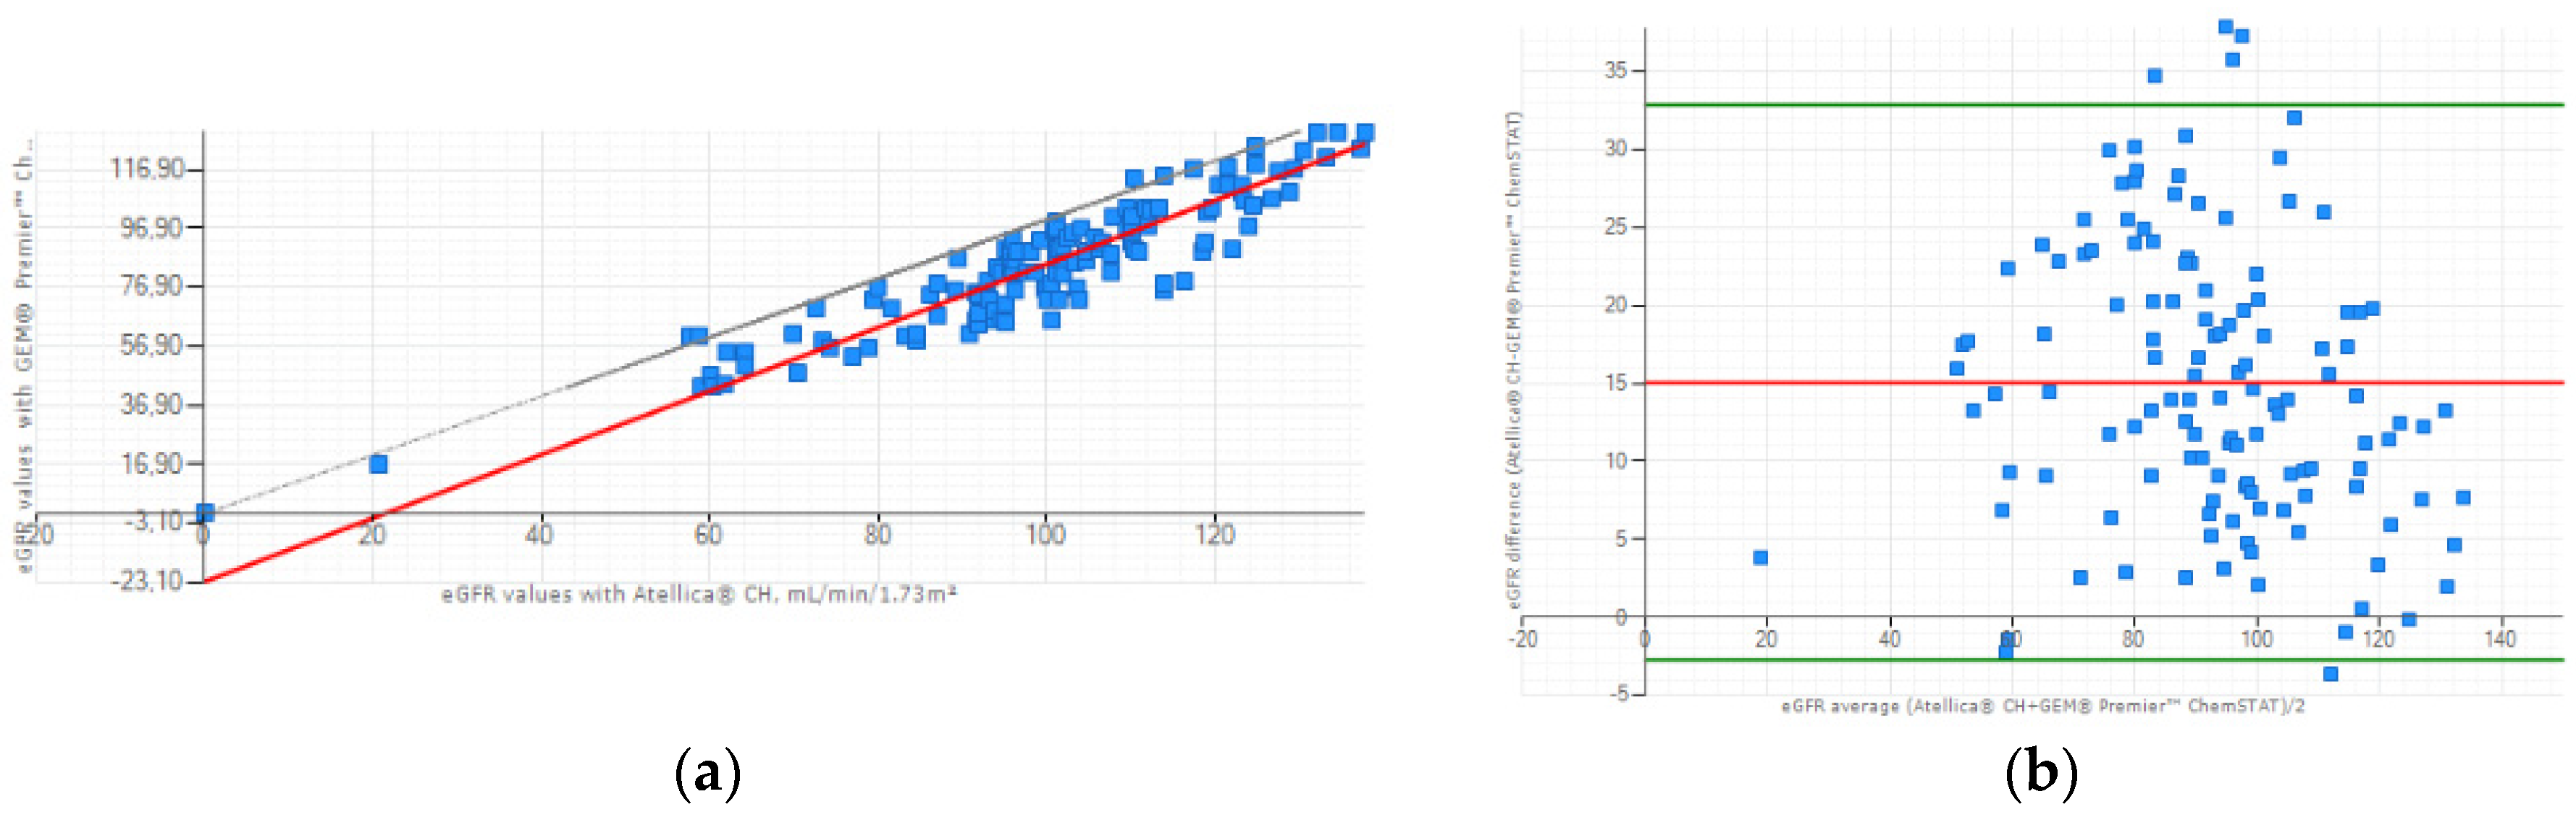
Figure 3.
Error grid analysis of concordance between eGFR risk stratification GEM® Premier™ ChemSTAT vs Atellica® CH creatinine method: (a) comparison by 30 mL/min/1.73 m2 threshold; (b) comparison by 45 mL/min/1.73 m2 threshold.
Figure 3.
Error grid analysis of concordance between eGFR risk stratification GEM® Premier™ ChemSTAT vs Atellica® CH creatinine method: (a) comparison by 30 mL/min/1.73 m2 threshold; (b) comparison by 45 mL/min/1.73 m2 threshold.

Disclaimer/Publisher’s Note: The statements, opinions and data contained in all publications are solely those of the individual author(s) and contributor(s) and not of MDPI and/or the editor(s). MDPI and/or the editor(s) disclaim responsibility for any injury to people or property resulting from any ideas, methods, instructions or products referred to in the content. |
© 2024 by the authors. Licensee MDPI, Basel, Switzerland. This article is an open access article distributed under the terms and conditions of the Creative Commons Attribution (CC BY) license (https://creativecommons.org/licenses/by/4.0/).
Copyright: This open access article is published under a Creative Commons CC BY 4.0 license, which permit the free download, distribution, and reuse, provided that the author and preprint are cited in any reuse.


