
Submitted:
28 August 2024
Posted:
29 August 2024
You are already at the latest version
Abstract
Full depth precast deck panel (FDDP) is one element of the prefabricated bridge element and systems (PBES) that allows for quick un-shored assembly of the bridge deck on-site as part of the accelerated bridge construction (ABC) technology. This paper investigates the structural response of full-depth precast deck panels (FDDPs) constructed with new construction materials and connection details. FDDP is cast with normal strength concrete (NSC) and reinforced with high modulus (HM) glass fiber reinforced polymer (GFRP) ribbed bars. The panel-to-girder V-shape connections use the shear pockets to accommodate the clustering of the shear connectors. A novel transverse connection between panels has been developed, featuring three distinct female-to-female joint configurations, each with 175-mm projected GFRP bars extending from the FDDP into the closure strip, complemented by a female vertical shear key and filled with cementitious materials. The ultra-high performance fiber reinforced concrete (UHPFRC) was selectively used to joint-fill the 200-mm transverse joint between adjacent precast panels and the shear pockets connecting the panels to the supporting girders to ensure full shear interaction. Two actual-size FDDP specimens for each type of the three developed joints were erected to perform fatigue tests under the footprint of the Canadian Highway Bridge Design Code (CHBDC) truck wheel loading. The FDDP had a 200-mm thickness, 2500-mm width, and 2400-mm length in traffic direction; the rest was over braced steel twin girders. Two types of fatigue tests were performed; incremental variable amplitude fatigue (VAF) loading and constant amplitude fatigue (CAF) loading, followed by monotonically loading the slab ultimate-to-collapse. It was observed that fatigue test results showed that the ultimate capacity of the slab under VAF loading or after 4 million cycles of CAF exceeds the factored design wheel load specified into the CHBDC. Also, punching shear failure mode was dominant in all the tested FDDP specimens.
Keywords:
Fatigue loading
; precast full-depth deck panel
; Joint fill materials
; GFRP bars
; UHPFRC
1. Introduction
Precast full-depth deck panels (FDDPs) have recently been used in new accelerated bridge construction (ABC) or for the rapid bridge replacement (RBR) of existing deteriorated bridge decks. FDDPs are produced off-site, quickly assembled on-site, reduce construction time, minimize lane closure and are considered as a good solution to minimize traffic disruption [1]. FDDPs are placed side by side and then the closure strips between them are filled with bonding material. Although the Canadian Highway Bridge Design Code, CHBDC [2] allows GFRP-reinforced FDDPs in bridge construction, there is no code provision on the joint details between such precast systems.
The use of precast FDDPs in bridge construction started in the United States in the early 1960s, with the purpose of shortening the deck construction time in areas with high traffic volumes. The deck-girder system was primarily non-composite, and the panel-to-panel connections exhibited partial failures. By 1974, FDDPs were made composite with the superstructure by extending the steel shear stud into the deck. FDDP was supported on girders and secured using shear studs embedded in the shear pockets that are normally filled with non-shrink grout to eliminate stress concentrations in the panels [3].
The transverse panel-to-panel connection has shear keys to protect adjacent panels from relative vertical movement due to traffic load. The panel-to-panel connection has several shapes in the literature, including the male-female (tongue/groove) shear key. However, cracking, spalling, and leakage were observed in such joints. Other panel-to-panel connections included female-to-female shear key, which comes in bulb and diamond shapes [4,5,6,7]. Splicing longitudinal reinforcement was introduced into overlapping U-bars or using HS spirals, or using open or closed steel tubes [8,9]. Grouting materials to fill the shear pockets and transverse joints have common properties, namely: (i) high strength at a young age, (ii) small shrinkage deformation, (iii) superior bonding, and (iv) low permeability [10]. Steel-reinforced lap-splice joints exploit bonding performance with the joint-field materials made of UHPFRC [11]. The behavior of the FDDP monolithic concrete joint, also known as moment resisting connection (MRC), accounts for the state of the bond of the projected longitudinal bars anchored through the cast-field joints.
Ultra-high performance fiber reinforced concrete (UHPFRC) is a relatively new class of cementitious matrix with steel fiber content that has high compressive strength (in order of 140 MPa at 28 days) and relatively large tensile strength (in order of 8 MPa), with strain hardening behavior in tension that ensure crack opening remains very small [12]. UHPFRC, as the filling material of the closure strip between connected FDDPs, has numerous benefits, including reduction of joint size, improved durability, speed of construction, and prolonged usage life [13,14,15].
GFRP reinforcement is a composite material made of polymer matrix reinforced with fibers. It has a high strength-to-weight ratio, is corrosion-free, and lasts longer. The mechanical properties of the GFRP depend on several factors, such as fiber quality, orientation, volumetric ratio, adhesion to the matrix, and the manufacturing process, such as pultrusion [16]. GFRP bar has relatively weak interlaminar shear strength governed by the weak matrix. The bond force in the GFRP bar is transferred to the concrete by adhesion, friction, and mechanical interlock, provided that adequate concrete cover is available. GFRP bars as an internal reinforcement are a practical choice for replacing deteriorated concrete bridge deck slabs owing to reinforcing steel bar corrosion [17,18,19,20,21].
AASHT-LRFD design specifications [22] consider the design of the deck slab as a continuous strip of 1000 mm width resting freely over the bridge beams. The load-carrying capacity of such a slab, which is based on the bending moment capacity, makes such a design to be over-conservative [23]. CHBDC specifies two different design methods for the slab-on-girder type, namely: (i) the flexural design method and (ii) the empirical method that accounts for the arching action of the laterally restrained slabs. The laterally-restrained concrete bridge slab deck fails in punching shear failure mode due to the effect of the concentrated wheel load causing the arching or compressive membrane action. Laterally-restrained precast FDDP under arching action should exhibit higher load-carrying capacity than one-way precast FDDP failed under pure flexural loading or combined flexural shear failure. Thus, it was deemed necessary to investigate the behavior of the laterally-restrained precast FDDP under the effect of truck wheel load.
Researchers conducted fatigue tests on steel-reinforced deck slabs [24,25,26,27,28]. Others tested two-way concrete bridge decks reinforced with GFRP bars under concentrated wheel loads, which failed in punching shear failure mode [29,30,31,32,33,34,35]. Others [36,37,38,39,40,41,42,43] tested one-way bridge deck slabs supported over girders and reinforced with GFRP bars and using carbon fiber fabric [44]. Few authors tested cast-in-place deck slabs reinforced with GFRP bars under fatigue loading [45,46,47,48] and using a CFRP grid [49]. Few authors conducted static and fatigue load tests on jointed slabs reinforced with steel bars and supported over girders [50,51]. Others conducted similar tests on FRP-reinforced jointed deck slabs [46,52,53]. Hassan et al. [29] concluded that the top FRP reinforcement in the bridge deck slab has a negligible effect on the punching shear capacity. Research on fatigue performance on bridge deck slabs showed negligible deterioration of the loaded slabs.
It is worth mentioning that the fiber-reinforced concrete (FRC) deck without internal reinforcement supported over restrained girders by transverse steel straps exhibits the necessary internal arching system to carry the wheel load [42]. Restrained longitudinal jointed precast bridge decks, also known as deck bulb-tee (DBT), were constructed with 3500-mm long, 2500-mm width including the joint width, and 200-mm thickness resting over twin steel girders were cast and tested under fatigue loading as well as static loading to collapse [46]. The wheel footprint was placed on the center of the slab and loaded with constant amplitude fatigue (CAF) loading for 4 million cycles at 4 Hz, followed by static loading to collapse. In contrast, other slabs were loaded under variable amplitude fatigue (VAF) loading to collapse at 2 Hz and less. All restrained slabs failed in punching shear failure mode at a wheel load greater than 3 times the specified CHBDC factored wheel loading.
Traditionally, bridges are designed using static loads that include the dynamic load allowance (DLA) due to passing trucks at the ultimate, serviceability, and fatigue limit states. It is important to examine the structural behavior of the jointed precast FDDPs under different fatigue loading conditions, which lead to progressive, internal, and permanent structural changes in the materials. After crack initiation and propagation, failure is caused by the bond deterioration between coarse aggregate, reinforcing bars, and the binding matrix. Two types of fatigue loading are considered in testing, namely: constant amplitude fatigue loading (CAF) and variable amplitude fatigue loading (VAF). Fatigue loading is known to reduce the life span of the bridge deck [53]. Constant amplitude fatigue (CAF) is a classical method for fatigue analysis of the material to obtain the three fatigue resistance components for a structure, namely: stress-life (S-N) known as Wöhler curve, strain-life (ԑ-N) and fatigue crack growth (FCG). CAF limit is the safe stress level under elastic deformation for the design that can take a very large number of cycles, longer than one million cycles. The Average Daily Truck Traffic (ADTT) of 100 trucks per lane over 25 years produces several cycles exceeding the CAF limit of two million cycles. Variable amplitude fatigue (VAF) limit investigates the effect of periodic overloading cycles. VAF is based on the same concepts, with the addition of cycle counting and damage summation due to increased step loading. However, the resulting stresses are high enough for plastic deformation to occur within the number of cycles, which is much less than one million cycles.
A limited number of researchers have investigated the fatigue strength of reinforced concrete slabs subjected to fixed-point pulsating and repetitive moving loads. Experimental tests showed that moving loads produce more fatigue deterioration than pulsating loads, and the influence of transverse reinforcement enhances fatigue performance [28]. Reduced-scale model deck slabs were tested under both pulsating and moving loads; although the moving load produced more fatigue deterioration, all slabs failed in punching [23]. Under fatigue loading, plain concrete exhibits increasing strain at the beginning, forming initial cracks followed by a steady state for a longer time before it crushes. Typical fatigue damage mechanisms for the FRP bars subjected to fatigue include matrix cracking, fiber-matrix debonding, void growth, and fiber breakage. FRP bar concrete under fatigue loading may result in abrasion of the bar surface due to shear lag [55,56]. Sand-coated GFRP-reinforced slab decks with transverse post-tensioning were constructed and subjected to cyclic loading at the center of the slab with a load range of 169.1 kN and a frequency of 1 Hz. Monotonic tests were performed every 100,000 cycles up to 4 million cycles at a load of 178 kN to measure the deterioration. The results show that the transverse post-tensioning enhances the deck performance and limits the crack growth [48]. A 52.08-m two-equal-span bridge was constructed in Quebec, Canada, named Cookshire-Eaton Bridge, with one span reinforced with steel bars and another with GFRP bars [37]. After one year, the bridge passed the service performance test using a calibrated CHBDC truck. Field test results showed no cracks, and deflection was within the allowable limits. In Vermont, USA, Morristown Bridge was reinforced with GFRP bars. Field test results revealed the good performance of the GFRP bars [36]. Full-scale deck slabs reinforced with GFRP bars were tested under pulsating concentrated loading up to failure, showing superior performance [27,47].
This paper reports the experimental test program of three developed joint details in a real-world situation. Two precast FDDPs were constructed for each developed joint detail and connected to an available braced twin-steel girder system. For each joint detail, one precast FDDP system was tested under CAF loading followed by loading it monotonically to collapse, and the other one was tested under VAF loading directly to collapse. Test results are analyzed to examine the fatigue performance and the ultimate load-carrying capacity of the developed jointed precast slabs.
2. New Connection Details
Three details for the joints between precast panels were proposed incorporating GFRP bars, as depicted in Fig. 1. The first proposed joint has a 200-mm wide closure strip, as shown in Figure 1(a). In this joint, the top and bottom GFRP bars in the precast slab project into the joint with a 175-mm anchorage length. The precast panel has a projected slab of 90 mm in length at the bottom of the joint to hold UHPFRC within the closure strip during casting. To avoid material leakage, a foam-type packing rod is inserted in the 20-mm gap between the two projected slabs at the bottom of the closure strip. This joint is called the “Angle-shape” joint or “A-joint” in this research. Figure 1(b) shows a view of the angle-joint cast for testing.
The second proposed joint has a 200-mm wide closure strip, as shown in Figure 1(c). This joint is identical to the first proposed joint but without the 90-mm projecting slab. The top and bottom GFRP bars in the precast slab project into the joint with a 175-mm anchorage length. It is assumed that temporary formwork will close the bottom of the closure strip to hold UHPFRC materials before hardening. This joint is called “C-shape” or “C-joint” in this research. Figure 1(d) shows a view of the C-joint cast for testing. The vertical shear key is expected to provide vertical shear friction resistance between the precast concrete and the UHPFRC filling to allow for vertical shear continuity of the slab across the joint.
Figure 1(e) depicts the trapezoidal zigzag-shaped panel-to-panel connection with a vertical female-to-female shear key. The slab thickness of 200 mm is divided vertically into equally four layers. The clear joint width between the ends of the jointed panels is 100 mm, while the zigzag shape (i.e., trapezoidal tooth shape) allows for an extension of the joint width of the other 100 mm into the precast panel. So, a GFRP bar from the end of one panel at its wide width of the trapezoidal shape will project into the joint with a length of 175 mm in 200 mm joint width in the same bar direction (i.e. 100 into the closure strip and 75 mm into the grooved trapezoidal shape in the adjacent panel). The pullout strength of the embedded GFRP in the joint will be resisted by the bond between its surface and the surrounding UHPFRC filling in addition to the bearing pressure between the UHPFRC filling and the precast concrete at the included surface of the trapezoidal shape at the interface between the two concretes. Such bearing pressure is expected to be resisted by the concrete surface normal to the joint at the narrow end of the trapezoidal shape and the GFRP bar projecting through it from the adjacent panel. A vertical shear key is introduced along the side of the precast panel while the expanded polystyrene foam is cut and used to form the zigzag connection. Figure 1(f) shows the GFRP bar arrangement in the zigzag joint and a view of the joint cast for testing. More details about the new connection details can be found elsewhere [57]
3. Experimental Program
The experimental program included testing two laterally-restrained precast FDDPs supported over braced twin-steel girder bridge system shown in Figure 2(a). The steel I-girders were 7500 mm in length and made of W610x241. They were placed over 330x330x25 mm elastomeric pads supported over steel pedestals, making the clear spacing of the girder equal to 7000 mm. Transverse cross-type bracings were installed at the two ends of the steel girders to provide lateral restraints to the deck slab as specified in the CHBDC empirical design method. The spacing of the twin girders was 2000 mm, measured center-to-center of the girders. Figure 2(b) shows cross-section details of the precast FDDP resting over the twin girders and connected to it using shear connectors. The M25 high-strength bolts are used for the panel-to-girder connection. The precast FDDP's width was 2500 mm so that it could be supported over the twin girders to produce a slab span of 2000 mm, as depicted in Figure 2(c). The precast FDDPs had a 200 mm thickness and were made of 35 MPa normal strength concrete (NSC) with a 10 mm nominal size aggregate, a 150 mm slump with added superplasticizer, and no air-entrant.
Straight-ended, 16M ribbed-surface HM GFRP bars reinforced the precast FDDP per CHBDC requirements. The slab's bottom and top transverse reinforcement were taken 16M bars @ 140 mm and 16M bars @ 200 mm, respectively. The slab was reinforced with 16M bars @ 200 mm in the bottom and top longitudinal direction (i.e., parallel to the girder). The properties of the materials of the HM GFRP bars are listed in Table 1. The specified modulus of elasticity and ultimate tensile strength of the GFRP bars were 64 GPa and 1188 MPa, respectively [58]. Two precast FDDPs were formed first to form the joint between the precast FDDPs. The first precast FDDP was of 200 mm thickness, 2400 mm length in the girder direction, and 2500 mm, while the second precast FDDP was of 200 mm thickness, 1000 mm length in the girder direction, and 2500 width. Those two FDDP segments are shown as FDDP 1 and FDDP 2 in Figure 2(c). This made the final length of the jointed slab 3700 mm in the direction of traffic. It should be noted that the short precast FDDP of 1000 mm was introduced beside the large precast FDDP in Figure 2(c)to ensure deck slab continuity beyond the joint. Figure 3 shows some images of the construction and detailing of the tested FDDPs having the three types of adopted joints.
The panel-to-girder connection was made using shear pockets to achieve the full composite action. Shear bolts were used to establish such full composite action between the girder and the precast panel every 1200 mm. Figure 4 shows cross-sections and views of the shear pockets between, as well as at, the transverse closer strips. UHPFRC (Ductal joint-fill JS1000 produced by Lafarge Canada Inc.) is used as filling materials in the shear pockets and the closure strips. The ultimate strengths of the UHPFRC were 140, 30, and 8 MPa in compression, flexural, and direct tension, respectively, while its modulus of elasticity was 50 GPa.
Using the available force-control hydraulic actuator system, the experimental program tested two precast FDDPs supported over a twin-steel girder bridge. The first precast FDDP system was tested under high-cycle constant-amplitude fatigue (CAF) loading, followed by increasing monotonic loading to collapse. To collapse, the second precast FDDP system was tested under low-cycle incremental step fatigue loading of variable amplitude (VAF). Table 2 presents a summary of fatigue-tested slab configurations. The actuator system generates sinusoidal harmonic force, , where is the average load of the maximum and minimum load, is the amplitude of applied load, ƒ is the frequency of the applied load, and t is the time. Before performing fatigue tests, a crack was initiated in the tested slab by applying monotonic loading equal to 3 times the applied wheel load for serviceability limit state design per CHBDC (SLS1 = 87.5 kN x 1.4 x 0.9 = 110.25 kN). This applied wheel load (87.5 kN) equals the heaviest wheel load in the specified CHBDC truck, multiplied by 1.4 to include the dynamic load allowance (DLA) and 0.9 as the fatigue limit state design load factor. This load is 3 times SLS1 = 110.25 x 3 = 330.75 kN. The footprint of the applied wheel load on top of the tested slab measured 600 mm wide by 250 mm long, and it was decided to locate it just beside the joint, as depicted in Figure 2(c).
The constant amplitude fatigue (CAF) loading was applied under force control with a sinusoidal shape to represent the fatigue limit state (FLS) load specified into the CHBDC as FLS = 87.5 x 1.4 x 1.0 = 122.5 kN at the frequency of 4 Hz for 4 million cycles. To prevent rattling of the test setup under cyclic loading, the loading cycle started with a 15 kN applied load that increased by 122.5 kN. Thus, the sinusoidal cyclic CAF ended up with a loading range of upper and lower absolute values of 137.5 kN and 15 kN, respectively, with a sample rate of 20.013 Hz. Figure 5(a) shows the CAF loading history applied to the test specimens. A monotonic test at 1.5 times the applied FLS load (i.e., 122.5 kN x 1.5 = 183.75 kN) was conducted every 250,000 cycles to assess the degradation of the FDDP system due to fatigue loading. The force-control monotonic test had a ramp segment shape at a loading and unloading rate of 5 kN/min. and 10 kN/min., respectively, collecting data points every 0.049967 sec, per Table 3. After the 4 million cycles of CAF loading, the FDDP system was monotonically loaded to collapse using a hydraulic jack with 1,300 kN capacity. The resulting ultimate load was compared to the CHBDC factored design load that was taken as Pf = 87.5 x 1.4 x 1.7 = 208.25 kN, where 87.5 kN is the heaviest wheel load in the CHBDC truck, the 1.4 is the dynamic load allowance and 1.7 is the live load factor for ultimate limit state design.
The incremental step variable amplitude fatigue (VAF) loading was applied under force control with sinusoidal shape to different 7 absolute peak levels of 1.0, 1.5, 2.0, 2.5, 3.0, 3.5, and 4.0 times the FLS load of 122.5 kN plus 15 kN as the absolute load lower level. The corresponding peak loads of the 7 incremental step VAF loading were 137.5, 198.75, 260, 321.25, 382.5, 443.75 and 505 kN. Each load level was applied for 100,000 cycles at the range of 2 Hz to 0.5 Hz depending on the stiffness of the FDDP system and the steel loading frame system, with the lowest frequency used when approaching failure of the slab. Figure 5(b) shows the VAF loading history considered in this study. Data was collected at a sample rate of 20.013 Hz. A monotonic test was performed after each 100,000 cycles with the same setting as the CAF monotonic test. After finishing with the 7 absolute peak levels mentioned earlier, the VAF loading testing continued with the highest peak value till collapse. Figure 6 shows images for the test setup used to conduct the fatigue loading tests under VAF and CAF and the monotonic loading to-collapse tests for all panels.
4. Experimental Test Results
This section discusses the structural behavior of the tested specimens in the form of slab vertical deflection and crack pattern. As mentioned earlier, fatigue pre-cracking was conducted under force control. The first hair flexural crack was observed at about 2.5 times the FLS loading (275.625 kN) underneath the wheel footprint area at the mid-span in the longitudinal direction (parallel to the supporting girders). The load was increased to 3 times the FLS load (330.75 kN) to increase the crack propagation beyond the wheel footprint area. The flexural crack width was 80 µm at that static load. CHBDC specifies that the design factored ultimate limit state (ULS) load of the deck slab is the multiplication of CHBDC truck wheel load of 87.5 kN, load factor of 1.7, and dynamic load allowance of 1.40. This makes the factored design applied load ULS1 = 87.5 x 1.4 x 1.7 = 208.25 kN. Interestingly, the pre-cracking monotonic load of 330.75 kN, at which a minor flexural crack appeared, is about 59% greater than the CHBDC factored design load of 208.25 kN.
4.1. Constant Amplitude Fatigue Loading
4.1.1. Behavior of the A-Jointed Precast FDDP under CAF
For the tested specimen S1 under CAF loading, the compressive strength of the concrete cylinders taken from the concrete mix were 60.76, 59.83, and 54.26 MPa, with an average value of 58.28 MPa. The tested cylinders for the UHPFRC resulted in compressive strengths of 161.94, 163.30, 170.54, and 159.20 MPa, with an average value of 161.48 MPa. During the initiation of the fatigue pre-cracking procedure, at a static load of 220.5 kN, the flexural crack propagated from underneath the mid-point of the wheel footprint about 100 mm towards the middle shear pockets shown at the middle of the precast slab segment. When the applied load increased to 275.625 kN, the flexural crack propagated further another 300 mm. However, when the applied load reached 330.75 kN, the flexural crack propagated diagonally from underneath the mid-point of the wheel footprint to the closest corner of the middle shear pocket. The maximum recorded flexural crack width at that point measured 80 µm. No more flexural cracks were observed during the CAF test that lasted over 16 days.
After each 250,000 cycles, the slab was subjected to monotonic loading to observe the change in slab flexural stiffness through deflection measurements. Figure 7(a) depicts the load-deflection relationship for the slab at the center of the footprint of the wheel load. It can be observed that the slope of the curves after each group of fatigue cycles appeared unchanged and maintained linear. After the 4-million fatigue cycles, the slab was subjected to a monotonic load that caused it to collapse. The precast FDDP failed due to punching shear at a jacking load of 930.92 kN. Figure 7(b). depicts recorded slab deflection at the mid-length of the free edge of the short slab shown as the location of LVDT 1 in Fig. 2(c), noted as the “Free end” curve in Figure 7(b). Such deflection reached 10.68 mm at failure. On the other hand, deflection under the wheel footprint shown as the location of LVDT 2 in Figure 2(c), denoted as “Point load” in Figure 7(b), were recorded as 23.05 and 23.88 mm at failure since 2 LVDTs were installed at this location. The deflection at the center of the long precast slab shown at the location of LVDT 3 in Fig. Fig. 2(c), denoted as “Mid-span” in Figure 7(b), was recorded as 13.09 mm. The maximum deflection of the long precast slab at the mid-length of the edge joint shown as the location of LVDT 4 in Figure 2(c), denoted as “Fixed end” in Figure 7(b), was recorded as 6.80 mm at failure.
Interestingly, such a failure load is about 4.47 times the CHBDC factored design wheel load. Figure 8(a) presents the top view of the slab showing punching shear failure at the footprint of the wheel load. Figure 8(b) shows the bottom view of the slab showing a crack pattern after failure due to the fan mechanism. One may observe the radial cracks starting from the location of the footprint of the wheel load and propagating toward the support line in a fan shape. At failure, concrete spalling appeared in some parts of the bottom side of the slabs as signs of punching shear failure. However, such concrete spalling appeared only in the large FDDP slab, but it did not extend to the short FDDP segment on the other side of the closure strip.
4.1.2. Behavior of the C-Jointed Precast FDDP under CAF
For the tested specimen S3 having C-joint under CAF loading, the compressive strengths of the concrete cylinders on the testing day were 58.10, 57.08, and 54.87 MPa, with an average value of 56.68 MPa. The tested cylinders for the UHPFRC, which were cast 10 days before the start of the fatigue testing, resulted in compressive strengths of 168.03, 162.33, 170.54, and 149.22 MPa, with an average value of 162.53 MPa.
During the initiation of the fatigue pre-cracking procedure, at a static load of 220.5 kN, the flexural crack propagated from underneath the mid-point of the wheel footprint about 100 mm towards the middle shear pockets shown at the middle of the precast slab segment. When the applied load increased to 275.625 kN, the flexural crack propagated further another 300 mm. However, when the applied load reached 330.75 kN, the flexural crack propagated diagonally from underneath the mid-point of the wheel footprint to the closest corner of the middle shear pocket. The maximum recorded flexural crack width at that point measured 80 µm. No more flexural cracks were observed during the CAF test that lasted over 16 days.
After each 250,000 cycles, the slab was subjected to monotonic loading to observe the change in slab flexural stiffness through deflection measurements. Figure 9(a) depicts the load-deflection relationship for the slab at the center of the footprint of the wheel load. It can be observed that the slope of the curves after each group of fatigue cycles appeared unchanged and maintained linear. After the 4-million fatigue cycles, the slab was subjected to a monotonic load that caused it to collapse. The precast FDDP failed due to punching shear at a jacking load of 973 kN. It can be noted that such failure load is about 4.67 times the CHBDC factored design wheel load. Figure 8(c) shows the top view of the slab showing punching shear failure at the footprint of the wheel load, while Figure 8(d) presents the bottom view of the slab showing a crack pattern after failure. It can be observed that the radial cracks start from the location of the footprint of the wheel load and propagate toward the support line in a fan shape. At failure, concrete spalling appeared in some parts of the bottom side of the slabs on one side of the closure strip as a sign of punching shear failure. However, this concrete spalling did not extend through the closure strip to the adjacent FDDP. Figure 8(d) shows that a concrete diagonal crack at the end of the bottom perimeter of the punching shear plane appeared, passing through UHPFRC on one side of the closure strip. In addition, fan-shaped cracks at the bottom surface of the slab passed through the UHPFRC but were less intensive than those in the precast slab. Figure 9(b) depicts the load-deflection relationship for the tested slab under static loading to collapse. Deflection values were recorded at the mid-length of the free edge of the short slab, noted as a “Free end” curve that reached 2.54 mm at failure. On the other hand, deflection under the wheel footprint, denoted as “Point load,” was recorded as 25.98 mm at failure. The deflection at the center of the long precast slab, denoted as “Mid-span,” was recorded as 17.83 mm. The maximum deflection of the long precast slab at the mid-length of the edge joint, denoted as “Fixed end,” was recorded as 3.73 mm at failure.
4.1.3. Behavior of the Z-Jointed Precast FDDP under CAF
For the tested specimen S5 under CAF loading, the NSC cylinders' average compressive and splitting tensile strengths were 37 MPa and 3.23 MPa, respectively. The tested cylinders for the UHPFRC, which were cast 10 days before the fatigue testing, resulted in an average compressive strength of about 127 MPa. During the initiation of the fatigue pre-cracking procedure, at a static load of 220.5 kN, the flexural crack propagated from underneath the mid-point of the wheel footprint about 100 mm towards the middle shear pockets. When the applied load increased to 275.625 kN, the flexural crack propagated further another 300 mm. However, when the applied load reached 330.75 kN, the flexural crack propagated diagonally from the mid-point of the wheel footprint to the closest corner of the middle shear pocket. The maximum recorded flexural crack width at that point measured 80 µm. No more flexural cracks were observed during the CAF test that lasted over 16 days.
After each 500,000 cycles, the slab was subjected to monotonic loading to observe the change in slab flexural stiffness through deflection measurements. Figure 10(a) depicts the load-deflection relationship for the slab at the center of the footprint of the wheel load. It can be observed that the slope of the curves after each group of fatigue cycles appeared unchanged and maintained linear. After the 4-million fatigue cycles, the slab was subjected to increasing monotonic load to collapse. The precast FDDP failed due to punching shear at a jacking load of 931 kN, which corresponded to about 4.47 times the CHBDC factored design wheel load. Figure 10(b) depicts the load-deflection relationship for the tested slab under static loading to collapse. The deflection value was recorded at the mid-length of the free edge of the short slab, noted as a “Free end” that reached 1.78 mm at failure. On the other hand, deflections under the wheel footprint, denoted as “Under load 1 and load 2,” were recorded as 30.29 and 28.94 mm at failure, respectively. The deflection at the center of the long precast slab, denoted as “Mid-span,” was recorded as 19.30 mm. The maximum deflection of the long precast slab at the mid-length of the edge joint, denoted as “Fixed end,” was recorded as 2.65 mm at failure. Figure 8(e) presents the top view of the slab showing punching shear failure at the footprint of the wheel load, while Fig. 8(f) presents the bottom view of the slab showing the crack pattern after failure.
4.2. Variable Amplitude Fatigue Loading
4.2.1. Behavior of the A-Jointed Precast FDDP under VAF
The precast FDDP specimen S2 underwent sinusoidal waveform fatigue load cycles with incremental step low cycle fatigue loading. The compressive strengths of concrete cylinders for the normal strength concrete (NSC) used to cast S2 were 54.29, 57.22, 59.98, 46.54, 65.84, and 64.7 MPa, with an average value of 58.10 MPa. The splitting tensile test for the NSC resulted in tensile strength of 3.53, 5.73, 5.31, 4.3, and 4.7 MPa, with an average value of 4.71 MPa. The compressive strengths of the concrete cylinder used to fill the joints of the UHPFRC were 154.17, 188.12, 184.61, and 181.91 MPa, with an average value of 179.52 MPa. The splitting tensile test for the UHPFRC resulted in tensile strength of 15.12, 12.14, and 15.76 MPa, with an average value of 14.42 MPa.
The first 501,002 fatigue load cycles were performed at a frequency of 2 Hz, then followed by 160,242 cycles at 1 Hz, and finally by 130,139 cycles at 0.5 Hz, leading to punching shear failure at a total number of cycles of 809,493. Figure 11(a) depicts the 60-mm-deep punching shear failure at the wheel footprint on top of the slab, while Figure 11(b) depicts the crack pattern at the bottom surface of the slab at failure. One may observe the radial cracks starting from the location of the footprint of the wheel load and propagating toward the support line in a fan shape. At failure, concrete spalling appeared in some parts of the bottom side of the large slab on one side only of the closure strip as a sign of punching shear failure. However, concrete spalling appeared to deviate from the traditional shape for punching failure (close to circular shape at the end of diagonal cracks through slab thickness). However, a major flexural crack appeared at failure just under the wheel load, extending in the direction of the girder towards the free end of the small FDDP segment while crossing the closure strip, as depicted in Figure 11(b). This precast FDDP failed at a jacking load of 487.50 kN and a maximum slab deflection of 32.46 mm. It is worth mentioning that such a failure load is about 2.34 times the CHBDC factored design wheel load. Figure 12 depicts the monotonic load-deflection relationship of the slab S2 after each 100,000 fatigue load cycles. It can be observed that the slope of the curve decreased, leading to a reduction in slab flexural stiffness, with an increase in the number of VAF load cycles. Table 4 and Table 5 summarize test data for all specimens with A-joints, C-joints, and Z-joints under CAF and VAF loading.
4.2.2. Behavior of the C-Jointed Precast FDDP under VAF
The compressive strengths of concrete cylinders for the NSC used to cast the second precast FDDP specimen with C-joint S4 were 67.78, 64.93, 65.63, and 67.81 MPa, with an average value of 66.54 MPa. The compressive strengths of the concrete cylinder for the UHPFRC used to fill the joints were 147.60, 150.69, and 151.45 MPa, with an average value of 149.91 MPa.
The first 500,000 fatigue load cycles were performed at a frequency of 2 Hz, then by 100,000 cycles at 1 Hz, and finally by 92,866 cycles at 1 Hz leading to punching shear failure at a total number of cycles of 692,866. Figure 11(c) depicts the punching shear failure at the wheel footprint on top of the slab, while Figure 11(d) depicts the crack pattern at the bottom surface of the slab at failure. A fan-shaped crack pattern was observed at the bottom surface similar to those developed for the slab tested to collapse after passing the CAF loading. However, Figure 11(d) shows greater concrete spalling along the perimeter on the punching shear plane at the bottom of the slab but only from one side of the closure strip. At failure of S4, a major flexural crack appeared at the wheel load location and extended to the free edge of the short FDDP segment, as depicted in Figure 11(d). This led to the conclusion that the failure mode is primarily punching shear combined with flexural failure in the adjacent short FDDP. It should be noted that very few flexural cracks appeared at the bottom of UHPFRC in slab S4 tested under VAF loading when compared to intensive cracks through UHPFRC in slab S3 tested under CAF loading, as depicted in Figure 8(d). Slab S4 failed at a jacking load of 495.69 kN and a maximum slab deflection of 40.89 mm. It is worth mentioning that such a failure load is about 2.38 times the CHBDC factored design wheel load. Figure 12 depicts the monotonic load-deflection relationship of the slab after each 100,000 fatigue load cycle. It can be observed that the slope of the curve decreased, leading to a reduction in slab flexural stiffness, with an increase in the number of VAF load cycles.
4.2.3. Behavior of the Z-Jointed Precast FDDP under VAF
The compressive strengths of concrete cylinders for the NSC used to cast slab S6 were 43.26, 68.16, 64.99, and 65.74 MPa, with an average value of 60 MPa. The compressive strengths of the concrete cylinder for the UHPFRC used to fill the joints were 163.35, 183.31, and 153.28 MPa, with an average value of 167 MPa. The splitting tensile test for the UHPFRC resulted in tensile strength of 18.30, 20.47, and 21.69 MPa, with an average value of 20 MPa.
The first 895,000 fatigue load cycles were performed at a frequency of 2 Hz, then 21,736 cycles at 1 Hz, and finally followed by 44,804 cycles at 0.5 Hz leading to punching shear failure at a total number of cycles of 961,540. Figure 11(e) depicts the punching shear failure at the wheel footprint on top of the slab, while Figure 11(f) depicts the crack pattern at the bottom surface of the slab at failure. A fan-shaped crack pattern was observed at the bottom surface similar to those developed for the slab tested to collapse after passing the CAF loading. However, greater concrete spalling appeared along the perimeter on the punching shear plane at the bottom of the slab but only from one side of the closure strip when compared to the failure mode shown in Figure 8(f) for slab S5 subjected to CAF loading. This precast FDDP slab S6 failed at a jacking load of 488.43 kN, about 2.35 times the CHBDC factored design wheel load, and a maximum slab deflection of 37.03 mm. Figure 13 depicts the monotonic load-deflection relationship of the slab after each 100,000 fatigue load cycles. It can be observed that the slope of the curve decreased, leading to a reduction in slab flexural stiffness, with an increase in the number of VAF load cycles.
To obtain a comprehensive overview of the punching shear failure at each side of the loaded area, slabs S1, S2, S3, S4, S5, and S6 were sliced at the load location in both the transverse direction (normal to the steel girders) and the longitudinal direction. Figure 14 shows schematic diagrams of the punching shear failure in the tested slab when sliced longitudinally and transversally at the wheel load location observed after saw-cutting the slabs.
4.3. Stiffness Degradation
The stiffness degradation of precast FDDPs under flexural-shear loading was calculated as spring stiffness, k. k is the ratio between the applied monotonic load, F, in kN, and the corresponding slab deflection, d, in mm. Stiffness degradation in reinforced concrete elements results from cracking, loss of bond, and interaction with higher shear or flexural stresses. The level of stiffness degradation depends on the characteristics of the structure, such as material properties (P-delta effect), geometry level, level of connection ductility, loading history, and their combination.
Table 6 summarizes the results for the CAF loading and for the VAF loading for precast A-Jointed FDDPs S1 and S2. Figure 15(a,b) depict the relationship between the spring stiffness and the number of fatigue cycles and slab deflection, respectively. One may observe that the specimen’s stiffness of S1 degraded by about 53.8% after 4 million cycles of constant amplitude fatigue loading. On the other hand, the specimen’s stiffness of S2 degraded by 86.86% when subjected to variable amplitude fatigue loading before complete collapse. Table 6 also summarizes the results for the CAF loading and for the VAF loading for C-jointed precast FDDPs S3 and S4. Figure 15(c,d) depict the relationship between the spring stiffness and the number of fatigue cycles and slab deflection, respectively, for S3 and S4. It can be observed that the first specimen’s stiffness (S3) degraded by about 50.73% after 4 million cycles of constant amplitude fatigue loading. On the other hand, the second specimen’s stiffness (S4) degraded by 63.24% when subjected to variable amplitude fatigue loading before complete collapse.
Furthermore, Table 6 summarizes the results for the CAF loading and for the VAF loading for Z-jointed precast FDDPs S5 and S6. Figure 15(e,f) depict the relationship between the spring stiffness and the number of fatigue cycles and slab deflection, respectively. One may observe that the specimen’s stiffness of S5 degraded by about 21.9% after 4 million cycles of constant amplitude fatigue loading. On the other hand, the specimen’s stiffness of S6 degraded by 71.32% when subjected to variable amplitude fatigue loading before complete collapse. Figure 16 shows a comparison of slab degradation under CAF and VAF loading.
4.4. Life Estimation of Fatigue of GFRP-Reinforced Precast FDDP
A realistic representation of the service loads is usually variable amplitude, which should consider the accurate measure of the applied load on the existing structure and predict loads on the structure that do not exist yet. Loads can be obtained from real-life histories or through simplified segmental loading. The fatigue cycle counting method compares the effect of the variable amplitude fatigue load histories to the fatigue data and curves obtained with the simple constant amplitude fatigue loading cycles. Applying the linear damage rule where cumulative linear damage, D, = 1.0 requires the knowledge of the mean and amplitude of the load to which the damaging event is compared. One approach to the variable load histories is the concept of the damage, known as fraction life or cycle ratio. These fractions are added together with the sum of 1.0 as defined in Equation (1) by the linear damage rule as proposed by Palmgren [59] and later again by Miner [60].
Where n is the number of cycles, and Nf is the number of repetitions of the same cycle that equals life to failure. The damaging effect of n1 cycles at P1 load amplitude is assumed to be , while the damaging effect of n2 cycles at P2 load amplitude is assumed to be . Similarly, the cycle ratio or damage caused by ni cycles at Pi load amplitude is . Failure is predicted when the sum of all ratios becomes 1 or 100%. The assumption of the linear damage depends on the rate of damage accumulation and load amplitude, which leads to for a low-to-high or a high-to-low loading sequence. Miner’s Rule doesn’t account for overload or high stress, which may occur in compressive residual stress that leads to retarding of the crack growth. High-to-low stresses may have less damage due to compressive residual stress. However, it is widely used for simplicity and hardly to achieve better agreement with the current experimental data. Nonlinear damage theories proposed where depends on the load level. When considering the change of load level to be , the authors propose the nonlinearity of the damaging effect on the step loading through Equation (2), as a result of the observed stiffness degradations, keeping the linearity of and solving for the using the nonlinear least square regression analysis (NLREG).
Where equals 25.86, 24.32, and 25.609 for the A-Joint, C-Joint, and Z-Joint, respectively. Table 7, Table 8, Table 9 and Table 10 illustrate the fatigue data where D = 1 for all types of joints of the precast FDDPs. The proposed model to determine the P-N effect is shown in Equation (3), where K equals 0.039, 0.041, and 0.039 for the A-Joint, C-Joint, and Z-Joint, respectively. For static failure N = 1, the model yields to .
Figure 17 shows the P-N fatigue curves for the developed model compared to the recently developed models on log-scale graphs compared to other fatigue models [46,47,60,61]. Equations (4)–(11) summarize the recent fatigue models.
The common observation is that these models by their current parameters, are overestimating the fatigue life since .
5. Conclusions
Three joint details were developed for transverse closure strips between precast FDDPs to accelerate bridge construction. Actual-size FDDPs were constructed and tested under CAF and VAF loading. Also, the panels tested under CAF loading were loaded under static loading to collapse. The experimental results yield several significant conclusions.
The experimental findings regarding the A-Jointed precast FDDP indicate that the newly developed transverse panel-to-panel connection, which incorporates projecting straight-ended high-modulus GFRP bars, is capable of facilitating continuous force transfer across the transverse joints of the FDDPs. The experiments further demonstrated exceptional fatigue performance, as no fatigue damage was detected after exposure to 4,000,000 cycles under a high-cyclic CAF loading of 122.5 kN, as outlined in the CHDBC. The precast FDDP subjected to high-cyclic CAF loading achieved a failure load approximately 4.47 times greater than the CHBDC factored design wheel load of 208.25 kN. In contrast, the precast FDDP tested under low-cyclic incremental step VAF loading reached a failure load roughly 2.34 times the CHBDC factored design wheel load. The two laterally-restrained precast FDDPs ultimately failed in a punching shear mode. Additionally, the stiffness of specimen S1 experienced a degradation of approximately 53% following 4 million cycles of constant amplitude fatigue (CAF) loading, while specimen S2 exhibited a degradation of 86.86% when subjected to low-cyclic variable amplitude fatigue (VAF) loading prior to complete failure.
The experimental findings regarding the C-Jointed precast FDDP lead to the conclusion that the newly designed transverse panel-to-panel C-shaped joint, which incorporates projecting straight-end high-modulus GFRP bars, effectively facilitates continuous force transfer across the transverse joint in precast FDDPs. The results further demonstrated that the precast FDDP, reinforced with high-modulus GFRP, exhibited exceptional fatigue performance, as no fatigue damage was detected after enduring 4,000,000 cycles of high-cyclic constant amplitude fatigue (CAF) loading at 122.5 kN, as outlined in the CHBDC. When subjected to CAF loading followed by an incrementally increasing monotonic wheel load until failure, the tested precast FDDP achieved a failure load approximately 4.67 times greater than the CHBDC factored ultimate limit state (ULS) design wheel load. In contrast, the precast FDDP under low-cyclic incremental step variable amplitude fatigue (VAF) loading reached a failure load roughly 2.38 times the CHBDC factored ULS1 design wheel load. Both precast FDDPs ultimately failed in a punching shear mode. Additionally, the stiffness of specimen S3 diminished by approximately 50.73% after 4 million cycles of high-cyclic CAF loading, while specimen S4 experienced a stiffness reduction of 63.42% under low-cyclic VAF loading prior to complete failure.
The experimental findings regarding the Z-Jointed precast FDDP lead to the conclusion that the newly designed transverse panel-to-panel connection, which incorporates projecting straight-ended high-modulus GFRP bars, effectively facilitates continuous force transfer across the transverse joints of the FDDPs. The results further demonstrated that the precast FDDP, reinforced with high-modulus GFRP ribbed-surface bars, exhibited exceptional fatigue performance, showing no signs of fatigue damage after enduring 4,000,000 cycles under high-cyclic constant amplitude fatigue (CAF) loading of 122.5 kN, as stipulated in the CHBDC. The precast FDDP tested under high-cyclic CAF loading achieved a failure load approximately 4.47 times greater than the CHBDC factored design wheel load of 208.25 kN. In contrast, the same precast FDDP, when subjected to low-cyclic incremental step variable amplitude fatigue (VAF) loading, sustained a failure load roughly 2.35 times the CHBDC factored design wheel load. The two laterally restrained precast FDDPs ultimately failed due to punching shear mode. Additionally, the stiffness of specimen S5 decreased by approximately 21.9% following 4 million cycles of constant amplitude fatigue (CAF) loading, whereas specimen S6 experienced a significant stiffness reduction of 71.32% under low-cyclic variable amplitude fatigue (VAF) loading before complete failure.
A mathematical model has been developed, grounded in experimental results, to assess the cumulative fatigue damage (CFD) and fatigue resistance (P-N effect) of GFRP-reinforced FDDPs featuring transverse joints. It is observed that the amplification factor related to fatigue loading is inversely related to the frequency of repeated cycles, which corresponds to the lifespan until failure.
Author Contributions
Methodology, Validation, Formal analysis, Investigation, Data curation, Writing – original draft, Visualization, Project administration. Khaled Sennah: Conceptualization, Investigation, Data curation, Writing – review & editing. Hamdy M. Afefy: Formal analysis, Investigation, Writing – review & editing.
Data Availability Statement
Data will be made available on request.
Acknowledgments
This study was sponsored by the Ontario Ministry of Transportation’s (MTO) Highway Infrastructure Innovation Funding Program through cash contribution, Lafarge North America through supplying UHPFRC (Ductal JS1000), and Schoeck Canada through providing composite GFRP bars. Opinions expressed in this paper are those of the authors and do not necessarily reflect the views and policies of the Ministry. The authors thank the technical staff of the Department of Civil Engineering at Toronto Metropolitan University for the support received in executing the experimental program.
Conflicts of Interest
The authors declare that they have no known competing financial interests or personal relationships that could have appeared to influence the work reported in this paper.
References
- Clumo, M. , 2011. Accelerated Bridge Construction - Experience in Design, Fabrication and Erection of Prefabricated Bridge Elements and Systems, FHWA-HIF-12-013, Federal Highway Administration, McLean, VA.
- CSA. 2014. Canadian Highway Bridge Design Code, CAN/CSA-S6-14. Canadian Standards Association, Mississauga, Ontario, Canada.
- Badie, S.; Tadros, M. 2008. Full-Depth Precast Concrete Bridge Deck Panel Systems. NCHRP Report 584, Transportation Research Board, Washington, D.C.
- Afefy, H.M.; Sennah, K.; Tu, S.; Ismail, M.; Kianoush, R. 2015. Experimental Study on the Ultimate Capacity of Deck Joints in Prefabricated Concrete Bulb-Tee Bridge Girders. Journal of Bridge Structures, Design, Assessment and Construction, 11 (2015) 55–71.
- Sennah, K.; Afefy, H.M. , (2015) “Development and study of deck joints in prefabricated concrete bulb-tee bridge girders: Conceptual design” Bridge Structures, Vol. 11, No. 1, 2, pp. 33–53. [CrossRef]
- Shah, B.; Sennah, K.; Kianoush, R.; Tu, S.; Clifford, L. 2007. Experimental Study on Prefabricated Concrete Bridge Girder-to-Girder Intermittent-Bolted Connection Systems. ASCE Journal of Bridge Engineering, 12(5): 570-584. [CrossRef]
- Sennah, S.K.; Kianoush, R.; Tu, S.; Lam, C. 2006. Flange-to-Flange Moment Connections for Precast Concrete Deck Bulb-Tee Bridge Girders. Journal of Prestressed Concrete Institute, PCI, 51(6): 86-107.
- PCI. 2011a. State-of-the-Art Report on Full-Depth Precast Concrete Bridge Deck Panels (SOA-01-1911), PCI Committee on Bridges and the PCI Bridge Producers Committee, Precast/Prestressed Concrete Institute, USA.
- PCI 2011b. Full Depth Deck Panels Guidelines for Accelerated Bridge Deck Replacement or Construction. Report Number PCINER-11-FDDP, Precast/Prestressed Concrete Institute, USA.
- Badie, S.; Tadros, M.; Girgis, A. , 2006. Full-Depth, Precast-Concrete Bridge Deck Panel Systems. Report No. NCHRP 12-65, Transportation Research Board, Washington, D.C.
- Hwang, H.; Park, S. 2014. A Study on the Flexural Behavior of Lap-spliced Cast-in-place Joints under Static Loading in Ultra-high Performance Concrete Bridge Deck Slabs. Canadian Journal of Civil Engineering, 41: 615-623. [CrossRef]
- Russell, H.; Graybeal, B. 2013. Ultra-High Performance Concrete: A State-of-the-Art Report for the Bridge Community, Publication No. FHWA-HRT-13-060, Federal Highway Administration, McLean, VA.
- Abokifa, M. (2021). Application of Polymer Concrete and Non-Proprietary Ultra-High Performance Concrete for Pre-fabricated Bridge Decks Field Joints (Doctoral dissertation, University of Nevada, Reno).
- Afefy, H.M.; Kassem, N.; Taher, S. (2021) Strengthening of defected closure strips for full-depth RC deck slabs using CFRP sheets” Proceedings of the Institution of Civil Engineers, Structures and Buildings. Volume 174 Issue 7, July, 2021, pp. 581-594. [CrossRef]
- Abdal, S.; Mansour, W.; Agwa, I.; Nasr, M.; Abadel, A.; Onuralp Özkılıç, Y. Akeed, M.H. (2023). Application of ultra-high-performance concrete in bridge engineering: current status, limitations, challenges, and future prospects. Buildings, 13(1), 185. [CrossRef]
- ACI Committee 440. 2006. Guide for the Design and Construction of Structural Concrete Reinforced with FRP Bars, ACI 440.1R-06. American Concrete Institute, Farmington Hills, MI, USA.
- Wu, W.; He, X.; Yang, W.; Dai, L.; Wang, Y.; He, J. (2022). Long-time durability of GFRP bars in the alkaline concrete environment for eight years. Construction and Building Materials, 314, 125573. [CrossRef]
- Zhu, P.; Li, Z.; Zhu, Y.; Wu, Y.; Qu, W. (2023). Prediction of the Long-Term Tensile Strength of GFRP Bars in Concrete. Buildings, 13(4), 1035. [CrossRef]
- Lu, J.; Afefy, H.M.; Azimi, H.; Sennah, K.; Sayed-Ahmed, M. , (2021) “Bond performance of sand-coated and ribbed-surface glass fiber reinforced polymer bars in high-performance concrete” Structures, December, Vol. 34, pp. 10-19.
- Rostami, M.; Sennah, K.; Afefy, H.M. (2018) “Ultimate capacity of barrier-deck anchorage in MTQ TL-5 barrier reinforced with headed-end, high-modulus, sand-coated GFRP bars” Canadian Journal of Civil Engineering, Vol. 45, April, 263-275.
- Islam, S.; Afefy, H.M.; Sennah, K.; Azimi, H. , (2015) “Bond characteristics of straight- and headed-end ribbed-surface GFRP bars embedded in high-strength concrete” Construction & Building Materials, Vol. 83, May, pp. 283–298.
- AASHTO, 2012. AASHTO-LRFD Bridge Design Specifications, Fifth Edition. American Association of State Highway and Transportation Officials, Washington, D.C.
- Perdikaris, P.; Beim, S. 1988. RC Bridge Decks under Pulsating and Moving Load. Journal of Structural Engineering, 114(3): 591-607. [CrossRef]
- Edalatmanesh, R.; Newhook, J. 2013a. Residual Strength of Precast Steel-Free Panels. ACI Structural Journal, 110(5): 715-721. [CrossRef]
- Edalatmanesh, R.; Newhook, J. 2013b. Investigation of Fatigue Damage in Steel-Free Bridge Decks with Application to Structural Monitoring. ACI Structural Journal, 110(4): 557-564. [CrossRef]
- Hwang, H.; Yoon, H.; Joh, C.; Kim, B. 2010. Punching and Fatigue Behavior of Long-Span Prestressed Concrete Deck Slabs. Engineering Structures, 32: 2861-2872. [CrossRef]
- Klowak, C.; Memon, A.; Mufti, A. 2007. Static and Fatigue Investigation of Innovative Second Generation Steel-Free Bridge Decks. Canadian Journal of Civil Engineering, 34: 331-339. [CrossRef]
- Sonoda, K.; Horikawa, T. 1982. Fatigue Strength of Reinforced Concrete Slabs under Moving Load. Zurich, Switzerland, pp. 455-462.
- Hassan, T.; Rizkalla, S.; Abdelrahman, A.; Tadros, G. 2000a. Fibre Reinforced Polymer Reinforcing Bars for Bridge Decks. Canadian Journal of Civil Engineering, 27: 839-849.
- Hassan, T.; Rizkalla, S.; Adelrahman, A.; Tadros, G. 2000b. Design Recommendations for Bridge Deck Slabs Reinforced by Fibre Reinforced Polymers. ACI SP, pp. 188-29.
- Hassan, M.; Ahmed, E.; Benmokrane, B. 2013. Punching Shear Strength of Normal and High-Strength Two-Way Concrete Slabs Reinforced with GFRP Bars. ASCE Journal of Composites for Construction, 04013003: 1-12. [CrossRef]
- Dulude, C.; Hassan, M.; Ahmed, E.; Benmokrance, B. 2013. Punching Shear Behavior of Flat Slabs Reinforced with Glass Fibre Reinforced Polymer Bars. ACI Structural Journal, 110(5): 723-733.
- El-Ghandour, A.; Pilakoutas, K.; Waldron, P. 1999. New Approach for Punching Shear Capacity Prediction of Fiber Reinforced Polymer Reinforced Concrete Flat Slabs. ACI Structural Journal, 188(13):135-144. [CrossRef]
- El-Ghandour, A.; Pilakoutas, K.; Waldron, P. 2003. Punching Shear Behaviour of Fiber Reinforced Polymers Reinforced Concrete Flat Slabs: Experimental Study. ASCE Journal of Composite for Construction, 7(3): 258-265. [CrossRef]
- Braimah, A.; Green, M.; Soudki, K. , 1998. Polypropylene FRC Bridge Deck Slabs Transversely Prestressed with CFRP Tendons. ASCE Journal of Composite for Construction, 2(4): 149-157. [CrossRef]
- Benmokrane, B.; El-Salakawy, E.; El-Ragaby, A.; Lackey, T. 2006. Designing and Testing of Concrete Bridge Decks Reinforced with Glass FRP Bars. ASCE Journal of Bridge Engineering, 11(2): 217-229. [CrossRef]
- El-Salakawy, E.; Benmokrane, B.; El-Ragaby, A.; Nadeau, D. 2005. Field Investigation on the First Bridge Deck Slab Reinforced with Glass FRP Bars Constructed in Canada. Journal of Composites for Construction, 9(6): 470-479. [CrossRef]
- Jacobson, D.; Bank, L.; Oliva, M.; Russell, J. 2005. Punching Shear Capacity of Double Layer FRP Grid Reinforced Slabs. Proceedings of the 7th International Conference on Fiber Reinforced Plastics for Reinforced Concrete Structures, American Concrete Institute, New Orleans, La., pp. 857–871.
- El-Gamal, S.; El-Salakawy, E.; Benmokrane, B. 2005. Behavior of Concrete Bridge Deck Slabs Reinforced with Fiber-Reinforced Polymer Bars under Concentrated Loads. ACI Structural Journal, 102(5): 727-735. [CrossRef]
- Khanna, O.; Mufti, A.; Bakht, B. 2000. Experimental Investigation of the Role of Reinforcement in the Strength of Concrete Deck Slabs. Canadian Journal of Civil Engineering, 27: 475-480.
- Matthys, S.; Taerwe, L. 2000. Concrete Slabs Reinforced with FRP Grid. II: Punching Resistance. ASCE Journal of Composite for Constructions, 4(3): 154-161.
- Banthia, N.; Al-Asaly, M.; Ma, S. 1995. Behavior of Concrete Slabs Reinforced with Fiber-Reinforced Plastic Grid. ASCE Journal of Materials in Civil Engineering, 7(4): 643-652. [CrossRef]
- Mufti, A.; Jaeger, L.; Bakht, B.; Wegner, L. 1993. Experimental Investigation of FRC Slabs without Internal Steel Reinforcement. Canadian Journal of Civil Engineering, 20(3): 389-406.
- Ahmad, S.H.; Zia, P.; Yu, T.; Xie, Y. 1993. Punching Shear Tests of Slabs Reinforced with 3-D Carbon Fiber Fabric. Concrete International, 16: 36-41.
- You, Y.; Kim, J.; Park, Y.; Choi, J. 2015. Fatigue Performance of Bridge Deck Reinforced with Cost-to-Performance Optimized GFRP Rebar with 900 MPa Guaranteed Tensile Strength. Journal of Advanced Concrete Technology, 13: 252-262. [CrossRef]
- Khalafalla, I.; Sennah, K. 2021. Ultimate and Fatigue Responses of GFRP-Reinforced, UHPC-Filled, Bridge Deck Joints. ACI Special Publication SP-356: Development & Applications of FRP Reinforcements, pp. 347-374. [CrossRef]
- El-Ragaby, A.; El-Salakawy, E.; Benmokrane, B. , 2007. Fatigue Life Evaluation of Concrete Bridge Deck Slabs Reinforced with Glass FRP Composite Bars. Journal of Composite for Construction, 11(3): 258-268. [CrossRef]
- Kumar, J.; GangaRao, H. 1992. Fatigue Response of Concrete Decks Reinforced with FRB Rebars. ACI Structural Journal, 89(1): 13-19.
- Rahman, A.; Kingsley, C.; Kobayashi, K. 2000. Service and Ultimate Load Behaviour of Bridge Deck Reinforced with Carbon FRP Grid. ASCE Journal of Composite of Construction, 4(1): 16-23.
- Zhu, P.; Ma, Z.; Cao, Q.; French, C. 2012. Fatigue Evaluation of Longitudinal U-Bar Joint Details for Accelerated Bridge Construction. Journal of Bridge Engineering, 17: 201-210. [CrossRef]
- Graybeal, B. 2010. Behavior of Field-Cast Ultra-High Performance Concrete Bridge Deck Connections under Cyclic and Static Structural Loading. Report No. FHWA-HRT-11-023, Federal Highway Administration, 116 pages.
- Hwang, H.; Park, S. 2014. A Study on the Flexural Behavior of Lap-spliced Cast-in-place Joints under Static Loading in Ultra-high Performance Concrete Bridge Deck Slabs. Canadian Journal of Civil Engineering, 41: 615-623. [CrossRef]
- Gar, S.; Head, M.; Hurlebaus, S.; Mander, J. 2014. Experimental Performance of AFRP Concrete Bridge Deck Slab with Full-Depth Precast Prestressed Panels. Journal of Bridge Engineering, 04013018: 1-10. [CrossRef]
- Karunananda, K.; Ohga, K.; Dissanayake, R.; Siriwardane, S. 2010. A Combined High and Low Cycle Fatigue Model to Estimate Life of Steel Bridges. Journal of Engineering and Technology Research, 2(8): 144-160.
- Adimi, M.; Rahman, A.; Benmokrane, B. 2000. New Method for Testing Fibre-Reinforced Polymers Rods under Fatigue. Journal of Composites for Construction, 4(4): 206-213.
- Katz, A. 2000. Bond to Concrete of FRP Rebars After Cyclic Loading. Journal of Composites for Construction, 4(3): 137-144. [CrossRef]
- Sayed-Ahmed MS. 2016. Development and Study of Closure Strip Between Precast Deck Panels in Accelerated Bridge Construction. PhD thesis, Ryerson University, Toronto, ON, Canada.
- Schoeck Canada Inc. ComBar Product Manual. [Online] Available at: www.schoeckcanada.com.
- Palmgren, A. Die Lebensdauer von Kugellagern. Verfahrenstechinik. Berlin, Vol. 68, pp 338-341, 1924.
- Miner, M.A. , “Cumulative Damage in Fatigue,” Journal of Applied Mechanics, Vol. 67, pp. A159-164, 1945.
- Memon, A.H. 2005. Compressive Fatigue Performance of Steel Reinforced and Steel-Free Bridge Deck Slabs. PhD Thesis, Department of Civil Engineering, University of Manitoba, Winnipeg, Canada. 125p.
- Mufti, 4.4., Memon, 4.H., Bakht, 8., and Banthia, N. (2002). Fatigue Investigation of the Steel-Free Bridge Deck Slabs. ACI International SP 206-4, American Concrete Institute, pp.6I-70.
Figure 1.
Details of GFRP bars joints.
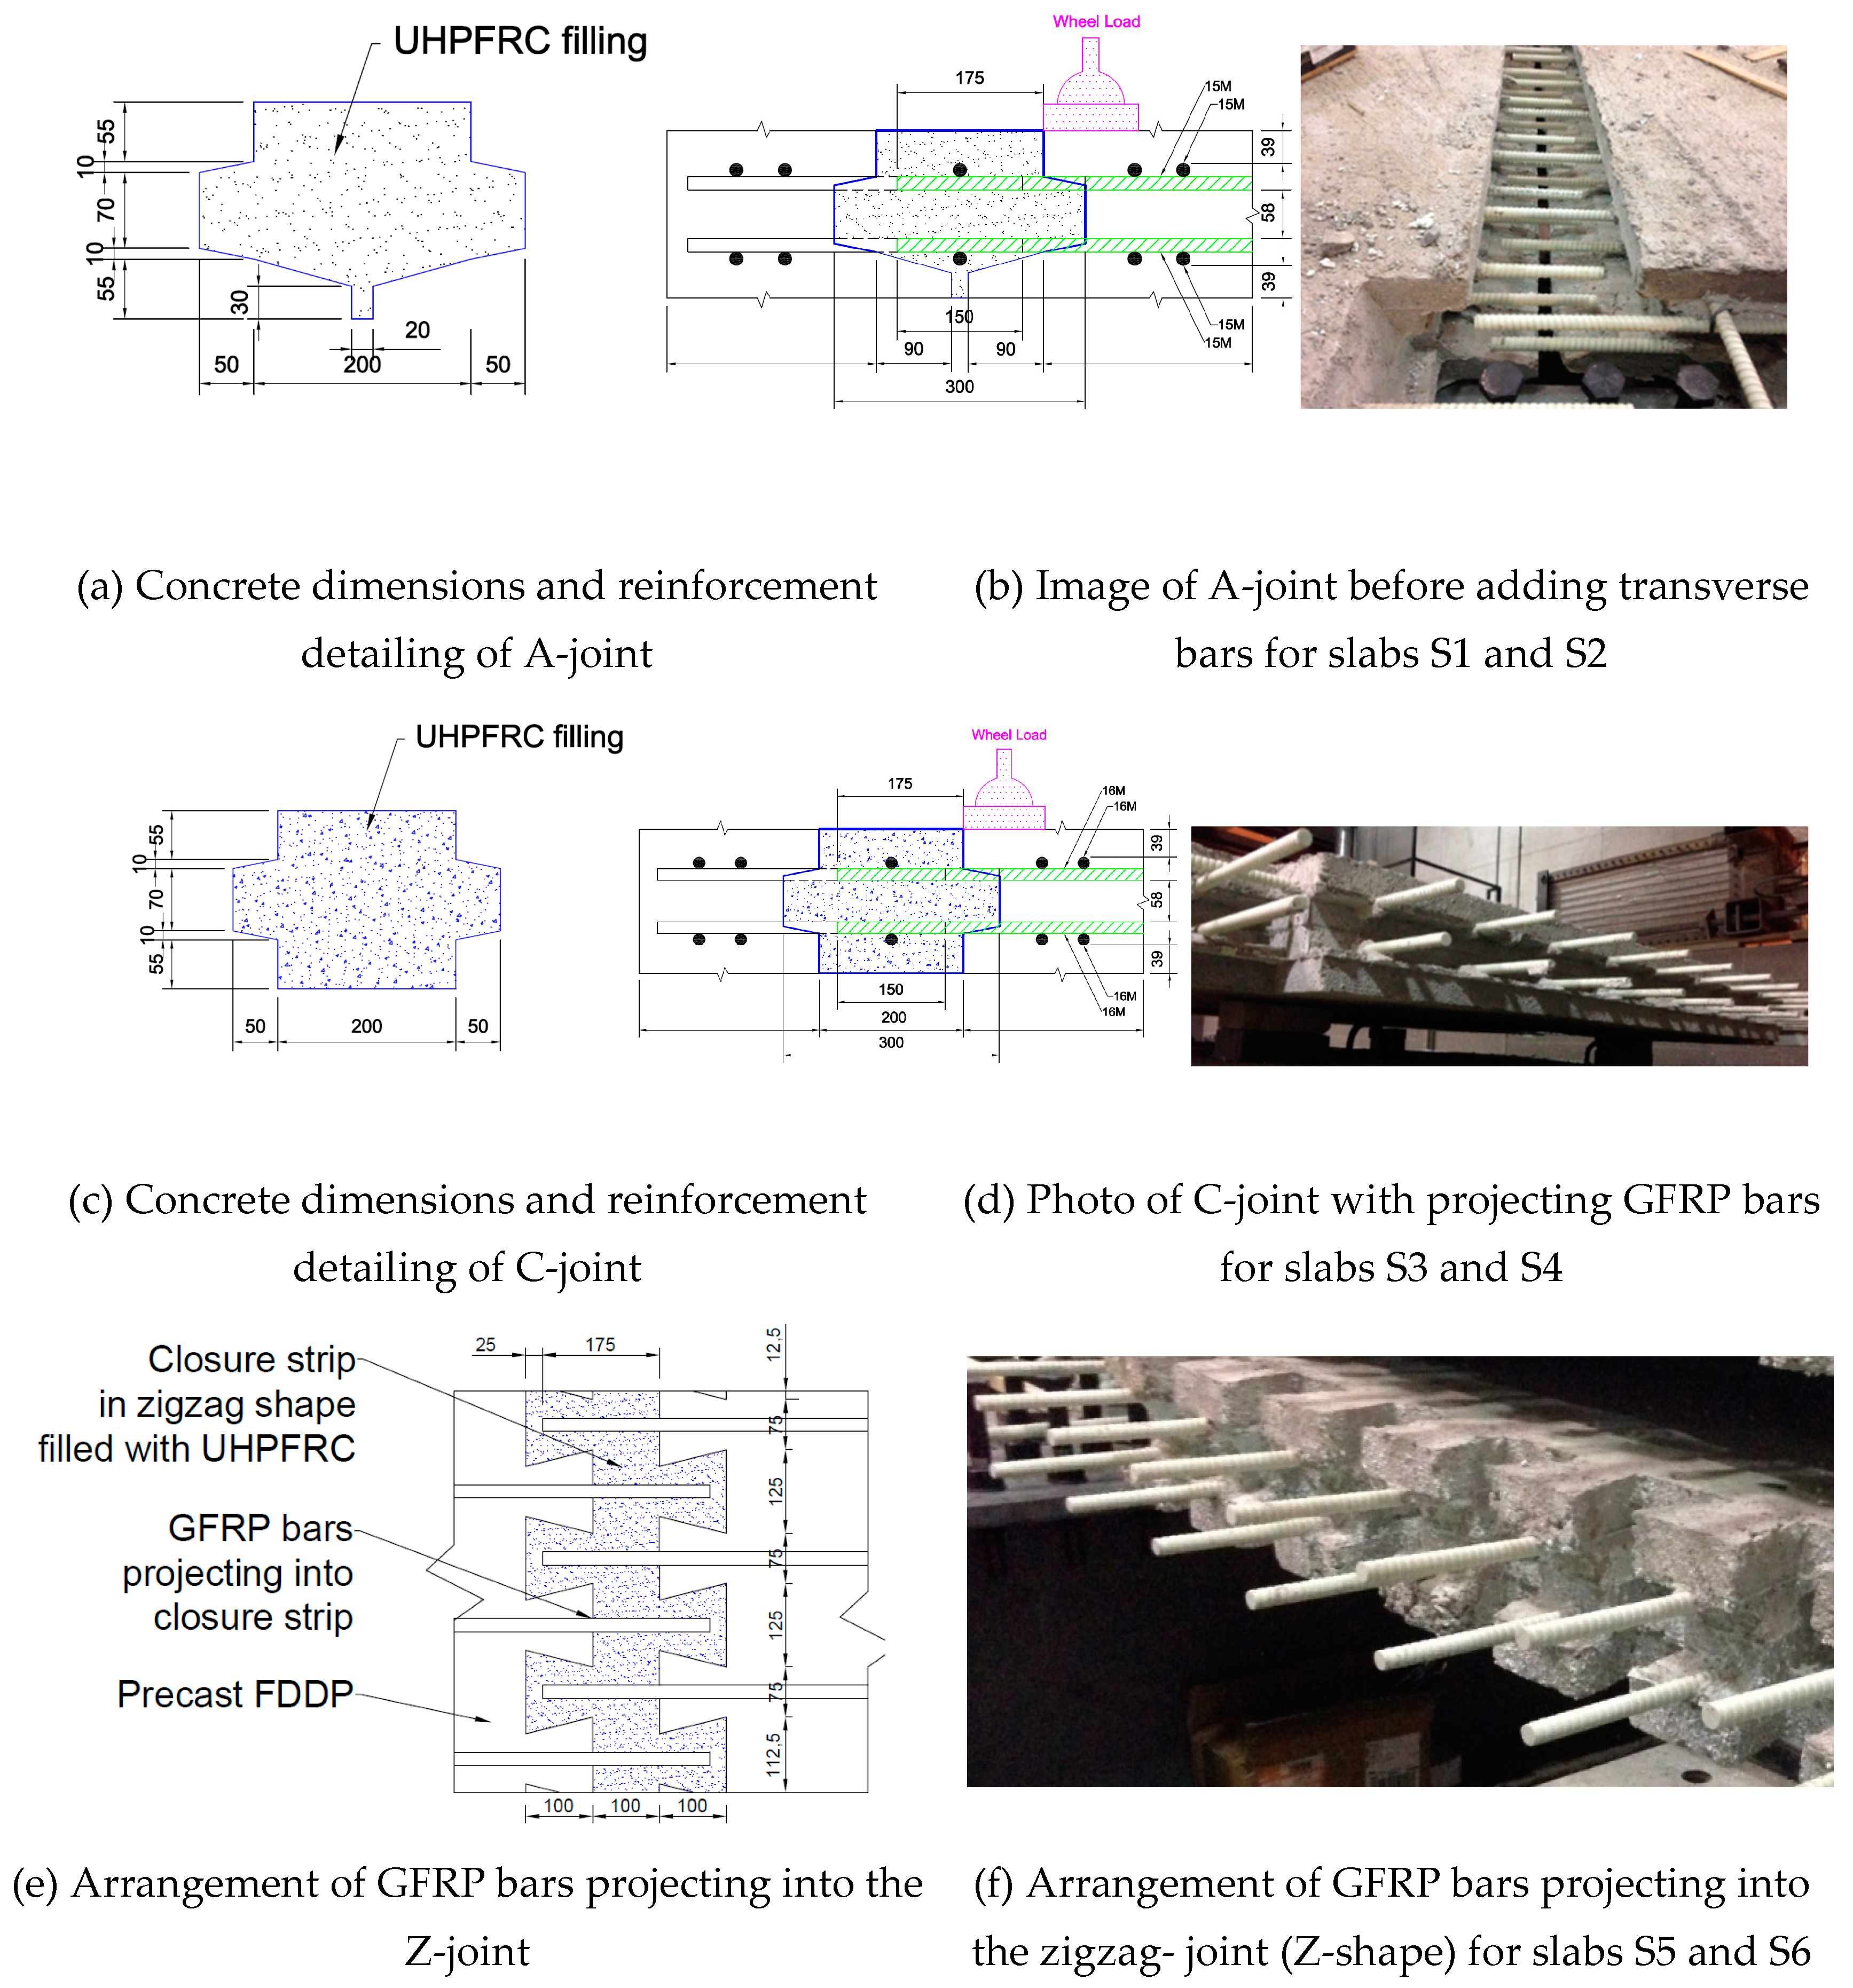
Figure 2.
Details of Steel twin-girder system supporting the precast FDDPs.
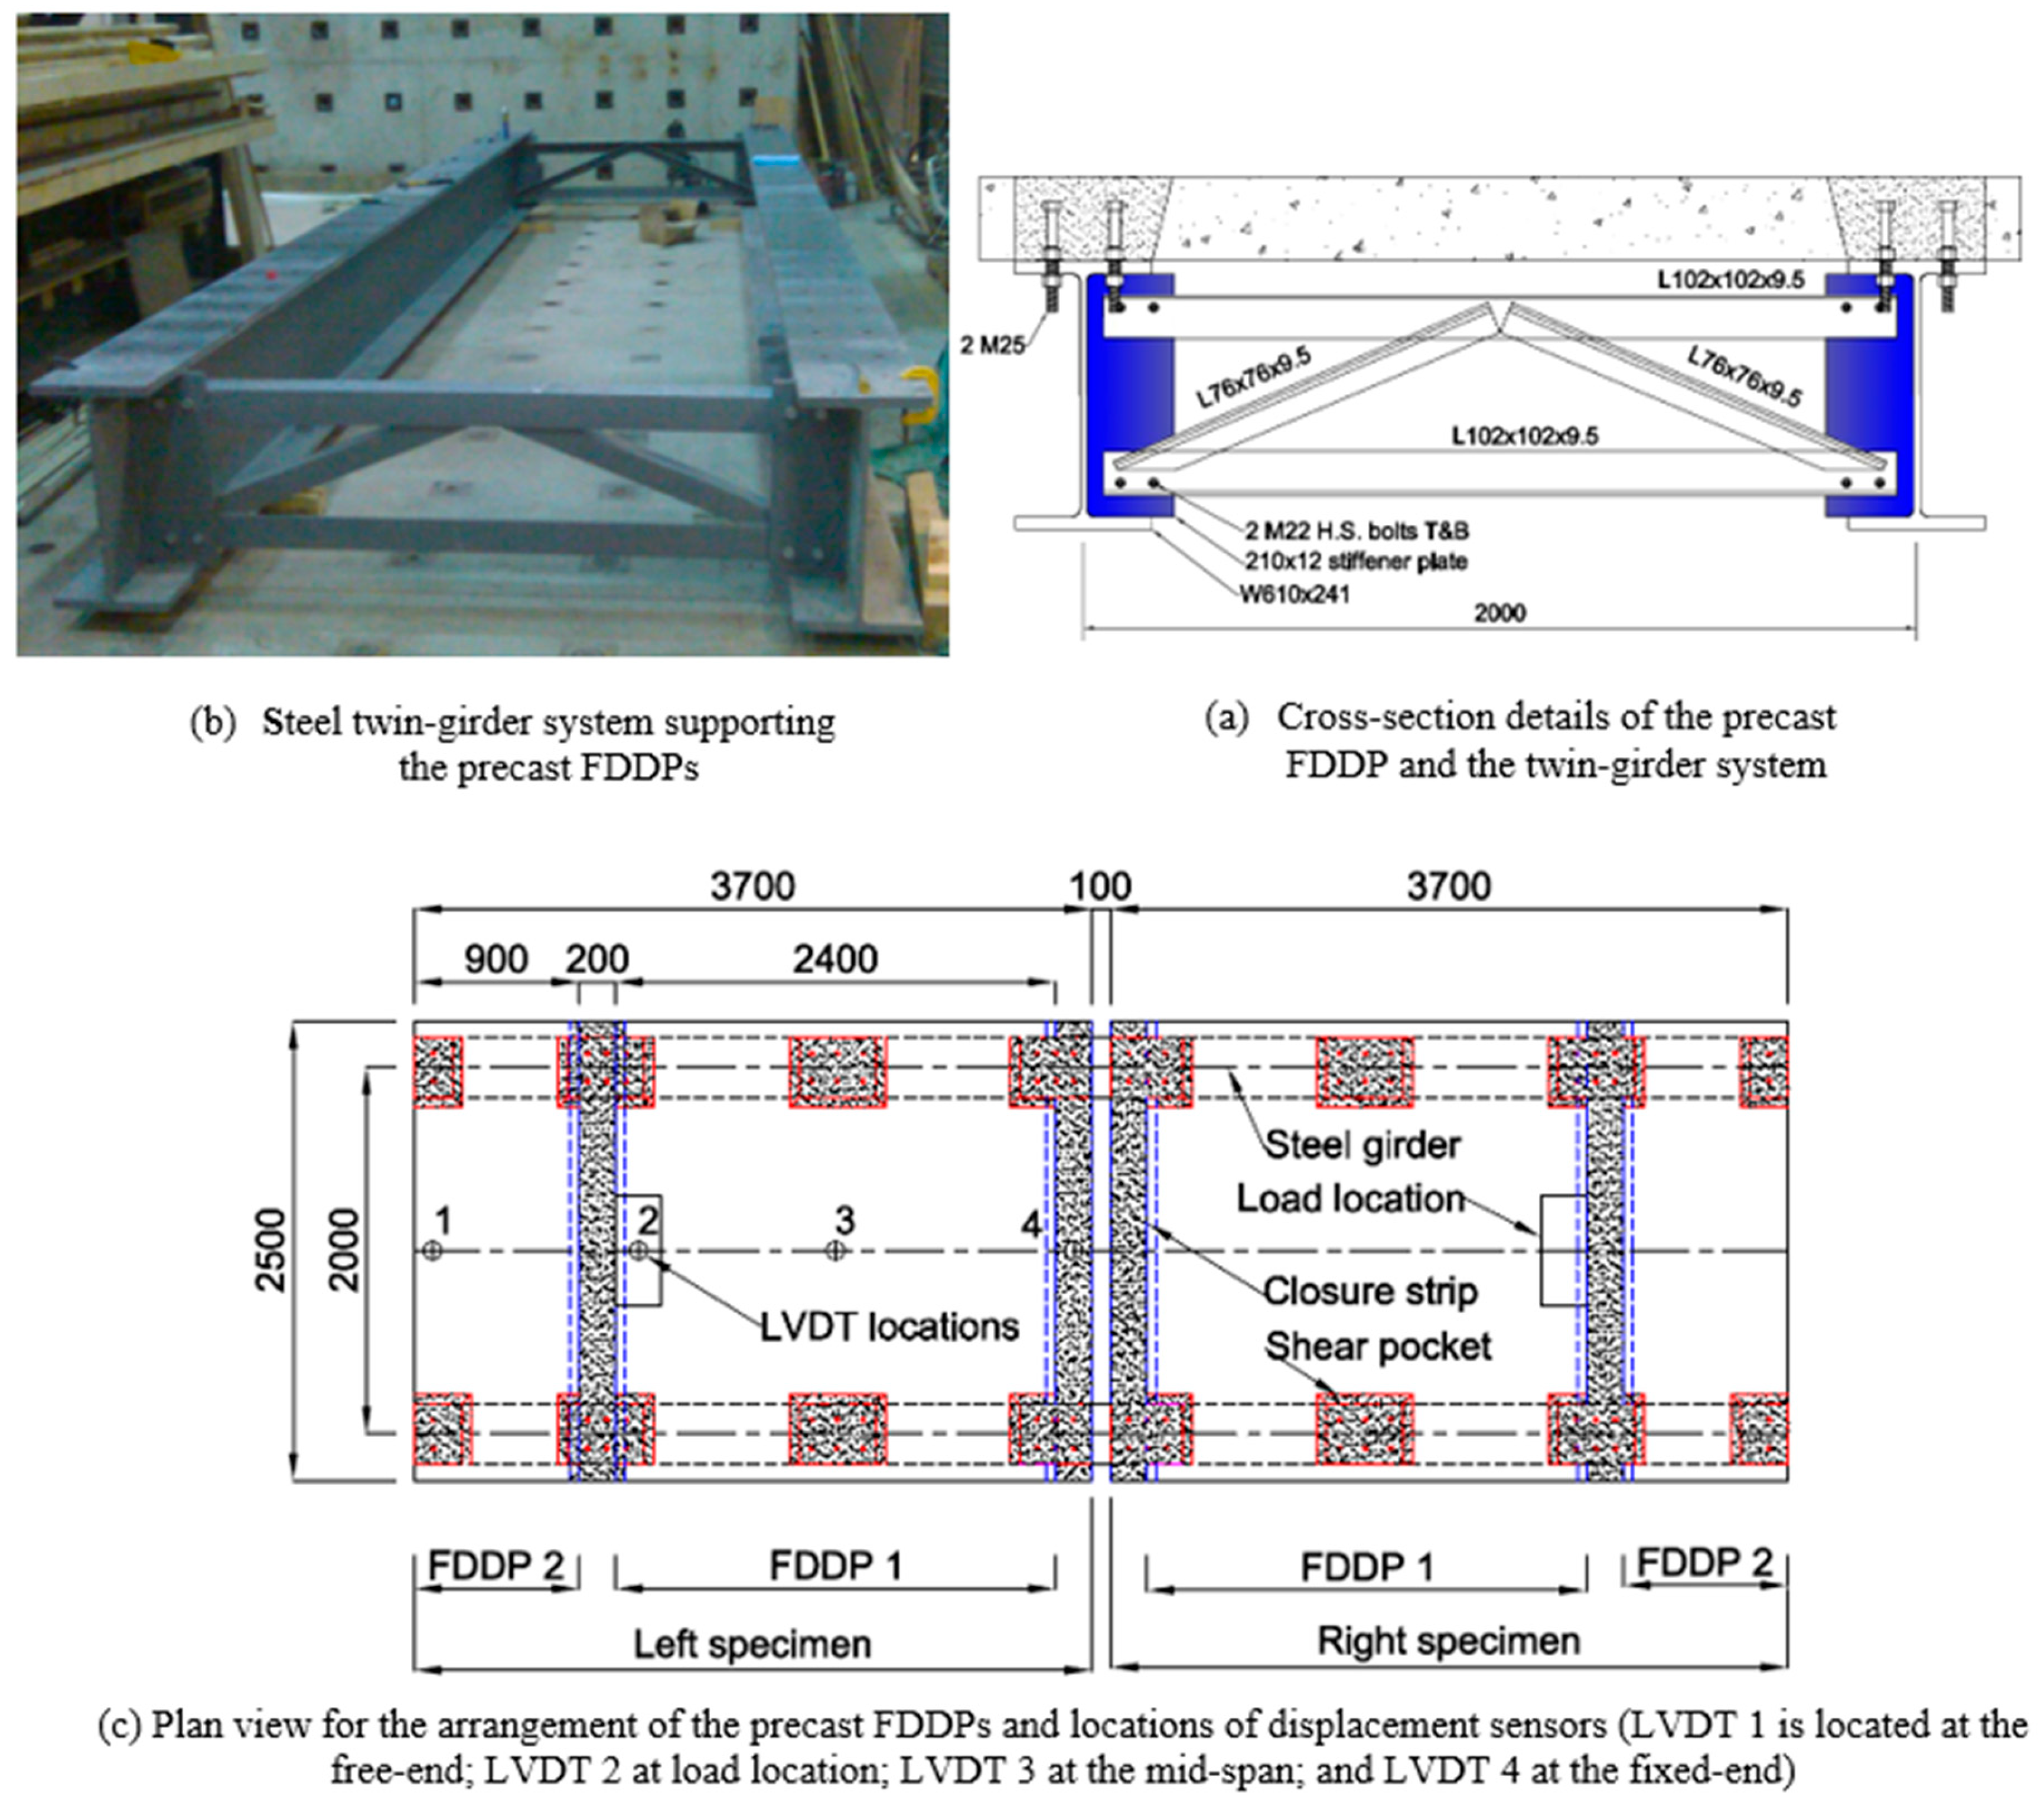
Figure 3.
Details and construction of the precast FDDP showing different joints.
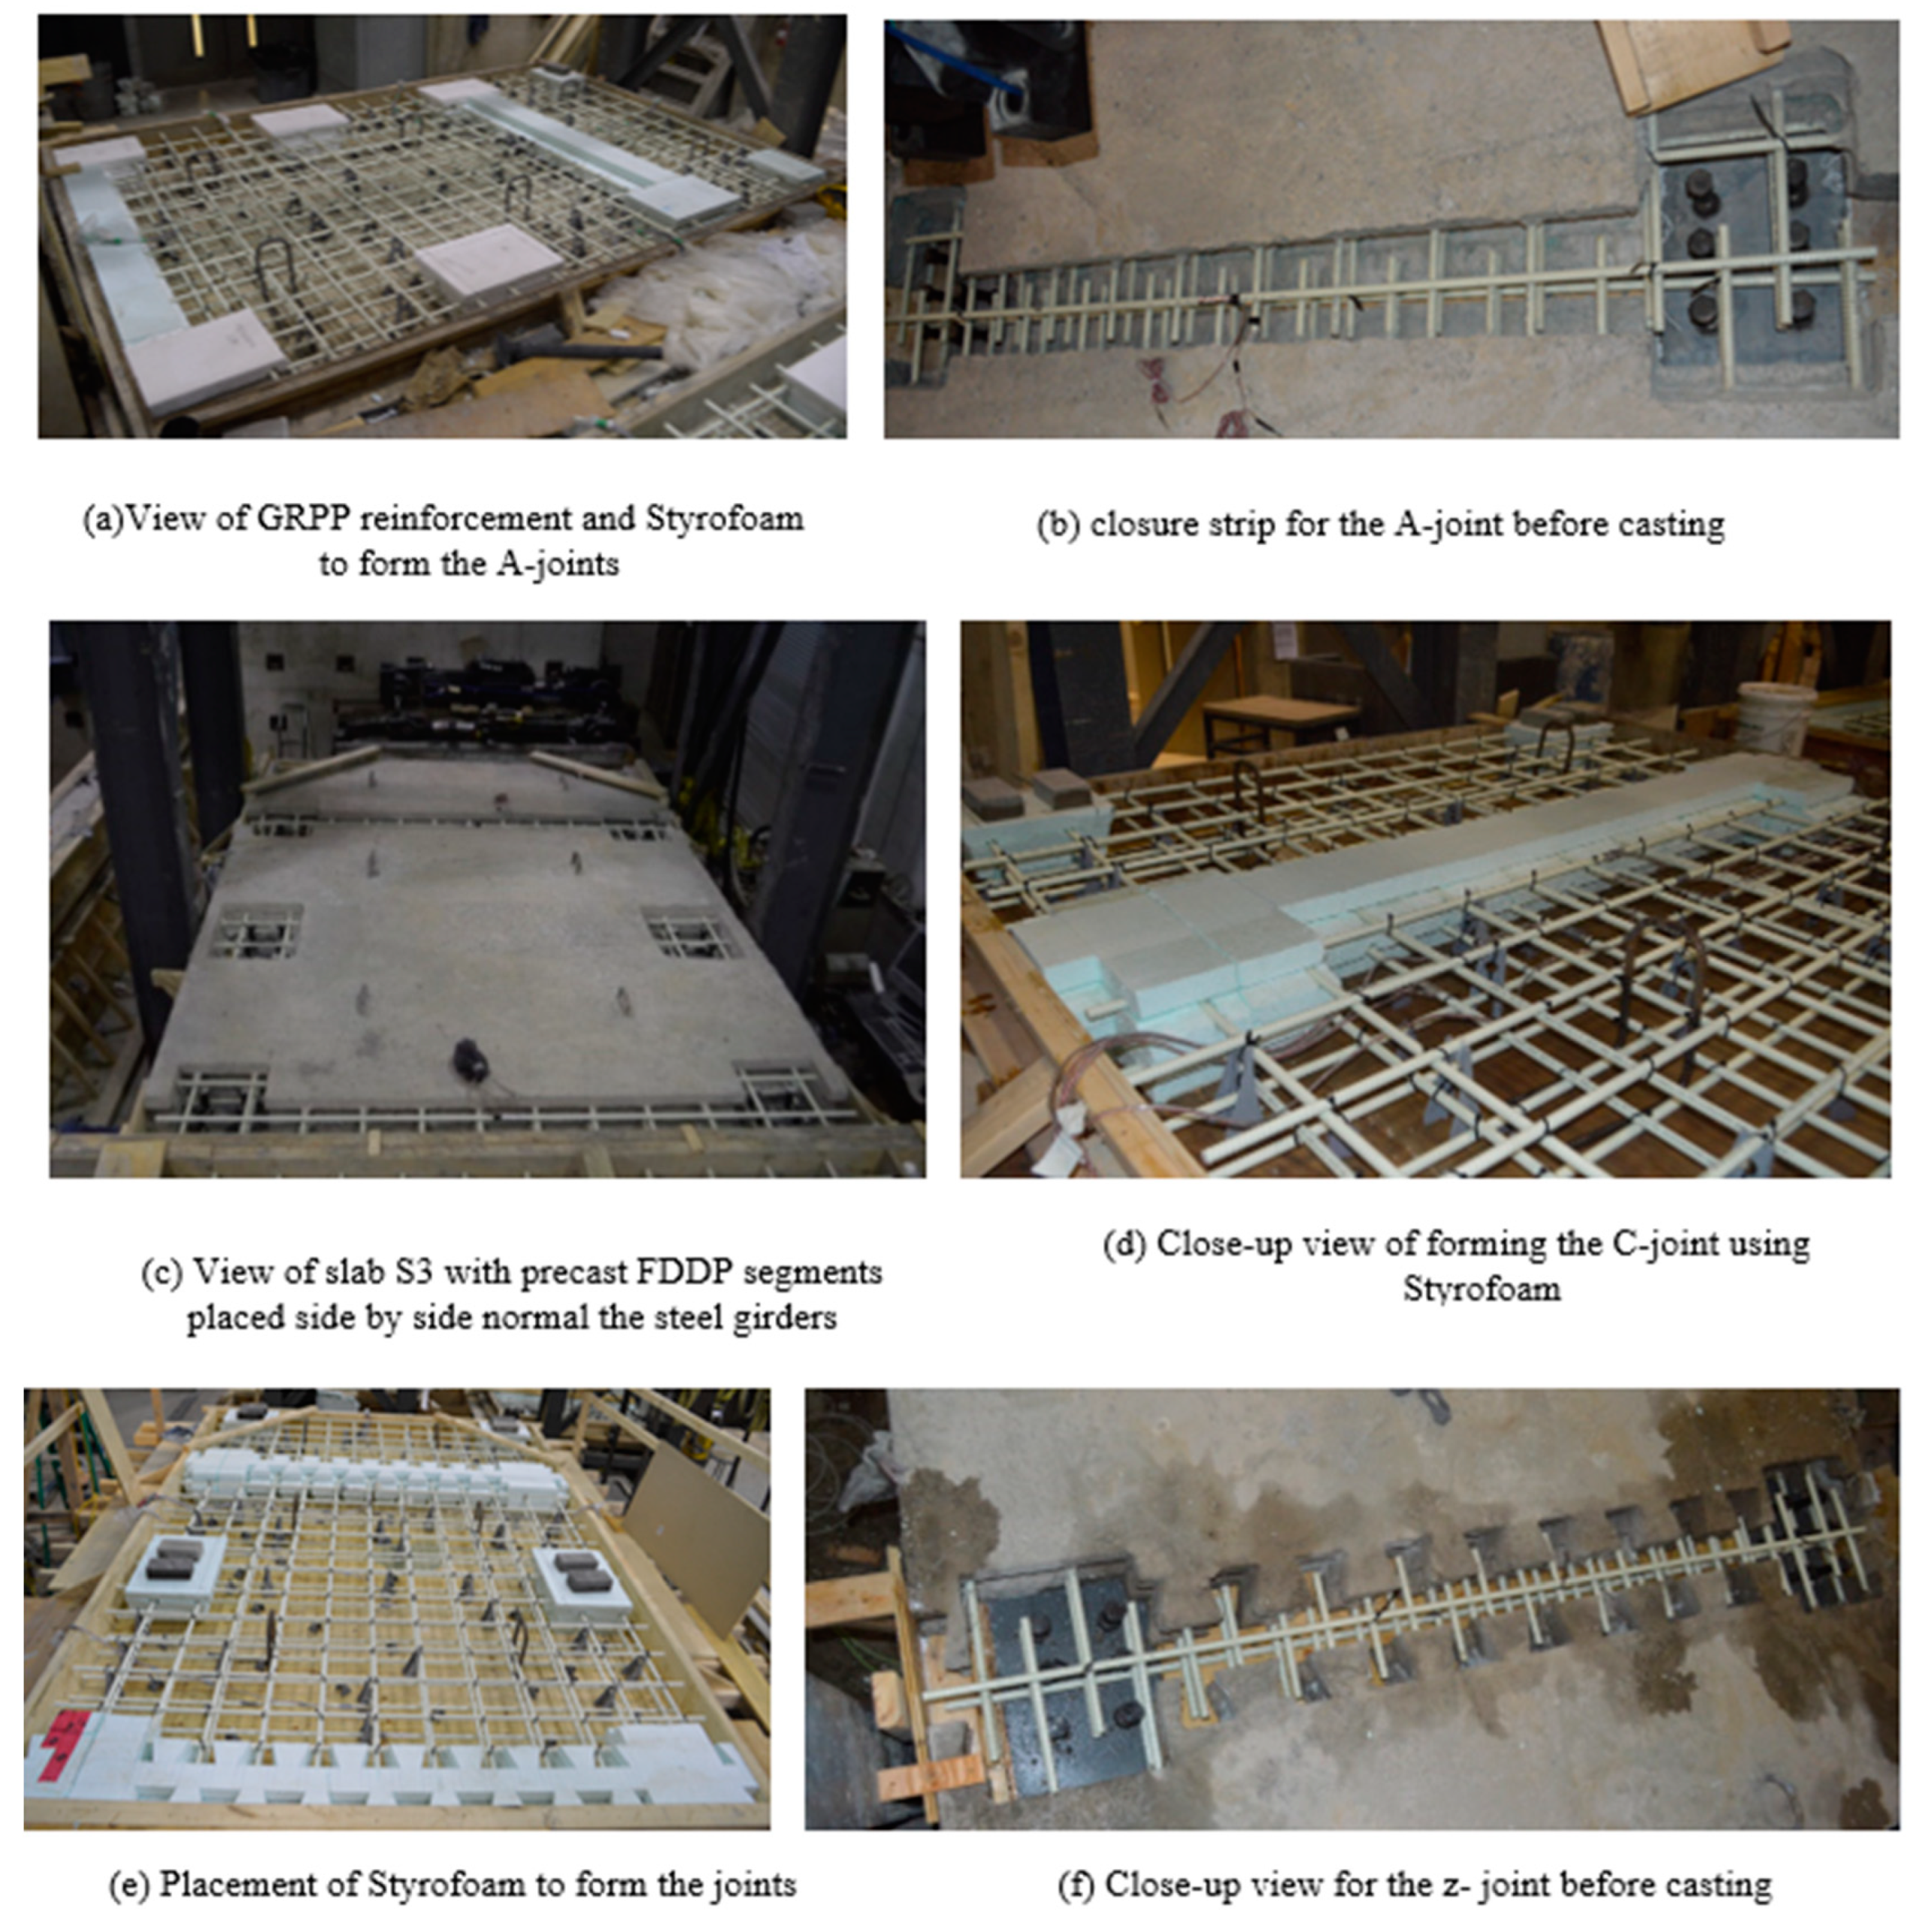
Figure 4.
Panel-to-girder connection of the precast FDDP.
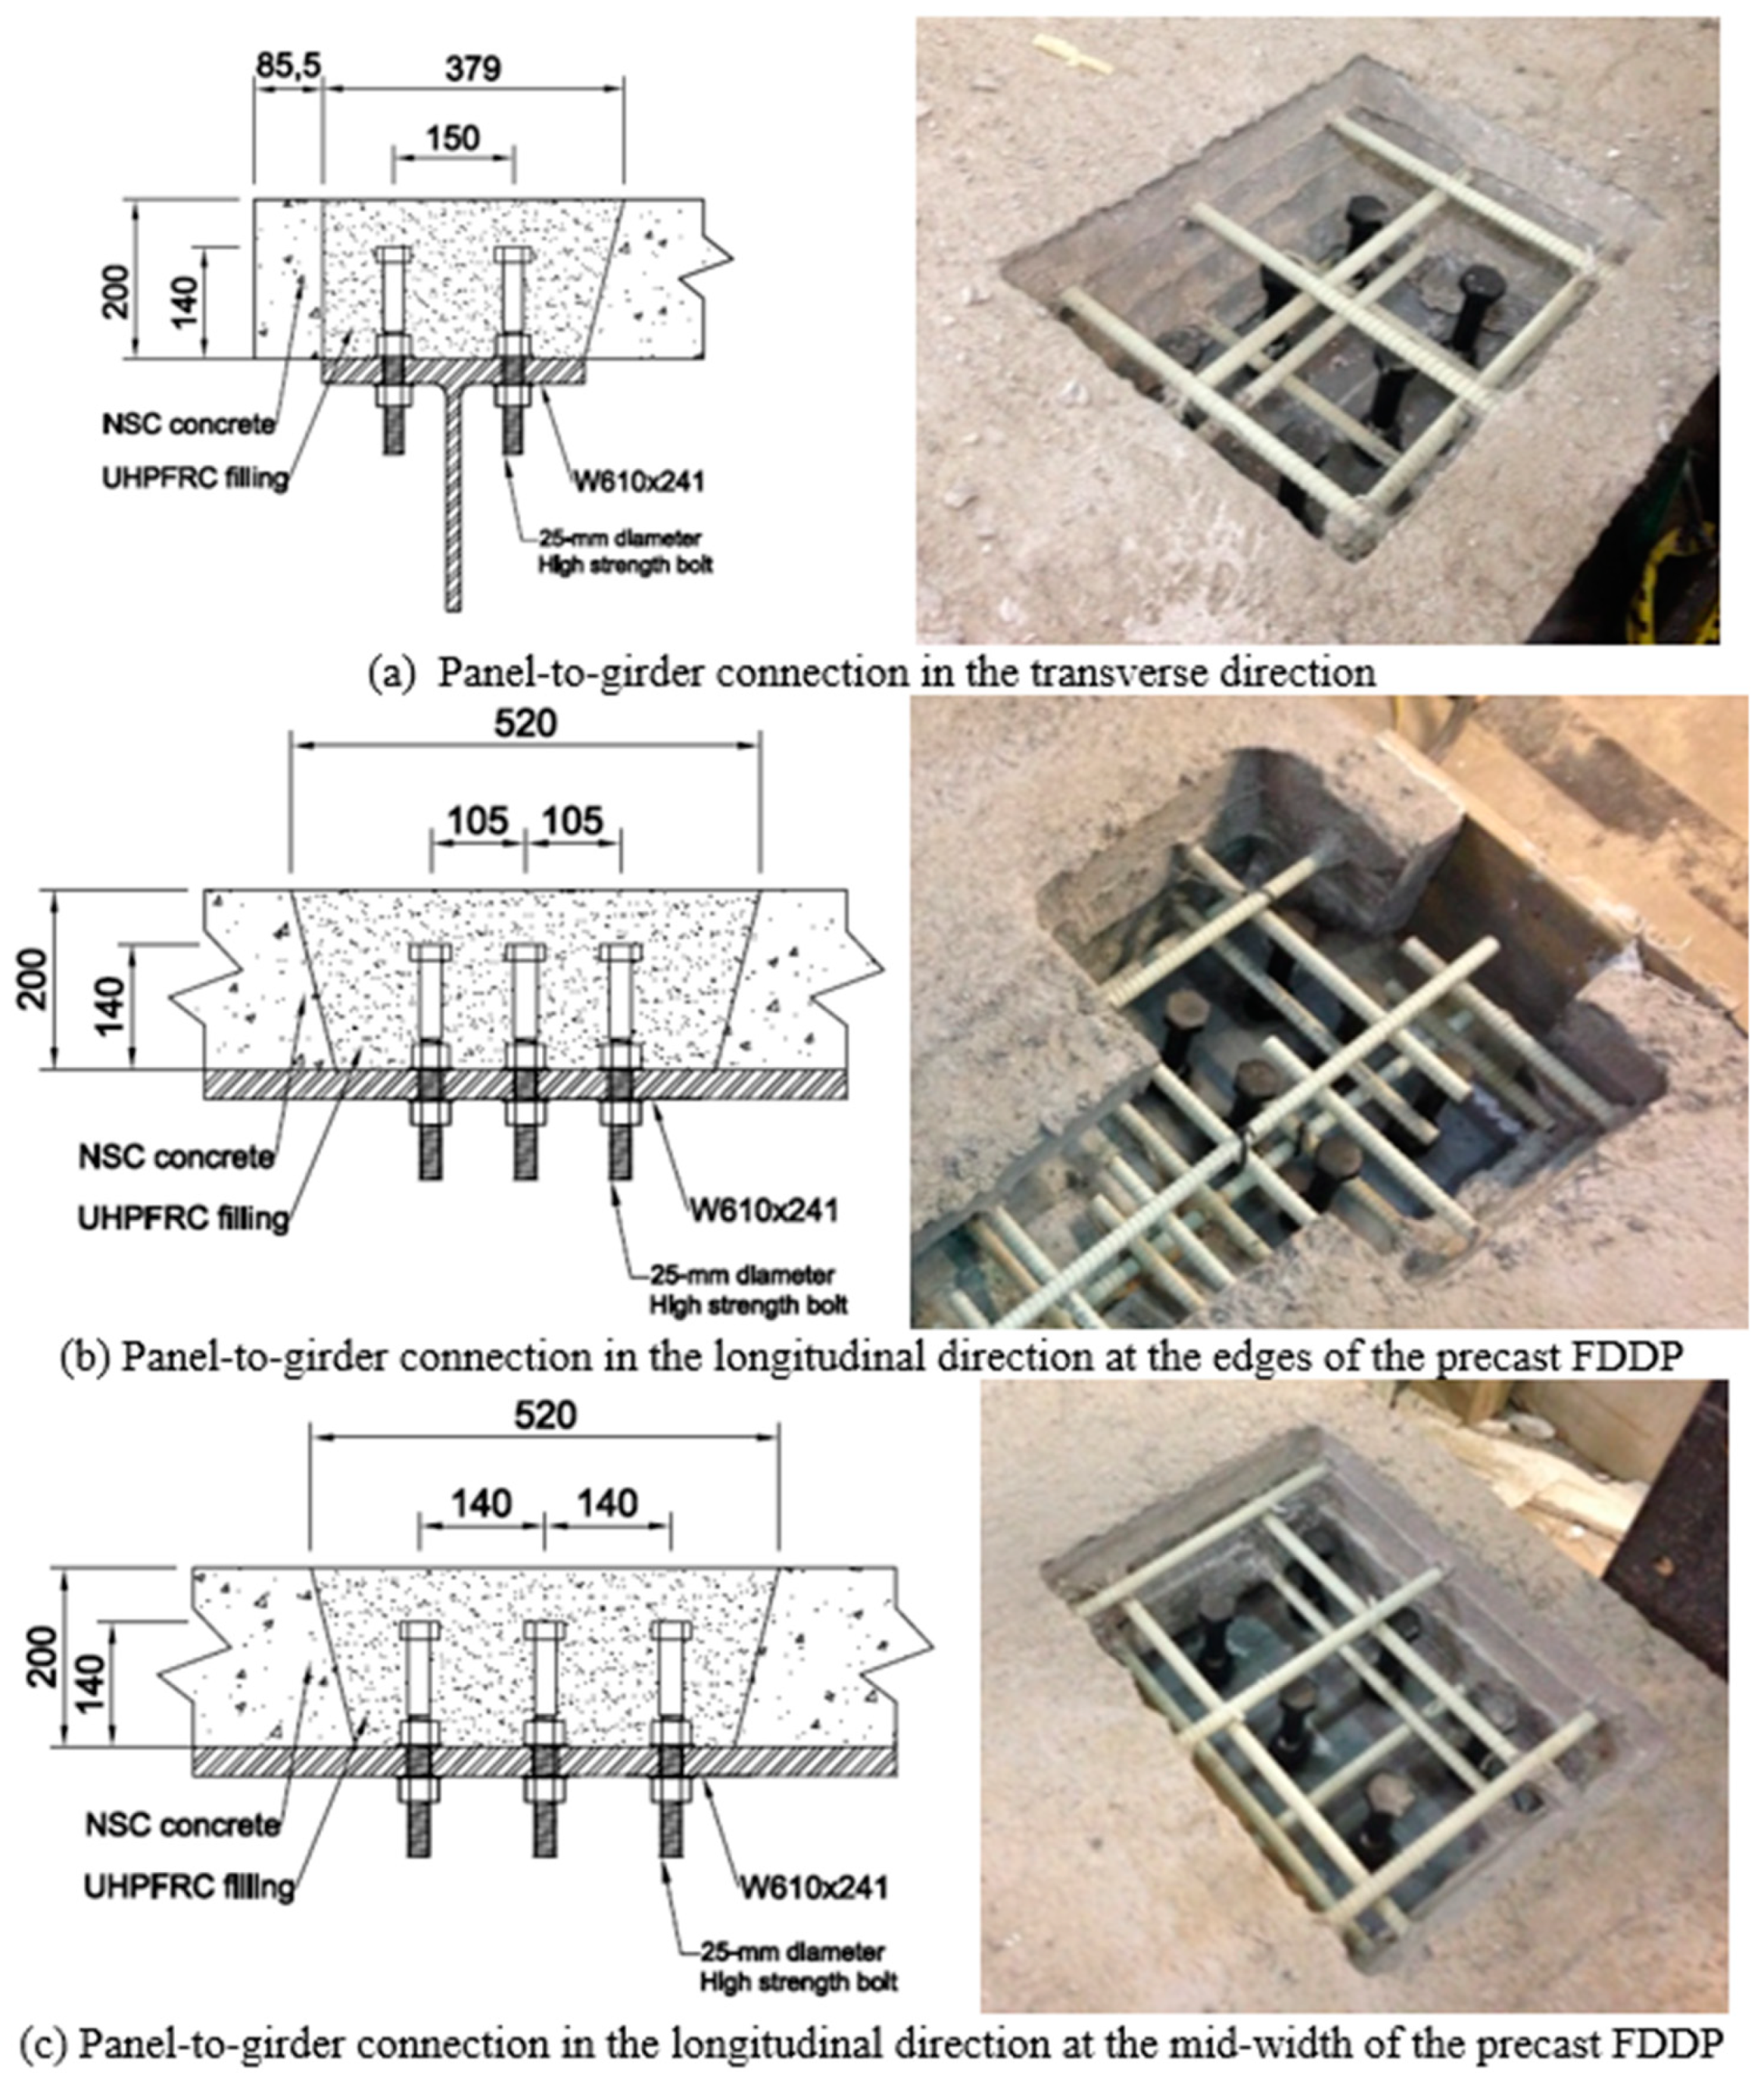
Figure 5.
Adopted loading history.
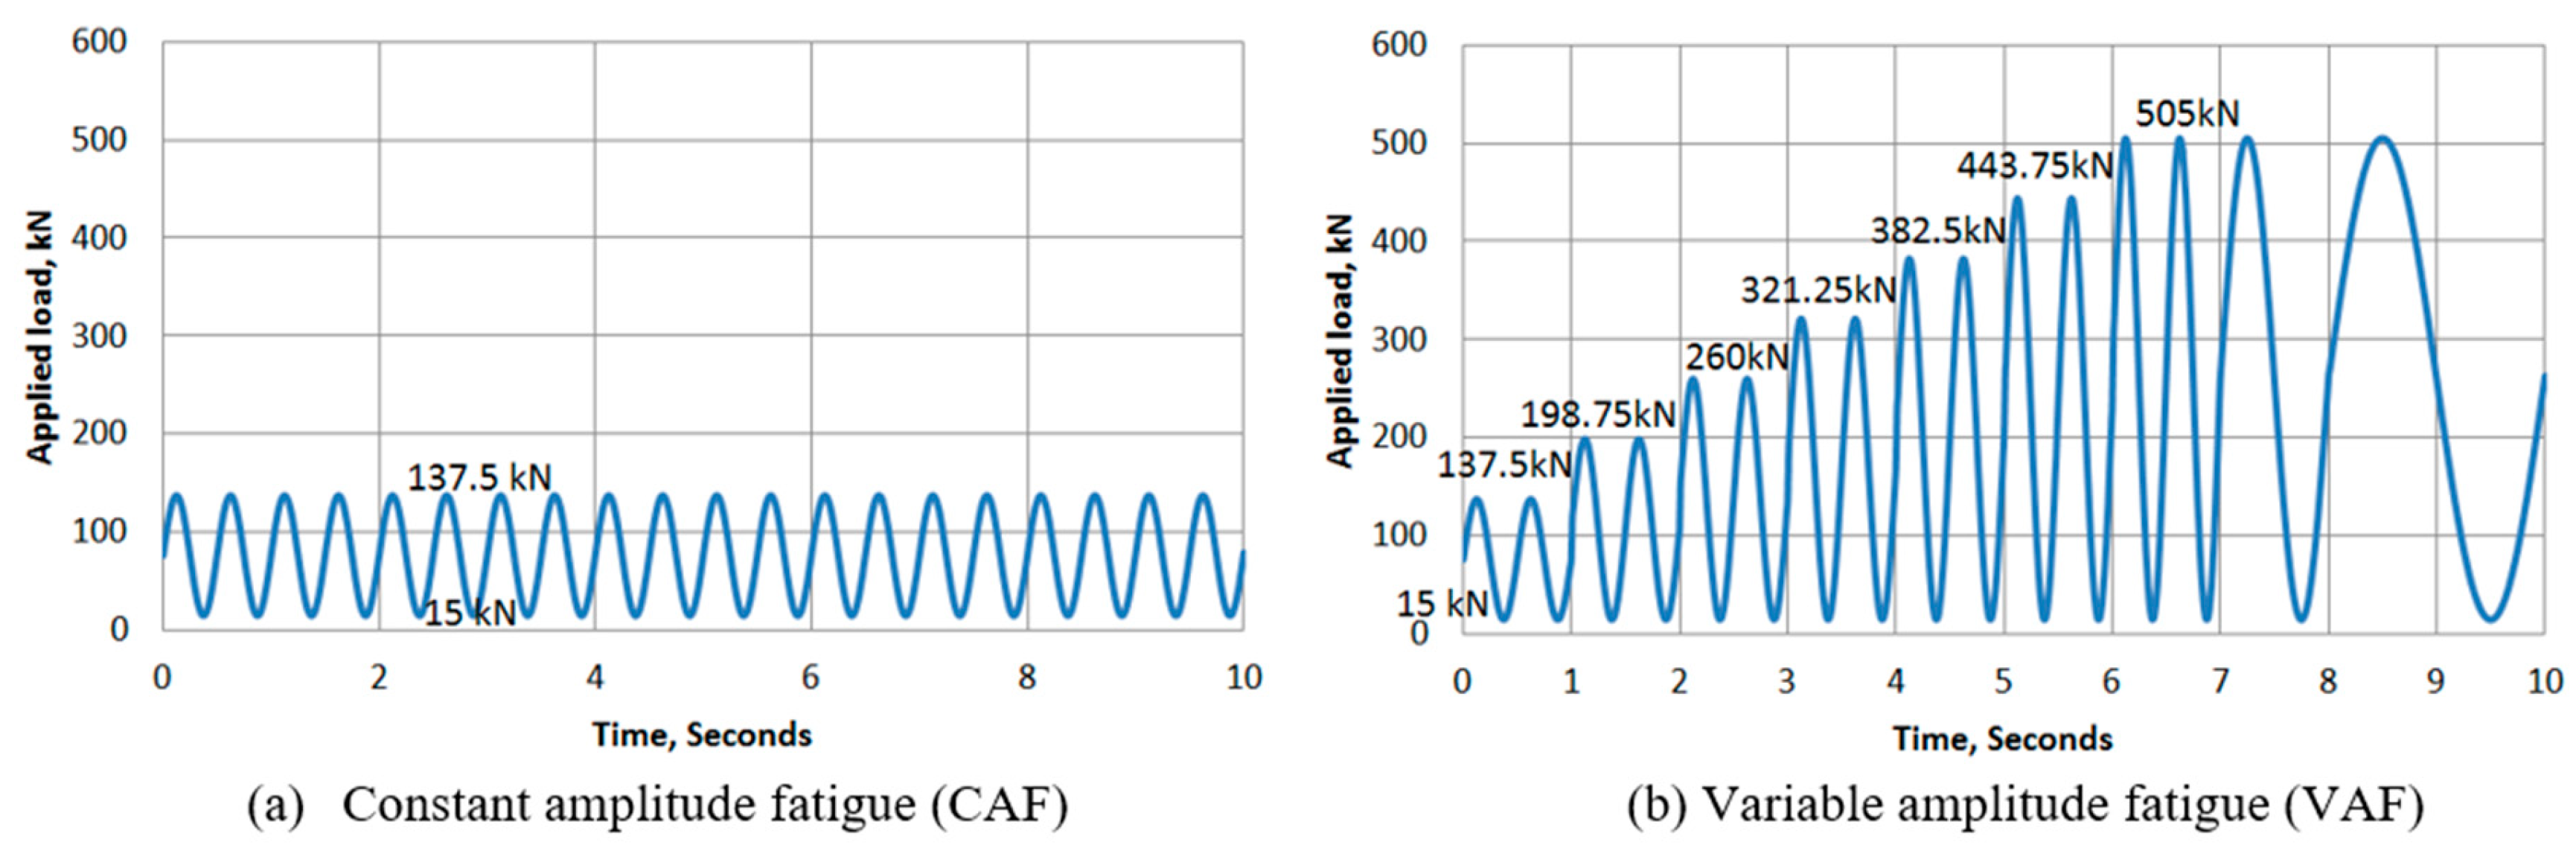
Figure 6.
View of the test setup for fatigue loading and the monotonic loading for FDDP system.
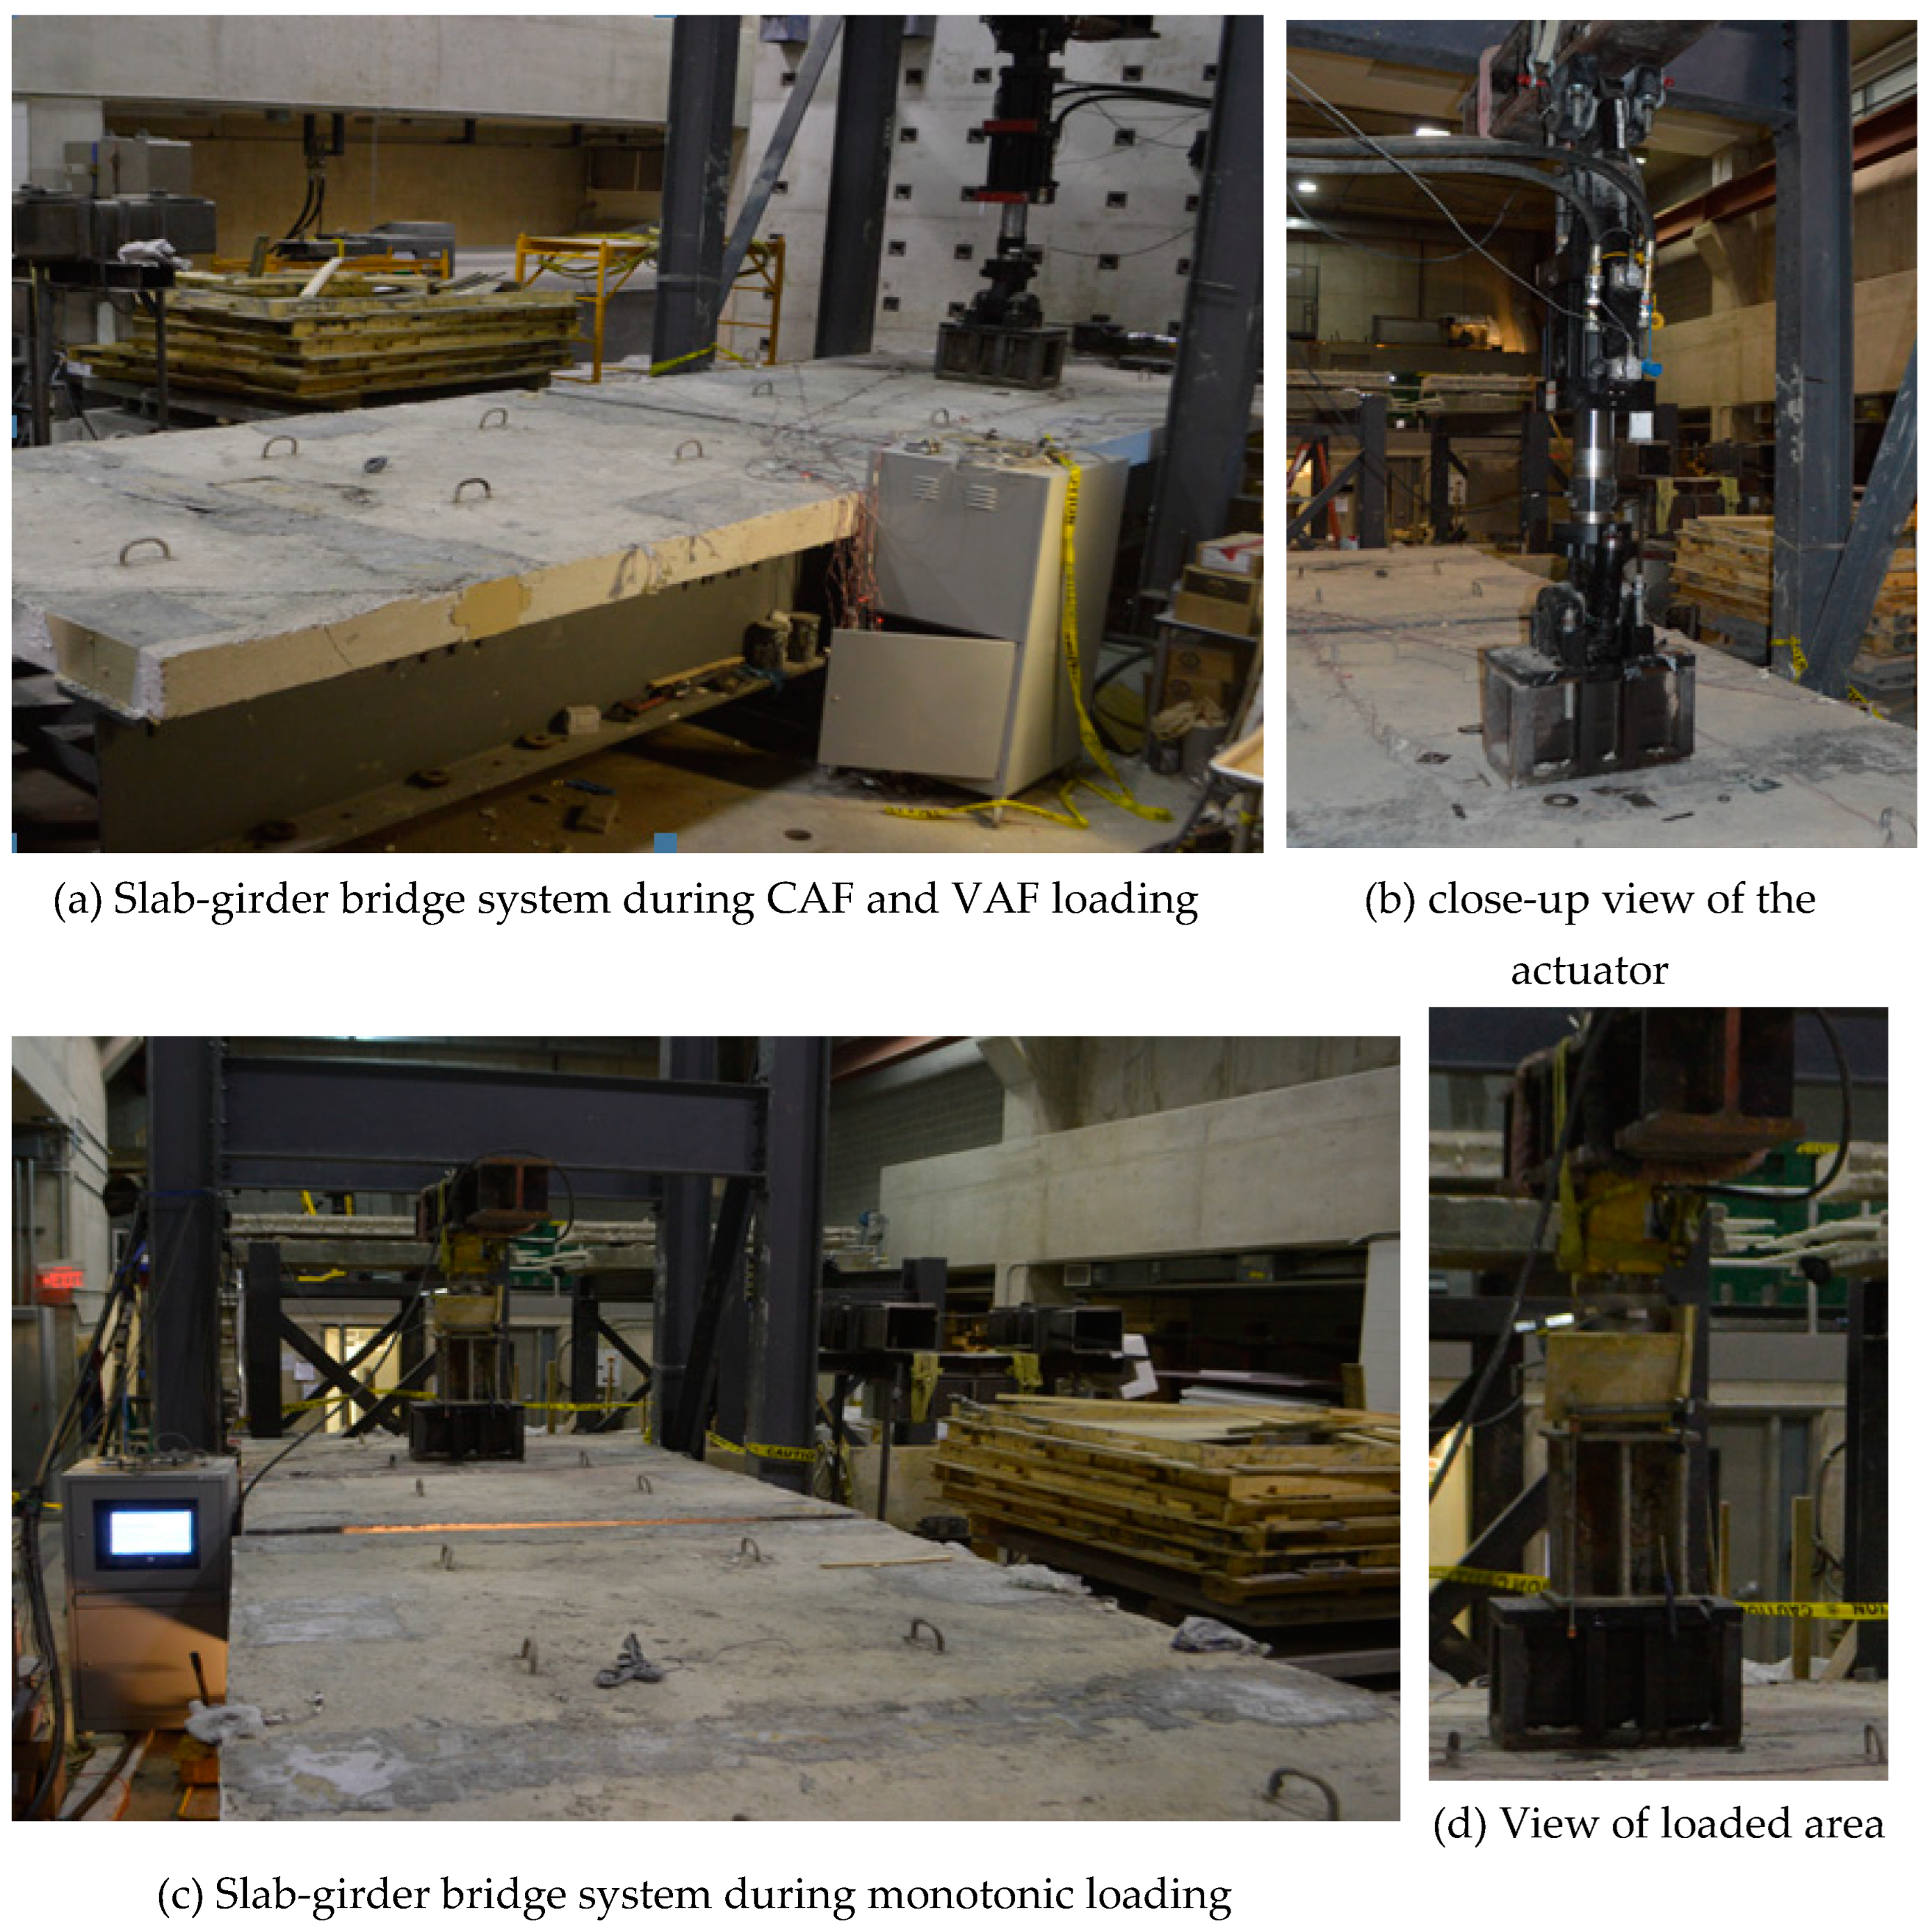
Figure 7.
Static load-deflection curves for slab S1 after being subjected to CAF loading.
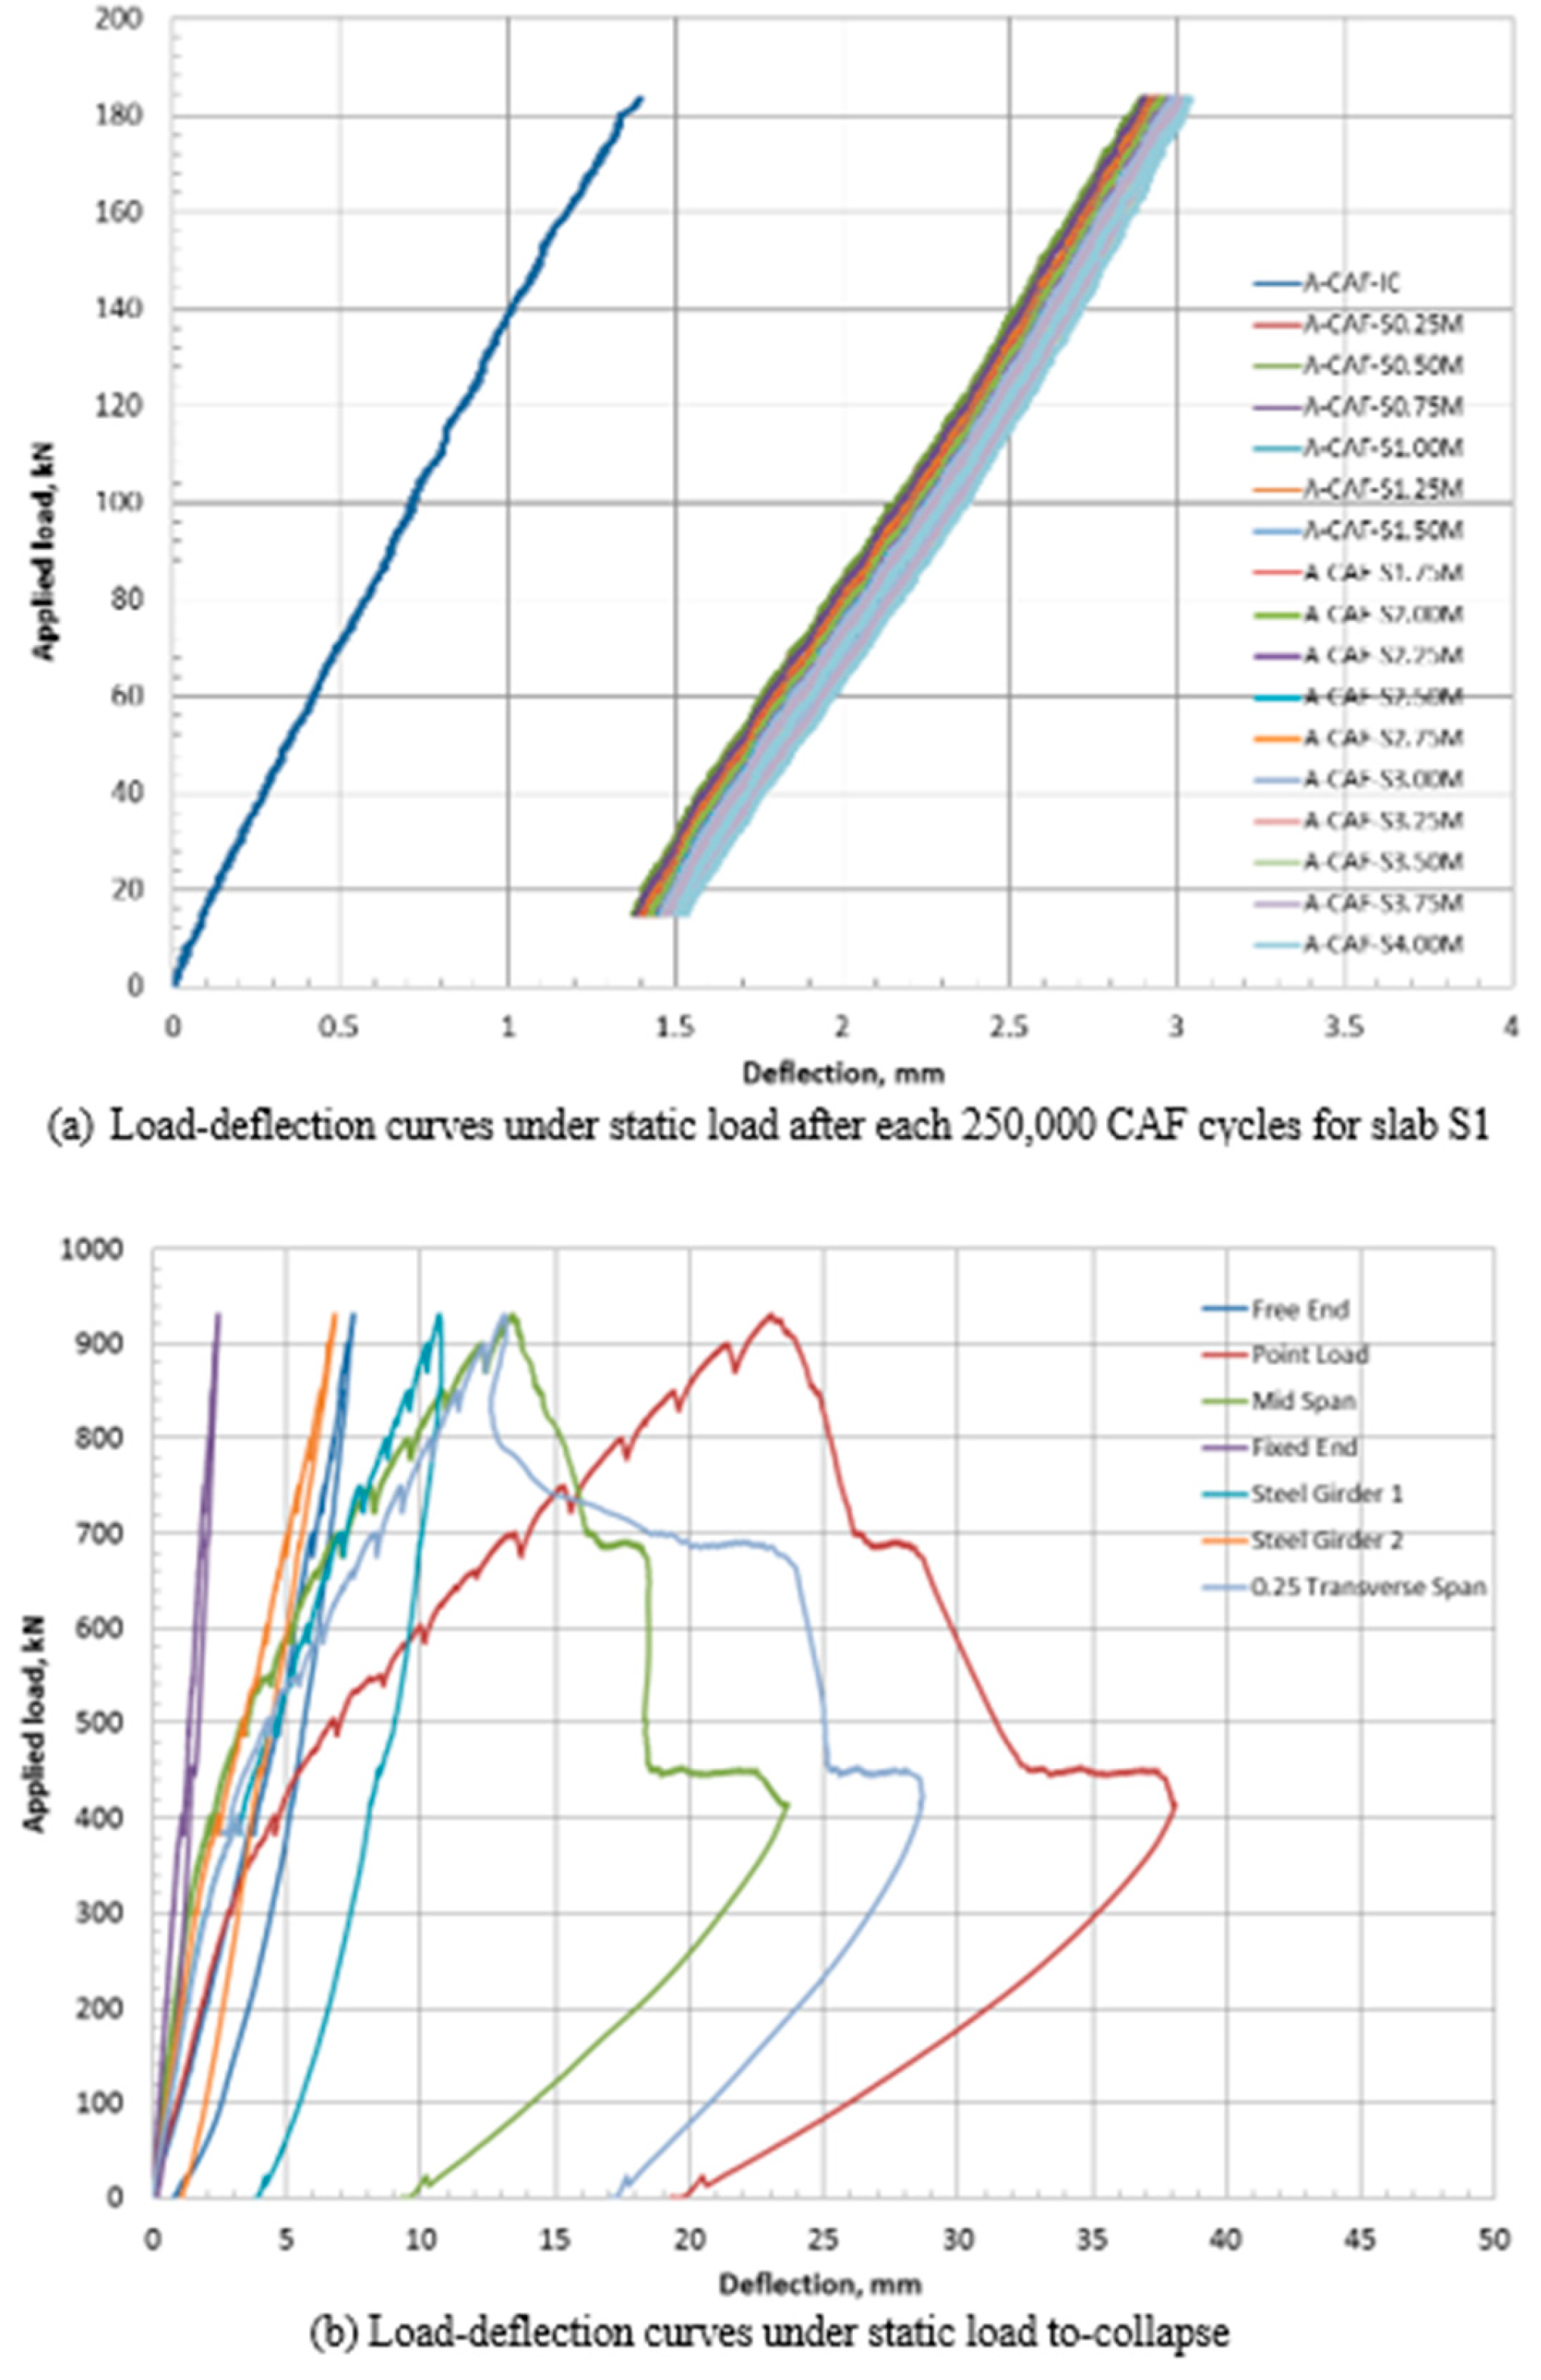
Figure 8.
Crack pattern after failure of slabs S1, S3 and S5 having A-joint, C-joint and Z-joint tested under CAF loading followed by static load test to-collapse.
Figure 8.
Crack pattern after failure of slabs S1, S3 and S5 having A-joint, C-joint and Z-joint tested under CAF loading followed by static load test to-collapse.
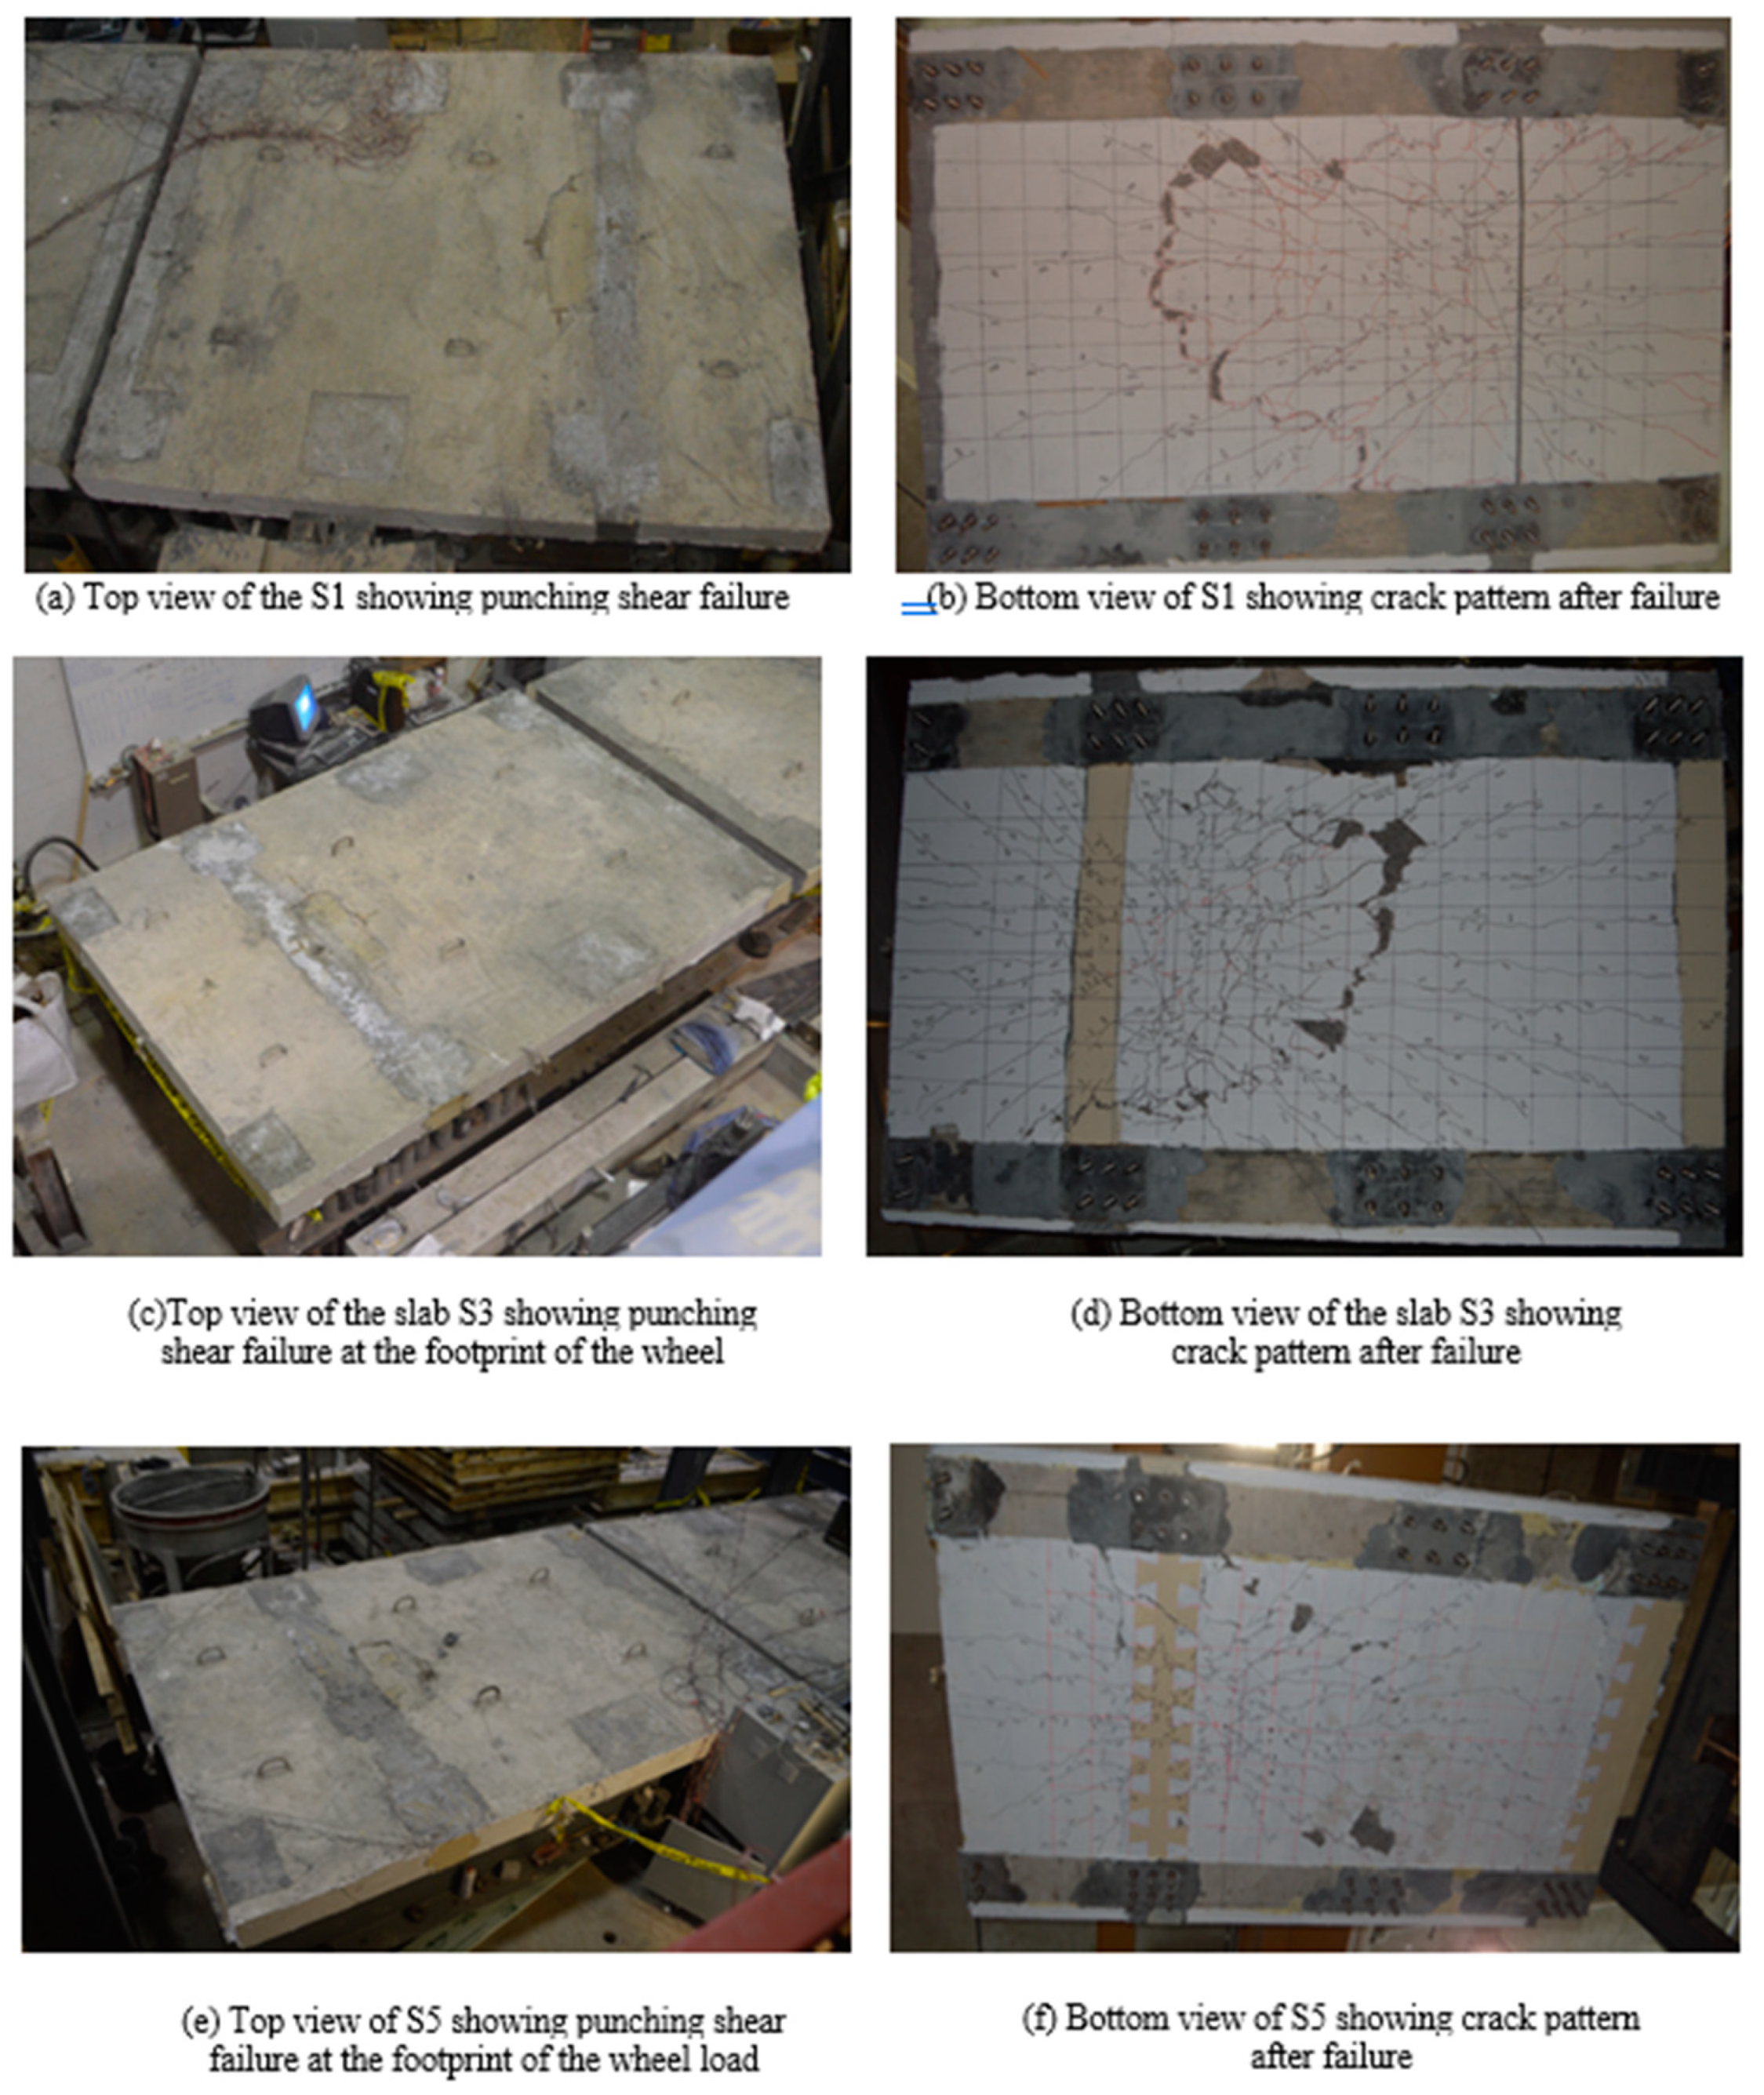
Figure 9.
Monotonic load-deflection curves for slab S3 during CAF loading and static load test to-collapse.
Figure 9.
Monotonic load-deflection curves for slab S3 during CAF loading and static load test to-collapse.
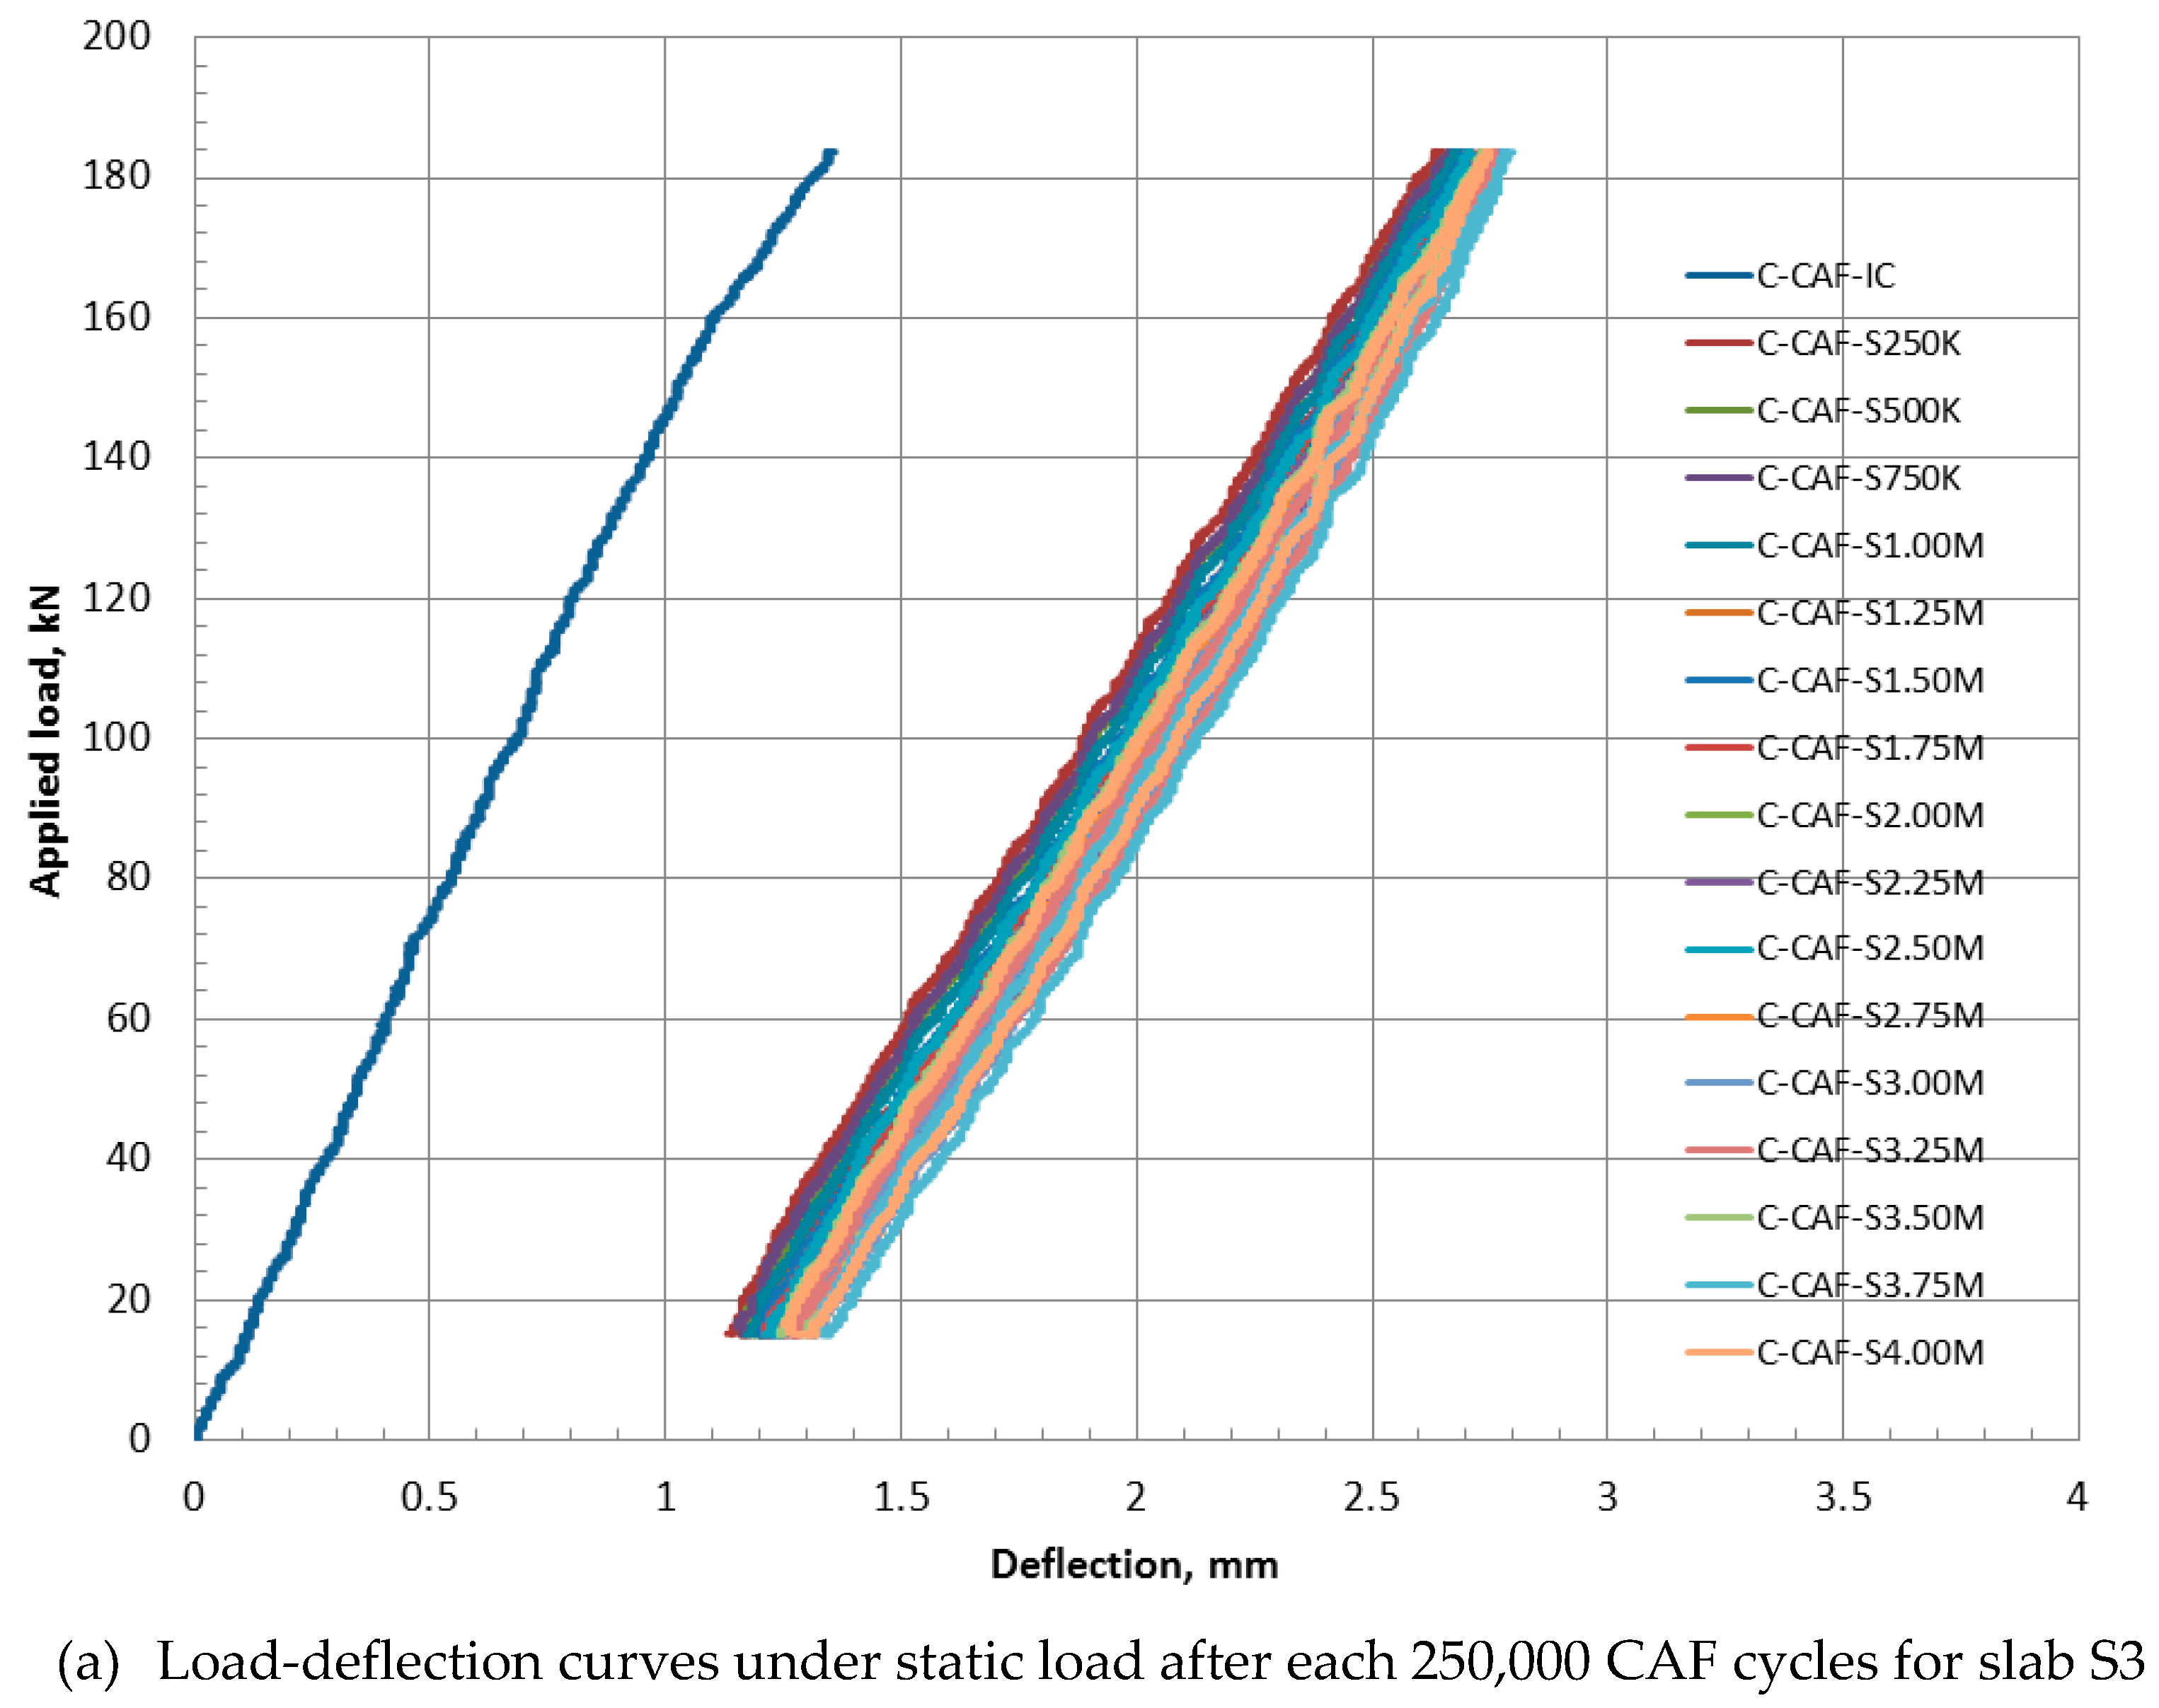
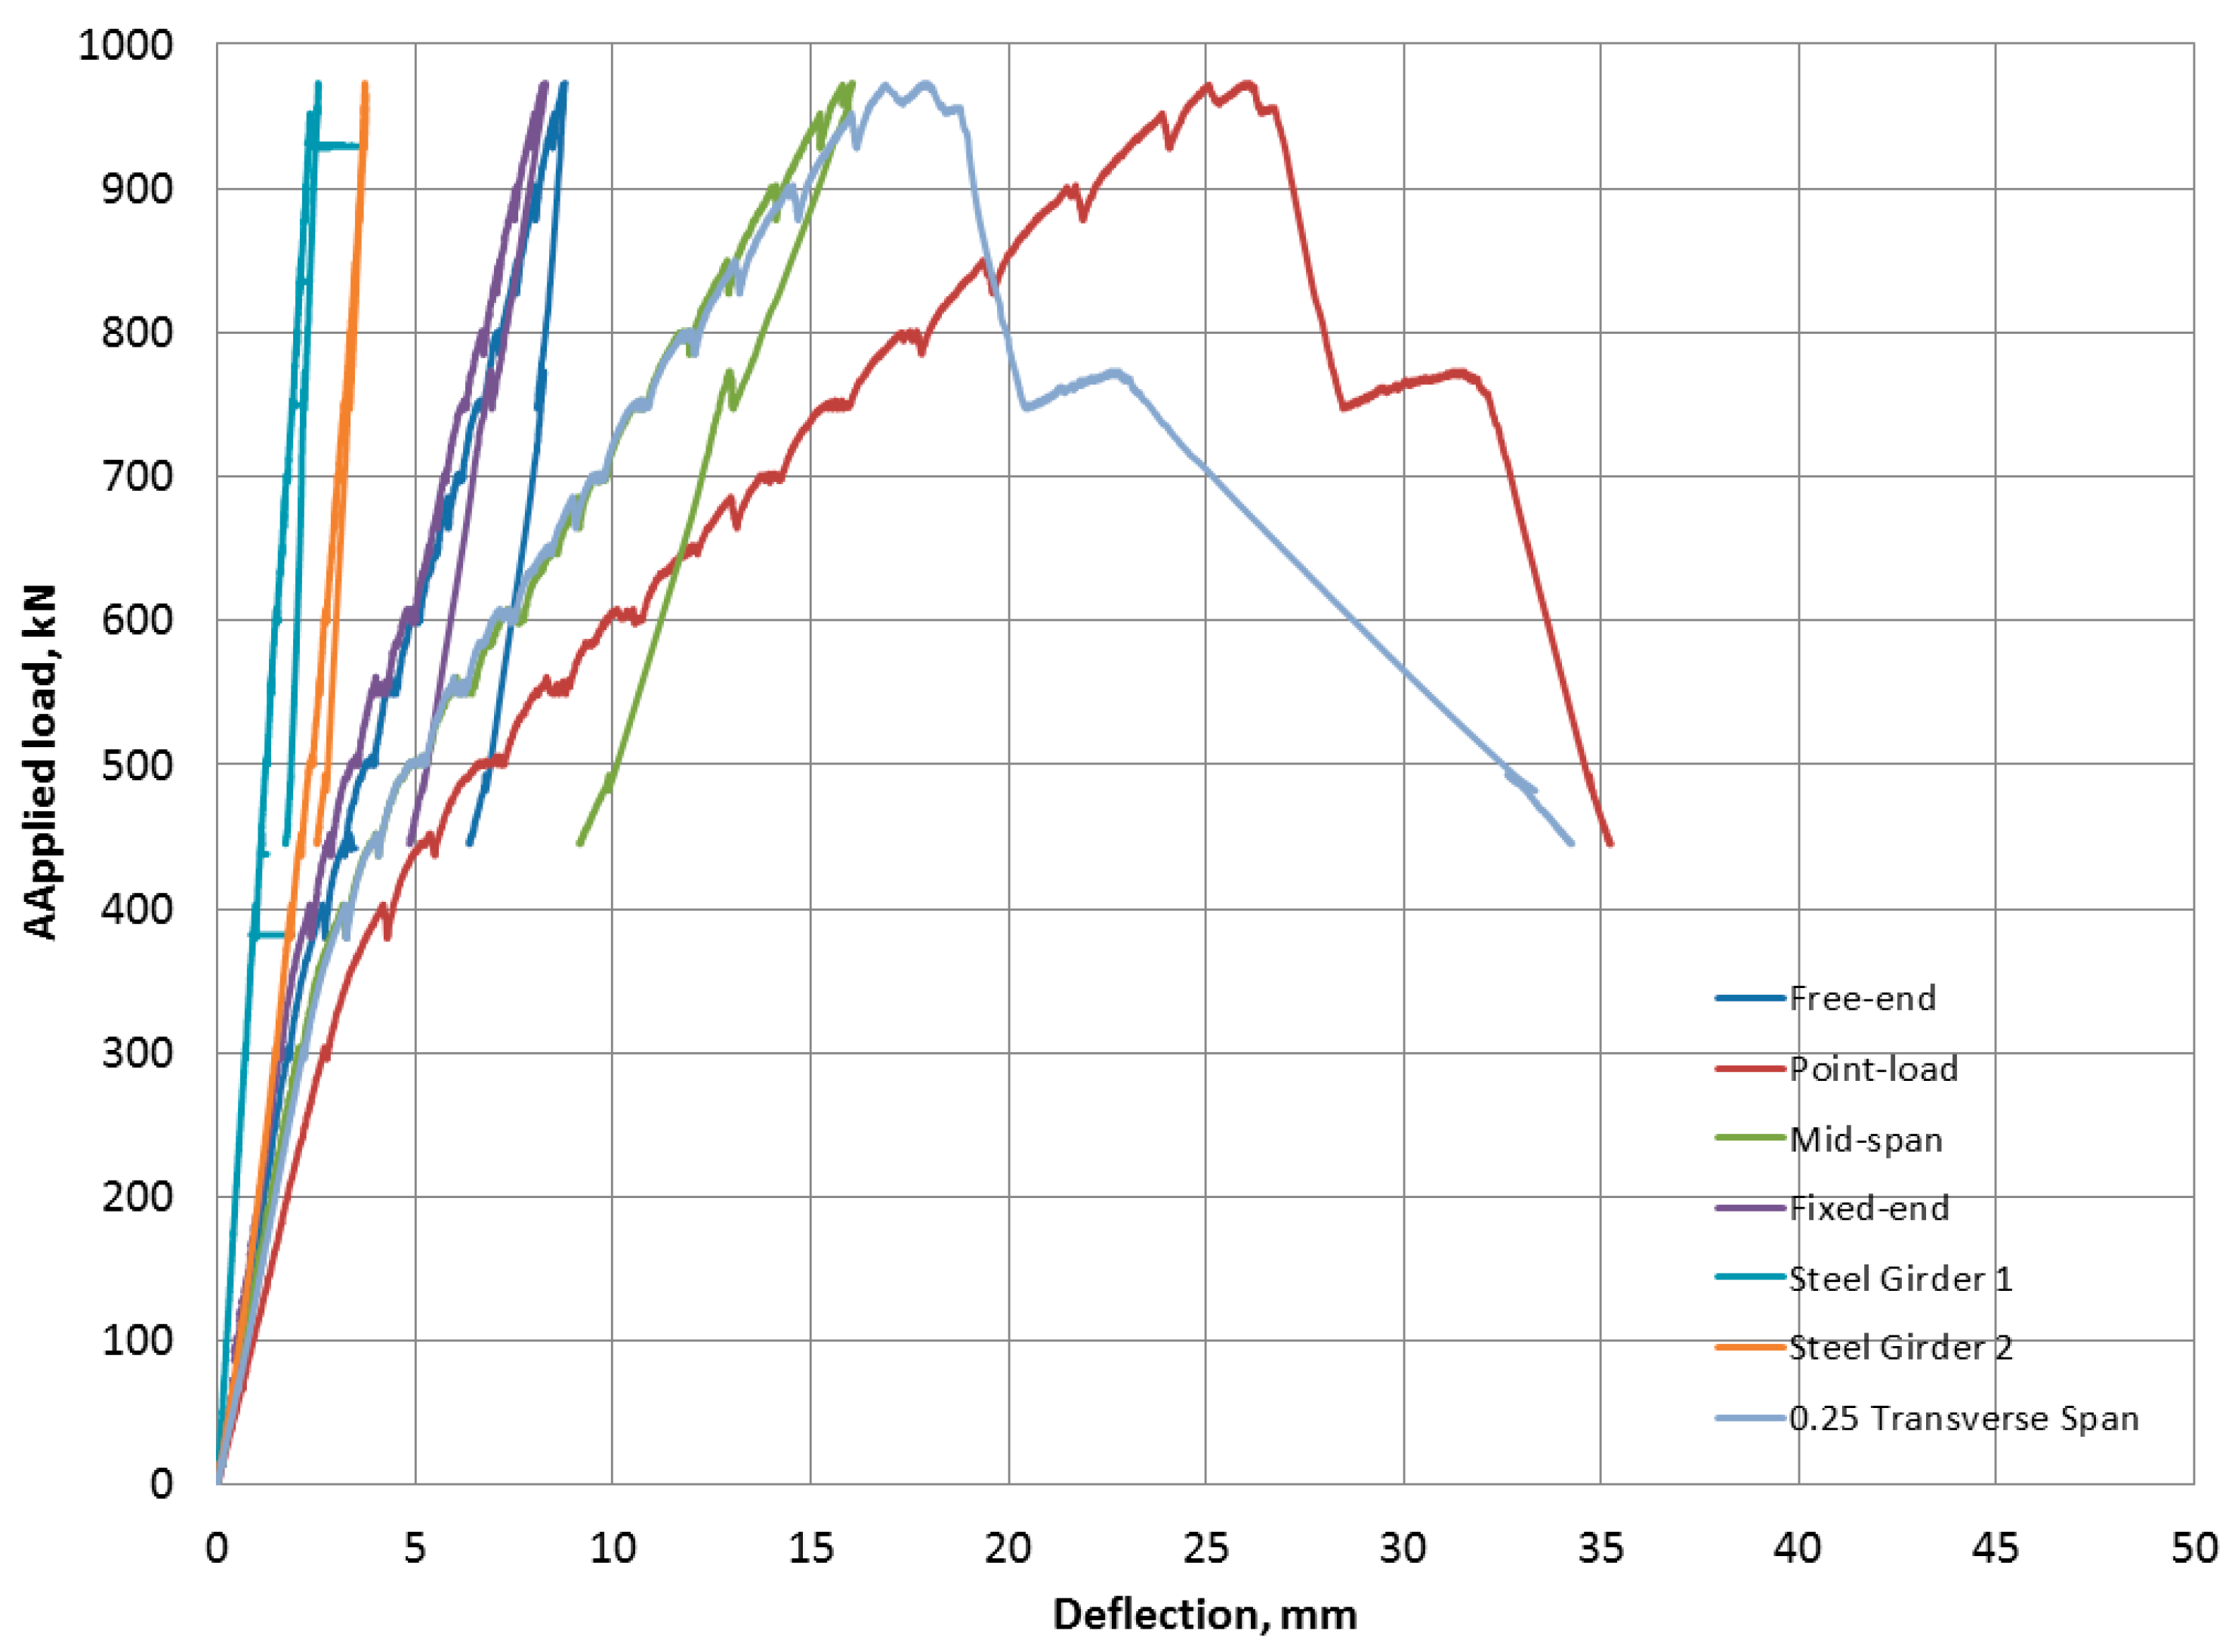
Figure 10.
Monotonic load-deflection history for slab S5 under CAF loading and static load test to-collapse.
Figure 10.
Monotonic load-deflection history for slab S5 under CAF loading and static load test to-collapse.
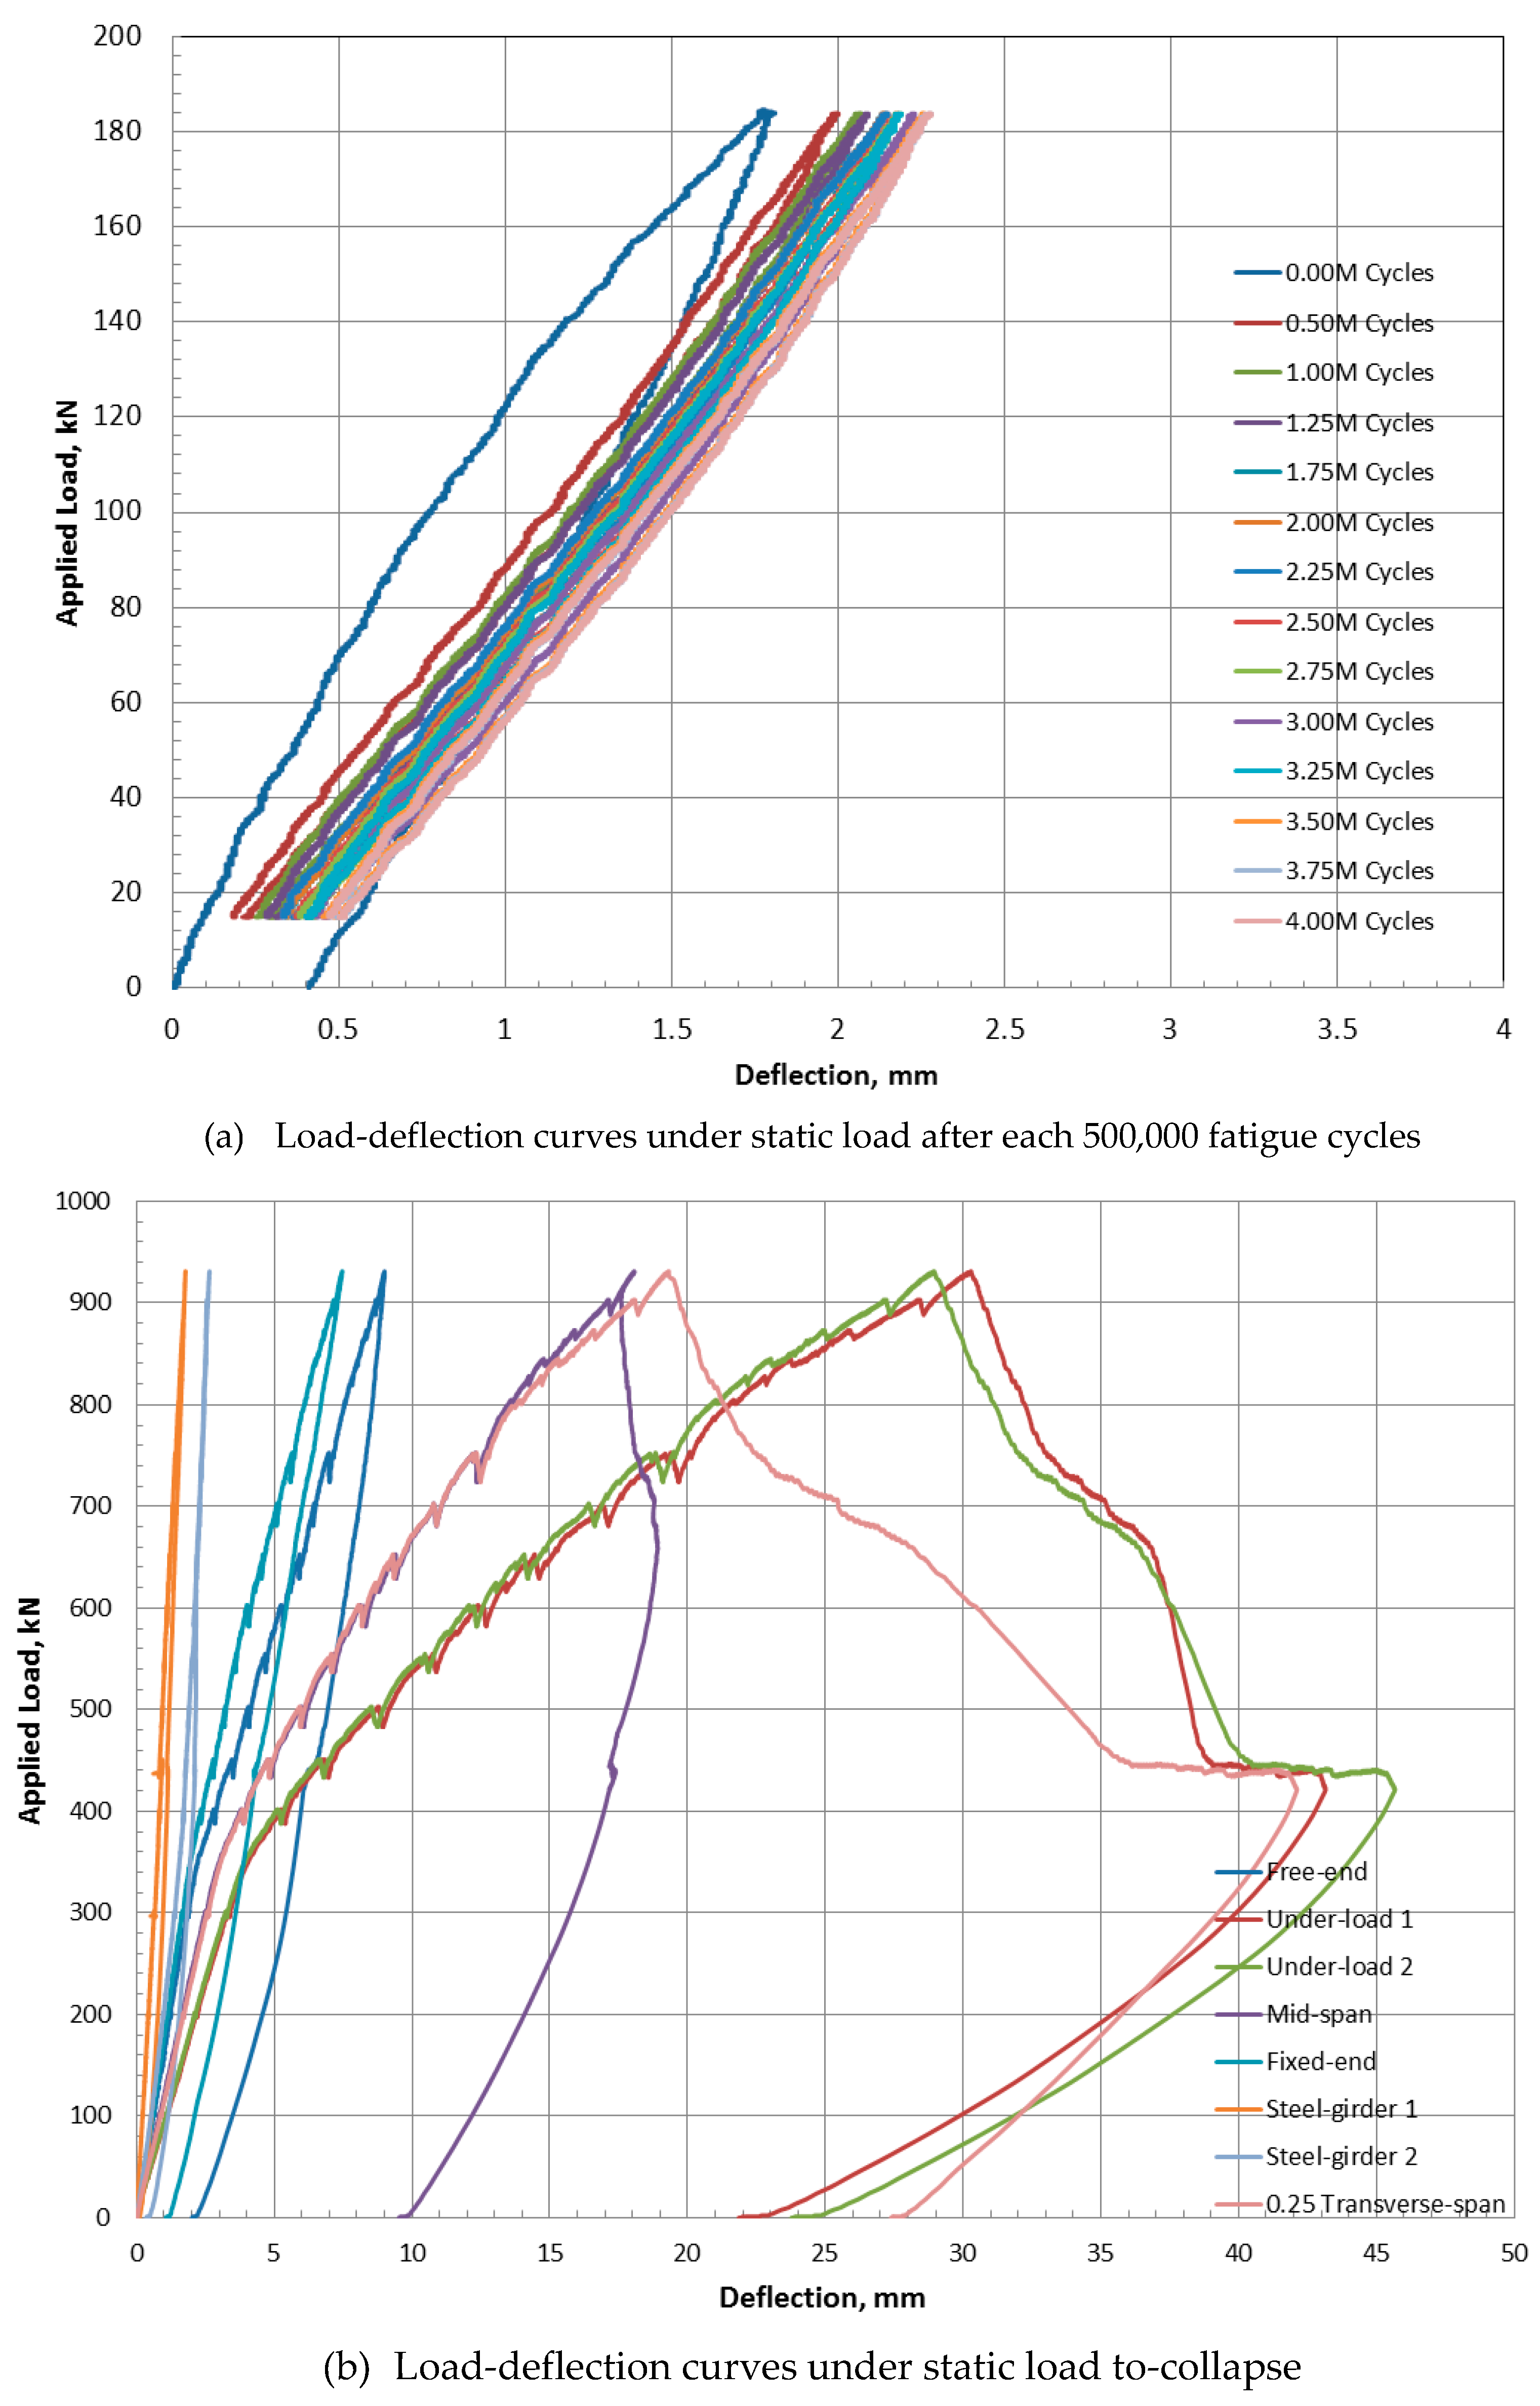
Figure 11.
Views of punching shear failure of slabs S2, S4 and S6 tested under VAF loading to-collapse.
Figure 11.
Views of punching shear failure of slabs S2, S4 and S6 tested under VAF loading to-collapse.
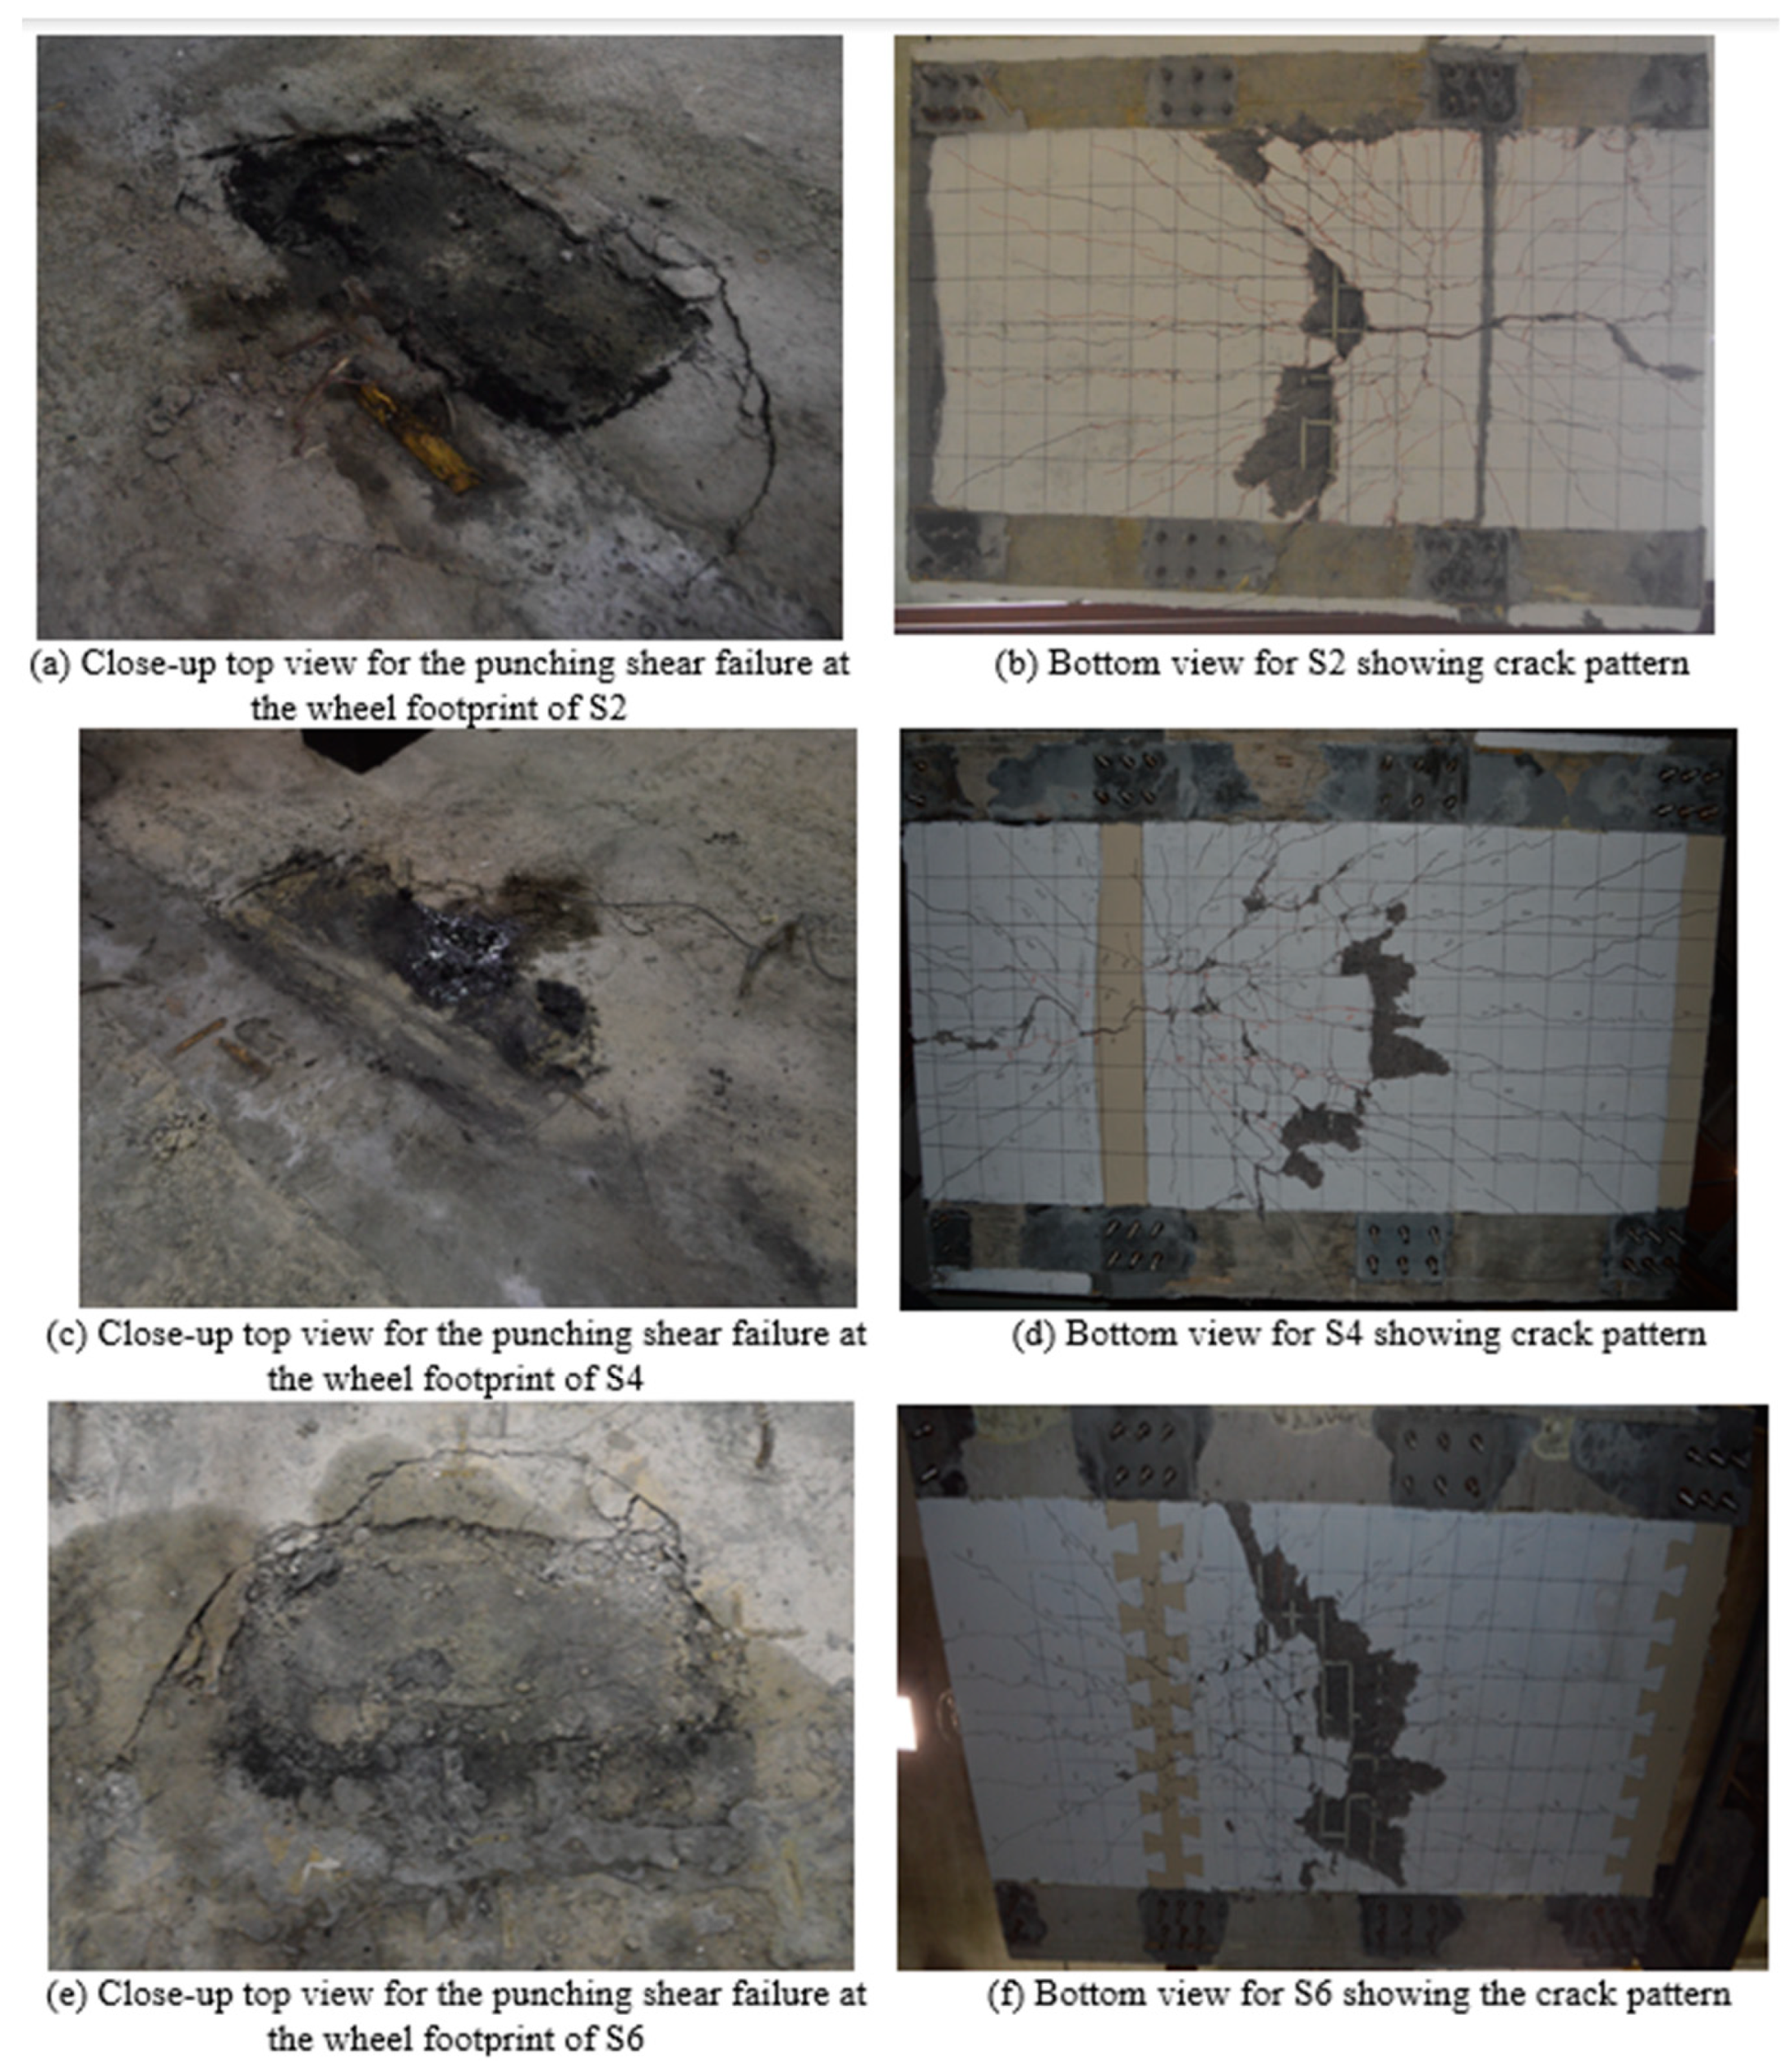
Figure 12.
Static load-deflection curves of slab S2 with A-joint after every 100,000 cycles of VAF loading.
Figure 12.
Static load-deflection curves of slab S2 with A-joint after every 100,000 cycles of VAF loading.
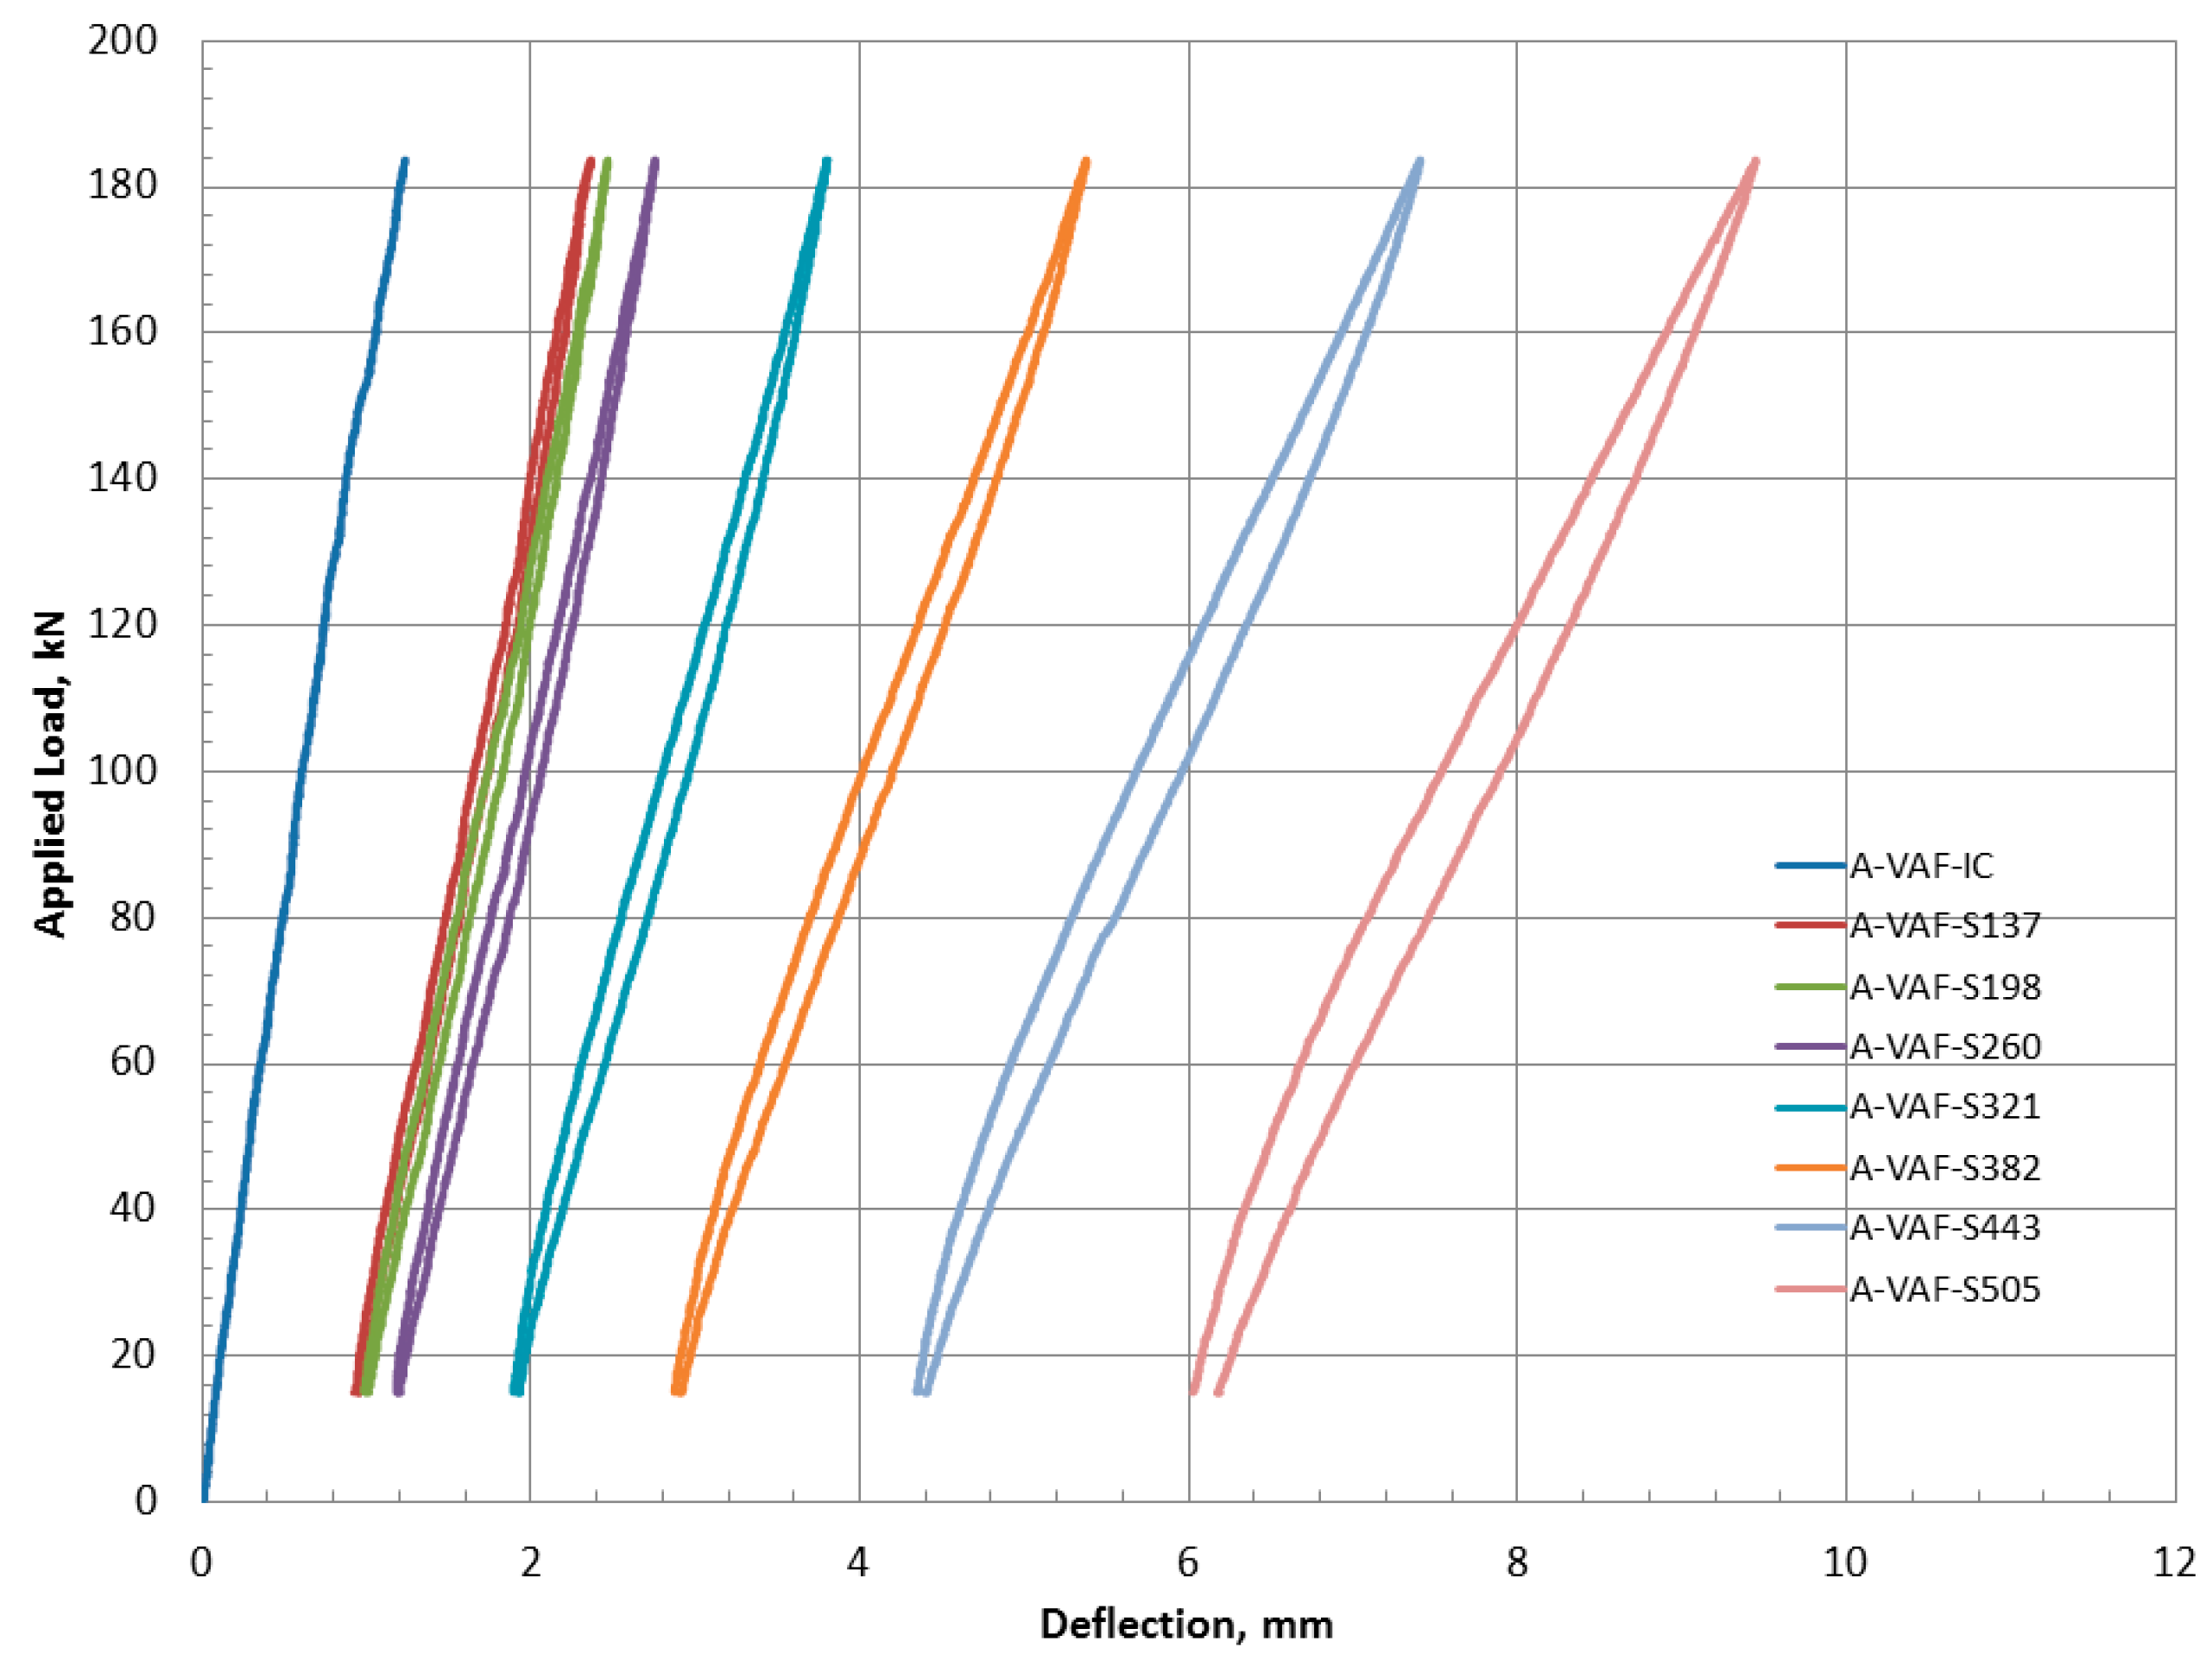
Figure 13.
Monotonic load-deflection history for slab S6 at every 100,000 cycles of VAF loading.
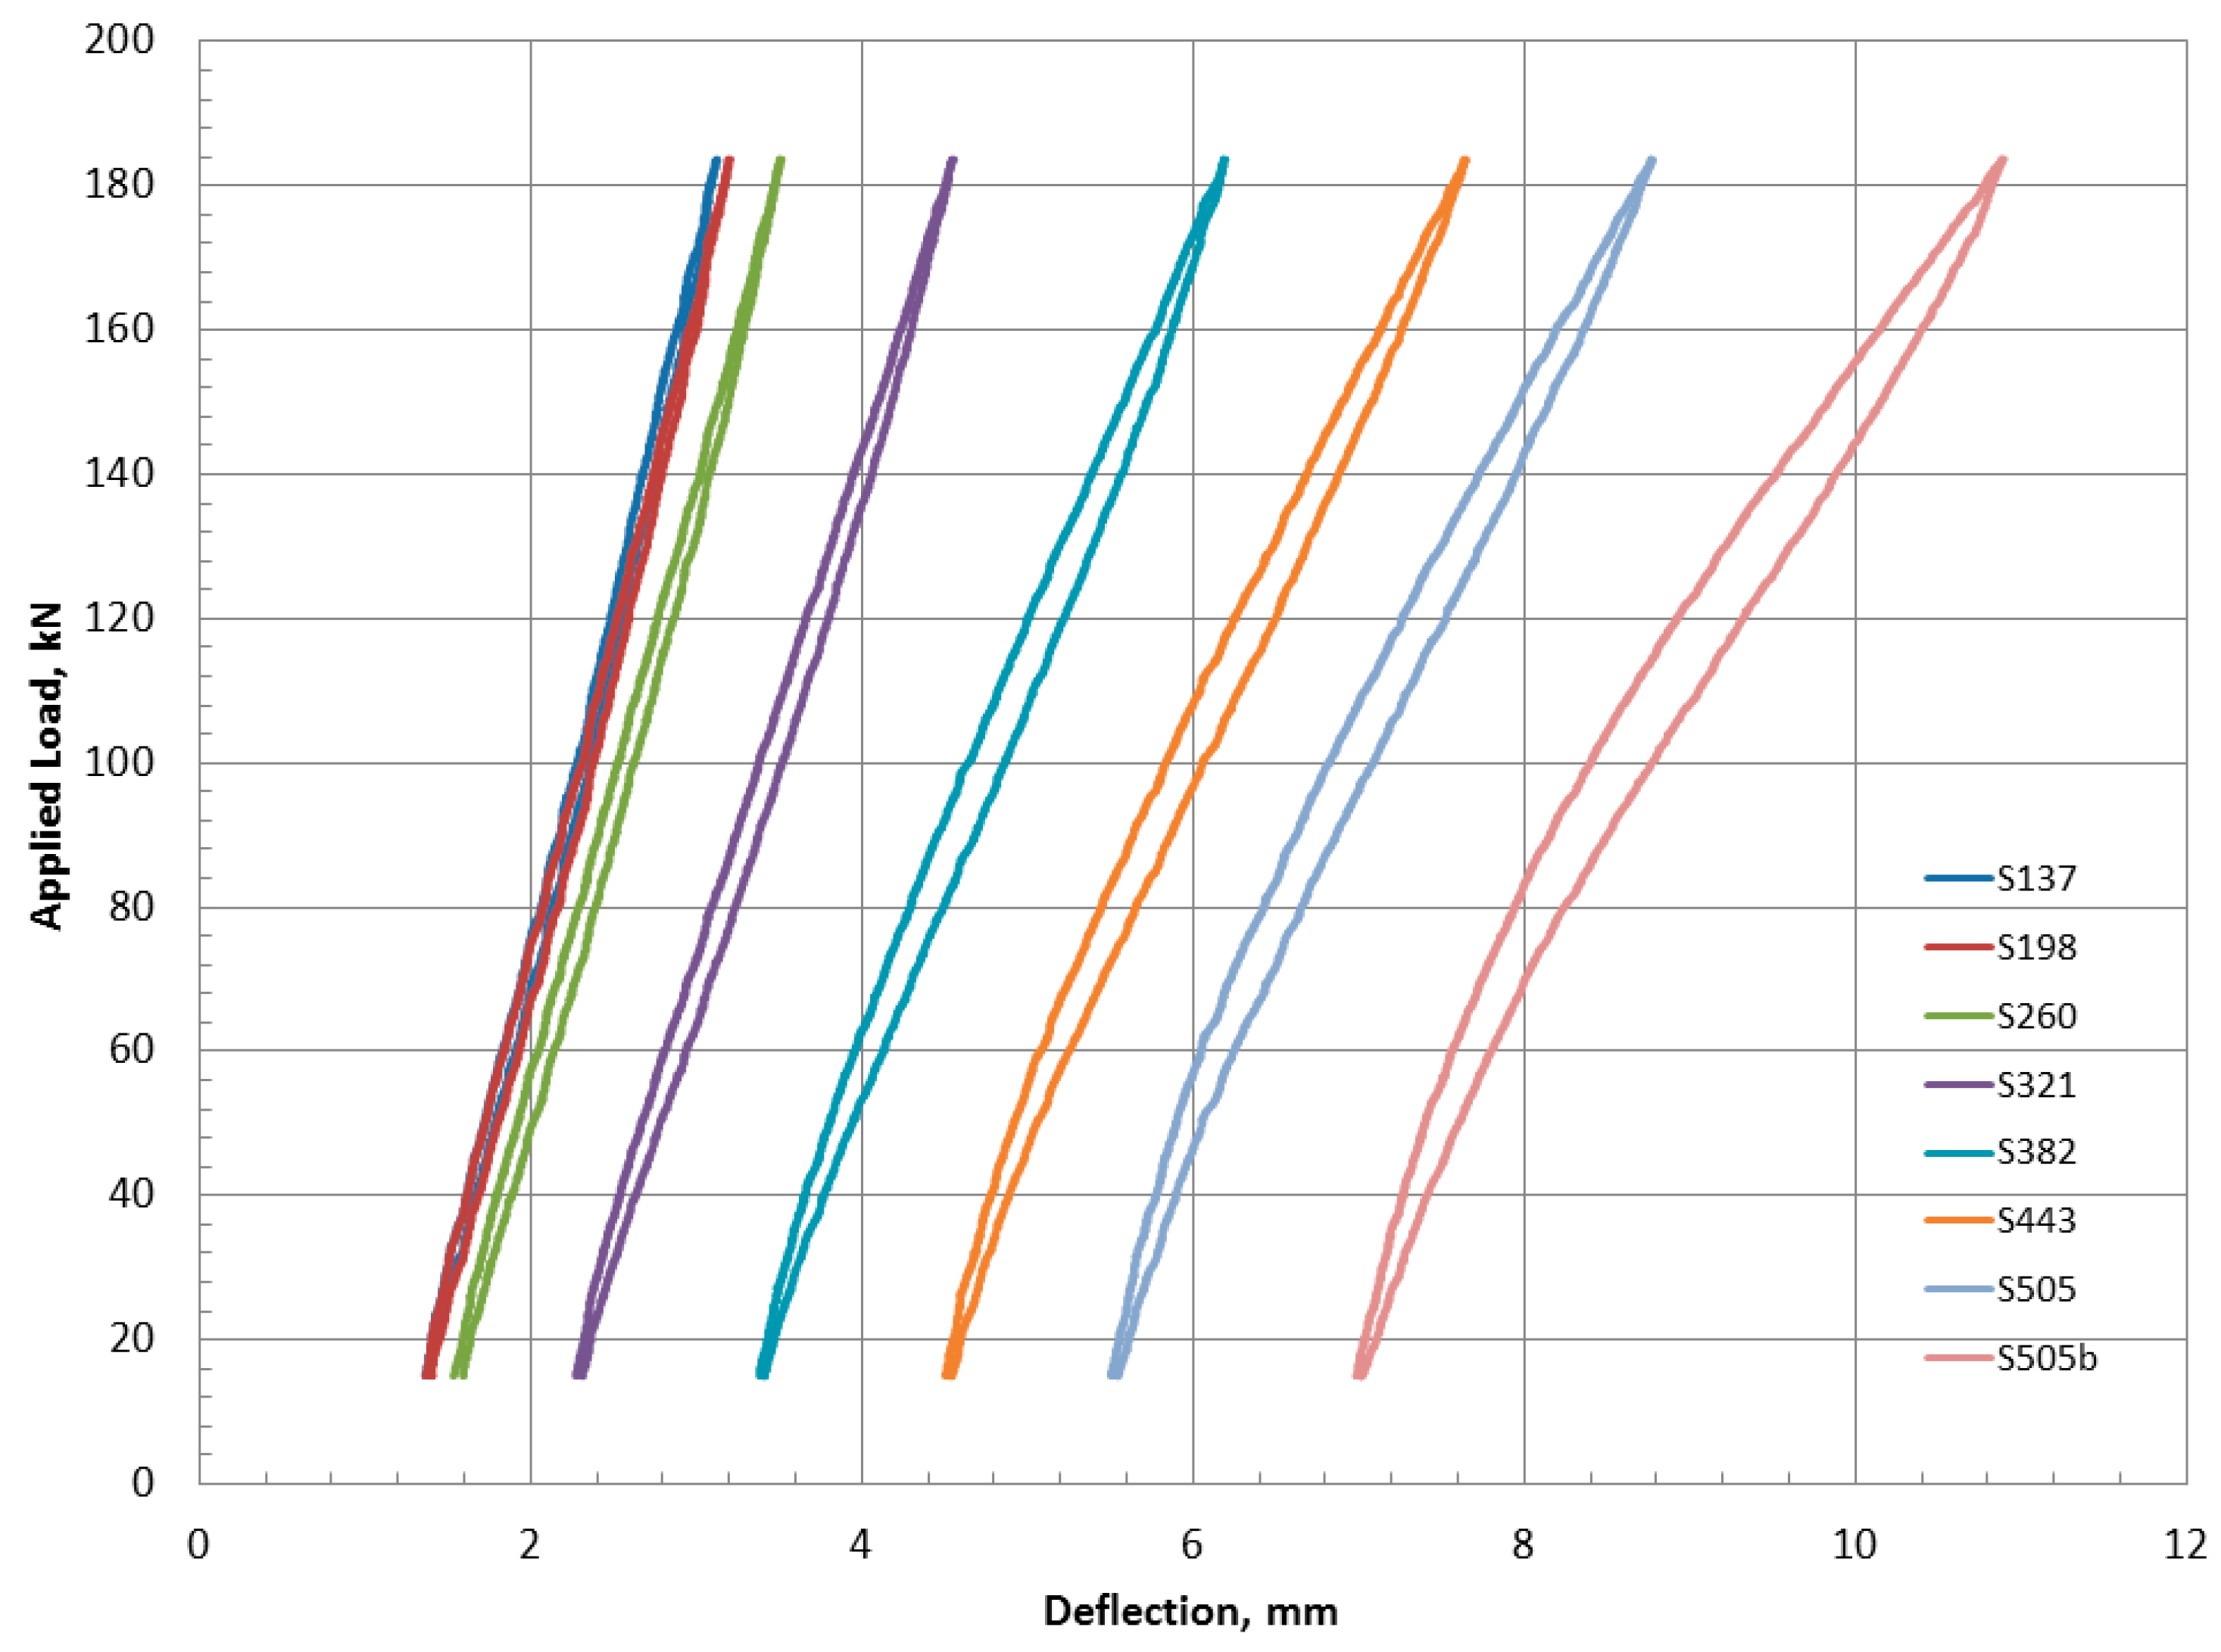
Figure 14.
Schematic diagrams of the punching shear crack patterns for the tested slabs.
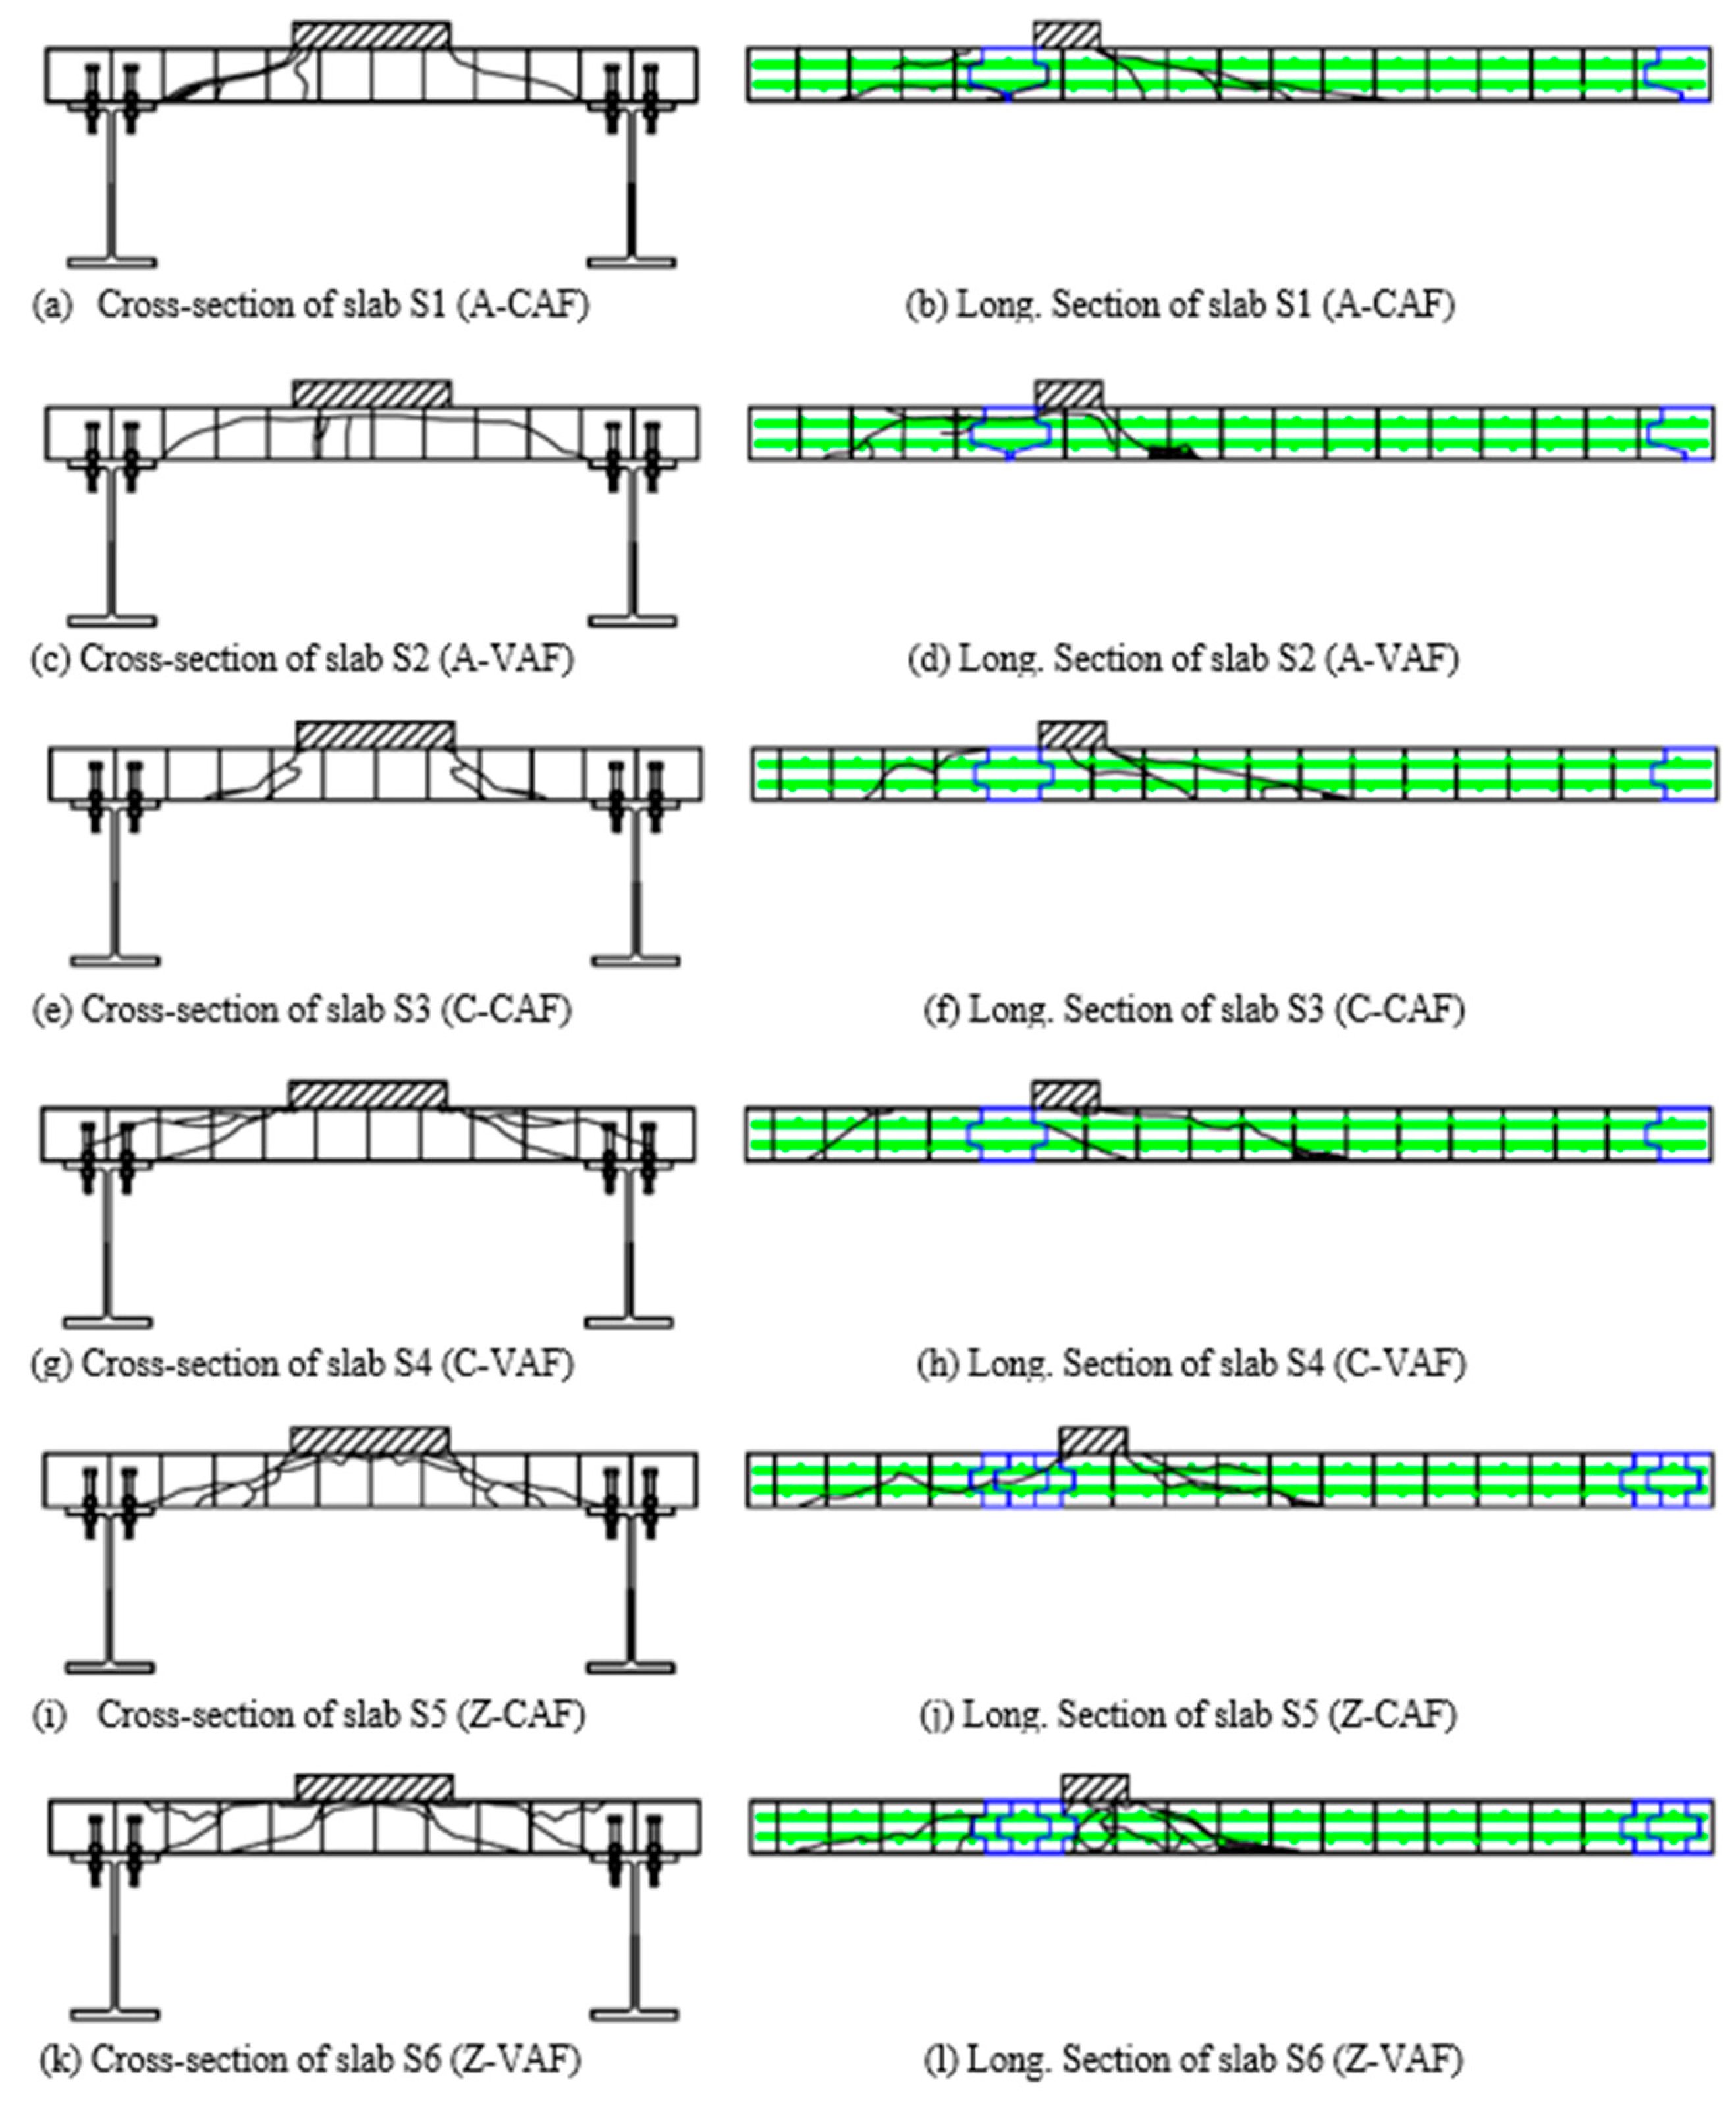
Figure 15.
Degradation of the precast FDDPs with different joints details under CAF and VAF loading.
Figure 15.
Degradation of the precast FDDPs with different joints details under CAF and VAF loading.
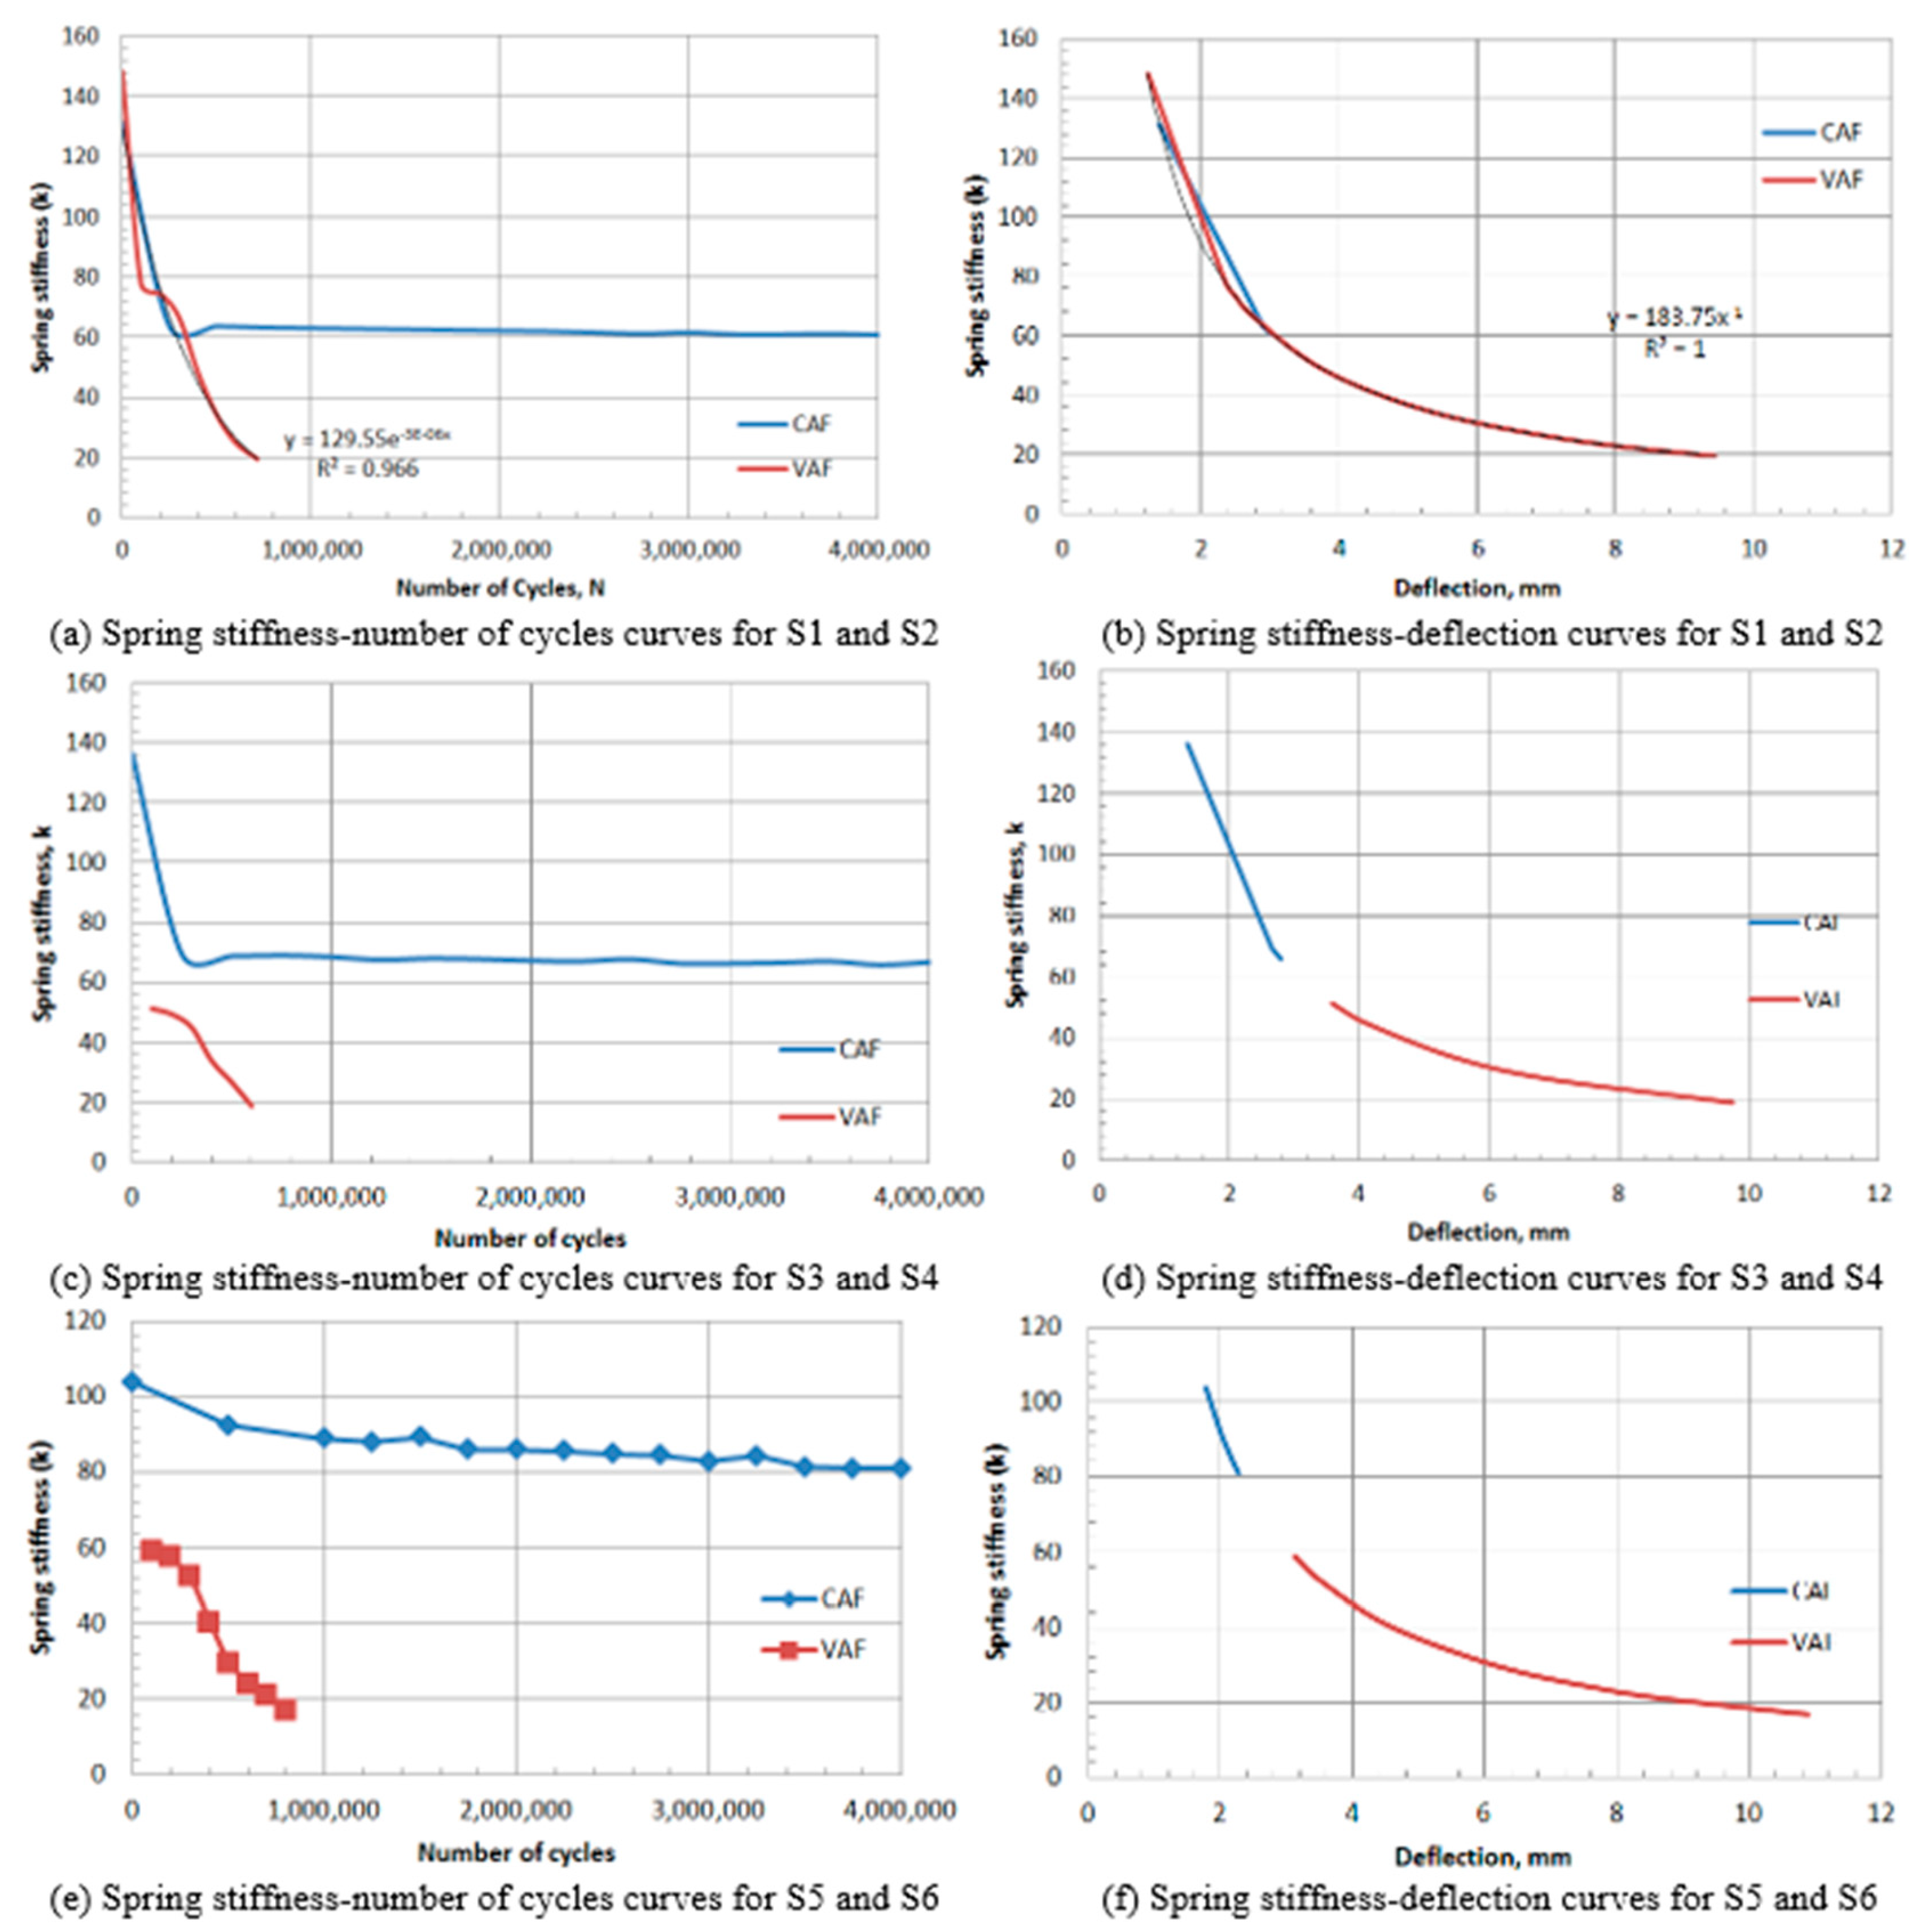
Figure 16.
Comparison among degradation of the precast FDDPs under CAF and VAF loading.
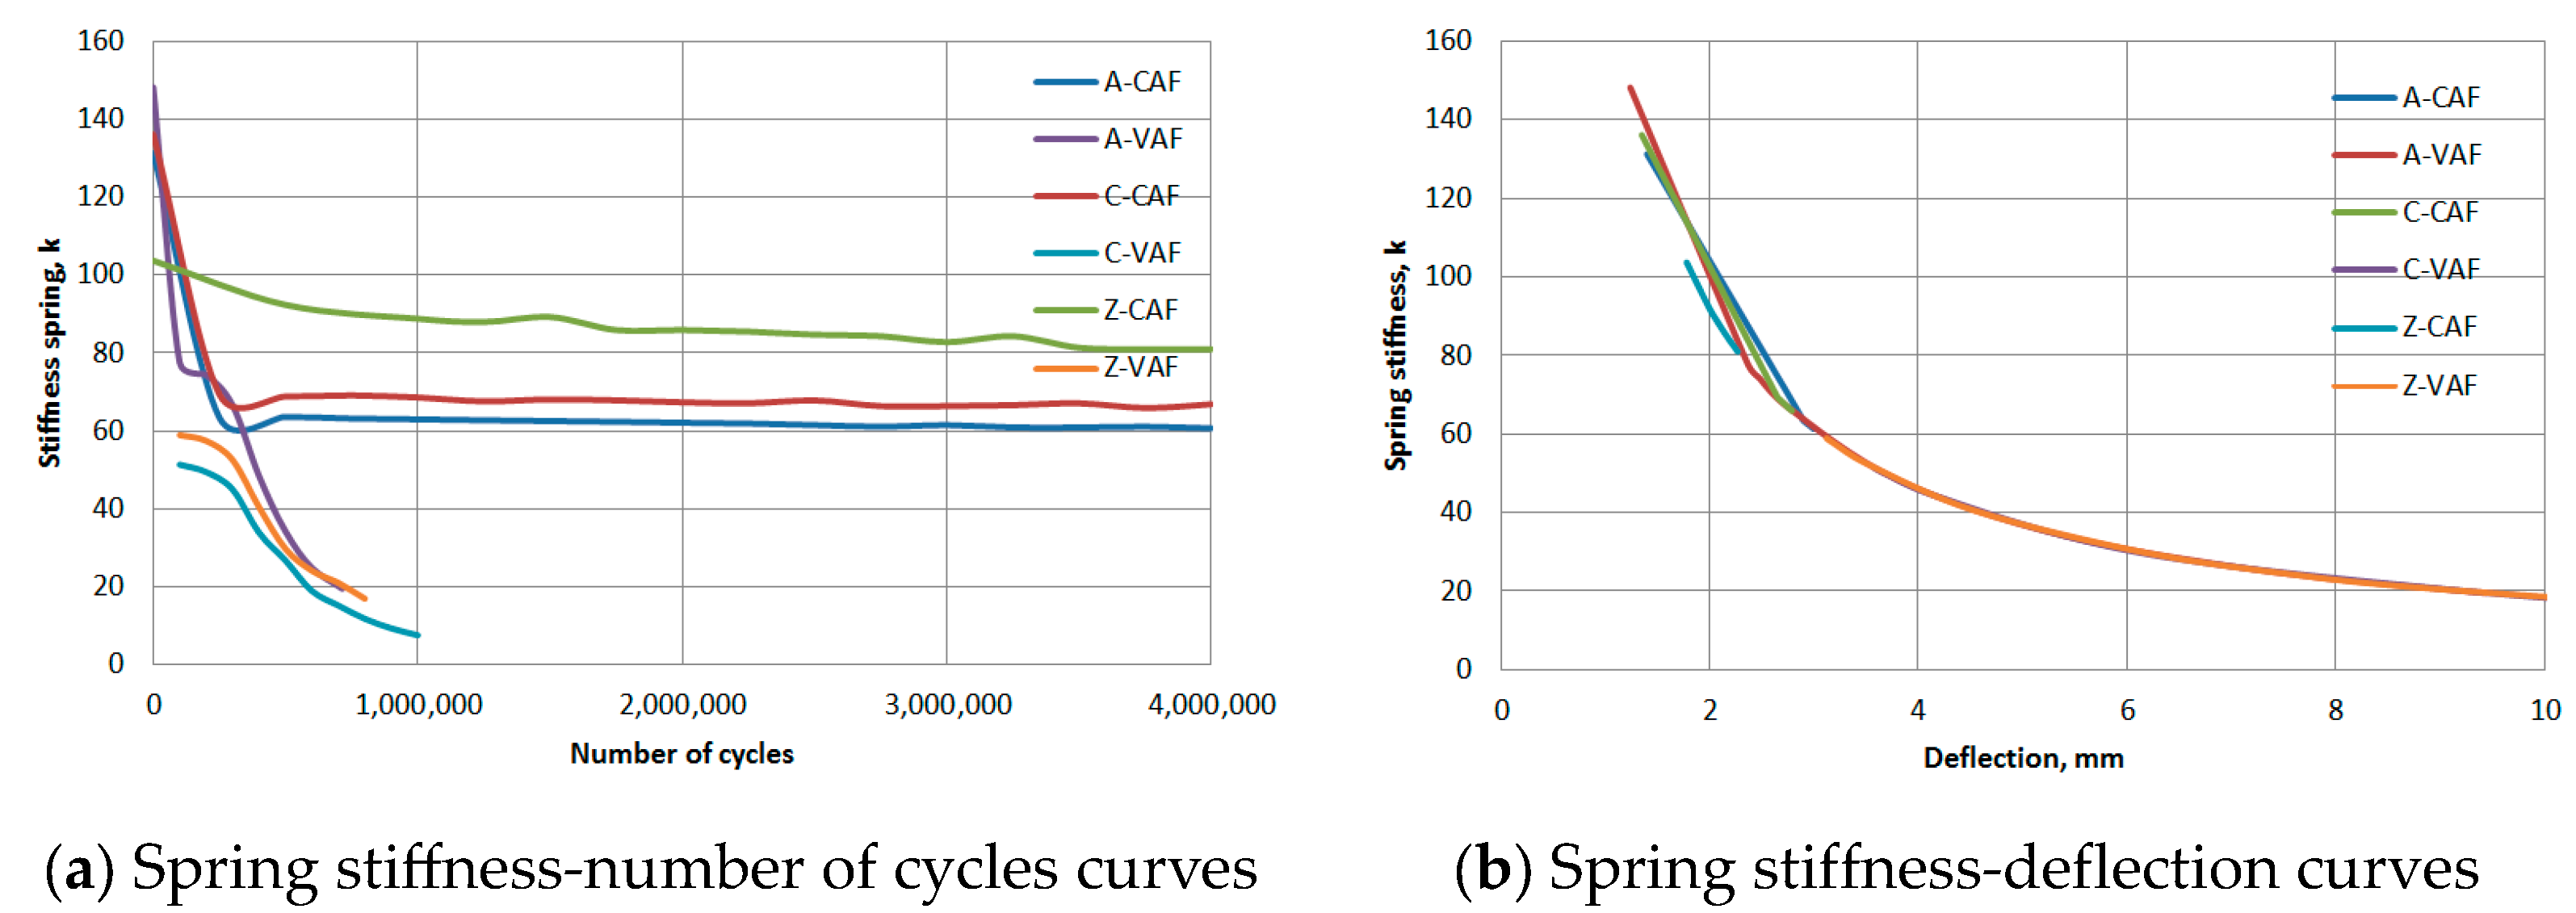
Figure 17.
P-N curves for the ribbed-surface GFRP-reinforced precast FDDPs.
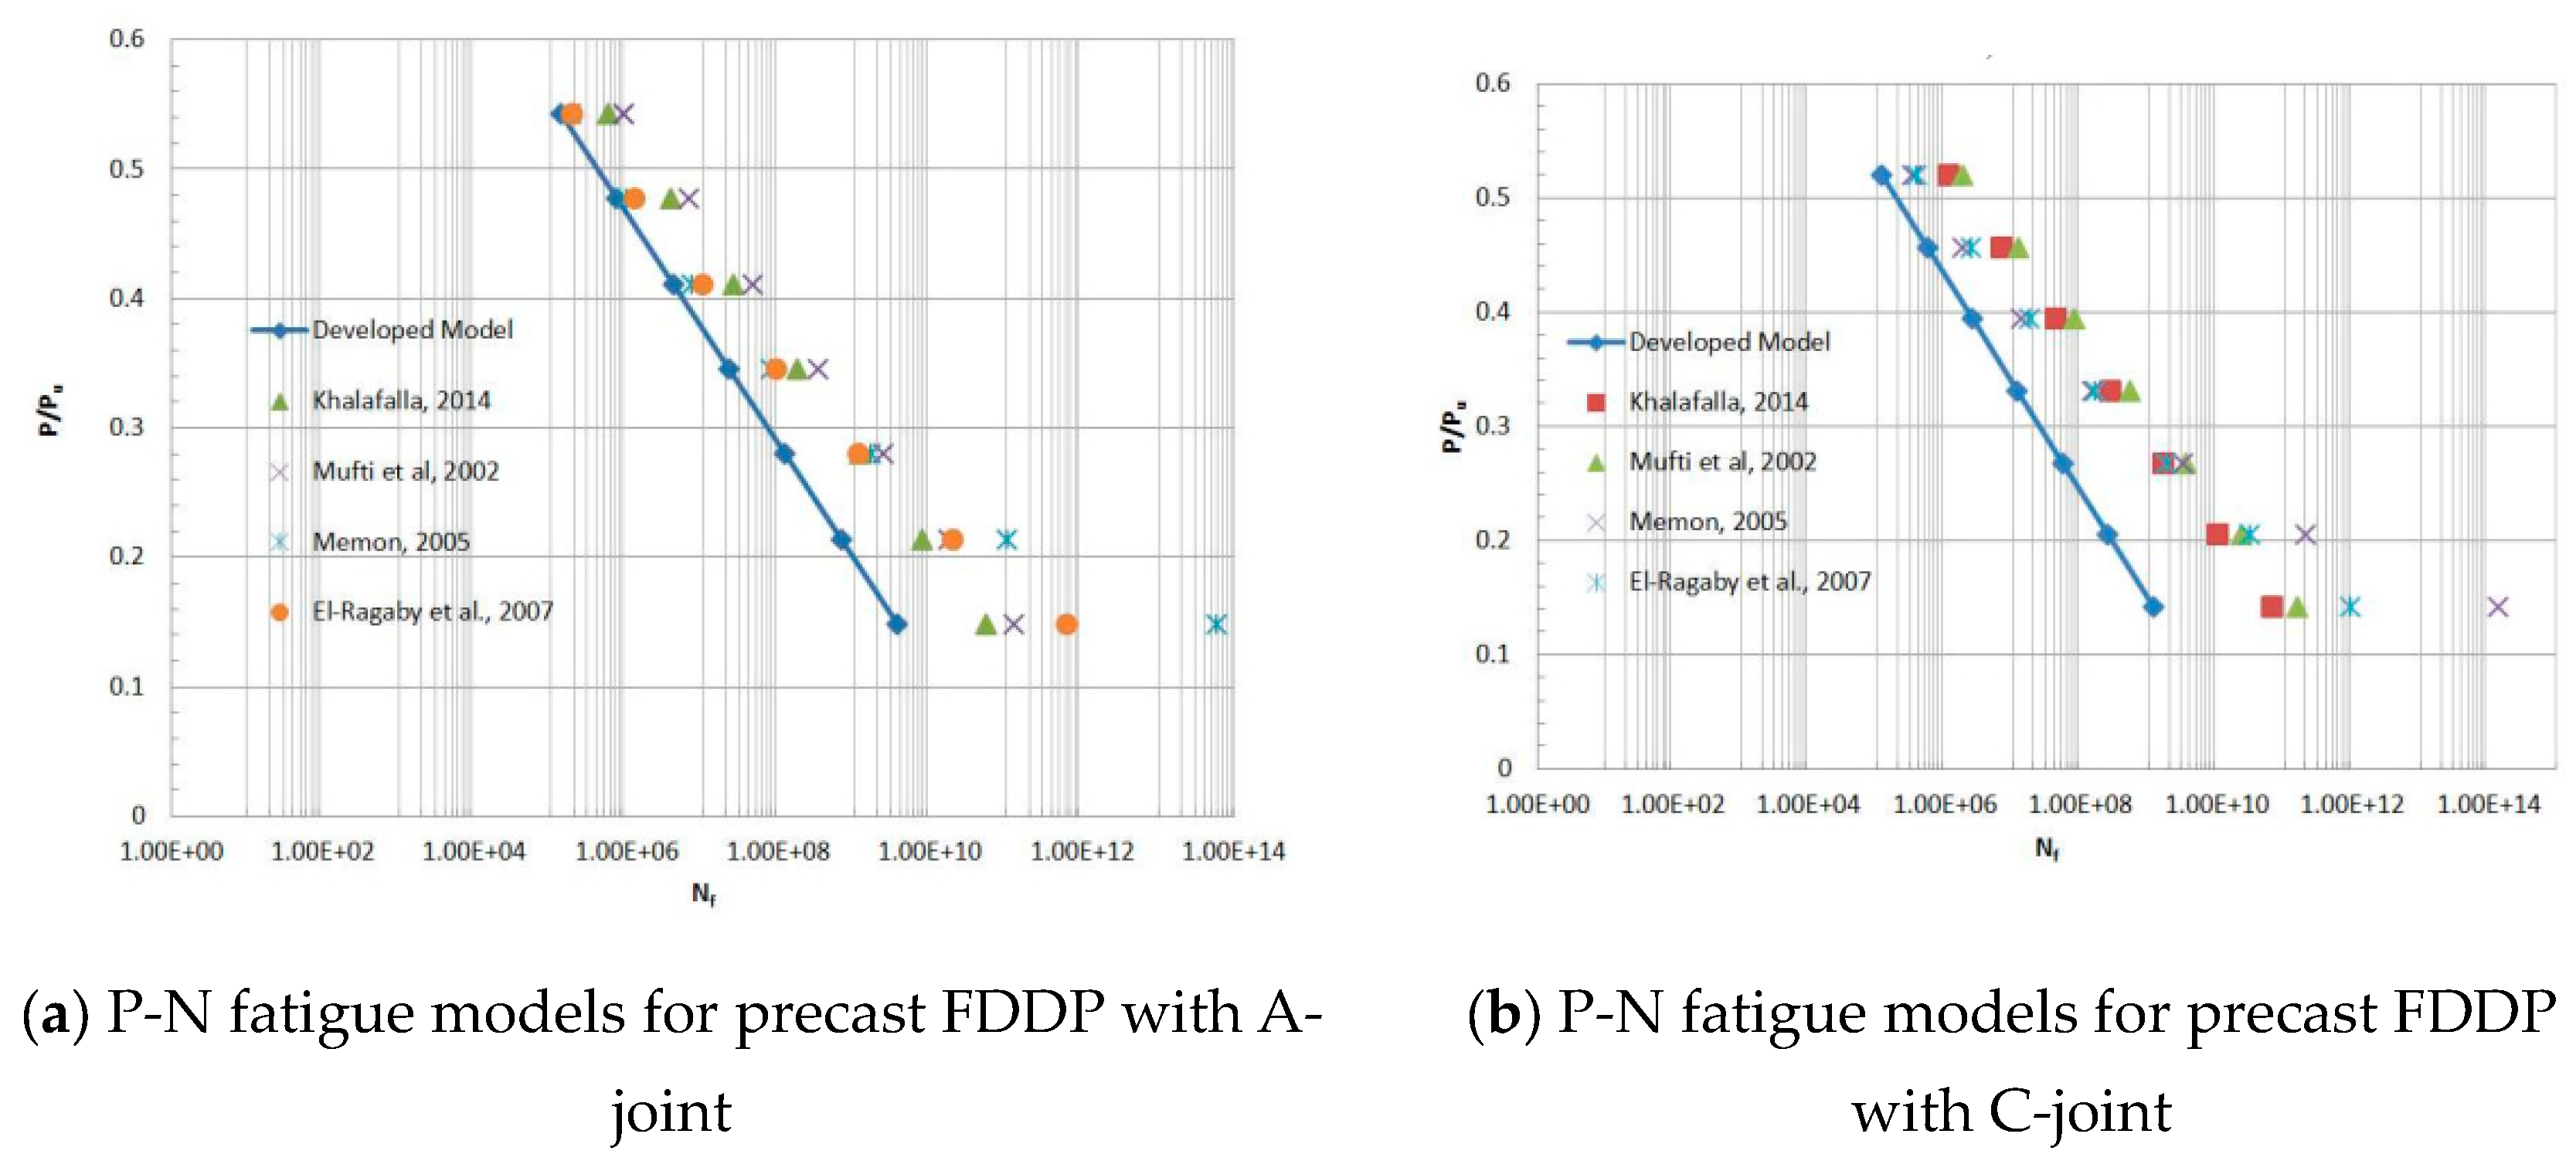
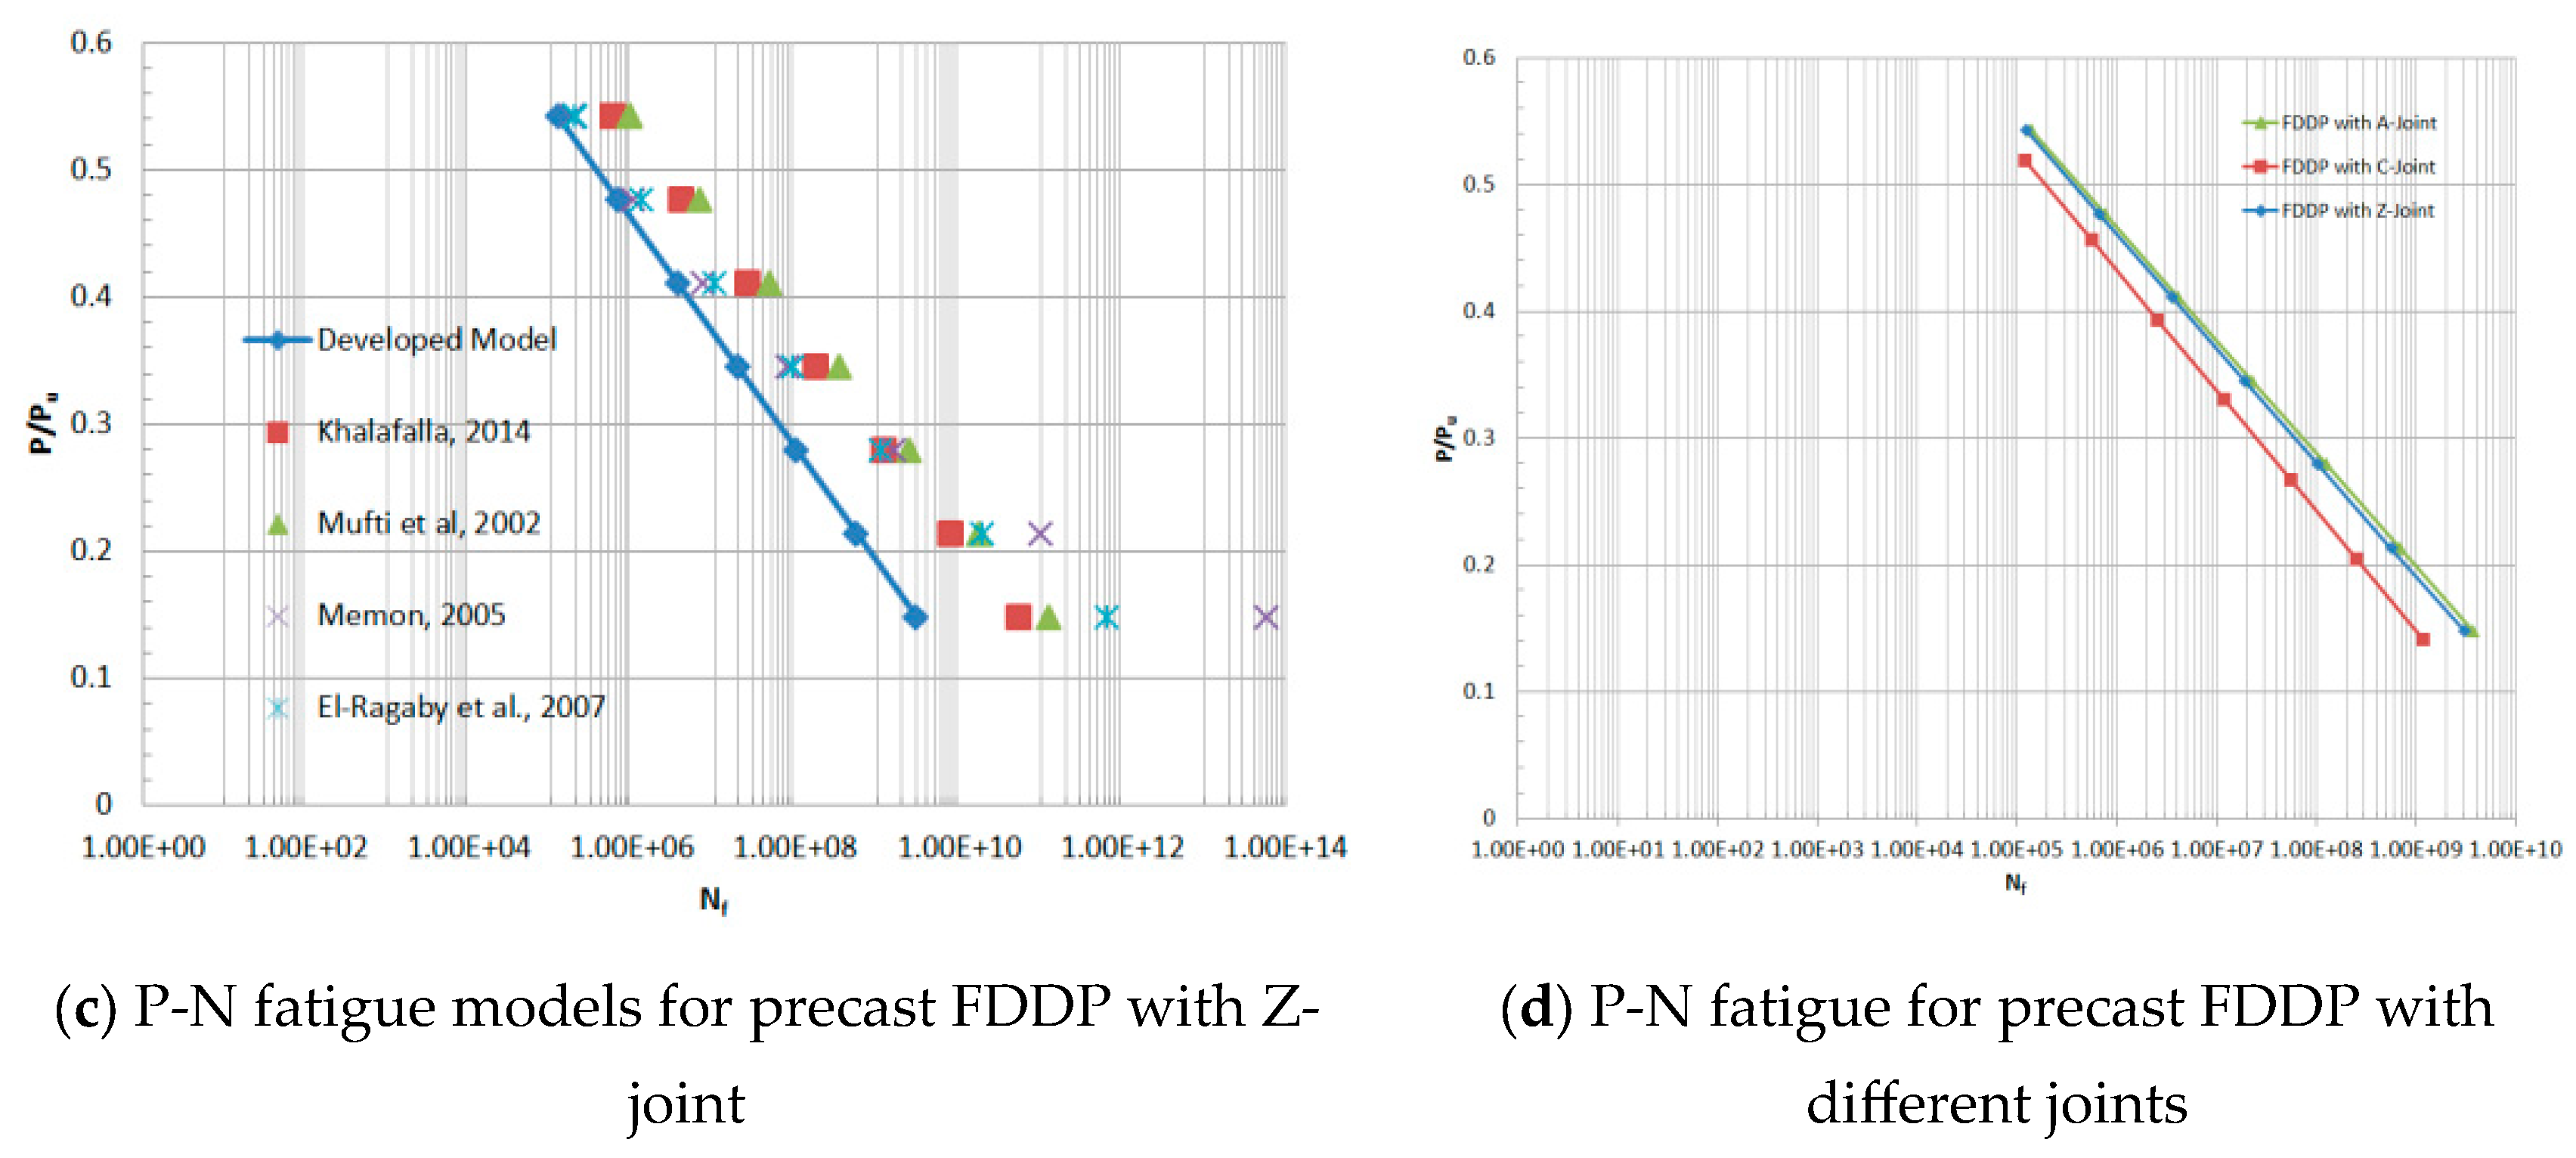

Table 1.
Mechanical properties of GFRP bars used in this study [58].
Table 1.
Mechanical properties of GFRP bars used in this study [58].
| Product type | Bar size | Bar area (mm2) |
Guaranteed tensile strength (MPa) | Modulus of elasticity (GPa) | Strain at failure |
| Ribbed-surface | 15M (#5) | 201 | 1188 | 64 | 2.6% |
Table 2.
Summary of fatigue-tested slab configurations.
| Slab Name | Transverse reinforcement (normal to girder) |
Longitudinal reinforcement (parallel to girder) |
||||
| Slab number | Joint type | Test type* | Bottom | Top | Bottom | Top |
| S1 | A | CAF | Straight end No. 16 @ 140 mm |
Straight end No. 16 @ 200 mm |
Straight end No. 16 @ 200 mm |
Straight end No. 16 @ 200 mm |
| S2 | VAF | |||||
| S3 | C | CAF | Straight end No. 16 @ 140 mm |
Straight end No. 16 @ 200 mm |
Straight end No. 16 @ 200 mm |
Straight end No. 16 @ 200 mm |
| S4 | VAF | |||||
| S5 | Z | CAF | Straight end No. 16 @ 140 mm |
Straight end No. 16 @ 200 mm |
Straight end No. 16 @ 200 mm |
Straight end No. 16 @ 200 mm |
| S6 | VAF | |||||
* CAF = Constant amplitude fatigue loading; VAF = Variable amplitude fatigue loading.
Table 3.
Static load configuration.
| Loading | Unloading |
| Segment shape: ramp function Rate: 5 kN/min Control mode: Force Absolute end level (machine max. load for test purpose): 183.75 kN |
Segment shape: ramp function Rate: 10 kN/min Control mode: force Absolute end level: zero kN |
Table 4.
Test results: loading data.
| Slab number | Joint type | Test* | Peak cyclic load (kN) | Frequency (Hz) | No. of load cycles | Ultimate load (kN) |
Ultimate deflection (mm) | Failure Mode |
| S1 | A | CAF + SUL | 137.5 | 4 | 4,000,000 | 930.92 | 23.47 | Punching |
| A | VAF | 500.0 | 2 – 0.5 | 809,493 | 487.50 | 32.46 | Punching | |
| S2 | C | CAF + SUL | 137.5 | 4 | 4,000,000 | 973.00 | 26.09 | Punching |
| C | VAF | 500.0 | 2 – 0.5 | 692,866 | 495.69 | 40.89 | Punching | |
| S3 | Z | CAF + SUL | 137.5 | 4 | 4,000,000 | 931.00 | 29.62 | Punching |
| Z | VAF | 500.0 | 2 – 0.5 | 961,540 | 488.43 | 37.03 | Punching |
* CAF = constant amplitude fatigue loading; SUL = static ultimate load; VAF = variable amplitude fatigue load.
Table 5.
Test results: deflection data.
| Monitoring direction | Deflection, mm | Comments | |||
| Longitudinal direction | A-Shape | C-Shape | Z-Shape | ||
| Free-end | 7.48 | 8.78 | 9.00 | Small segment | |
| Point-load 1 | 23.05 | 25.98 | 30.29 | Actual segment | |
| Point-load 2 | 23.88 | 26.20 | 28.94 | Actual segment | |
| Mid-span | 13.39 | 16.03 | 18.06 | Actual segment | |
| Fixed-end | 2.44 | 8.28 | 7.47 | Rear joint | |
| Transverse direction | |||||
| Steel-girder 1 | 10.68 | 2.54 | 1.78 | Twin girder | |
| 0.25 Transverse-span | 13.09 | 17.86 | 19.32 | Actual segment | |
| Point-load 1 | 23.05 | 25.98 | 30.29 | Actual segment | |
| Point-load 2 | 23.88 | 26.20 | 28.94 | Actual segment | |
| Steel-girder 2 | 6.8 | 3.73 | 2.65 | Twin girder | |
Table 6.
Stiffness degradation of the tested slabs.
| Joint Type | Slab S1 with CAF loading* | Slab S2 with VAF loading* | ||||||
| Cumulative cycles (N) | Load (kN) |
Deflection (mm) | k = F/d** | Cumulative cycles, N | Load (kN) |
Deflection (mm) | k = F/d** | |
| A-type | 0 | 183.75 | 1.40 | 131.25 | 0 | 183.75 | 1.24 | 148.19 |
| 250,000 | 183.75 | 2.90 | 63.36 | 100,000 | 183.75 | 2.37 | 77.53 | |
| 500,000 | 183.76 | 2.89 | 63.58 | 200,000 | 183.76 | 2.47 | 74.39 | |
| 750,000 | 183.75 | 2.91 | 63.14 | 300,000 | 183.76 | 2.76 | 66.58 | |
| 1,000,000 | 183.75 | 2.92 | 62.92 | 400,000 | 183.76 | 3.80 | 48.35 | |
| 1,250,000 | 183.76 | 2.93 | 62.71 | 500,000 | 183.76 | 5.38 | 34.15 | |
| 1,500,000 | 183.76 | 2.94 | 62.50 | 600,000 | 183.78 | 7.41 | 24.80 | |
| 1,750,000 | 183.76 | 2.95 | 62.29 | 715,381 | 183.76 | 9.44 | 19.46 | |
| 2,000,000 | 183.77 | 2.96 | 62.08 | 809,493 | ||||
| 2,250,000 | 183.76 | 2.97 | 61.87 | |||||
| 2,500,000 | 183.75 | 2.99 | 61.45 | |||||
| 2,750,000 | 183.76 | 3.01 | 61.05 | |||||
| 3,000,000 | 183.75 | 2.99 | 61.45 | |||||
| 3,250,000 | 183.76 | 3.02 | 60.84 | |||||
| 3,500,000 | 183.76 | 3.02 | 60.84 | |||||
| 3,750,000 | 183.75 | 3.01 | 61.04 | |||||
| 4,000,000 | 183.76 | 3.03 | 60.64 | |||||
| C-type | Slab S3 with CAF loading* | Slab S4 with VAF loading* | ||||||
| 0 | 183.75 | 1.35 | 136.11 | 100,000 | 183.75 | 3.58 | 51.32 | |
| 500,000 | 183.76 | 2.65 | 69.34 | 200,000 | 183.76 | 3.72 | 49.39 | |
| 1,000,000 | 183.76 | 2.67 | 68.82 | 300,000 | 183.75 | 4.09 | 44.92 | |
| 1,250,000 | 183.76 | 2.66 | 69.08 | 400,000 | 183.75 | 5.43 | 33.84 | |
| 1,500,000 | 183.76 | 2.68 | 68.56 | 500,000 | 183.76 | 6.89 | 26.67 | |
| 1,750,000 | 183.76 | 2.72 | 67.56 | 600,000 | 183.75 | 9.74 | 18.86 | |
| 2,000,000 | 183.76 | 2.7 | 68.05 | 692,866 | ||||
| 2,250,000 | 183.76 | 2.71 | 67.80 | |||||
| 2,500,000 | 183.75 | 2.73 | 67.31 | |||||
| 2,750,000 | 183.76 | 2.74 | 67.06 | |||||
| 3,000,000 | 183.75 | 2.71 | 67.80 | |||||
| 3,250,000 | 183.75 | 2.77 | 66.33 | |||||
| 3,500,000 | 183.76 | 2.77 | 66.34 | |||||
| 3,750,000 | 183.76 | 2.76 | 66.58 | |||||
| 4,000,000 | 183.76 | 2.74 | 67.06 | |||||
| Z-shape | Slab S5 with CAF loading* | Slab S6 with VAF loading* | ||||||
| 0 | 184.55 | 1.78 | 103.68 | 100,000 | 183.74 | 3.12 | 58.89 | |
| 500,000 | 183.76 | 1.99 | 92.34 | 200,000 | 183.76 | 3.2 | 57.42 | |
| 1,000,000 | 183.75 | 2.07 | 88.77 | 300,000 | 183.76 | 3.5 | 52.5 | |
| 1,250,000 | 183.75 | 2.09 | 87.92 | 400,000 | 183.75 | 4.55 | 40.38 | |
| 1,500,000 | 183.76 | 2.06 | 89.2 | 500,000 | 183.76 | 6.19 | 29.68 | |
| 1,750,000 | 183.75 | 2.14 | 85.86 | 600,000 | 183.75 | 7.64 | 24.05 | |
| 2,000,000 | 183.77 | 2.14 | 85.87 | 700,000 | 183.75 | 8.77 | 20.95 | |
| 2,250,000 | 183.75 | 2.15 | 85.46 | 800,000 | 183.83 | 10.88 | 16.89 | |
| 2,500,000 | 183.75 | 2.17 | 84.68 | 895,000 | -- | |||
| 2,750,000 | 183.75 | 2.18 | 84.29 | 916,736 | -- | |||
| 3,000,000 | 183.75 | 2.71 | 67.80 | |||||
| 3,250,000 | 183.75 | 2.77 | 66.33 | |||||
| 3,500,000 | 183.76 | 2.77 | 66.34 | |||||
| 3,750,000 | 183.76 | 2.76 | 66.58 | |||||
| 4,000,000 | 183.76 | 2.74 | 67.06 | |||||
* CAF = constant amplitude fatigue loading; VAF = variable amplitude fatigue load. ** k is the spring constant in kN per mm, F is the ultimate load in kN, and d is the deflection in mm.
Table 7.
Fatigue parameters.
| Joint Pattern | H | k |
| A-Jointed Precast FDDP | 25.86 | 0.039 |
| C-Jointed Precast FDDP | 24.32 | 0.041 |
| Z-Jointed Precast FDDP | 25.61 | 0.039 |
Table 8.
Loading history of the tested slab S2 of type A-joint with equivalent constant amplitude fatigue load segments.
Table 8.
Loading history of the tested slab S2 of type A-joint with equivalent constant amplitude fatigue load segments.
| Segment | Pu | FLS | Pmin | Pmax | Pamp | Pmean | R | A | Pmax /Pu | n | Nf | n/Nf | ||
| MF | WL | FLS1 | ||||||||||||
| 1 | 930.92 | 1.0 | 87.5 | 122.5 | 15 | 137.50 | 61.25 | 76.25 | 0.109 | 0.803 | 0.148 | 100,000 | 3,740,491,266 | 2.673E-05 |
| 2 | 930.92 | 1.5 | 87.5 | 183.8 | 15 | 198.75 | 91.88 | 106.88 | 0.075 | 0.860 | 0.213 | 100,000 | 682,217,686 | 0.0001466 |
| 3 | 930.92 | 2.0 | 87.5 | 245.0 | 15 | 260.00 | 122.50 | 137.50 | 0.057 | 0.891 | 0.279 | 100,000 | 124,427,766 | 0.0008037 |
| 4 | 930.92 | 2.5 | 87.5 | 306.3 | 15 | 321.25 | 153.13 | 168.13 | 0.046 | 0.911 | 0.345 | 100,000 | 22,694,030 | 0.0044064 |
| 5 | 930.92 | 3.0 | 87.5 | 367.5 | 15 | 382.50 | 183.75 | 198.75 | 0.039 | 0.925 | 0.411 | 100,000 | 4,139,100 | 0.0241598 |
| 6 | 930.92 | 3.5 | 87.5 | 428.8 | 15 | 443.75 | 214.38 | 229.38 | 0.034 | 0.935 | 0.477 | 100,000 | 754,919 | 0.1324646 |
| 7 | 930.92 | 4.0 | 87.5 | 490.0 | 15 | 505.00 | 245.00 | 260.00 | 0.030 | 0.942 | 0.542 | 115,381 | 137,688 | 0.8379916 |
| 8 | 930.92 | 4.0 | 87.5 | 490.0 | 15 | 505.00 | 245.00 | 260.00 | 0.030 | 0.942 | 0.542 | 94,112 | 137,688 | 0.6835187 |
| Total | 809,493 | Σn/N | 0.9999995 | |||||||||||
Notes: Pmean = (Pmax + Pmin)/2; R = Pmin/Pmax; A=Pa / Pm; Pa = (Pmax - Pmin)/2.
Table 9.
Loading history of the tested slab S4 of type C-joint with equivalent constant amplitude fatigue load segments.
Table 9.
Loading history of the tested slab S4 of type C-joint with equivalent constant amplitude fatigue load segments.
| Segment | Pu | FLS | Pmin |
Pmax |
Pamp |
Pmean |
R |
A |
Pmax /Pu |
n |
Nf |
n/Nf |
||
| MF | WL | FLS1 | ||||||||||||
| 1 | 973 | 1.0 | 87.5 | 122.5 | 15 | 137.50 | 61.25 | 76.25 | 0.109 | 0.803 | 0.141 | 100,000 | 1,176,908,558 | 8.497E-05 |
| 2 | 973 | 1.5 | 87.5 | 183.8 | 15 | 198.75 | 91.88 | 106.88 | 0.075 | 0.860 | 0.204 | 100,000 | 254,549,386 | 0.0003929 |
| 3 | 973 | 2.0 | 87.5 | 245.0 | 15 | 260.00 | 122.50 | 137.50 | 0.058 | 0.891 | 0.267 | 100,000 | 55,055,586 | 0.0018163 |
| 4 | 973 | 2.5 | 87.5 | 306.3 | 15 | 321.25 | 153.13 | 168.13 | 0.047 | 0.911 | 0.330 | 100,000 | 11,907,778 | 0.0083979 |
| 5 | 973 | 3.0 | 87.5 | 367.5 | 15 | 382.50 | 183.75 | 198.75 | 0.039 | 0.925 | 0.393 | 100,000 | 2,575,491 | 0.0388275 |
| 6 | 973 | 3.5 | 87.5 | 428.8 | 15 | 443.75 | 214.38 | 229.38 | 0.034 | 0.935 | 0.456 | 100,000 | 557,044 | 0.1795191 |
| 7 | 973 | 4.0 | 87.5 | 490.0 | 15 | 505.00 | 245.00 | 260.00 | 0.030 | 0.942 | 0.519 | 92,886 | 120,481 | 0.7709595 |
| Total | 692,886 | Σn/N | 0.9999981 | |||||||||||
Notes: Pmean = (Pmax + Pmin)/2; R = Pmin/Pmax; A=Pa / Pm; Pa = (Pmax - Pmin)/2.
Table 10.
Loading history of the tested slab S6 of type Z-joint with equivalent constant amplitude fatigue load segments.
Table 10.
Loading history of the tested slab S6 of type Z-joint with equivalent constant amplitude fatigue load segments.
| Segment | Pu | FLS | Pmin |
Pmax |
Pamp |
Pmean |
R |
A |
Pmax /Pu |
n |
Nf |
n/Nf |
||
| MF | WL | FLS1 | ||||||||||||
| 1 | 931 | 1.0 | 87.5 | 122.5 | 15 | 137.50 | 61.25 | 76.25 | 0.109 | 0.803 | 0.147 | 100,000 | 3,015,323,194 | 3.316E-05 |
| 2 | 931 | 1.5 | 87.5 | 183.8 | 15 | 198.75 | 91.88 | 106.88 | 0.075 | 0.860 | 0.213 | 100,000 | 559,277,378 | 0.0001788 |
| 3 | 931 | 2.0 | 87.5 | 245.0 | 15 | 260.00 | 122.50 | 137.50 | 0.057 | 0.890 | 0.279 | 100,000 | 103,733,884 | 0.000964 |
| 4 | 931 | 2.5 | 87.5 | 306.3 | 15 | 321.25 | 153.13 | 168.13 | 0.046 | 0.911 | 0.345 | 100,000 | 19,240,397 | 0.0051974 |
| 5 | 931 | 3.0 | 87.5 | 367.5 | 15 | 382.50 | 183.75 | 198.75 | 0.039 | 0.925 | 0.411 | 100,000 | 3,568,678 | 0.0280216 |
| 6 | 931 | 3.5 | 87.5 | 428.8 | 15 | 443.75 | 214.38 | 229.38 | 0.034 | 0.935 | 0.477 | 100,000 | 661,913 | 0.1510773 |
| 7 | 931 | 4.0 | 87.5 | 490.0 | 15 | 505.00 | 245.00 | 260.00 | 0.030 | 0.942 | 0.542 | 100,000 | 122,771 | 0.8145276 |
| 8 | 931 | 4.0 | 87.5 | 490.0 | 15 | 505.00 | 245.00 | 260.00 | 0.030 | 0.942 | 0542 | 100,000 | 122,771 | 0.8145276 |
| 9 | 931 | 4.0 | 87.5 | 490.0 | 15 | 505.00 | 245.00 | 260.00 | 0.030 | 0.942 | 0.542 | 95,000 | 122,771 | 0.7738013 |
| 10 | 931 | 4.0 | 87.5 | 490.0 | 15 | 505.00 | 245.00 | 260.00 | 0.030 | 0.942 | 0.542 | 21,736 | 122,771 | 0.1770457 |
| 11 | 931 | 4.0 | 87.5 | 490.0 | 15 | 505.00 | 245.00 | 260.00 | 0.030 | 0.942 | 0.542 | 44,804 | 122,771 | 0.364941 |
| Total | 961,540 | Σn/N | 0.9999999 | |||||||||||
Notes: Pmean = (Pmax + Pmin)/2; R = Pmin/Pmax; A=Pa / Pm; Pa = (Pmax - Pmin)/2.
Disclaimer/Publisher’s Note: The statements, opinions and data contained in all publications are solely those of the individual author(s) and contributor(s) and not of MDPI and/or the editor(s). MDPI and/or the editor(s) disclaim responsibility for any injury to people or property resulting from any ideas, methods, instructions or products referred to in the content. |
© 2024 by the authors. Licensee MDPI, Basel, Switzerland. This article is an open access article distributed under the terms and conditions of the Creative Commons Attribution (CC BY) license (http://creativecommons.org/licenses/by/4.0/).
Copyright: This open access article is published under a Creative Commons CC BY 4.0 license, which permit the free download, distribution, and reuse, provided that the author and preprint are cited in any reuse.


