Submitted:
16 August 2024
Posted:
19 August 2024
You are already at the latest version
Abstract
This study employs a comprehensive computational approach to identify and evaluate potential inhibitors of gamma D crystallin (CRYGD), a key protein implicated in cataract formation. A library of compounds, including natural products and FDA-approved drugs, was screened using molecular docking simulations and binding energy calculations. The top-scoring compounds were further assessed for drug-likeness properties and potential toxicity. Molecular dynamics simulations were conducted on the most promising candidates to investigate their interactions with CRYGD at the atomic level. The study identified CNP0185903, CID 3741, and CNP0151361 as the most promising compounds, with CNP0151361 demonstrating the most favorable combination of binding affinity, structural stabilization, and conformational modulation of CRYGD. These findings provide a foundation for the development of novel pharmacological interventions for cataract treatment, potentially offering alternatives or complements to current surgical approaches.
Keywords:
Cataract
; CRYGD
; Molecular docking
; Molecular dynamics
; Crystallin
; Protein aggregation
1. Introduction
Cataracts, characterized by the clouding of the eye's natural lens, remain a leading cause of vision impairment worldwide. As populations age, the incidence of cataracts continues to rise, creating an urgent need for innovative treatments beyond traditional surgical interventions. While cataract surgery is currently the primary treatment method, it has limitations including potential complications, high costs, and insufficient capacity to meet growing demand [1]. These factors have driven researchers to explore pharmacological alternatives, which could offer a more cost-effective and widely available option for patients. Historical approaches to anti-cataract drug development have focused on specific pathogenic factors such as oxidative stress, excess quinoid substances, and aldose reductase activation [2]. Although some drugs targeting these factors have reached clinical application, their efficacy has been disappointing, failing to provide a satisfactory solution to cataract treatment. Recent breakthroughs, however, have opened new avenues for research. The discovery that small molecules like 25-hydroxycholesterol, lanosterol [3], and Rosmarinic acid can potentially reverse lens opacity by dissolving crystallin protein aggregates has reinvigorated the field [4]. This finding suggests that protein aggregation in cataracts is not an irreversible endpoint, but can potentially be addressed with targeted pharmacological intervention [5].
Crystallins are the primary structural proteins in the eye lens, categorized into three main classes: alpha, beta, and gamma crystallins. Each class plays a crucial role in maintaining lens transparency and proper vision. However, among the gamma crystallins, gamma D crystallin has emerged as a key player in maintaining lens transparency and a promising target for drug design. The delicate balance of protein-protein interactions in the lens is critical for its transparency, and gamma D crystallin, with its unique structural properties and high concentration in the lens nucleus, plays a vital role in these interactions.
Recent research has highlighted the significance of gamma D crystallin in cataract formation [6]. Multiple studies have identified mutations in the CRYGD gene (which encodes gamma D crystallin) associated with various forms of congenital cataracts. For instance, a recurrent p.P24T mutation in CRYGD was found in 83.3% of Chinese families with congenital coralliform cataracts [7] Other studies have reported novel mutations such as p.S78F, associated with congenital nuclear cataract and nystagmus [8], and c.475delG, causing increased hydrophobicity of the mutant protein [9]. These findings underscore the critical role of CRYGD in lens development and clarity maintenance, providing multiple potential targets for drug design.
The importance of targeting γ-crystallin aggregation as a therapeutic approach for cataract treatment has been explored in several studies. Screening of FDA-approved drugs and natural compounds has identified promising candidates such as closantel and gambogic acid, which inhibit thermal-induced protein unfolding and aggregation of γ-crystallins [10]. Other potential treatments include the use of citrate-stabilized gold nanoparticles to inhibit amyloid fibrillation of human γD-crystallin [11], and small molecules like fusidic acid that have shown anti-aggregation properties[12].
In addition to these compounds, certain natural products and medicinal plants have demonstrated preventive effects against cataract formation in traditional medicine [13]. Other promising substances include N-acetylcysteine (NACA) eye drops, antioxidant-rich compounds like curcumin, vitamin C, and vitamin E [14]. Pharmacological agents such as aldose reductase (AR) inhibitors and sulfhydryl combinations of quinoid substance inhibitors have also been explored for their anti-cataract effects [2]
In this study, we employed a computational approach to identify and validate reliable small molecule inhibitors against CRYGD. We utilized a comprehensive library of compounds, including natural products with potential anticataract effects from the Coconut and PubChem databases, as well as FDA-approved drugs from the ZINC database. Our methodology involved molecular docking simulations, binding energy calculations, assessment of drug-likeness properties, and molecular dynamics simulations to investigate the behavior of potential cataract drugs at the atomic level.
This research aims to contribute to the development of novel pharmacological interventions for cataract treatment, potentially offering alternatives or complements to current surgical approaches. By targeting the CRYGD protein and its role in cataract formation, we hope to identify promising drug candidates that could lead to more effective, accessible, and less invasive treatments for this widespread vision impairment.
2. Materials and Methods
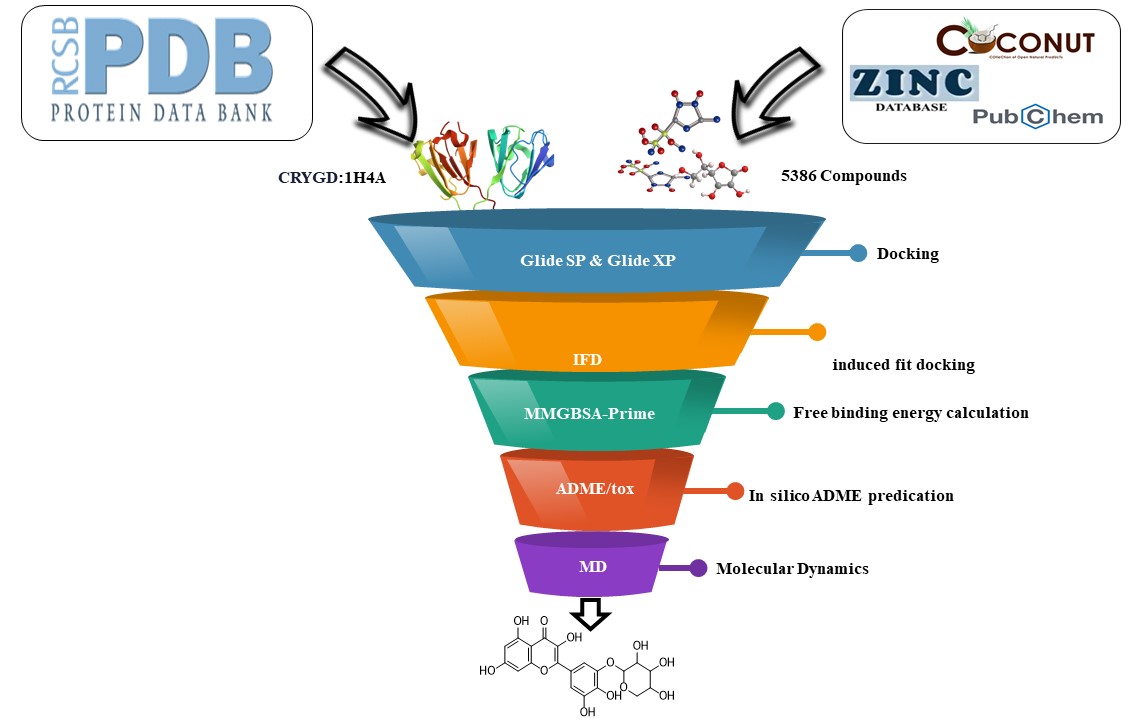
A computational approach was employed to identify promising drug candidates for cataracts. This in-silico analysis utilized Maestro v11.5 on a Windows PC. Maestro's docking tools (Glide and Induced-Fit Docking) and Prime module's binding energy calculations (MM-GBSA) were used to analyze the interactions between potential drug molecules and their target. Maestro's QikProp module assessed the drug-likeness properties (ADME) of these candidate molecules. Additionally, a free online server (SwissADME) aided in predicting toxicity. The simulations were performed utilizing the GROMACS 2023 software package on an Ubuntu 24.04 Linux operating system. The computational platform employed an Intel Core i7-12700K processor (3.6 GHz), an NVIDIA GeForce GTX 1080 Ti graphics processing unit, and 16 GB of RAM. This configuration facilitated atomistic simulations, enabling the investigation of the potential cataract drugs' behavior at the atomic level. Figure 1 illustrates the workflow of this computational methodology.
2.1. Selection and Preparation of Protein
A review of the literature indicated a strong association between the CRYGD protein and cataract formation. To further investigate this relationship, a high-resolution crystal structure of CRYGD (PDB ID: 1H4A, 1.15 Å resolution) was retrieved from the Protein Data Bank [15] and prepared for subsequent docking simulations. Prior to docking, the protein underwent comprehensive preparation using the Protein Preparation Wizard panel [16,17]. This process involved assigning bond orders based on the CCD database, adding hydrogens, defining zero-order metal bonds and disulfide bridges, filling in missing side chains and loops using Prime, removing water molecules beyond 5 Å from hetero groups, and generating het states with Epik [18]. Following preparation, the protein structure was refined through H-bond assignment utilizing sample water orientations and structural optimization via PROPKA at a physiological pH of 7.0. Finally, the OPLS_2005 force field was employed to achieve restrained minimization of the protein. This comprehensive approach ensured a well-characterized and accurately prepared CRYGD structure for use in downstream docking simulations.
2.2. Ligand Preparation and Grid Generation of Receptor Protein
A dataset encompassing 3,771 natural products with potential anticataract effects was compiled. These compounds were sourced from two databases: the Coconut database (https://coconut.naturalproducts.net/) [19], housing natural products, and PubChem (https://pubchem.ncbi.nlm.nih.gov/) [20], a comprehensive collection of chemical structures. Additionally, 1,615 FDA-approved drugs were retrieved from the ZINC database (https://zinc.docking.org/substances/fda/) [21].
All retrieved structures were subsequently uploaded to the Maestro graphical user interface (GUI) of the Schrödinger suite [22], a powerful software program employed for molecular modeling.
For each two-dimensional structure, low-energy 3D conformers were generated using established methodologies. These conformers represent the most stable spatial arrangements of the molecules, taking into account factors such as bond lengths and angles. Epik, a software tool, was utilized to account for the influence of pH (set at 7.4 ± 2) on the ionization state of the molecules, resulting in the generation of various possible protonation states. Subsequently, desalting (removal of charged ions) of the ligands was performed, followed by tautomer generation (creation of structural isomers). Stereoisomerism, referring to the existence of molecules with different spatial arrangements of atoms, was also addressed. A maximum of 32 chiral structures (stereoisomers) were generated for each ligand based on their 3D conformations, with all other settings remaining at default values.
Finally, minimization of all ligands was carried out using the OPLS-2005 force field module within Maestro. Force fields are computational models that simulate the interactions between atoms in a molecule. Minimization optimizes the ligand structures to their most stable energy states. Since the exact structure of the cataract-causing protein (CRYGD) active site is unknown, a 3D grid with appropriate dimensions was generated using the Schrödinger receptor grid generation tool. This grid represents the potential binding pocket for the ligands on the protein.
2.3. Rigid Molecular Docking
The docking process utilized the GLIDE ligand docking function in Maestro Schrödinger [23]. Glide identified potential ligand sites within the active-site region of the receptor using a hierarchical sequence of filters. Ligands exceeding 500 atoms or 100 rotatable bonds were excluded from consideration. Van der Waals radii were scaled by a factor of 0.80, and a partial charge cutoff of 0.15 was applied. To refine the selection, two docking techniques were employed. Standard-precision (SP) docking was used to screen a large number of ligands of unknown quality. Additionally, for the top 10 compounds identified in SP, extra-precision (XP) [24] docking and scoring, which is more robust and discriminating but requires longer computational time than SP, were applied.
Initially, 5386 compounds underwent screening in Standard Precision (SP) mode. Results were assessed based on the Docking score, and the top 10 compounds from SP were subsequently redocked using the Extra Precision (XP) method to minimize false positives. Validating the docking process is crucial in docking investigations.
2.4. Induced Fit Docking
Protein-ligand binding often triggers dynamic fluctuations within the protein structure, involving both side-chain and backbone movements. However, conventional docking methodologies typically treat proteins as rigid entities, which can lead to inaccurate predictions of affinity. To overcome this limitation, we implemented the Induced Fit Docking (IFD) protocol [25,26], a hybrid approach that integrates molecular docking with elements of molecular dynamics simulations. This method is particularly effective for validating the binding affinity of candidate ligands with the target receptor. IFD simulations were conducted using the Prime IFD panel within the Maestro software suite. Initially, promising ligand candidates were rigidly placed into a flexible model of the CRYGD protein using the XP GLIDE docking engine. Within the IFD workflow, the Van der Waals scaling factor was adjusted to 0.50 to accommodate protein flexibility, and up to 20 ligand poses were generated for each candidate. Subsequently, these poses underwent side-chain rotamer optimization and backbone minimization within a 5.0 Å radius surrounding the binding pocket. Finally, individual pose scores were computed using the IFD scoring function, and the ligand exhibiting the most favorable (highest negative) IFD score was selected for further investigation via molecular dynamics simulations.
2.5. Prediction of Binding Site
Docking simulations, employing both standard and induced fit approaches (docking and IFD, respectively), identified a set of residues that consistently engaged in favorable interactions with all ten top-ranked ligands. These key residues are presented in Table 3. Given the lack of prior characterization of the binding pocket(s) within CRYGD, the current study's findings suggest that these residues represent promising starting points for further investigations aimed at elucidating the protein's binding sites [27].
2.6. Free Binding Energy Calculation (MM-GBSA)
In order to assess the energetic favorability and potential biological activity of the top ten docked complexes identified through Induced Fit Docking (IFD), we employed Prime's implementation of the Mean Molecular Mechanics/Generalized Born Surface Area (MM-GBSA) method [28]. This computational approach enabled the estimation of the binding free energy (ΔG_bind) for each complex. Prior to MM-GBSA calculations, all docked complexes underwent local minimization within the Prime environment. The minimization protocol utilized the OPLS_2005 force field in conjunction with the Variable Dielectric Surface Generalized Born (VSGB) implicit solvation model.
The Prime MM-GBSA workflow yielded the relative binding free energy (ΔG_bind) values for each ligand, which are presented in Table 2 The underlying thermodynamic equation for ΔG_bind is provided below:
where:
ΔG_bind = ΔG_solv + ΔE_MM + ΔG_SA
- ΔG_solv represents the difference in solvation free energy calculated using the VSGB model between the CRYGD-inhibitor complex and the sum of the solvation free energies for the unbound CRYGD protein and the inhibitor molecule.
- ΔE_MM signifies the difference in minimized potential energies between the CRYGD-inhibitor complex and the sum of the minimized energies for the unbound CRYGD protein and the inhibitor molecule.
- ΔG_SA represents the difference in surface area free energy contributions between the complex and the sum of the surface area free energy terms for the unbound CRYGD protein and the inhibitor molecule.
Beyond the estimation of binding free energy, the Prime MM-GBSA approach also calculates the interaction energies of optimized free receptors, free ligands, and the corresponding complexes [29]. Notably, this method incorporates an evaluation of the ligand strain energy upon solvation within an implicit solvent environment generated by VSGB.
2.7. In Silico ADME Prediction
Compounds were evaluated to assess their drug-likeness and potential pharmacokinetic properties using QikProp [30] in Maestro v11.5 and SwissADME (http://www.swissadme.ch/ ) [31] These tools predicted a range of physicochemical and pharmacokinetic parameters relevant for drug candidate selection. Additionally, an in silico toxicology evaluation was conducted using the web server VenomPred 2.0 (https://www.mmvsl.it/wp/venompred2/ ) [32] to estimate potential toxicological properties of the compounds.
2.8. Molecular Dynamics
Molecular dynamics (MD) simulations offer a powerful computational approach to investigate the behavior of protein-ligand complexes at the atomic level within a dynamic environment [33]. This technique has gained significant traction in drug discovery research, enabling the elucidation of ligand-induced conformational changes within the protein. Additionally, MD simulations provide a valuable tool for assessing the stability of intra- and interatomic interactions within the complex over user-defined timescales.
In this study, the three top-scoring docking models were employed as initial configurations for 100 ns all-atom MD simulations. The CHARMM36 force field [34] and Gromacs 2023 software package were utilized to conduct the simulations [35]. All systems were solvated using the simple-point charge (SPC) water model and neutralized by incorporating 20 Na+ ions.
Prior to production simulations, each system underwent energy minimization (50,000 steps) using the steepest descent algorithm. This was followed by a thermal equilibration step (NVT ensemble) for 1 ns at 300 K using a Berendsen thermostat. Subsequently, pressure equilibration (NPT ensemble) was performed for 1 ns until a pressure of 1 bar was achieved. The LINCS algorithm was implemented to constrain bond lengths throughout the NVT, NPT, and production stages. Particle Mesh Ewald (PME) summation was employed to calculate long-range electrostatic interactions, with a cut-off value (r-coulomb) of 1.2 nm. Short-range van der Waals interactions were treated using a Verlet scheme with a cut-off of 1.2 nm. Finally, well-equilibrated systems were subjected to 100 ns production MD simulations [36].
Post-simulation analysis of the trajectories was performed using the QTGRACE software. A comprehensive analysis was conducted to evaluate various properties, including root mean square deviation (RMSD), root mean square fluctuation (RMSF), radius of gyration (Rg), solvent-accessible surface area (SASA), hydrogen bond occupancy, and principal component analysis (PCA).
3. Results
3.1. Docking and MM-GBSA
Molecular docking was performed to evaluate and confirm the binding affinity of the identified hits against CRYGD. This process provided detailed insights into their binding modes and interactions, along with quantitative binding energies and precise rankings based on their docking scores. Molecular docking plays a crucial role in drug design, accurately predicting the experimental binding mode and affinity of molecules within the target protein's binding site. To understand the molecular interactions and conformations of hit compounds within the binding site of CRYGD, we conducted glide SP docking, glide XP docking, and induced fit docking (IFD). Table 1 illustrates the 2D structures of the lead compounds along with their IUPAC names.
Initially, ten compounds demonstrated promising docking scores through SP docking, and these were subsequently subjected to XP docking. The results, summarized in Table 2, indicate that CNP0185903 had the most favorable docking score with CRYGD (-11.343 kcal/mol), followed by CID 3741 and CNP0151361 with scores of -10.732 kcal/mol and -10.304 kcal/mol, respectively. The IFD algorithm, which combines Glide and refinement modules to account for structural changes of the ligand within the protein's binding pocket, was further employed for accurate predictions.
In the Glide docking algorithm (HTVS, XP, and SP), the receptor is held rigid during ligand docking. However, receptor rigidity can result in inaccurate docking scores because proteins undergo specific movements upon binding with small molecules. These structural changes allow the receptor to modify its binding site to better accommodate the ligand. The IFD method enables the receptor to adapt its binding pocket to the ligand's shape and binding mode. Consistent with the docking scores, IFD results also showed that CNP0185903, CID 3741, and CNP0151361 had the most favorable interactions with CRYGD, achieving IFD scores of -424.7 kcal/mol, -420.32 kcal/mol, and -416.9 kcal/mol, respectively. The docking scores reflect the potential inhibitory capacity of the ligands in the protein–ligand complex, suggesting these top compounds may inhibit CRYGD.
Interaction analysis revealed that CNP0185903 formed six hydrogen bonds with CRYGD residues ARG79, TYR50, GLY52, LEU145, TYR151, and GLN155. CID 3741 formed nine hydrogen bonds, the highest number, with LEU145 (2), ARG142, GLN54, GLY158 (2), GLY52, TYR50, and ASN49. CNP0151361 formed five hydrogen bonds with residues TYR151, LEU145, GLN143, GLN54, and ASP156. Notably, the lead compounds exhibited similar hydrogen bond interactions with the LEU145 residue, and several residues, including TYR50, GLY52, TYR151, and GLN54, were common among two of the three compounds. Table 2 presents a summary of the docking analysis, including docking scores, IFD scores, and hydrogen bond interactions.
To validate the docking analysis, the binding free energy of the protein–ligand complexes was calculated. MM-GBSA (Molecular Mechanics Generalized Born Surface Area) post-docking methods, known for their reliability in estimating protein–ligand affinity, were employed. The binding free energy (ΔG_bind) released upon ligand binding indicates the stability of the protein–ligand complex, with a negative ΔG_bind indicating a favorable interaction. Table 2 provides the results of the energetic analysis, with Prime MM-GBSA (ΔG_bind) values ranging from -75.88 kcal/mol (CNP0312151) to -53.55 kcal/mol (ZINC000150339323). Among the lead compounds, CID 3741 and CNP0185903 had the highest binding scores.
The ligand-interaction tool in Maestro and PyMOL [37] was used to generate 2D and 3D graphical representations of the ligand-protein interactions, as shown in Figure 2.
The ligand-interaction tool in Maestro and PyMOL was used to generate 2D and 3D graphical representations of the ligand-protein interactions, as shown in Figure 3.
The consistent interaction of specific residues with multiple high-affinity ligands suggests their potential involvement in ligand binding.
The residues listed in the Table 3 were consistently involved in favorable interactions with the top-scoring ligands, suggesting their potential role in the binding site. This computational identification serves as a preliminary step, and further experimental validation is necessary to confirm these residues' involvement in ligand binding. Techniques such as site-directed mutagenesis, X-ray crystallography, or NMR spectroscopy could provide definitive evidence.
3.2. ADME Property and Toxicological Profile Analysis
The ADME properties and toxicological profiles of the top-scoring compounds against CRYGD were evaluated using a combination of computational tools and web servers. ADME properties were assessed using SwissADME and QikProp tools, while toxicological profiles were predicted using the VenomPred 2.0 web server. This comprehensive analysis revealed that the molecular weights of the compounds ranged from 377.39 to 821.143 Da, with most showing favorable QPlogP values (predicted octanol/water partition coefficients) within the acceptable range of -2.0 to 6.5, spanning from -3.376 to 0.684. QPlogS values (predicted aqueous solubility) were also mostly within the acceptable range of -6.5 to 0.5, ranging from -4.319 to -2.072. Notably, all compounds except 5464344 were predicted to have low GI absorption, and none were predicted to have BBB (Blood-Brain Barrier) permeability, which could be advantageous for targeting CRYGD in the eye by potentially reducing off-target effects in the central nervous system. Regarding Lipinski's Rule of Five, most compounds violated at least one rule, with only 5464344 fully complying, while CNP0151361 and 135398561 violated two rules. The toxicological profiles, as predicted by VenomPred 2.0, showed varying levels of potential risks, with mutagenicity predictions ranging from 16% to 56% (CNP0185903 showing the highest potential), carcinogenicity predictions ranging from 27% to 49% (CNP0151361 highest), hepatotoxicity predictions varying from 38% to 64% (135398561 highest), and eye irritation predictions generally low, ranging from 0% to 22% (CNP0113067 highest). Among the top-scoring compounds, CID3741 and 3743 demonstrated relatively lower toxicity risks across all categories while maintaining favorable ADME properties, making them promising candidates for further investigation. This comprehensive analysis, utilizing a combination of SwissADME, QikProp, and VenomPred 2.0, provides valuable insights for prioritizing compounds in the development of potential CRYGD inhibitors for cataract treatment, emphasizing the importance of considering both physicochemical properties and safety profiles when selecting candidates for further pre-clinical studies [38].

Table 4.
ADME Properties of Top-Scoring Compounds Against CRYGD.
| Name | MW | QPlogp o/w | QPlogS | GI absorption | BBB Permanent | Rule of Five |
| CNP0185903 | 626.52 | -3.376 | -2.072 | low | no | 3 |
| CID3741 | 807.11 | -1.671 | -2.45 | low | no | 3 |
| CNP0151361 | 450.35 | -1.448 | -2.846 | low | no | 2 |
| ZINC000150339323 | 821.143 | -1.391 | -2.672 | low | no | 3 |
| CNP0113067 | 584.48 | -0.28 | -3.575 | low | no | 3 |
| 3743 | 791.11 | -0.588 | -2.998 | low | no | 3 |
| 135398561 | 459.46 | 0.274 | -4.319 | low | no | 2 |
| CNP0312151 | 798.65 | 0.684 | -5.297 | low | no | 3 |
| ZINC000009164421 | 667.7 | -2.652 | -2.136 | low | no | 3 |
| 5464344 | 377.39 | 0.244 | -3.464 | high | no | 0 |
Table 5.
Toxicological Profiles of Top-Scoring Compounds Against CRYGD.
| Name | Mutagenicity (%) | Carcinogenicity (%) | Hepatotoxicity (%) | Eye irritation (%) |
| CNP0185903 | 56 | 43 | 54 | 18 |
| CID3741 | 19 | 47 | 38 | 4 |
| CNP0151361 | 55 | 49 | 51 | 21 |
| ZINC000150339323 | 21 | 43 | 42 | 8 |
| CNP0113067 | 49 | 42 | 54 | 22 |
| 3743 | 22 | 45 | 39 | 4 |
| 135398561 | 30 | 43 | 64 | 8 |
| CNP0312151 | 41 | 43 | 51 | 17 |
| ZINC000009164421 | 34 | 37 | 57 | 6 |
| 5464344 | 16 | 27 | 60 | 0 |
3.3. Molecular Dynamics
3.3.1. RMSD Plots
The RMSD plot (Figure 4) illustrates the structural stability and dynamic behavior of the apo protein and its complexes with compounds CNP0185903, CNP0151361, and CID3741 over a 100 ns molecular dynamics simulation. The RMSD values for all systems generally fall within the range of 0.5-1.0 nm, indicating overall stability throughout the simulation period.
The apo protein, represented by the black line, shows a relatively stable RMSD profile, with values predominantly remaining between 0.6-0.75 nm. After an initial equilibration phase in the first 10 ns, the apo protein maintains a consistent RMSD, suggesting a stable conformation in the absence of ligands.
The protein complex with CNP0185903 (red line) exhibits slightly higher RMSD values compared to the apo protein, generally ranging from 0.7-0.8 nm. It shows more pronounced fluctuations, particularly around the 40-50 ns mark, indicating that the binding of CNP0185903 induces some conformational changes in the protein structure. Interestingly, the protein complex with CNP0151361 (green line) demonstrates the lowest overall RMSD values, mostly between 0.6-0.75 nm. While some fluctuations are present, this complex maintains the most stable RMSD profile among all systems, suggesting that CNP0151361 may have a stabilizing effect on the protein structure.
In contrast, the protein complex with CID3741 (blue line) displays the highest RMSD values and the most significant fluctuations among all systems. The RMSD values for this complex range from about 0.7-1.0 nm, with notable peaks around 40 ns and 90 ns. This behavior implies that CID3741 induces the most substantial conformational changes in the protein, potentially affecting its structure and function to a greater extent than the other ligands.
All systems show an initial rapid increase in RMSD during the first 5-10 ns, which likely represents the equilibration phase of the simulation. After this initial phase, the RMSD values stabilize for each system, albeit at different levels and with varying degrees of fluctuation.
3.3.2. Root Mean Square Fluctuation (RMSF)
Based on the RMSF plot provided (Figure 5), we can analyze the flexibility of residues 1-174 in the protein structure across four states: apo protein and its complexes with compounds CNP0185903, CID3741, and CNP0151361. The apo protein (black line) exhibits generally low RMSF values (<0.3 nm) for most residues, with notable peaks around residues 40, 87, and 116. The complex with CNP0185903 (red line) shows a similar pattern to the apo state, but with higher peaks around residues 58-60 and 145-150, indicating increased local flexibility in these regions. CNP0151361 (green line) induces the highest overall RMSF values among all systems, with major peaks at residues 40, 87, and 116-120, suggesting widespread increases in protein flexibility. In contrast, the complex with CID3741 (blue line) demonstrates generally lower RMSF values compared to other complexes, except for a pronounced peak around residue 87 and high flexibility at the C-terminus (residues 170-174). Interestingly, all systems show increased flexibility around residue 87, with RMSF values reaching approximately 0.5 nm, indicating this might be a key region for protein function or ligand interaction. The C-terminal region (residues 160-174) also consistently shows higher flexibility across all systems. Based on this RMSF analysis, CID3741 appears to be the best compound for stabilizing the protein structure. It maintains lower RMSF values throughout most of the protein sequence, indicating a rigidifying effect on the overall structure. While it does show high flexibility in specific regions (around residue 87 and the C-terminus), this localized flexibility coupled with overall stabilization might be beneficial for the protein's function. The reduced fluctuations in many regions compared to the apo state and other complexes suggest that CID3741 could potentially enhance the protein's stability and possibly its activity, making it the most promising candidate from a structural dynamics perspective.
3.3.3. Radius of Gyration (Rg) Analysis
Based on the Radius of Gyration (Rg) plot (Figure 6), we can analyze the compactness of the protein structure over a 100 ns simulation for the apo protein and its complexes with compounds CNP0185903, CNP0151361, and CID3741. The plot reveals distinct differences in structural compactness among the systems studied.
The apo protein, represented by the black line, exhibits the highest overall Rg values, fluctuating mostly between 1.75 nm and 1.85 nm. This suggests that the protein maintains a less compact structure in its unbound state, with noticeable variability especially in the first 20 ns of the simulation. In contrast, all ligand-bound complexes demonstrate lower Rg values compared to the apo protein, indicating that ligand binding generally induces a more compact protein structure.
Among the ligand-bound complexes, the CNP0151361 complex (green line) stands out by consistently displaying the lowest Rg values, mostly between 1.65 nm and 1.75 nm. This suggests that CNP0151361 induces the most compact protein structure among all systems and maintains this compact conformation stably throughout the simulation. The CNP0185903 complex (red line) shows intermediate compactness, with Rg values generally ranging between 1.7 nm and 1.8 nm, indicating a slightly more compact structure than the apo form but less compact than the CNP0151361 complex. The CID3741 complex (blue line) exhibits Rg values that fluctuate between those of the apo protein and the other complexes, ranging from 1.75 nm to 1.85 nm. It shows notable fluctuations, particularly around 40 ns where it briefly reaches the highest Rg values in the simulation, suggesting that while it generally induces a more compact structure than the apo protein, it allows for more structural flexibility.
3.3.4. Solvent Accessible Surface Area (SASA) Analysis
The SASA plot (Figure 7) shows the solvent-accessible surface area of the apo protein and its complexes with compounds CNP0185903, CID3741, and CNP0151361 over a 100 ns simulation. The apo protein (black line) generally shows SASA values fluctuating between about 90-100 nm², with some peaks reaching slightly above 100 nm².
The complex with CNP0185903 (red line) displays SASA values mostly in the range of 93-98 nm², often overlapping with or slightly below the apo protein line. The complex with CID3741 (blue line) shows the highest overall SASA values among all systems, particularly in the latter half of the simulation. It shows an increasing trend towards the end, peaking around 105 nm².
The complex with CNP0151361 (green line) consistently demonstrates the lowest SASA values, generally ranging between 87-93 nm². All complexes show relatively stable SASA values throughout the simulation, suggesting the ligands remain bound within the protein's binding cavity over the 100 ns period. The differences in SASA between the complexes indicate that each ligand interacts uniquely with the protein, inducing specific conformational changes that affect the overall solvent exposure of the protein surface.
The SASA analysis suggests that all three compounds remain bound to the protein throughout the simulation. The CID3741 complex shows the highest solvent accessibility, even exceeding the apo protein, while the CNP0151361 complex displays the lowest SASA values, potentially indicating it induces the most compact protein conformation.
3.3.5. Principal Component Analysis (PCA)
The PCA plots (Figure 8) illustrate the conformational dynamics of the protein systems during the molecular dynamics simulations by projecting the trajectories onto the two most significant principal components (PC1 and PC2). This allows us to visualize the major collective motions and conformational changes of the protein in each system. For the apo protein (black), we observe a relatively compact and localized distribution of conformations, primarily clustered in the center of the plot. This suggests that the apo protein explores a limited conformational space, indicating a relatively stable structure with fewer large-scale motions. The tight clustering implies that the protein maintains a consistent overall conformation throughout the simulation.
The complex with CNP0185903 (red) shows a more dispersed distribution compared to the apo protein. The conformations are spread across a larger area of the PC1-PC2 space, particularly along the PC1 axis. This increased spread indicates that the binding of CNP0185903 induces greater conformational flexibility in the protein. The protein-ligand complex appears to sample a wider range of conformations, suggesting that CNP0185903 may alter the protein's dynamics and potentially its function.
The CID3741 complex (blue) exhibits the most extensive distribution among all systems. The conformations are widely spread across both PC1 and PC2 axes, forming distinct clusters. This pattern suggests that CID3741 induces the most significant conformational changes in the protein, allowing it to access a diverse range of conformational states. The presence of multiple clusters indicates that the complex may transition between several stable conformations during the simulation.
The CNP0151361 complex (green) shows an intermediate level of conformational sampling between the apo protein and the other complexes. Its distribution is more spread out than the apo protein but less extensive than the CID3741 complex. This suggests that CNP0151361 induces moderate conformational changes in the protein, allowing for some flexibility while maintaining a degree of structural stability.
These findings corroborate other analyses in the study. The enhanced conformational flexibility of ligand-bound complexes, especially with CID3741, is consistent with increased RMSD and RMSF values.
CNP0151361 emerges as the most promising compound based on the molecular dynamics analyses. This ligand consistently induces the most compact protein structure, as evidenced by the lowest Radius of Gyration and Solvent Accessible Surface Area values. It maintains stable RMSD profiles, indicating a consistent protein conformation throughout the simulation. While allowing for some flexibility, as shown in the PCA, CNP0151361 strikes an optimal balance between structural stability and necessary protein dynamics. This combination of compactness and moderate conformational changes suggests that CNP0151361 likely forms stable interactions with the protein, potentially enhancing its inhibitory effects. The compound's ability to induce a more rigid overall structure, while still permitting essential molecular movements, could be crucial for maintaining or improving the protein's functional state. Therefore, CNP0151361 presents itself as the best candidate for further development, offering a promising balance of structural stabilization and functional modulation that could translate into effective protein inhibition or regulation.
4. Conclusions
This computational study has successfully identified several promising compounds as potential inhibitors of CRYGD for cataract treatment. Through a rigorous process of molecular docking, ADME property analysis, and molecular dynamics simulations, we have demonstrated that CNP0151361 emerges as the most promising candidate. This compound consistently induced the most compact protein structure while maintaining a balance between structural stability and necessary protein dynamics. The ability of CNP0151361 to modulate CRYGD's conformation suggests its potential to inhibit or regulate the protein's function effectively. These findings provide a strong foundation for further experimental validation and development of novel pharmacological interventions for cataract treatment. While this computational approach offers valuable insights, it is important to note that experimental studies are necessary to confirm these predictions and to fully understand the efficacy and safety of these compounds in biological systems. Future research should focus on in vitro and in vivo studies to validate the effectiveness of CNP0151361 and other identified compounds in preventing or treating cataracts.
Author Contributions
These authors contributed equally to this work.
Funding
The authors report that there is no funding associated with the work featured in this article.
Conflicts of Interest
The author(s) report no conflicts of interest in this work.
References
- Mencucci, R.; Stefanini, S.; Favuzza, E.; Cennamo, M.; De Vitto, C.; Mossello, E. Beyond vision: Cataract and health status in old age, a narrative review. Frontiers in Medicine 2023, 10, 1110383. [Google Scholar] [CrossRef]
- Xu, J.; Fu, Q.; Chen, X.; Yao, K. Advances in pharmacotherapy of cataracts. Annals of translational medicine 2020, 8. [Google Scholar] [CrossRef]
- Chen, X.-J.; Hu, L.-D.; Yao, K.; Yan, Y.-B. Lanosterol and 25-hydroxycholesterol dissociate crystallin aggregates isolated from cataractous human lens via different mechanisms. Biochemical and biophysical research communications 2018, 506, 868–873. [Google Scholar] [CrossRef]
- Chemerovski-Glikman, M.; Mimouni, M.; Dagan, Y.; Haj, E.; Vainer, I.; Allon, R.; Blumenthal, E. Z.; Adler-Abramovich, L.; Segal, D.; Gazit, E. Rosmarinic acid restores complete transparency of sonicated human cataract ex vivo and delays cataract formation in vivo. Scientific reports 2018, 8, 9341. [Google Scholar] [CrossRef] [PubMed]
- Moreau, K. L.; King, J. A. Protein misfolding and aggregation in cataract disease and prospects for prevention. Trends in molecular medicine 2012, 18, 273–282. [Google Scholar] [CrossRef]
- Takemoto, L.; Sorensen, C. M. Protein–protein interactions and lens transparency. Experimental eye research 2008, 87, 496–501. [Google Scholar] [CrossRef] [PubMed]
- Wang, K.-J.; Wang, J.-X.; Wang, J.-D.; Li, M.; Zhang, J.-S.; Mao, Y.-Y.; Wan, X.-H. Congenital coralliform cataract is the predominant consequence of a recurrent mutation in the CRYGD gene. Orphanet Journal of Rare Diseases 2023, 18, 200. [Google Scholar] [CrossRef]
- Gao, Y.; Ren, X.; Fu, X.; Lin, Y.; Xiao, L.; Wang, X.; Yan, N.; Zhang, M. Case Report: A Novel Mutation in the CRYGD Gene Causing Congenital Cataract Associated with Nystagmus in a Chinese Family. Frontiers in Genetics 2022, 13, 824550. [Google Scholar] [CrossRef]
- Lin, M.; Jin, Y.; Chen, X.; Sui, Y.; Li, Y.; Li, H.; Ni, X.; Zhao, N.; Lu, Y.; Jiang, M. Increased hydrophobicity of CRYGD p.(Ala159ProfsTer9): Suspected cause of congenital cataracts in a large Chinese family. Molecular Genetics & Genomic Medicine 2020, 8, e1436. [Google Scholar]
- Islam, S.; Do, M. T.; Frank, B. S.; Hom, G. L.; Wheeler, S.; Fujioka, H.; Wang, B.; Minocha, G.; Sell, D. R.; Fan, X. α-Crystallin chaperone mimetic drugs inhibit lens γ-crystallin aggregation: Potential role for cataract prevention. Journal of Biological Chemistry 2022, 298. [Google Scholar] [CrossRef]
- Sharma, V.; Sharma, S.; Rana, S.; Ghosh, K. S. Inhibition of amyloid fibrillation of human γD-crystallin by gold nanoparticles: Studies at molecular level. Spectrochimica Acta Part A: Molecular and Biomolecular Spectroscopy 2020, 233, 118199. [Google Scholar] [CrossRef] [PubMed]
- Gasymov, O. K.; Mammedzade, A. M.; Bakhishova, M. J.; Guliyeva, A. J.; Ragona, L.; Molinari, H. Sodium fusidate prevents protein aggregation of silk fibroin and offers new perspectives for human lens material disaggregation. Biophysical Chemistry 2021, 279, 106680. [Google Scholar] [CrossRef] [PubMed]
- Tewari, D.; Samoilă, O.; Gocan, D.; Mocan, A.; Moldovan, C.; Devkota, H. P.; Atanasov, A. G.; Zengin, G.; Echeverría, J.; Vodnar, D. Medicinal plants and natural products used in cataract management. Frontiers in Pharmacology 2019, 10, 466. [Google Scholar] [CrossRef] [PubMed]
- Imelda, E.; Idroes, R.; Khairan, K.; Lubis, R. R.; Abas, A. H.; Nursalim, A. J.; Rafi, M.; Tallei, T. E. Natural antioxidant activities of plants in preventing cataractogenesis. Antioxidants 2022, 11, 1285. [Google Scholar] [CrossRef]
- Basak, A.; Bateman, O.; Slingsby, C.; Pande, A.; Asherie, N.; Ogun, O.; Benedek, G. B.; Pande, J. High-resolution X-ray crystal structures of human γD crystallin (1.25 Å) and the R58H mutant (1.15 Å) associated with aculeiform cataract. Journal of Molecular biology 2003, 328, 1137–1147. [Google Scholar] [CrossRef]
- Madhavi Sastry, G.; Adzhigirey, M.; Day, T.; Annabhimoju, R.; Sherman, W. Protein and ligand preparation: parameters, protocols, and influence on virtual screening enrichments. Journal of computer-aided molecular design 2013, 27, 221–234. [Google Scholar] [CrossRef] [PubMed]
- De Vita, S.; Lauro, G.; Ruggiero, D.; Terracciano, S.; Riccio, R.; Bifulco, G. Protein preparation automatic protocol for high-throughput inverse virtual screening: Accelerating the target identification by computational methods. Journal of chemical information and modeling 2019, 59, 4678–4690. [Google Scholar] [CrossRef]
- Johnston, R. C.; Yao, K.; Kaplan, Z.; Chelliah, M.; Leswing, K.; Seekins, S.; Watts, S.; Calkins, D.; Chief Elk, J.; Jerome, S. V. Epik: p K a and Protonation State Prediction through Machine Learning. Journal of chemical theory and computation 2023, 19, 2380–2388. [Google Scholar] [CrossRef] [PubMed]
- Santosa, F. A.; Lamba, M.; George, C.; Downie, J. S. Coconut Libtool: Bridging Textual Analysis Gaps for Non-Programmers. arXiv preprint arXiv:2406.05949 2024.
- Kim, S.; Chen, J.; Cheng, T.; Gindulyte, A.; He, J.; He, S.; Li, Q.; Shoemaker, B. A.; Thiessen, P. A.; Yu, B. PubChem 2023 update. Nucleic acids research 2023, 51, D1373–D1380. [Google Scholar] [CrossRef]
- Irwin, J. J.; Sterling, T.; Mysinger, M. M.; Bolstad, E. S.; Coleman, R. G. ZINC: a free tool to discover chemistry for biology. Journal of chemical information and modeling 2012, 52, 1757–1768. [Google Scholar] [CrossRef]
- LigPrep, S. Schrödinger. Schrödinger Release 2018, 2. [Google Scholar]
- Yang, Y.; Yao, K.; Repasky, M. P.; Leswing, K.; Abel, R.; Shoichet, B. K.; Jerome, S. V. Efficient exploration of chemical space with docking and deep learning. Journal of Chemical Theory and Computation 2021, 17, 7106–7119. [Google Scholar] [CrossRef]
- Friesner, R. A.; Murphy, R. B.; Repasky, M. P.; Frye, L. L.; Greenwood, J. R.; Halgren, T. A.; Sanschagrin, P. C.; Mainz, D. T. Extra precision glide: Docking and scoring incorporating a model of hydrophobic enclosure for protein− ligand complexes. Journal of medicinal chemistry 2006, 49, 6177–6196. [Google Scholar] [CrossRef]
- Miller, E. B.; Murphy, R. B.; Sindhikara, D.; Borrelli, K. W.; Grisewood, M. J.; Ranalli, F.; Dixon, S. L.; Jerome, S.; Boyles, N. A.; Day, T. Reliable and accurate solution to the induced fit docking problem for protein–ligand binding. Journal of Chemical Theory and Computation 2021, 17, 2630–2639. [Google Scholar] [CrossRef] [PubMed]
- Sherman, W.; Day, T.; Jacobson, M. P.; Friesner, R. A.; Farid, R. Novel procedure for modeling ligand/receptor induced fit effects. Journal of medicinal chemistry 2006, 49, 534–553. [Google Scholar] [CrossRef] [PubMed]
- Fukunishi, Y.; Nakamura, H. Prediction of ligand-binding sites of proteins by molecular docking calculation for a random ligand library. Protein Science 2011, 20, 95–106. [Google Scholar] [CrossRef]
- Lyne, P. D.; Lamb, M. L.; Saeh, J. C. Accurate prediction of the relative potencies of members of a series of kinase inhibitors using molecular docking and MM-GBSA scoring. Journal of medicinal chemistry 2006, 49, 4805–4808. [Google Scholar] [CrossRef] [PubMed]
- Genheden, S.; Ryde, U. The MM/PBSA and MM/GBSA methods to estimate ligand-binding affinities. Expert opinion on drug discovery 2015, 10, 449–461. [Google Scholar] [CrossRef]
- Schrödinger Release 2024-2: QikProp, S., LLC, New York, NY, 2024.
- Daina, A.; Michielin, O.; Zoete, V. SwissADME: a free web tool to evaluate pharmacokinetics, drug-likeness and medicinal chemistry friendliness of small molecules. Scientific reports 2017, 7, 42717. [Google Scholar] [CrossRef]
- Di Stefano, M.; Galati, S.; Piazza, L.; Granchi, C.; Mancini, S.; Fratini, F.; Macchia, M.; Poli, G.; Tuccinardi, T. VenomPred 2.0: a novel in silico platform for an extended and human interpretable toxicological profiling of small molecules. Journal of Chemical Information and Modeling 2023, 64, 2275–2289. [Google Scholar] [CrossRef]
- Hollingsworth, S. A.; Dror, R. O. Molecular dynamics simulation for all. Neuron 2018, 99, 1129–1143. [Google Scholar] [CrossRef] [PubMed]
- Huang, J.; MacKerell Jr, A. D. CHARMM36 all-atom additive protein force field: Validation based on comparison to NMR data. Journal of computational chemistry 2013, 34, 2135–2145. [Google Scholar] [CrossRef] [PubMed]
- Bekker, H.; Berendsen, H.; Dijkstra, E.; Achterop, S.; Vondrumen, R. v.; Vanderspoel, D.; Sijbers, A.; Keegstra, H.; Renardus, M. Gromacs-a parallel computer for molecular-dynamics simulations. In 4th international conference on computational physics (PC 92), 1993; World Scientific Publishing: pp 252-256.
- Lindahl, E.; Hess, B.; Van Der Spoel, D. GROMACS 3.0: a package for molecular simulation and trajectory analysis. Molecular modeling annual 2001, 7, 306–317. [Google Scholar] [CrossRef]
- DeLano, W. L. Pymol: An open-source molecular graphics tool. CCP4 Newsl. Protein Crystallogr 2002, 40, 82–92. [Google Scholar]
- Li, A. P. Screening for human ADME/Tox drug properties in drug discovery. Drug discovery today 2001, 6, 357–366. [Google Scholar] [CrossRef] [PubMed]
Figure 1.
Schematic illustration of pipelines employed in this research.
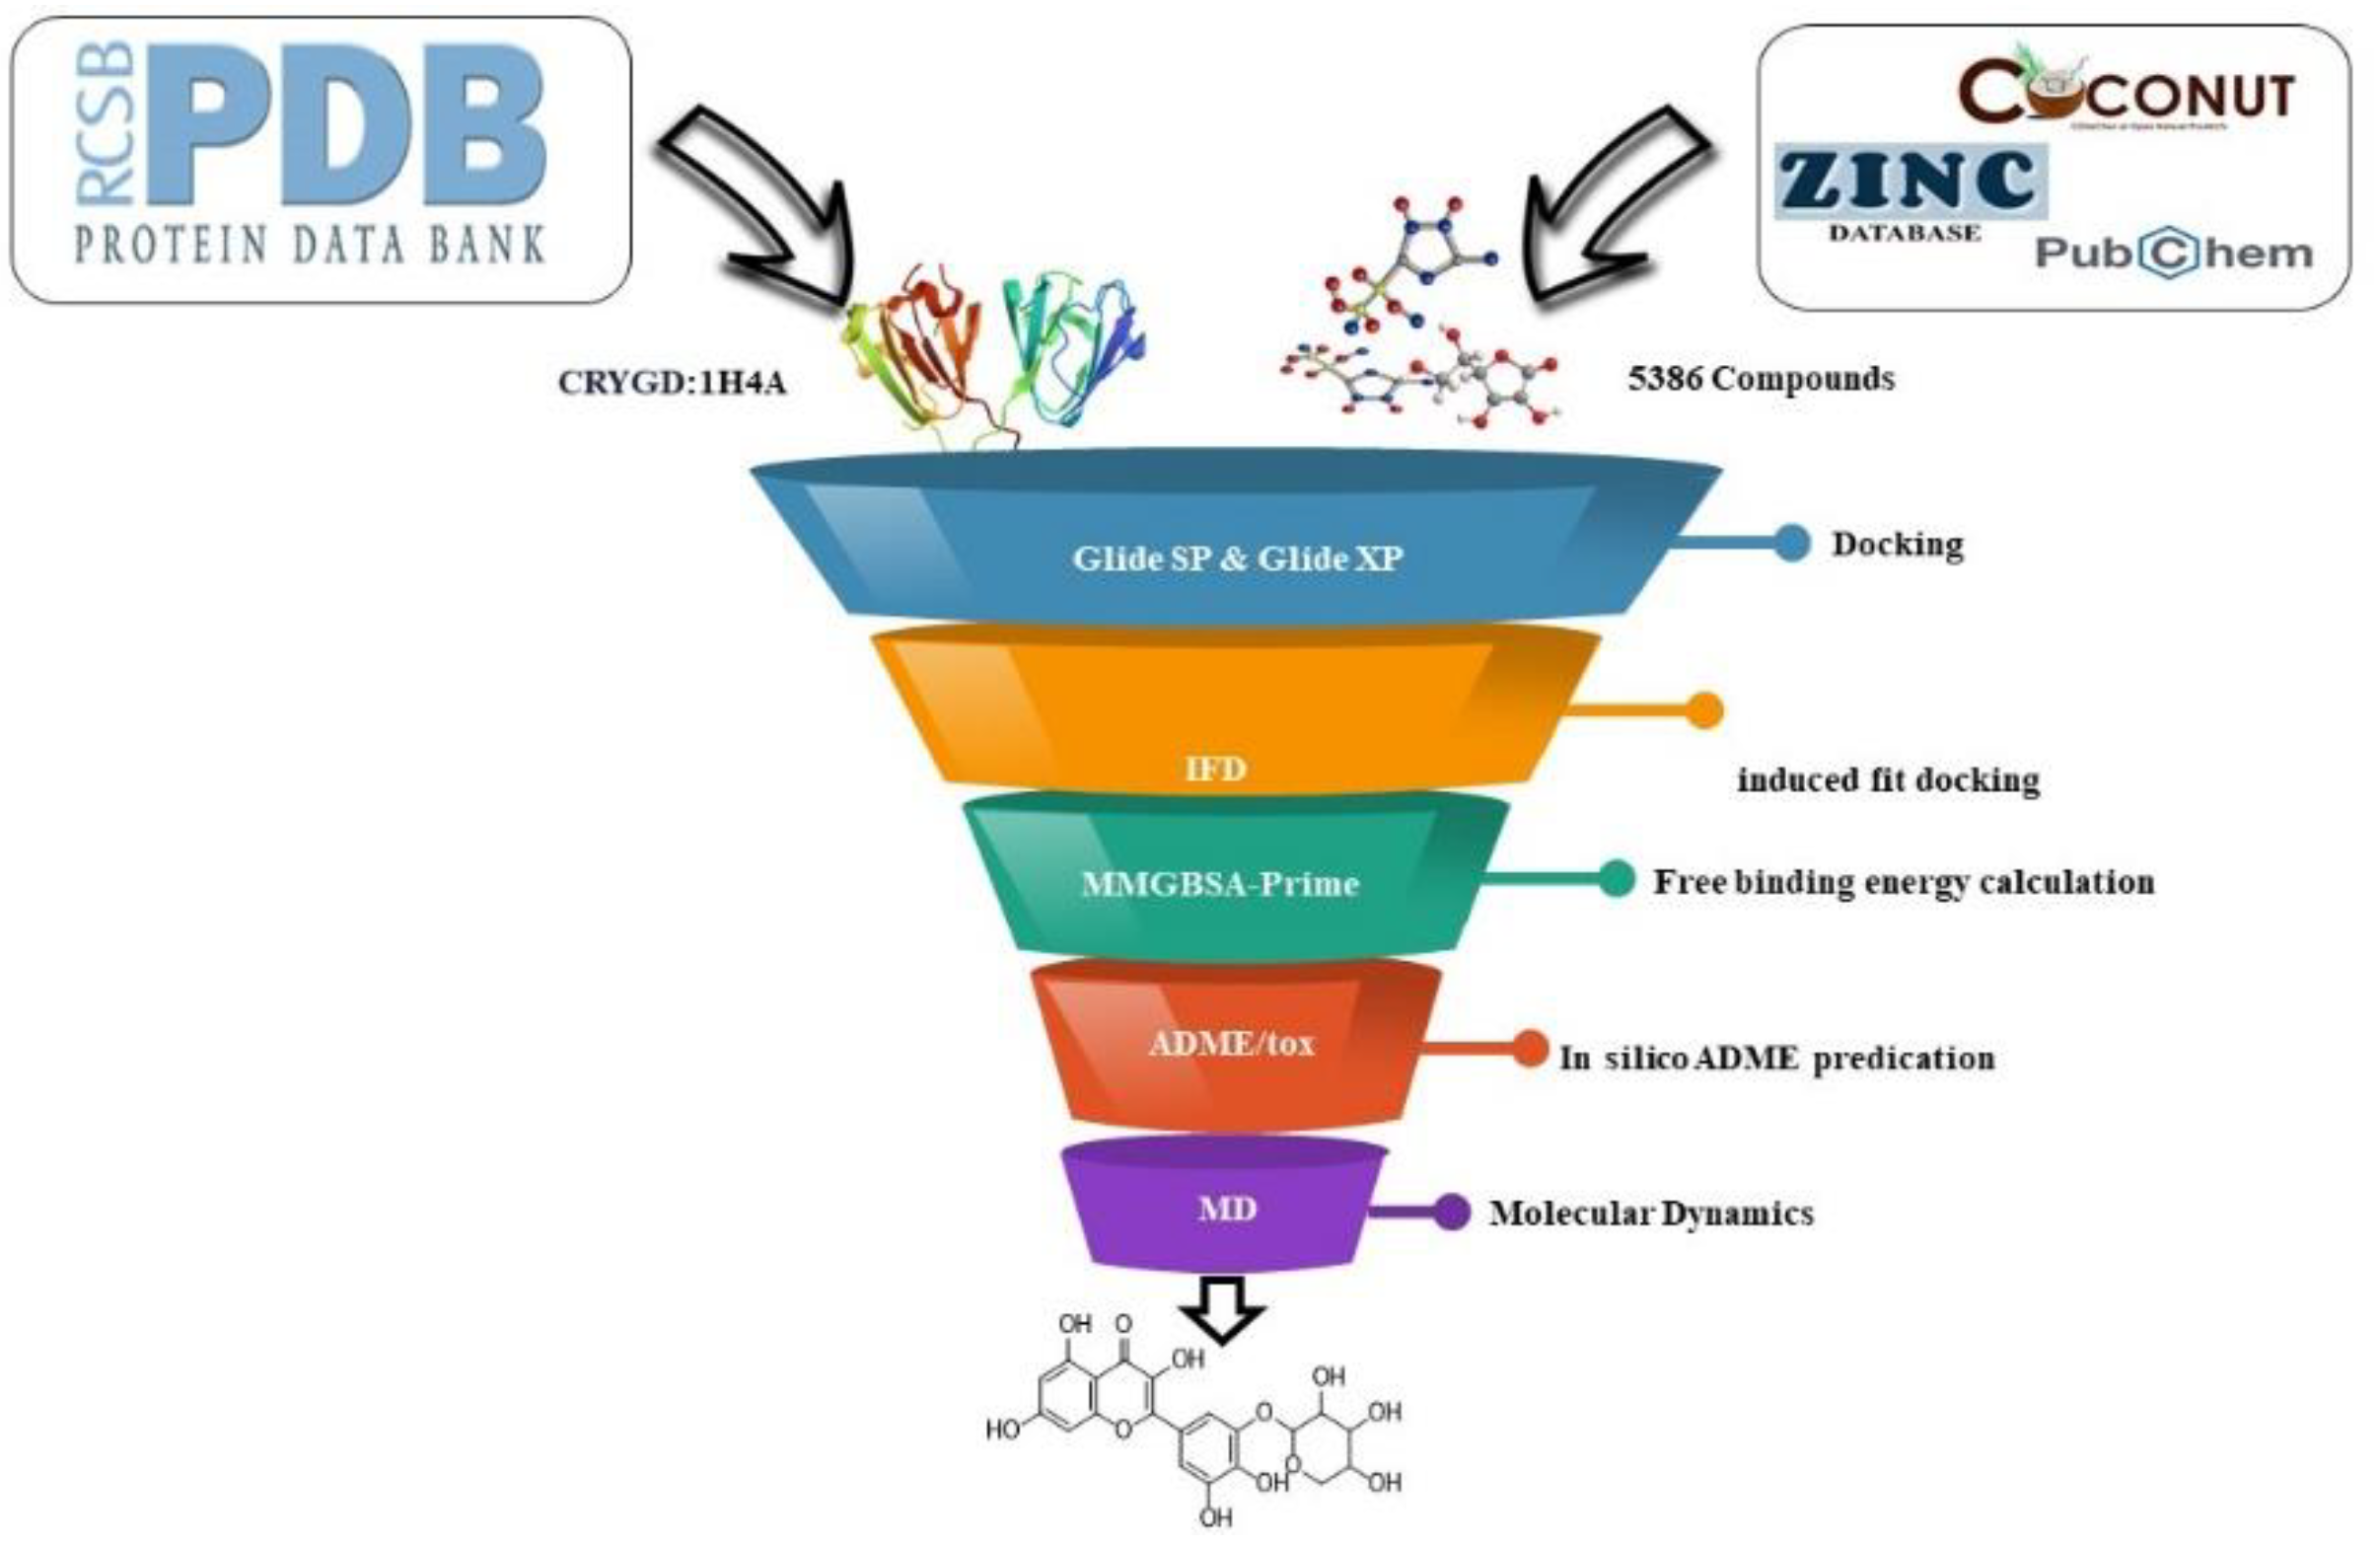
Figure 2.
The 2D and 3D Interactions of CNP0185903, 3741CID, and CNP0151361 with Amino Acid Residues in the CRYGD Protein Structure.
Figure 2.
The 2D and 3D Interactions of CNP0185903, 3741CID, and CNP0151361 with Amino Acid Residues in the CRYGD Protein Structure.
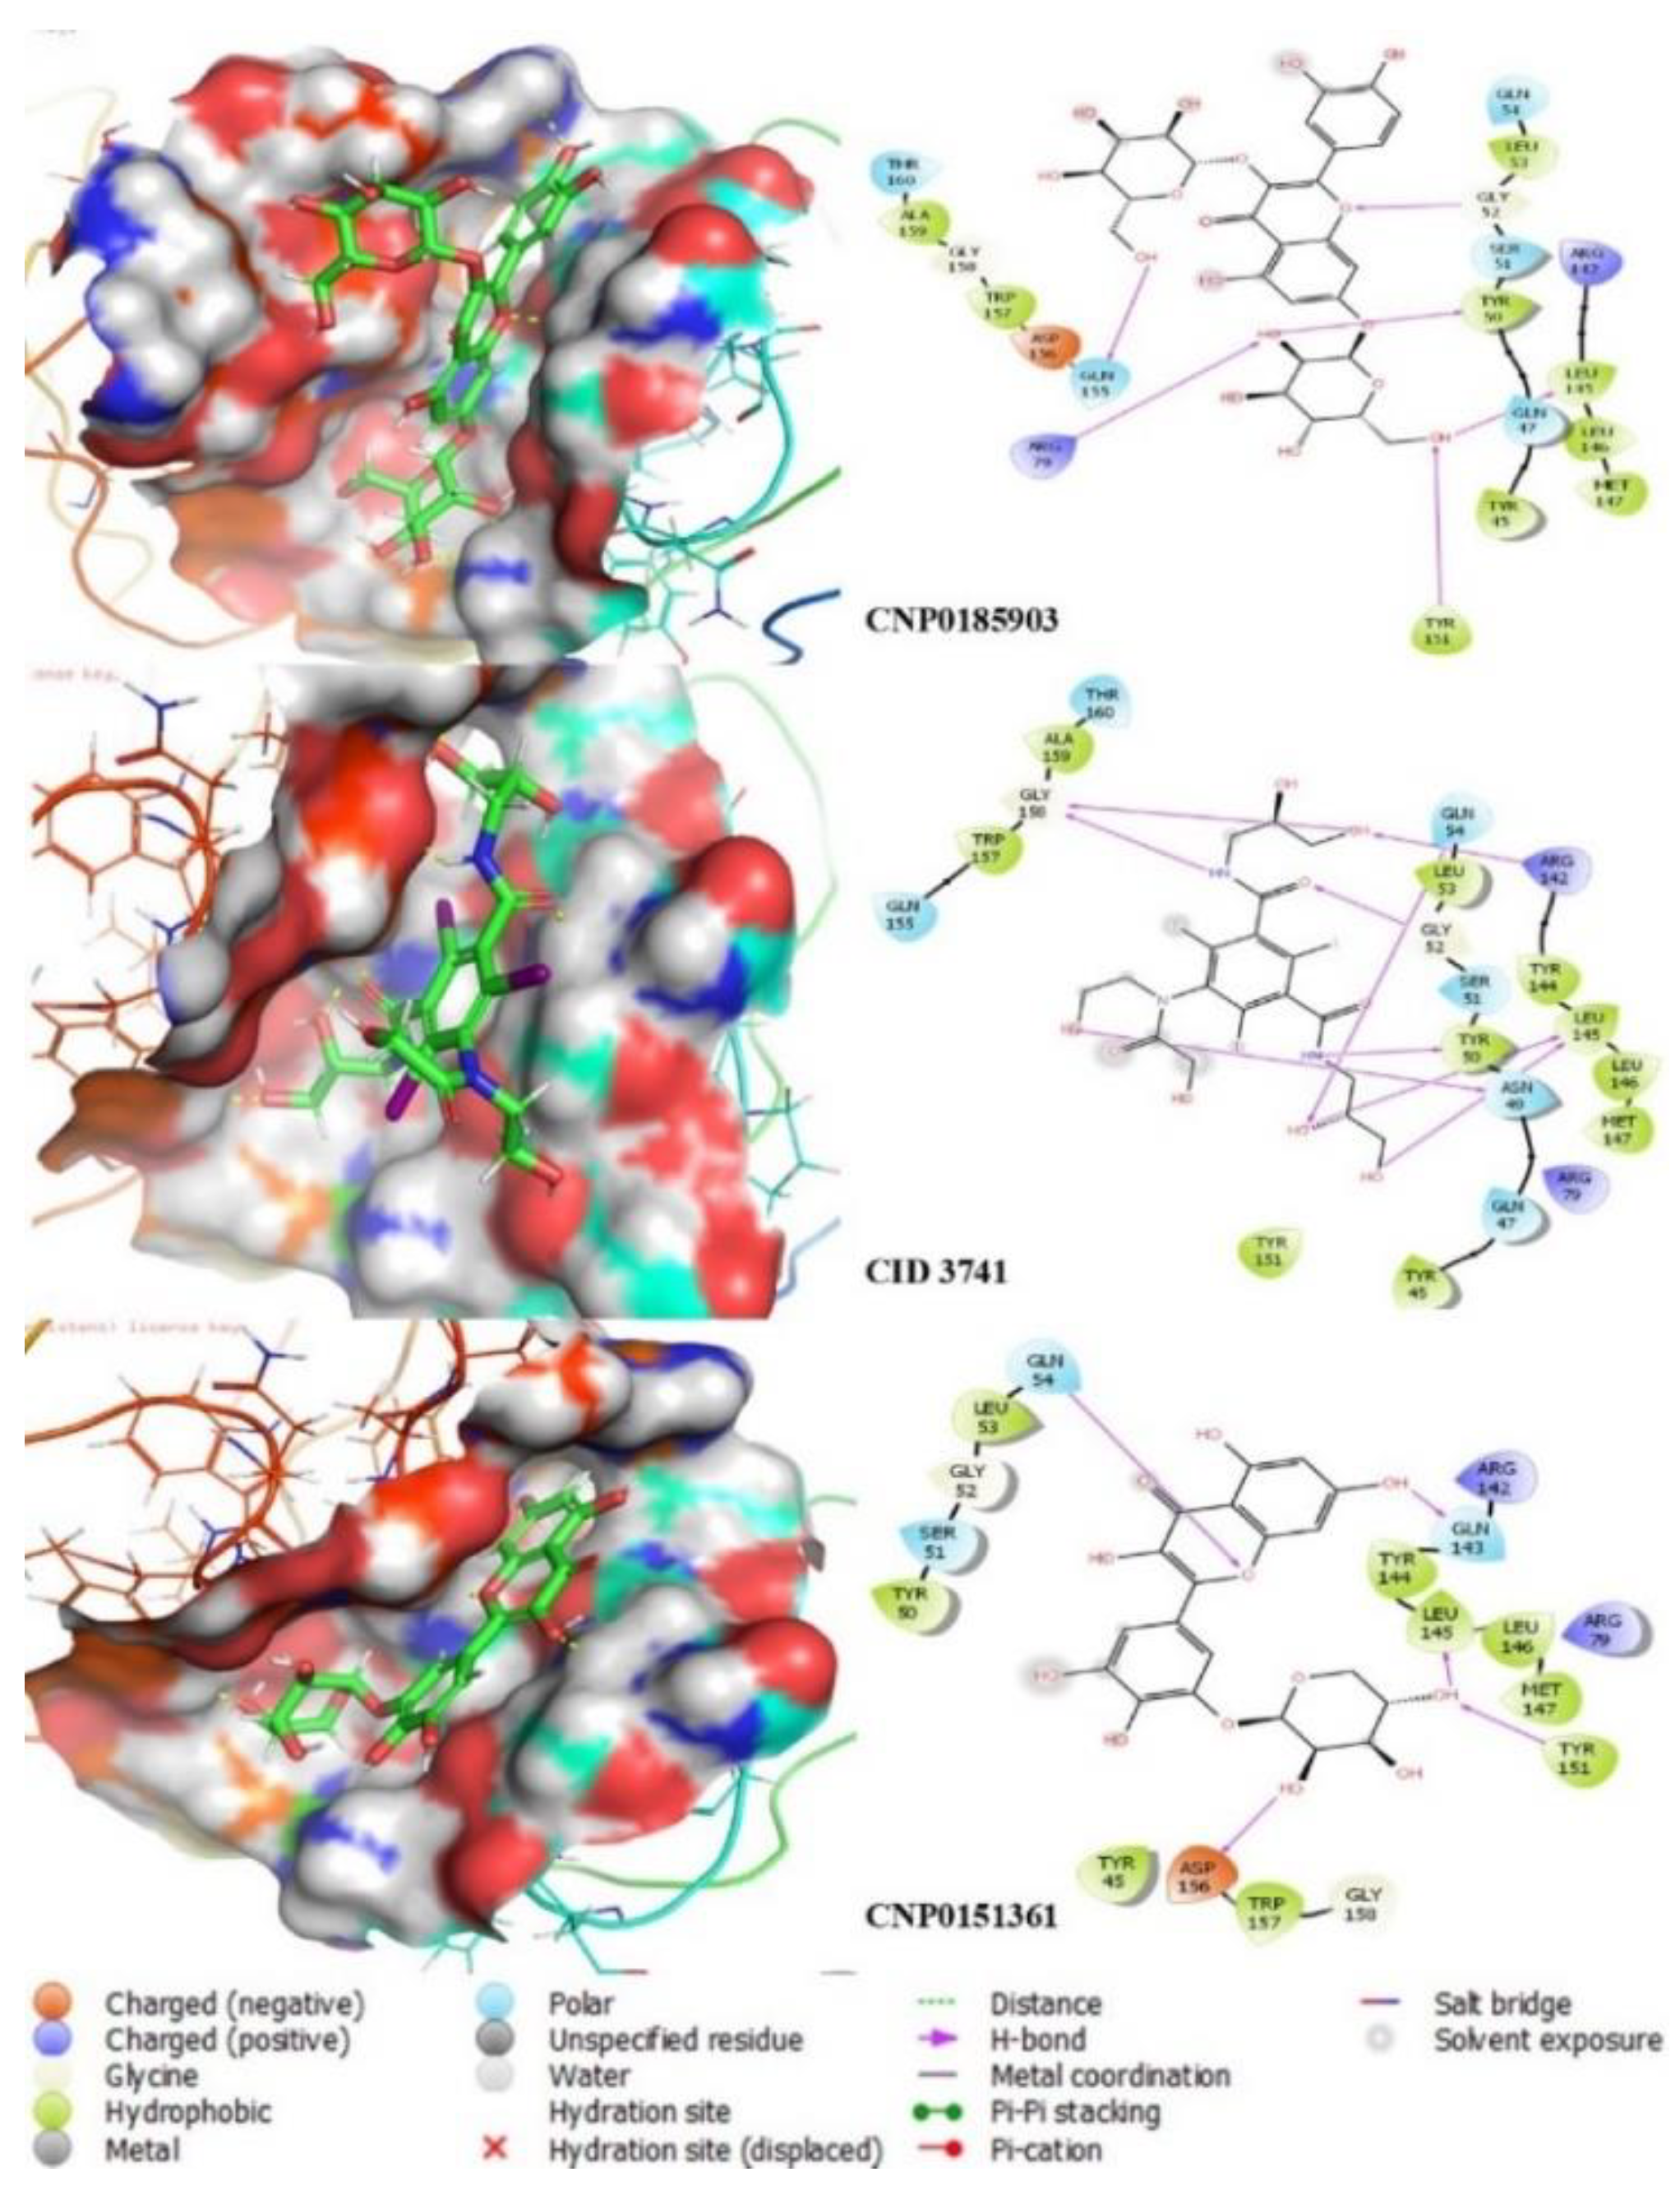
Figure 3.
Interactions of Top-Scoring Compounds with CRYGD Protein.
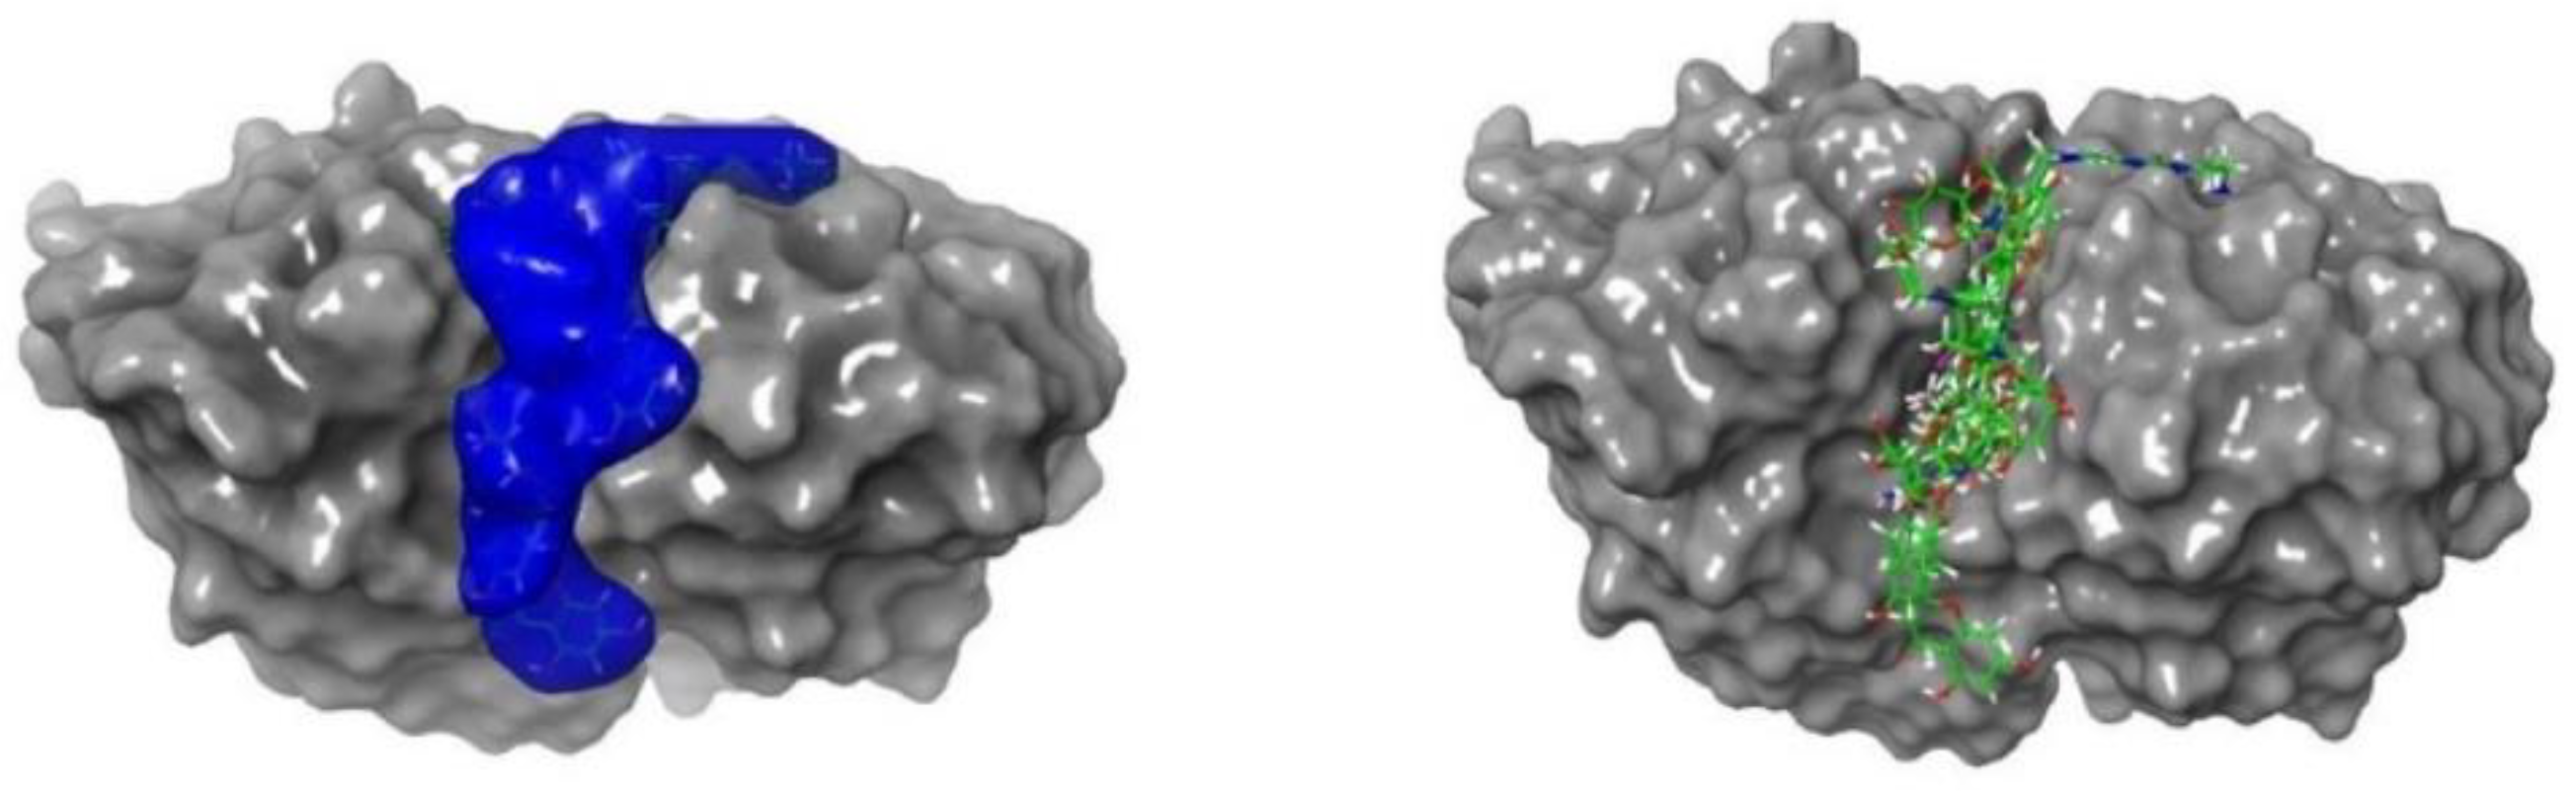
Figure 4.
RMSD analysis of apo protein (black) and its complexes with compounds CNP0185903 (red), CNP0151361 (green), and CID3741(blue) over a 100 ns molecular dynamics simulation.
Figure 4.
RMSD analysis of apo protein (black) and its complexes with compounds CNP0185903 (red), CNP0151361 (green), and CID3741(blue) over a 100 ns molecular dynamics simulation.
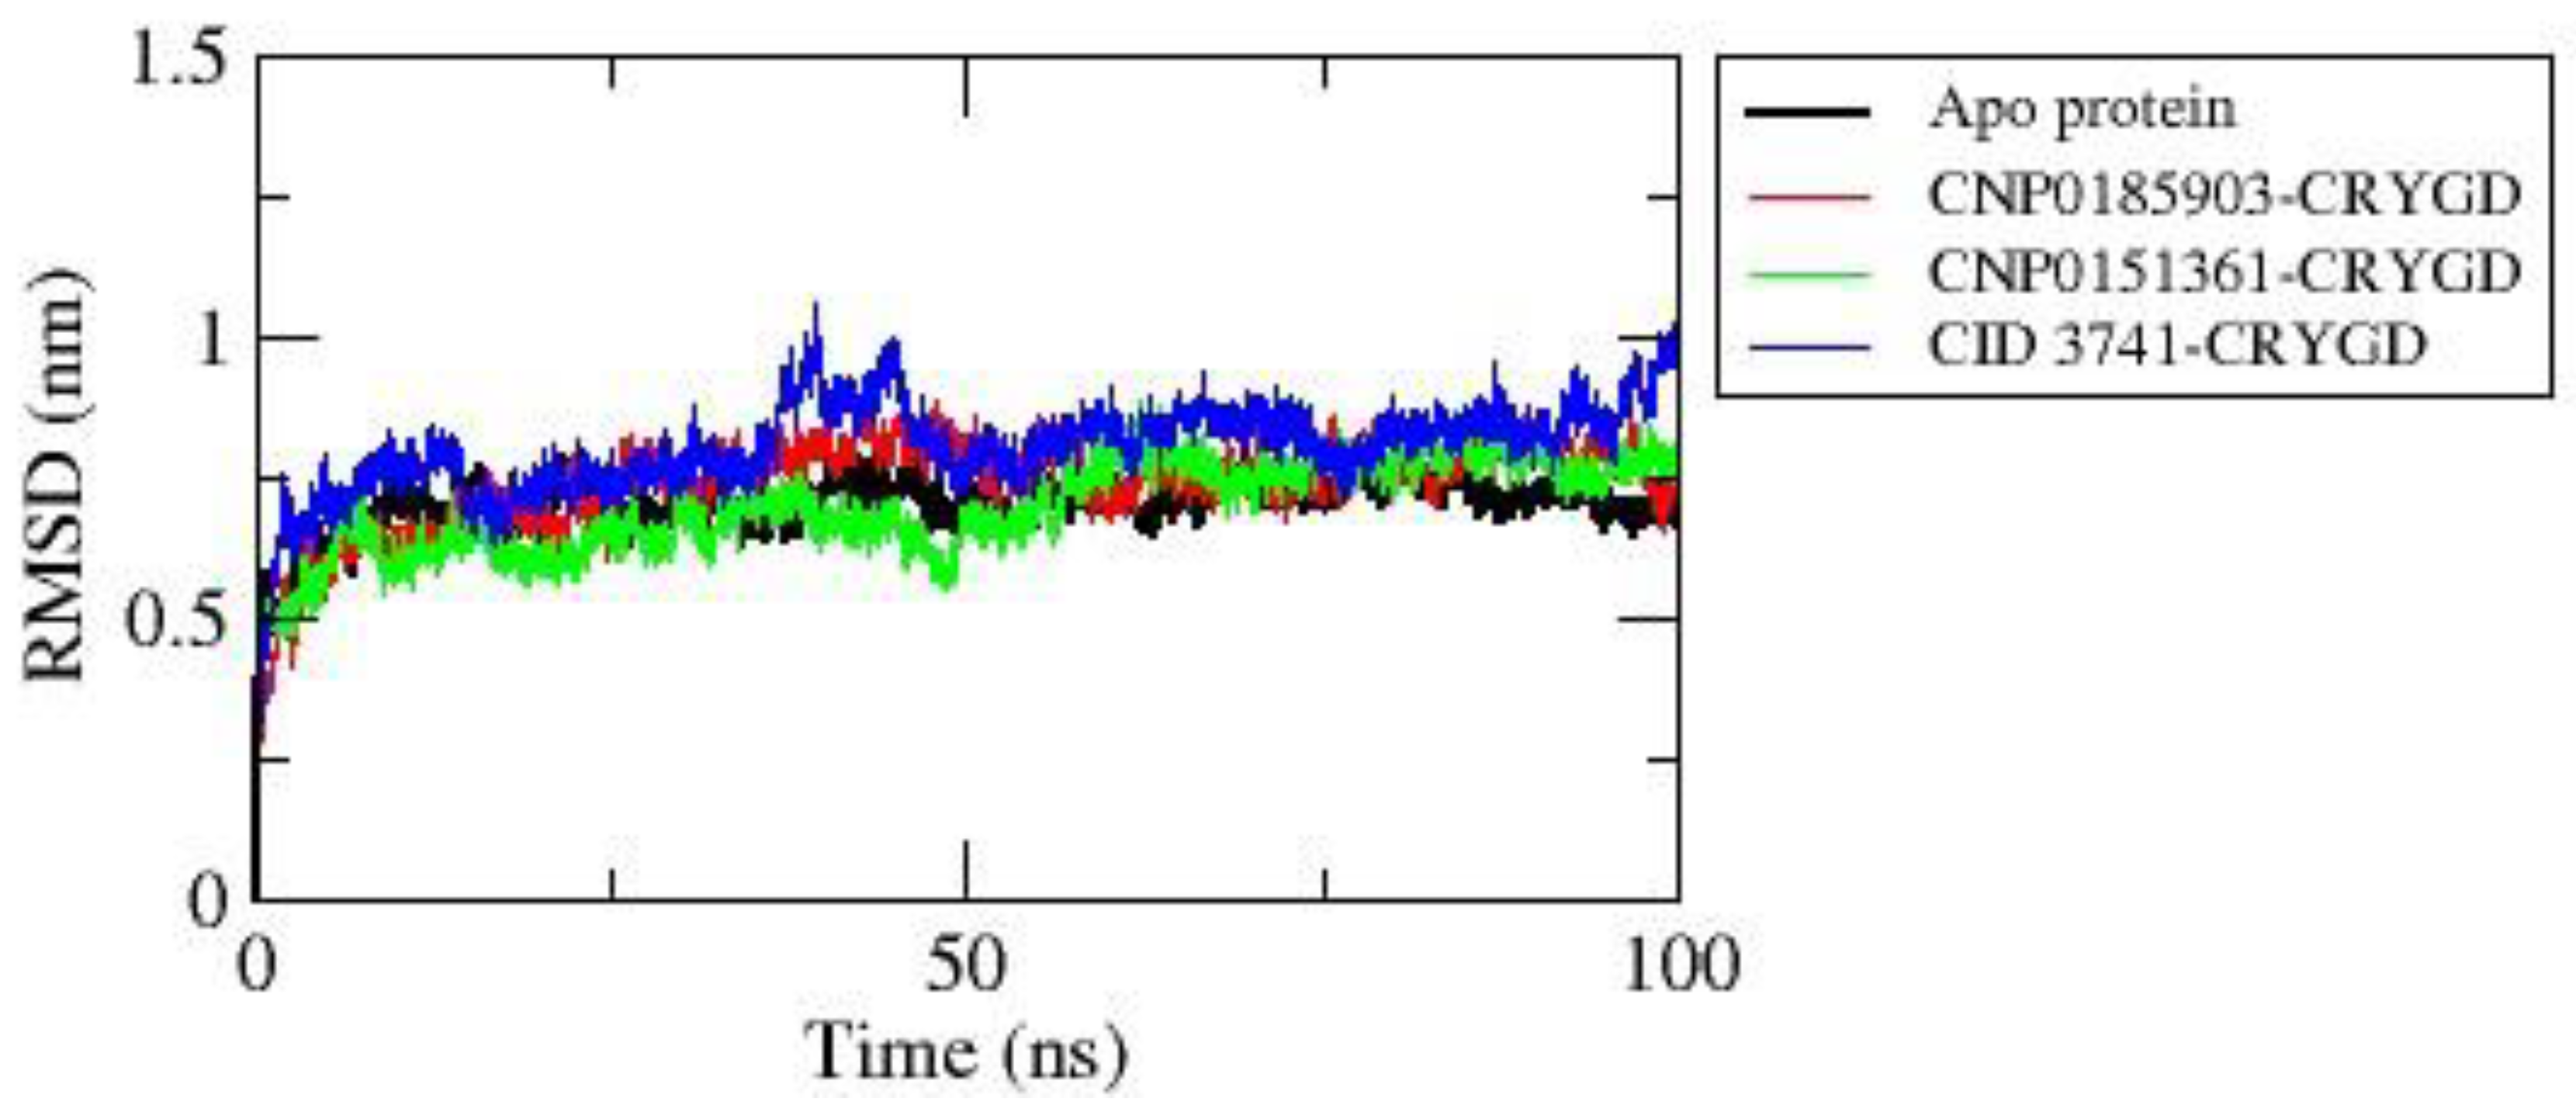
Figure 5.
RMSF analysis of apo protein (black) and its complexes with compounds CNP0185903 (red), CNP0151361 (green), and CID3741(blue) over a 100 ns molecular dynamics simulation.
Figure 5.
RMSF analysis of apo protein (black) and its complexes with compounds CNP0185903 (red), CNP0151361 (green), and CID3741(blue) over a 100 ns molecular dynamics simulation.
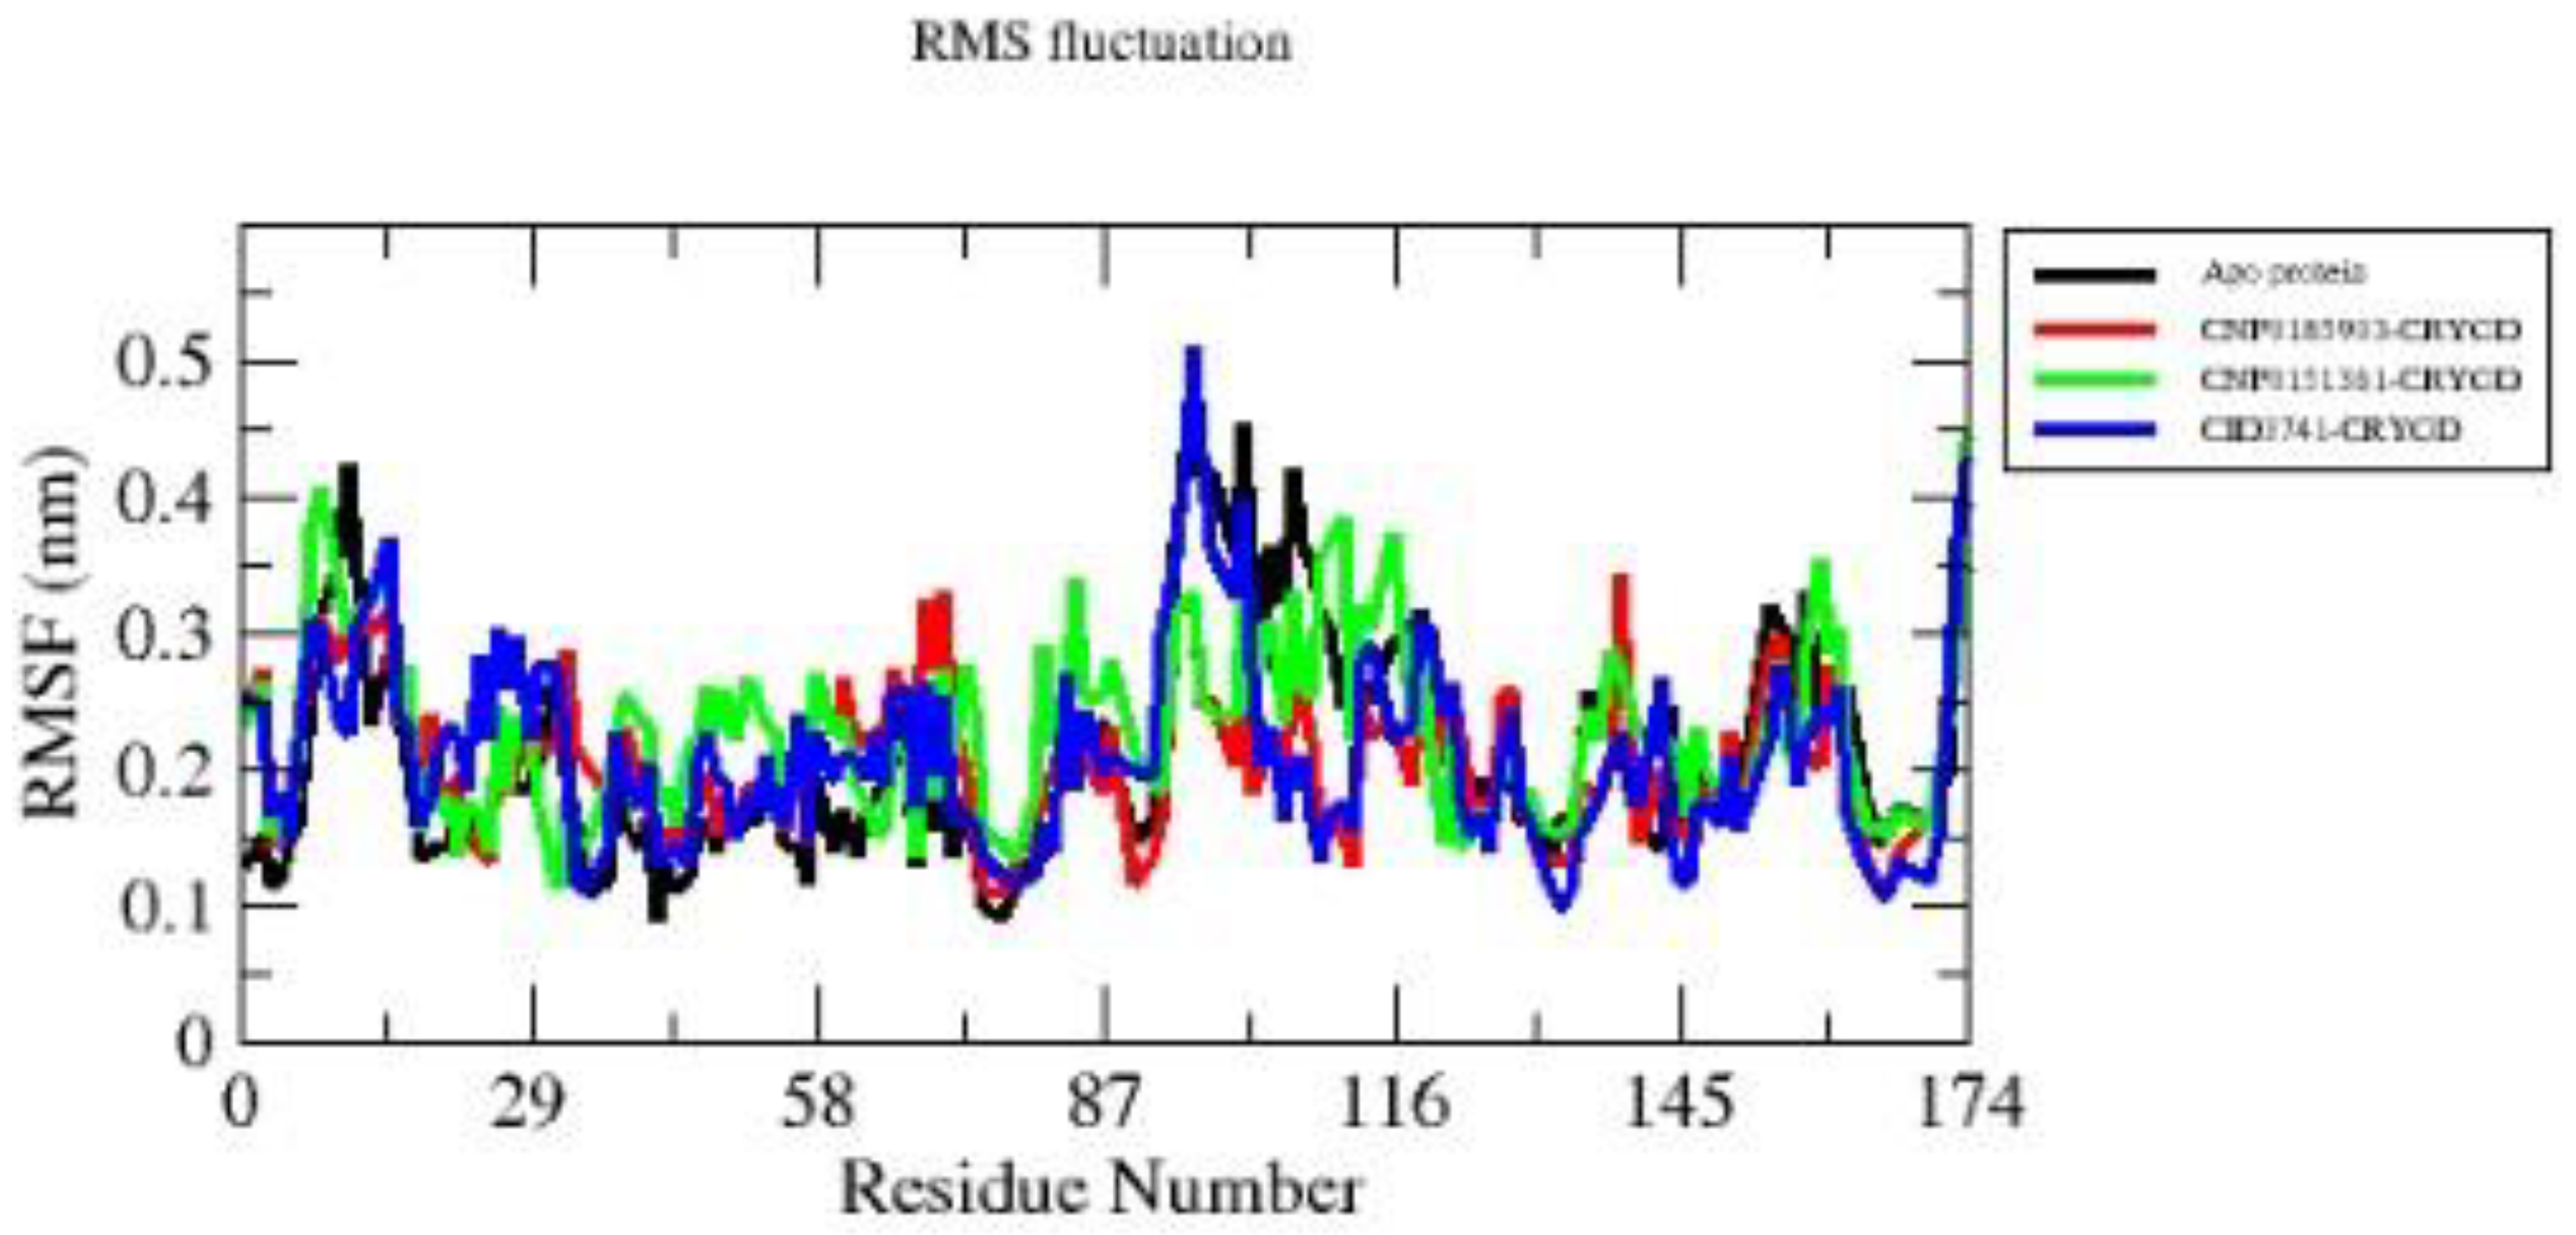
Figure 6.
Rg analysis of apo protein (black) and its complexes with compounds CNP0185903 (red), CNP0151361 (green), and CID3741(blue) over a 100 ns molecular dynamics simulation.
Figure 6.
Rg analysis of apo protein (black) and its complexes with compounds CNP0185903 (red), CNP0151361 (green), and CID3741(blue) over a 100 ns molecular dynamics simulation.
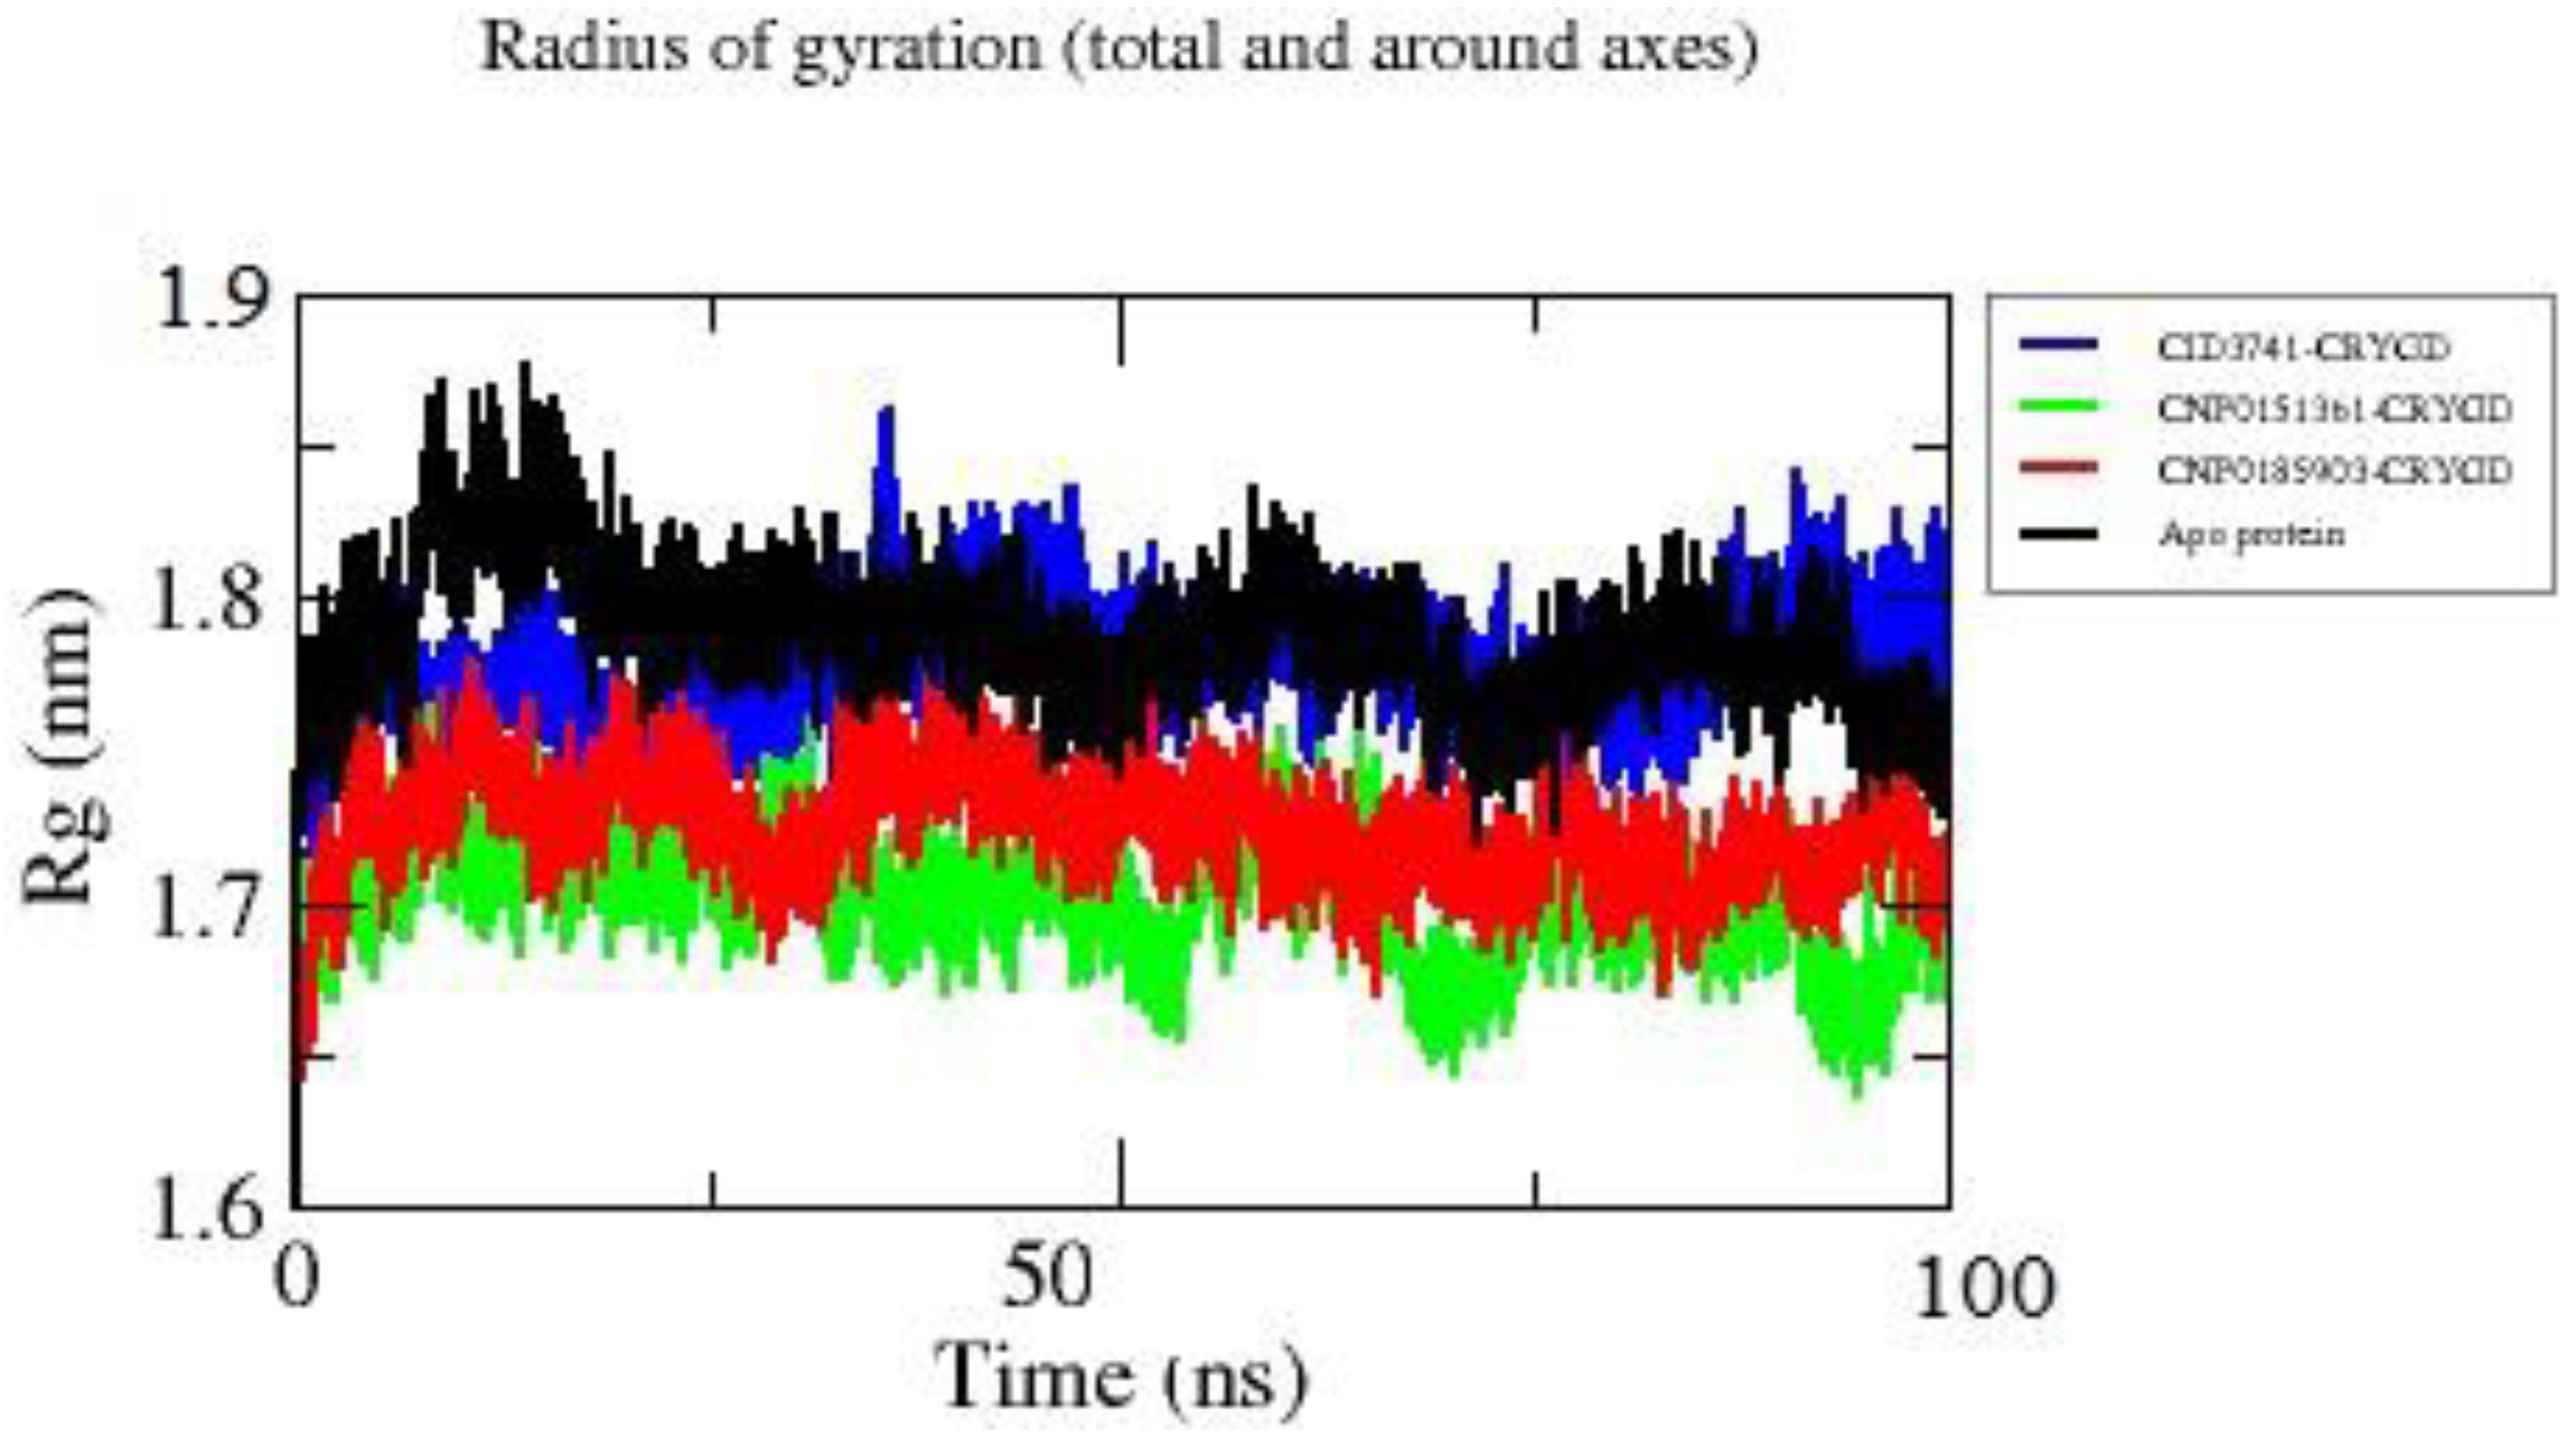
Figure 7.
SASA analysis of apo protein (black) and its complexes with compounds CNP0185903 (red), CNP0151361 (green), and CID3741(blue) over a 100 ns molecular dynamics simulation.
Figure 7.
SASA analysis of apo protein (black) and its complexes with compounds CNP0185903 (red), CNP0151361 (green), and CID3741(blue) over a 100 ns molecular dynamics simulation.
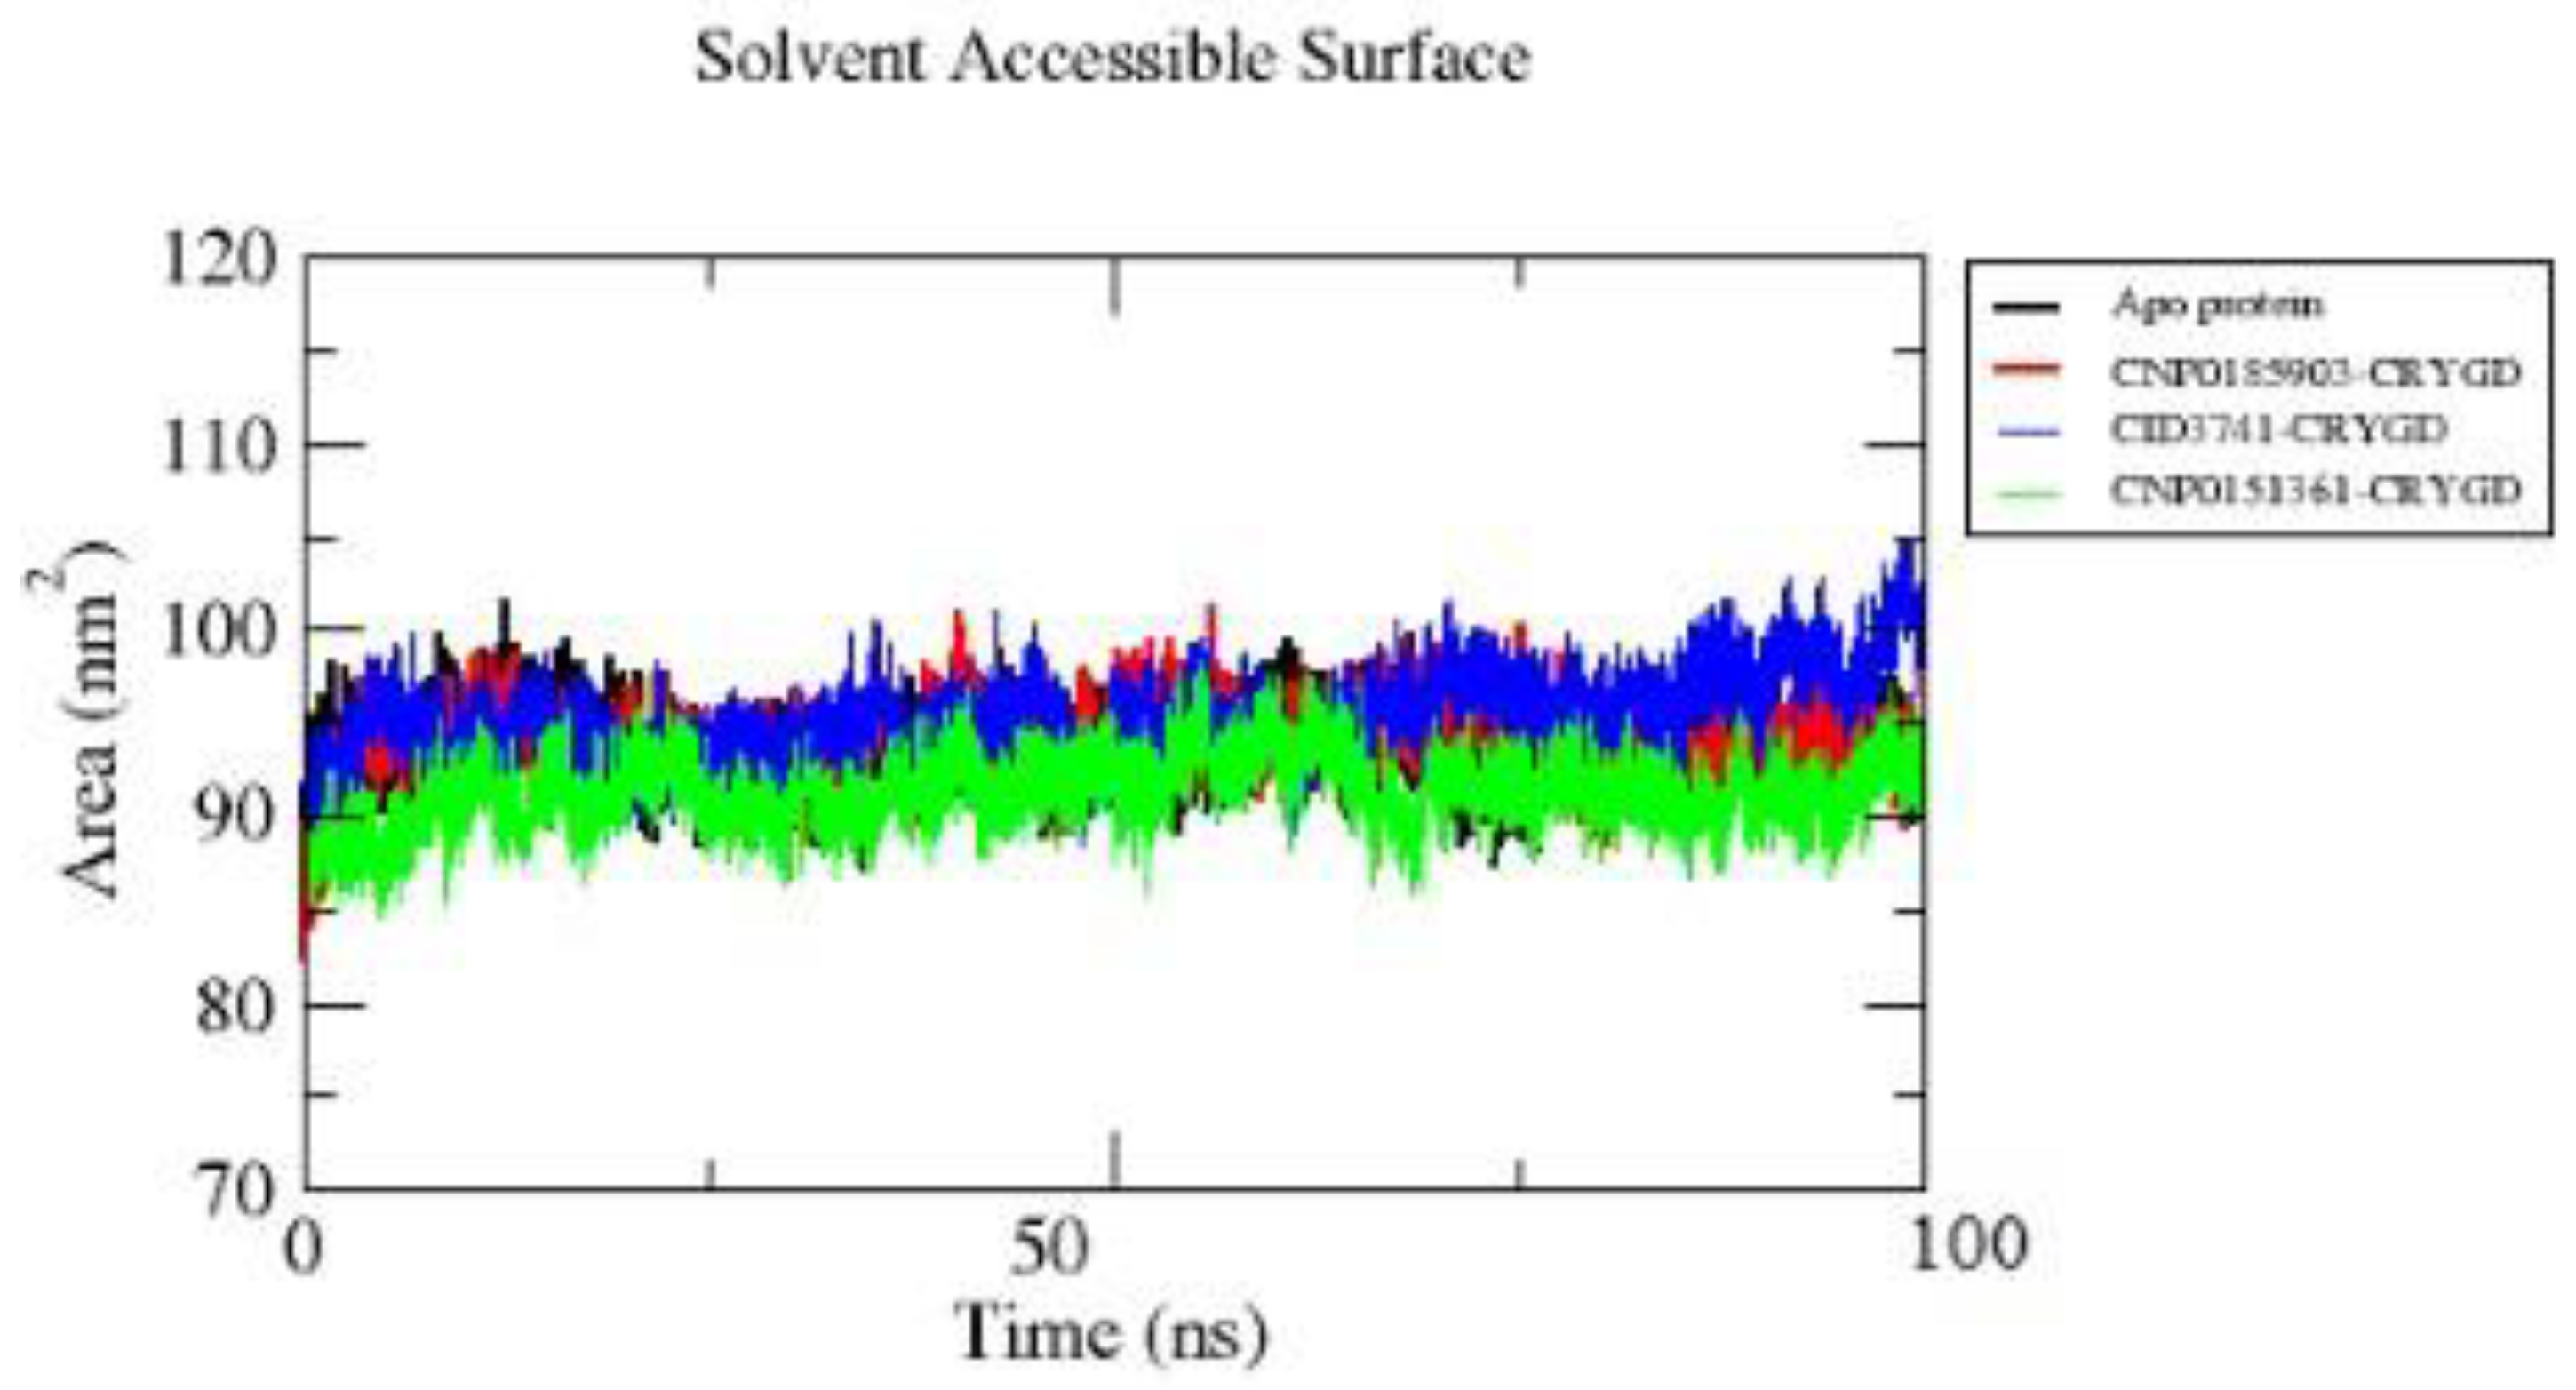
Figure 8.
PCA analysis of apo protein (black) and its complexes with compounds CNP0185903 (red), CNP0151361 (green), and CID3741(blue) over a 100 ns molecular dynamics simulation.
Figure 8.
PCA analysis of apo protein (black) and its complexes with compounds CNP0185903 (red), CNP0151361 (green), and CID3741(blue) over a 100 ns molecular dynamics simulation.
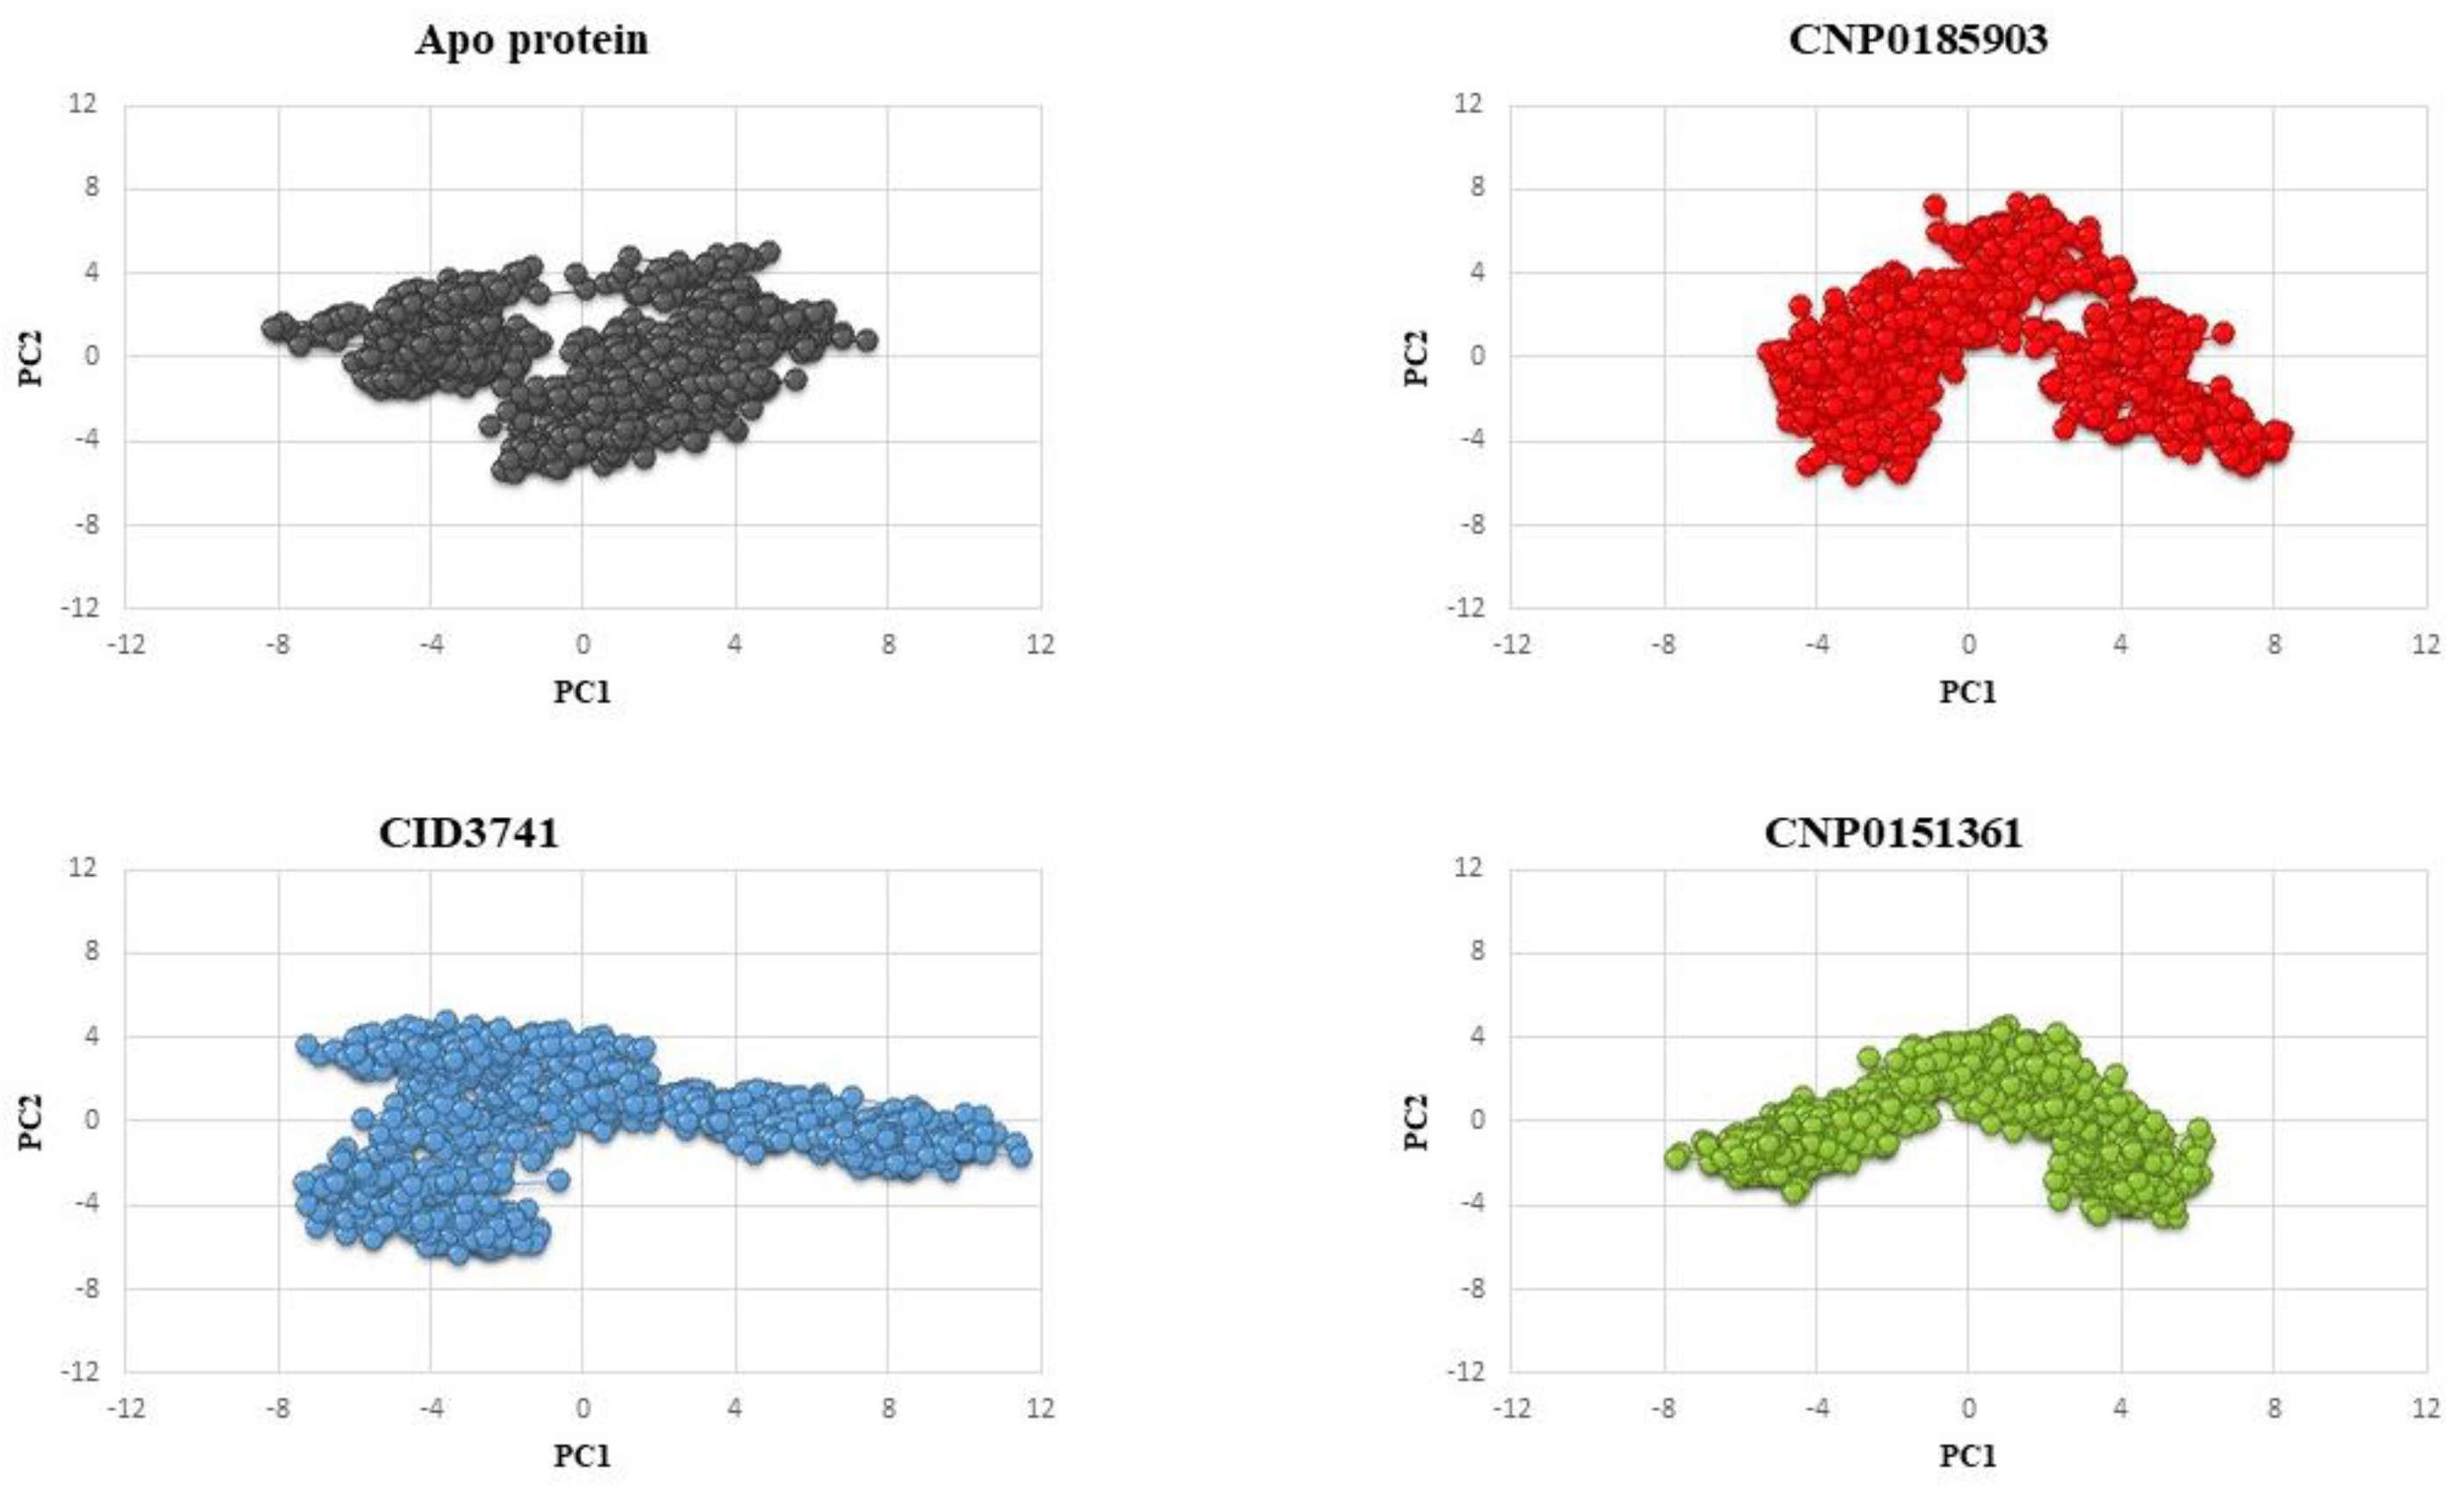
Table 1.
Compounds displaying the most favorable conformation and binding energy during the docking process.
Table 1.
Compounds displaying the most favorable conformation and binding energy during the docking process.
| Compound ID | IUPAC name | 2D Structure |
| CNP0185903 | 2-(3,4-dihydroxyphenyl)-5-hydroxy-3,7-bis({[3,4,5-trihydroxy-6-(hydroxymethyl)oxan-2-yl]oxy})-4H-chromen-4-one | 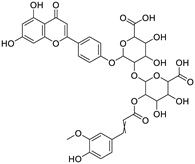 |
| 3741CID | 1-N,3-N-bis(2,3-dihydroxypropyl)-5-[(2-hydroxyacetyl)-(2-hydroxyethyl)amino]-2,4,6-triiodobenzene-1,3-dicarboxamide | 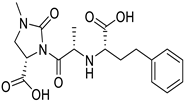 |
| CNP0151361 | 2-{3,4-dihydroxy-5-[(3,4,5-trihydroxyoxan-2-yl)oxy]phenyl}-3,5,7-trihydroxy-4H-chromen-4-one | 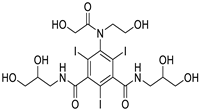 |
| ZINC000150339323 | 5-[acetyl(2,3-dihydroxypropyl)amino]-1-N,3-N-bis(2,3-dihydroxypropyl)-2,4,6-triiodobenzene-1,3-dicarboxamide | 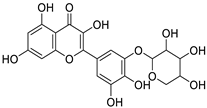 |
| CNP0113067 | 2-{3,4-dihydroxy-5-[(3,4,5-trihydroxyoxan-2-yl)oxy]phenyl}-3,5,7-trihydroxy-4H-chromen-4-one | 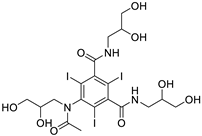 |
| 3743CID | 5-[acetyl(2,3-dihydroxypropyl)amino]-3-N-(2,3-dihydroxypropyl)-1-N-(2-hydroxyethyl)-2,4,6-triiodobenzene-1,3-dicarboxamide | 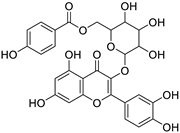 |
| 135398561CID | (2S)-2-[[4-[[(6S)-2-amino-5-methyl-4-oxo-3,6,7,8-tetrahydropteridin-6-yl]methylamino]benzoyl]amino]pentanedioic acid | 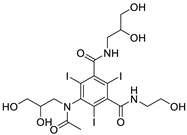 |
| CNP0312151 | 5-[(6-carboxy-4,5-dihydroxy-3-{[3-(4-hydroxy-3-methoxyphenyl)prop-2-enoyl]oxy}oxan-2-yl)oxy]-6-[4-(5,7-dihydroxy-4-oxo-4H-chromen-2-yl)phenoxy]-3,4-dihydroxyoxane-2-carboxylic acid | 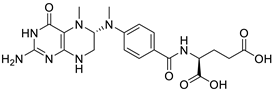 |
| ZINC000009164421 | (6R,7R)-3-[[3-amino-4-(2-aminoethylcarbamoylamino)-2-methylpyrazol-1-ium-1-yl]methyl]-7-[[(2Z)-2-(5-amino-1,2,4-thiadiazol-3-yl)-2-(2-carboxypropan-2-yloxyimino)acetyl]amino]-8-oxo-5-thia-1-azabicyclo [4.2.0]oct-2-ene-2-carboxylate |  |
| 5464344CID | (4S)-3-[(2S)-2-[[(1S)-1-carboxy-3-phenylpropyl]amino]propanoyl]-1-methyl-2-oxoimidazolidine-4-carboxylic acid | 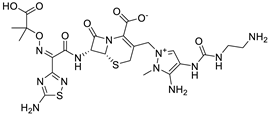 |
Table 2.
Docking, subsequent analysis post-docking, and calculation of binding free energy (MM-GBSA) for the top 10 compounds.
Table 2.
Docking, subsequent analysis post-docking, and calculation of binding free energy (MM-GBSA) for the top 10 compounds.
| Compound ID | Docking score | IFD score | Interaction residues | Number of hydrogen bonds | MM-GBSA Dg bind |
| CNP0185903 | -11.343 | -424.7 | ARG79, TYR50, GLY52, LEU145, TYR151, GLN155 | 6 | -59.93 |
| CID 3741 | -10.732 | -420.32 | LEU145 (2), ARG142, GLN54, GLY158 (2), GLY52, TYR50, ASN,49 | 9 | -60.13 |
| CNP0151361 | -10.304 | -416.9 | TYR151, LEU145, GLN143, GLN54, ASP156 | 5 | -55.32 |
| ZINC000150339323 | -10.038 | -414.9 | GLN54, LEU145, GLY52, GLN143, GLY158, ALA159 | 6 | -53.55 |
| CNP0113067 | -9.812 | -414.67 | PRO148, TYR151 LEU145, LEU145 GLN54, GLY158 GLY52 |
7 | -71.42 |
| CID 3743 | -9.579 | -415.94 | LEU145, TYR45 TYR152, ARG142, GLY52 GLY158, ALA159 |
7 | -57.33 |
| CID 135398561 | -8.702 | -411.56 | LEU145, TYR151, GLN143 GLN54, ARG142 GLY158 |
6 | -67.67 |
| CNP0312151 | -8.595 | -410.62 | ASP156, TYR45 ARG79, LEU145 TYR50, TYR50 |
6 | -75.88 |
| ZINC000009164421 | -7.502 | -411.95 | GLN54, TYR50 GLY158, GLU46(4), ARG76, SER74 |
9 | -59.79 |
| CID 5464344 | -6.574 | -409.14 | TYR50, GLY52, GLN54, GLY158 | 4 | -59.11 |
Table 3.
predicted binding sites using docking results.
| Pocket-lining residues | GLN47,GLN 54, LEU53, GLY52, SER51, TYR50, ARG79, TYR45, MET147, LEU146, LEU145, TYR151, ARG142, GLN 155, ASP56, TRP157, GLY158, ALA159, THR160, TYR144, ASN49, PRO148, GLN143, ASP21, HIS58, SER72, SER74, ARG76 |
Disclaimer/Publisher’s Note: The statements, opinions and data contained in all publications are solely those of the individual author(s) and contributor(s) and not of MDPI and/or the editor(s). MDPI and/or the editor(s) disclaim responsibility for any injury to people or property resulting from any ideas, methods, instructions or products referred to in the content. |
© 2024 by the authors. Licensee MDPI, Basel, Switzerland. This article is an open access article distributed under the terms and conditions of the Creative Commons Attribution (CC BY) license (http://creativecommons.org/licenses/by/4.0/).
Copyright: This open access article is published under a Creative Commons CC BY 4.0 license, which permit the free download, distribution, and reuse, provided that the author and preprint are cited in any reuse.


