
Submitted:
14 August 2024
Posted:
16 August 2024
You are already at the latest version
Abstract
The main objective of our study was to understand the rheological behavior of various types of cheeses with mold subjected to multiple stresses during processing/handling, transport, or storage, aiming to maintain or even improve product quality, using computer-assisted penetration methods, and advanced regression algorithms. Uniaxial penetration tests with a cone at a constant speed were conducted using a universal Hounsfield HK1S testing equipment connected to a computer to analyze the texture behavior (tangential stress, flow index, apparent viscosity) of four of the most common types of cheese with mold, depending on the cone's tip angle (9, 19, and 90°) and penetration speed (12, 30, and 60 mm/min). From the results obtained for the four categories of mold cheeses (Brie, Camembert, Dorblue, or Roquefort), the amplitude of the speed and angle of penetration were considered as the main influencing factors for the shear deformation (τc), flow index (Kf), and apparent viscosity (ηa). The moisture and firmness of the mold cheeses are closely linked and depend on the type of mold, the maturation process, or storage conditions. Careful control of these factors is essential to achieve the desired texture and taste characteristics in cheeses with mold.
Keywords:
mold
; cheese
; penetration
; apparent viscosity
1. Introduction
The global consumption of mold cheeses is on the rise as consumers around the world become increasingly interested in gourmet and high-quality food products. The cheeses with mold, such as blue cheese, Gorgonzola, Roquefort, and Brie, are valued for their distinctive taste and potential health benefits. This increase in consumption is driven by several factors, including:
I. Changing consumer preferences, with a trend towards premium and artisanal foods, and mold cheeses fit perfectly into this category.
II. Increased accessibility due to globalization and improvements in supply chains, making these cheeses now available in more markets worldwide.
III. Awareness of health benefits, with some studies suggesting that mold cheeses may have beneficial properties, such as probiotic content and anti-inflammatory properties.
IV. The popularity of gastronomy, where cooking shows, food blogs, and social networks have contributed to the popularity of mold cheeses, making them more appealing and pleasurable to consumers.
These trends suggest that mold cheeses will continue to be an important part of the global dairy market. The production of noble mold cheeses has many elements that liken it to art, and understanding the rheological behavior of the texture, how it reacts, and how to choose the right ingredients can make cheese not only extremely attractive but also accessible to many producers.
A brief classification of mold cheeses can be made into two main categories: cheeses with internal mold (e.g., Roquefort, Gorgonzola, Stilton, Dorblue) and cheeses with external mold (e.g., Brie, Camembert). Cheeses with internal mold are injected or inoculated with Penicillium roqueforti or Penicillium glaucum, which develop inside the cheese, creating a marbled appearance, while cheeses with external mold have Penicillium camemberti or Penicillium candidum on their surface, forming a white, velvety crust. In addition to frequently used alternative methods for analyzing cheeses, such as sensory analysis for evaluating the taste, smell, texture, and appearance of the cheese, high-performance liquid chromatography (HPLC) for the separation, identification, and quantification of cheese components such as proteins, fatty acids, and carbohydrates, scanning electron microscopy (SEM) used to study the microstructure of cheese at the surface level, and polymerase chain reaction (PCR) and DNA sequencing as genetic methods for identifying bacteria and fungi present in cheese, each with their advantages and areas of application, the computerized cone penetration test provides precise information about the rheological properties of cheese and helps better understand the texture and consistency of mold cheeses [1,2,3,4], which can be important for production and quality control.
A quick bibliometric search on the Google Scholar platform using the keywords “penetrometer”, “test”, “cheese”, and “mold” resulted in a total of 445 scientific research articles, by the method used Bonilla-Chaves in ref. [5]. The decision regarding the appropriate database to be used to achieve the study’s objective was based on the fact that Google Scholar is the largest, free, and easy-to-navigate search engine, with a constantly updated database, ensuring access to the latest research and publications indexed across all scientific fields [6]. Additionally, exporting data to other programs is straightforward.
It can be noted from the graph presented in Figure 1 that before the year 2005, there were 100 publications, then between 2005-2010, there was a decrease of approximately 50%, followed by a steady increase in the number of articles after 2010 (see Figure 1), reaching 109 publications in the period 2020-2024. This growth reflects both the increased academic and industrial interest in understanding the physical properties of cheese, as well as the importance of this field for improving the quality of dairy products.
The study of flow is immediately applicable to describing the properties of any cheese, as this fall within the range that exhibits both elastic and viscous properties, known as viscoelastic material. In the following period, the studies of Joshi et al. [10], Michelson [11], and Korolczuk et al. [12] highlighted, where the rheological characteristics of several processed cheeses were evaluated, such as the relaxation modulus or viscoelastic moduli, showing that the high values determined indicate their viscoelastic nature. Also, in the same period, in the ref. [13], Awad et al. noticed changes in viscosity values following treatments of cheese with added milk protein and various skim milk powder and stabilizer levels, both when fresh and after a storage period, or at work, Sharma et al. [14] presents research on the response of various cheeses to shearing speeds below 1 s-1. The authors found that to achieve conditions of constant shear, an extremely long time was necessary, primarily due to the viscoelastic nature. Continuous prolonged shearing altered the structure of the melted cheeses. During the determination of the flow curve, the effects of this change were greatly reduced by minimizing the total accumulated stress exerted on the sample.
Recently, there has been a significant increase in research in this field, including notable works, such as Ipate et al., [15], Hartmann et al. [16], Crespo et al. [17], which show that rheological properties tend to be obtained much more easily from the response of increasingly sophisticated electronic equipment. Generally, the conclusion is that the texture of the cheese is firm, but elastic and smooth, while the body of the cheese is slightly moist and often has a fine surface.
Nowadays, we observe a significant change in the forms and the way cheese is used in the mass market. Cheese needs to be sliced or shredded by high-speed cutting devices; the melting and flowing properties of the cheeses must be more carefully controlled; the intensities and flavor profiles need to be modified without negatively affecting the physical properties of the cheese [18] and cheese products must have adequate stability, often under varying environmental conditions. This multitude of desired requirements significantly increases both the need for control procedures for certain properties and the necessity of applying appropriate methods to specifically measure these properties [19,20,21].
Understanding the value of deformation amplitude, as well as the intensity of the stresses that cause them, thus becomes an important aspect in implementing strategies for the production of innovative cheeses recently introduced to the market (vegan cheeses made from plant-based ingredients; with functional additions enriched with probiotics, vitamins, minerals, or other ingredients; with unique flavors such as truffles, hot peppers, black garlic, or various exotic herbs and spices; matured in controlled environments to develop distinct flavors and textures) and which reflect current trends in the food industry, focusing on health, sustainability, and unique culinary experiences [22].
The purpose of this paper includes the development of an innovative digital method that can be easily implemented to quantify the rheological behavior of mold cheeses, in terms of their resistance to various stresses, to ensure their quality during packaging, transport, and storage processes. The quality of the products requires a balance between the use of appropriate packaging materials, control of environmental conditions, and proper handling. Correct stacking of products to evenly distribute weight and prevent excessive pressure on certain points is crucial. By implementing these preventive measures, the risk of deformation can be reduced, and the integrity of the final product for consumers can be maintained.
2. Materials and Methods
2.1. The Hounsfield Mechanical Testing Equipment
The Hounsfield mechanical testing equipment (Figure 2a) is a fully automated system designed by the British company Hounsfield (Redhill, RH51 DZ, England) for use in research departments and quality control, to quantify the characteristics of food products in accordance with international standards such as ASTM, ISO, and others [23]. It is used to determine essential mechanical properties of materials, such as tensile strength, elasticity modulus, yield point, and breaking strength. The equipment is mounted securely on a workbench and offers a range of functionalities that make it ideal for applications requiring continuity and safety. The main components of the Hounsfield mechanical testing equipment are:
- Main frame, the basic structure that supports all other components of the equipment;
- Drive unit, a system consisting of an electric motor and a screw transmission to apply the necessary force to the sample;
- Load cell, the sensor that measures the force applied to the sample;
- Clamping devices (clamps), which secure the sample in the testing position;
- Control and display system, which includes a computer or a controller that allows the user to set the test parameters and monitor the data in real time;
- Extensometer, a device used to measure the deformation of the sample during the test;
- Hounsfield equipment software streamlines the testing and material analysis process, providing precise and easy-to-interpret results. It allows for the configuration and control of mechanical tests, setting parameters such as the speed of load application, load limits, and test endpoints.
In all experiments conducted, the Hounsfield equipment, model 1kS (accuracy: ±25 mN in force, ±10 µm in displacement), equipped with a 1000 N force transducer was used (Figure 3).
Essentially, this device consists of a fixed lower plate and a movable bar on which the force transducer is mounted. The movable bar can move vertically at various constant speeds (0.1-500 mm/min, in 0.1 mm/min steps). The force required for deforming the product is recorded directly by the computer of the equipment as a function of time. By using different measurement geometries, uniaxial compression tests were conducted. Essentially, with this equipment, a constant load is applied to a sample (Figure 2b and c), and the variation in the height of the sample over time is measured with the help of a displacement transducer [24].
2.2. Load Cell
The HTE 1kN force sensor (see Figure 3) is a device used for measuring force in a variety of mechanical testing applications. It is often used in combination with universal testing machines to evaluate the mechanical properties of materials, such as resistance to penetration, compression, and flow [25]. It can measure forces up to 1 kN, making it ideal for tests that require precise measurements of small to moderate forces. The sensor provides high-resolution measurements of the applied force, as it is designed to minimize errors and deliver consistent and reliable data. It can be easily integrated into various testing applications due to its standardized interfaces. Built to withstand harsh and repeated testing conditions, the sensor self-calibrates at regular intervals to ensure measurement accuracy. The compensation algorithms used in signal processing minimize the effects of interference, ensuring reliable measurements, which is particularly important. Table 1 briefly presents the technical and functional characteristics of the sensor.
2.3. Penetration Cones
Figure 4 shows the penetration cones used in experimental tests. Each of these cones is designed to meet different requirements in mechanical testing, depending on the materials being tested and the nature of the test being conducted [26,27,28]. The choice of tip angle is essential for obtaining accurate and relevant results based on the properties of the materials being tested.
The image in Figure 4 shows the three cones with different geometries, each having a distinct tip angle, used in experiments. Making a brief analysis, based on the distinct tip angle, it can be specified:
(a) Tip angle of 9 degrees. This cone has a very sharp tip angle (Figure 4a). Its geometry suggests that it is used for fine and precise penetration into the material. It is suitable for soft materials or for tests that require minimal penetration with a very acute angle.
(b) Tip angle of 19 degrees. This cone has a moderate tip angle, larger than the 9-degree one but still relatively sharp (Figure 4b). It can be used for tests that require deeper penetration than the 9-degree cone, while still maintaining a certain level of precision. It is appropriate for slightly harder materials.
(c) Tip angle of 90 degrees. This cone has a wide tip angle of 90 degrees (Figure 4c). It is the least sharp of the three. It is used for penetrating harder materials or for tests that require a larger contact surface at the point of penetration. It can be useful in evaluating materials that require high resistance to deformation.
The geometric constant of the cone, kcone is obtained from the diagram of the forces acting on the sample during penetration (Figure 4d) and is calculated using the relation [19]:
where, α represents the tip angle of the cone.
The forces acting on the material, as shown in the diagram in Figure 4d, are the penetration force (Fp), the normal force (Fn) which generates normal stresses (σ), and the tangential force (Ft) which generates tangential/shear stresses (τc); the surface area of the material in contact with the cone is denoted by A, and h is the penetration depth.
2.4. The Cheeses Varieties
The cheeses Camembert, Brie, Dorblue, and Roquefort used in this study were purchased from a local supermarket, being four of the most commonly sold varieties in the local retail market. A brief description of these cheeses is provided below:
(a) Camembert cheese (Figure 5a) originates from France, in the Normandy region. Its main characteristic is a soft and creamy texture with a thin, edible white rind of Penicillium candidum mold, featuring small brown spots. The taste is delicate, and creamy, with notes of mushrooms and a slight bitterness. The traditional shape is a small cylinder approximately 10-12 cm in diameter and 3 cm in height. The flavor is complex, becoming more intense as the cheese matures, including earthy and mushroom notes. It is usually consumed as is, with bread and fruit, but can also be used in various culinary recipes, such as tarts, salads, or melted in different dishes. It is typically wrapped in wax paper.
(b) Brie cheese (Figure 5b) also originates from France, but in the Île-de-France region. It has a soft, creamy texture similar to Camembert, with a uniform white rind of Penicillium candidum mold, without visible spots. The taste is rich and creamy, slightly buttery, with notes of nuts and mushrooms. It is available in larger wheels than Camembert, with a diameter of up to 36 cm and a height of approximately 2.5-4 cm. The flavor is subtle but intensifies as the cheese matures. Like Camembert, it is consumed as is or can be used in various culinary dishes. It is also very popular on cheese platters and at festive events.
(c) Dorblue cheese (Figure 5c) originates from Germany. It is characterized by a semi-soft texture with blue veins of Penicillium roqueforti mold. The flavors are varied, ranging from spicy, mildly spicy, to salty, with a distinct blue mold aroma. It usually takes the form of a cylinder or wheel, with blue veins running through the cheese. The strong, penetrating blue mold aromas become more intense as the cheese matures. It is ideal for cheese platters but also in salads, sauces, and various culinary dishes, including pasta and meat.
(d) Roquefort cheese (Figure 5d) originates from France, in the Roquefort-sur-Soulzon region. It is distinguished by its semi-hard, crumbly texture with blue veins of Penicillium roqueforti mold. The taste is spicy, salty, with a subtle sweetness and a distinct blue mold aroma. It is available in cylindrical shapes, with characteristic blue veins spreading irregularly through the cheese. The flavors are complex, spicy, and earthy, with blue mold notes. It is usually consumed as is, with bread, fruit, and sweet wines. It is also used in various culinary recipes, such as sauces, salads, and dishes based on meat and fish.
These cheeses are appreciated not only for their distinct flavors but also for their varied textures and aromas, which can transform any meal into a unique gastronomic experience.
2.5. Moisture Content
The determination of the cheese drying curves was carried out using the Radwag MAC 110 (Poland) halogen lamp moisture analyzer, a precise and efficient instrument specifically designed for measuring moisture loss in cheese samples, by the AOAC (Association of Official Analytical Chemists) Method 925.10 and ISO 1442 standards. Data saving to external files was done using the Rad_key software, a simple application that allows for the collection of data regarding the weight indicated by the Radwag moisture analyzer (with a precision of 1 mg) to a computer via an RS 232 serial communication interface.
The moisture content (Um) of the sample as a percentage of the wet weight is calculated using the following formula:
where, Mm is the mass of the wet material (initial mass 100%), and Ms is the mass of the dry material.
The dry matter content (Dc) of the sample, as a percentage of the wet mass, was calculated as the ratio between the mass of the dry material and the reference value, expressed as a percentage:
The pH values were determined using a portable digital pH meter developed within the department (pH sensor with an electrode for semi-solid products and a Raspberry Pi 4 board) in accordance with the AOAC Official Method 981.12 (pH of Acidified Foods). The fat content, protein content, and energy values were determined using standard methods by the manufacturers and are summarized in Table 2.
According to the above, this study aimed to characterize the variety of mold-ripened cheese that is processed before being used by final consumers. Therefore, the temperatures studied included the range of values normally found in the ambient environment, between 22 and 30°C. An increase in temperature above 30°C can lead to melting and fat separation, an undesirable reaction during processing.
2.6. Software
For the test configuration, we used the specialized software of the Hounsfield QMat equipment, version 5.50p (Figure 6).
The software’s TestScript test generator allows for the development of a testing routine for cheese sample penetration by controlling the movement speed of the movable plate and the penetration force. During each test, the software generates a diagram, as will be seen below, representing the force application curve over time or deformation. The maximum penetration depth was set at 15 mm [29,30]. The penetration speeds were 0.2, 0.5, and 1.0 mm/s, and the cone angles were 9°, 19°, and 90° (and presented above). The cones were made of metal material (bronze and steel). The maximum load gauge of the force transducer of the penetrometer was 900 N. The sensor’s output signal, proportional to the voltage/force (1.4 V/N), was digitized by a CAN-RS232/RS485 serial converter, and transmitted to the control unit processor, which was connected to an Intel Pentium 4 computer (Frequency: 1.3 GHz–3.8 GHz) via the RS232 interface. The data acquired in the QMat 5.50 program were exported for processing and analysis in Microsoft Excel.
The cheese samples were kept in a refrigerator at a temperature of 8°C ± 1°C for 2 days after purchase. The ambient temperature during the study was 21°C ± 1°C. The penetration tests were performed after removing the packaging for each cheese variety. Adapting the method proposed by Korolczuk and Mahaut [19], three penetration tests were conducted in three different locations in the central part of the sample for each cone and each penetration speed. When tested very close to the edge of the product, the original consistency of the cheese seems to be significantly weakened [31,32].
2.7. The Statistical Analysis
The statistical analysis performed on the experimental results using the “Statistics and Machine Learning” toolbox of the Matlab R2024a program (Mathworks Inc., USA, License No. 41055472 shows how significant are differences between categories (groups) tested using t-test, two-way analysis of variance (ANOVA), and analysis of covariance (ANCOVA). For each type of cheese, it was determined whether the average penetration forces depended on the tip angle of the cone or its movement speed.
3. Results
The experiments were conducted in the Laboratory of Rheological Properties of Food Products, located at the Faculty of Biotechnical Systems Engineering, National University of Science and Technology POLITEHNICA Bucharest.
3.1. The Visual Inspection
The visual inspection of the tested cheeses revealed the following aspects: (a) Camembert—The cheese has a round shape, is covered with a white mold crust, and is wrapped in wax paper. The crust is thin and shows small brown mold spots. (b) Brie—The cheese has a triangular shape, is covered with a white mold crust, and is in a cardboard package. The crust is uniform, without visible spots. (c) Dorblue—The cheese has a triangular shape, with visible blue mold distributed throughout the cheese mass. The texture appears denser and has a yellow color. (d) Roquefort—The cheese has a triangular shape, with visible blue mold throughout the mass. It is placed in a plastic support to maintain its shape.
3.2. Penetration Tests
The images in Figure 7a-c shows the results of the penetration tests (Qmat program screenshots) for Camembert, Brie, Dorblue, and Roquefort cheeses using a 9-degree cone at speeds of 12 mm/min (Figure 7a), 30 mm/min (Figure 7b), and 60 mm/min (Figure 7c).
The graph in each section presents the force (N) as a function of the penetration depth (mm). Several specific observations can be drawn from their analysis, namely:
- Camembert (speed 12 mm/min): The force increases steadily with the penetration depth up to approximately 10 mm, after which it stabilizes; the maximum displacement reached at the maximum force is 13.70 mm.
- Brie (speed 30 mm/min): A steeper increase in force is noted compared to Camembert, reaching a plateau after approximately 9 mm; the maximum force is reached at the maximum displacement of 13.19 mm.
- Dorblue/Roquefort (speed 60 mm/min): The increase in force is even steeper, reaching a plateau after approximately 8 mm, and the maximum force is reached at the maximum penetration depth of 12.30 mm. The increasing the penetration speed leads to a more rapid increase in the applied force, indicating greater resistance to initial deformation. This is especially evident at the speed of 60 mm/min for Dorblue/Roquefort.
Regarding the texture and consistency of the cheese, it was observed:
- Camembert, having a softer texture, shows a smooth increase in force;
- Brie, being slightly firmer, exhibits a more rapid increase in force;
- Dorblue, with a denser structure and higher mold content, presents the greatest resistance to penetration;
- Roquefort shows the lowest values of resistance to penetration, mainly due to its crumbly structure.
The rheological behavior of cheeses with a softer texture (Camembert) reveals that they have lower resistance to penetration, while those with a firmer and denser texture (Dorblue) show greater resistance. The penetration speed significantly influences the measured force and should be taken into consideration when evaluating the consistency of the cheeses.
As a result of processing the data from the experiments, the average penetration force values for each variety of cheese were obtained, for each geometric configuration of the cone, and each specified speed. Figure 7d-f show the average penetration force values obtained from the experiments over time for the four types of cheese (Camembert, Brie, Dorblue, and Roquefort) using a 9-degree cone at three different speeds: 12 mm/min, 30 mm/s, and 60 mm/s. A more detailed interpretation of the results for each graph is presented in the following section.
In Figure 7d (with the cone moving at a speed of 12 mm/min), we observe that the Camembert cheese starts with a low force, gradually increasing over time, reaching approximately 0.9 N in 80 seconds; Brie cheese behaves similarly to Camembert but slightly lower, peaking around 0.8 N; Dorblue cheese starts with a low force value, increases relatively steadily, and peaks around 0.7 N; in contrast, the Roquefort variety starts with a higher initial force and consistently increases, reaching approximately 0.6 N at the end.
The graph in Figure 7e presents the results for the cone moving at a speed of 30 mm/min. The Camembert variety shows a sharp increase in force, reaching approximately 1.1 N in about 30 seconds; the Brie variety, close to Camembert, reaches a maximum force around 1.0 N; Dorblue cheese shows a steady increase, reaching approximately 0.9 N, while Roquefort cheese has a lower force compared to the others, peaking around 0.7 N.
The graph in Figure 7f presents the average penetration force values calculated for a speed of 60 mm/min. For Camembert, a rapid increase in force is observed, reaching a peak of approximately 1.2 N in 15 seconds; for Brie, the force increases rapidly and similarly, reaching just below Camembert, around 1.1 N; for Dorblue, a rapid increase in force is noted, reaching a peak of approximately 1.0 N, while for Roquefort, the lowest force is reached, around 0.8 N.
A general observation regarding the impact of the 9-degree cone tip speed on the penetration force is that as the speed increases, the required penetration force increases for all varieties of cheese. The comparison between the cheese varieties indicates that Brie and Camembert tend to require the highest penetration forces at all speeds, Dorblue consistently requires a moderate force, and Roquefort always requires the lowest force among the four. These results indicate the differences in texture and firmness of the cheeses, with Camembert and Brie being firmer than Dorblue and Roquefort, especially at higher penetration speeds.
In Figure 8, the images show two sets of graphs comparing the force-penetration depth behavior (Figure 8a, b, and c) and the force-time behavior (Figure 8d, e, and f) of different types of cheese (Camembert, Brie, Dorblue, and Roquefort) under varying conditions of the cone speed with a 19-degree tip angle (12 mm/min, 30 mm/min, and 60 mm/min, respectively).
The first set includes three graphs (Figure 8a, b, c) that display the resistance force to penetration (N) of the cheeses as a function of penetration depth (mm) for the 19° cone, showing a similar behavior to the previous one. As the penetration depth increases, the force required for penetration also increases. The different varieties of cheese exhibit varying levels of resistance to penetration, which become more pronounced at greater penetration depths.
The second set includes three graphs (Figure 8d, e, f) that compare the variation in penetration resistance force (N) over time (s) for the same varieties of cheese under different test conditions. Figure 8d shows the response at a speed of 12 mm/min; the force gradually increases over time for all types of cheese, with distinct differences in force values. Figure 8e presents the response at an intermediate speed of 30 mm/min; the force values increase more quickly compared to the lower speed, more clearly highlighting the differences in resistance between the types of cheese. The response of the four cheese varieties (Camembert—violet; Brie—light blue; Dorblue—orange; Roquefort—dark blue) to a higher cone penetration speed of 19° at 60 mm/min is presented in Figure 8f. The force values increase rapidly, indicating greater resistance, with the differences between the force responses of the various cheeses being evident.
The images in Figure 9a-c display the three graphs (QMat software screenshot) resulting from testing the penetration resistance of the cheeses at the three proposed speeds, using a 90-degree cone.
A detailed analysis of each graph, which shows the variation of the applied penetration force Fp [N] as a function of the cone’s penetration depth into the sample (mm), is presented below.
The curves in Figure 9a show how the force increases as the cone moves; initially, all the curves have a low slope, indicating low initial resistance, but after approximately 8 mm, the force increase becomes more pronounced, suggesting increased material resistance. In Figure 9b, the curves indicate a slight initial increase in force, followed by a significant increase after 7-8 mm; there are variations between samples, but the general trend remains consistent with a sharper increase after a certain point of penetration. Similar to the other graphs, the curves in Figure 9c show a small initial increase in force, followed by a sharp increase after approximately 7-8 mm. There is some consistency between the different samples, indicating similar behavior in terms of penetration resistance. As a general trend, all three graphs show a slight initial increase in applied force, followed by a sharp increase after approximately 7-8 mm of penetration, mainly due to the cone’s geometry. This suggests that the tested material (cheeses) shows low initial resistance to penetration but becomes significantly more resistant after the cone penetrates a certain depth. Variations between samples are present, but the overall behavior remains consistent, indicating a similar structure of the tested material.
3.3. Results Obtained through Statistical Analysis
The repeatability of measurements refers to the consistency and stability of results obtained when a measurement is repeated under the same conditions. Noise caused by vibrations from external sources, from the electric motor drive, or deviations due to temperature is extremely important [33]. Evaluating repeatability is essential to ensure that a measurement instrument or process produces reliable and consistent results. A total of 36 sets of penetration force measurements were conducted for each variety of cheese, cone geometry (the tip angle) and speed of the cone’s movement, resulting in a total of 11,209 average penetration force values. The repeatability of the measurements was assessed by testing significant differences between categories (groups) using a t-test, two-variable analysis of variance (ANOVA), and the ANCOVA method (analysis of covariance). The determination shows whether the average penetration force depends on the cone geometry or the cone movement speed. The average penetration force value for Brie cheese was 1.0520 N, for Camembert cheese it was 1.0434 N, for Dorblue cheese it was 1.1471, and for Roquefort cheese, it was 0.6029 N.
The box plot charts presented in Figure 10 are used to identify outliers, the symmetry of the distribution, and the variation in the data, each representing the average penetration force grouped by cone geometry, based on the hypothesis of three force size classes 1.5 N; 2.5N; 3.5N.
The plot in Figure 10a shows the data groups with cone the geometries of 9 and 19 degrees (with the acronyms of con_09_gr con_19_gr). The penetration force for the con_19_gr group is significantly higher than for the con_09_gr group. The box for con_19_gr (median value of force around 1.75 N) is positioned much higher than the box for con_09_gr (the force median value is around 3.1 N), indicating a significant difference in penetration force. The plot in Figure 10b shows the data groups with cone the geometries of 9 (con_09_gr) and 90 (with the acronym of cone con_90_gr) degrees. In this case, although the difference is not as large as the one observed in plot in Figure 10a, there is still a notable difference (median of approximately 1.75 N for the con_09_gr group compared to the median of approximately 2.6 N for the con_90_gr group). In Figure 10c, it can be observed that the penetration force for con_90_gr is significantly higher than for con_19_gr. All three plots suggest that there are significant differences in penetration force between the different cone geometries. This visual analysis provides a clear understanding of how cone geometry affects penetration force, suggesting that cones with larger angles require more force for penetration.
To perform the multi-factor ANOVA statistical test, we used the built-in Matlab function ‘anovan’.
Table 3 presents the results of the two-way ANOVA analysis. The probability value (p) for testing the equality of means as an effect of the ‘GeometryCONE’ variable (cone tip angle) is 0, so the null hypothesis is rejected at a significance level of 0.05. The p-value for testing the equality of effects of the ‘Speed’ variable (movement speed) is 0.1188, so this null hypothesis is also rejected.
The Analysis of Covariance (ANCOVA) is a statistical technique that combines elements from the ANOVA model and the regression model. Adding the continuous variable ‘Product’ as a third group in the variance analysis led to the results presented in Table 4. The result shows that when this variable is also taken into account, there is not enough evidence of an effect on the equality of the mean penetration force values, leading to the rejection of this hypothesis (p-value = 0.0201).
The interactive graphical interface for visualizing ANCOVA analysis, presented in Figure 11, can be used to visualize the results. The plot displays the predicted penetration force (ForceP) as a function of penetration depth for four varieties of cheese: Brie, Camembert, Dorblue, and Roquefort. Each variety of cheese is represented by a different color and symbol: Brie with blue dots, Camembert with orange crosses, Dorblue with yellow dashes, and Roquefort with purple asterisks. All varieties of cheese show an increase in penetration force as the penetration depth increases, but the rate and intensity of the increase vary among them. This interface allows for the observation of general trends, identification of inflection points, and comparison of the behavior of different cheeses under the same set of testing conditions [34]. It can guide informed decisions in optimizing production processes and evaluating the quality of dairy products.
3.4. Penetration Force
The plot presented in Figure 12 illustrates the variation of the average penetration force (N) for Camembert cheese, measured on an intact cheese sample, as a function of penetration speed (mm/s) and cone angle (degrees).
In the 3D plot in Figure 12a, it is observed that the penetration force increases as the cone angle increases, especially for higher angle values. In the 3D surface plot, the X-axis represents the penetration speed, ranging approximately from 0 to 1 mm/s, the Y-axis represents the cone angle, ranging from 0 to 90 degrees, and the Z-axis represents the penetration force measured in N, ranging from 1 to 4 N. At lower penetration speeds (approximately below 0.4 mm/s), the penetration force remains relatively constant and low, regardless of the cone angle. At higher penetration speeds, the penetration force tends to increase with the cone angle. In the contour plot (Figure 12b), the level curves represent the average penetration force [N], with each color indicating a different force range. The blue region represents areas with lower penetration forces, found at low penetration speeds and smaller cone angles. The green and yellow regions indicate an increase in penetration force, observable at moderate speeds and angles. The orange region suggests higher penetration forces, predominant at larger angles and higher penetration speeds.
In Figure 13, the variation of penetration depth (mm) measured on a sample of Camembert cheese is shown as a function of penetration speed (mm/s) and the cone tip angle (degrees). The surface plot (top part) shows that penetration (Z-axis) increases as the penetration speed (X-axis) and the cone angle (Y-axis) increase. At lower penetration speeds and smaller angles, penetration is relatively constant and low. At higher penetration speeds and larger angles, penetration becomes more pronounced, indicating a significant interaction between these two factors.
In the contour plot, each color indicates a different penetration range. The blue region represents areas with the lowest penetration, occurring at low penetration speeds and small cone angles. The green and yellow regions indicate increased penetration, observable at moderate speeds and angles. The orange and yellow regions suggest maximum penetration, predominant at larger angles and higher penetration speeds. In conclusion, we can state that an increase in the cone angle leads to increased penetration, especially at larger angles (approximately above 60 degrees). At low penetration speeds, penetration remains relatively constant and low, while at higher speeds, penetration increases with the cone angle, indicating a significant interaction between penetration speed and cone angle. There is a clear interaction between penetration speed and cone angle, both significantly influencing penetrations. This is evident in both the surface plot and the contour plot.
3.5. Firmness Index
By analogy with the method proposed by Hayakawa and Deman [27], the firmness/hardness index (FI) of the cheeses was determined as the ratio between the maximum penetration force (Fp max) and the maximum penetration depth (h):
The FI value can be easily calculated using the following Excel instruction, which checks two independent conditions in the data table and then decides which value to return:
“=IF(AND(VLOOKUP(“v30mm_min”,E3738:F7473,1,FALSE)=“v30mm_min”,VLOOKUP(“Camembert”,G3738:G7473,1,FALSE)=“Camembert”),MAX(D3738:D7473)/ MAX(C3738:C7473), 0).”
This instruction uses the VLOOKUP function to check if the variable “v30mm_min” is present in the range E3738 (the columns with the speed acronym) and if the variable “Camembert” is present in the range G3738 (the column for the cheese type). If both conditions are true, it calculates the ratio between the maximum values in the ranges D3738 (the column for penetration force) and C3738 (the column for penetration depth). If “v30mm_min” and “Camembert” are not found, it returns the value 0. The firmness indices determined, using relation 4, are presented in Table 5.
The plots in Figure 14 present the firmness indices for different varieties of mold-ripened cheeses (Camembert, Brie, Dorblue, Roquefort) under various experimental conditions.
In the plot shown in Figure 14a, the FI of the cheeses is displayed as a function of penetration speed (v12mm/min, v30mm/min, v60mm/min). For all four varieties of cheeses, it is observed that firmness varies with penetration speed. In the case of Camembert, the firmness is relatively low regardless of the applied speed, but it slightly increases at a speed of 60mm/min. Brie and Dorblue show a significant increase in firmness at a speed of 30mm/min, while for Roquefort, firmness increases significantly at all speeds. Differences in firmness are observed between the types of cheeses, indicating structural variation. In Figure 14b, the FI is represented as a function of cone geometry (cone_9_deg, cone_19_deg, cone_90_deg). It is observed that for Camembert, firmness remains relatively low for cones with tip angles of 9 and 19 degrees, with a significant increase at the 90-degree cone. Brie shows a more moderate increase in firmness at 19 and 90 degrees. Dorblue exhibits a relevant increase in firmness at 90 degrees, similar to the observations for penetration speed. Roquefort also shows higher firmness at high tip angle values, especially at 90 degrees.
In conclusion, both graphs demonstrate that the firmness of mold-ripened cheeses is influenced by parameters such as penetration speed and cone tip angle. The different varieties of cheeses react differently to these parameters, highlighting their structural and compositional diversity.
3.6. Analysis of Moisture Content
Moisture plays an essential role in mold development and the cheese maturation process. Cheeses with higher moisture content allow mold to develop more quickly and uniformly. For example, cheeses with internal mold tend to have a higher moisture content to facilitate mold growth inside. In cheeses with external mold, controlled moisture during maturation helps in the formation of the rind and the development of specific taste and texture characteristics.
The Moisture Ratio (MR) represents the ratio between the current moisture content of a material at a given moment during drying and its initial moisture content [35,36]. It is a dimensionless parameter that indicates how much moisture remains in the material compared to its initial state. The calculation relation for MR is:
where: Mt is the moisture content of the material at time t; M0 is the initial moisture content of the material (at the beginning of the drying process); Me is the equilibrium moisture content (the residual moisture of the material after complete drying, when no significant water loss occurs).
The plots presented in Figure 15 provide information on the evolution of the moisture content of different types of cheese over time during the drying process.
Figure 15a presents the Moisture Ratio (MR) for different types of cheeses: Camembert (MR_CAM), Brie (MR_BRI), Dorblue (MR_DOR), and Roquefort (MR_ROQ) as a function of time (s). All curves indicate a decrease in the MR over time, reflecting the drying process of the cheeses [37]. Roquefort appears to lose moisture faster than the other cheeses, showing a more rapid decline in MR, reaching near zero before the others. Camembert exhibits a slower decline compared to the other cheeses, indicating a slower moisture loss. Brie and Dorblue have an intermediate evolution, with moisture loss rates between those of Camembert and Roquefort. These differences may be associated with the structure, composition, and initial moisture characteristics of each variety of cheese [38].
The plot in Figure 15b presents the cumulative curves of the amount of water (g) remaining in the different varieties of cheeses during drying, measured in time (s). It can be observed that Roquefort (waterROQ) initially has a higher amount of water but loses moisture quickly, indicating accelerated drying compared to the other cheeses. Dorblue (waterDOR) shows a rapid initial loss, followed by a slowdown, suggesting more uniform drying. Brie (waterBRIE) and Camembert (waterCAM) have slower and more consistent water loss rates, indicating greater moisture retention during drying; Camembert appears to retain more moisture by the end of the process compared to the other cheeses.
3.7. Tangential Stress
By measuring and analyzing the variation of force during the penetration of a cone with a specific geometry to a constant speed into cheese samples, it is possible to estimate the degree of texture deterioration caused by the transportation and transfer of these types of cheese samples, from their original packaging boxes into special containers.
The cone penetration method assumes that the tangential force (Ft), which is proportional to the apparent viscosity (ηa), the surface area of the cone in contact with the product (A), and the deformation rate ():
The tangential force (Ft) is given by:
where: α/2 is half of the cone angle.
The external surface area of the cone (A) in contact with the product is given by the equation [19]:
Considering that the penetration speed and, consequently, the deformation rate remain almost constant throughout the test, we can regard the tangential stress (τc) as an index of consistency for a studied product. In many studies in the literature [19,38], the apparent viscosity of many food products largely depends on the deformation rate, and this is also true for acid cheese. However, at a constant penetration speed, the deformation rate does not vary significantly during penetration (especially for a small cone angle), and consequently, the tangential stress will remain almost constant. This allows the approximation of the tangential or shear stress (τc) at the surface of the cone as:
If we take into account (7) and (8), we can rewrite equation (9) and approximate the shear stress [19] as:
where: kcone is the cone constant.
In Figure 16, the plots of shear stresses and apparent viscosity for Camembert cheese as a function of the deformation rate can be seen.
Figure 16a presents the tangential stresses determined at the three penetration speeds for the 90-degree cone, while Figure 16b shows the apparent viscosity determined for the three geometric configurations of the cone at a speed of 12 mm/min. These graphs illustrate how the tangential stresses and apparent viscosity of Camembert cheese vary with the deformation rate, under different conditions of penetration speed and cone geometry. The overall trend in both graphs shows that as the deformation rate increases, both the stress and viscosity decrease, which is characteristic of shear-thinning materials like Camembert cheese. The differences between the curves reflect how the cheese’s response is influenced by the speed of penetration and the geometry of the cone used in the tests. The results obtained in all these types of experiments are easy to explain only when performed at small deformations in the so-called linear region [39]. In this region, the ratio between stress and deformation depends only on time; thus, it is independent of the level of stress and deformation. When larger deformations are applied, the ratio changes and the material may even yield and/or fracture, making the explanation more difficult [31]. For a quantitative comparison of results, a size-independent measure of deformation must be defined. Usually, deformation is considered, defined as the relative deformation concerning the initial dimensions as the initial distance between the considered points approaches zero [40]. The presence of a non-slip wall condition is an important prerequisite in accurately measuring constant shear viscosity. In the case of Mozzarella-like cheeses in a melted state, the liquid fat on the surface of the cheese begins to lubricate the wall [14,41]. This lubrication violates the classical non-slip boundary condition, leading to erroneous viscosity data.
When the cheese sample heats up due to the heat transfer caused by friction at the contact surface between the cone and the product, it becomes more fluid [42]. As the temperature increases, hydrogen bonds decrease while electrostatic repulsion increases, leading to the relaxation of bonds between proteins and a shift towards a more liquid-like behavior. In general, to stabilize cream cheeses, an additional amount of carrageenan with pectin is added [43], which will lead to the formation of new bonds between carrageenan, pectin, and the milk protein matrix. As the temperature in the cheese maturation chamber decreases, inducing helix formation, carrageenan begins to form a network and interact with the protein matrix [44]. Pectin will bind water, which can amplify the interaction between the helical form of carrageenan and proteins. Conversely, the formation of more helical bonds is possible due to homogenization, which reduces the size of protein clusters. In this way, an extremely compact and strong gelatinous network can form, and the observed jump in shear stress is caused by the need to break the well-bound network [32].
The plot presented in Figure 17 shows the variation of the apparent viscosity (ηa) of Roquefort cheese as a function of the shear rate ():
):
The data series in the graph with blue points represents the apparent viscosity of the sample for testing with a conical penetrometer with a 9° angle; the red points represent the apparent viscosity for the test with a conical penetrometer with a 19° angle, and the green points represent the measured values for the test with a cone with a 90° angle. The general trend observed for all three cone geometries is that the apparent viscosity decreases as the shear rate increases. This indicates that Roquefort cheese exhibits shear-thinning behavior, where viscosity decreases as the shear rate increases. A possible explanation could be that salting the cheese increases the hydration level of the proteins and results in swelling of the protein matrix [45].
Comparatively, at low shear rates (the left side of the graph), the apparent viscosity is highest for the 90° cone (green points) and lowest for the 9° cone (blue points). As the shear rate increases, the apparent viscosities for the different angles converge. Roquefort cheese demonstrates shear-thinning behavior, typical for many semi-solid foods. This means it becomes less viscous as it is subjected to higher shear rates [46].
The graph in Figure 18 presents the dependence of apparent viscosity ηa (in Pa*s) on shear stress τc (in MPa) for three different data sets, the Dorblue variety., marked with different colors and symbols, during the movement of the 19° cone at speeds of 12, 30, and 60 mm/min.
The data set ηa_v1 (blue line and points) shows a rapid increase in apparent viscosity with increasing shear stress, which is also evidenced by the coefficient of determination R² = 0.9943, indicating a very good model fit. The data set ηa_v2 (red line and points) indicates a less steep increase compared to ηa_v1, but still significant. The coefficient of determination R² = 0.9724 also suggests a good data fit. The data set ηa_v3 (green line and points) shows the slowest increase in apparent viscosity with shear stress among the three data sets. With a coefficient R² = 0.9984, this model also appears to be extremely accurate.
The general observation is that all three data sets follow a non-linear (power-type) growth model, which suggests that the apparent viscosity of Dorblue cheese increases significantly with shear stress; however, the rate of this increase differs among the three data sets. The ηa_v1 set shows the fastest increase in apparent viscosity with shear stress, followed by ηa_v2 and then ηa_v3.
The rheological model that most adequately describes the behavior of apparent viscosity (ηa) as a function of shear stress (τc) for different types of cheeses, each with its characteristics, has been determined to be the power law in the form:
The rheological parameters (Kf—flow index and n—power exponent) obtained from the regression analysis, as well as the coefficient of determination R², are summarized in Table 6.
The rheological behavior showed a close relationship with the degree of cheese maturation. To estimate the flow coefficients and power factors in equation (11), several commonly used methods in the context of nonlinear optimization algorithms were applied, such as the Trust-Region method, the Least Squares (LSQ) method, or the Robust Least Squares (Robust LSQ) method. These methods adjust the model to the experimental data in a way that attempts to minimize the impact of data points that significantly deviate from the general behavior of the other data.
4. Discussion
The general observation can be that the different types of mold-ripened cheeses exhibit distinct behaviors during the drying process, as reflected by the rate of decrease in moisture ratio and the amount of water remaining. Roquefort tends to lose moisture more quickly, which may be due to its more porous structure as well as its higher initial moisture content. Camembert, on the other hand, has a slower drying rate, indicating a structure that retains water better. This could significantly influence the final texture and firmness of each variety of cheese. These changes in characteristics are, however, very well accepted by consumers, making them ideal for commercial production [37].
The firmness of cheeses is influenced by moisture content and the duration of maturation. Soft cheeses, such as Brie and Camembert, have higher moisture content and are less firm, but they become creamier as they mature. Internally mold-ripened cheeses, such as Roquefort, can range from semi-soft to firm, depending on the initial moisture content and the maturation process. As they mature, the cheese may become firmer, and the texture can vary from creamy to crumbly.
The maturation of mold-ripened cheeses involves keeping them at controlled temperatures and humidity levels to allow the mold to develop and influence the texture, flavor, and quality of the products [38]. During maturation, the moisture in the cheese can gradually evaporate, which may increase the firmness of the cheese. Additionally, the enzymatic activity of the mold can contribute to the breakdown of proteins and lipids, affecting firmness and creaminess.
Mold has a direct impact on the texture of cheese. In internally mold-ripened cheeses, the mold produces enzymes that break down proteins and fats, creating a creamy texture and a specific flavor. Instead, the externally mold-ripened cheeses, the rind formed by the mold contributes to the uniform maturation of the cheese from the outside in, affecting firmness and developing a soft and creamy consistency under the rind. In conclusion, the moisture and firmness of mold-ripened cheeses are interdependent and influenced by the type of mold, the maturation process, and storage conditions. Careful control of these factors is essential to achieve the desired texture and flavor characteristics in mold-ripened cheeses.
Different cone tip angles influence the calculated viscosity, with larger angles (e.g., 90°) showing higher apparent viscosity at lower shear rates. This could be due to the larger contact area and greater resistance encountered by the conical probe. The graphic presentations that the internal structure of Roquefort cheese allows it to flow more easily under higher shear conditions, which could be related to its fat and moisture content as well as its microstructure. The practical implications are evident: understanding the shear-thinning behavior of Roquefort cheese can aid in designing processes where the cheese needs to be pumped, mixed, sliced, or spread. Viscosity measurements can be used as a quality control parameter to ensure consistent texture and spreadability of the cheese. During the storage period, cheeses can be classified based on firmness and consistency. White mold cheeses (Camembert and Brie) are particularly characterized by lower firmness and consistency, which is caused by their higher moisture content compared to blue mold cheeses that exhibit increased firmness, even after several months of storage [48,49,50].
The storage period can have a significant impact on the shear stresses and consistency of mold cheese, a cheese with mold distributed throughout its mass. Here’s how storage can influence these characteristics:
- Consistency: As mold cheese matures during storage, enzymatic activity can lead to a creamier texture or, conversely, a more crumbly one. Initially, the cheese may be firmer, but it becomes softer and more buttery over time.
- Shear Stresses: These measure the cheese’s resistance to cutting. During maturation, protein bonds break down, which can reduce shear resistance, making the cheese easier to cut. However, variations in storage conditions, such as humidity and temperature, can influence these properties.
- Structural Changes: Long-term storage can lead to the development of additional mold characteristics, altering the texture profile and even the taste of the cheese.
- Aroma: Maturation also affects the cheese’s aroma profile. Volatile compounds produced during maturation can intensify cheese’s aroma, indirectly influencing the perceived texture during consumption.
5. Conclusions
From a rheological perspective, cheeses with a softer texture (Camembert, Brie) have less resistance to penetration, while those with a firmer and denser texture (Dorblue, Roquefort) exhibit greater resistance. The penetration speed significantly influences the measured force and must be considered when evaluating the consistency of cheeses.
The moisture and firmness of mold-ripened cheeses are interdependent and influenced by the type of mold, the maturation process, and storage conditions. Careful control of these factors is essential to achieve the desired texture and flavour characteristics in mold-ripened cheeses. By correlating the penetration force with the known characteristics of the tested cheeses, predictive models can be developed for assessing cheese quality based on its texture.
The tangential stress determined by the proposed method can be a fairly good indicator of cheese consistency and could serve to evaluate the influence of chemical composition and the intensity of technological processing during product preparation.
The complex analysis carried out highlights the importance of rheological measurements in understanding the textural properties of food products such as mold-ripened cheese, which can provide extremely valuable information for both processing techniques and quality control measures.
These tests are essential for understanding the mechanical and rheological properties of different types of cheeses, which can influence both manufacturing processes and the final consumer experience.
The study has proven its usefulness by expanding the level of knowledge in the field of rheological properties of soft or semi-hard solid products with a very cost-effective solution compared to other existing solutions.
As a future research direction, it is necessary to conduct a Principal Component Analysis (PCA) to clearly identify the significant influence of a component on sample groupings and their characteristics.
Author Contributions
Conceptualization, G.I. and G.F.P.; methodology, G.F.P and F.I.; software, G.I; validation, G.I, G.F.P. and F.I.; formal analysis, F.I.; investigation, G.I. and F.I.; resources, G.I. and G.F.P.; data curation, G.I and G.F.P; writing—original draft preparation, G.I; writing—review and editing, F.I.; visualization, G.I, G.F.P. and F.I.; supervision, G.I and F.I.; project administration, F.I.; funding acquisition, G.I, G.F.P.
Funding
This research received no external funding.
Institutional Review Board Statement
Not applicable.
Informed Consent Statement
Not applicable.
Data Availability Statement
Data is contained within the article.
Conflicts of Interest
The authors declare no conflict of interest.
References
- Karoui, R.; De Baerdemaeker, J. A review of the analytical methods coupled with chemometric tools for the determination of the quality and identity of dairy products. Food chemistry 2007, 102, 621–664. [Google Scholar] [CrossRef]
- Guinee, T.P.; O’callaghan, D.J. Control and prediction of quality characteristics in the manufacture and ripening of cheese. In Technology of cheesemaking, 2nd Edition. 2010; 8904, 260–329. [Google Scholar] [CrossRef]
- Salles, C.; Chagnon, M.C.; Feron, G.; Guichard, E.; Laboure, H.; Morzel, M.; Yven, C. In-mouth mechanisms leading to flavor release and perception. Critical reviews in food science and nutrition 2011, 51, 67–90. [Google Scholar] [CrossRef] [PubMed]
- Dicolla, C.B. Characterization of heat resistant milk chocolates. Master Thesis, The Pennsylvania State University, USA, 2009. [Google Scholar]
- Bonilla-Chaves, E.F.; Palos-Sánchez, P.R. Exploring the evolution of human resource analytics: a bibliometric study. Behavioral Sciences 2023, 13, 244. [Google Scholar] [CrossRef]
- Sweileh, W.M. Bibliometric analysis of peer-reviewed literature on climate change and human health with an emphasis on infectious diseases. Global Health 2020, 16, 44. [Google Scholar] [CrossRef]
- Harper, R.; Baron, M. The application of factor analysis to tests on cheese. British Journal of Applied Physics 1956, 2, 35. [Google Scholar] [CrossRef]
- Potter, N.N. Chapter Quality factors and how they are measured, In book Food Science Ed. Springer Science & Business Media, 2013, 113-139.
- Prentice, J.H.; Langley, K.R.; Marshall, R.J. Cheese rheology. In In: Fox, P.F. (eds) Cheese: Chemistry, Physics and Microbiology 1993, Spinger Boston, MA, USA. [CrossRef]
- Joshi, N.S.; Jhala, R.P.; Muthukumarappan, K.; Acharya, M.R.; Mistry, V.V. Textural and Rheological Properties of Processed Cheese. International Journal of Food Properties 2004, 7, 519–530. [Google Scholar] [CrossRef]
- Michelson, P. Cheese: exploring taste and tradition, Publisher Gibbs Smith 2010.
- Korolczuk, J.; Roignant, M.; Maubois, J.L. Computer data acquisition of sinusoid ally varying stress and strain. Journal of texture studies 2007, 16, 129–142. [Google Scholar] [CrossRef]
- Awad, R.A.; Salama, W.M.; Ragb, W.A. Enhancing yield and acceptability of Kareish cheese made of Reformulated milk. Annals of Agricultural Sciences 2015, 5, 87–93. [Google Scholar] [CrossRef]
- Sharma, P.; Dessev, T.T.; Munro, P.A.; Wiles, P.G.; Gillies, G.; Golding, M.; James, B.; Janssen, P. Measurement techniques for steady shear viscosity of Mozzarella-type cheeses at high shear rates and high temperature. International Dairy Journal 2015, 47, 102–108. [Google Scholar] [CrossRef]
- Ipate, G.; Biris, S.S.; Voicu, G.; Vladut, V.; Zabava, B.; Udroiu, N.A.; Pihurov, M. Numerical simulation and experimental evaluation of the rheological behaviour of cheese. Research people and actual tasks on multidisciplinary sciences 2019, Lozenec, Bulgaria.
- Hartmann, K.; Licitra, G.; Eugster-Meier, E.; Fröhlich-Wyder, M.T.; Jakob, E.; Wechsler, D.; Ardo, Y. Hard cheeses. In Global Cheesemaking Technology: Cheese Quality and Characteristics,. John Wiley & Sons, Ltd. 2017, 204-246. [CrossRef]
- Crespo, A.; Martín, A.; Ruiz-Moyano, S.; Benito, M.J.; Rufo, M.; Paniagua, J.M.; Jiménez, A. Application of ultrasound for quality control of Torta del Casar cheese ripening. Journal of Dairy Science 2020, 103, 8808–8821. [Google Scholar] [CrossRef]
- Gunasekaran, S.; Ak, M.M. Cheese rheology and texture. In Handbook of Cheese Chemistry; 2023. [CrossRef]
- Korolczuk, J.; Mahaut, M. Studies on acid cheese texture by a computerized, constant speed, cone penetrometer. Le Lait 1988, 68, 349–361. https://hal.science/hal-00929137 hal-0092913.
- Guinee, T.P.; O’callaghan, D.J. Control and prediction of quality characteristics in the manufacture and ripening of cheese, In bookTechnology of cheesemaking 2000, 8904, 260. [CrossRef]
- Olson, N.F.; Vakaleris, D.G.; Price, W.V.; Knight, S.G. Acidity and age of natural cheese as factors affecting the body of pasteurized process cheese spread. Journal of Dairy Science 1958, 41, 1005–1016. [Google Scholar] [CrossRef]
- Koca, N.; Öztürk, M.U. Application of batch system ultraviolet light on the surface of kashar cheese, a kind of pasta-filata cheese: effects on mould inactivation, lipid oxidation, colour, hardness and sensory properties. Journal of Dairy Research 2020, 87, 493–497. [Google Scholar] [CrossRef] [PubMed]
- Falcone, P.M.; Baiano, A.; Conte, A.; Mancini, L.; Tromba, G.; Zanini, F.; Del Nobile, M.A. Imaging techniques for the study of food microstructure: a review. Advances in food and nutrition research 2006, 51, 205–263. [Google Scholar] [CrossRef] [PubMed]
- Lashkari, H.; Khosrowshahi asl, A.; Madadlou, A.; Alizadeh, M. Chemical composition and rheology of low-fat Iranian white cheese incorporated with guar gum and gum arabic as fat replacers. Journal of Food Science and Technology 2014, 51, 2584–2591. [Google Scholar] [CrossRef]
- Ipate, G.; Voicu, G.; Dinu, I. Research on the use of drones in precision agriculture. University Politehnica of Bucharest Bulletin Series 2015, 77, 1–12. [Google Scholar]
- Pompei, C.; Lucisano, M.; Zanoni, B.; Casiraghi, E. Evaluation of spreadability of food products by penetration tests and panel scores. Journal of Food Science 1988, 53, 592–596. [Google Scholar] [CrossRef]
- Hayakawa, M.; Deman, J.M. Interpretation of cone penetrometer consistency measurements of fats. Journal of Texture Studies 1982, 13, 201–210. [Google Scholar] [CrossRef]
- Lis, A.; Staniewski, B.; Ziajka, J. A comparison of butter texture measurements with the AP 4/2 penetrometer and TA. XT. Plus texture analyzer. International Journal of Food Properties 2021, 24, 1744–1757. [Google Scholar] [CrossRef]
- Gageanu, I.; Cujbescu, D.; Persu, C.; Tudor, P.; Cardei, P.; Matache, M.; Ungureanu, N. Influence of input and control parameters on the process of pelleting powdered biomass. Energies 2021, 14, 4104. [Google Scholar] [CrossRef]
- Moiceanu, G.; Voicu, G.; Paraschiv, G.; Ipate, G. Aspects regarding miscanthus cutting process FEM simulation and some experimental data, In Engineering for Rural Development. Proceedings of the International Scientific Conference (Latvia) 2019, 18, Latvia University of Life Sciences and Technologies. [CrossRef]
- Szczesniak, A.S. Instrumental methods of texture measurements, In Texture Measurements of Foods: Psychophysical Fundamentals: Sensory, Mechanical, and Chemical Procedures, and their Interrelationships, 1st ed. 1973, 71-108, Dordrecht: Springer Netherlands.
- Geng, X.; Ipsen, R.; Liot, F. Rheological properties of cold and hot filled model cream cheese. Ann. Trans. Nordic Rheol. Soc. 2008, 16, 217–223. [Google Scholar]
- Xu, X.; Han, Q.; Chu, F. Review of electromagnetic vibration in electrical machines. Energies 2018, 11, 1779. [Google Scholar] [CrossRef]
- Ilie, F.; Saracin, I.A.; Voicu, G. Study of Wear Phenomenon of a Dental Milling Cutter by Statistical–Mathematical Modeling Based on the Experimental Results. Materials 2022, 15, 1903. [Google Scholar] [CrossRef] [PubMed]
- Vu, N.D.; Tran, N.T.Y.; Le, T.D.; Phan, N.T.M.; Doan, P.L.A.; Huynh, L.B.; Dao, P.T. Kinetic model of moisture loss and polyphenol degradation during heat pump drying of soursop fruit (Annona muricata L.). Processes 2022, 10, 2082. [Google Scholar] [CrossRef]
- Paul, A.; Martynenko, A. The effect of material thickness, load density, external airflow, and relative humidity on the drying efficiency and quality of EHD-dried apples. Foods, 2022; 11, 2765. [Google Scholar] [CrossRef]
- Chang, A.; Zheng, X.; Xiao, H.; Yao, X.; Liu, D.; Li, X.; Li, Y. Short-and medium-wave infrared drying of cantaloupe (Cucumis melon L.) slices: Drying kinetics and process parameter optimization. Processes 2022, 10, 114. [Google Scholar] [CrossRef]
- Guo, H.L.; Chen, Y.; Xu, W.; Xu, M.T.; Sun, Y.; Wang, X.C.; Xiong, Y.K. Assessment of drying kinetics, textural and aroma attributes of Mentha haplocalyx leaves during the hot air thin-layer drying process. Foods 2022, 11, 784. [Google Scholar] [CrossRef]
- Mahaut, M.; Korolczuk, J.; Pannetier, R.; Maubois, J.L. Eléments de fabrication de fromage de type pâte molle de lait de chèvre à caractère lactique par ultrafiltration de lait acidifié et coagulé. Techinique Latère & Marketing. Julho-agosto 1986, 1011, 24–28. [Google Scholar]
- Luyten, H. The rheological and fracture properties of Gouda cheese, Doctoral Thesis 1988, Wageningen University and Research.
- Mackey, K.L.; Ofoli, R.Y.; Morgan, R.G.; Steffe, J.F. Rheological modeling of potato flour during extrusion cooking. Journal of food process engineering 1990, 12, 1–11. [Google Scholar] [CrossRef]
- Hatzikiriakos, S.G. Wall slip of molten polymers. Progress in Polymer Science 2012, 37, 624–643. [Google Scholar] [CrossRef]
- Lazaroiu, G.; Mihaescu, L.; Grigoriu, R.M.; Negreanu, G.P.; Stoica, D. Possibilities of Climate Control of Poultry Complexes through Co-Combustion of Poultry Waste–Solid Biomass for Agriculture in Romania. Agriculture 2024, 14, 428. [Google Scholar] [CrossRef]
- Wang, W.; Jia, R.; Hui, Y.; Zhang, F.; Zhang, L.; Liu, Y.; Wang, B. Utilization of two plant polysaccharides to improve fresh goat milk cheese, Texture, rheological properties, and microstructure characterization. Journal of Dairy Science 2023, 106, 3900–3917. [Google Scholar] [CrossRef]
- Du, M.; Lu, W.; Zhang, Y.; Mata, A.; Fang, Y. Natural polymer-sourced interpenetrating network hydrogels: Fabrication, properties, mechanism and food applications. Trends in Food Science & Technology 2021, 116, 342–356. [Google Scholar] [CrossRef]
- Rahimi, J.; Khosrowshahi, A.; Moradi, M.M.; Mohamadi, H.; Abbasi, H.; Madadlou, A. Texture and chemistry of Iranian white cheese as influenced by brine treatments. Journal of Food Processing & Technology 2013, 4, 1000219. [Google Scholar] [CrossRef]
- Leach, M.R.; Farkas, B.E.; Daubert, C.R. Rheological Characterization of Process Cheese Using Tube Viscometry. International Journal of Food Properties 2003, 6, 259–267. [Google Scholar] [CrossRef]
- Farahani, G.; Ezzatpanah, H.; Abbasi, S. Characterization of Siahmazgi cheese, an Iranian ewe’s milk variety: Assessment of physico-chemical, textural and rheological specifications during ripening. LWT-Food science and Technology 2014, 58, 335–342. [Google Scholar] [CrossRef]
- Vukić, D.V.; Vukić, V.R.; Milanović, S.D.; Ilicic, M.D.; Kanuric, K.G. Modeling of rheological characteristics of the fermented dairy products obtained by novel and traditional starter cultures. J Food Sci Technol. 2018, 55, 2180–2188. [Google Scholar] [CrossRef]
- Tunick, M.H. Chapter: Cheese Rheology and Texture, In book: Handbook of Cheese Chemistry, 1st Edition, Series: Food Chemistry, Function and Analysis, 2023, 202–222. [CrossRef]
Figure 1.
Evolution of the number of scientific publications regarding the behavior of cheese with mold in rheological penetration tests.
Figure 1.
Evolution of the number of scientific publications regarding the behavior of cheese with mold in rheological penetration tests.
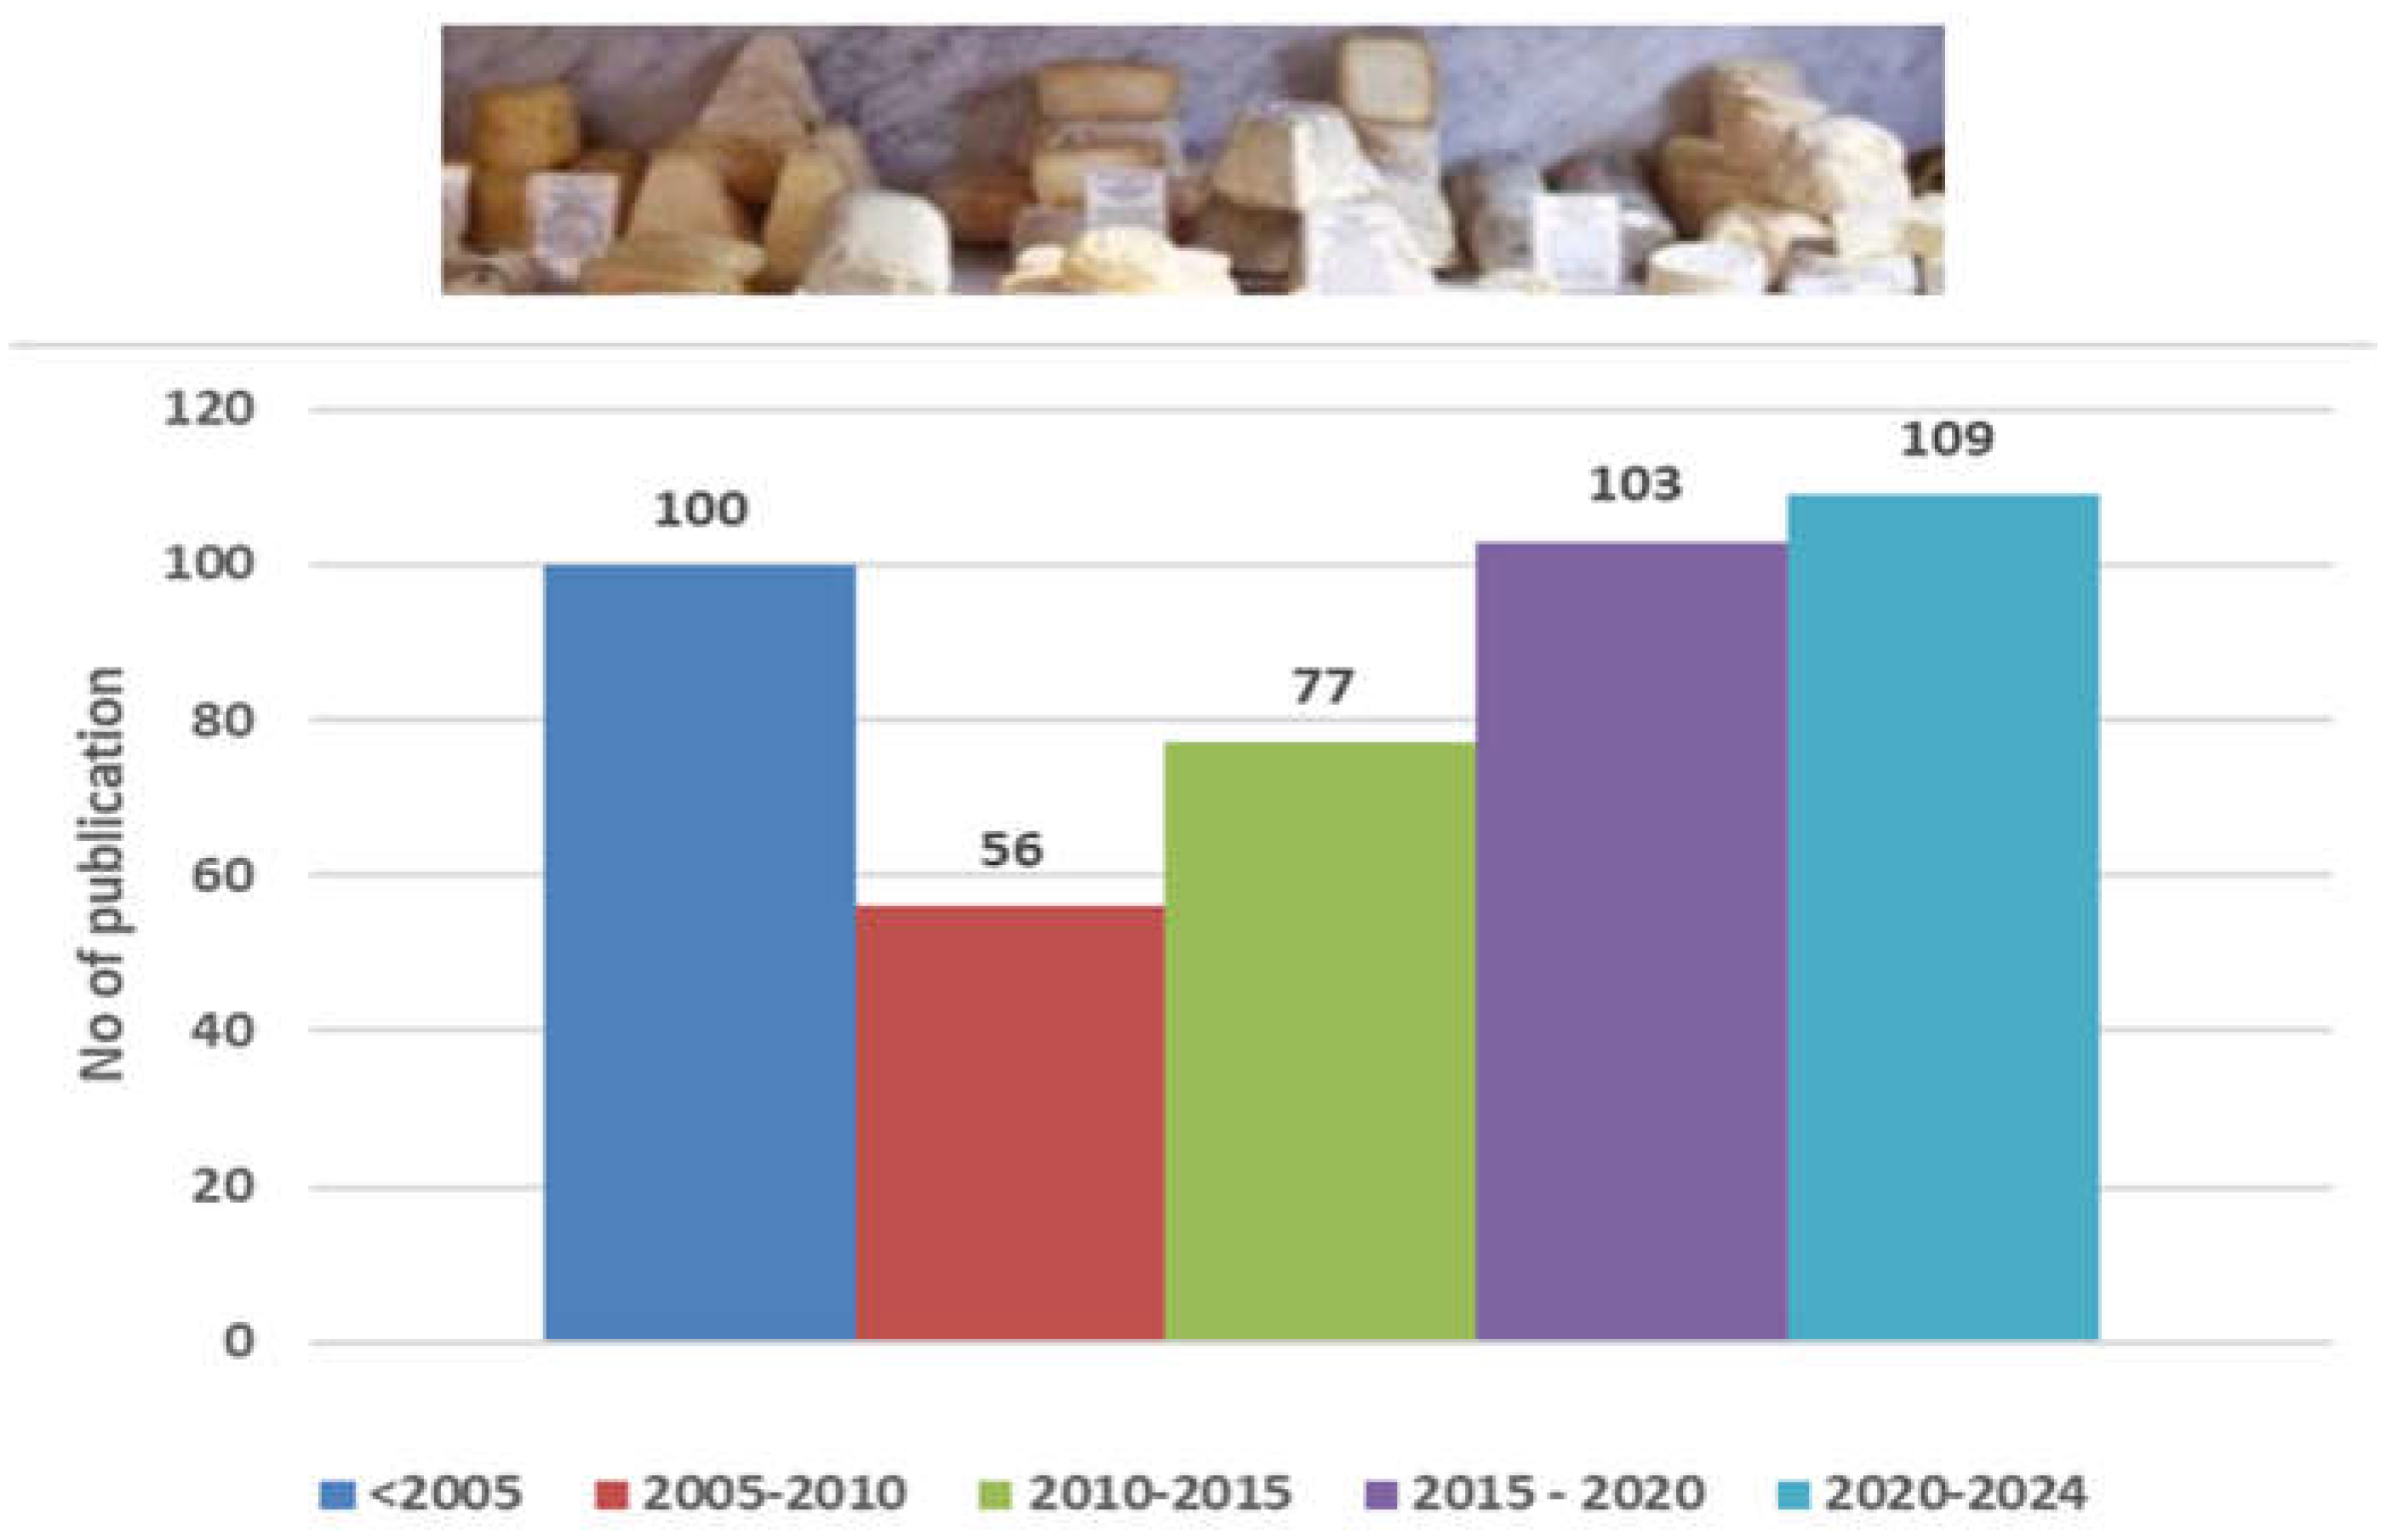
Figure 2.
Computer-assisted penetration method: (a) The Hounsfield H1 KS equipment; (b) the penetration of the sample with a cone; (c) The microstructure of blue cheese In the penetration test.
Figure 2.
Computer-assisted penetration method: (a) The Hounsfield H1 KS equipment; (b) the penetration of the sample with a cone; (c) The microstructure of blue cheese In the penetration test.
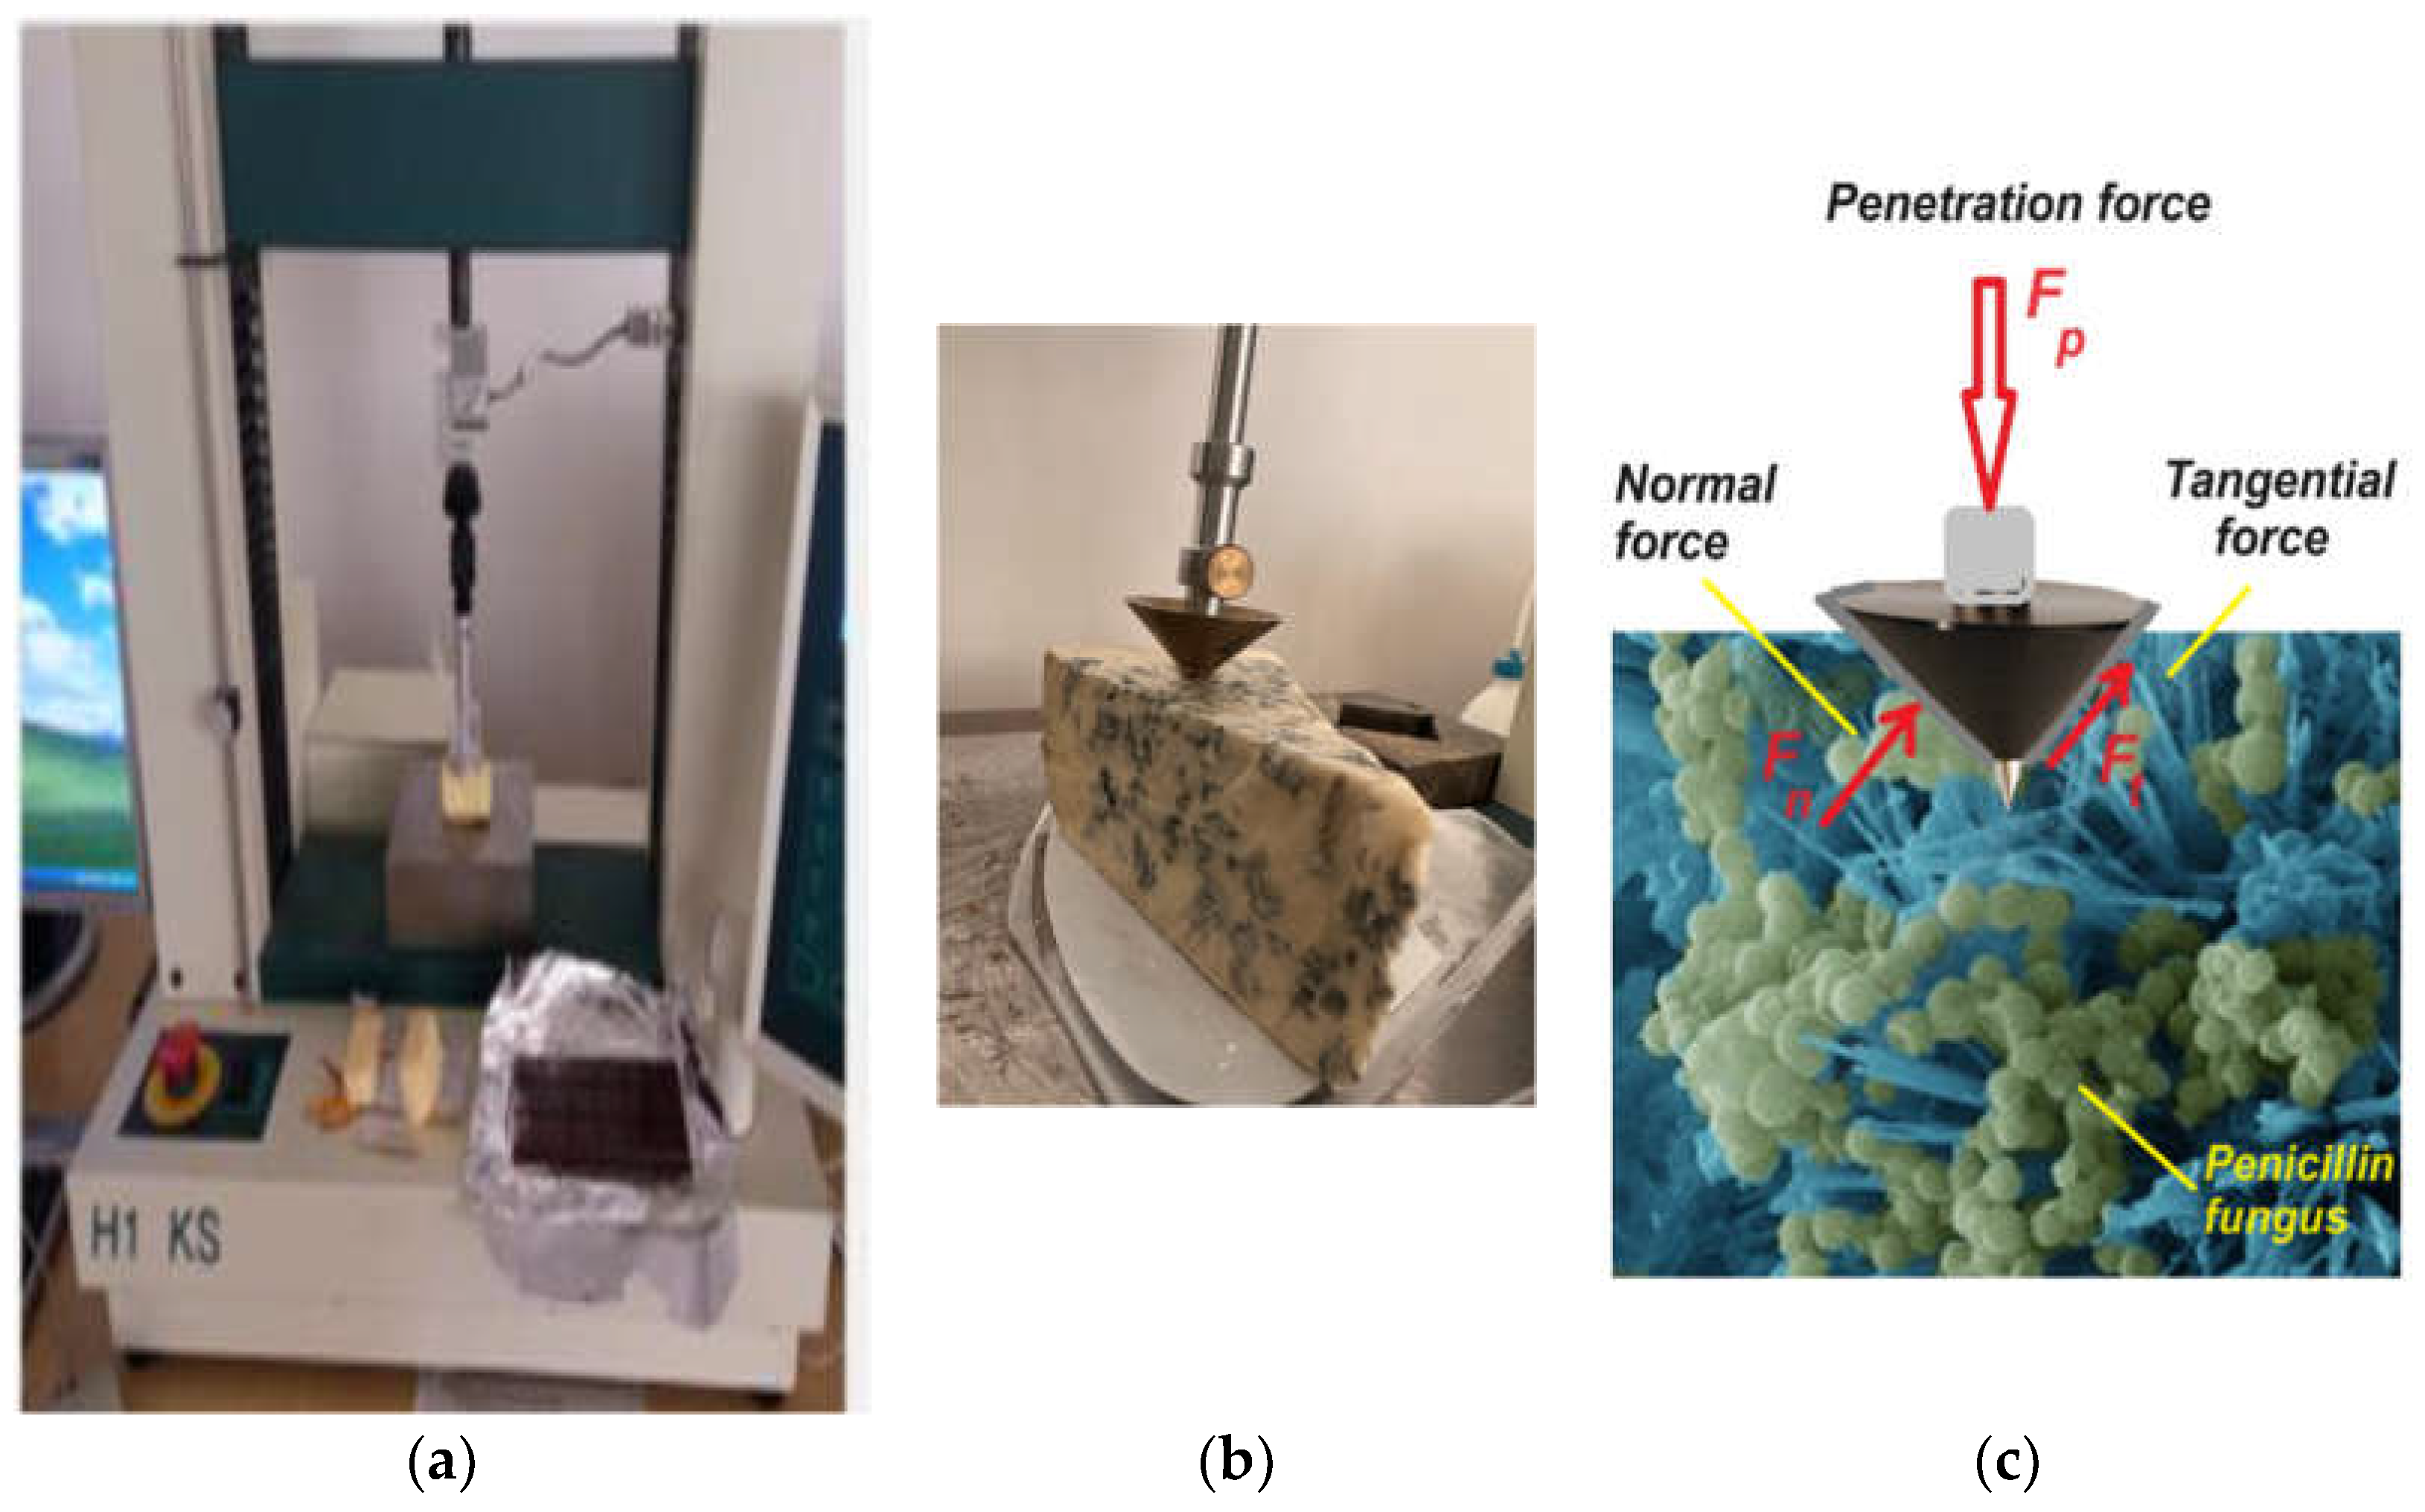
Figure 3.
Hounsfield 1kN load cell: (a) Front view; (b) Main structural dimensions.
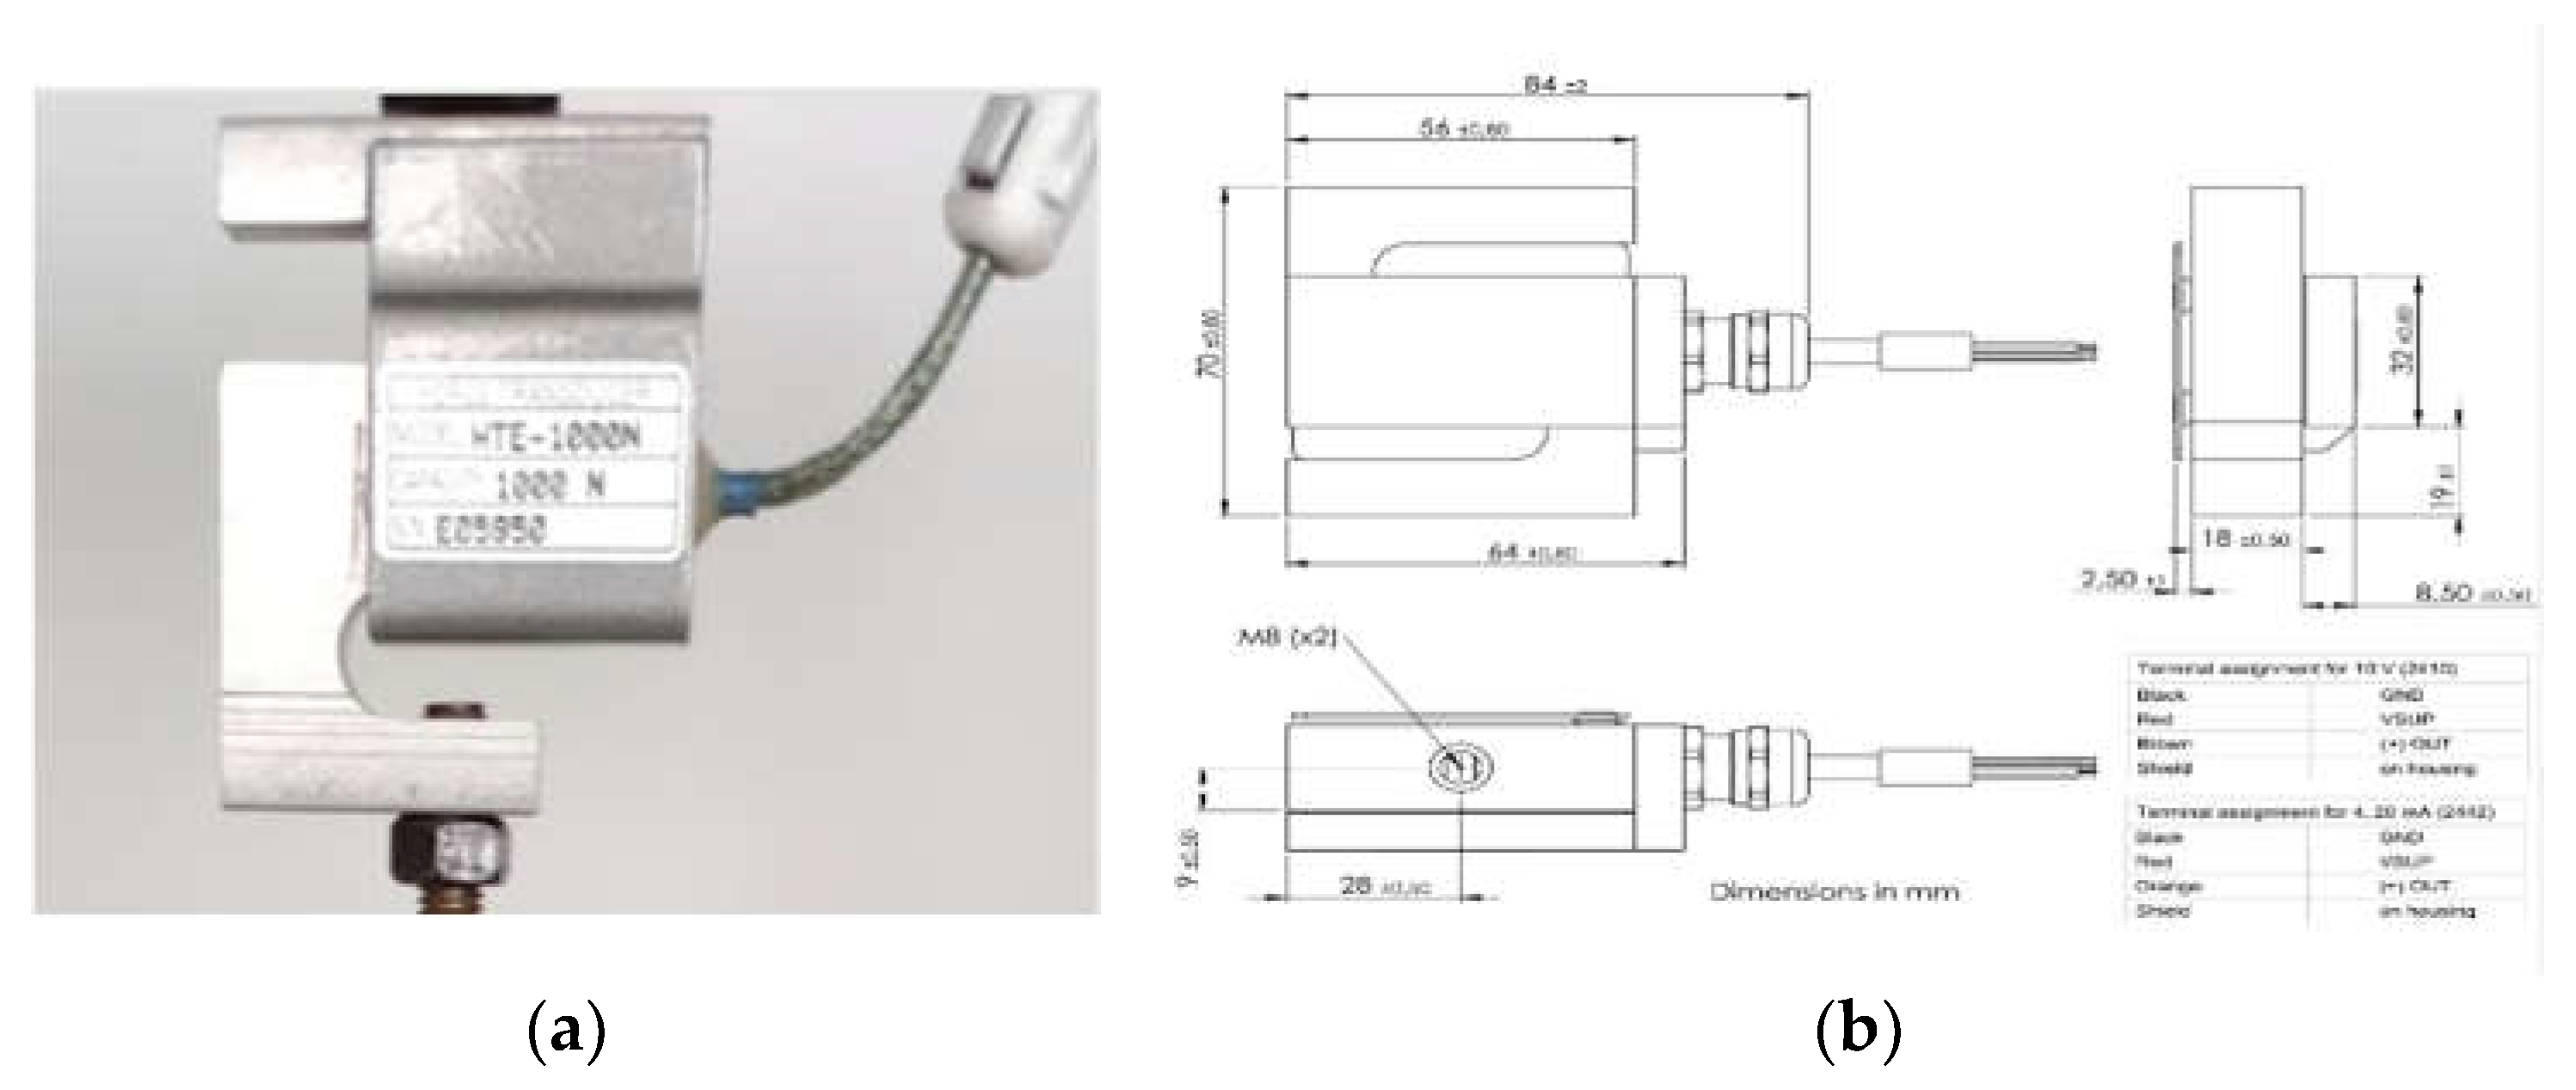
Figure 4.
Geometry of the cones: (a) con (from steel) with a tip angle of 9 degrees; (b) con (from bronze) with a tip angle of 19 degrees; (c) con (from bronze) with a tip angle of 90 degrees; (d) diagram of the forces acting on the sample.
Figure 4.
Geometry of the cones: (a) con (from steel) with a tip angle of 9 degrees; (b) con (from bronze) with a tip angle of 19 degrees; (c) con (from bronze) with a tip angle of 90 degrees; (d) diagram of the forces acting on the sample.
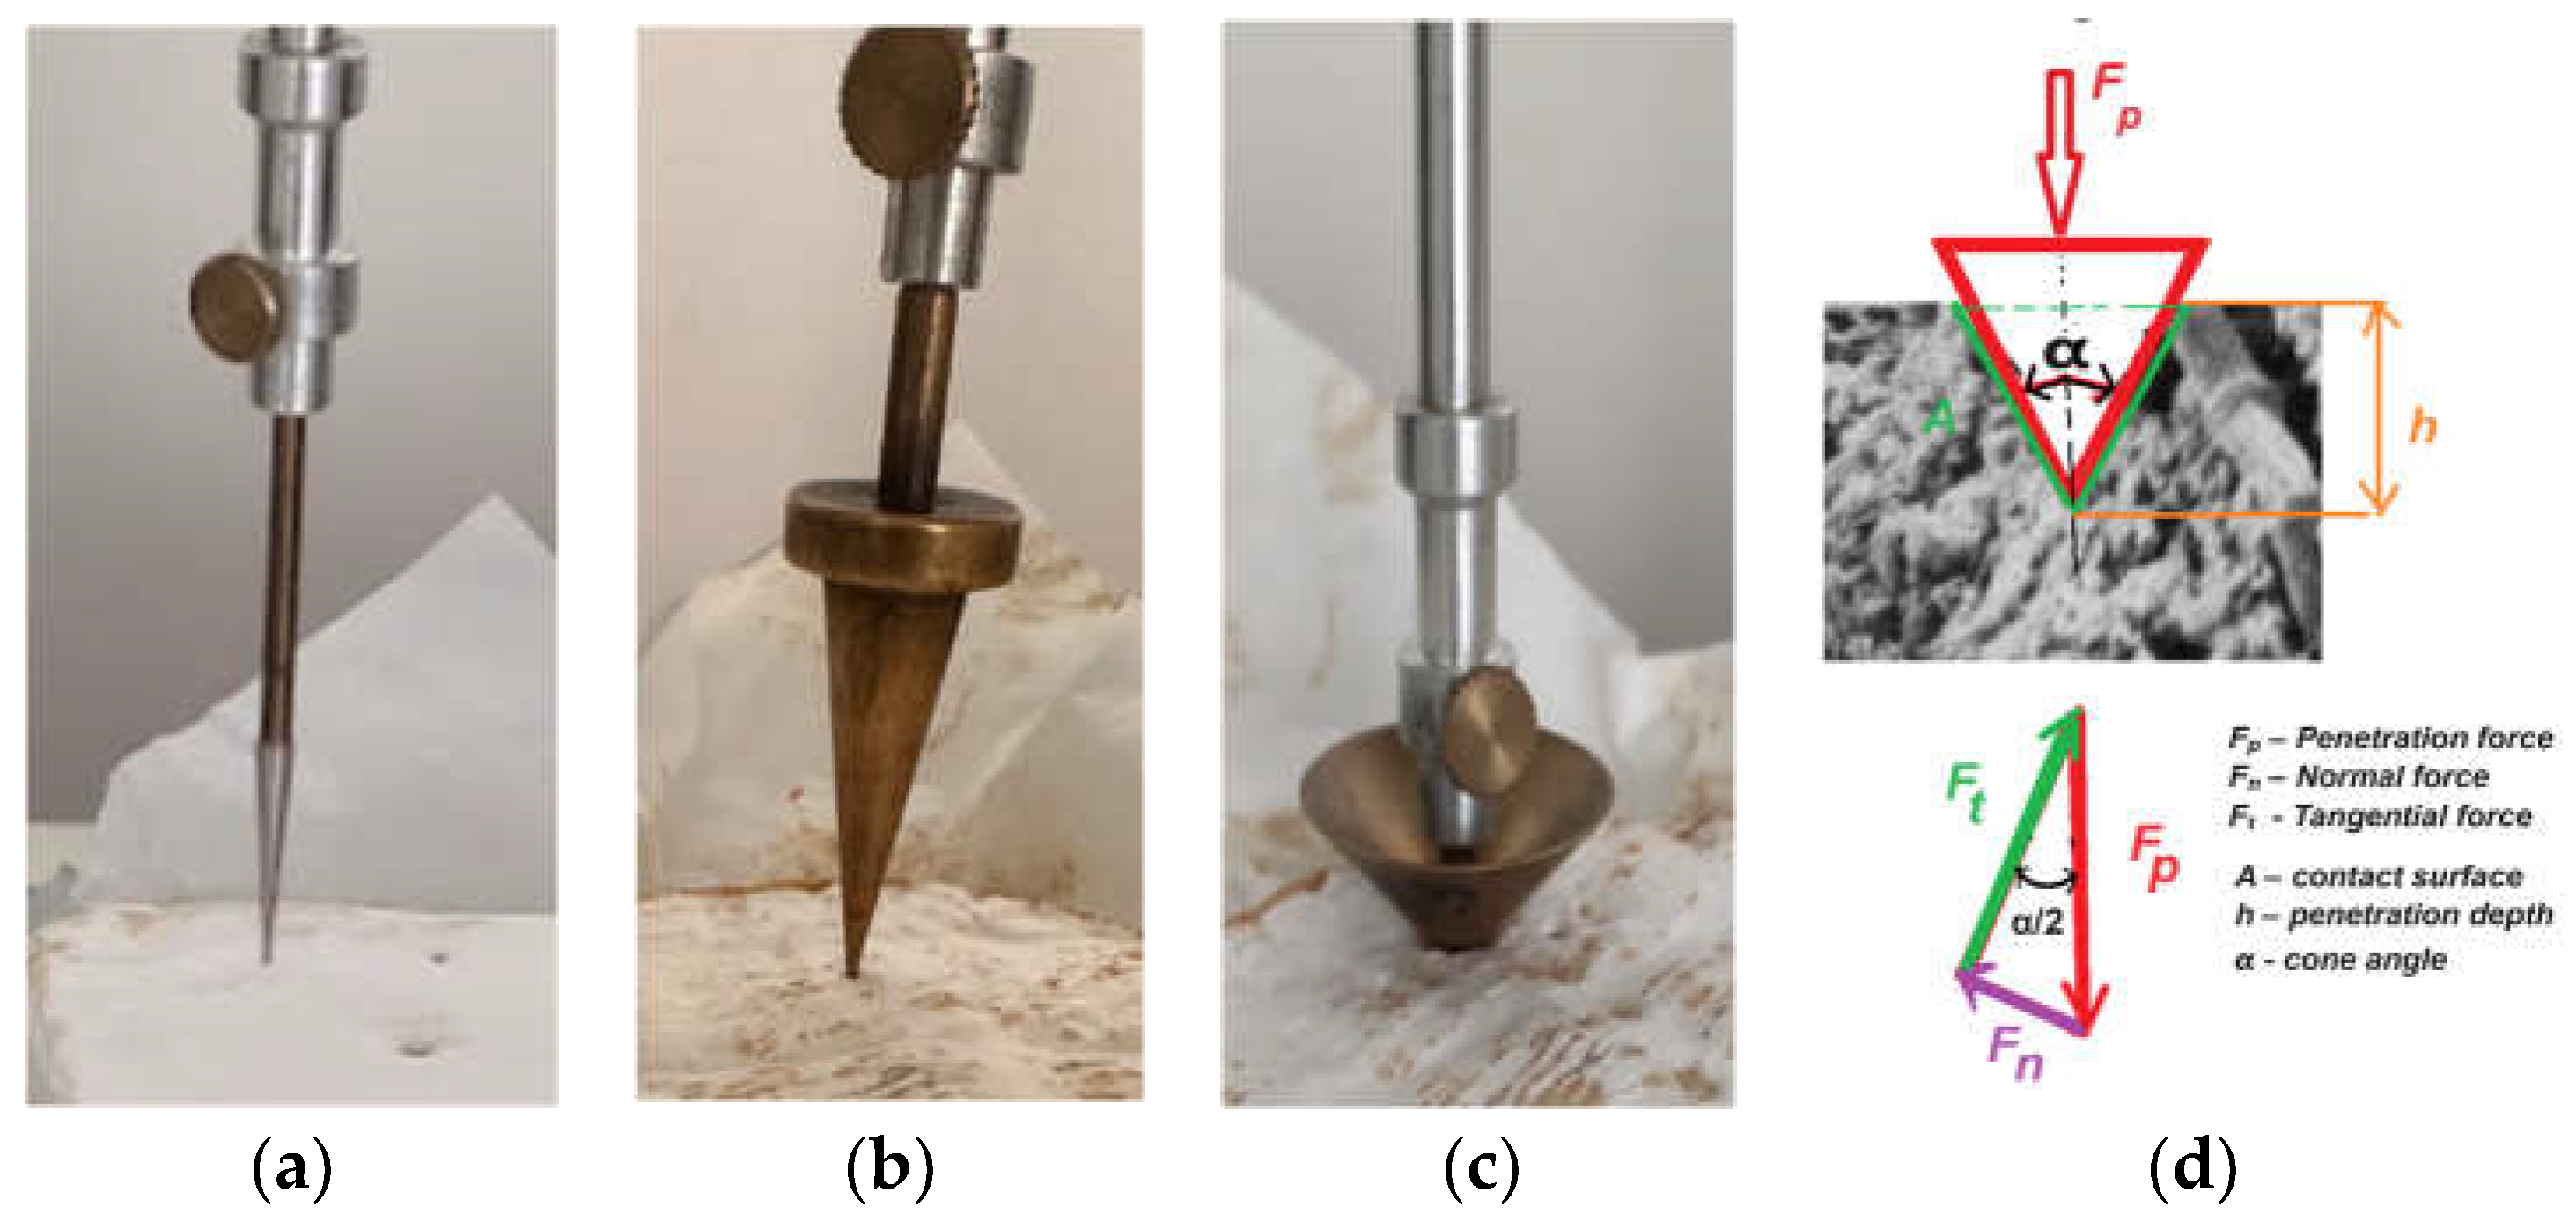
Figure 5.
Tested cheese varieties: (a) Camembert; (b) Brie (c) Dorblue (d) Roquefort.
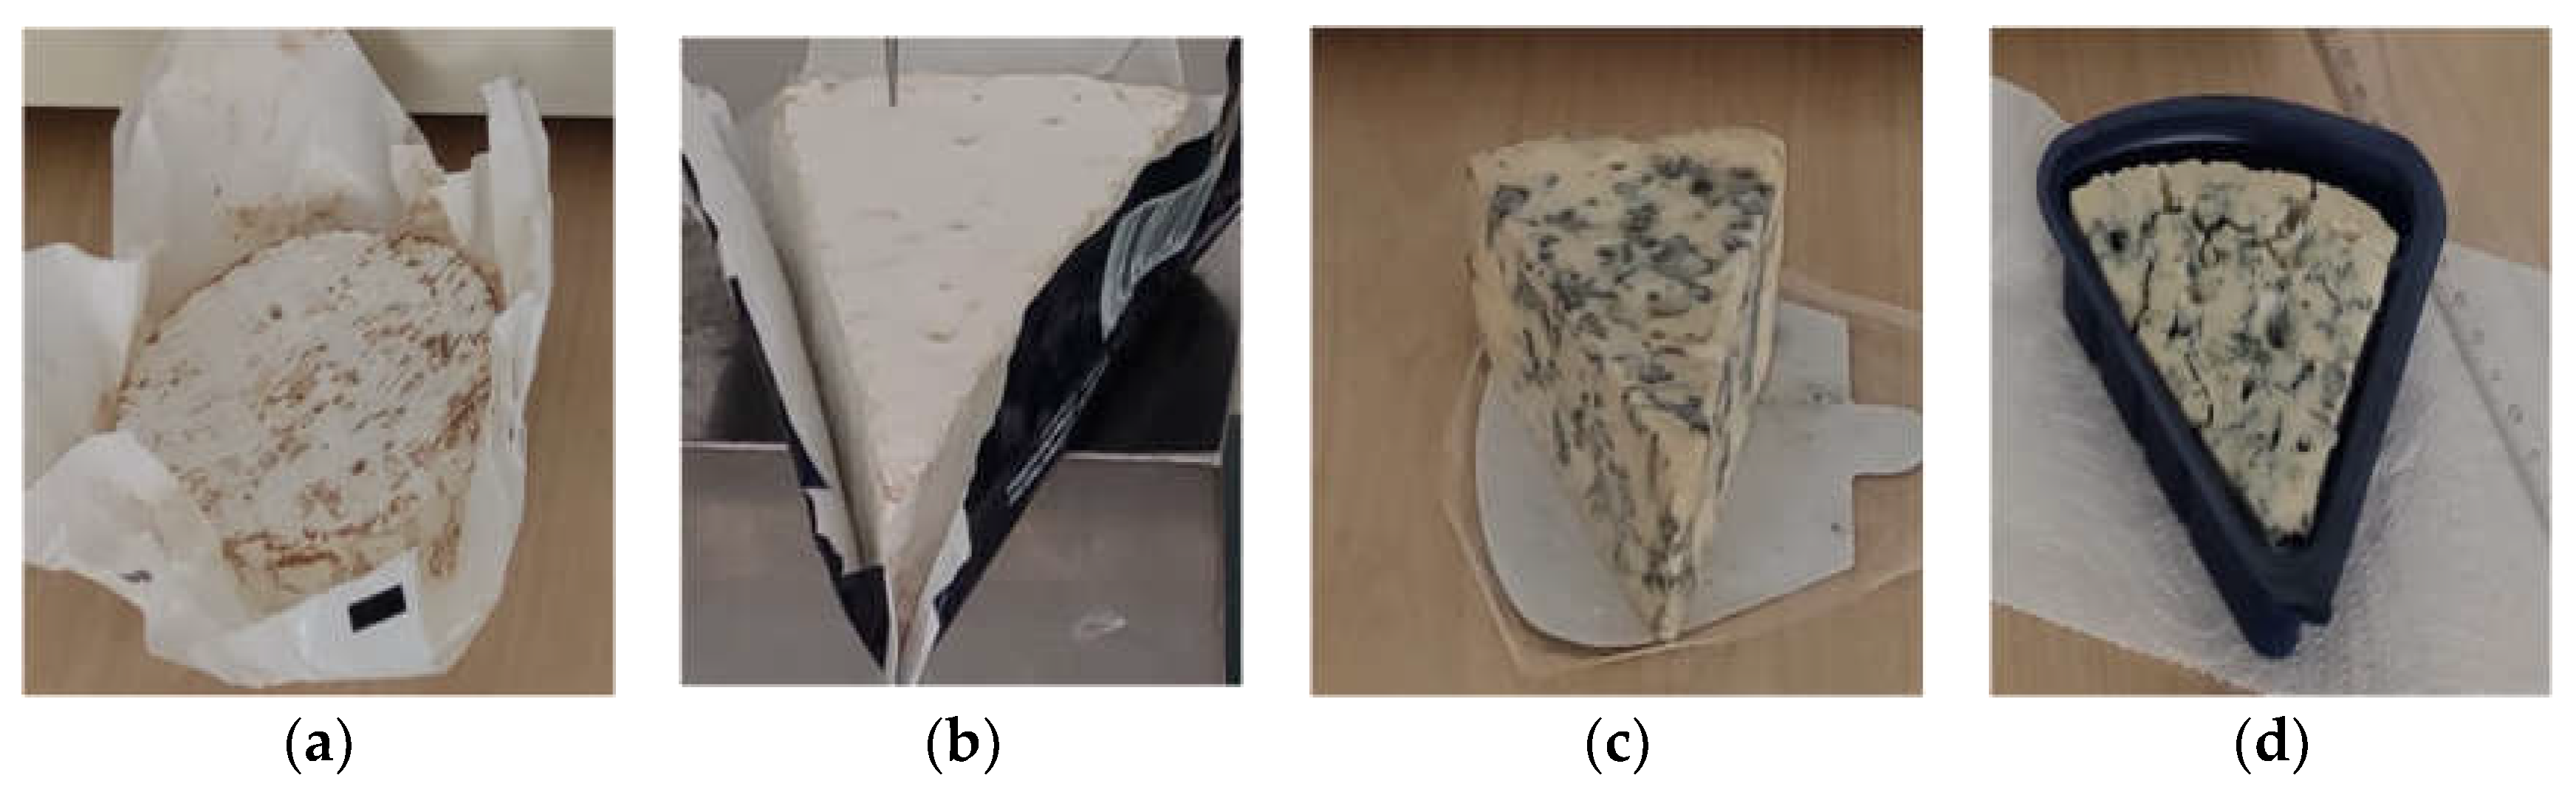
Figure 6.
Software Qmat 5.50p: (a) General user interface of the program (GUI); (b) test configuration for experimentation.
Figure 6.
Software Qmat 5.50p: (a) General user interface of the program (GUI); (b) test configuration for experimentation.
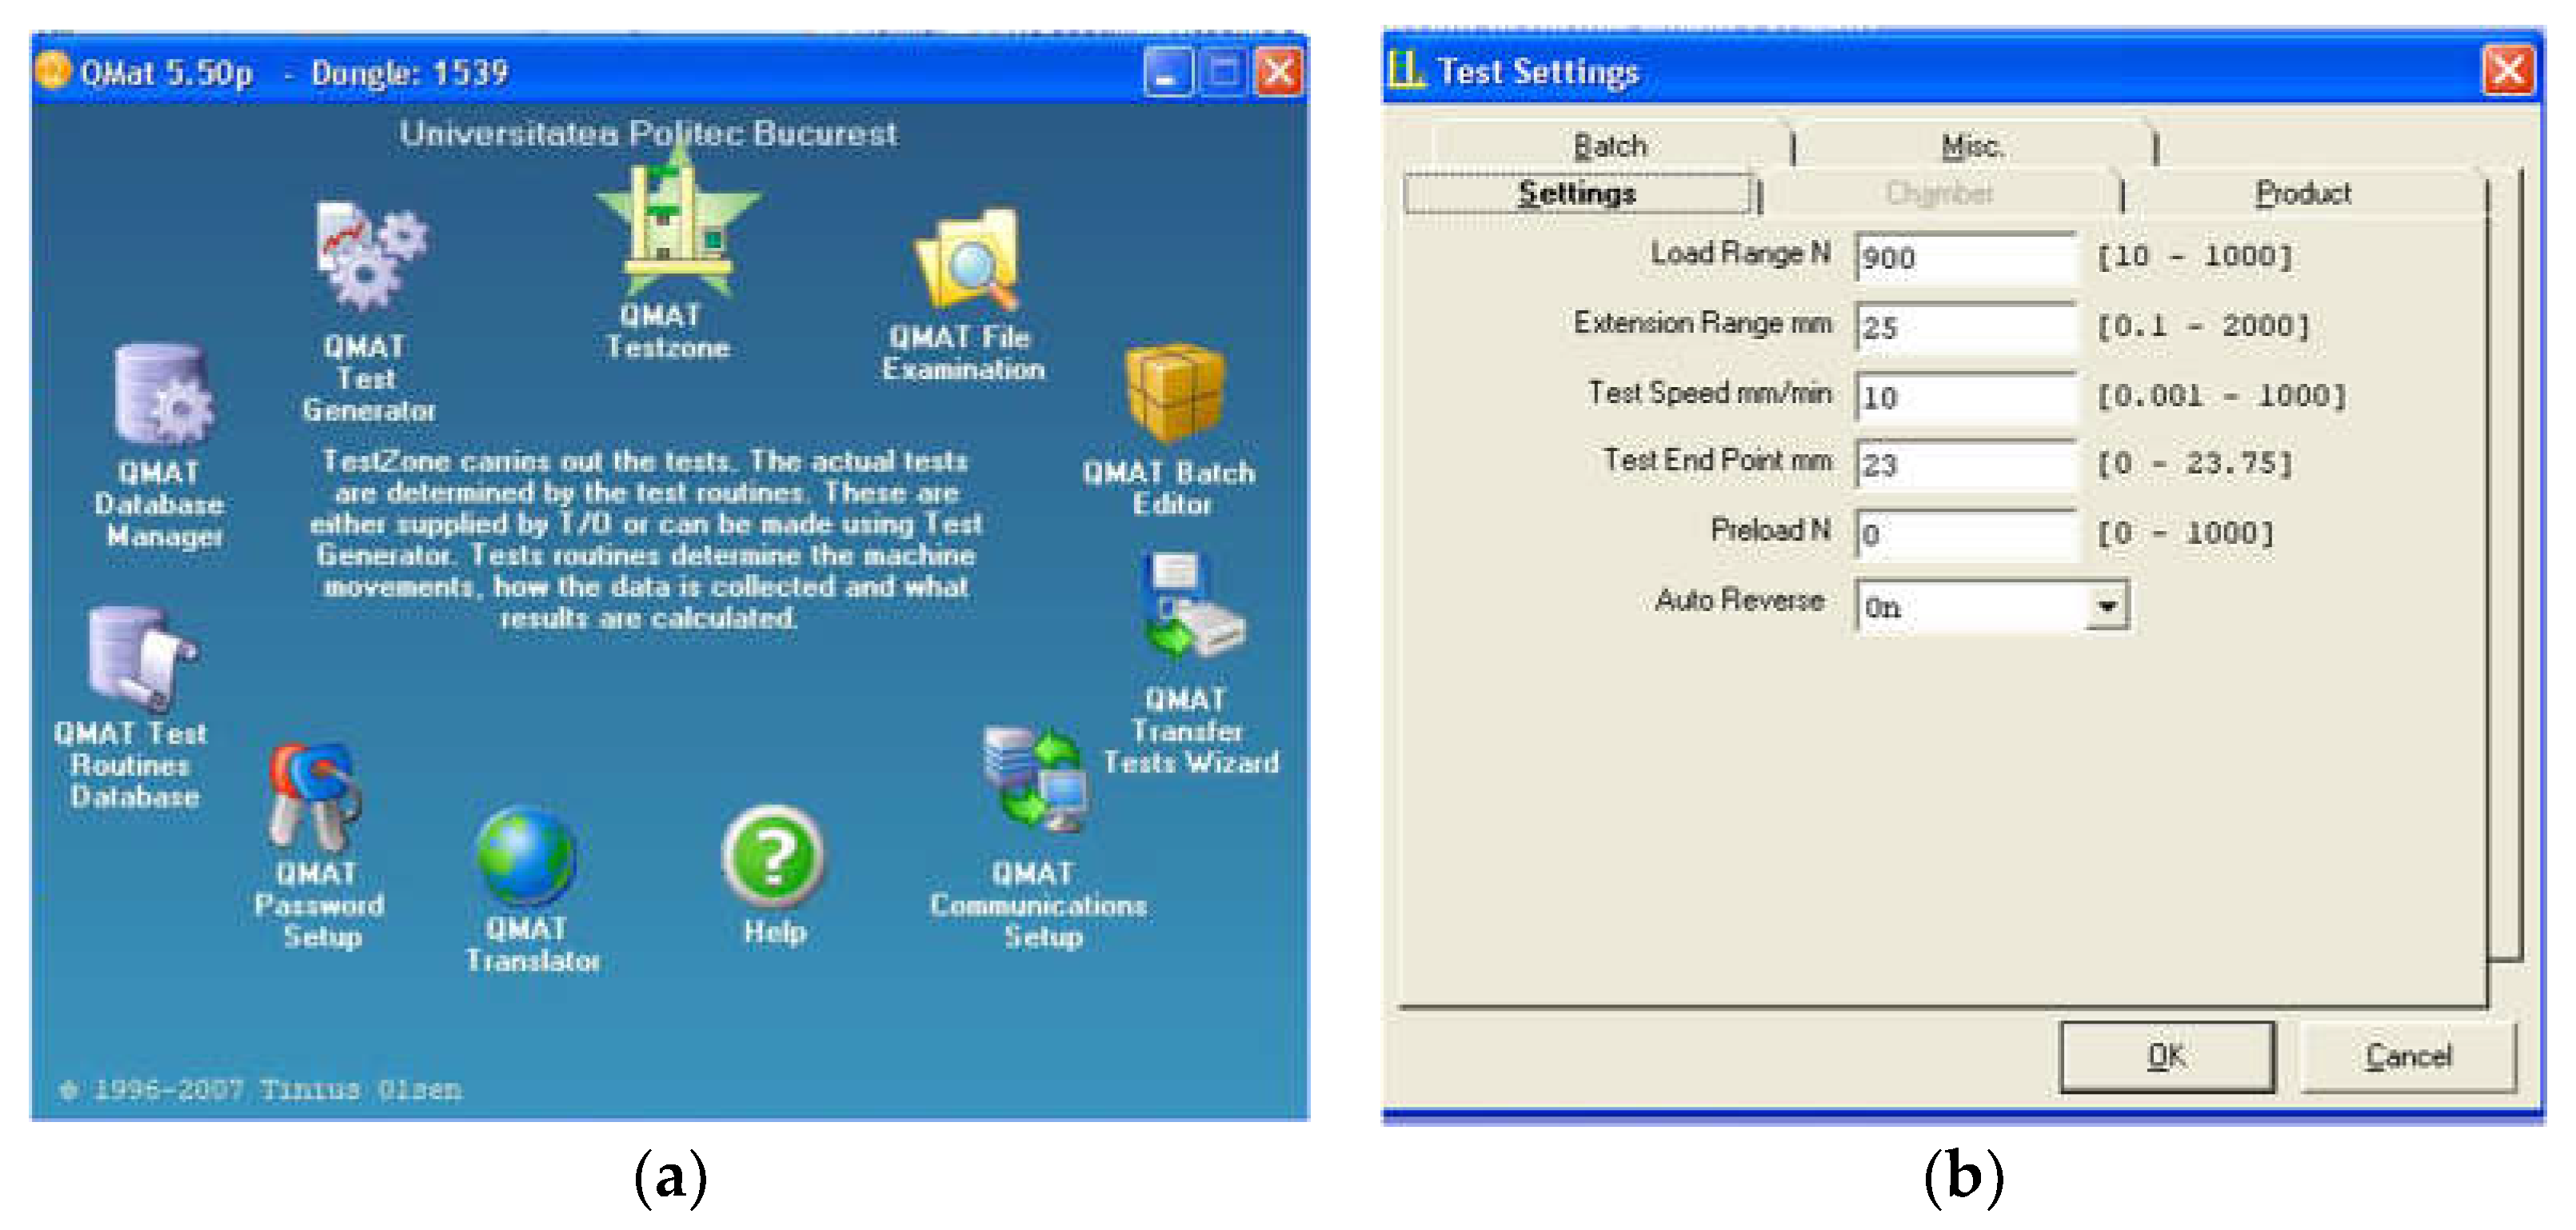
Figure 7.
Experimental Results for 9-Degree Cone Penetration Tests: (a) screenshot (QMat) cone speed of 12 mm/min.; (b) screenshot (QMat) cone speed of 30 mm/min.; (c) screenshot (QMat) cone speed of 60 mm/min.; (d) the average penetration force values obtained from at the speed of 12 mm/min.; (e) the average penetration force values obtained at the speed of 30 mm/min.; (f) the average penetration force values obtained at the speed of 60 mm/min.
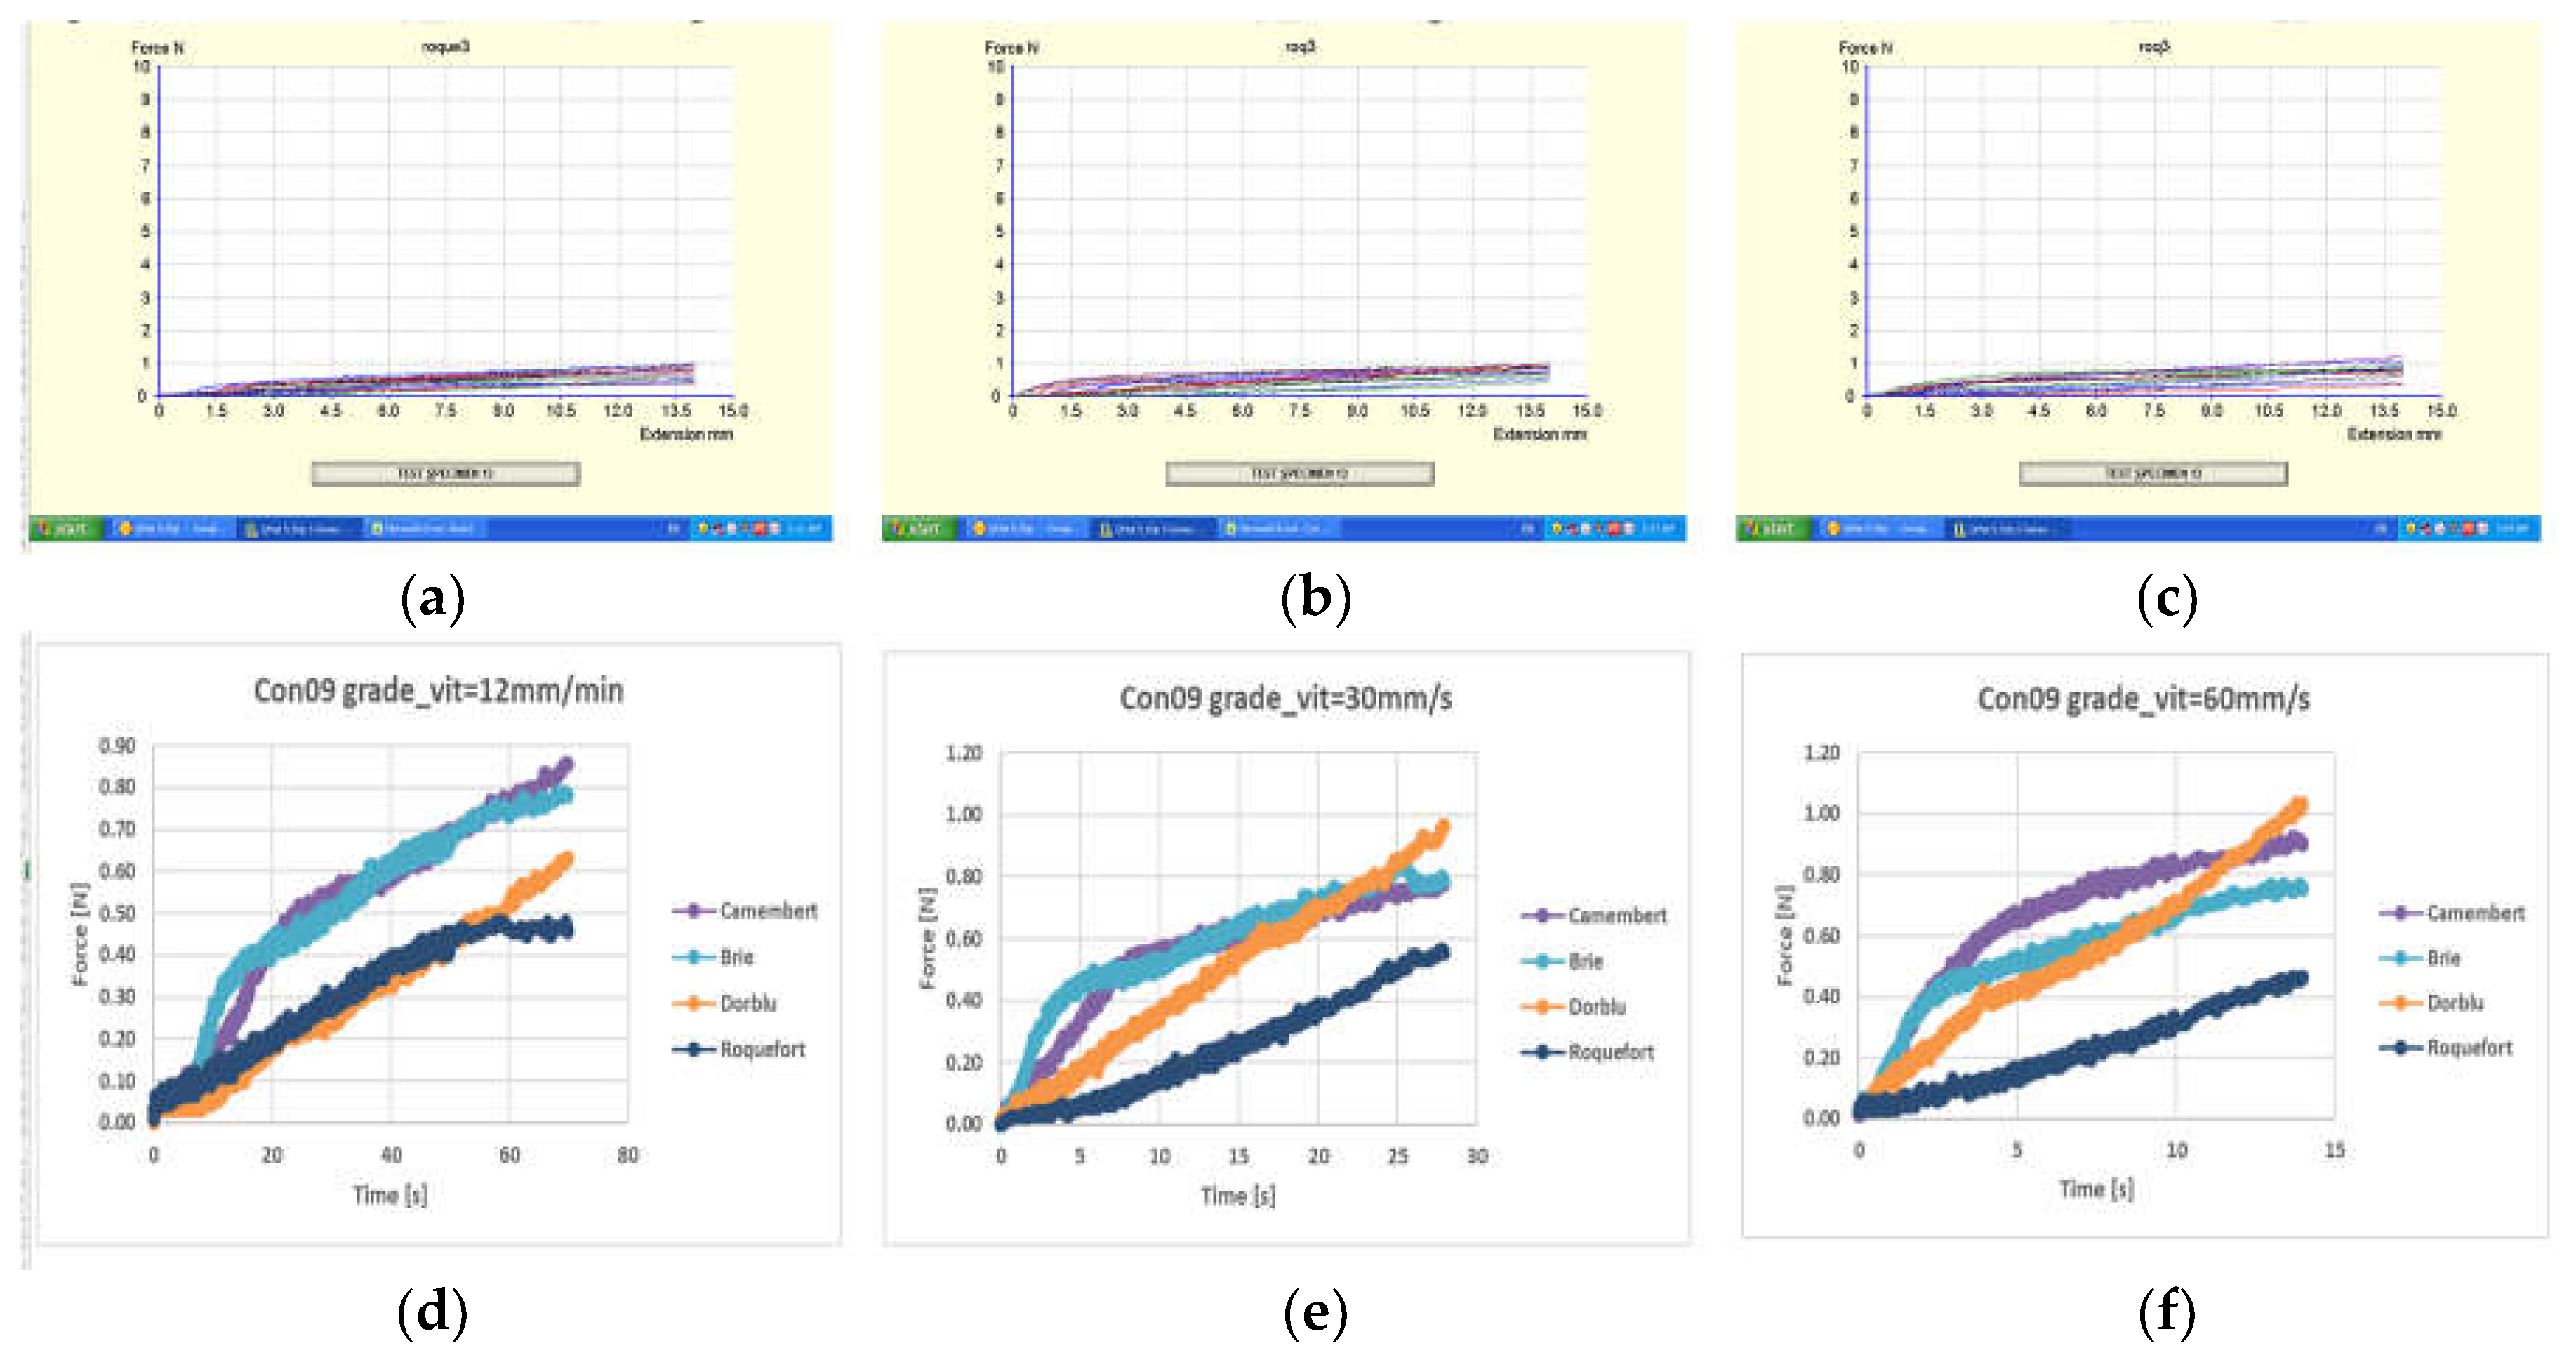
Figure 8.
Experimental Results for 19-Degree Cone Penetration Tests: (a) Screen capture (QMat) cone speed of 12 mm/min.; (b Screen capture (QMat) cone speed of 30 mm/min.; (c) Screen capture (QMat) cone speed of 60 mm/min.; (d) the mean penetration force obtained from the speed of 12 mm/min.; (e) the mean penetration force obtained from the speed of 30 mm/min.; (f) the mean penetration force obtained from the speed of 60 mm/min.
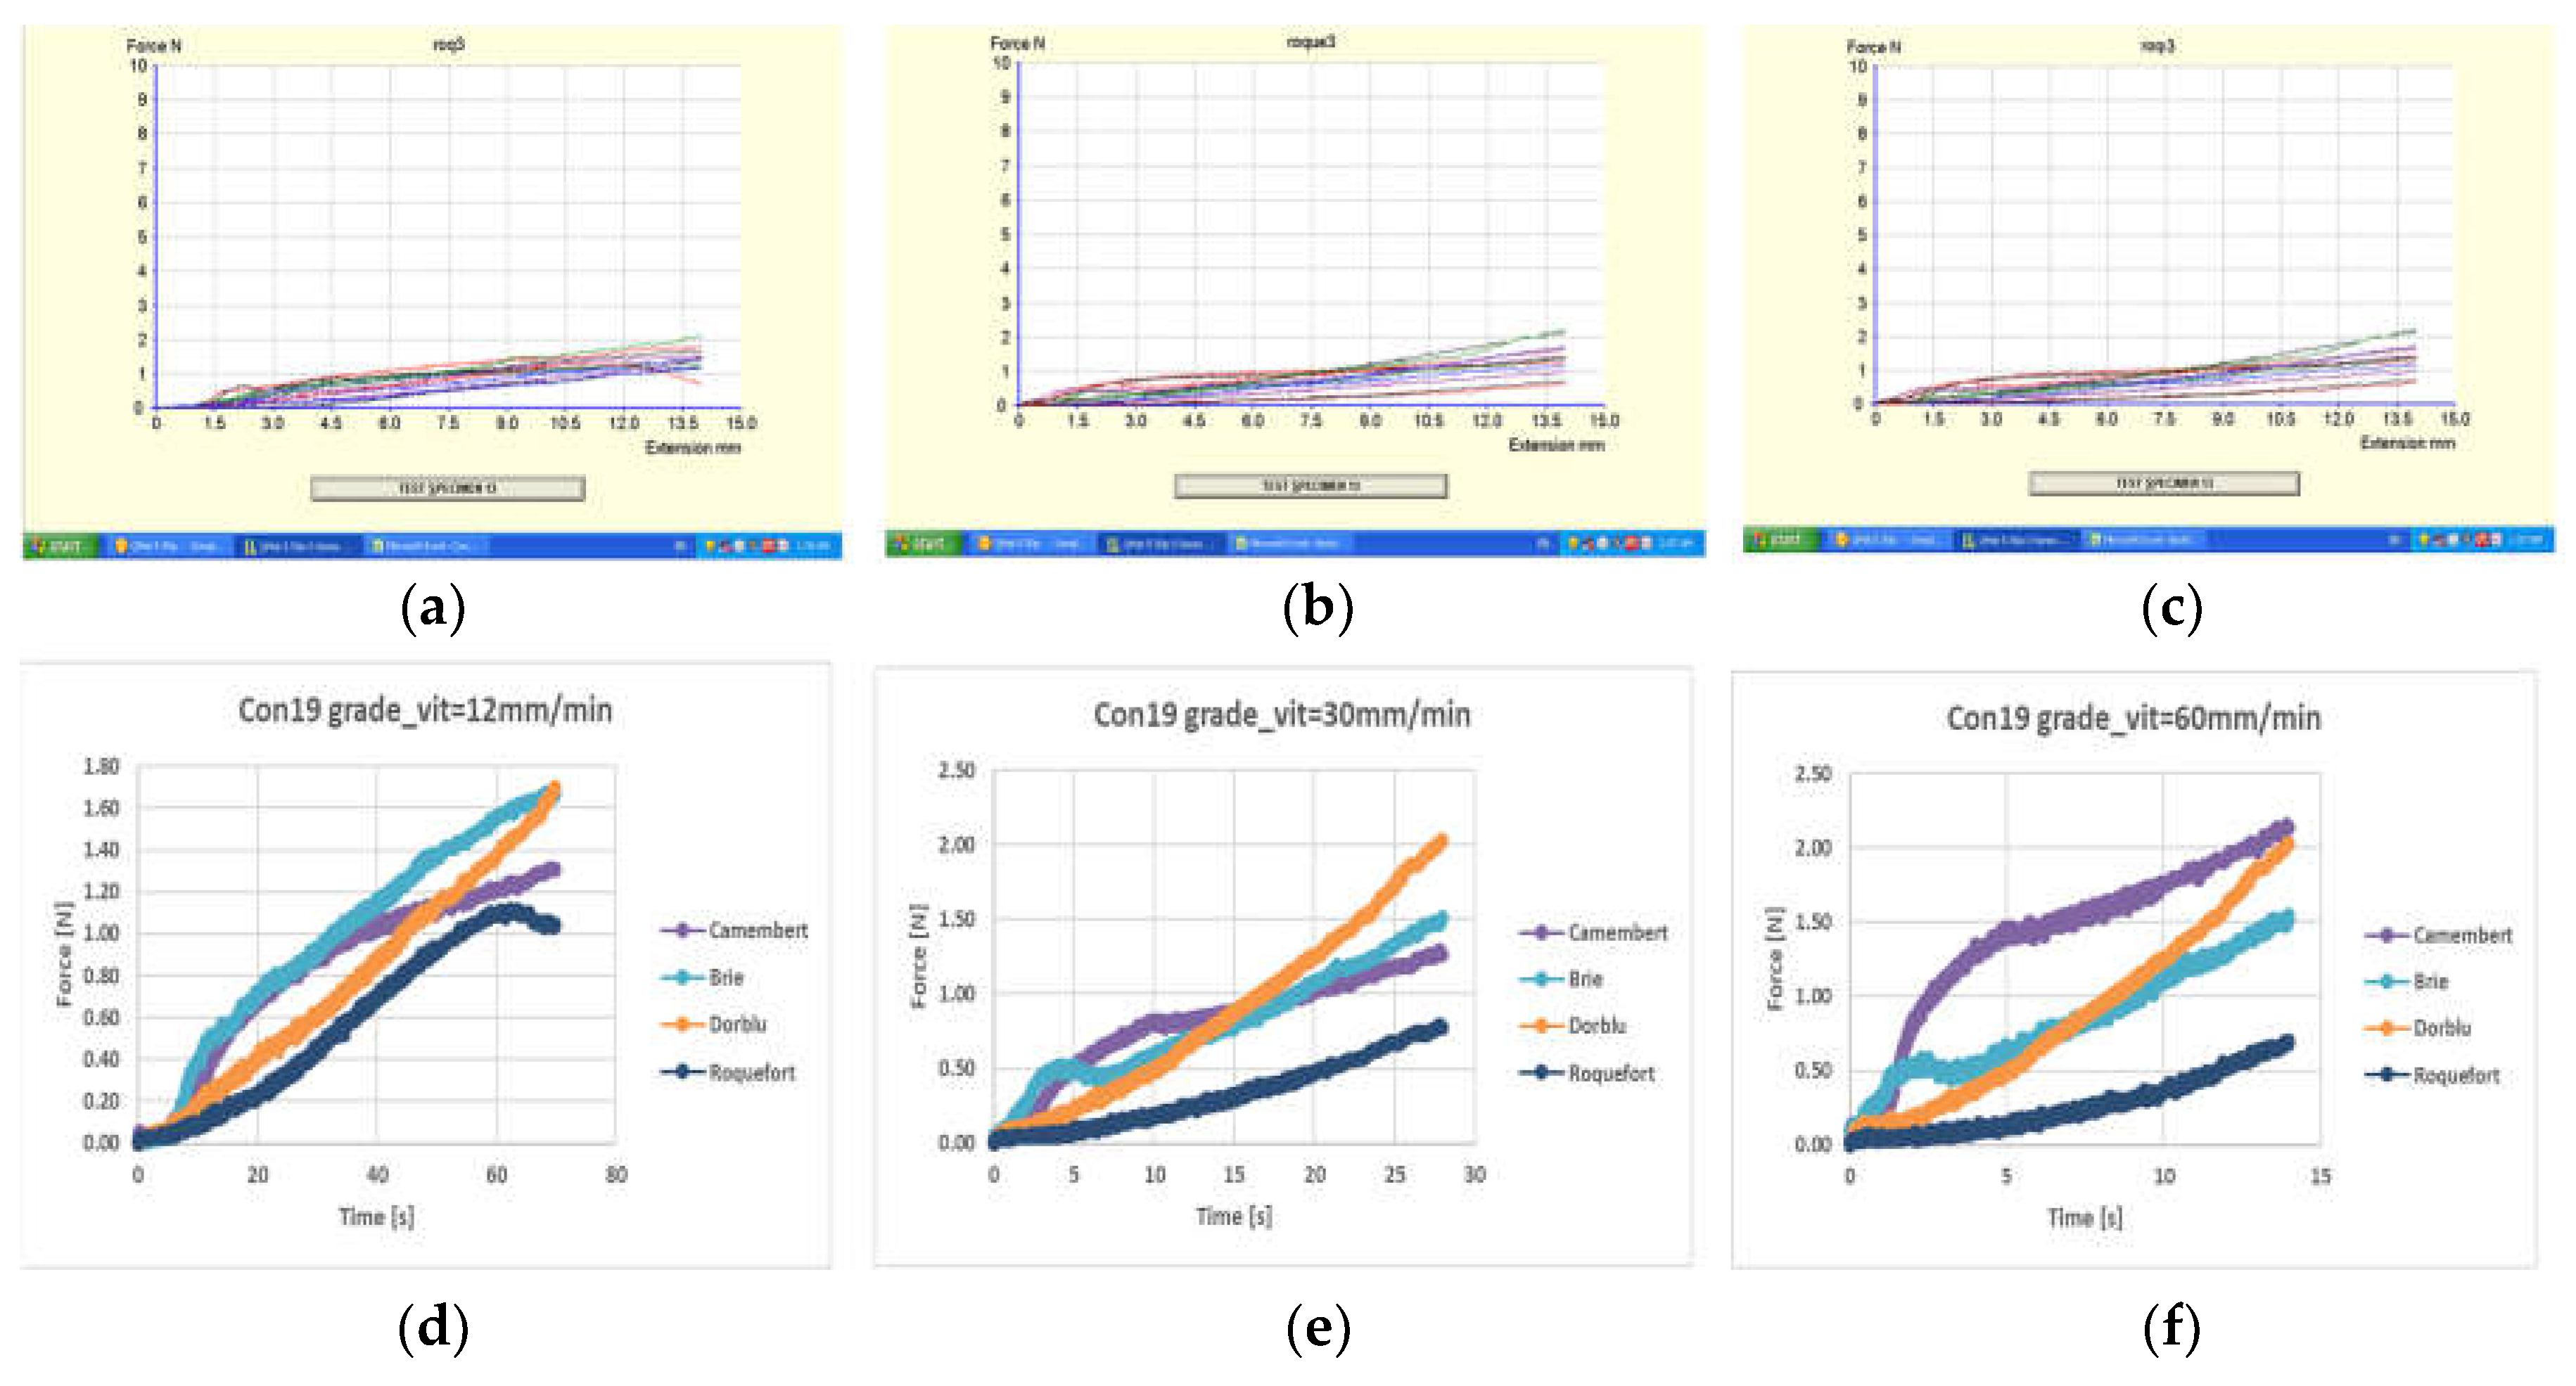
Figure 9.
Experimental Results for 19-Degree Cone Penetration Tests: (a) Screen capture (QMat) at speed cone of 12 mm/min.; (b) Screen capture (QMat) at speed cone of 30 mm/min.; (c) Screen capture (QMat) at speed cone of 60 mm/min.; (d) the average force obtained from the speed of 12 mm/min.; (e) the average force obtained from the speed of 30 mm/min.; (f) the average force obtained from the speed of 60 mm/min.
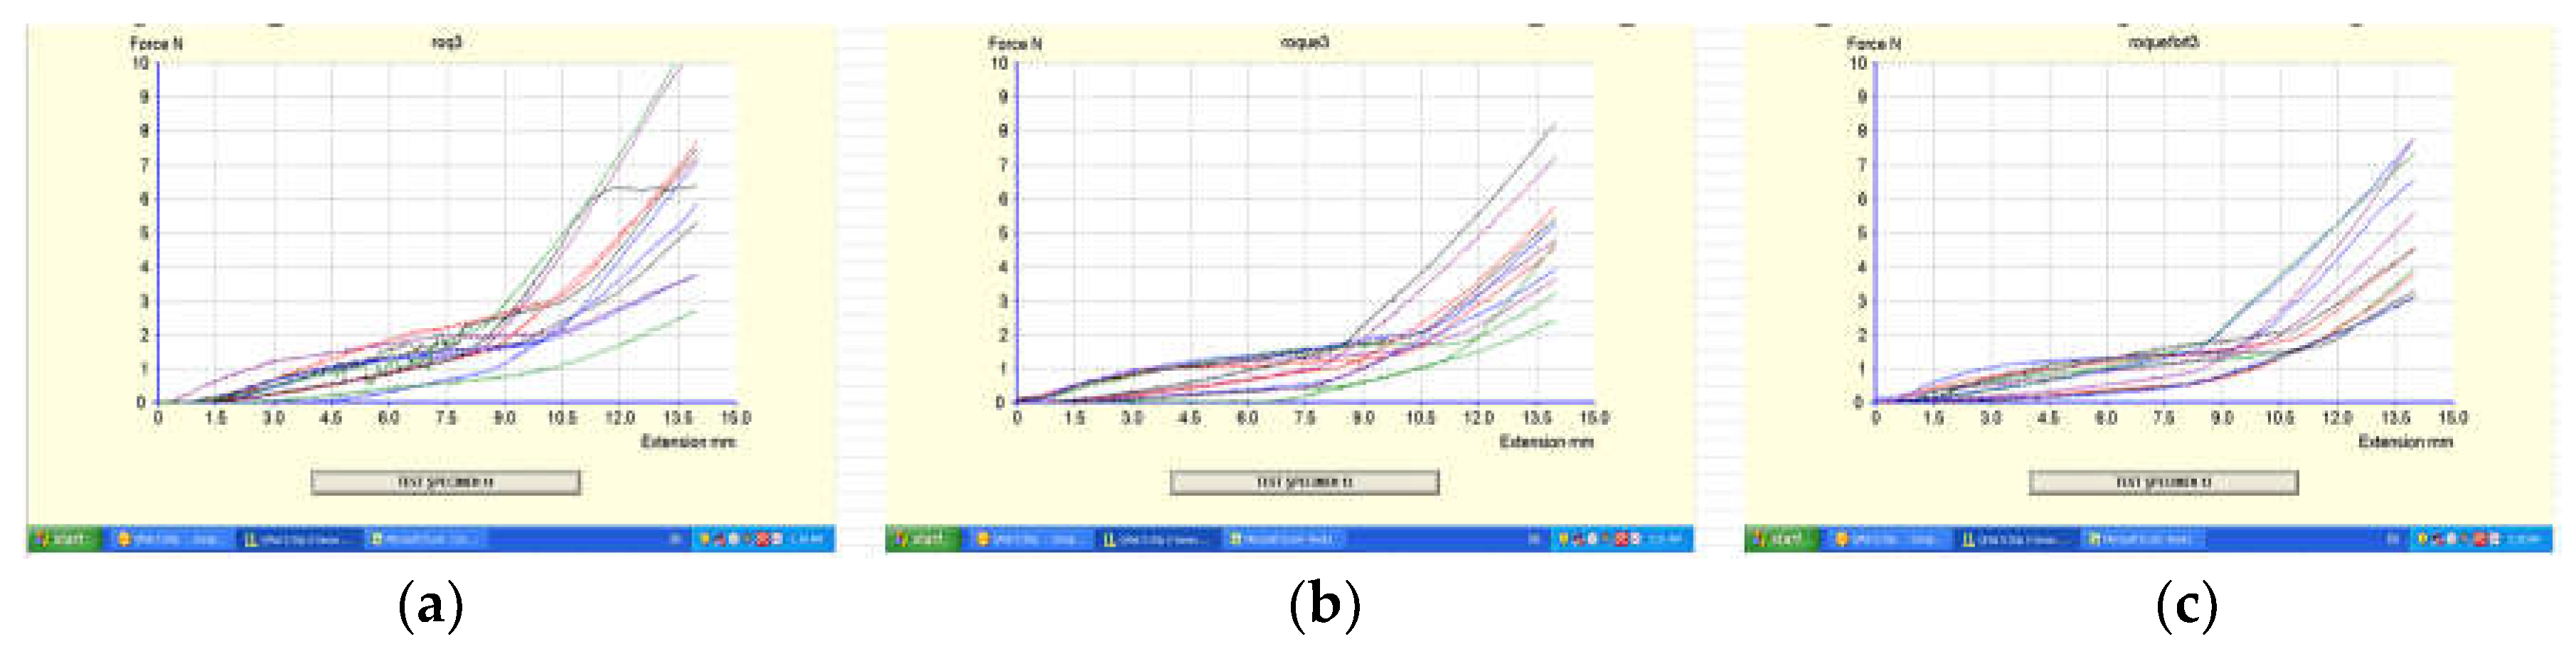
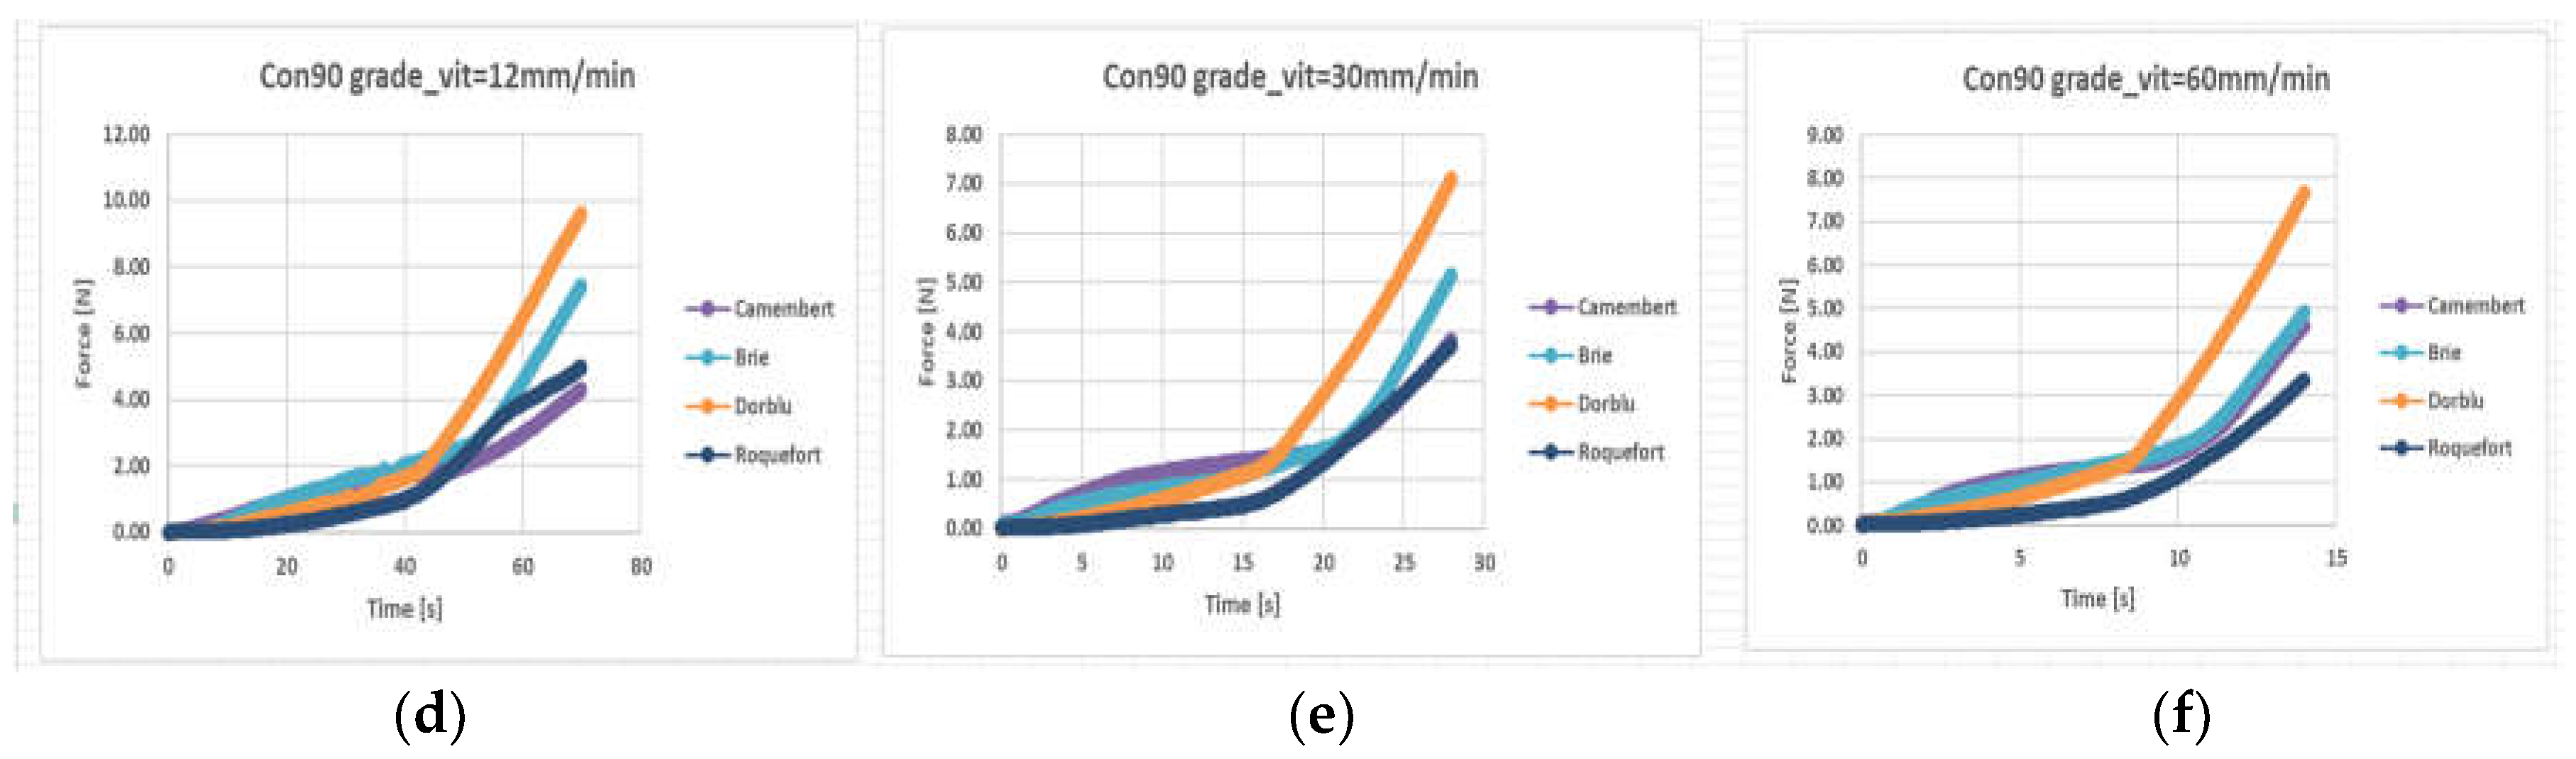
Figure 10.
Box plot charts of variance analysis ANOVA: (a) comparison of data distributions across groups cone of 9 and 19 degree; (b) comparison of data distributions across groups cone of 9 and 90 degree; (c) comparison of data distributions across groups cone of 19 and 90 degree.
Figure 10.
Box plot charts of variance analysis ANOVA: (a) comparison of data distributions across groups cone of 9 and 19 degree; (b) comparison of data distributions across groups cone of 9 and 90 degree; (c) comparison of data distributions across groups cone of 19 and 90 degree.
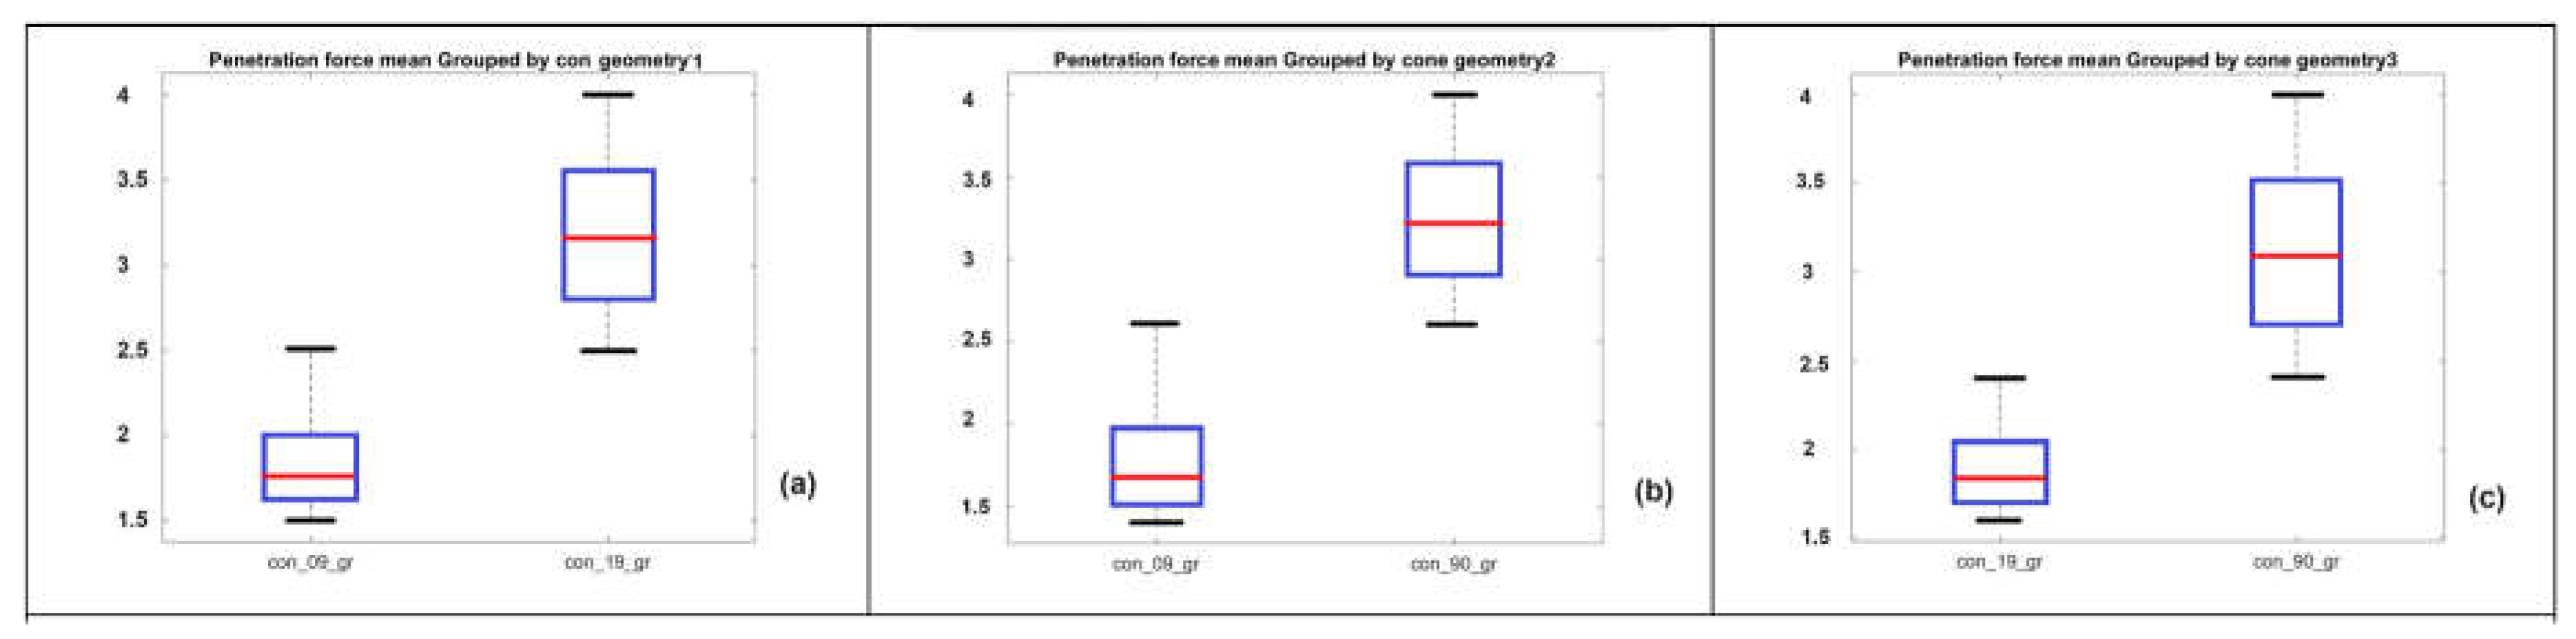
Figure 11.
Interactive graphical interface (GUI) for visualizing ANCOVA analysis.
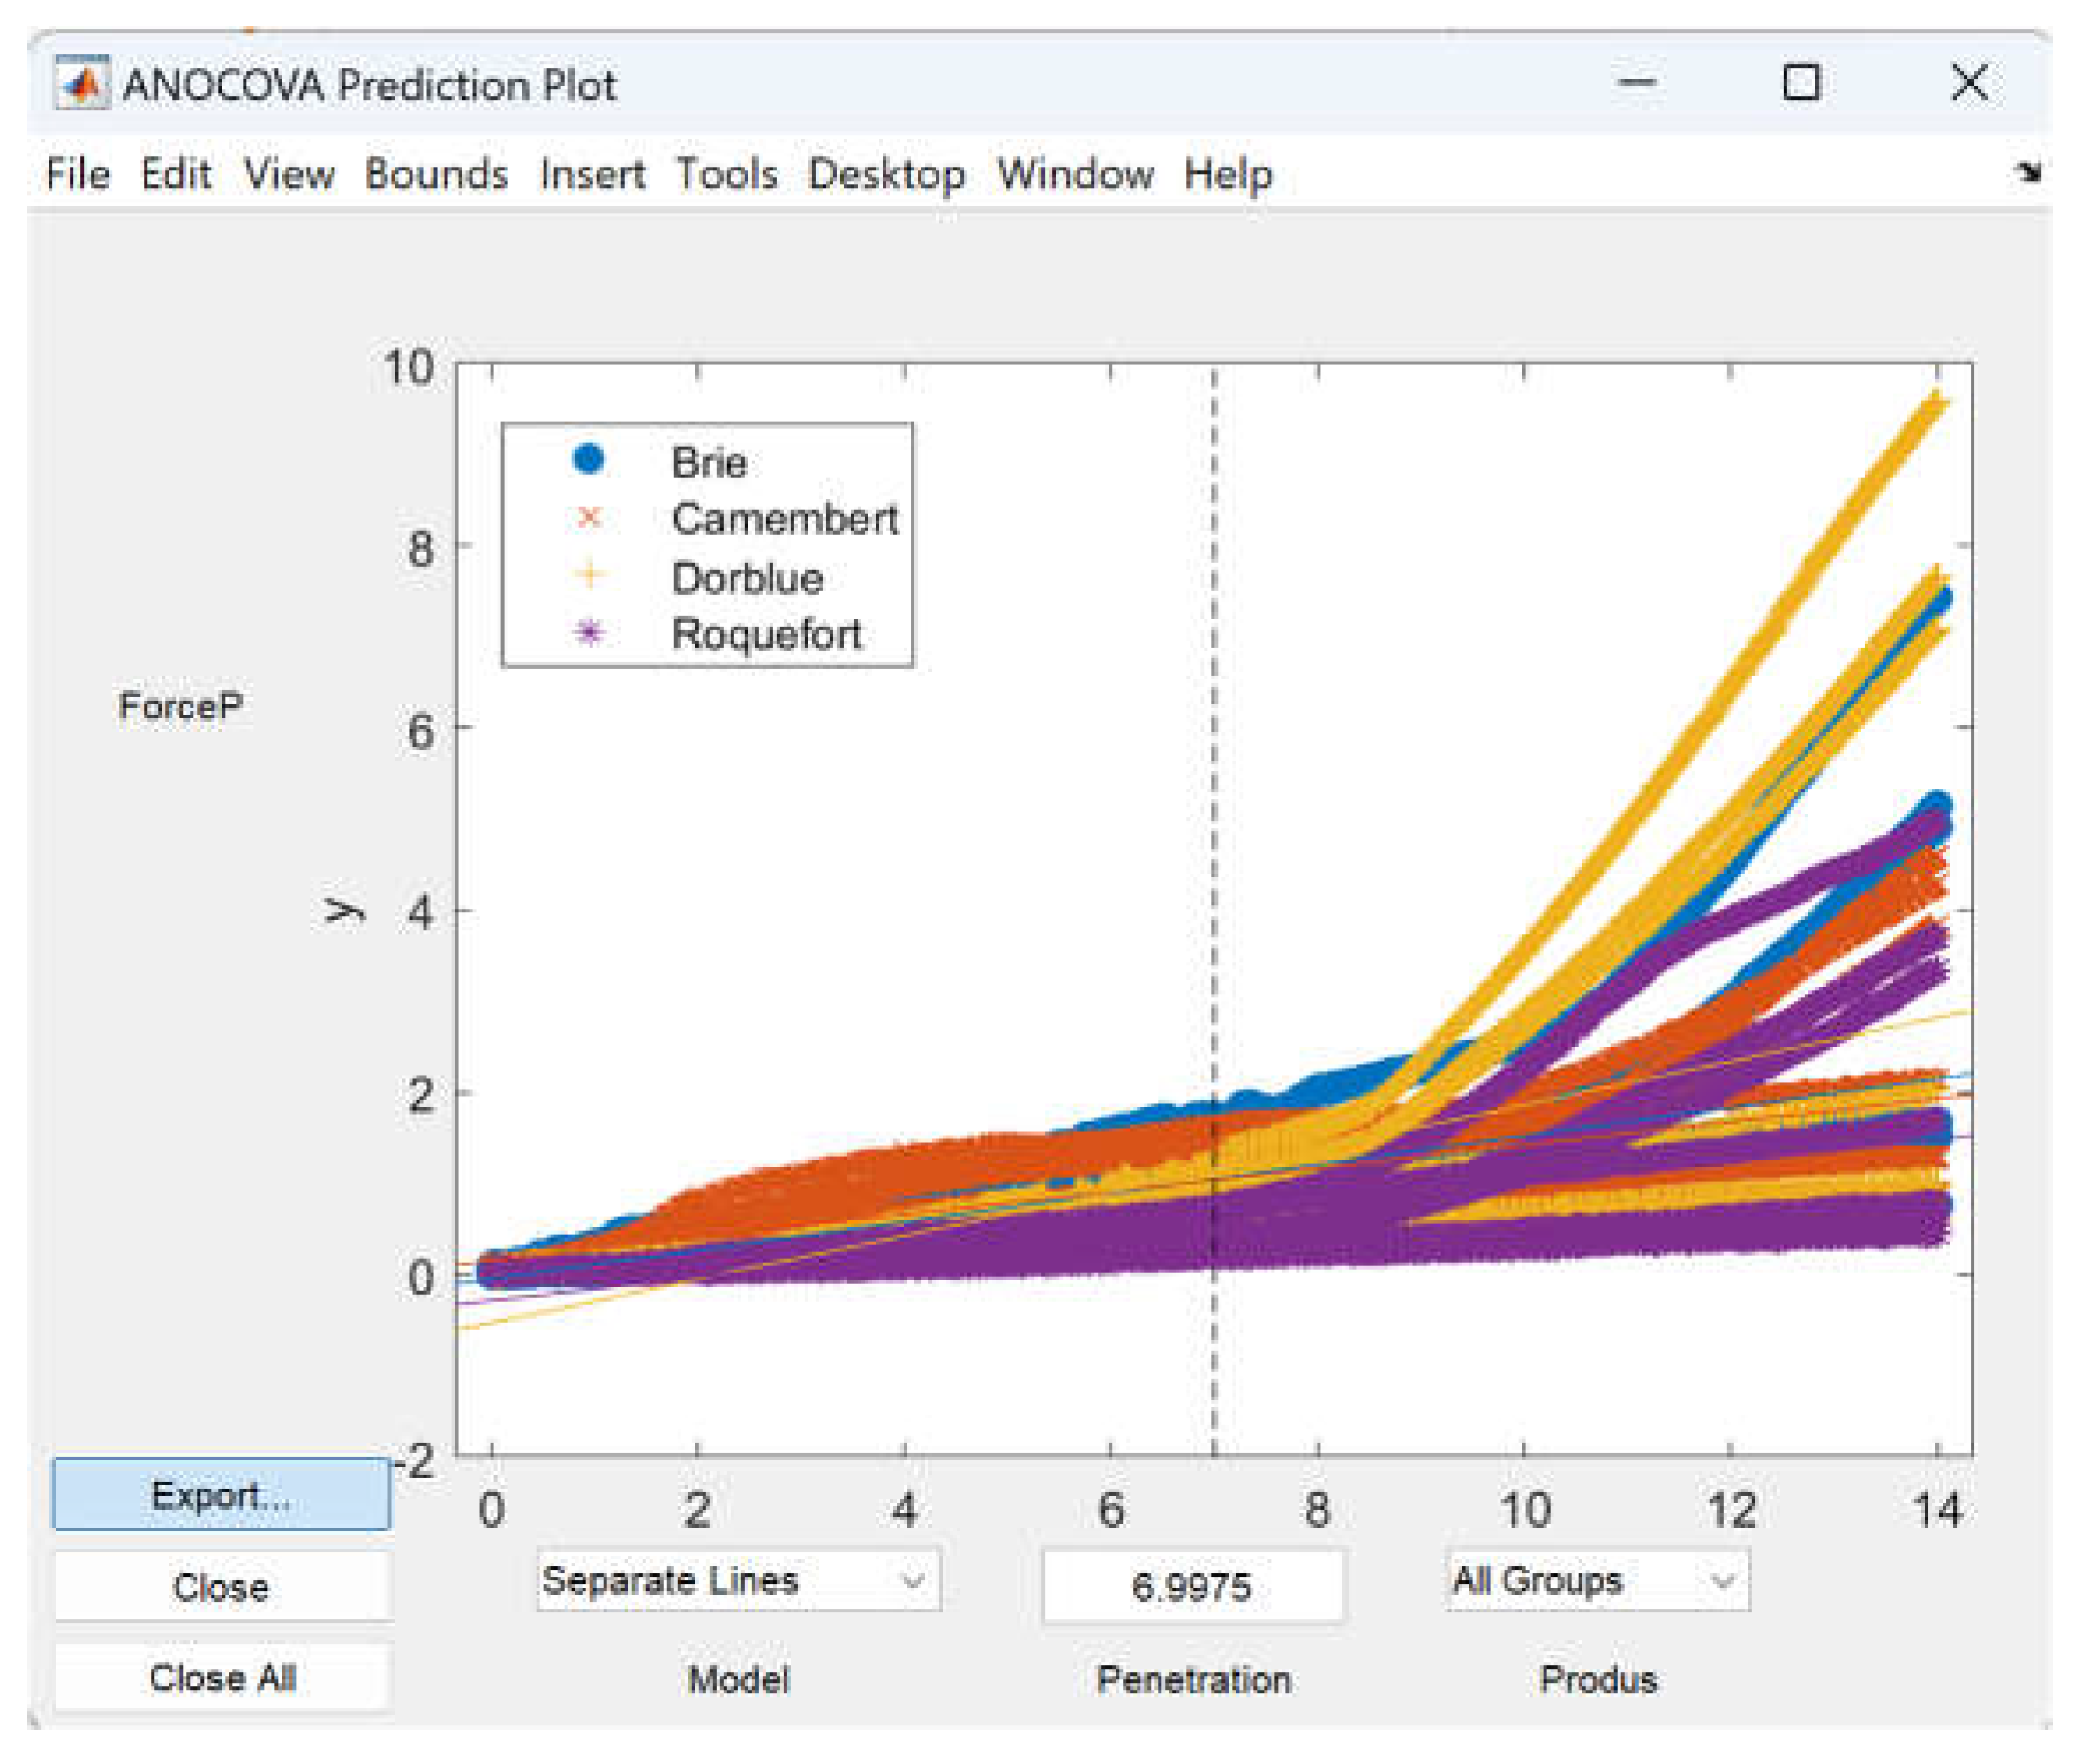
Figure 12.
Variation of penetration force [N] for Camembert cheese as a function of penetration speed (mm/s) and cone angle (degrees): (a) the 3D plot; (b) the contour plot.
Figure 12.
Variation of penetration force [N] for Camembert cheese as a function of penetration speed (mm/s) and cone angle (degrees): (a) the 3D plot; (b) the contour plot.
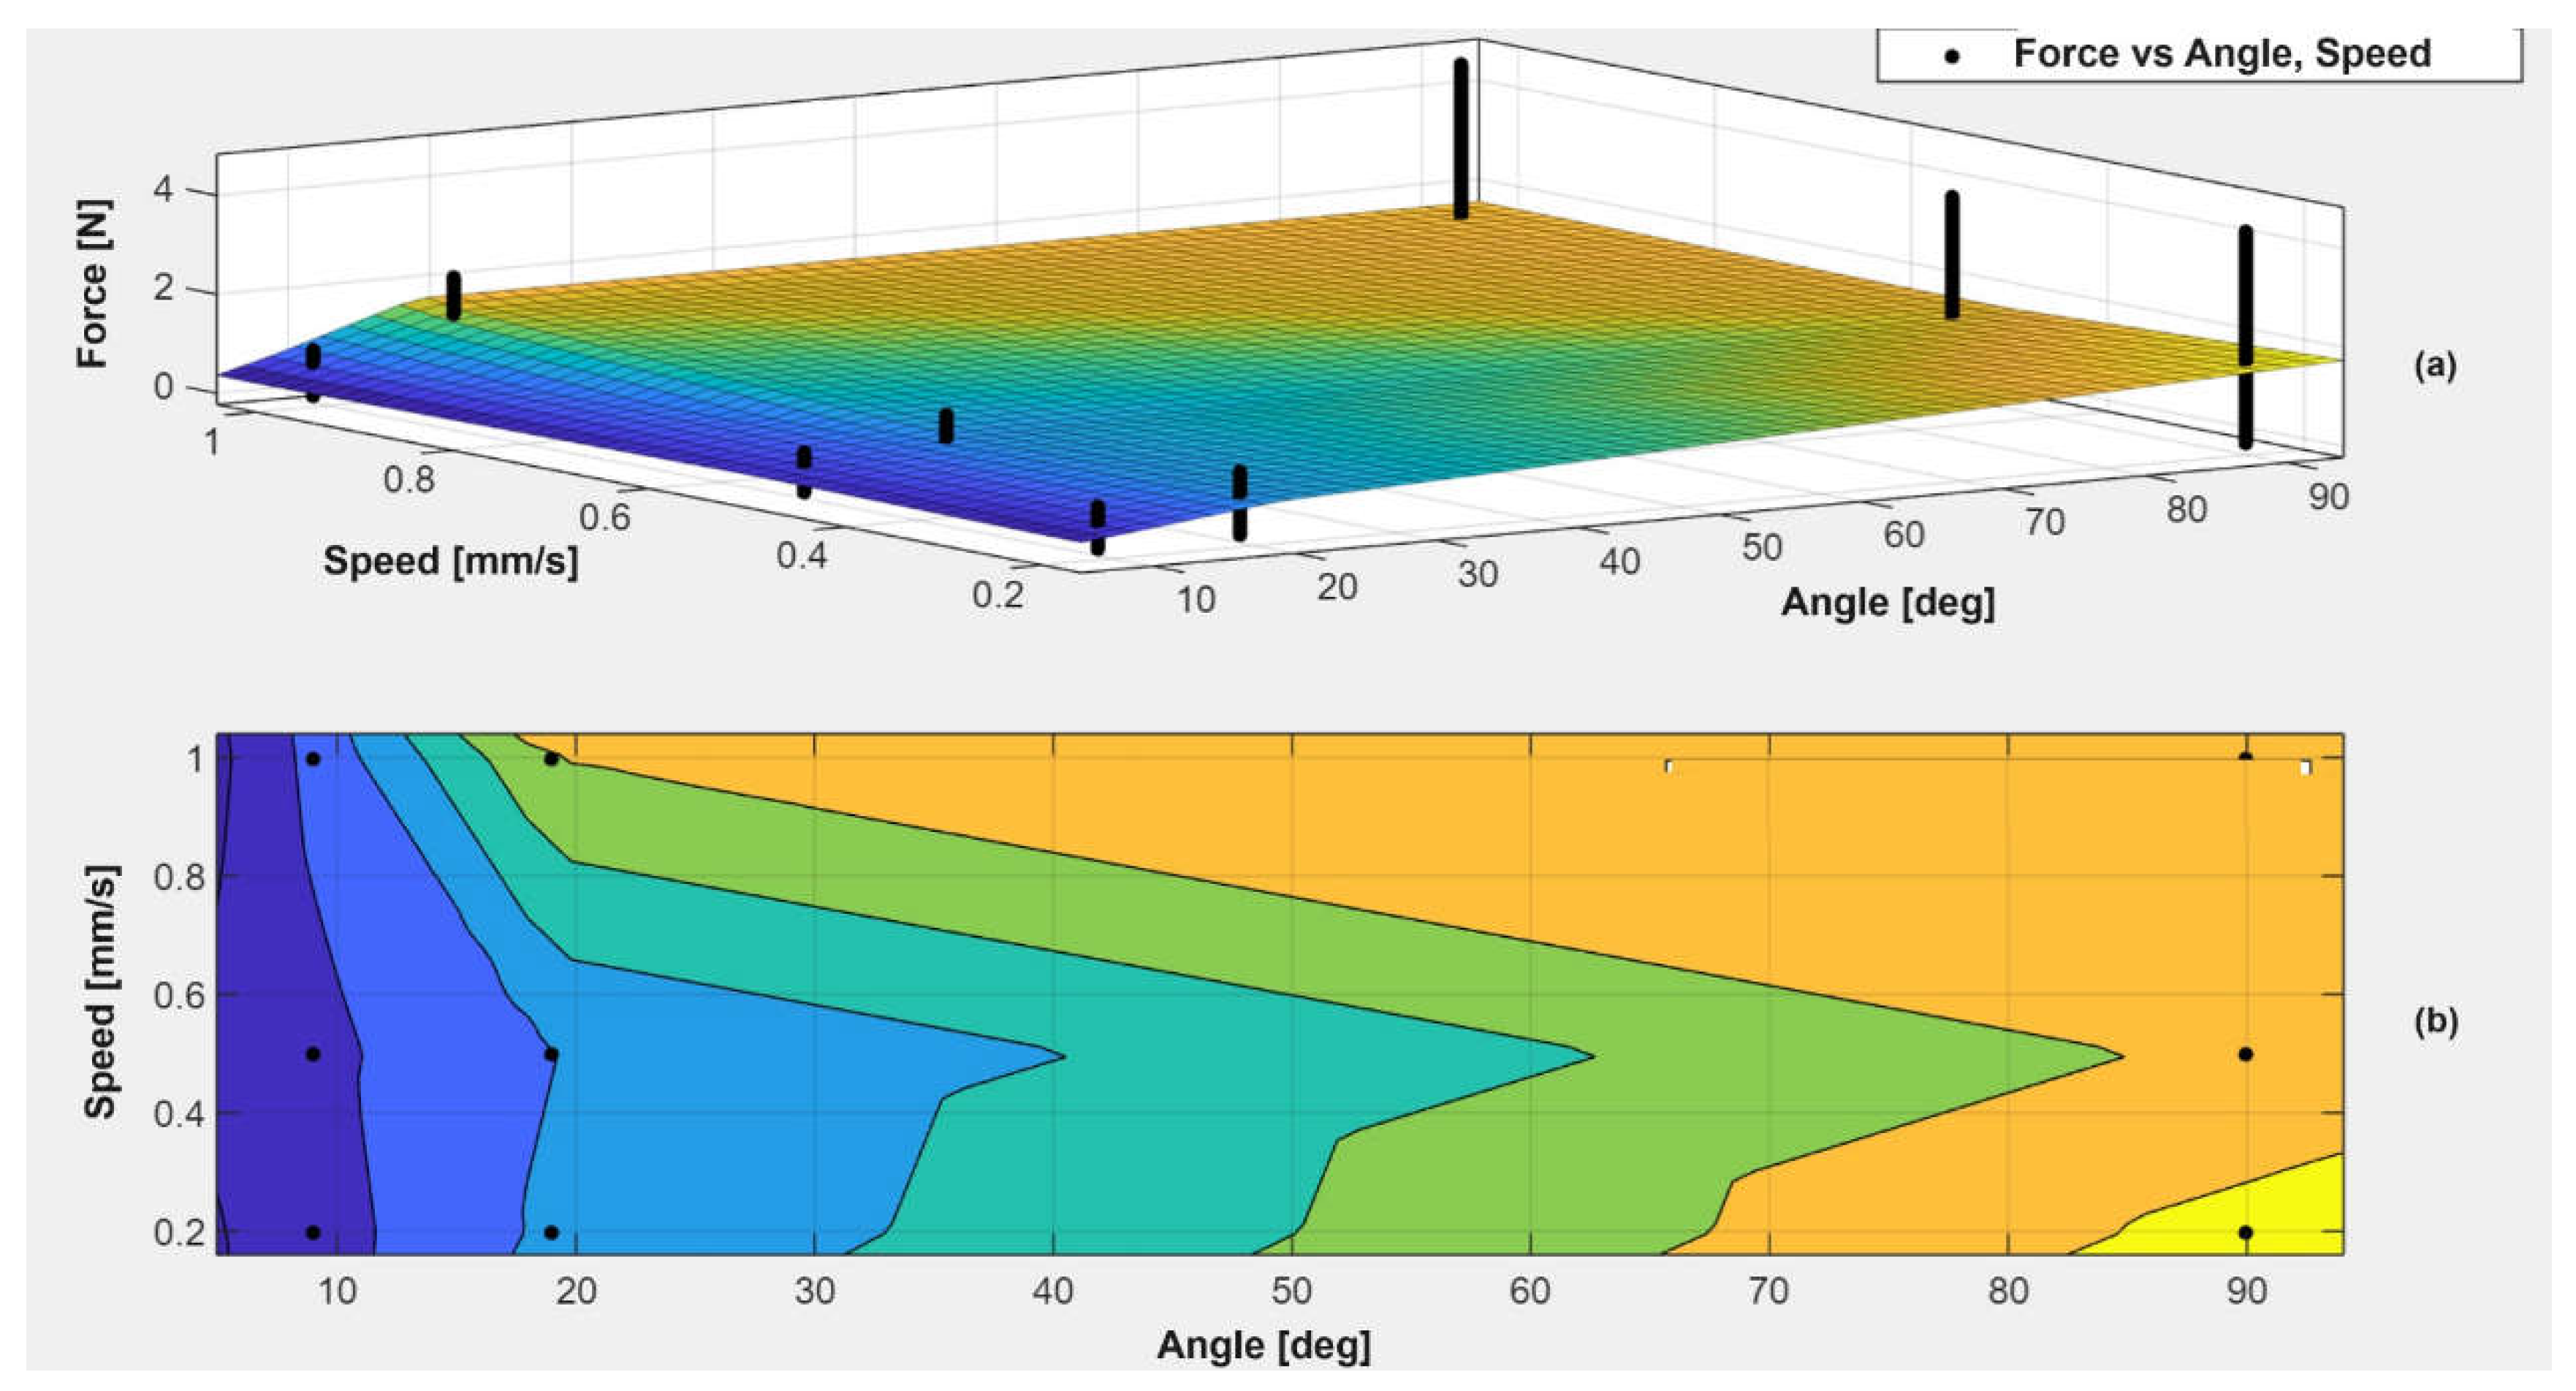
Figure 13.
Variation of penetration depth [N] for Camembert cheese, measured on an intact cheese sample, as a function of penetration speed (mm/s) and cone angle (degrees).
Figure 13.
Variation of penetration depth [N] for Camembert cheese, measured on an intact cheese sample, as a function of penetration speed (mm/s) and cone angle (degrees).
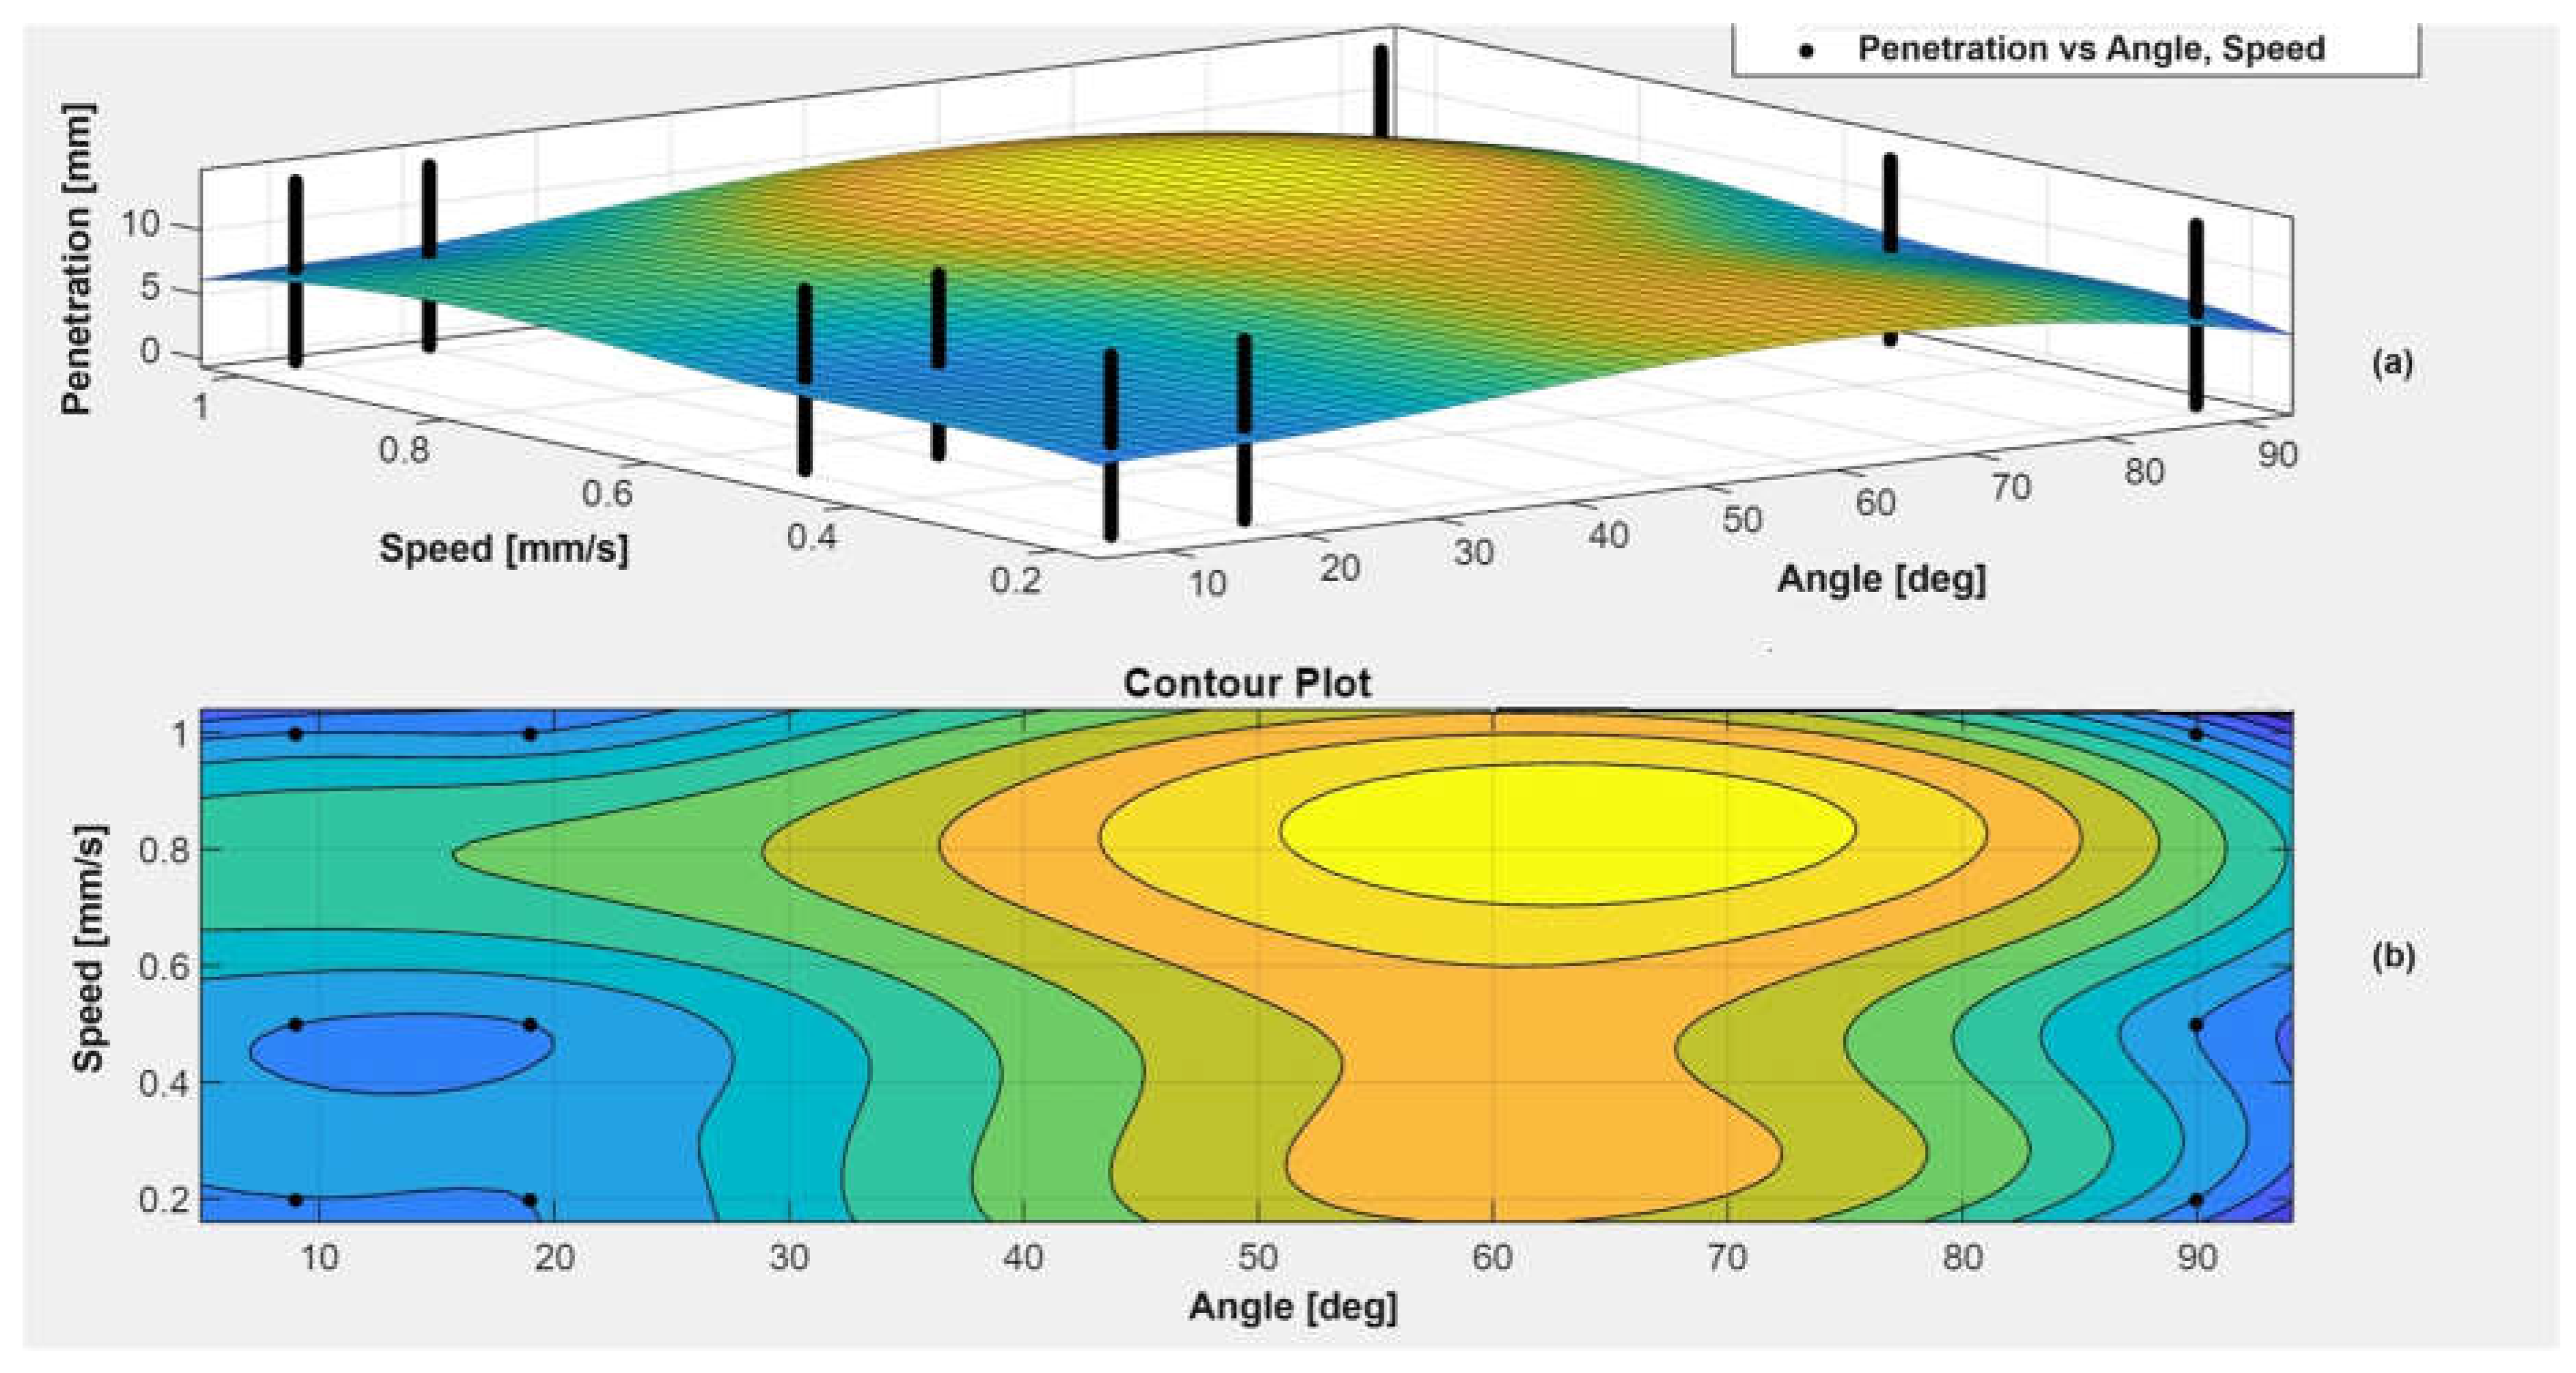
Figure 14.
Firmness index of the tested cheeses: (a) variation of FI as a function of penetration speed; (b) variation of FI as a function of the penetration cone.
Figure 14.
Firmness index of the tested cheeses: (a) variation of FI as a function of penetration speed; (b) variation of FI as a function of the penetration cone.
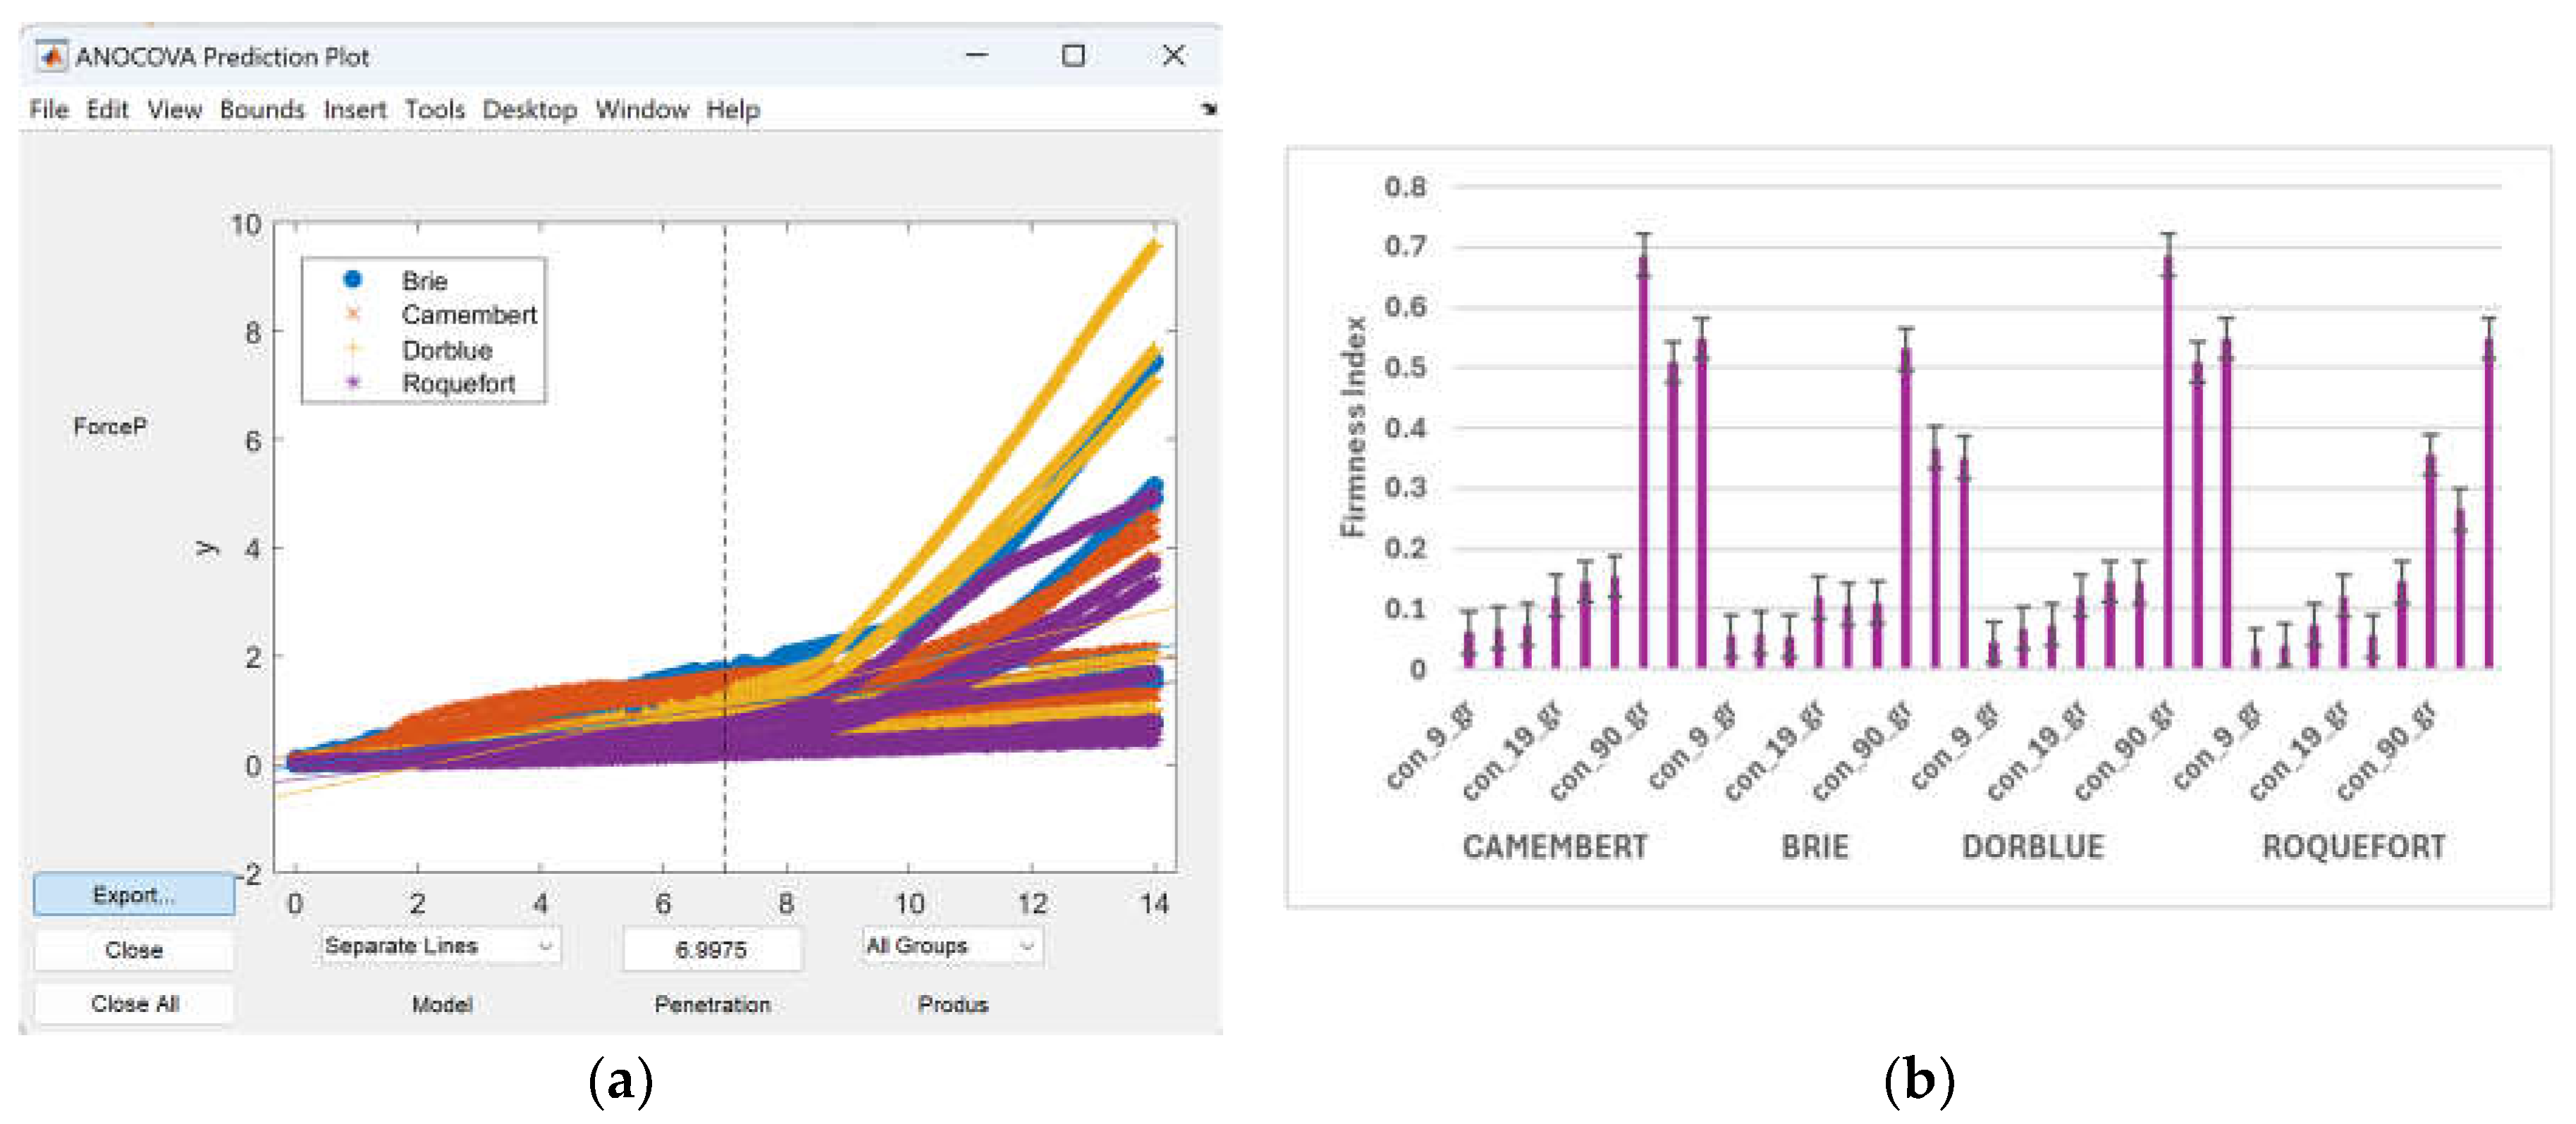
Figure 15.
Analysis of moisture content for cheese varieties: (a) moisture ratio; (b) cumulative water content curve.
Figure 15.
Analysis of moisture content for cheese varieties: (a) moisture ratio; (b) cumulative water content curve.
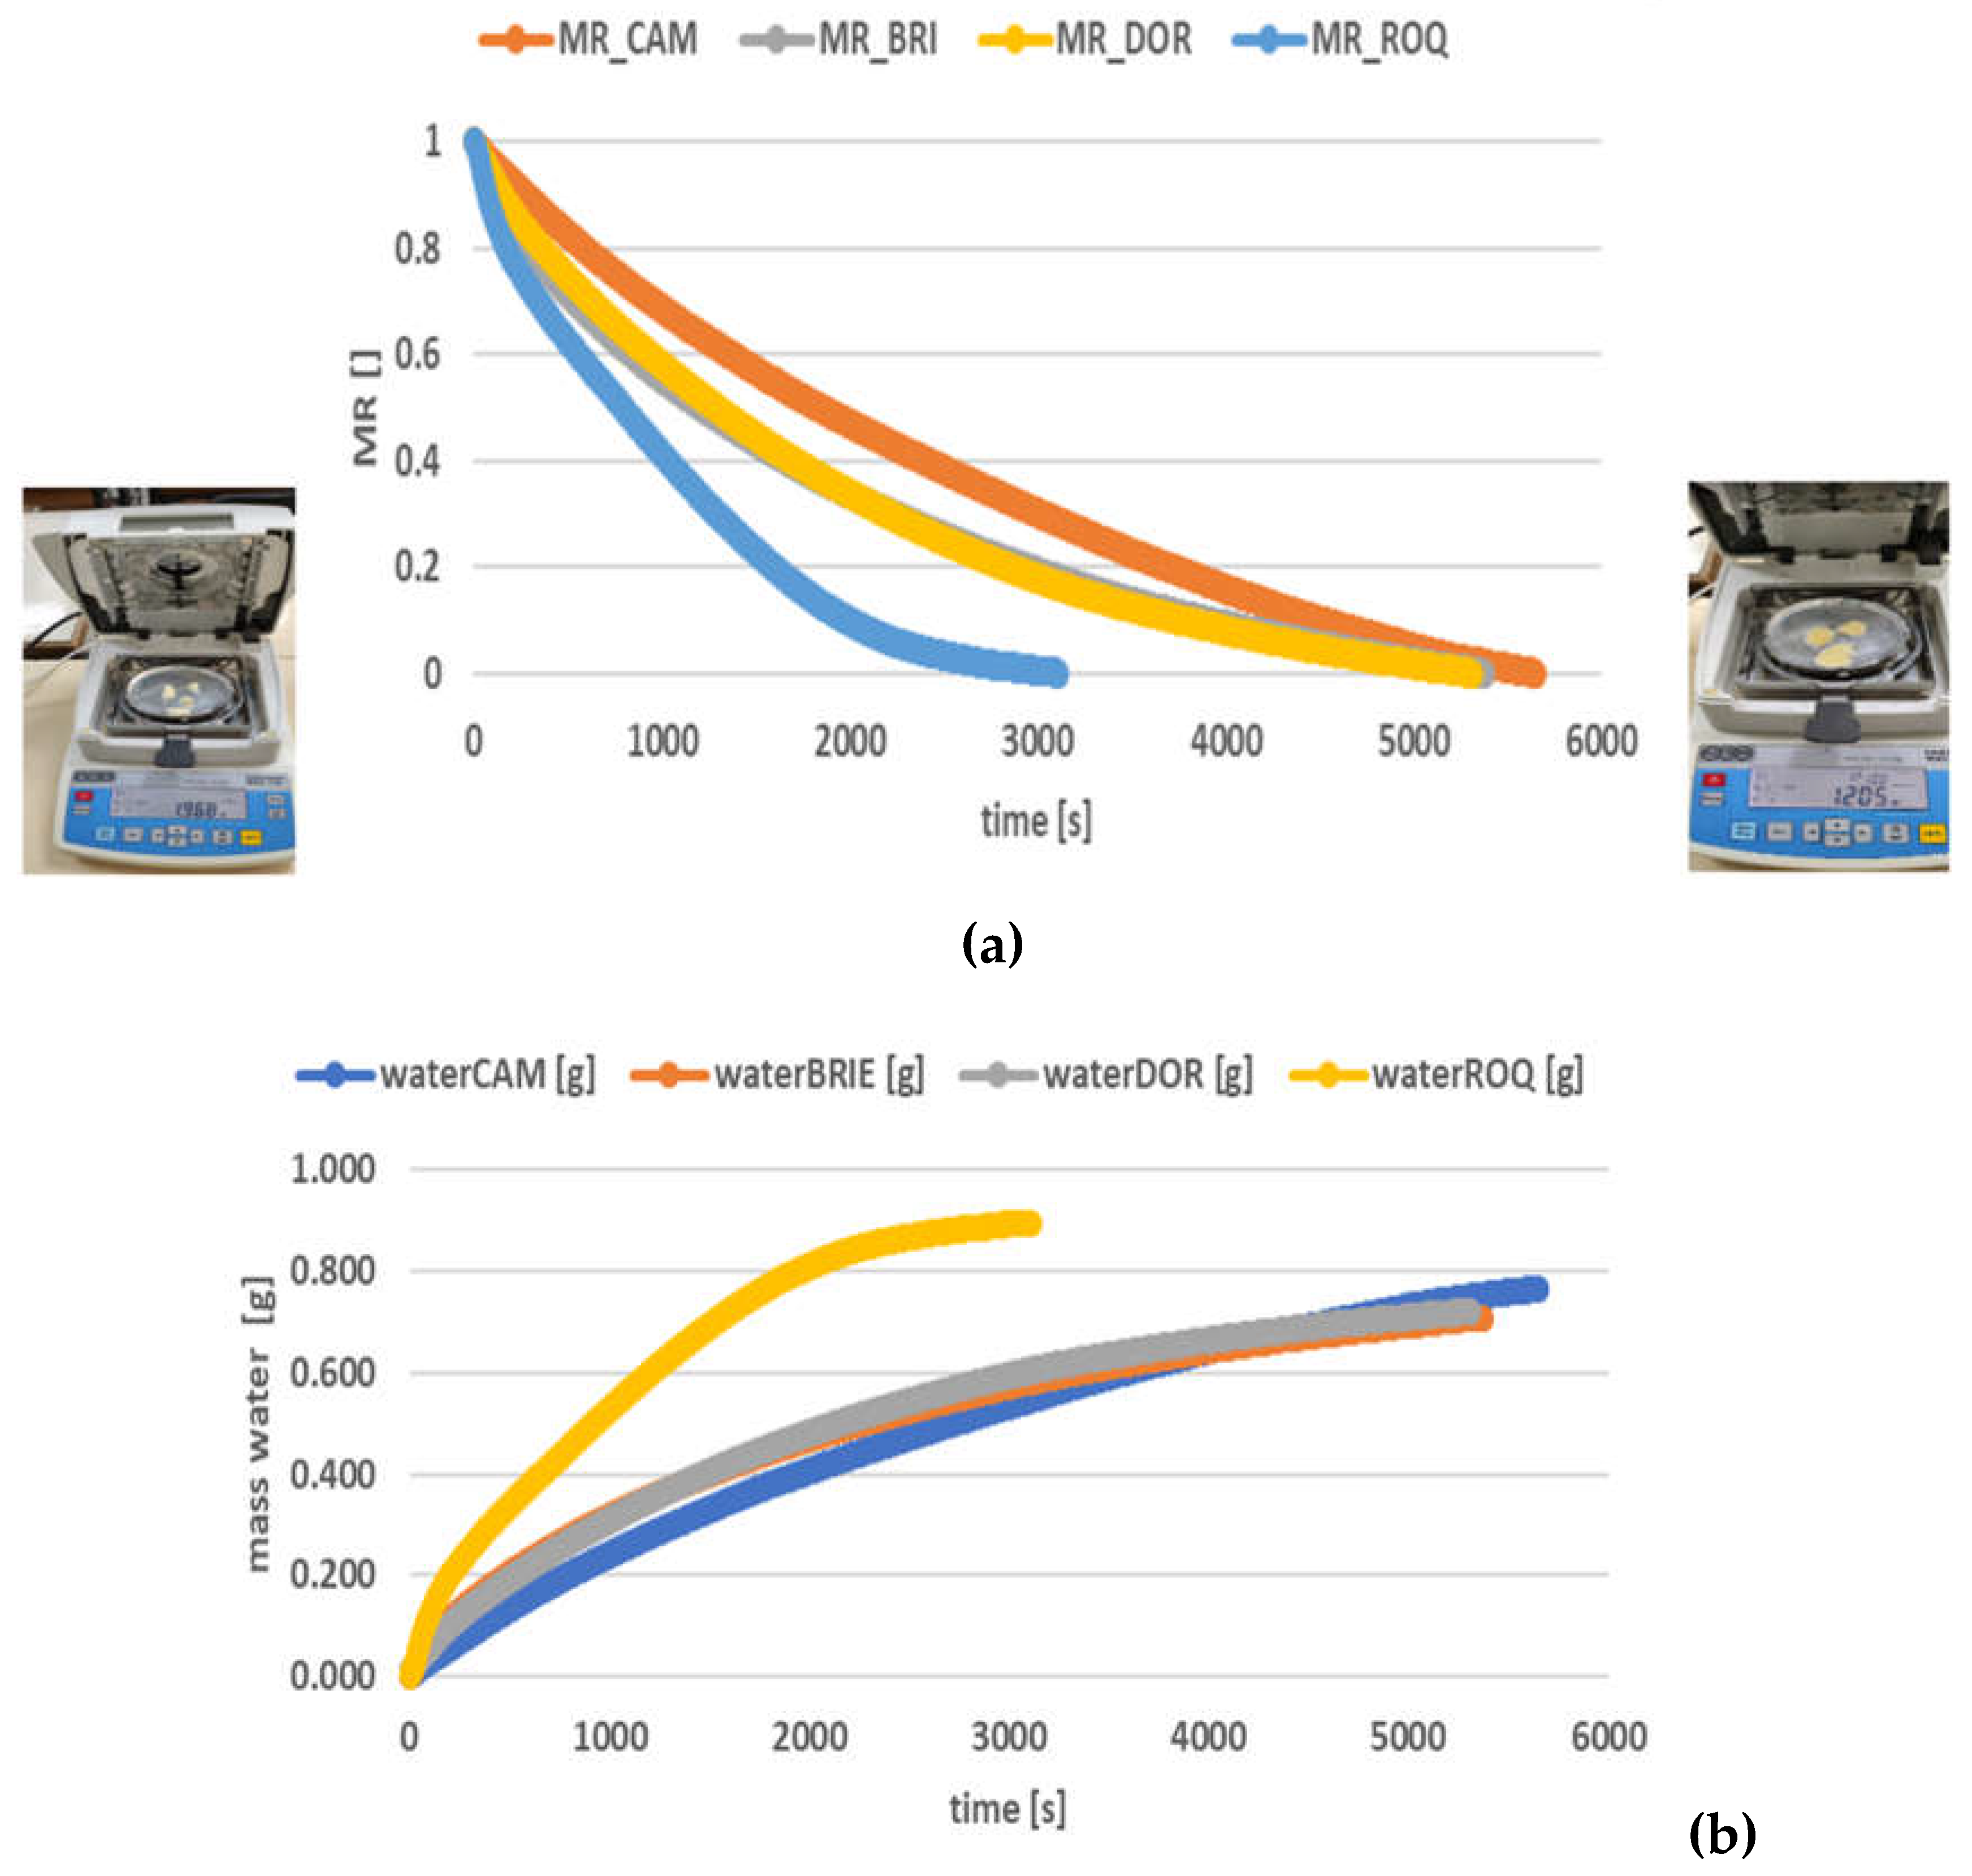
Figure 16.
Variation of shear stresses and apparent viscosity for Camembert cheese as a function of the deformation rate: (a) shear stresses; (b) apparent viscosity.
Figure 16.
Variation of shear stresses and apparent viscosity for Camembert cheese as a function of the deformation rate: (a) shear stresses; (b) apparent viscosity.
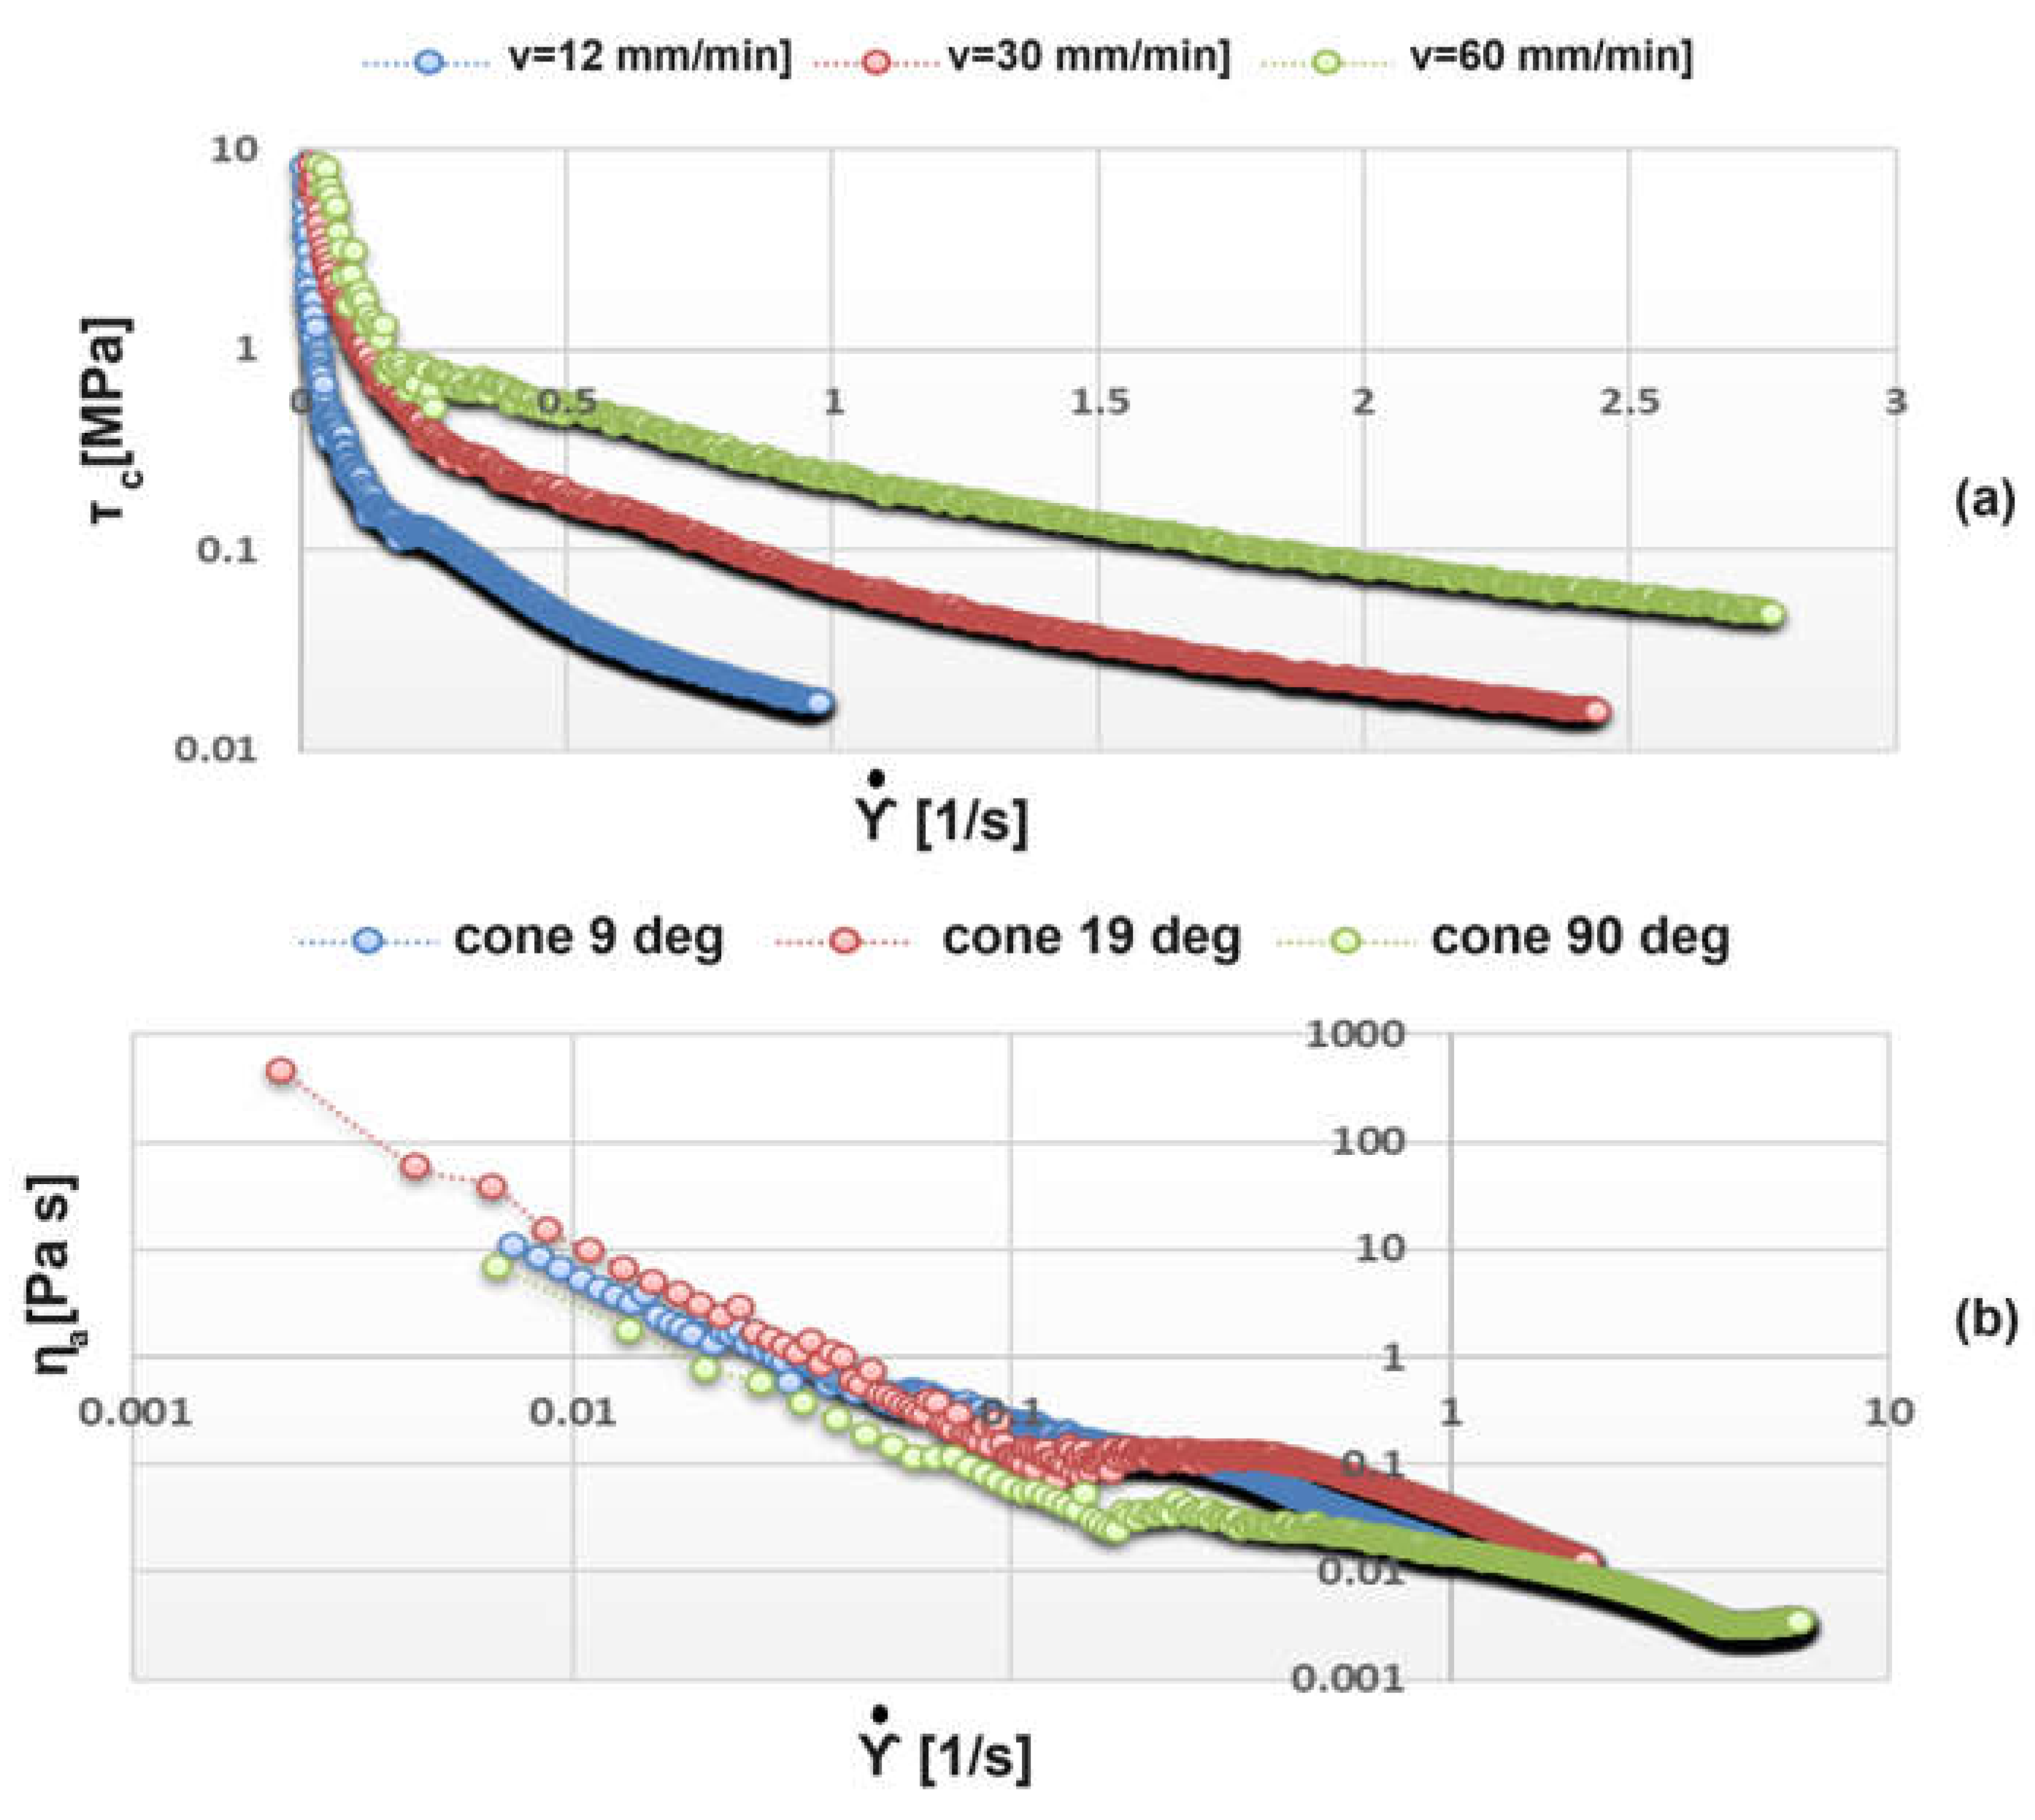
Figure 17.
Variation of the apparent viscosity (ηa) of Roquefort cheese as a function of the shear rate (
Figure 17.
Variation of the apparent viscosity (ηa) of Roquefort cheese as a function of the shear rate (
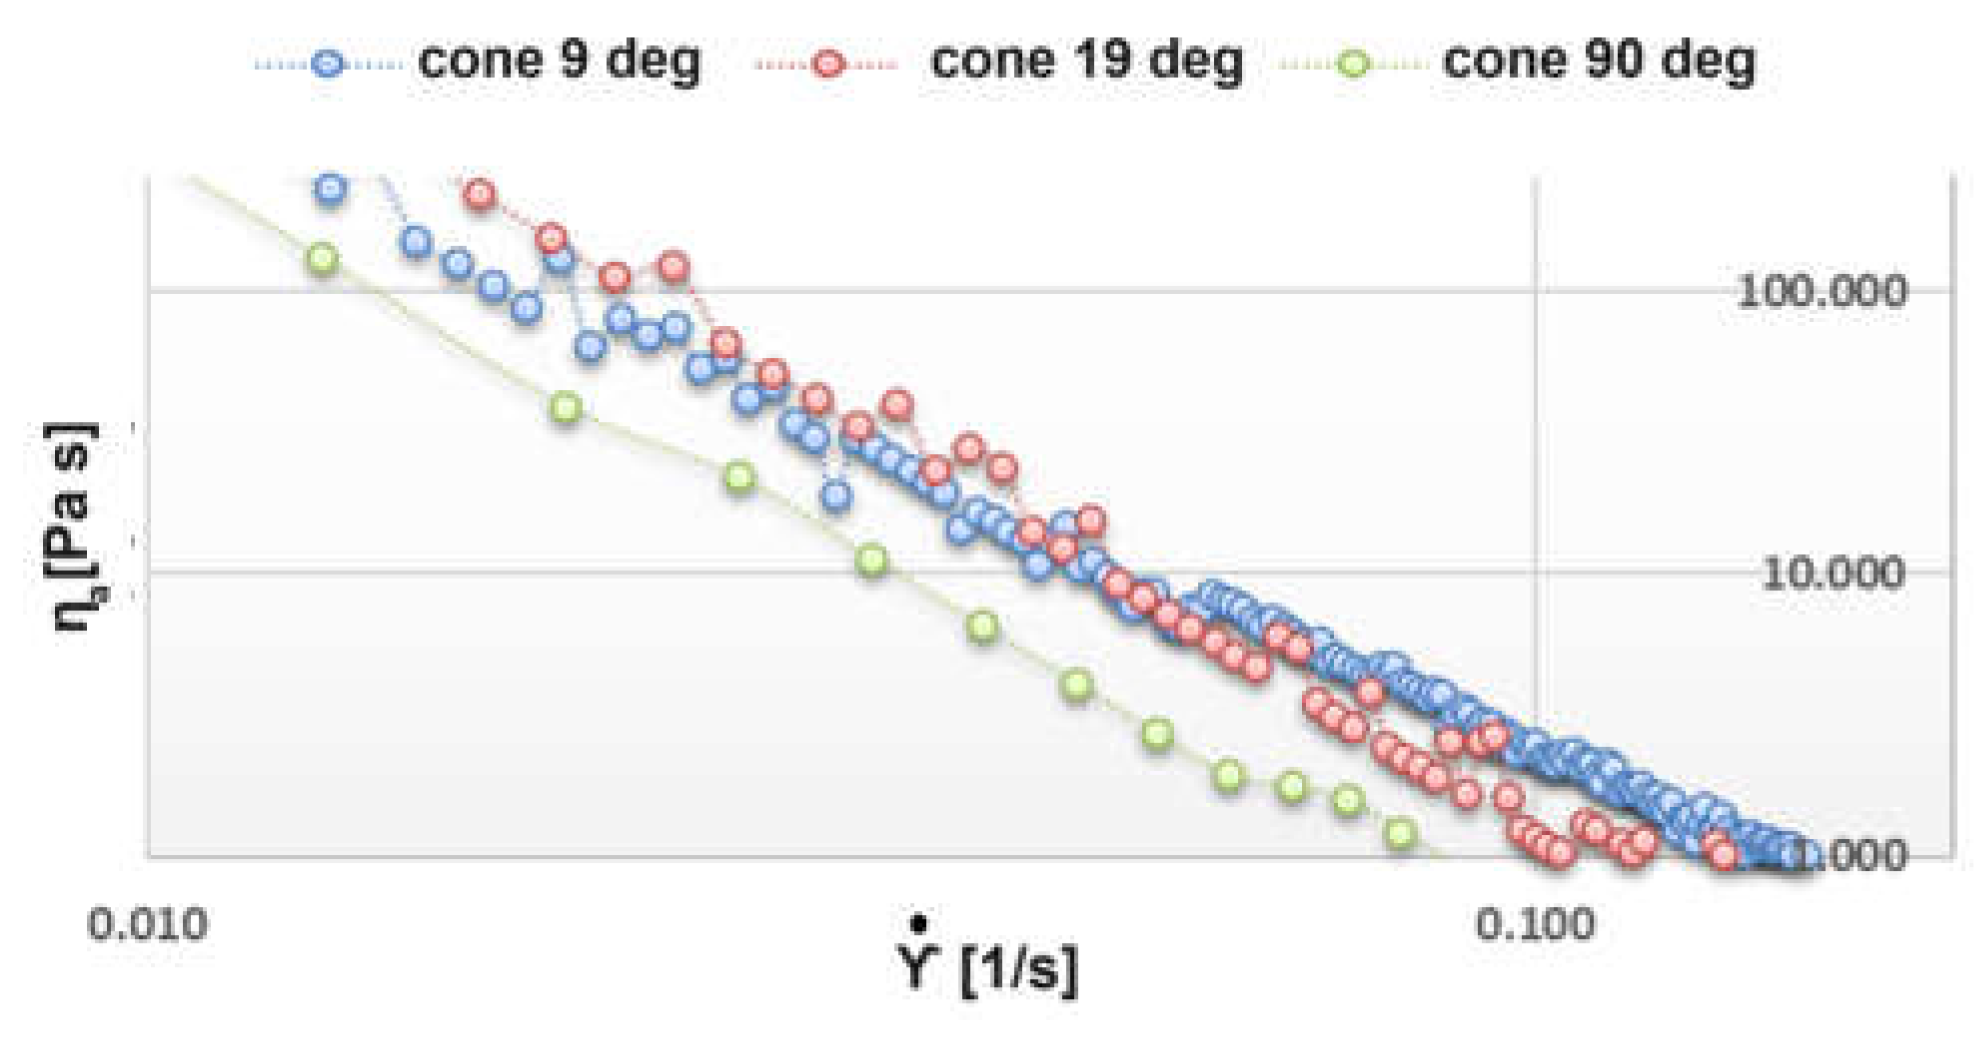
Figure 18.
Correlation between the apparent viscosity and the tangential tension of Dorblue cheese when penetrating with the 19ﹾ cone for the 3 speeds (v1 = 12, v2 = 30, and v3 = 60 mm/min, and the acronyms ηa_v1, ηa_v2, ηa_v3 represent the ηa values calculated for the three speeds).
Figure 18.
Correlation between the apparent viscosity and the tangential tension of Dorblue cheese when penetrating with the 19ﹾ cone for the 3 speeds (v1 = 12, v2 = 30, and v3 = 60 mm/min, and the acronyms ηa_v1, ηa_v2, ηa_v3 represent the ηa values calculated for the three speeds).
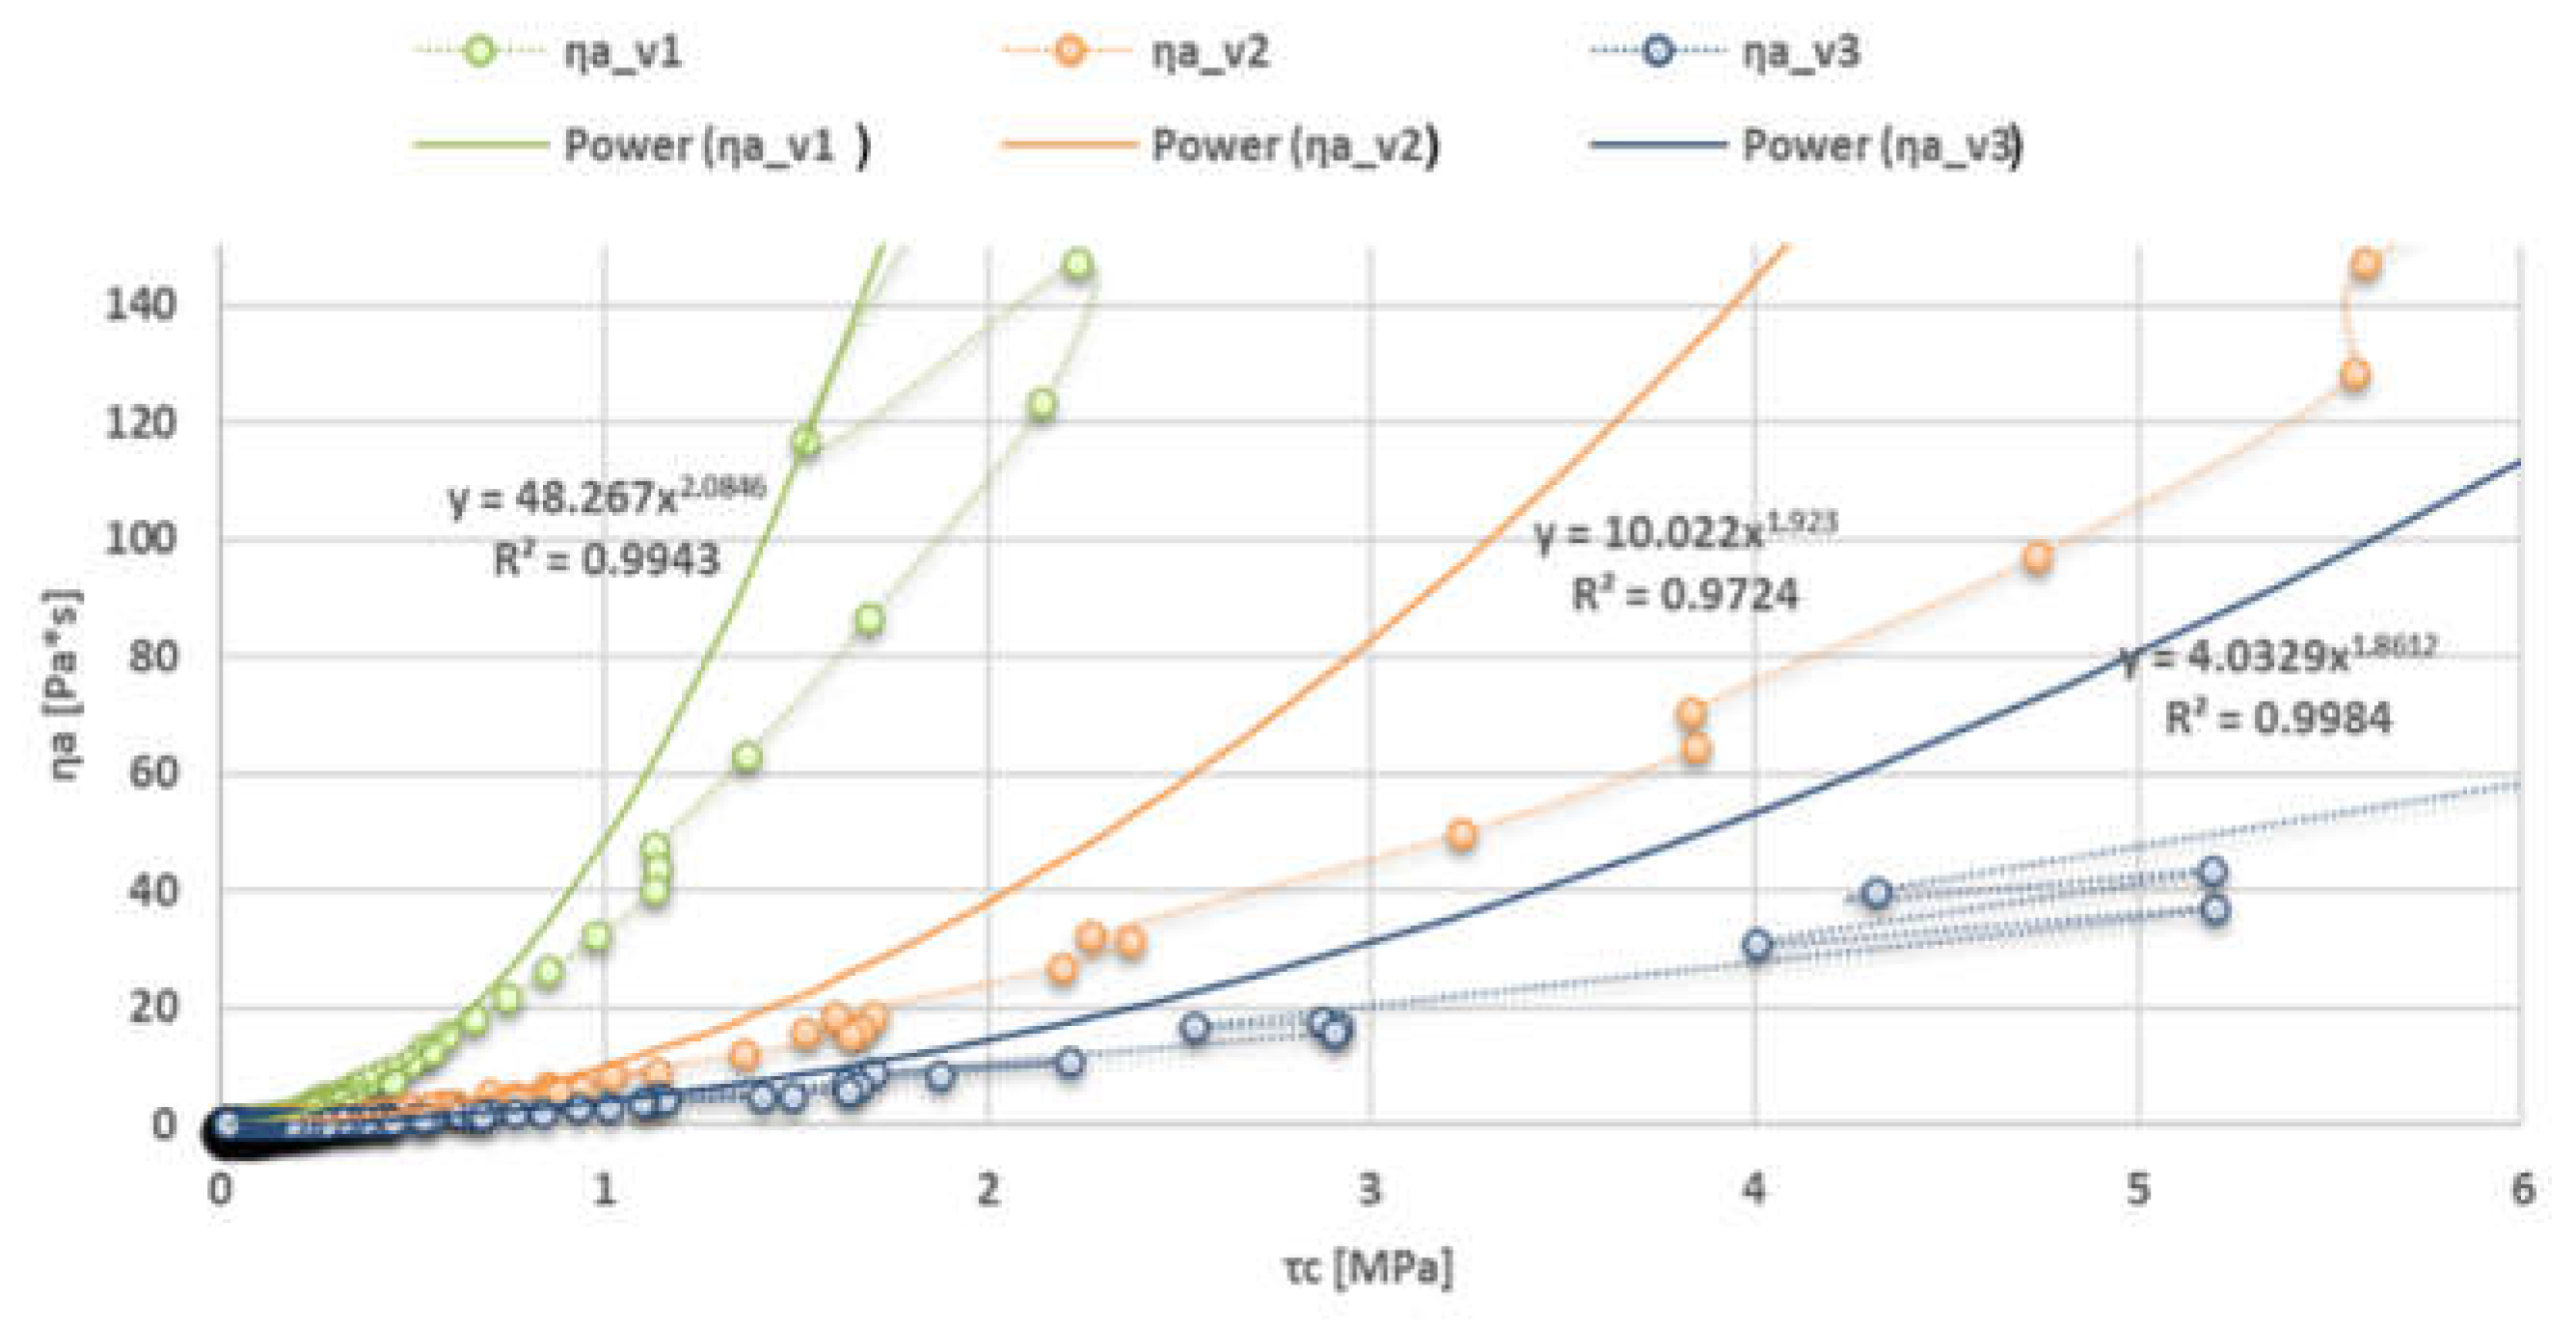

Table 1.
Technical and functional characteristics of the HTE 1kN force sensor.
| Characteristic name | Values |
|---|---|
| Nominal Force (Fnom) | 1 kN |
| Maximum Operating Force (Fom) | ≤ 125% |
| Output Signal Options | 0...10 V/4...20 mA |
| Nominal Supply Voltage | 24 V |
| Supply Voltage Range | 12-36 V |
| Relative Linearity Error | ≤ 0.5% |
| Hysteresis | ≤ 0.05% |
| Relative Repeatability Error | ≤ 0.05% Fnom |
Table 2.
Physical and chemical characteristics of the products.
| Characteristic | Camembert | Brie | Dorblue | Roquefort |
|---|---|---|---|---|
| Sample mass (g) | 120 | 125 | 100 | 100 |
| Height (mm) | 32.5 | 32.5 | 25 | 25 |
| Nutritional value (kcal per 100g) | 216 | 334 | 413 | 346 |
| pH | 6.7 | 7.5 | 6.2 | 6.0 |
| Milk fats (g per 100g) | 13.5 | 17 | 29 | 29.8 |
| Total proteins (g per 100g) | 23.5 | 20 | 19 | 21.1 |
| Dry matter (%) | 61.7 | 64.65 | 64.23 | 56.16 |
| Sodium (g per 100g) | 1.5 | 1.3 | 1.7 | 3.5 |
Table 3.
Results of two-way ANOVA analysis.
| Analysis of variance | |||||
|---|---|---|---|---|---|
| Source | Sum Sq | d.f. | Mean Sq. | F | Prob>F |
| GeometryCONE | 1666.7 | 1 | 1666.7 | 15752.15 | 0 |
| Speed | 0.45 | 2 | 0.23 | 2.13 | 0.1188 |
| Error | 464.6 | 4391 | 0.11 | ||
| Total | 2161.24 | 4394 | |||
Note: The notations in the ANOVA table represent: Sum Sq—sum of squares of differences, d.f.—degrees of freedom, Mean Sq.—mean squares, F—Fischer’s criterion, Prob—probability.
Table 4.
Results of three-way ANOVA analysis.
| Analysis of variance | |||||
|---|---|---|---|---|---|
| Source | Sum Sq | d.f. | Mean Sq. | F | Prob>F |
| GeometryCONE | 1632.95 | 1 | 1632.95 | 15446.74 | 0 |
| Product | 1.04 | 3 | 0.35 | 3.28 | 0.0201 |
| Speed | 0.03 | 1 | 0.03 | 0.31 | 0.5763 |
| Error | 434.98 | 4389 | 0.11 | ||
| Total | 2161.24 | 4394 | |||
Table 5.
Firmness index FI determined for various cone geometries and penetration speeds.
| Cheese | Cone | Const. cone | Speed | FI |
|---|---|---|---|---|
| CAMEMBERT | con_9_gr | 4.020 | v12mm_min | 0.0612 |
| v30mm_min | 0.069 | |||
| v60mm_min | 0.0738 | |||
| con_19_gr | 1.850 | v12mm_min | 0.121472 | |
| v30mm_min | 0.145759 | |||
| v60mm_min | 0.154103 | |||
| con_90_gr | 0.159 | v12mm_min | 0.685781 | |
| v30mm_min | 0.508961 | |||
| v60mm_min | 0.548529 | |||
| BRIE | con_9_gr | 4.020 | v12mm_min | 0.056211 |
| v30mm_min | 0.06026 | |||
| v60mm_min | 0.054781 | |||
| con_19_gr | 1.850 | v12mm_min | 0.119805 | |
| v30mm_min | 0.107896 | |||
| v60mm_min | 0.110844 | |||
| con_90_gr | 0.159 | v12mm_min | 0.531142 | |
| v30mm_min | 0.36775 | |||
| v60mm_min | 0.35084 | |||
| DORBLUE | con_9_gr | 4.020 | v12mm_min | 0.045254 |
| v30mm_min | 0.069056 | |||
| v60mm_min | 0.073836 | |||
| con_19_gr | 1.850 | v12mm_min | 0.121472 | |
| v30mm_min | 0.145759 | |||
| v60mm_min | 0.14529 | |||
| con_90_gr | 0.159 | v12mm_min | 0.685781 | |
| v30mm_min | 0.508961 | |||
| v60mm_min | 0.548529 | |||
| ROQUEFORT | con_9_gr | 4.020 | v12mm_min | 0.03406 |
| v30mm_min | 0.040252 | |||
| v60mm_min | 0.073836 | |||
| con_19_gr | 1.850 | v12mm_min | 0.121472 | |
| v30mm_min | 0.056211 | |||
| v60mm_min | 0.14529 | |||
| con_90_gr | 0.159 | v12mm_min | 0.355603 | |
| v30mm_min | 0.265095 | |||
| v60mm_min | 0.548529 |
Note: The acronyms “v12mm_min”, “v30mm_min”, and “v60mm_min” from the “Speed” column of Table 5 indicate the cone’s travel speed of 12 mm/min, 30 mm/min, and 60 mm/min, respectively.
Table 6.
Correlation coefficients Kf and n, as well as the coefficient of determination R² for the regression from equation (11) and for the four types of cheeses tested.
Table 6.
Correlation coefficients Kf and n, as well as the coefficient of determination R² for the regression from equation (11) and for the four types of cheeses tested.
| Apparent viscosity (shear stress)—ηa = Kf · τcn | |||||
|---|---|---|---|---|---|
| Cheese | Cone | Speed | Kf | n | R2 |
| CAMEMBERT | con_9_gr | v12mm_min | 3.57 | 1.75 | 0.99 |
| v30mm_min | 7.7 | 1.745 | 0.998 | ||
| v60mm_min | 28.26 | 1.838 | 0.987 | ||
| con_19_gr | v12mm_min | 1.829 | 1.764 | 0.99 | |
| v30mm_min | 6.007 | 1.788 | 0.99 | ||
| v60mm_min | 20.016 | 1.867 | 0.99 | ||
| con_90_gr | v12mm_min | 109.49 | 2.108 | 0.994 | |
| v30mm_min | 8.294 | 1.777 | 0.997 | ||
| v60mm_min | 4.148 | 1.485 | 0.999 | ||
| BRIE | con_9_gr | v12mm_min | 3.35 | 1.688 | 0.99 |
| v30mm_min | 6.647 | 1.701 | 0.997 | ||
| v60mm_min | 27.68 | 1.818 | 0.987 | ||
| con_19_gr | v12mm_min | 2.057 | 1.684 | 0.999 | |
| v30mm_min | 5.044 | 1.734 | 0.998 | ||
| v60mm_min | 33.672 | 2.049 | 0.994 | ||
| con_90_gr | v12mm_min | 109.49 | 2.018 | 0.994 | |
| v30mm_min | 13.289 | 1.847 | 0.997 | ||
| v60mm_min | 7.369 | 1.628 | 0.999 | ||
| Cheese | Cone | Speed | K | n | R^2 |
| DORBLUE | con_9_gr | v12mm_min | 61.39 | 1.91 | 0.981 |
| v30mm_min | 13.176 | 1.859 | 0.99 | ||
| v60mm_min | 4.64 | 1.782 | 0.98 | ||
| con_19_gr | v12mm_min | 48.267 | 2.084 | 0.994 | |
| v30mm_min | 10.022 | 1.923 | 0.972 | ||
| v60mm_min | 4.032 | 2.074 | 0.998 | ||
| con_90_gr | v12mm_min | 133.7 | 2.157 | 0.993 | |
| v30mm_min | 85.859 | 2.17 | 0.993 | ||
| v60mm_min | 5.848 | 1.636 | 0.999 | ||
| ROQUEFORT | con_9_gr | v12mm_min | 30.408 | 1.731 | 0.988 |
| v30mm_min | 7.707 | 1.735 | 0.998 | ||
| v60mm_min | 3.57 | 1.753 | 0.99 | ||
| con_19_gr | v12mm_min | 53.543 | 2.009 | 0.995 | |
| v30mm_min | 18.144 | 1.849 | 0.998 | ||
| v60mm_min | 7.883 | 1.773 | 0.997 | ||
| con_90_gr | v12mm_min | 32.458 | 1.759 | 0.998 | |
| v30mm_min | 22.891 | 1.819 | 0.998 | ||
| v60mm_min | 7.665 | 1.609 | 0.993 | ||
Disclaimer/Publisher’s Note: The statements, opinions and data contained in all publications are solely those of the individual author(s) and contributor(s) and not of MDPI and/or the editor(s). MDPI and/or the editor(s) disclaim responsibility for any injury to people or property resulting from any ideas, methods, instructions or products referred to in the content. |
© 2024 by the authors. Licensee MDPI, Basel, Switzerland. This article is an open access article distributed under the terms and conditions of the Creative Commons Attribution (CC BY) license (http://creativecommons.org/licenses/by/4.0/).
Copyright: This open access article is published under a Creative Commons CC BY 4.0 license, which permit the free download, distribution, and reuse, provided that the author and preprint are cited in any reuse.


