
Submitted:
10 August 2024
Posted:
13 August 2024
You are already at the latest version
Abstract
Ammonia synthesis is one of the most important chemical reactions. Due to thermodynamic restrictions and the reaction requirements of the current commercial iron catalysts, it is also one of the worst reactions for carbon dioxide emissions and energy usage. Ruthenium-based catalysts can substantially improve the environmental impact as they operate at lower pressures and temperatures. In this work, we provide a screening of more than 40 metals as possible promoter options based on a Ru/Pr2O3 catalyst. Cesium was the best alkali promoter and was held constant for the series of double-promoted catalysts. Ten formulations outperformed the Ru-Cs/PrOx benchmark, with barium being the best second promoter studied and the most cost-effective option. Designs of experiments were utilized to optimize both the pretreatment conditions and the promoter weight loadings of the doubly promoted catalyst. As a result, optimization led to more than a five-fold increase in activity compared to the unpromoted catalyst, therefore creating a possibility for low ruthenium ammonia synthesis catalysts to be used at scale. Further, we have explored the roles of promoters using kinetic analysis, XPS, and in situ infrared spectroscopy. Here, we have shown that the role of barium is to act as a hydrogen scavenger and donor, which may permit new active sites for the catalyst, and have demonstrated that the associative reaction mechanism is likely used for the unpromoted Ru/PrOx catalyst with hydrogenation of the triple bond of the dinitrogen occurring first before any dinitrogen bond breakage.
Keywords:
Ammonia Synthesis
; Associative Mechanism
; Praseodymium Oxide
; Promoters
; Ruthenium
1. Introduction
Since its first use on an industrial scale, the Haber-Bosch Process has utilized iron-based catalysts. Although these catalysts are inexpensive and durable, they are not nearly as efficient as other metals for ammonia synthesis. This process is typically run at high pressures (200-300 bar) and high temperatures (400-500 °C), which results in very high carbon dioxide emissions and a large energy requirement. Ruthenium, however, is a more active metal than iron, especially at lower temperatures and pressures.[1] Lower temperatures are key, however, as this process is highly thermodynamically limited in the typical operating range. Unfortunately, the cost of ruthenium has prevented large-scale industrialization, as it cannot compete with the low cost of iron.[2] One area this may be useful, though, is in new reactors that are being developed such as Pressure Swing Adsorption Reactors and Membrane Reactors. Although this has so far been mainly explored using ex situ separation,[3,4,5] if they are utilized in situ then these reactors could remove ammonia from the gas stream as it is produced, reducing the effect of thermodynamic equilibrium limitations, which also removes the requirement of running these catalysts at stoichiometric conditions, which is further advantageous as for ruthenium catalysts a nitrogen rich environment is best.
Ruthenium-based ammonia synthesis catalysts are not new.[6] In fact, even the promotion of these catalysts can be traced back decades.[7] Most of the reported catalysts are magnesium oxide-supported or carbon-supported (with these catalysts actually somewhat industrialized using the KBR-KAAP Process), but recently, there has been a drive for lanthanide-based oxide supports.[8] In fact, oxide supports containing lanthanum, cerium, and praseodymium are many times more active than a traditional ruthenium on magnesium oxide catalyst.[9,10] Interestingly, however, Ru/PrOx catalysts have previously been shown to not be in the form of nanoparticles, but rather they are active in the form of a possible nanolayer, an occurrence that, to the best of our knowledge, has not been shown on another metal oxide support.[11] Further, this formulation was shown to be the most active of single metal oxide-supported catalysts, although some mixed metal oxide supports have been shown to exceed these.[12] Naturally, the next step for these catalysts would be promotion, and we believe this is the first such comprehensive exploration for promoted ammonia synthesis for this support.
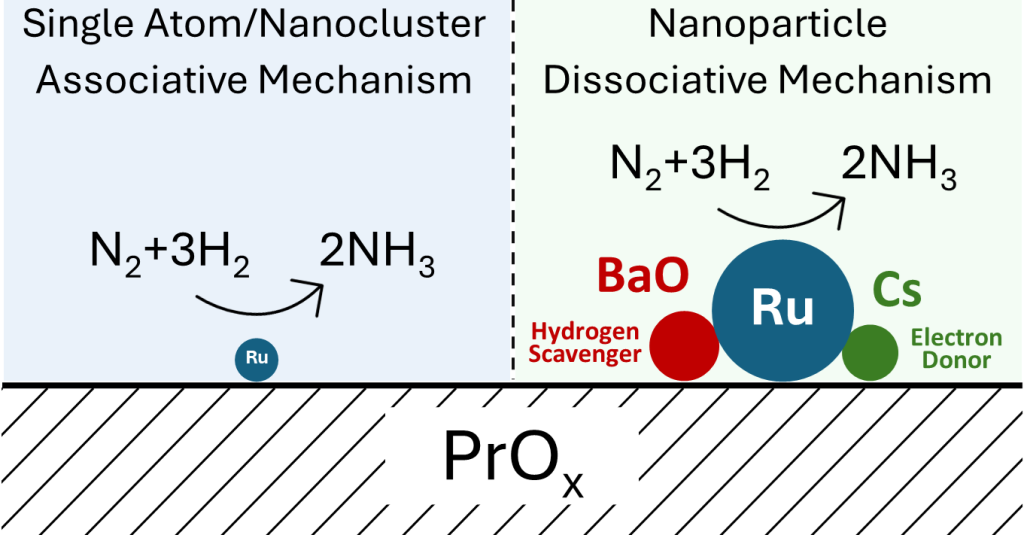
When selecting metals to act as promoters, only a handful are typically tested.[13,14] Alkali metals are known to act as strong electronic promoters, with cesium being the usual choice.[14,15] As breaking of the triple bond of nitrogen is accepted as the rate determining step, alkali metals play an important role in the catalyst by weakening the triple bond of the dinitrogen through filling of antibonding orbitals through electron donation.[16,17] This process is due to the very low electronegativity of the cesium and through donation of the electron to the ruthenium, permitting the weakening to occur.[14,16] Barium is also a common promoter, which is believed to act as both an electronic and structural promoter.[13] Other metals are typically not analyzed. Thus, we seek to screen new formulations of catalysts to determine the most active before optimizing some of the key synthesis parameters. Furthermore, the process for this reaction has typically been shown to be the dissociative mechanism, thought to likely occur on the B5 sites of ruthenium.[18] Unfortunately, for a sufficient number of these sites to be present, the active metal must be present in particles of at least 2nm, leading to the associative process for atomic-scale ruthenium catalysts (which are also greatly influenced by their supports at this size), although the detailed pathway for this process is still unknown.[19,20] Contrasting the dissociative mechanism, the associative mechanism does not result in complete breakage of the nitrogen-nitrogen bond before hydrogenation. Instead, the N2 is hydrogenated to N2H2 before N2H4 (hydrazine) and finally to ammonia. However, the intermediate step for hydrogenation of the N2 bond is still being investigated.[18,21] As a result, we have attempted to explore this lack of knowledge with in situ spectroscopy and rigorous kinetic testing. [10,11,19]
2. Results and Discussion
2.1. Screening of Promoters
Based on previous research,[14,22,23] 2 wt.% of each promoter was selected as a starting point. This was also chosen as overloading of the catalysts, especially for such a low weight-loading of ruthenium, was a concern. Moreover, although this weight loading was selected for the initial screening, an extensive range of promoter weight loadings was employed in the final optimization. The alkali metals are good for the promotion of ruthenium-based ammonia-synthesis catalysts due to their electron-donating abilities.[16] As a result, five different alkali metals were selected for initial promotion. It has been shown previously[24,25] that cesium leads to the highest activity of singly promoted catalysts. This result was confirmed here, as cesium leads to an almost three-fold increase in synthesis rate in comparison to the unpromoted catalysts, as seen in Figure 1. Interestingly, lithium and sodium actually decreased the overall activities of the catalysts. This may possibly be due to the small alkalis migrating onto the ruthenium surface, blocking active sites or changing the overall active sites from the preferable step sites as shown previously in literature.[26] From here, all future catalysts explored were doubly promoted using the Ru-Cs/PrOx as a base catalyst.
Nearly all feasible metals were then added as a second promoter. Four requirements needed to be met for each promoter: they needed to have a non-chlorine precursor, the precursor must be water soluble, the cost of metal must be less than ruthenium, and they must be generally safe for use. Water solubility was a prerequisite due to the inherent simplicity of deposition, and although chlorine precursors are typically more affordable, which would be a consideration for possible commercialization, previous work has suggested that chlorine contamination decreases overall activity.[25,27]
The activity of many of the doubly promoted catalysts was within approximately 5 mmol/gcat/hr of the singly promoted Ru-Cs/PrOx catalyst, as shown in Figure 1b. Despite this, though, some outliers occurred, such as a gallium-promoted catalyst that produced no detectable ammonia. Overall, ten doubly promoted catalysts produced more than the single promoted catalysts. Barium was the best second promoter, which was expected due to the number of catalysts in literature and commercially that use either barium or both barium and cesium as promoters for this reaction, with the role of the promoter explored below.[13,28] Despite this, some previously not studied promoters showed high activity. The use of lanthanides as promoters has not been fully explored, and thus far, we have yet to find an example of dysprosium (the second most beneficial secondary promoter) as a promoter in the literature for either direction of the ammonia reaction.
Some clear trends can be found in the beneficial secondary promoters. As shown previously, three of the alkali promoted catalysts showed higher activity compared to the unpromoted benchmark, and these doubly-promoted formulations (as Ru-Cs-K/PrOx and Ru-Cs-Rb/PrOx) performed even higher than the singly promoted catalyst. Two causes may explain this phenomenon, as this could be due to simply a need for additional alkali (which will be explored below by increasing the amount of cesium) or due to a synergistic effect of two alkalis, which has been shown to be beneficial in other reactions.[29] In addition, adding lanthanides generally showed improved activity, with four of the ten beneficial secondary promoters being lanthanides, particularly dysprosium, lutetium and europium. Here, two possible reasons are charge mobility and basicity. The addition of praseodymium dopants to Dy2O3 films has increased the electrical conductivity of the oxides, possibly due to the mixed oxidation state of the praseodymium,[30] which is beneficial to improve the rate of the ammonia synthesis of ruthenium on lanthanide oxide catalysts. Furthermore, some mixed lanthanide oxide supports have shown both added electron donation abilities and improved the weakening of N≡N bonds due to their redox capabilities, which too would likely increase the overall reaction rate.[31,32]
2.2. Optimization of Catalysts
Subsequently, optimization of various synthesis parameters was undertaken. Of the nearly 30 possible parameters that could be optimized for the base doubly promoted catalyst, initially only a handful of synthesis parameters were varied: decomposition of the promoter precursors, decomposition of the triruthenium dodecacarbonyl, reduction conditions during the pretreatment and promoter weight-loadings. These parameters were selected due to the arbitrary selection of these conditions for our initial screening, and due to our ability to process multiple catalysts simultaneously, a full factorial design was used for each pair of parameters.
Initially, optimization of the promoter calcination occurred. A three-level factorial design was used for testing. There was a discrepancy in the results, however, in the initial starting range of 400-900°C. For the low temperatures, a clear trend of increasing time led to increasing activity. However, this was reversed for the 650 and 900°C temperatures. The likely cause was the decomposition temperatures for the precursors. As acetates typically decompose under air at much lower temperatures than nitrates, the barium nitrate is likely the reason for the higher temperatures. Decomposition likely occurs between the 500-650°C range[33] for the nitrate, and as a result, intermediate temperatures of 500°C and 550°C were added to the optimization. Following this, an almost hyperbolic trend for the synthesis rates occurred, where added temperature above 500°C led to a decrease in the required time for similar synthesis rates, as shown in Figure 2a. This general trend follows the trend of barium nitrate decomposition, thus allowing us to conclude that the driving force for this optimization step was the promoter decomposition alone.
Decomposition of the ruthenium precursor was also optimized. This condition was varied between 200°C and 500°C for 10 to 300 minutes. This simple three-level factorial optimization led to a clear optimal region of our design space, between 250 and 350°C, and between 160 and 290 minutes, exemplified in Figure 2b. This decomposition was intriguing due to the nature of the interactions of the ruthenium precursors and the modified supports. Previous work has shown that the complete decomposition of triruthenium dodecacarbonyl under argon requires temperatures above 700°C,[34] however, the addition of semi-reducible supports, in that case TiO2, led to a much lower decomposition temperature of 320-420°C.[35,36] This likely occurred again due to the possibility of a reaction between the carbonyl species and the surface oxygen of the praseodymium oxide and the cesium and barium oxides. The nature of praseodymium oxide itself further leads to this pathway. This metal oxide transitions to reduced oxygen amounts with heat, with many stable oxidation states available.[37] This emitted oxygen would also create an easier removal of the CO ligands of the precursor with the ruthenium even possibly acting as a catalyst for this, likely explaining the need for very low temperatures of decomposition. This is further beneficial, however, as increasing the temperature beyond this point would probably increase the sintering rate of the ruthenium and thus decrease the overall activity of the catalyst.
Following this, the hydrogen pretreatment conditions were also varied. Reduction time and temperature were adjusted, and a similar hyperbolic trend occurred as with the calcination conditions. Variation between 200°C and 650°C occurred with times between 10 and 160 minutes. Increasing the reduction time generally led to an increase in activity, as shown in Figure 2c. Further, increasing the temperature of the reduction for short reduction times also increased the ammonia synthesis rate, until the 650°C reduction, which likely led to the sintering of the catalyst. One notable difference in the different reduction temperatures was the time on stream to reach maximum activity. All catalysts reduced above 500°C were stable within an hour under reaction conditions, whereas the 200°C reduced catalysts required multiple hours of activation under the hydrogen-nitrogen mixture. This would suggest that these low temperatures did not fully reduce the catalyst to operating conditions, as the reaction conditions are naturally reducing. TPR analysis was conducted to understand this result better, and samples with and without ruthenium, cesium, and barium were produced. From these results, found in Fig. S4, it can be seen that the ruthenium reduces close to 200°C and the cesium around 350°C, with no reduction of the barium oxide. Following this, it can be deduced that the reason for this optimum is that each of the required reductions have occurred, and any further temperature unnecessarily reduces the support or further sinters the ruthenium nanoparticles, reducing the overall number of active sites. Overall, an optimum was selected at slightly under three hours at 350°C, as any additional time reducing the catalyst had little effect on additional activity, wasting ammonia production time.
Finally, the optimal weight loadings of each of the promoters were investigated, and the 1:2:2 (ruthenium:cesium:secondary promoter) formula was used based on previous literature data[14,22,23]; however, a much more extensive range was tested for efficacy. Varying from 0-12 wt.% of each of the Ba and Cs was used, before narrowing to a final range of 2-8 wt.% for each of the metals. Here, synthesis rates varied from 35.2-62.9 mmol/gcat/hr, with the final optimal weight of each being 3.86 wt.% and 4.12 wt.% for the Ba and Cs, respectively. A quadratic model was fitted to the data with an R2 of 96.2%, with the results shown in Figure 2d.
A combination of these various optimization steps was then undertaken. The optimized catalyst formulation was a 1 wt.% Ru, 3.86 wt.% Ba, 4.12 wt.% Cs/PrOx, for which the promoters were calcined at 550°C for 150 minutes before the argon calcination was conducted at 300°C for 4 hours. This catalyst was reduced at 350°C for 160 minutes before operating at the typical reaction conditions. This catalyst produced as much as 65.42 mmol/gcat/hr at 400°C and 30 bar of reactant pressure. Although this optimized catalyst was nominally 1 wt.% Ru, the actual weight-loading was closer to 0.6 wt.%, as determined by ICP. This optimal catalyst produced close to 11,000 mmol NH3/gRu/hr, which to our knowledge is the highest for any ruthenium-based catalyst in comparison to the literature, where the highest reported values are around 3,200 mmol NH3/gRu/hr (see supplementary information Table S1). [14,22,23]
Two notes must be made, however, about this doubly-promoted catalyst. First, stability was a major concern for this optimized catalyst. This catalyst was left on stream for approximately one week, as shown in Figure 3b. Significant deactivation occurred in the first few days of running. In fact, in the first four days of testing, this catalyst lost half of its activity. Following this, though, the rate of deactivation tended to decrease with time, and an exponential curve was fitted with exceptional accuracy of the model. If the extrapolation of this data is to be believed, this catalyst would plateau at a rate of slightly under 19 mmol/gcat/hr, which is only marginally above the typical rate of the unpromoted, unoptimized catalyst. Based on literature, two options are suggested: sintering of the ruthenium nanoparticles and loss of promotional ability for the cesium. Given the small size, based on H2 Chemisorption (shown in Table 1) to be between 3 and 5nm, sintering under high heat is expected, which would reduce the overall number of active sites and decrease total ammonia production. Further, under reaction conditions, it has been suggested that the cesium may be somewhat mobile on the surface of the support and ruthenium, which may in turn lead to an increase in sintering rate. If this is to be true, unfortunately, then the cesium would both be the promoter that significantly increases the rate and also leads to the expedited deactivation of the catalyst. Alternatively, the other possibility is that small amounts of water and oxygen may still be present in the UHP gas feed. If this is the case, then these gases may interact with the ruthenium or cesium, resulting in increased sintering of the catalysts or the production of CsOH, which may either reduce the alkali metal’s promotional effect or lead to desorption of the alkali metal from the catalyst; both which would explain the drop in activity.[11] This effect has been shown previously in literature where a drop of close to half of its initial activity was shown during a time-on-stream test for a Cs-Ru/MgO catalyst, and pre- and post-reaction characterization of the catalyst showed a clear loss of cesium from the catalyst and sintering of the ruthenium.[38] To explore this theory, an additional catalyst was studied using the same optimized pretreatments but with reduced cesium. Testing this 1 wt.% Ru, 4 wt.% Ba, 1 wt.% Cs/PrOx catalyst, shown in Figure 3c, resulted in a much more stable catalyst whilst still having an initial activity of more than 60 mmol/gcat/hr. In fact, following the initial activation of the catalyst, the rate was approximately reducing at a mere 7 μmol/gcat/hr2, thus suggesting that the cesium was the main cause of the deactivation. Interestingly, the time to reach maximum activity was also increased with the lowered amount of alkali promoter, suggesting that the cesium influenced the activation of the catalyst as well. Overall, this stable catalyst was able to consistently produce more than 4 kg NH3/gRu/day, highlighting the possibility for this catalyst to be used industrially.
Second, a tapering of the reaction rate occurred at high temperatures for this catalyst. For both the unpromoted and Cs-Promoted catalysts, the rate continued exponentially with increasing temperatures, and for the optimized catalyst, this also occurred for the 300-380°C temperature range; however, above 400°C the rate plateaued (as seen in Figure 3a), and even decreased with even higher temperatures. In order to explain this effect, further characterization and comparison were conducted as described in detail below.
2.3. The Role of the Promoters and the Mechanism
Determining the exact role that each promoter plays is not necessarily straightforward. Cesium has traditionally been viewed as an electronic promoter for ammonia synthesis. [11] Conversely, barium has been debated as being both an electronic promoter and a structural promoter.[13] To hopefully elucidate the effect of the promoters, XRD, XPS, N2- and CO-DRIFTS, and kinetic analysis were used on the unpromoted, Cs-Promoted and Ba-Cs-Promoted catalysts. XRD, which was performed on each of the many variations of promoted catalysts in the initial screening, yielded little assistance, as seen in Fig. S3, in this determination, however. It has previously been shown that small Ru nanoparticles (for which these are according to chemisorption) are not visible in the patterns, further enhanced by the collapsing of Ru nanoparticles under nitrogen,[39,40] which create issues with estimating average particle size.
Kinetic analysis was conducted to determine the reaction order of the various compounds in this reaction. Previous work in the literature has shown that for the Ru/PrOx catalysts, there seems to be little inhibition from hydrogen coverage at high temperatures- likely due to hydrogen spillover to the support- and a first-order dependency on nitrogen,[10] whereas for the Cs-promoted catalyst the hydrogen reaction order is slightly negative possibly due to the cesium preventing the hydrogen spillover effect from occurring. Here, as shown in Table 2, a similar trend was observed for both the unpromoted and Cs-promoted catalysts. As the temperature is decreased, the hydrogen reaction order noticeably decreases as site blockage becomes an issue as the desorption rate decreases. For the Ba-Cs-Promoted catalyst, this is exemplified even more so, as at lower temperatures, the nitrogen reaction order remains approximately the same at 0.72, but the hydrogen reaction order changes to close to -1. Comparing the singly- and doubly-promoted catalysts at higher temperatures showed a shift in hydrogen reaction order, increasing from -0.25 to 0.25 with the addition of barium. This decrease in hydrogen inhibition may be due to the possibility of hydroxide production on the barium reducing the issue of hydrogen poisoning that typically occurs on ruthenium catalysts, either as a temporary storage for the hydrogen or to expedite the migration to the support, which has only recently been suggested.[41] One possible, notable cause for the plateauing effect at high temperatures for the optimized catalyst was the change in ammonia reaction order. Despite the unpromoted and Cs-Promoted catalysts’ ammonia reaction order not particularly altering with temperature, the doubly promoted catalyst moves from -0.17 to -0.59 during the increase in 40°C. It would be unlikely that this was due to a desorption issue as the rate of desorption would tend to increase with temperature rather than decrease. Further, these catalysts are very non-porous which would suggest that internal mass transfer would not be an issue either. As a result, this is likely due to a possibility of back reaction or site blocking occurring due to the increased concentration of NH3, even though the rates were still below the thermodynamic equilibrium.
Further elucidation of the catalysts was accomplished through DRIFTS analysis. Initially CO-DRIFTS was conducted on the three samples, shown in Figure 4a-c. The first noticeable difference was between the unpromoted and promoted catalysts. The unpromoted catalyst only showed bonding types which may be attributed to either linear (2006 cm-1) or multi-adsorbed (2058 cm-1) CO only,[42] whereas each of the promoted catalysts show these bonding types as well as the more typical bridge (1962 and 1959 cm-1) and three-fold hollow (1890 and 1897 cm-1) sites. This data was not necessarily unexpected, however, as previous literature data showed that Ru/PrOx did not show nanoparticles, for which the three-fold hollow would be most expected.[11] Alternatively, these promoted samples have not been fully studied before, however their spectra both relate closer to other ruthenium catalysts that have been explored previously. The second notable occurrence was the lack of difference between the singly- and doubly-promoted catalysts, with each peak varying by only a few wavenumber in each direction, which suggests that there is not a very significant variation in the bond strength of the ruthenium sites and adsorbate molecules. Thirdly, another small peak appears at 2117 and 2120 cm-1 for the promoted samples, which is due to triply-adsorbed CO-Ru. This band is only observed for nanoparticle ruthenium catalysts. This shows that these catalysts have corner Ru atoms which is only possible for nanoparticles, suggesting that the unpromoted catalyst consists only of single atoms and some possible nanoclusters of ruthenium.
XPS was then utilized to determine the chemical environment for the ruthenium in the three samples. Because the 3d peak for ruthenium is in close proximity to the C 1s peak, the 3p3/2 peak was utilized instead. Typical analysis would suggest that peaks between 461 and 462 eV are from metallic Ru, and higher binding energies are due to RuO2 or even RuO3 structures.[43,44] However, the unpromoted catalyst, as shown in Figure 4d, displays a RuO2 peak at 463.4 eV and a second peak at 458.7 eV. Although this second peak would traditionally be below the normal metallic Ru position, recent literature has shown that this is possible for very small Ru nanoclusters.[45] Here, this catalyst, though, is shifted to even lower binding energies- the RuO2 peak was shifted down by approximately 1 eV as well- likely due to the electron donation capability of the PrOx support and possibly due to these nanoclusters being even smaller. These results are, however, in agreement with the previous CO-DRIFTS data that suggested that this catalyst does not contain the typical nanoparticles of other ruthenium-based ammonia synthesis catalysts. Conversely, the Cs-promoted catalyst displayed a singular peak at 462.1 eV, which is indicative of metallic ruthenium nanoparticles. This result was not unexpected, though, as the FTIR data was once again in good agreement as it too suggested nanoparticles of Ru. Finally, XPS was conducted on the BaCs-promoted catalyst. This spectrum was similar to the unpromoted ruthenium catalyst with peaks at 463.5 and 458.5 eV. Despite the similarities though, the CO-DRIFTS spectrum suggests small nanoparticles of Ru in this catalyst. Thus, the combination of these results suggests that the BaO- determined to be the barium state from TPR- is likely decorating the surface of the Ru, and slightly oxidizing some of the sample producing both the metallic and oxidized XPS peaks. Further, due to the BaO and the support’s electron-donating and possibly proton-withdrawing ability, this interaction likely led to the shift of the peak positions to lower binding energies, as seen.[41] Thus, the XPS results here, corroborate the interpretation of the previous TPR and CO-DRIFTS results.
To further understand these differences, N2-DRIFTS was utilized. Here, we reduced the samples at their respective reduction conditions (under pure hydrogen at 500°C for one hour for the unpromoted catalyst and 350°C for three hours for the promoted catalysts), with the removal of gas phase hydrogen via argon, before being cooled to 30°C prior to addition of nitrogen. Although we expected a large N≡N stretch between 2000 and 2200 cm-1,[11,46] instead, for the Cs-promoted catalyst, the much more prominent peak was near 1570 cm-1. This peak is most likely the N=N stretch,[47,48,49] highlighting the ability for this catalyst to efficiently break the triple bond of nitrogen even at ambient temperatures and pressures. To further probe this, we sought to explore this transient phase before a steady state was achieved. Here, Figure 5 shows that over time, this catalyst begins with breaking the N≡N bond before a very minor amount of N-H is formed shown via the bending of the bond (which appears between 1630 and 1670 wavenumbers), although this hydrogenation likely occurs after full breakage of the triple bond. This was not very remarkable though as this has been suggested to be the main pathway for many years for this reaction.[23,50,51] Interestingly, though, this same trend was quite different for the BaCs-promoted catalyst. Although the order of peak formation remains the same, the ratio of N-H/N=N peak formation is much higher for this catalyst. This would suggest that the role of barium is in fact to aid in the transfer of excess hydrogen, as aforementioned. Here, the barium oxide can remove unneeded hydrogen, which would account for the significant shift of hydrogen reaction order from negative to positive, and then re-donate the hydrogen back to the ruthenium as needed, as shown here with this in situ spectroscopy. Furthermore, this could lend itself to opening two active sites for the catalyst. The most energetically favorable place for the N≡N dissociation is the B5 site, [52,53] however, the hydrogenation would not be required to occur on this place as the nitrogen radicals could migrate from these step sites to other free ruthenium sites for the hydrogen addition. This in turn may open up more step sites for N2 dissociation, possibly explaining the three-fold increase in TOF despite the decrease in gas accessible ruthenium (shown in Table 1). Despite this, however, the perhaps even more intriguing occurrence was related to the unpromoted catalyst. Here, the initial peak formed was the expected N≡N bond between 2000 and 2100 cm-1. However, before the N=N peak could be formed, the N-H peak was created around 1637 cm-1. Over time, this N-H peak continued to increase, but at the same time the N≡N peak decreases whilst the 1533cm-1 peak increases. This suggests that this low wavenumber peak is in fact the N=N peak, and that over time, the triple bond is transitioning to a double bond after hydrogenation (a schematic of a suggested pathway for this is shown in Figure 6). This shift allows us to determine two key points for the mechanism on isolated ruthenium atoms and nanoclusters. First, this catalyst must be using the associative mechanism for ammonia synthesis.[18,26,54] This would occur with hydrogen being added via the support. This would further permit us to understand the previously perplexing contrast of increasing activity while also increasing activation energy, as the associative mechanism has been suggested to overcome a much lower activation barrier. [26,54] Second, the first step in the associative mechanism for isolated ruthenium or nanoclusters on metal oxides is not the breaking of the first dinitrogen bond, but rather an electrophilic attack of the hydrogen adsorbed to the surface of the support.
3. Materials and Methods
3.1. Catalyst Preparation
The support used for these catalysts was lab-made praseodymium oxide produced using a precipitation method.[11] A 0.5M solution of praseodymium nitrate (Sigma Aldrich, St Louis, MO) in deionized water was dropped into 30% ammonium hydroxide solution (Sigma Aldrich) at a rate of 2mL/min until the final solution was a 1:1 v/v mixture of nitrate solution and ammonium hydroxide solution. This mixture was stirred for two hours before being filtered and washed with more deionized water. Finally, the support was calcined at 700°C for five hours before being ground into a powder.
Due to triruthenium dodecacarbonyl being insoluble in water, a sequential impregnation for adding the promoters and the ruthenium to the support was used. Promoters were added first using dry impregnation. Nitrates of cerium, chromium, iron, magnesium, manganese, neodymium, silver and thulium, ammonium perrhenate, and tin acetate were sourced from Sigma Aldrich; nitrates of bismuth, cadmium, dysprosium, erbium, lead, strontium and terbium, acetates of cesium, iridium and sodium, hafnium acetylacetonate, vanadium acetylacetonate, and zirconium dinitrate oxide were sourced from Fisher Scientific (Waltham. MA); nitrates of aluminum, barium, calcium, europium, gallium, gadolinium, holmium, indium, lanthanum, lutetium, nickel, samarium, yttrium, ytterbium and zinc, potassium acetate and scandium acetate were sourced from Alfa Aesar (Ward Hill, MA); Cobalt nitrate, copper nitrate and lithium acetate were sourced from Acros Organics (Geel, Belgium); and rubidium acetate was sourced from Strem Chemicals (Newburyport, MA) (a table of promoter precursors can be in Table S2 for clarity). Following the addition, the supports were dried and then calcined at or around 650°C for one hour, with a ramping rate of 2.5°C/min. After the promotion, triruthenium dodecacarbonyl (Sigma Aldrich) was dissolved in tetrahydrofuran and deposited using wet impregnation. After the solvent evaporated, the catalysts were calcined under argon (Airgas) at 350°C for three hours in a Linberg Blue furnace as a base testing case.
3.2. Catalyst Evaluation
The catalysts were analyzed in a four-channel parallel reactor, where approximately 0.2g of each catalyst was added to a ¼” reactor tube fitted with stainless steel frits. The catalysts were reduced under hydrogen (Airgas) at 500°C for one hour before being cooled and pressurized under a 50:50 mix of hydrogen and nitrogen. Each reactor was held at 30 bar using backpressure regulators, and catalysts were tested using a total flow rate of approximately 120 sccm per reactor between 283°C and 442°C, measured using a K-type thermocouple in each catalyst bed. The final gas mixture was then analyzed using a Shimadzu GC-2014 (Kyoto, Japan) with a TCD detector and Restek RTX-VolatileAmine column. Nitrogen and hydrogen reaction orders were determined by the change in reaction rate due to variation of the partial pressures whilst balanced in argon, and the ammonia reaction order was determined by varying the total flow of reactants with comparison on resultant ammonia concentration as previously performed in literature. [10,55]
3.3. Catalyst Characterization
TPR, physisorption, and H2 chemisorption were all completed on an Autosorb iQ-C-XR-XR-XR (Anton Paar, Ashland, VA, USA). TPR was conducted on samples dried at 120°C under helium for one hour and cooled before analysis. Samples were ramped at 20°C/min. For physisorption analysis, samples were outgassed at 300°C for three hours before they were analyzed at 77K, with BET analysis conducted at the 0.3 P/P0 pressure. Hydrogen chemisorption was accomplished after an in situ reduction at 500°C for one hour before argon was flowed and samples cooled. Samples were then analyzed at 30°C.
X-ray diffraction (XRD) was carried out on a Rigaku Miniflex II (Tokyo, Japan) with a Cu-Kα X-ray source and a D/teX Ultra: silicon strip detector. The patterns were collected from 20 to 80° 2Θ with a scanning speed of 6°/min, a step size of 0.01º, a scanning voltage of 30 kV, and a current of 15 mA.
DRIFTS analysis was conducted on a Bruker Vertex 70 FT-IR spectrometer (Bruker, Billerica, MA, USA) with a mercury cadmium telluride (MCT) detector. FT-IR testing parameters were a scanning wavelength range from 4000 to 1000 cm-1, a resolution of 4 cm-1, and averaged over 128 scans with dried air as a background. Before analysis, samples were reduced at several conditions, hydrogen was removed, and cooling occurred under argon. All samples were then analyzed at 30°C, to increase adsorption of probe molecules, and atmospheric pressures, due to limitations of the DRIFTS cell. X-Ray Photoelectron Spectroscopy (XPS) was performed using a Kratos AXIS Ultra DLD XPS system with a monochromatic Al K source. The samples were prereduced in situ using a catalysis cell at 350°C for 3 hours to prevent exposure to air between reduction and analysis.
ICP-OES was used to determine the actual amount of ruthenium deposited on the catalysts. Samples were compared to ruthenium standards (Spex, Metuchen, NJ) and analyzed on a Perkin-Elmer Avio 200 (Waltham, MA).
4. Conclusions
Numerous promoted ruthenium-based catalysts were investigated on praseodymium oxide for ammonia synthesis. Of the nearly 40 metals tested for promotional activity, a mixture of barium and cesium was shown to be the most active. This catalyst was optimized and was able to produce more than 65 mmol/gcat/hr, nearly a six-fold increase in activity to the unpromoted catalyst. Further, the addition of the promoters led to a restructuring of the ruthenium into clear nanoparticles from isolated ruthenium, as shown by CO-DRIFTS. Further in situ spectroscopy permitted us to determine that the isolated/nanocluster ruthenium catalysts use the associative mechanism, with hydrogenation being the first step in the reaction. Moreover, the role of the barium (in the form of BaO) in this catalyst is to act as an excess hydrogen scavenger and back donor, further explaining the shift in hydrogen reaction order, and opening up possibilities for new active sites on the catalyst.
6. Patents
SD, JN and JL would like to declare that a patent has been filed for these catalysts.
Supplementary Materials
The following supporting information can be downloaded at the website of this paper posted on Preprints.org, Fig S1: Cycling of unpromoted Ru/PrOx catalyst, Fig S2: Arrhenius plot of screen catalysts, Table S1: Comparison of state of the art catalysts for ammonia synthesis, Fig S3: XRD patterns for screened catalysts, Fig S4: TPR profiles for various combinations of Ru, Cs and Ba on PrOx, Fig S5: Rate vs. Temperature plots for screened promoters, Figs S6-S11: Information for tests conducted to determine reaction orders, Table S2: List of promoter precursors used.
Author Contributions
Samuel M. Drummond: Conceptualization, Investigation, Writing- Original Draft, Writing: Review & Editing, Jennifer Naglic: Investigation, Writing: Review & Editing, Thossaporn Onsree: Investigation, Writing: Review & Editing, S. K. Balijepalli: Investigation, Writing: Review & Editing, Alexis Allegro: Investigation, Stephanie N. Orraca Albino: Investigation, Katherine M. O’Connell: Investigation, Jochen Lauterbach: Conceptualization, Supervision, Project Administration, Funding acquisition, Writing: Review & Editing.
Funding
This work was supported by the United States Department of Energy- EERE/AMO grant DE-EE0009409.
Data Availability Statement
Data will be made available upon request.
Conflicts of Interest
The authors declare no conflict of interest.
References
- Daisley, A.; Hargreaves, J.S.J.; Hermann, R.; Poya, Y.; Wang, Y. A Comparison of the Activities of Various Supported Catalysts for Ammonia Synthesis. Catal Today 2020, 357, 534–540. [CrossRef]
- Ogawa, T.; Yoshida, M.; Ishihara, K. Techno-Economic Analysis on Recent Heterogeneous Catalysts for Ammonia Synthesis. ChemRxiv 2022.
- Knaebel, K.S. Pressure Swing Adsorption System for Ammonia Synthesis 1996.
- Bhadra, S.J. Purification of Ammonia by Pressure Swing Adsorption. Doctoral Dissertation, University of South Carolina, 2012.
- Padinjarekutt, S.; Sengupta, B.; Li, H.; Friedman, K.; Behera, D.; Lecaros, R.; Yu, M. Synthesis of Na+-Gated Nanochannel Membranes for the Ammonia (NH3) Separation. J Memb Sci 2023, 674, 121512. [CrossRef]
- Saadatjou, N.; Jafari, A.; Sahebdelfar, S. Ruthenium Nanocatalysts for Ammonia Synthesis: A Review. Chem Eng Commun 2015, 202, 420–448. [CrossRef]
- Rosowski, F.; Hornung, A.; Hinrichsen, O.; Herein, D.; Muhler, M.; Ertl, G. Ruthenium Catalysts for Ammonia Synthesis at High Pressures: Preparation, Characterization, and Power-Law Kinetics. Appl Catal A Gen 1997, 151, 443–460. [CrossRef]
- Zhang, X.; Liu, L.; Wang, J.; Ju, X.; Si, R.; Feng, J.; Guo, J.; Chen, P. The Role of Lanthanum Hydride Species in La2O3 Supported Ru Cluster Catalyst for Ammonia Synthesis. J Catal 2023, 417, 382–395. [CrossRef]
- Li, C.; Zhang, Z.; Zheng, Y.; Fang, B.; Ni, J.; Lin, J.; Lin, B.; Wang, X.; Jiang, L. Titanium Modified Ru/CeO2 Catalysts for Ammonia Synthesis. Chem Eng Sci 2022, 251, 117434. [CrossRef]
- Imamura, K.; Miyahara, S.; Kawano, Y.; Sato, K.; Nakasaka, Y.; Nagaoka, K. Kinetics of Ammonia Synthesis over Ru/Pr2O3. J Taiwan Inst Chem Eng 2019, 105, 50–56. [CrossRef]
- Sato, K.; Imamura, K.; Kawano, Y.; Miyahara, S.; Yamamoto, T.; Matsumura, S.; Nagaoka, K. A Low-Crystalline Ruthenium Nano-Layer Supported on Praseodymium Oxide as an Active Catalyst for Ammonia Synthesis. Chem Sci 2017, 8, 674–679. [CrossRef]
- Li, W.; Wang, S.; Li, J. Highly Effective Ru/BaCeO 3 Catalysts on Supports with Strong Basic Sites for Ammonia Synthesis. Chem Asian J 2019, 14, 2815–2821. [CrossRef]
- Truszkiewicz, E.; Raróg-Pilecka, W.; Schmidt-Szałowski, K.; Jodzis, S.; Wilczkowska, E.; Łomot, D.; Kaszkur, Z.; Karpiński, Z.; Kowalczyk, Z. Barium-Promoted Ru/Carbon Catalyst for Ammonia Synthesis: State of the System When Operating. J Catal 2009, 265, 181–190. [CrossRef]
- Osozawa, M.; Hori, A.; Fukai, K.; Honma, T.; Oshima, K.; Satokawa, S. Improvement in Ammonia Synthesis Activity on Ruthenium Catalyst Using Ceria Support Modified a Large Amount of Cesium Promoter. Int J Hydrogen Energy 2022, 47, 2433–2441. [CrossRef]
- Chen, S.-Y.; Chang, C.-L.; Nishi, M.; Hsiao, W.-C.; Reyes, Y.I.A.; Tateno, H.; Chou, H.-H.; Yang, C.-M.; Chen, H.-Y.T.; Mochizuki, T.; et al. Unraveling the Active Sites of Cs-Promoted Ru/γ-Al2O3 Catalysts for Ammonia Synthesis. Appl Catal B 2022, 310, 121269. [CrossRef]
- Aika, K. Role of Alkali Promoter in Ammonia Synthesis over Ruthenium Catalysts—Effect on Reaction Mechanism. Catal Today 2017, 286, 14–20. [CrossRef]
- Wang, Q.; Guo, J.; Chen, P. The Impact of Alkali and Alkaline Earth Metals on Green Ammonia Synthesis. Chem 2021, 7, 3203–3220. [CrossRef]
- Zeinalipour-Yazdi, C.D.; Hargreaves, J.S.J.; Laassiri, S.; Catlow, C.R.A. A Comparative Analysis of the Mechanisms of Ammonia Synthesis on Various Catalysts Using Density Functional Theory. R Soc Open Sci 2021, 8. [CrossRef]
- Wang, X.; Li, L.; Fang, Z.; Zhang, Y.; Ni, J.; Lin, B.; Zheng, L.; Au, C.; Jiang, L. Atomically Dispersed Ru Catalyst for Low-Temperature Nitrogen Activation to Ammonia via an Associative Mechanism. ACS Catal 2020, 10, 9504–9514. [CrossRef]
- Ghoreishian, S.M.; Shariati, K.; Huh, Y.S.; Lauterbach, J. Recent Advances in Ammonia Synthesis over Ruthenium Single-Atom-Embedded Catalysts: A Focused Review. Chemical Engineering Journal 2023, 467, 143533. [CrossRef]
- Zhang, Y.; Li, J.; Zhou, Y.; Au, C.; Wang, X.; Jiang, L. Recent Progress of Thermocatalytic Ammonia Synthesis via an Associative Mechanism. Fundamental Research 2024. [CrossRef]
- Vieri, H.M.; Badakhsh, A.; Choi, S.H. Comparative Study of Ba, Cs, K, and Li as Promoters for Ru/La2Ce2O7-Based Catalyst for Ammonia Synthesis. Int J Energy Res 2023, 2023, 1–11. [CrossRef]
- Humphreys, J.; Lan, R.; Tao, S. Development and Recent Progress on Ammonia Synthesis Catalysts for Haber–Bosch Process. Advanced Energy and Sustainability Research 2021, 2. [CrossRef]
- Forni, L.; Molinari, D.; Rossetti, I.; Pernicone, N. Carbon-Supported Promoted Ru Catalyst for Ammonia Synthesis. Appl Catal A Gen 1999, 185, 269–275. [CrossRef]
- Aika, K.; Takano, T.; Murato, S. Preparation and Characterization of Chlorine-Free Ruthenium Catalysts and the Promoter Effect in Ammonia Synthesis 3. A Magnesia-Supported Ruthenium Catalyst. J Catal 1992, 136, 126–140. [CrossRef]
- Zheng, J.; Liao, F.; Wu, S.; Jones, G.; Chen, T.; Fellowes, J.; Sudmeier, T.; McPherson, I.J.; Wilkinson, I.; Tsang, S.C.E. Efficient Non-dissociative Activation of Dinitrogen to Ammonia over Lithium-Promoted Ruthenium Nanoparticles at Low Pressure. Angewandte Chemie International Edition 2019, 58, 17335–17341. [CrossRef]
- Lin, B.; Wang, R.; Lin, J.; Ni, J.; Wei, K. Effect of Chlorine on the Chemisorptive Properties and Ammonia Synthesis Activity of Alumina-Supported Ru Catalysts. Catal Letters 2011, 141, 1557–1568. [CrossRef]
- Zeng, H.S.; Inazu, K.; Aika, K. The Working State of the Barium Promoter in Ammonia Synthesis over an Active-Carbon-Supported Ruthenium Catalyst Using Barium Nitrate as the Promoter Precursor. J Catal 2002, 211, 33–41. [CrossRef]
- Ren, Y.; Sun, X.; Huang, J.; Zhang, L.; Zhang, B.; Haruta, M.; Lu, A.-H. Dual-Component Sodium and Cesium Promoters for Au/TS-1: Enhancement of Propene Epoxidation with Hydrogen and Oxygen. Ind Eng Chem Res 2020, 59, 8155–8163. [CrossRef]
- Tikhonov, P.A.; Nakusov, A.T.; Popova, I.O.; Konyukhov, G.S. Investigation of the Surface Structure of Dysprosium and Praseodymium Oxide-Based Polycrystalline Films Sensitive to Ozone and Vapors of Ethanol and Methanol. Glass Physics and Chemistry 2005, 31, 252–258. [CrossRef]
- Ogura, Y.; Sato, K.; Miyahara, S.; Kawano, Y.; Toriyama, T.; Yamamoto, T.; Matsumura, S.; Hosokawa, S.; Nagaoka, K. Efficient Ammonia Synthesis over a Ru/La 0.5 Ce 0.5 O 1.75 Catalyst Pre-Reduced at High Temperature. Chem Sci 2018, 9, 2230–2237. [CrossRef]
- Sato, K.; Miyahara, S.; Ogura, Y.; Tsujimaru, K.; Wada, Y.; Toriyama, T.; Yamamoto, T.; Matsumura, S.; Nagaoka, K. Surface Dynamics for Creating Highly Active Ru Sites for Ammonia Synthesis: Accumulation of a Low-Crystalline, Oxygen-Deficient Nanofraction. ACS Sustain Chem Eng 2020, 8, 2726–2734. [CrossRef]
- Bardwell, C.J.; Bickley, R.I.; Poulston, S.; Twigg, M. V. Thermal Decomposition of Bulk and Supported Barium Nitrate. Thermochim Acta 2015, 613, 94–99. [CrossRef]
- Miyajima, K.; Mafuné, F. Thermal Decomposition of Triruthenium Dodecacarbonyl Investigated by Variable-Temperature Mass Spectrometry in the Gas Phase. Chem Phys Lett 2022, 786, 139191. [CrossRef]
- Zhao, X.; Hrbek, J.; Rodriguez, J.A. The Decomposition and Chemistry of Ru3(CO)12 on TiO2(110) Studied with X-Ray Photoelectron Spectroscopy and Temperature Programmed Desorption. Surf Sci 2005, 575, 115–124. [CrossRef]
- Meier, D.C.; Rizzi, G.A.; Granozzi, G.; Lai, X.; Goodman, D.W. Ru 3 (CO) 12 Adsorption and Decomposition on TiO 2. Langmuir 2002, 18, 698–705. [CrossRef]
- Ferro, S. Physicochemical and Electrical Properties of Praseodymium Oxides. International Journal of Electrochemistry 2011, 2011, 1–7. [CrossRef]
- Javaid, R.; Nanba, T. Stability of Cs/Ru/MgO Catalyst for Ammonia Synthesis as a Hydrogen and Energy Carrier. Energies (Basel) 2022, 15, 3506. [CrossRef]
- Schwegmann, S.; Seitsonen, A.P.; Dietrich, H.; Bludau, H.; Over, H.; Jacobi, K.; Ertl, G. The Adsorption of Atomic Nitrogen on Ru(0001): Geometry and Energetics. Chem Phys Lett 1997, 264, 680–686. [CrossRef]
- Peng, X.; Chen, X.; Zhou, Y.; Sun, F.; Zhang, T.; Zheng, L.; Jiang, L.; Wang, X. Size-Dependent Activity of Supported Ru Catalysts for Ammonia Synthesis at Mild Conditions. J Catal 2022, 408, 98–108. [CrossRef]
- Baik, Y.; Kwen, M.; Lee, K.; Chi, S.; Lee, S.; Cho, K.; Kim, H.; Choi, M. Splitting of Hydrogen Atoms into Proton–Electron Pairs at BaO–Ru Interfaces for Promoting Ammonia Synthesis under Mild Conditions. J Am Chem Soc 2023, 145, 11364–11374. [CrossRef]
- Chin, S.Y.; Williams, C.T.; Amiridis, M.D. FTIR Studies of CO Adsorption on Al 2 O 3 - and SiO 2 -Supported Ru Catalysts. J Phys Chem B 2006, 110, 871–882. [CrossRef]
- Rini, A.S.; Radiman, S.; Yarmo, Mohd.A. XPS and TPR Studies of 2%(Ru 1/2 -Sn 1/2 )/Al 2 O 3 Catalyst Synthesized by Microwave Techniques. J Phys Conf Ser 2018, 1120, 012036. [CrossRef]
- Zhang, X.; Liu, L.; Feng, J.; Ju, X.; Wang, J.; He, T.; Chen, P. Ru Nanoparticles on Pr2O3 as an Efficient Catalyst for Hydrogen Production from Ammonia Decomposition. Catal Letters 2022, 152, 1170–1181. [CrossRef]
- Deng, Y.; Yang, L.; Wang, Y.; Zeng, L.; Yu, J.; Chen, B.; Zhang, X.; Zhou, W. Ruthenium Nanoclusters Anchored on Cobalt Phosphide Hollow Microspheres by Green Phosphating Process for Full Water Splitting in Acidic Electrolyte. Chinese Chemical Letters 2021, 32, 511–515. [CrossRef]
- Kubota, J.; Aika, K. Infrared Studies of Adsorbed Dinitrogen on Supported Ruthenium Catalysts for Ammonia Synthesis: Effects of the Alumina and Magnesia Supports and the Cesium Compound Promoter. J Phys Chem 1994, 98, 11293–11300. [CrossRef]
- Zimmermann, F.; Lippert, Th.; Beyer, Ch.; Stebani, J.; Nuyken, O.; Wokaun, A. N=N Vibrational Frequencies and Fragmentation Patterns of Substituted 1-Aryl-3,3-Dialkyl-Triazenes: Comparison with Other High-Nitrogen Compounds. Appl Spectrosc 1993, 47, 986–993. [CrossRef]
- Larkin, P.J. General Outline for IR and Raman Spectral Interpretation. In Infrared and Raman Spectroscopy; Elsevier, 2018; pp. 135–151.
- Rayner-Canham, G.W.; Sutton, D. Identification of ν(N=N) in Metal Arylazo Complexes: The Infrared and Raman Spectra of Some Arylazo Complexes of Rhodium(III). Can J Chem 1971, 49, 3994–3996. [CrossRef]
- Sun, K.; Zou, X.; Sun, X.; Pang, W.; Hao, X.; Xu, Y.; Su, H.-Y. Structure and Reaction Condition Dependent Mechanism for Ammonia Synthesis on Ru-Based Catalyst. Appl Surf Sci 2023, 613, 156060. [CrossRef]
- Zeinalipour-Yazdi, C.D.; Hargreaves, J.S.J.; Laassiri, S.; Catlow, C.R.A. A Comparative Analysis of the Mechanisms of Ammonia Synthesis on Various Catalysts Using Density Functional Theory. R Soc Open Sci 2021, 8. [CrossRef]
- Jacobsen, C.J.H.; Dahl, S.; Hansen, P.L.; Törnqvist, E.; Jensen, L.; Topsøe, H.; Prip, D. V; Møenshaug, P.B.; Chorkendorff, I. Structure Sensitivity of Supported Ruthenium Catalysts for Ammonia Synthesis. J Mol Catal A Chem 2000, 163, 19–26. [CrossRef]
- Logadóttir, Á.; Nørskov, J.K. Ammonia Synthesis over a Ru(0001) Surface Studied by Density Functional Calculations. J Catal 2003, 220, 273–279. [CrossRef]
- Li, Q.; Chen, S.; Wang, Y.; Li, K.; Li, M.; Liu, L.; Wang, F. Elucidating the Dissociative and Associative Mechanisms on the Surface-Anchored Fe3 Cluster under the Effect of External Electric Field. Appl Surf Sci 2023, 623, 157021. [CrossRef]
- Lee, K.; Woo, R.; Woo, H.C.; Ko, G.; Cho, K.; Park, Y.; Choi, M.; Yoon, H.C. Unraveling the Role of MgO in the Ru-Ba/MgO Catalyst for Boosting Ammonia Synthesis: Comparative Study of MgO and MgAlO Supports. J Catal 2024, 434, 115530. [CrossRef]
Figure 1.
(a) Comparison of alkali promoted 1 wt.% Ru, 2 wt.% M/PrOx catalysts at various temperatures. Rate shown with a standard deviation of 2.4% calculated based on repetition of a representative sample (with n=4). (b) Comparison of doubly-promoted 1 wt.% Ru, 2 wt.% Cs, 2 wt.% M/PrOx catalysts at various temperatures. Selected catalysts shown in color, remaining catalysts are shown with grey lines for simplicity, all catalysts are shown in Fig. S5 All catalysts were tested at a space velocity of 36,000 mL/gcat/hr, 1:1 H2:N2 and 30 bar.
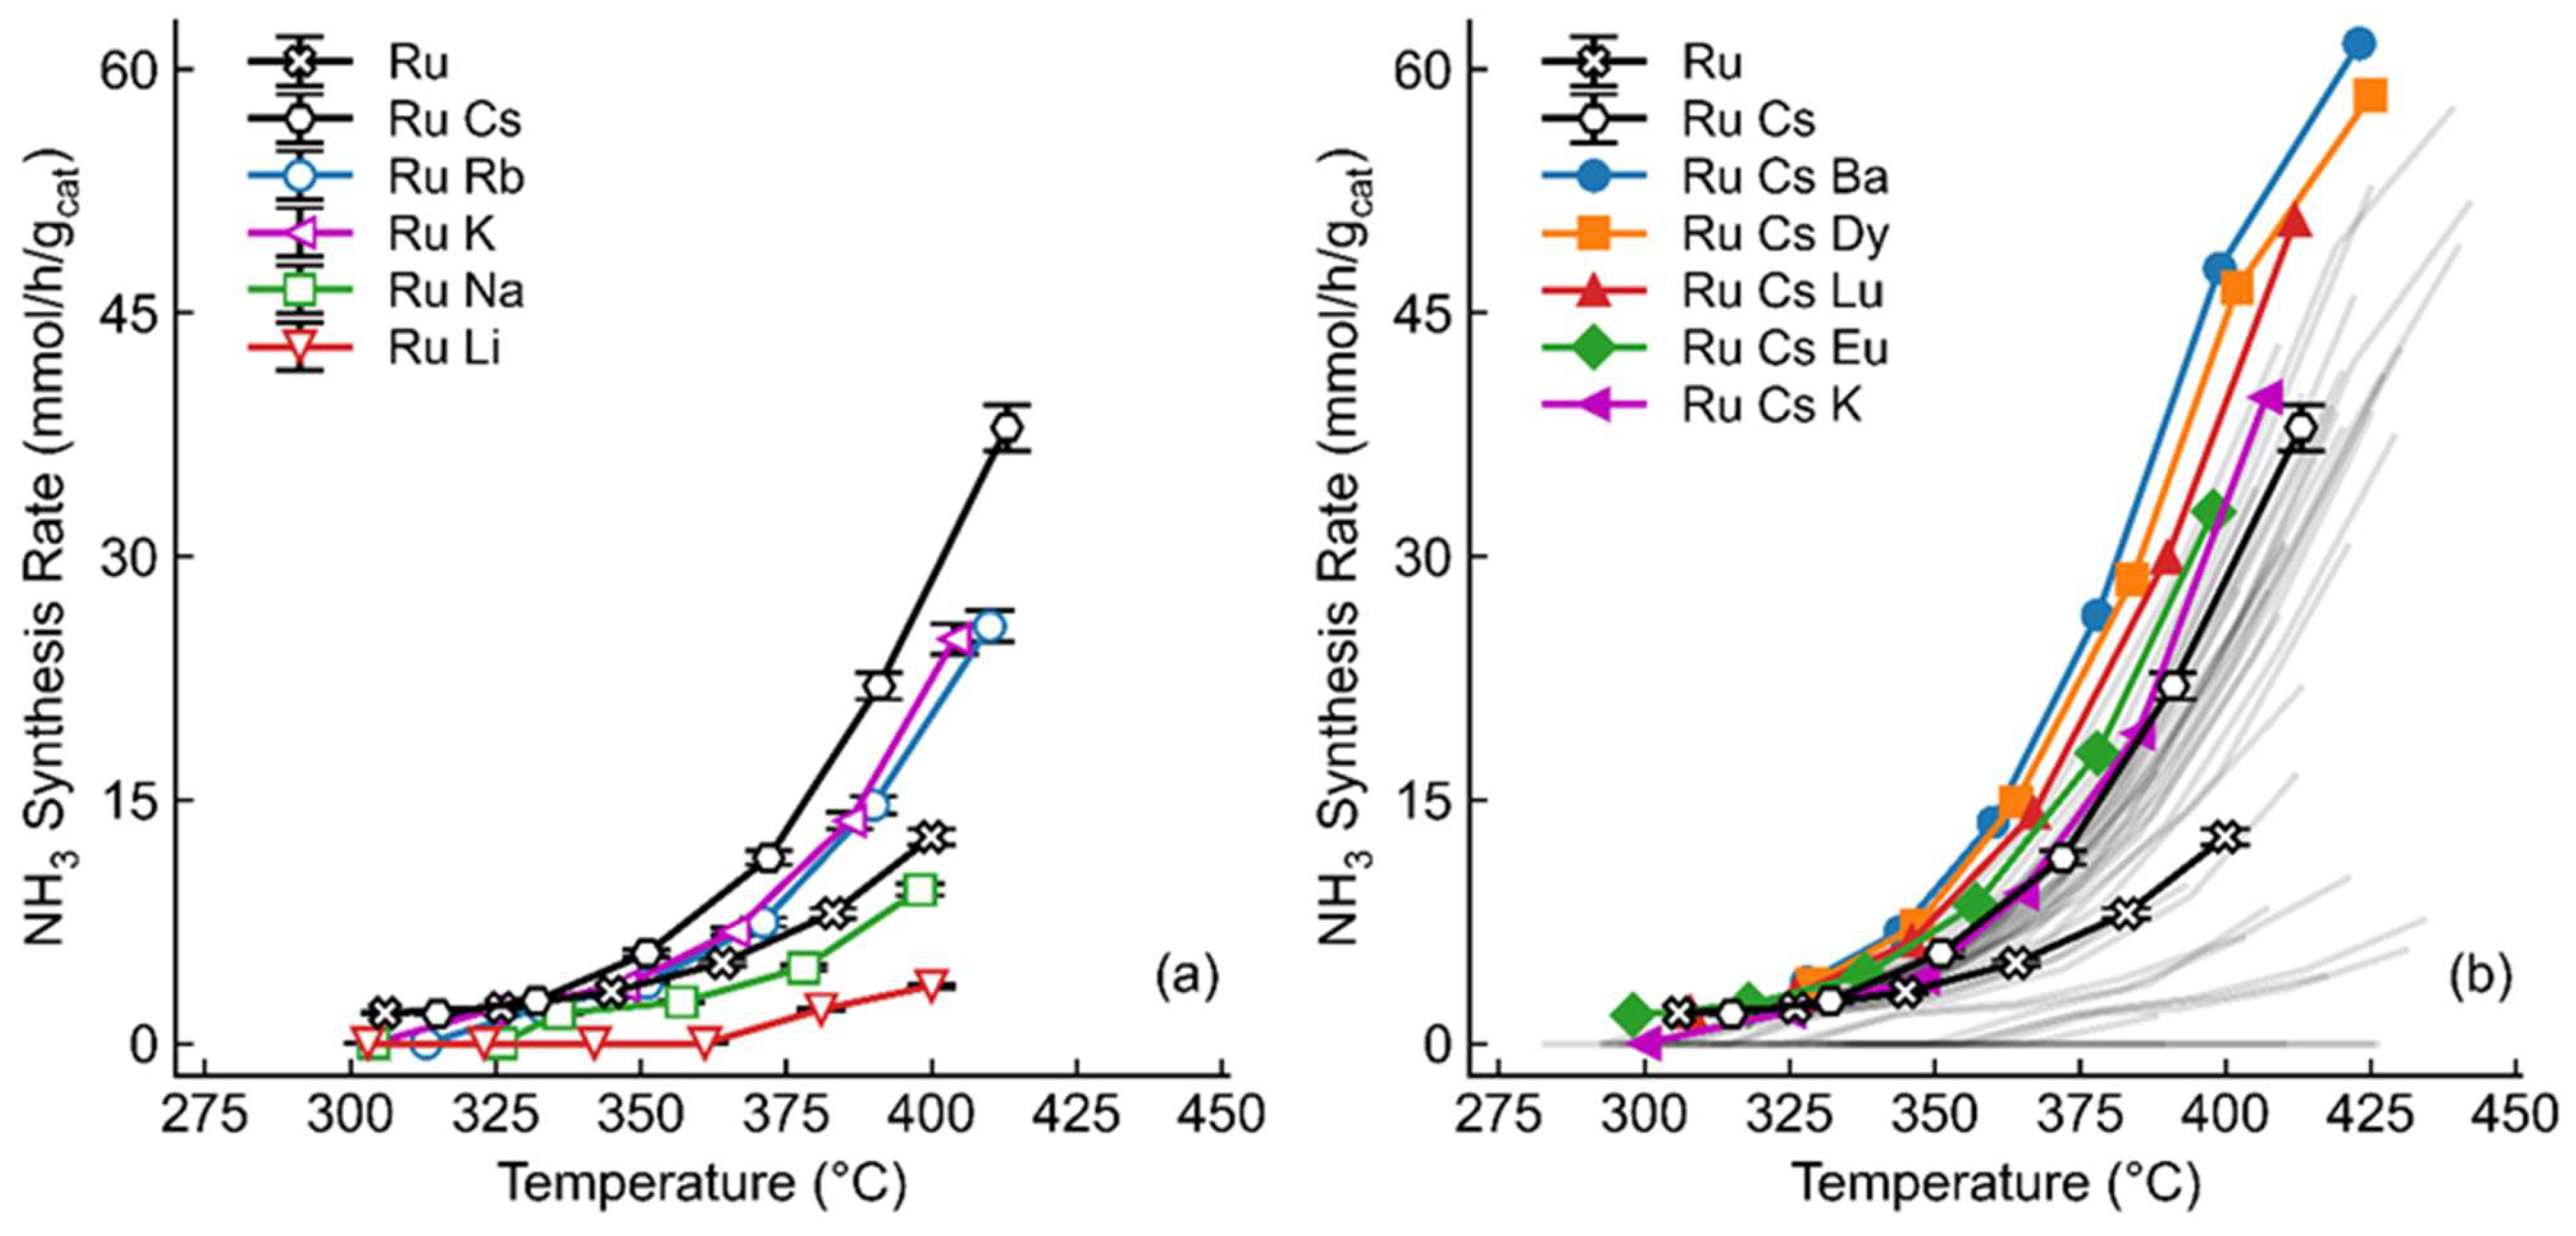
Figure 2.
(a) Comparison of doubly promoted 1 wt.% Ru, 2 wt.% Cs, 2 wt.% Ba/PrOx catalysts at various calcination temperatures (°C) and times (min). (b) Comparison of doubly promoted 1 wt.% Ru, 2 wt.% Cs, 2 wt.% Ba/PrOx catalysts at various calcination temperatures (°C) and times (min) under argon. (c) Comparison of doubly promoted 1 wt.% Ru, 2 wt.% Cs, 2 wt.% Ba/PrOx catalysts at various reduction temperatures (°C) and times (min) under pure hydrogen. (d) Comparison of doubly promoted 1 wt.% Ru, X wt.% Cs, Y wt.% Ba/PrOx. All catalysts were tested at a space velocity of 36,000 mL/gcat/hr, 1:1 H2:N2, 400°C and 30 bar.
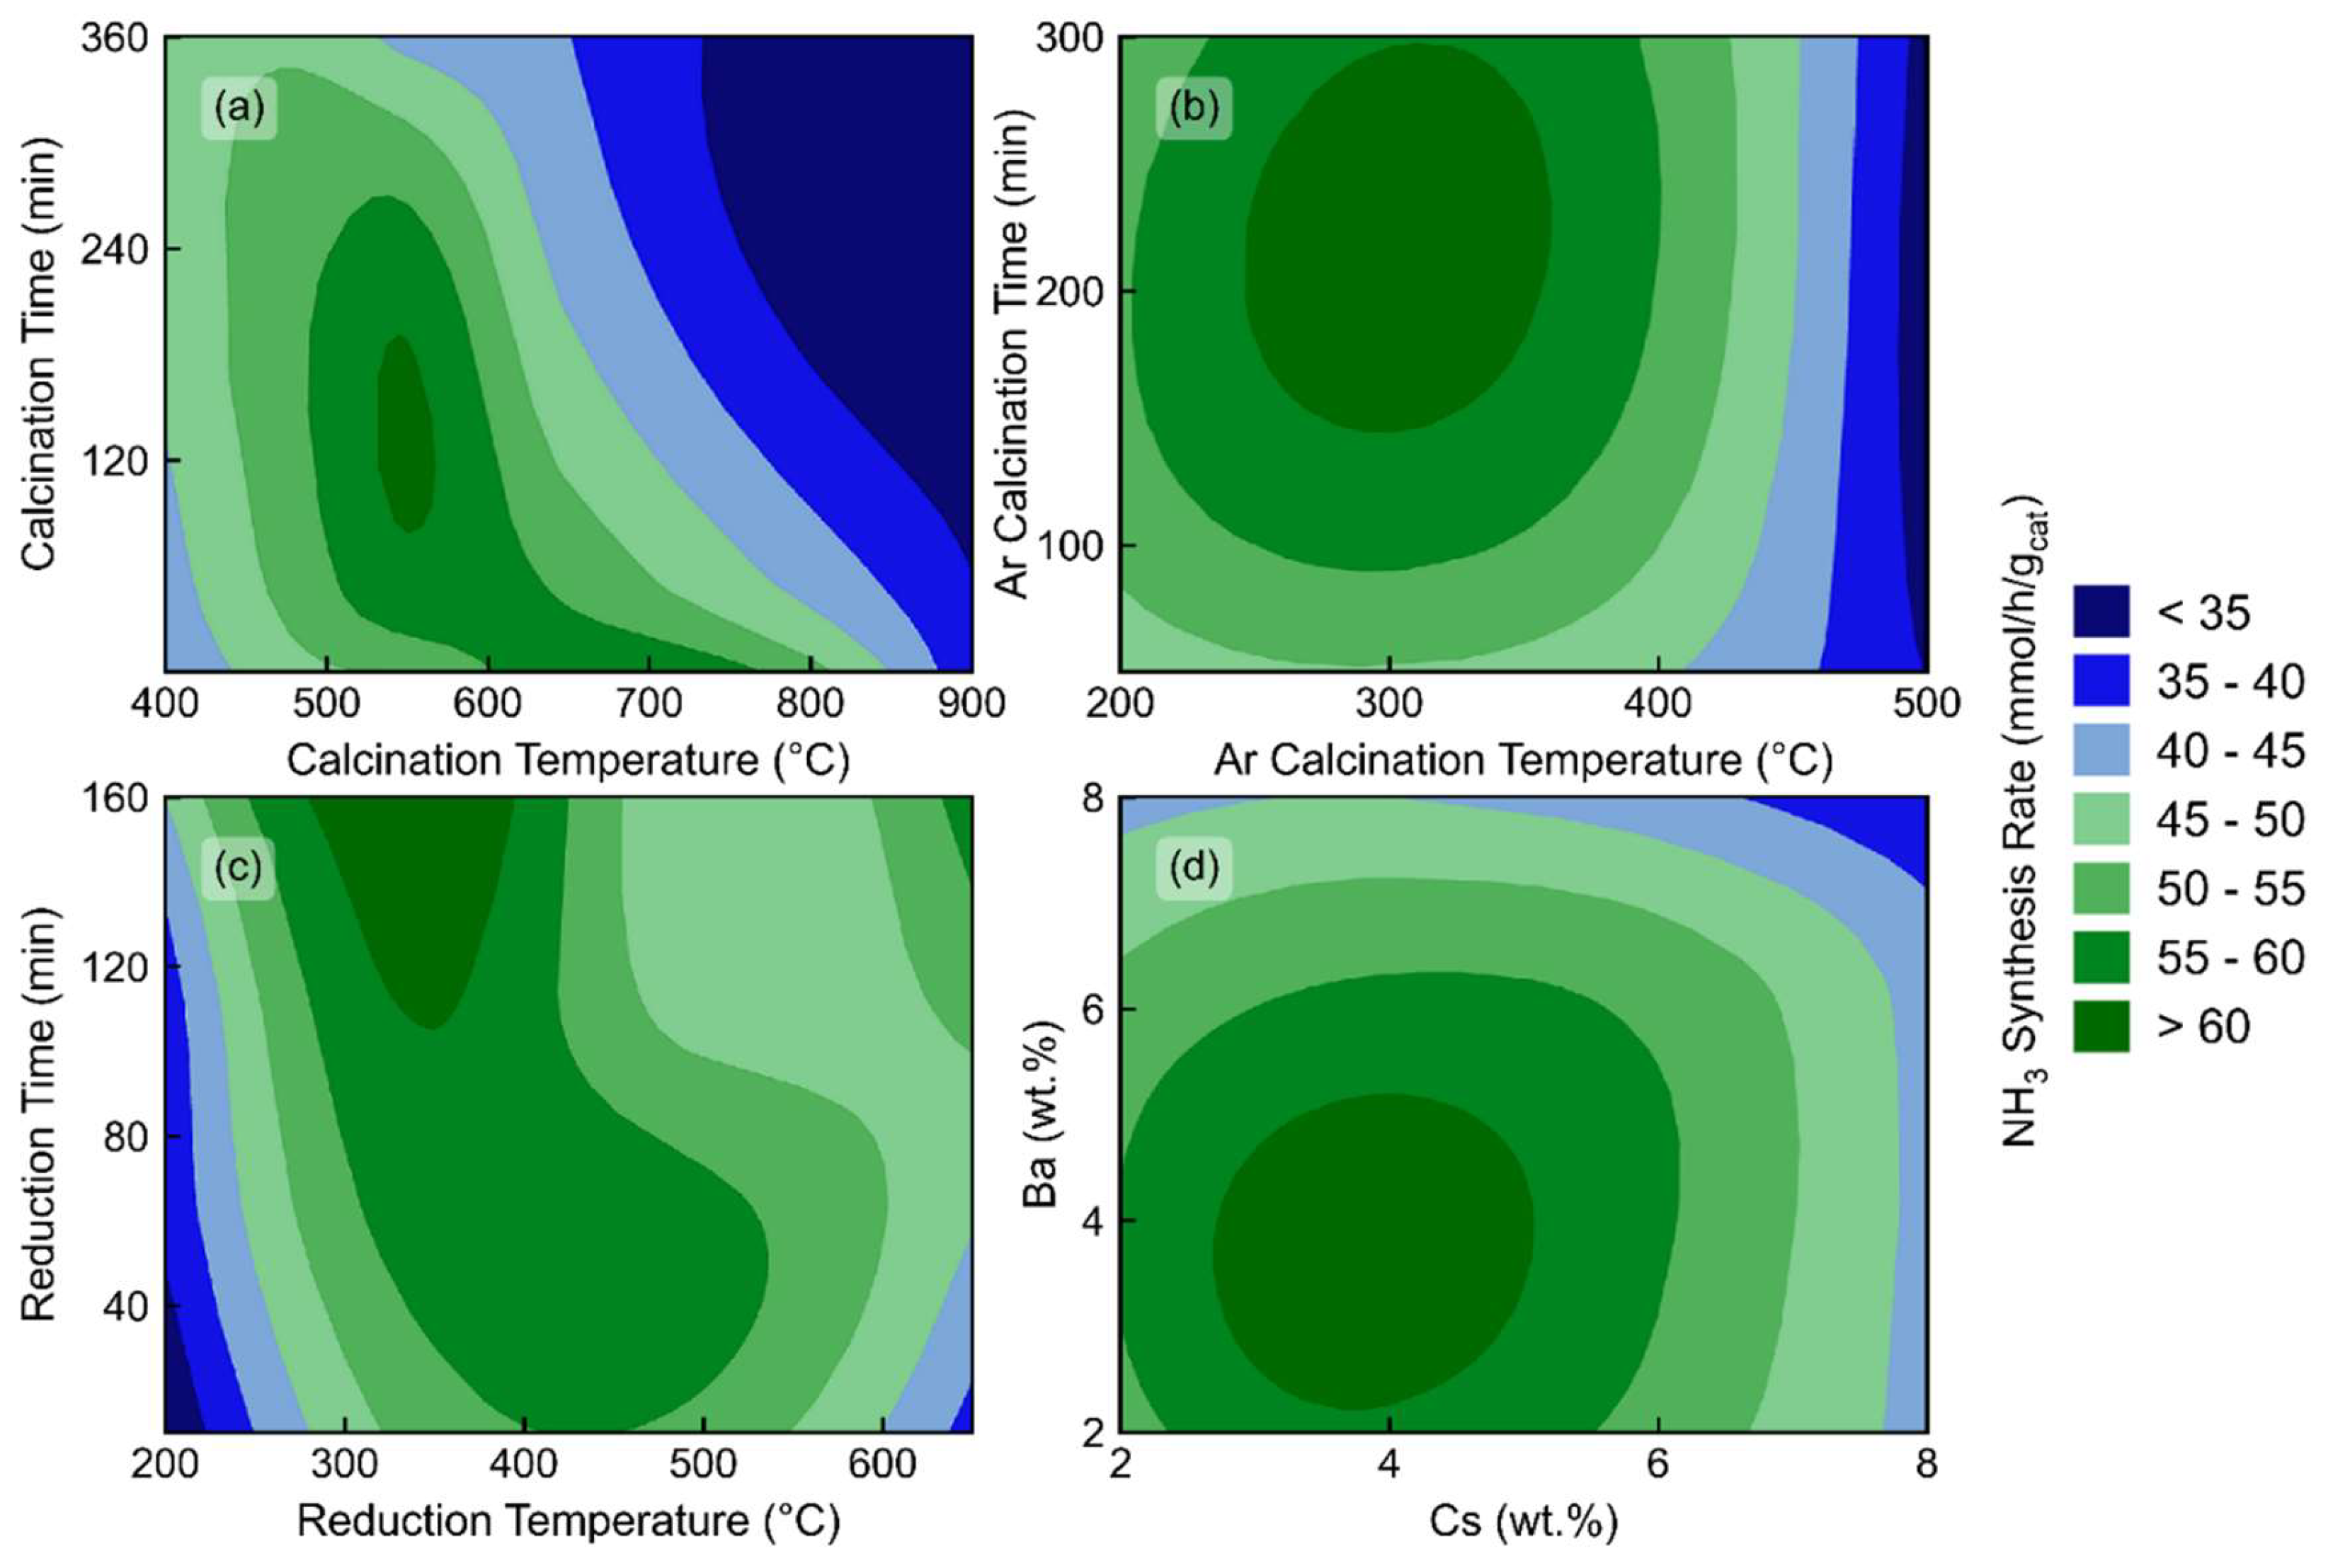
Figure 3.
(a) Temperature dependency of 1 wt.% Ru, 4.12 wt.% Cs, 3.86 wt.% Ba/PrOx, prepared at optimal pretreatment conditions. Rate shown with a standard deviation of 2.4% calculated based on repetition of a representative sample (with n=4). (b) Stability of 1 wt.% Ru, 4.12 wt.% Cs, 3.86 wt.% Ba/PrOx tested at 400 °C, prepared at optimal pretreatment conditions. Data was fit with an exponential fit with equation and R2 shown. (c) Stability of 1 wt.% Ru, 1 wt.% Cs, 4 wt.% Ba/PrOx tested at 400 °C, prepared at optimal pretreatment conditions. All catalysts were tested at a space velocity of 36,000 mL/gcat/hr, 1:1 H2:N2 and 30 bar. Data was fit with a linear fit with equation and R2 shown.
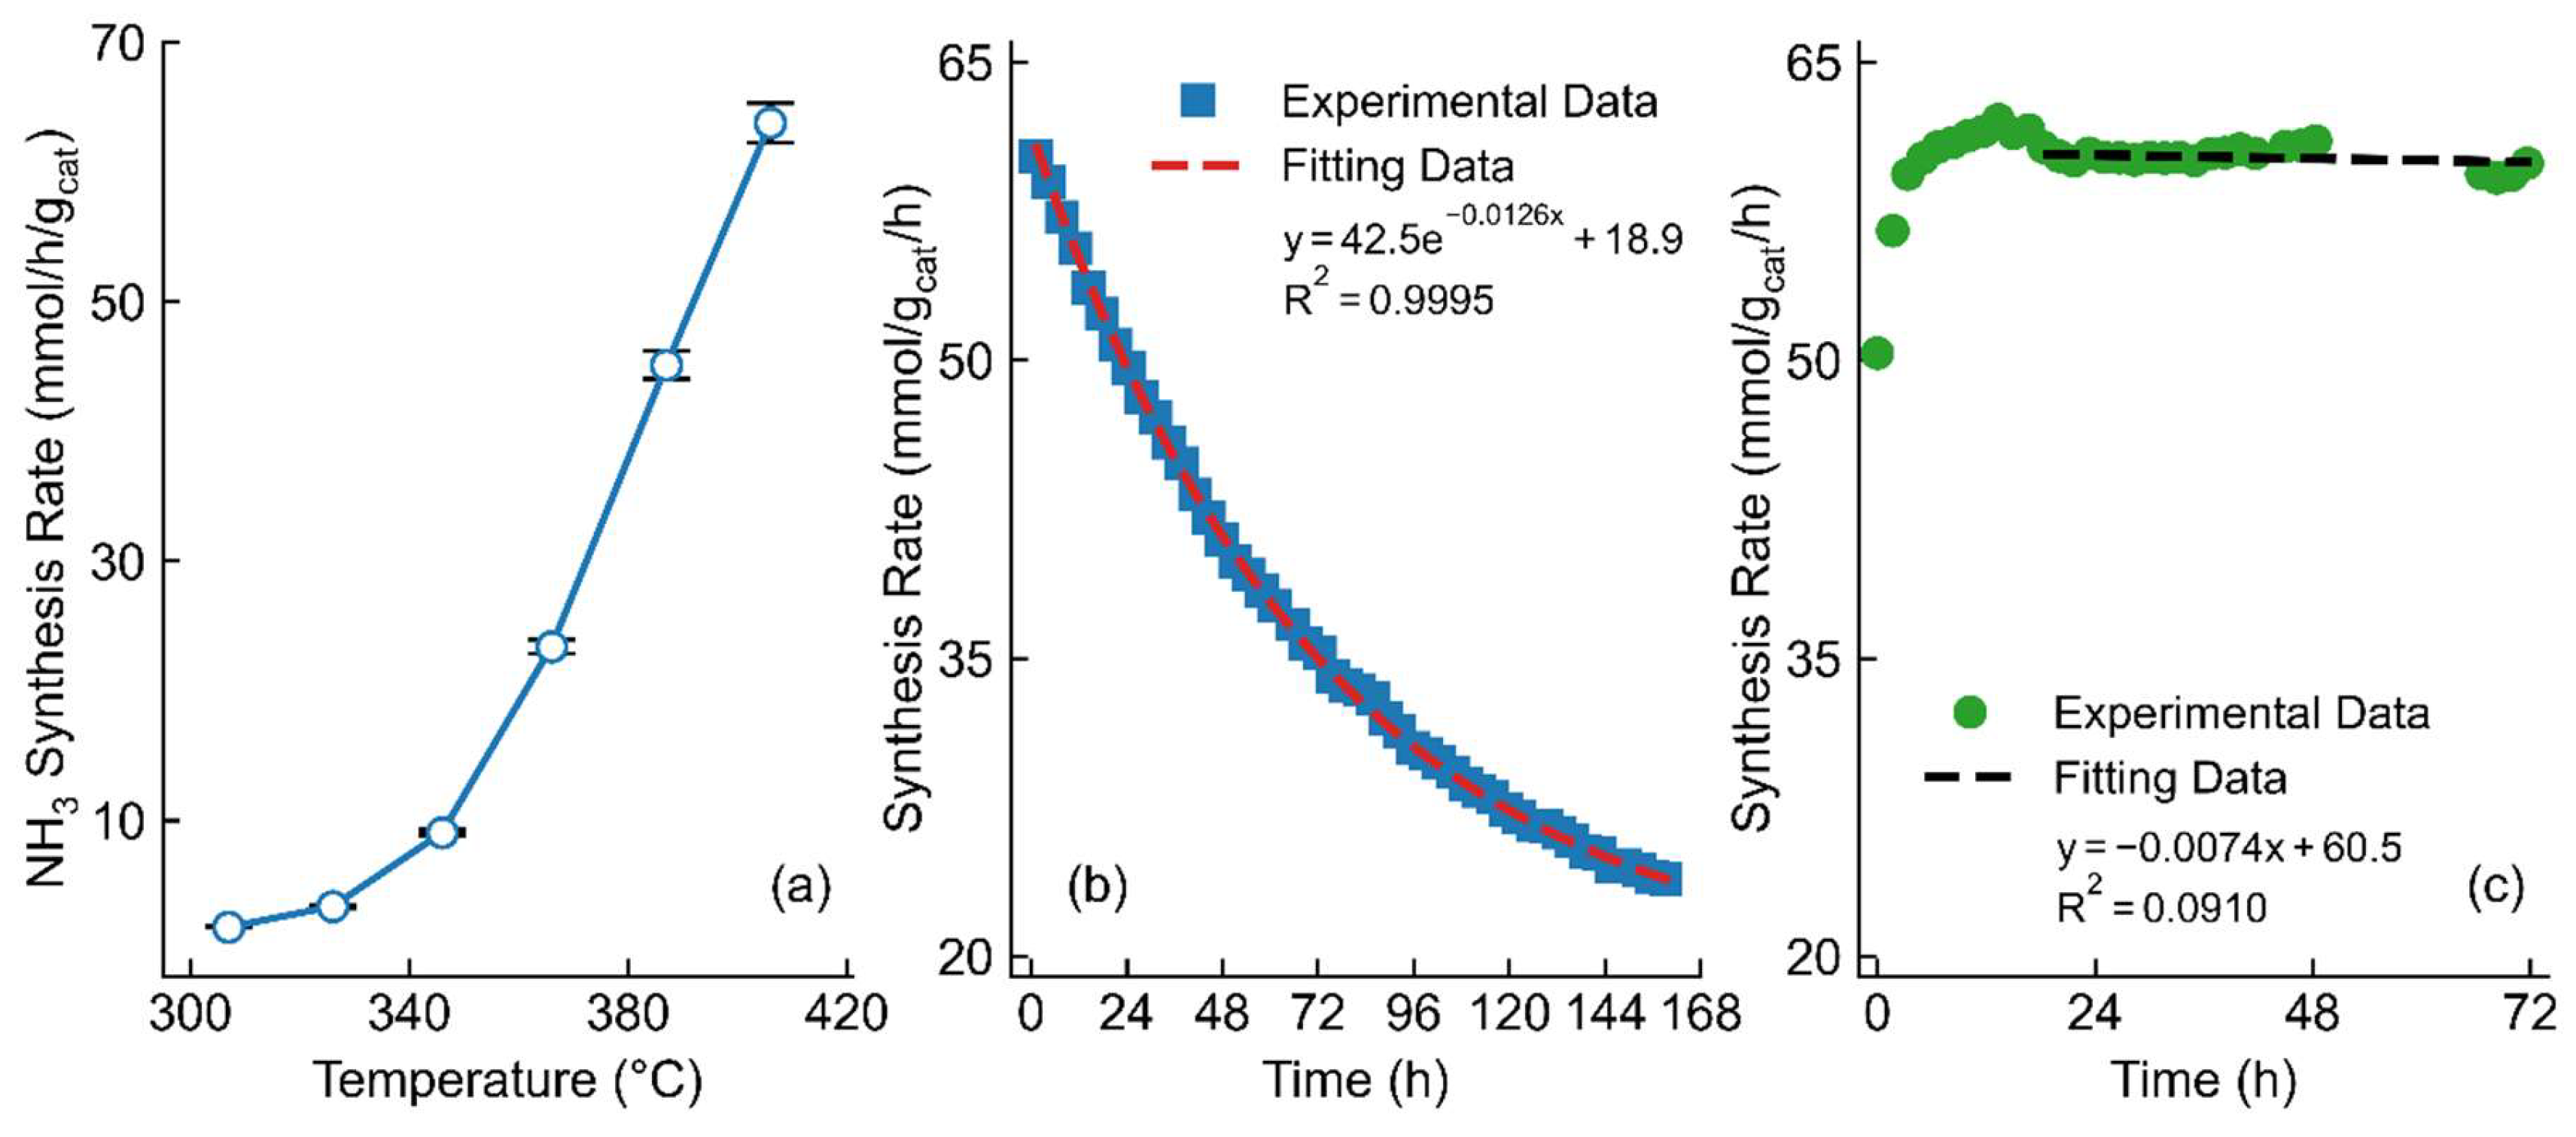
Figure 4.
CO-DRIFTS conducted on (a) Ru/PrOx, (b) Ru-Cs/PrOx, and (c) Ru-Ba-Cs/PrOx catalysts. Raw data are shown along with suggested peaks and their positions. (d) XPS analysis of the Ru 3p3/2 peak of the 1 wt.% Ru/PrOx (top), 1 wt.% Ru, 2 wt.% Cs/PrOx (middle), and 1 wt.% Ru, 3.86 wt.% Ba, 4.12 wt.% Cs/PrOx (bottom) catalysts, fitted with peak locations shown.
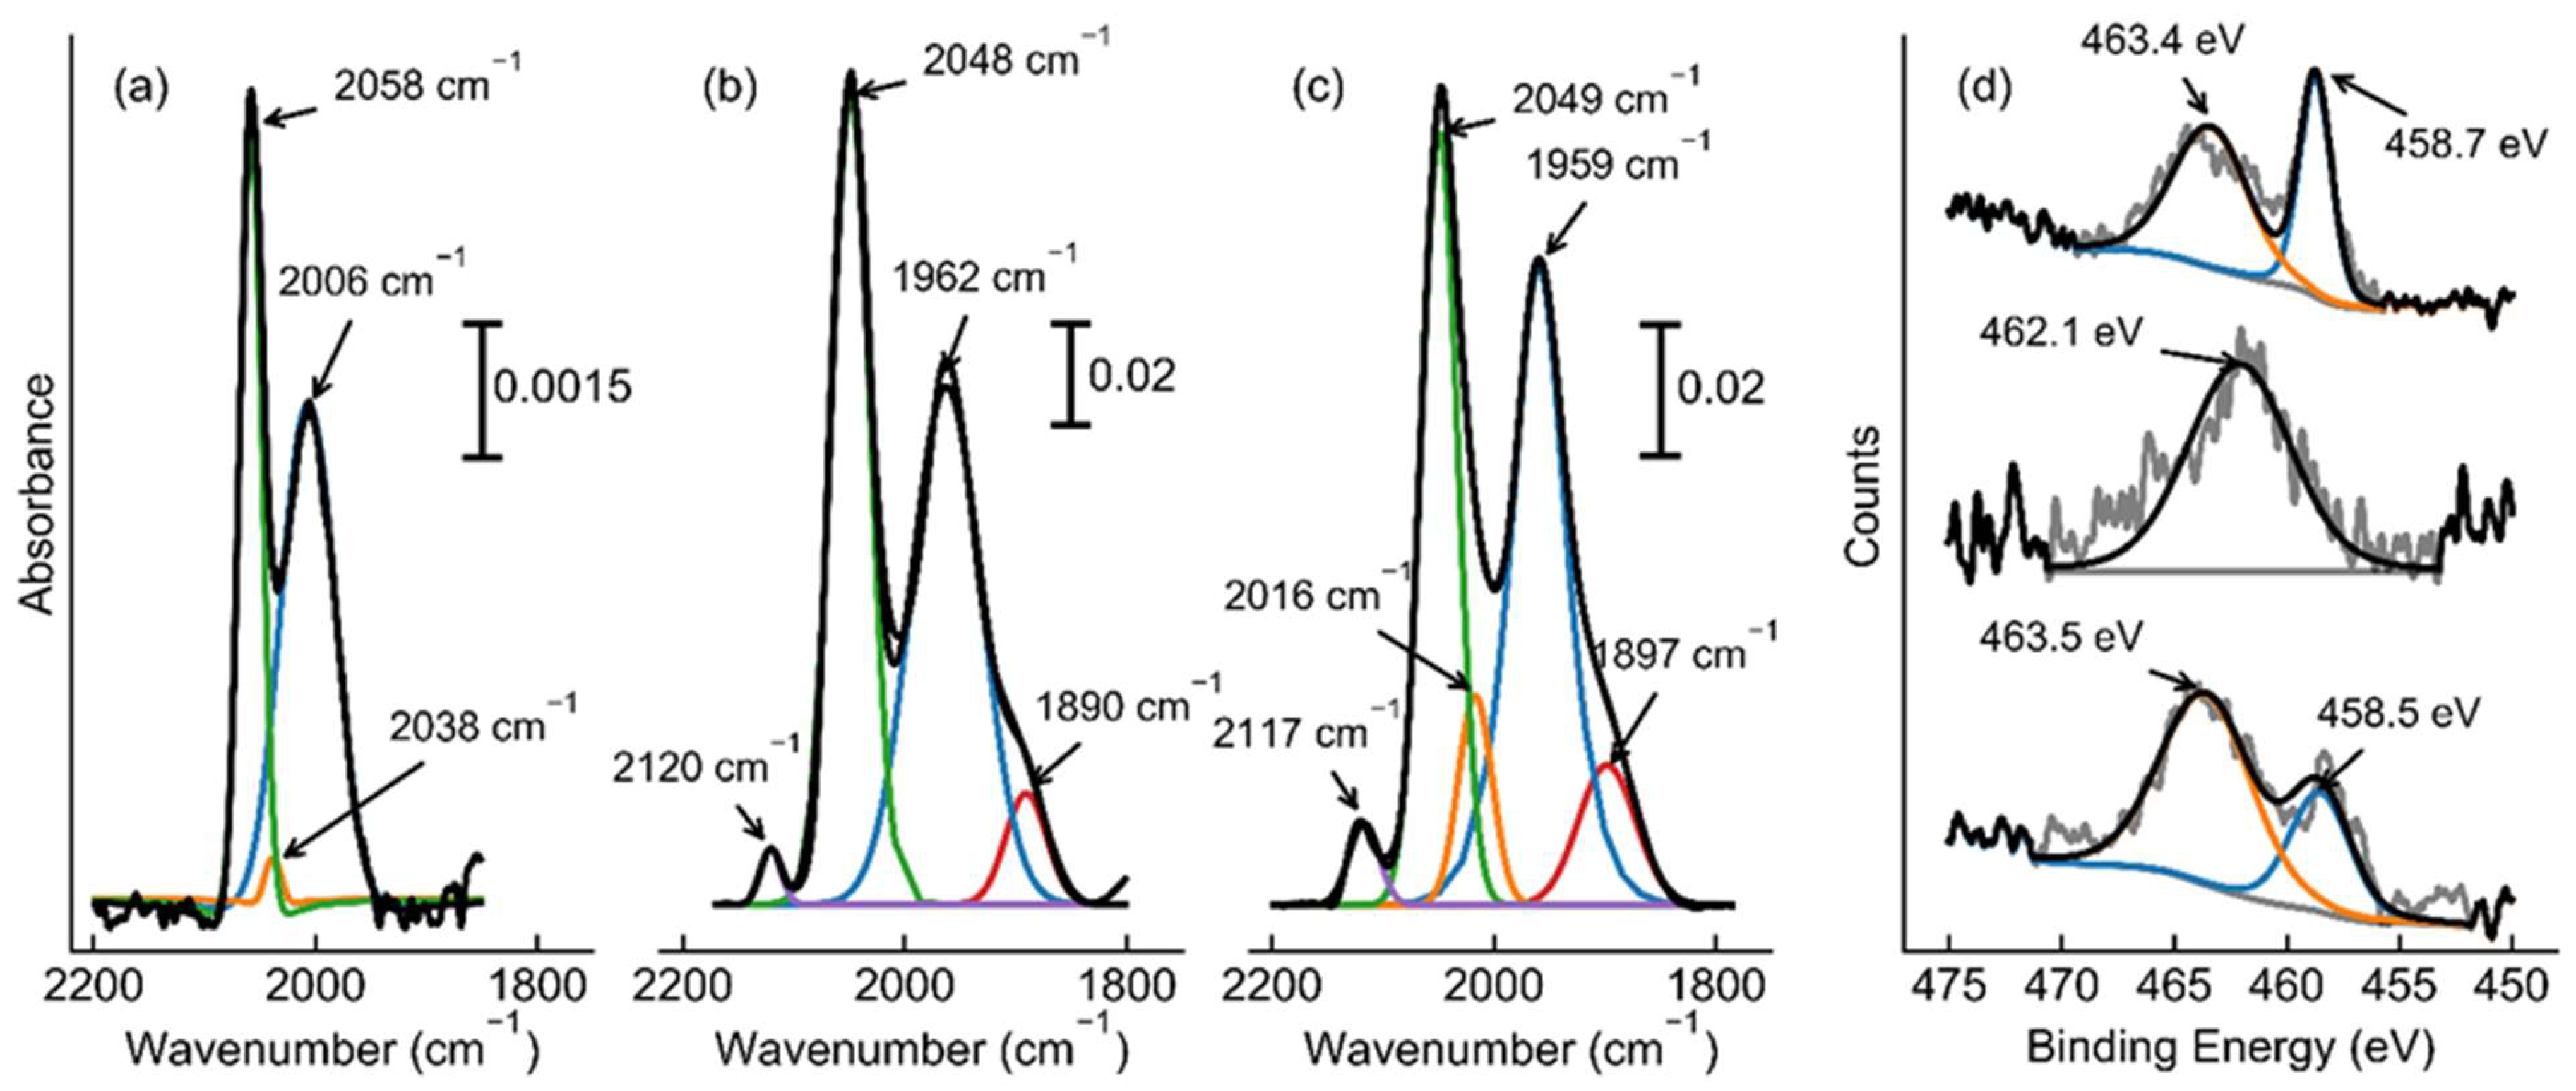
Figure 5.
Time resolved N2-DRIFTS conducted on (a) 1 wt.% Ru/PrOx, (b) 1 wt.% Ru, 2 wt.% Cs/PrOx, and (c) 1 wt.% Ru, 3.86 wt.% Ba, 4.12 wt.% Cs/PrOx catalysts. Scans taken at 0 min (blue), 2 mins (orange), 10 mins (green), 18 mins (red), 26 mins (purple) and 34 mins (brown). Approximate peak positions are shown with a dashed line and their respective peak positions shown beside. Note: spectra are shifted up with time to improve clarity.
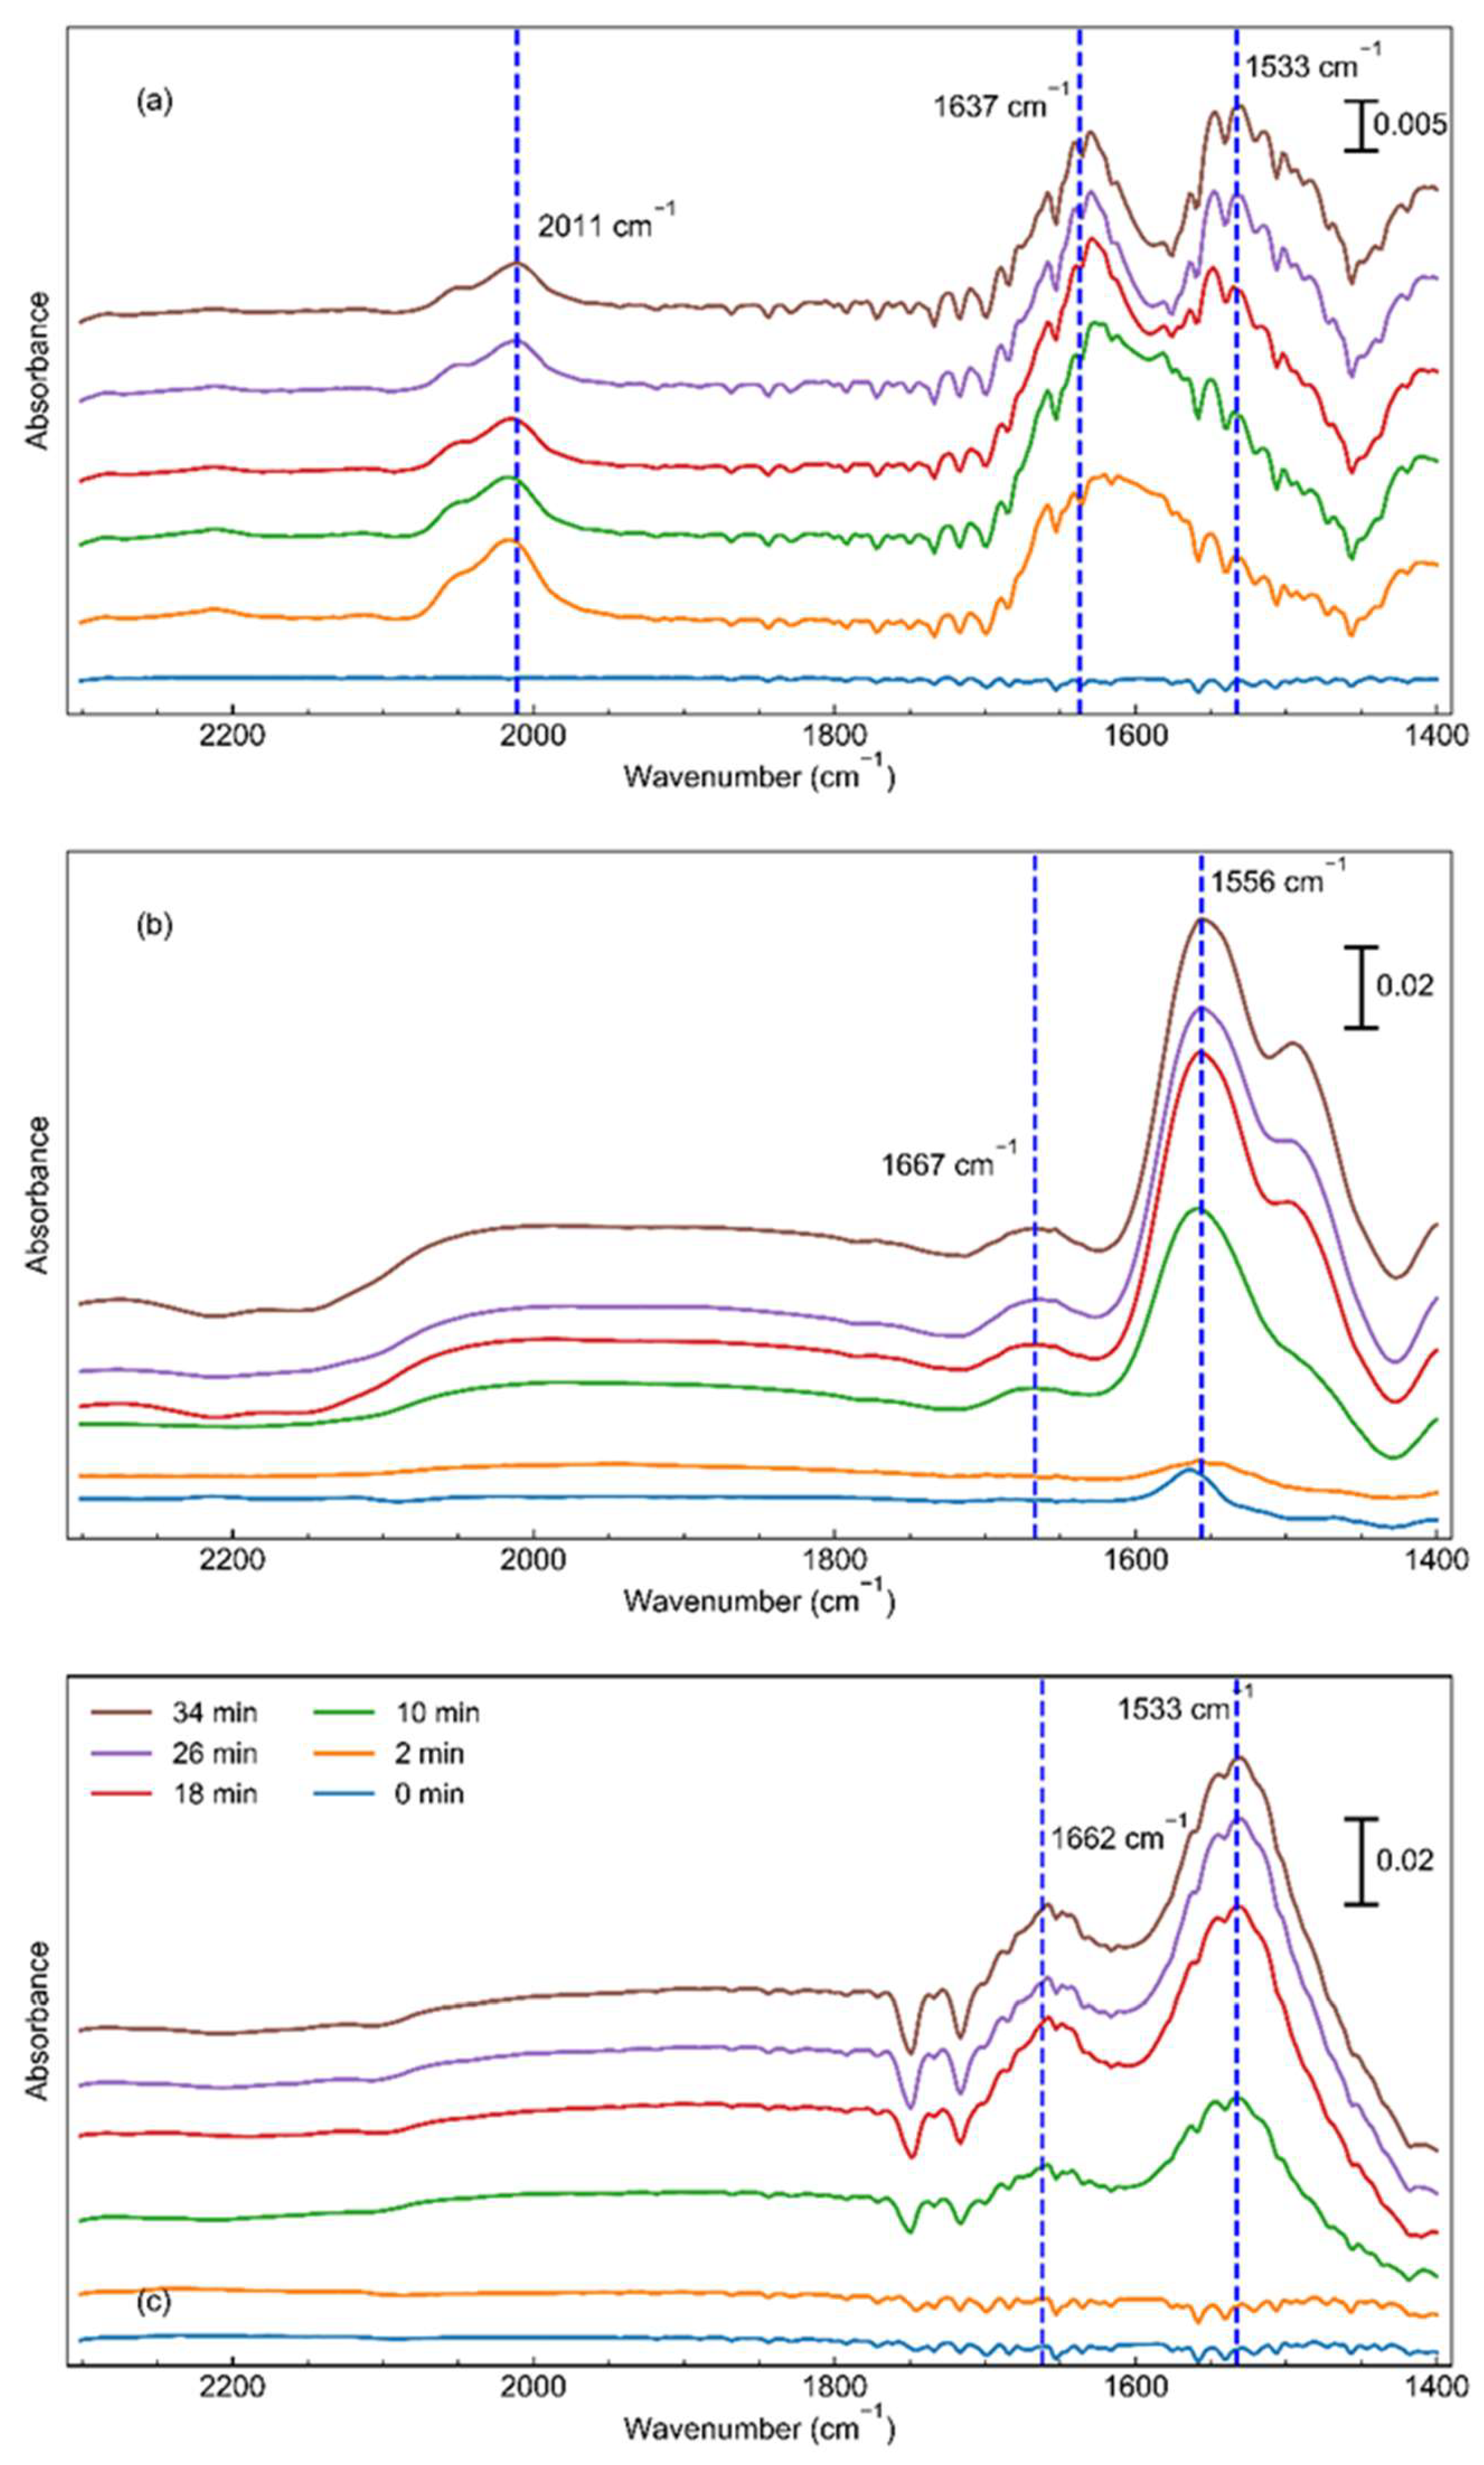
Figure 6.
A simplified schematic depicting the suggested first step of the associative process. For simplicity the ruthenium is shown as a single atom but is representative of any non-nanoparticle of ruthenium.
Figure 6.
A simplified schematic depicting the suggested first step of the associative process. For simplicity the ruthenium is shown as a single atom but is representative of any non-nanoparticle of ruthenium.
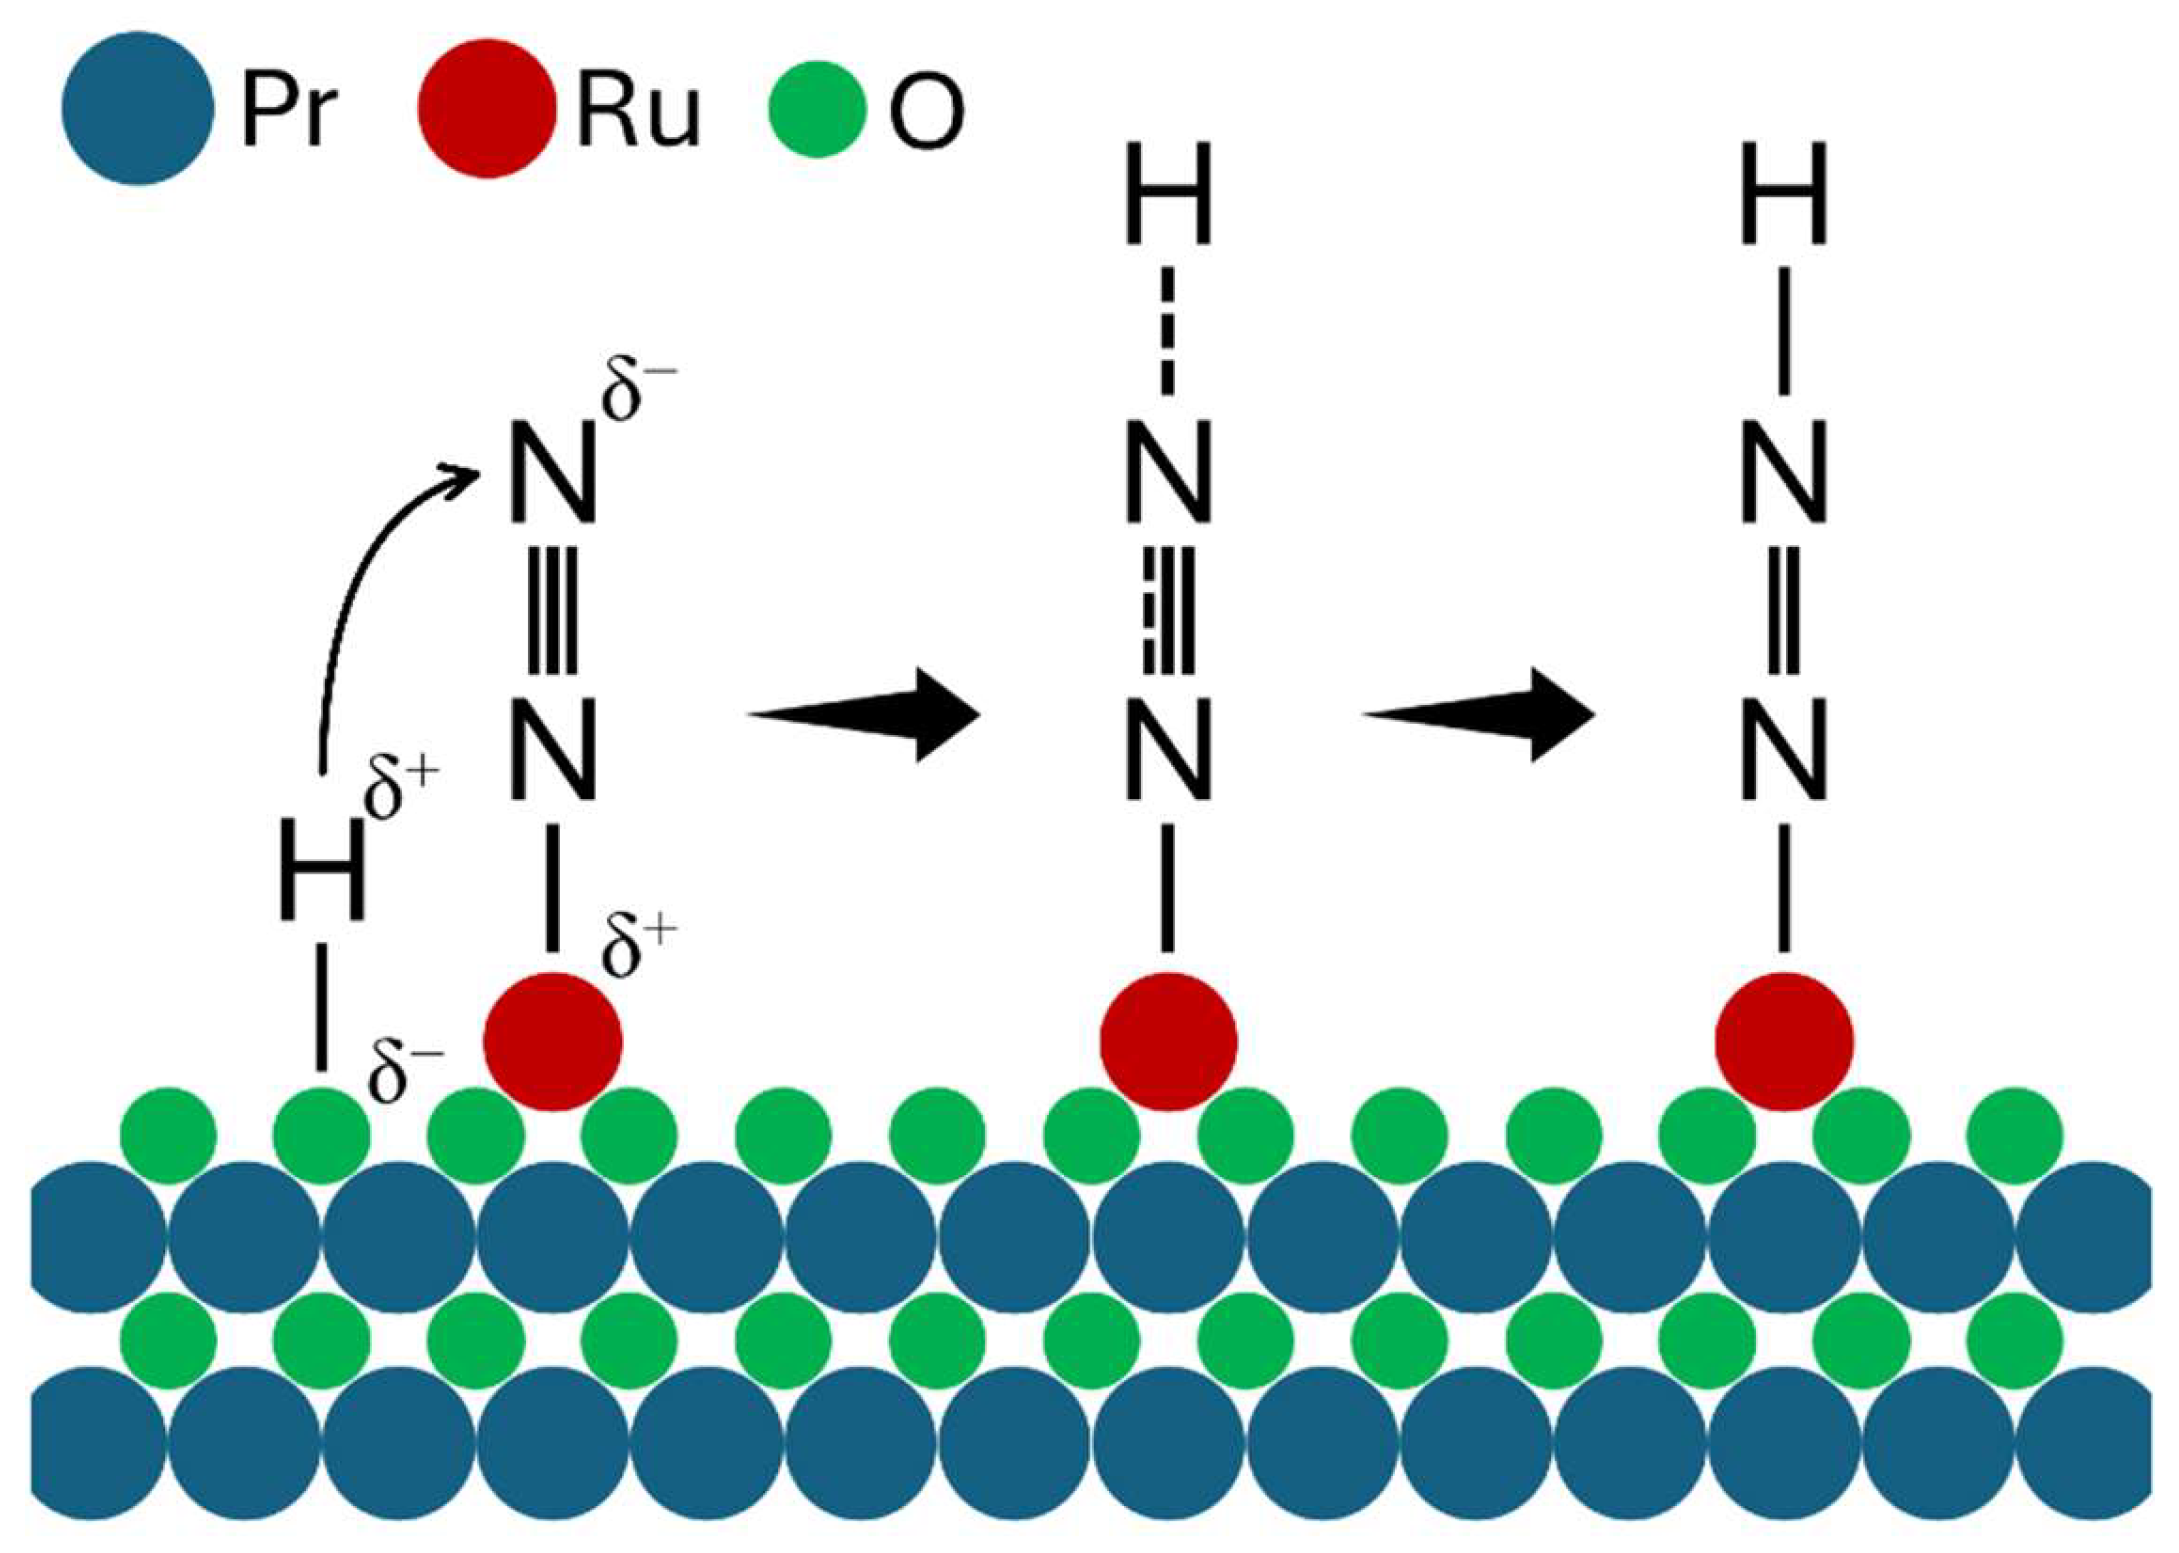

Table 1.
Properties of the unpromoted, Cs-promoted and Ba-Cs-promoted catalysts. BET surface area taken at 0.3 P/P0 level; and dispersion calculated with the assumption that the actual weight-loading of ruthenium is 0.6 wt.% (based on previous ICP-OES data). Turnover frequency (TOF) calculated at 400°C, 30 bar, 1:1 H2:N2 and 36000 mL/gcat/hr, and based on both the rate per ruthenium atom and per surface ruthenium atom. Apparent activation energies calculated based on the linear region of Arrhenius plot, with standard deviation of 1% calculated based on the average of three (n=3) runs.
| Catalyst | Dispersion (%) | Chemisorption Particle Size (nm) | BET Surface Area (m2/g) | Pore Volume (cc/g) | TOFRu (s-1) | TOFSurface Ru (s-1) | Apparent Activation Energy (kJ/mol) |
|---|---|---|---|---|---|---|---|
| 1 wt.% Ru/PrOx | ~100 | < 0.9 | 27.1 | 0.745 | 5.95 x 10⁻² | 5.95 x 10⁻² | 73.9 ± 0.7 |
| 1 wt.% Ru, 2 wt.% Cs/PrOx | 44.2 | 3.0 | 17.6 | 0.199 | 1.63 x 10⁻¹ | 3.69 x 10⁻¹ | 102.3 ± 1.0 |
| 1 wt.% Ru, 4.12 wt.% Cs, 3.86 wt.% Ba/PrOx | 29.3 | 4.6 | 18.1 | 0.361 | 3.06 x 10⁻¹ | 1.04 x 100 | 133.8 ± 1.3 |
Table 2.
Calculated reaction orders for the unpromoted, Cs promoted and Ba-Cs promoted catalyst at both 360°C and 400°C. Catalysts were tested at 30 bar, and a space velocity of 72,000 mL/gcat/hr for the reactant reaction orders, and between 45,000 and 125,000 mL/gcat/hr for the ammonia reaction order. Standard deviation for this experiment was ±0.01 based on triplicate (n=3) replication of a condition.
| Catalyst | Temperature (°C) | Pressure (bar) | Nitrogen Reaction Order |
Hydrogen Reaction Order |
Ammonia Reaction Order |
|---|---|---|---|---|---|
| 1 wt.% Ru/PrOx | 400 | 30 | 1.05 | 0.01 | -0.38 |
| 1 wt.% Ru, 2 wt.% Cs/PrOx | 400 | 30 | 1.04 | -0.25 | -0.13 |
| 1 wt.% Ru, 4.12 wt.% Cs, 3.86 wt.% Ba/PrOx | 400 | 30 | 0.82 | 0.25 | -0.59 |
| 1 wt.% Ru/PrOx | 360 | 30 | 0.39 | -0.14 | -0.49 |
| 1 wt.% Ru, 2 wt.% Cs/PrOx | 360 | 30 | 0.66 | -0.63 | -0.28 |
| 1 wt.% Ru, 4.12 wt.% Cs, 3.86 wt.% Ba/PrOx | 360 | 30 | 0.72 | -1.08 | -0.17 |
Disclaimer/Publisher’s Note: The statements, opinions and data contained in all publications are solely those of the individual author(s) and contributor(s) and not of MDPI and/or the editor(s). MDPI and/or the editor(s) disclaim responsibility for any injury to people or property resulting from any ideas, methods, instructions or products referred to in the content. |
© 2024 by the authors. Licensee MDPI, Basel, Switzerland. This article is an open access article distributed under the terms and conditions of the Creative Commons Attribution (CC BY) license (http://creativecommons.org/licenses/by/4.0/).
Copyright: This open access article is published under a Creative Commons CC BY 4.0 license, which permit the free download, distribution, and reuse, provided that the author and preprint are cited in any reuse.


