Submitted:
09 August 2024
Posted:
13 August 2024
You are already at the latest version
Abstract
Secondary microplastic (MPL) and nanoplastic (NPL) particles exhibit different physiochemical characteristics that attenuate their toxicities in different ways: some particle types being well documented (primary) while other (secondary), are more unknown. Fourier Transform Infrared Spectroscopy (FTIR), Raman, Proton Nuclear Magnetic Resonance (H-NMR), Curie Point-Gas Chromatography-Mass Spectrometry (CP-gc-MS), Induced Coupled Plasma-Mass Spectrometry (ICP-MS), Nanoparticle Tracking Analysis (NTA), Field Flow Fractionation-Multiple Angle Light Scattering (FFF-MALS), Differential Scanning Calorimetry (DSC), Thermogravimetry (TGA), Differential Mobility Particle [Sizing] (DMPS), Scanning Electron Microscopy (SEM), Transmission Electron Microscopy (TEM), and Scanning Transmission X-ray Microspectroscopy (STXM) are re-viewed as part of a suite of characterization methods for physiochemical ascertainment and distinguishment. Organizations, like the water treatment or waste management industry, and those in groups that bring awareness to this issue, which are in direct contact with the hydrosphere, can utilize these techniques in order to sense and remediate this plastic polymer pollution. The primary goal of this review paper is to highlight the extent of plastic pollution in the environment as well as introduce its effect on the biodiversity of the planet while underscoring current characterization techniques in this field of research. The secondary goal involves illustrating current and theoretical avenues in which future research needs to address and optimize MPL/NPL remediation, utilizing nanotechnology, before this sleeping giant of a problem awakens.
Keywords:
Plastics
; MPL
; NPL
; Characterization
; Pretreatment
; Spectroscopy
; Microscopy
; MPL Remediation
; LBL
1. Introduction
Understanding the significance of characterizing MPLs and NPLs begins with addressing the fact that their extent within the environment comes from their induction of larger bulk plastic pollution. Since the 1950’s, plastic production has correlated with its induction into the environment primarily into the hydrosphere [1]. Organization conventions from the UN have sought to address this issue, like MARPOL, by limiting dumping from fishing and other maritime industries. However, it is currently reported that plastic induction primarily starts with wastewater mismanagement from waterways that flow into the greater volume of the hydrosphere. It is estimated [2] that 250,000 tons of the annual induction of plastics are of the MPL type with one estimate asserting that 150 million tons are presently in the ocean. This is expected to accelerate to a total mass of 1.8 billion tons by the year 2050 (Figure 1).
Consequently, research into plastic pollution began to accelerate around this time [1] (Figure 2A) as well with MPLs and NPLs being elucidated in the later 1900s negating the notion of plastics’ ability to be hardy from degradation however this is more commonly observed in certain environments: highly aerobic or high UV exposed areas. One can infer that free radical formation, scission events, and oxidation can occur for thermoplastics in these conditions resulting in various degrees of degradation [3,4]. Aforementioned chemical events occur in tandem with physical processes for breakdown, like abrasion, leading to secondary microplastics with higher irregular surface morphology and higher amorphous content. Moreover, these factors often act as an indication of age in MPL characterization [5,6].
An elegant report [8] relayed the theoretical differences and attributes of secondary MPLs and NPLs. They behave differently to their bulk predecessors in that the former can form scaffolds and aggregates of biotic or abiotic material and ions/metal cations in the environment to a much higher degree due to a higher surface area to volume ratio (SA:V). To note, many of these cations are heavy transition metals, like Cadmium, which may pose some toxicity [9]. In the latter case, higher surface energy is often minimized by the adsorption of a heterogenous mixture of material increasing the chances of aggregation (heteroaggregation). Due to their size, NPLs possess Brownian motion and are subject to random influences from electrostatic forces. This complicates calculation and sampling to ascertain their extent as this phenomenon results in the decreased rate of sedimentation and buoyancy. Lastly, increase in light interaction (scattering) at this scale contributes to complications with resolving signals from spectroscopic characterization due to more diffuse refraction of light and nanoscale critical dimensions nearing critical DeBroglie wavelengths of notably enhanced plasmons on the surface of these materials compared to bulk material.
Due to this energetically precocious nature, primary (industrially-created) and secondary MPLs/NPLs can unfortunately introduce themselves in marine ecosystems whereby uptake, trophic transfer, and human exposure takes place. MPLs and NPLs have the preponderance to retain the numerous types of industrial additives found in their native polymer like flame retardants, pigments, plasticizers, antistatics, antiozonants, vulcanizing agents, curing agents, soaps, surfactants, biocides, metal deactivators, fillers, lubricants, foaming agents, crosslinkers, peptizers, and most notably, colorants (Hummel, 2002). A portion of these small molecules are known as persistent organic pollutants (POPs): chemicals that produce a variety of deleterious effects onto marine biota and beyond [10]. Moreover, the type of thermoplastics that MPLs and NPLs are made from influences the distribution of additives in the particles themselves and the preponderance of their ability to adsorb extraneous organic molecules for example, but not limited to: antibiotics like ciprofloxacin, sulfamethoxazole, and sulfamethazine; antihypertensives like propranolol; and antidepressants like sertraline and amitriptyline [11,12,13]. More specifically, it is theorized [14] that the rates of adsorption and interaction are influenced by the following theoretical primary intramolecular interactions (Note: this is not a completely exhaustive list as there could be more interactions that have yet to be elucidated): polyethylene (PE) having crystallinity dependent interaction with high density polyethylene (HDPE) possessing less opportunity for interaction than low density polyethylene (LDPE), polypropylene (PP) having reduced degrees of freedom due to its bulky isopropyl group (though this may vary based on syndiotactic or isotactic stereochemistry), polystyrene (PS) possessing benzyl structure with interaction from a molecular orbital of delocalized electrons, polyethylene terephthalate (PET) possessing pH dependent interactions but limitations in small molecule size due to electropositive and electronegative centers being in close proximity, and polyvinyl chloride’s (PVC) restrictions with its glassy crystallinity (Figure 2B).
Effects of these particles and their additives/adsorbents on the environment has mostly been elucidated through experimentation [15,16,17] with engineered MPLs and NPLs. Animals like filter-feeding bivalves, medaka, marine round worms, and sessile organisms have either been shown to uptake and translocate NPLs and MPLs across multiple organ systems, induce oxidative stress and genomic expression shift of receptors of high affinity, or promote invasiveness of species. Furthermore, there are models in literature that estimate the potential magnification of the POPs found in these particles through trophic transfer with one [18] possessing reasonable predictability in 30 out of 35 of their species subjects in the Arctic environment. In terms of human beings, one pathway of exposure, gastrointestinal (GI), is thought [19] to be size dependent with the mechanisms in the gut elucidated to be through Peyer’s patches and paracellular uptake of microfold (M) cells. Retention time would vary between charge nature of these particles though uptake through dermal contact and pulmonary uptake is theorized as a pathway of inundation potentially complicating kinetics. Lastly, one such paper [20] that came out recently became the first empirical evidence of plastic contamination of PP, PS, PE, and PET in the bloodstream of human beings. 80% of the 22 healthy volunteers that donated their blood to the study possessed, on average, 1.6 µg/mL of plastics leading to the conjecture that particles in the lower microscale and upper nanoscale range are translocating into the central compartment of human beings (Figure 3). Moreover, it appears that MPLs exhibit a level of lethality with a report [21] indicating a significant 5-fold increase in the likelihood of exhibiting an end-point cardiovascular event (myocardial infarction/stroke) for patients who possessed MPLs within their atherosclerotic carotid arterial plaques versus patients whose plaques were absent of MPLs!
With the prevalence of plastics virtually around and within most organisms, the importance of characterizing these materials and what they constitute is prime. When researchers possess more detailed information, proposals for solutions to detect, remove, and remediate these materials become more accurate. Sophisticated techniques that look at spectroscopy, morphology, and concentration help elucidate toxicants and potential byproducts, or resulting off-target effects, that could result from naïve reaction schemes. Like any method, there are limitations in determining what may confound and influence multiple aspects of the spectral nature of these particles. Advanced computational work may allow for adequate levels of detection in order to facilitate complete ascertainment. Thusly, a stronger foundation for effective remediation can be established.
2. Characterization
2.1. Characterization Overview (Introduction)
As mentioned in the previous section, analytical techniques for characterizing microplastics and nanoplastics is an effective methodology for ascertaining their chemical properties and their accumulated changes. Resultant data gives remediation and detection methods a stronger basis into their function, efficacy, and safety. The following sections will cover a numerous collection of techniques that identify, quantify, and sample these particles for that very purpose: Fourier-transform infrared spectroscopy (FTIR), Raman, hydrogen-nuclear magnetic resonance (H-NMR), induced coupled plasma-mass spectrometry (ICP-MS), field flow fractionalization-multiple angle light scattering (FFF-MALS), Curie-point gas chromatography mass spectrometry (CP-gc-MS), differential mobility particle [Sizing] (DMPS), scanning transmission x-ray microspectroscopy (STXM), fluorescence microscopy, differential scanning calorimetry, (DSC), thermogravimetry (TGA), nanoparticle tracking analysis (NTA), dynamic light scattering (DLS), and turbidometry. The section will also cover the important differences from the native plastic data to these particles in terms of weathering, oxidation, additive/adsorbent presence, color, adsorption of biotic and abiotic material (eco-corona formation) and so on. Moreover, the section will conclude with newer innovations in sampling methodology for MPLs and NPLs.
2.2. Fourier-Transform Infrared Spectroscopy
FTIR detects the changes in the dipolar moment of a bond in a molecule. Some of these bonds possess different magnitudes of frequency based on the size differences of the atoms, their electronegativity, and their interaction with other neighboring molecular bonds (i.e. dipolar induction). In addition, multiple modes or harmonics are not only seen electronically but in the degrees of freedom in which these bonds can bend, stretch, rotate, and so on. As the FTIR interferometer produces a signal, it is the resultant of the different modes that a particle bond can make that result in a peak with relative degrees of broadness when converted to the frequency domain which typically range from 4,000 to 1,000 inverse centimeters. With good resolution, one can then ascertain bond type and the degree of the bond. In complex samples, ascertainment becomes increasingly difficult which, with advanced computational work, might help resolve what specific bonds are in a signal. Instrumental modes like attenuated total reflectance (ATR) can work with dry samples using the resultant reflection of an incident interferometer modified-infrared beam through a crystal. The sample sits on the crystal by which the light reflects immediately off of the sample at the crystal/sample interface into a detector.
In context to MPLs and NPLs, a library of their native plastic polymers are available in public databases giving researchers access to compare and score the similarities of the spectra from environmental samples to their bulk native spectra [6] (Figure 4A,B). Specifically, for MPLs and NPLs, we can see evidence of environmental weathering for these PE, PP, and PET MPLs with considerable noise and characteristic peak broadening in their spectra compared to native spectra. The research group also noted a change in the modality of the spectra of PE MPLs where divergence increases (bimodality of peak) as a function of increased amorphous character in the sample (lowest to highest spectrum). Interestingly, results [22] (Figure 4C) indicated the degree of intensity of noise obscure characteristic peaks in PET MPLs as a function of increased surface roughness from simulated mechanical abrasion. Moreover, various types of sandpapers with increased degrees of roughness were used as the treatment. Extensive weathering can also be seen here in a similar study [23] where researchers sampled terrestrial environments from the city of Dongguan, in China, resulting in the discovery of weathered cellulose, PE, PP, and PS MPLs from atmospheric deposition similarly to a Parisian report [24] they closely replicated. Due to the shape also being in fibrous form, the team concluded that induction was from the textile industry (Figure 4D,E).
In terms of oxidation, prolonged exposure can exhibit degrees of oxidation in MPLs and NPLs where the introduction of bond stretches attributable to hydroxyl or carbonyl groups begin to form. Carbonyl inclusion of this group is reported [25] in more detail comparing their intensities between timepoints from 24 to 456 hours. Increasing intensity from the inclusion of carbonyl, hydroxyl, and carboxylate functional groups is notable (Figure 5A). In addition, in an industrial paper’s example [26], the group induced weathering over an 1,138-hour period and studied similar effects of oxidation in FTIR on meso/microplastic particles from HDPE, LDPE, PP, and PS. As is expected, the later timeline from 442 to 1,138 hours possessed the most extensive oxidation with PS showing extensive oxidation in comparison with PP, and PE (Figure 5B). This makes since, logically, since aromatic compounds tend to be more photoactive due to presence of cyclic pi resonance molecular orbitals that absorb UV radiation well. In terms of color, although the samples are mesoplastics, the lower end of the wave number domain for the red mesoplastic particle possesses an intensity that is raised quite considerably compared to the rest of its spectrum and the green spectrum (Figure 5C). This might be explained due to red pigment possessing immediate absorbance around red wavelengths closer to the infrared spectrum of EM radiation whereas the green pigment would, in theory, not have as strong of an intensity of absorbance breaching the infrared spectrum. Presumably, the closer the particular wavelength of a given pigment is to infrared for FTIR, the more uncharacteristic absorption would be seen, theoretically, though absorption phenomena varies.
2.3. Raman Spectroscopy
Raman spectroscopy is governed by the polarizability of atoms’ electronic orbital structure resulting in a magnitude or shift of EM emission from EM irradiation. This generates a unique spectrum that indicates characteristic bond types of a sampled material. Anti-Stokes, part of inelastic scattering, subtracted from the energy of incident light, gives us precise information on the bond type. This technique possesses remarkable spatial resolution in comparison to FTIR (about 10 to 20-fold higher) benefiting characterization in the MPL and NPL regime (Nava et al., 2021). Vibrational modes, similar to FTIR, give rise to a curve around a characteristic wave number that indicates the degrees of freedom the bond structure possesses. Group theory dictates the modes expected from this spectroscopy to be "3N-6" (above linear) or "3N-5" (linear) with N being the number of atoms. In terms of nanomaterials, forbidden modes are exhibited which complicates the resolution of the spectrum especially at the edges of irregularly shaped-nanomaterials (Guo et al., 2018). Surface phonon modes, adsorption of the solvent, and surface functionalization from oxidation alter the characteristic wave number and resultant absorbance peaks making them less resolute, as well. In terms of the probability of receiving Anti-Stokes scattering for detection it is primarily dependent on Maxwell-Boltzmann theory of electron distribution at room temperature which leads to a greater number of electrons on higher vibrational modes than the ground state which, when irradiated with photons, results in the emission of photons with higher energy as electrons return to ground state producing a negative shift with lower wavelength photons. Generally, the inverse reciprocal of the energy differences of the incident photon wavelength and the Anti-Stokes photon is proportional to and part of the resultant Raman spectrum. In terms of the instrumental parameters, excitation wavelength (lower wavelength lasers producing greater intensity), sample acquisition rates (scans per second), and sampling time help maximize resolution in spectrum with different trade-offs of time, sample fluorescence, and so on. Optimizing these parameters [27] may be of benefit to researchers who test heterogeneous materials like MPLs and NPLs perhaps with a Design-of-Experiments (DoE) that can build a preset condition for material or additive/adsorbent nature. Specific modes, like “Raman tweezers”, improve upon this even more so which will be explained shortly.
Similarly, to FTIR, Raman online spectral databases exist for plastic polymers. Pulled from "PublicSpectra" [28], specifically, are the typical Raman spectra from PE, PP, PS, PET, PVC, and Nylon-6,6 (Figure 6). The spectra share some similarities between Raman where you can find the CH2/CH3 stretches and bends. Single bond C-O, C-C, and phenolic-H is seen in more detail than FTIR which shows the importance of this technique as a vital complimentary identification technique. A report from New Zealand showcased the significance of weathering via Raman as seen in (Figure 6C) [29]. Peak comparison indicates a slight decrease in intensity with a slight increase in uncharacteristic noise. Unfortunately, the article dictates the size of MPLs measured were from 2 to 5 mm indicating that they're in the far upper range of MPLs (similarity to bulk is higher which may not be indicative of effects in the MPL/NPL size regime). This may also explain why the spectra have changed only slightly compared to native spectra. In comparison to the next paper's example [22], more dramatic changes are seen (Figure 6D) where the range of intensity between certain wave numbers is severely diminished, the "width" or uncertainty of their peaks is increased, and the heightened uncharacteristic noise is more severe. This indicates difficulty in resolution possibly due to physiochemical forces in environmental weathering. Surface roughness, or the proportion of increasing amorphous character, may be to blame based on reports from FTIR with the rationale of it being another interferometry-based spectroscopy method with similar signal processing. In terms of NPLs, a report [30] using the "Raman Tweezers" method sampled 6 types of MPLs and NPLs: PET, PVC, PP, PE, PMMA, and Nylon-6,6 (Figure 6E). This method uses the focal point of EM radiation to confine the particles singularly. For MPLs, greater resolution and less noise was exhibited (PET, PVC, PP, and PE) however for NPLs, significant increases in noise was exhibited in comparison. Interestingly (Figure 6F), the mode is able to determine the number of particles, linearly, based on the magnitude of the intensity of the characteristic peaks from the samples as well as distinguish between a particle in the nanoregime versus the microscale regime which may give valuable insight into investigating the ability for Raman to quantify or approximate the particle concentration of MPLs and NPLs and perhaps other materials in this size regime.
With respect to biotic samples components, one paper [31] incubated PS NPLs in environmentally-derived water to look for changes in native spectra. Their findings (Figure 7A) showed a significant decrease in characteristic peaks from the PS with a heightened increase in functional groups owing to proteins from a biotic "eco-corona". This underscores the importance of sample pretreatment and the push for characterization techniques that can identify MPLs and NPLs in situ whilst elucidating biotic signals that may be vital for signal processing of MPL and NPL characterization. With respect to color (Portable Raman Microscopy for Identification of Microplastics), polyethylene mesoplastics (Figure 7B) that were sampled from 200 µm towing net stations were found to have color dependent noise increase in their spectra which, while being uncharacteristic of MPLs and NPLs, still elucidates the fluorescence effect of pigments.
In regard to the effect of oxidation seen in Raman, one such research report [32] (Figure 7C) simulated weathering on PE MPLs which resulted in total occlusion of the prominent CH2 peak its native spectra possesses. Furthermore (Figure 7D), it was also found that a steady increase in the characteristic peaks of a variety of carbonyl, ether, or ester functional groups were introduced by free radical oxidation.
2.4. Proton Nuclear Magnetic Resonance Spectroscopy (H-NMR)
H-NMR is most beneficial for single compound analysis but its use can extend to polymers and their additives giving researchers more information into the makeup of their molecular structure. The method detects the induced magnetic alignment of hydrogen nuclei and resulting magnetic coupling of nearby hydrogen nuclei. The magnetic dipole moments flip its spin direction aligning with an applied magnetic field. From this, we can determine the number of hydrogen atoms are on a constituent "branch" of a molecule and determine distance from the induction of their spin-coupled "neighbors". The multiplicity of this signal indicates the number of neighbors including the original center of induction (singlet, doublet, triplet, and so on). The chemical shift typically denotes the strength of electromagnetically differences in the local magnetic field (alkyl hydrogen possessing lower shifts and then carboxylic). This can be explained by the strength and direction of the resultant electric dipole in a given molecule or dielectric environment influencing the strength of the shift (Figure 8A) [34].
In terms of MPLs and NPLs, one report [35] was able to detect engineered PS, PET and LDPE MPLs denoting couplings and shifts present in bulk native spectra. Only slight changes in shifts were recorded but this may not give enough information into what real environmental samples would look like though what should be underscored in this paper is that NMR is valuable in its size-independent nature of its characterization. As mentioned earlier, good characterization of MPLs and especially NPLs needs special modes of operation. Interestingly, one report [36] may help alleviate that need. The report (Figure 8B) tested the existence of PE and PS MPLs in nature through NMR but in addition was able to identify specific oxidated fragments or chains in the molecule. This may turn out to be a facile method of determine the exact identification of oxidized species which could be vital for later testing or processing rather than the total identity. At the very least, it can contribute to the explanation to why the nature of these particles is difficult to determine with absolute precision after oxidation.
2.5. Pyrolysis: Curie Point-Gas Chromatography-Mass Spectrometry and Induced Coupled Plasma-Mass Spectrometry
Curie Point Pyrolysis (CP-gc-MS) is an advanced technique that identifies samples with high discrepancy. The sample is induced with high thermal energy up to molecular breakdown, also known as thermochemolysis, via a ferromagnetic radiofrequency conductor. The sample housing is typically made out of a glass capillary with which carrier gas flows over the sample picking up thermally-degraded products for the measurement of unique retention times which measure the concentration/weight of a substance. Induced coupled plasma-mass spectrometry works similarly however the instrumentation atomizes the sample for higher discrepancy. However, both methods, from a sensitivity standpoint, seem comparable aside from their both being pyrolysis techniques [40].
An interesting report [37] from the Hudson Bay was able to characterizes the presence of MPLs from fish sampled directly from the marine environment. The paper (Figure 8C) elucidated a 95% recovery efficiency for the treatment of black (spiked Herring) biotic samples before attempting to measure their treatment group from the bay. It was discovered that the Sprat samples possessed a mean concentration of 3, 6, and 7 µg indicating potent biotic uptake of MPLs, and perhaps, NPLs. A paper using the same technique [20] implemented, previously mentioned before in the Introduction, measured the concentration of plastic particles in the blood of 22 healthy volunteers. Their implementation followed the method of the highly-sensitive “double shot” mode capable of the thermochemolysis of specific groups of plastics rather than all at one instance. Moreover, with different sample types, a paper [38] (Figure 8D) testing plant tissue, comparing both methods, elucidated the presence of PS and PMMA NPLs showcasing uptake in every anatomical region of the plant sample over time. Recovery efficiency was comparable for both indicating evidence for a possible alternate avenue in which trophic transfer of NPLs could take place. In terms of improving upon the technique, one report [39] (Figure 8E) used gold-gelatin core-shell nanoparticles with carboxylic functionalization to increase the sensitivity of ICP-MS down to a single particle discrepancy at a lower limit approximately equal to 800,000 NPL particles per liter.
2.6. Miscellaneous Identification, Isolation, and Quantification Techniques
This section will cover other techniques due to their limited presence in the literature compared to the aforementioned techniques. These techniques have exciting applications across the board with some possessing more general application than others.
In context to MPLs and NPLs, counting and weighing them is an obvious challenge one must undertake before further experimentation begins. Relatively facile methods, like Dynamic Light Scattering (DLS) can, with adequate standardization, reveal the concentration and size distribution of these particles. Essentially, the measurement is estimated from the spacing measured from scattered light’s constructive or destructive interference into the sensor of the instrument. This gives a sense on the average characteristic dimension of colloids in a dynamic system undergoing Brownian motion [41,42]. In context to MPL characterization, researchers [43] (Figure 9A) have used this methods to quantify the ability of their systems to remediate and remove them. More specifically, the Magnetic Polyoxometalate-Supported Ionic Liquid Phases (magPOM-SILPs) estimated a 90% recovery of MPLs in the system. Moreover, a similar paper [44] (Figure 9B) measured 98% efficiency with the technique utilizing their crosslinked polyethylenimide-celluose fibers “PEI@CE”. Simpler than DLS, turbidometry utilizes the opacity of a colloid as measurement of concentration for nanoparticles. One such study [45] (Figure 9C) implemented a turbidometer to measure a 98.6% removal efficiency rate for MPLs of varying concentrations based on electrocoagulation from real wastewater samples in pH range of 4 (and up 7 in other treatments). A method like this reduces “workup” necessary for heterogeneous backgrounds. Moreover, two tangential reports measured a 99.4% (4 to 5 orders of magnitude less than control wastewater sample) and 95% (down from a concentration of 250 ppm) efficiency of clearing MPLs from their systems (passive inorganic metal-based coagulant and electrospun tubular nanofibers) with turbidometry assessment as well [46,47]. NTA is a similar technique to DLS in that it measure the hydrodynamic diameter of particles in a colloidal suspension although algorithms, software, and instrumentation seem to differ (presumably) across companies with different proprietary makeups (Nanoparticle Tracking Analysis NTA | Malvern Panalytical). Nevertheless, it offers itself as a noteworthy tool for characterization. One paper [48] (Figure 9D) implementing this technique wanted to test their hypothesis that NPLs can be formed during the degradation of disposable PS coffee cup lids. The analysis technique, having a boundary of 30 to 2000 nm, found an increase of .32 to 1.26 x 10⁸ particles/mL evolved with UV radiation compared to the control (.04 to .41 x 108 particles/mL) at day 14 and day 56.
Field flow fractionalization-multiple angle light scattering (FFF-MALS) is a newer method that quantifies and characterizes particles of many different sizes using electric, magnetic, thermal, centrifugal, or so on to separate particles based on size, electromagnetic properties, and etc. Mass transport is the main phenomenon that dictates how the instrument partitions these particles with a channel decorated with pores or helical ribbon-like gaps of different diameters or widths. In context to MPLs and NPLs, there isn’t much literary presence but it may serve as a valuable technique due to certain modes and fields operating withing discrete ranges for particle size (Figure 9E) [49,50].
Thermogravimetry and Differential Scanning Calorimetry are newer techniques in the application of identifying MPLs. Coupled together, they both work to measure the purity of samples based on phase transitions from applied thermal energy. The former assesses purity through change in mass over time and temperature whilst the latter uses a reference or pure sample to ascertain percentage of purity by comparing differences in measured heat flow in the experimental sample. One study [51] (Figure 9F) used these techniques to determine if PE, PP, PVC, polyamide (PA), polyester (PES), PET, and polyurethane (PU) samples could be measured. However, only (weight per volume) concentration were determined for PE and PP from wastewater samples. Interestingly, it was determined that 34% and 17% of the solid extracted from their sampled consisted of PE, solely illustrating the power of this technique to identify targeted materials in heterogeneous samples. Moreover, a similar report [52] claims to perfect these applications for MPLs by the introduction of multiple heat-up steps that allow more concrete signals to manifest due to the particles semi-crystalline nature. The initial heat-up steps purpose helps account for sample impurities increasing SNR. A similar apparatus using applied thermal energy may be beneficial in measuring the atmospheric content of MPLs and NPLs: Differential Mobility Particle Sizer (DMPS). The instrumentation of DPMS works, in terms of experimental samples, by vaporizing the sample material in a furnace whereby carrier gas flows into cooler regions of the apparatus by which specific temperatures are set to record induced homogenous nucleation. The resultant is fed into a condenser and cooled down with water. Next, the aerosol is combined with compressed air and charged via X-ray irradiation where the aerosol sample is charged. The analyzer detects the details of the charged particles to determine particle concentration, diameter, and particle type. After these standards are made, it may be possible to inject atmospheric samples into the machine to compare. Outlined in [53], the group was able to measure PET, LDPE, and PP NPLs from about 1 to 100 nm in diameter from a number concentration range that appears to be from 100 particles to 100 million per cubic centimeter. In terms of instrumental parameters. Note, setting temperature, flow rate, and material amount changes the distribution (higher temperature/flow rate/sample mass “pushing” distribution rightward) created with the analyzer so any comparative replications must take into account the parameters outlined.
2.7. Morphological Characterization
Visual confirmation is an importance aspect of characterizing any material. It is no less important for MPLs and NPLs by which differentiation from other materials, extensive oxidation, surface roughness from abrasion and weathering, cracking, and so on can be seen for their samples. Pairing this with other identification techniques helps shape our expectations and fortifies interpretation. There are only a few notable techniques in literature used to accomplish this task as follows: scanning electron microscopy (SEM), transmission electron microscopy (TEM), atomic force microscopy (AFM), scanning transmission X-ray microspectroscopy (STXM), and Fluorescence Microscopy.
For SEM, a beam of electrons inundate a sample’s surface and scatter into a detector resulting in an image of a particle under investigation. In the case of MPLs and NPLs, it gives valuable information into the structure of the particles that indicate aging, oxidation, and polymer type (based on overall morphology). This is typically seen by cracks, holes, groves, and discolorations. It also aids characterization, either pretreated or as is, from their native environments that can be cataloged for comparison with other particles sampled in literature. Paired with previous characterization techniques, it gives a more holistic characterization with adequate sample preparation (Figure 10A) [5]. For TEM, the method works similarly in that it bombards the sample with electrons that transmit and detect them in high resolution (atomic) although it is typically used in toxicological models with MPLs and NPLs rather than alone. With TEM, low electrodense materials tend to have a harder time imaging compared with SEM and need to be stained. This can lengthen sample preparation or interfere with obtaining more representative images depending on the staining agent. The staining media is typically made up of heavy metals which can even interfere with the chemical properties of the sample, as well. For AFM, the probe equipped in the sample can map out a topological-like image that gives great resolution in 3D for MPLs and NPLs however, the sample needs to be dry firstly [55,42]. For STXM, the method scans the sample with focused x-ray beams that generate an image based off of the intensity of x-ray flux after transmission. Spectra can be formed in which information on bond type is revealed by a particular coordinate. One example [54] employed this technique to verify PET nanoparticles (Figure 10B) due to the spectrum possessing carbonyl and pi-star carbon-carbon double bonds. In fluorescence microscopy, a sample is inundated with fluorescent dyes or fluorophores that are associated with thermoplastic particles and provide a greater detail of contrast in heterogenous samples. Interestingly, a paper [56] employed the usage of Nile Red in an experimentally-derived heterogenous matrix of sand and other environmental samples of LDPE, PP, and expanded polystyrene (EPS) NPLs (Figure 10C). Their findings indicated highly distinct structures attributed to the NPLs with further studies into other thermoplastics with varying results. In addition, this method can distinguish electronegativity of polymers through solvatochromism [57] (shift of fluorescence).
2.8. Isolation and Sample Pretreatment
In context to isolation, for terrestrial sources, the issue of losing particles that skew results isn’t as big of a problem as it is in oceanic or maritime sampling whereby studies that employ netting to capture microplastics have a lower cutoff with one estimate being about 150 to 300 µm [27]. This confounds comparison of studies who measure MPL particle sizes at lower regimes in the microscale to the larger scale reports. If oceanic studies are to continue, physical capture by means of the marine biota or sediment, should predominate as an isolation technique. As for their preparation, the literature uses a wide variety of acids, bases, oxidative agents, and enzymes to purge biotic or abiotic material that could confound characterization. Interestingly, it [58] was found that the use of nitric acid was too harsh and degraded MPLs from study leading to severe underrepresentation. In place, potassium hydroxide and sodium hypochlorite is used as well as proteinase K. Moreover, as an improvement to these harsh techniques, one study [59] employed the use of papain in tissue samples of C. robusta previously bombarded with PS NPLs resulting in recovery down to an LOD of 1 ng/g of particles from organic tissue. The employment of MALS confirmed presence of the 100 nm particles increase over time with notable agglomeration evidenced by detection of diameters above 100 nm (Figure 11A). As for isolation techniques more specific to the nano regime, membrane filtration cascades whereby sequentially smaller pores are used to help segregate NPLs from a general solution without clogging. There are other methods, like chromatography, FFF, and electrophoresis but they have troublesome caveats: higher interaction at the nano regime (size exclusion stationary phase interaction), complex optimization, and functionalization of plastics have to proceed separation before they’re influenced by an electric field, respectively [60]. Interestingly, one paper [61] (Figure 11B) illustrates a method that naturally separates heterogenous samples via density by the application of zinc chloride solution that is as efficacious in both engineered and weathered MPLs in artificial incorporation in estuarine sediment. A similar study [62] employed the technique to map out MPLs abundance and type in different maritime zones potentially modeling deposition in finer detail. While the method is cheap and facile, it may not capture particles of all densities. Moreover, particles with an assortment of potential adsorbents and endowed additives may be missed (differing densities/potentially energetically unfavorable) though, as a consolation, there is no isolation protocol that won’t leave NPLs and MPLs completely undisturbed. Because of this reality, oleophilic sample media may be of benefit for a more representative capture. One paper (Figure 11C) [63] took note of the oleophilic properties of MPLs and employed oil in their proof-of-concept to increase recovery efficiency of sampling protocols suing environmental samples. In addition, a simple ethyl alcohol wash aided in further studying of the sample. In tandem, these techniques would work synergistically as a sort of insurance though polymers, and their constituents, have various degrees of oleophilicity (hydrophobicity). Other reviews [64] cite the freeze drying or dehydrating soils for easier removal which is less facile though the primary goal is to employ some solvent that can be used “on-site” during ecological sampling thus potentially disturbing the samples even less from their native “state”. Further research warrants trials with specific organic solvents, salt solutions, and proteins at various ratios down to specific polymer type which could increase recovery efficiency. There appears to be a greater need to take into account the change in concentration and type-considered abundance of MPLs and NPLs in different environments but a severe gap in the research is how to apply a standard DoE to sample isolation and preparation. Investigating which aspects of protocol may have more weight in recovery based on material type should be of immediate importance to this sub-field.
2.9. Characterization Overview (Conclusion)
Table 1 and Table 2 give an overview of the characterization techniques underscored in this review. The techniques possess great benefits towards accelerating the understanding of MPLs and NPLs in every dimension possible but each possesses its own unique set of issues that makes the need for research proliferation less than ideal (Note: the limitations of the table do not address the entirety of the scope of these methods and their capabilities but it addresses a summary of the scope from the review’s extent into researching the topic). The prime limitations appear to be issues regarding extensive sample pretreatment, sample destruction, and signal processing of confounding signals. The former could very well alter the true identification of these particle, the middle issue removes all notion of repeatability in experimentation, and the latter should be investigated in terms of setting new standards for existing MPLs for proper characterization. Computational methods may better resolve and interpret results these results as well newer instrumentation in the SOTA.
3. Existing and Theoretical Modes of Remediation
3.1. Existing Modes of Remediation
There are multiple avenues of plastic degradation in literature but the two most relevant pathways are the photolytic and microbial pathways which could make MPL and NPL remediation feasible in terms of cost and implementation. This is due to, presumably, easier implementation into existing architecture for water remediation and waste management. One report [4] has looked into the advent of zinc oxide nanoparticles capable of reducing the mass of MPLs in a continuous flow system. The PP MPLs flow through glass fiber substrates where they are trapped and subsequently photocatalytically degraded by visible light irradiated-ZnO NRs (Figure 12A,B). GC-MS analysis revealed the formation of ethyl alcohol, organic compounds with hydroxypropyl and acetyl groups, acetylacetone, and acetone: relatively non-toxic byproducts with possible reconstitution (value-added) in chemical engineering processes for common pharmaceutical/industrial compounds. The process is theorized to accelerate the beta-scission mechanism of photooxidation and degradation of PP plastics in a faster time period. Radicals of different sizes (alkoxy radicals) can form that help facilitate scission events but it may be an issue in certain systems not resistant to free radical degradation (Figure 12C). A similar report [65] detailed a similar mechanism of action but found that PE (LDPE), instead, could be degraded in a similar way. SEM revealed morphological cracking and striation formation, increase in elastic modulus due to extensive oxidation, and inclusion of functional groups like carbonyls and peroxides in the materials. The primary pathway of degradation was theorized to be through Norrish type reactions of beta-scission as well as superoxide depolymerization. Systems like these could enable waste water treatment plant remediation and ocean venting and filtration especially due to their ability to work near room temperature conditions.

Table 1.
Overview of characterization modes. Application towards MPLs and/or NPLs, sample preparation type, and tradeoffs are summarized (Part 1 of 2).
Table 1.
Overview of characterization modes. Application towards MPLs and/or NPLs, sample preparation type, and tradeoffs are summarized (Part 1 of 2).
| Method | Category | Particle Size Regime | Sample Preparation | Advantages | Disadvantages |
|---|---|---|---|---|---|
| FTIR | Identification | MPLs | Dry | Adequate resolution and well reported method. Identifies polymers, additives, and adsorbents. Spectral libraries available | Sensitive to confounding chemical noise from additives/adsorbents. |
| Raman | Identification/Quantification | MPLs/NPLs | Dry (Wet: Raman Tweezers) | Higher spatial resolution, well reported method. Identifies polymers, additives, and adsorbents. Spectral libraries available | Sensitive to confounding chemical noise from additives/adsorbents. Fluorescence from material can be an issue. |
| H-NMR | Identification | MPLs | Wet | Possible confirmatory technique for structural analysis. Identifies structure of oxidized species. | Extensive sample preparation. |
| Pyrolysis | Identification/Quantification | MPLs/NPLs | Wet | LoD is low for concentration and size of particles. Great application for biological samples. | Sample destruction. Extensive sample preparation. |
| FFF-MALS | Identification/Quantification | MPLs/NPLs | Wet | Various size regimes can be studied based on applied mode (field/pore shape nature and size. | Not well studied. Largely proprietary. |
| Counting/Weighing | Quantification | MPLs (counting)/MPLs and NPLs weighing | Dry | Mainly benefits larger MPLs and mesoplastics. | NPL and lower MPL regime more challenging to weigh/count. |
Table 2.
Overview of characterization modes. Application towards MPLs and/or NPLs, sample preparation type, and tradeoffs are summarized (Part 2 of 2).
Table 2.
Overview of characterization modes. Application towards MPLs and/or NPLs, sample preparation type, and tradeoffs are summarized (Part 2 of 2).
| Method | Category | Particle Size Regime | Sample Preparation | Advantages | Disadvantages |
|---|---|---|---|---|---|
|
DLS |
Quantification |
MPLs/NPLs |
Wet (colloid) |
Gives average diameter in addition to concentration of MPLs and NPLs. |
Engineered MPL and NPL colloids with adequate serial dilutions for calibration needed. Samples tested must be within range of calibration. |
| Turbidometry |
Quantification | MPLs | Wet/Dry | Facile: Measures opacity. | Turbidometry not as common as DLS in literature for nanoparticles. |
| AFM/SEM/TEM | Identification | MPLs/NPLs | Dry | Elucidates morphological nature to particles. | AFM not well studied for MPLs |
|
STXM |
Identification |
MPLs/NPLs/Microfibrils |
Dry |
Offers spatial determination of material type present in a given sample | Extensive preparation for particle type and size. Grid needed for centrifugal capture. |
|
NTA |
Quantification |
MPLs/NPLs (by particle conc.) |
Wet |
Fairly facile and quick method for particle concentration determination. |
Limited to specific ranges of particle concentrations. |
|
TGA |
Identification |
MPLs (heterogeneous sample may contain NPLs/Mesoplastic etc.) |
Dry |
Concentration of PE/PP determined in heterogeneous sample | No clear determination of MPL and NPL presence (general plastic concentration). |
| DSC | Identification | MPLs (specific extraction for higher regime MPLs) | Dry | Heating steps improves SNR | Sample not heterogenous. |
3.2. Theoretical Modes of Remediation via Nanotechnology
3.2.1. Layer-by-layer (LBL) Nanoparticle Remediator
Firstly, before a process implementing nanotechnology is approved, the proof of concept of the extent of NPLs and MPLs must be established with detection. We then can outline a methodology of creating a nanoparticle platform that can digest MPLs/NPLs with possible integration in water treatment/sewage treatment systems as well as implementation into oceanic events. In order to sense the presence of materials of nanoscale dimensions and concentrations, the advent of a sensing modality capable enabled with nanotechnology must be defined. Herein, we will discuss a proposed sensing and remediation methods by the review (Note: figures in this section are merely general examples to showcase general methodology or setup).
An attractive implementation could be with the use of a biokleptic LBL directed self-assembled system that ensnares microbial enzymes capable of plastic degradation. A theoretical system like this could possibly preserve their original functionality by increasing their longevity (protection from harsh non-native environment) thus ultimately degrading these harmful particles completely with presumably higher degrees of specificity than the current SOTA. Employment of the use of polycations and polyanions to “sandwich” enzymes (Figure 13A) based on their isoelectric points or overall charge characteristics. The specific choices of polymers or macromolecules, or chemical modification, is vital in selecting for sterics and electrostatic interactions. In addition, adjustment the porosity of layers over ensnared enzymes to ensure efficient binding opportunity for MPLs/NPLs (or, at least, dangling chains in their amorphous regions) [66]. A study [67] tangent to LBL nanoparticle systems underscored their reasoning as a platform for biokleptic capture of enzymes whilst also bringing to light their preservation of enzymatic activity for their smaller magnetic nanoparticles (their example covalently bonded lactase to the nanoparticles) as follows: 79%, 34%, and 14% for 18nm, 50nm, and 200 nm nanoparticle conjugates, respectively. The coefficient of catalysis, kcat , decreases with respect to diameter increase which, according to the paper’s rationale, is due to individual enzyme binding pocket surface interactions with a larger surface area on an individual nanoparticle. As for a LBL system that relies on electrostatic interaction, multiple layers, and different nanoparticle materials reactivity retention will vary. This is fascinating in that the overall higher amount of surface energy for smaller nanoparticles doesn’t disrupt enzymatic activity though this is most likely circumvented to covalent binding, or in this review’s case, could be circumvented by electrostatic interaction. Moreover, emphasis is placed on magnetic NPs due to their enhanced separability from solution.
The choice of enzymes that can be amplified and purified in microbial cultures is an important one in that we want to ensure that the enzyme can catalytically degrade multiple MPL and NPL polymer types as well as their constituents. It is also to ensure they’re safe, easily producible, and that their byproducts are safe or separable for value-added manufacturing. Moreover, those byproducts, if environmentally harmful, should be noted and mitigated appropriately. This next subsection will give an overview of potential enzymes of choice that are hypothesized to degrade PE, PP, PVC, PS, PET, and NA6 plastic polymers with some overlap as well as potential enzymes and antioxidants that can control for free radical/super oxide formation from certain catalytic processes, and finally, control for carbon dioxide production. The final subsection will dive into a quick overview of how these processes could potentially be deployed in a real-world separation process so that the technology is more feasible for end-stage R&D.
3.2.2. Enzyme Selection
There are numerous amounts of plant, fungal, and bacterial enzymes that possess the ability to catalytically degrade plastic polymers albeit with experimentally challenging process conditions like anerobic environments, presence of heavy metal/alkali earth metal cofactors, and mandatory bundling in a particular microbial pathway. Some can be isolated as a sole catalytic enzyme that can bind to a wide array of ligands of interest. A popular one in the literature is “cutinase,” a carboxyl esterase, which can hydrolyze the ester bonds of PET polymers with various crystallinity. Lignin enzymes in plants like lignin peroxidase, laccase, and manganese peroxidase, can break down the C-C backbone polymers like PP, PE, PS, and PVC but they tend to have less enzymatic activity than native lignin due to less redox potential (may be mitigated by environmental oxidation). A report [68] deploying alkane hydroxylase from E. coli expansion revealed about a 20% weight reduction of PE with a 10% increase in weight reduction for concomitant alkane monooxygenase, rubredoxin, and rubredoxin reductase. PS, in one example [69], was rapidly degraded to water soluble byproducts by hydroquinone peroxidase though it should be noted that this process needs added hydrogen peroxide and tetramethylhydroquinone. A possible pathway yielding recyclable and safe byproducts from plastics was reported (Figure 13B) [68], along with other pathways, via elucidation of a stream-lined isolation of the Geobacillus thermodentriticans fatty acid synthesis pathway. This streamline consists of “LndA” (long-chain monooxygenase), alcohol dehydrogenase 1 and 2, and aldehyde dehydrogenase to generate fatty acids of multiple lengths from alkanes. This pathway only works for carbon polymer lengths above 20 but it can be performed without cofactors. Carbon lengths from 2 to 9 can be digested by “a three-component di-iron monooxygenase system that consists of an iron-containing hydroxylase (BMOH), a flavo-iron sulfur-containing NADH-oxidoreductase (BMOR), and a small regulatory component protein (BMOB)” from Thauera butanivorans. Fatty acid formation, via the fumarate addition pathway, can occur with at least 6 carbons seen in a study from the bacterial strain “Hxd3”. After fumarate addition, the product can be used by the bacteria in their beta oxidation pathway (caveat is that exact enzyme is unknown) (Figure 13C). Thermomyces (formerly Humicola) insolens cutinases have been shown to possess complete degradation of PET although they require high temperature reaction conditions due to the extremophilic nature of their parent fungi. As for fungal polyester hydrolases, they could overcome the barrier that fungal carboxylesterases possess when encountering crystalline PET MPLs presumably due to their hydrophobic nature and low SA:V. Interestingly, altered “cutinase” from Thermobifida fusca was modified with a disulfide linkage or salt bridge to completely reduce PET of any crystallinity though the enzyme requires a presence of calcium and magnesium ions. Future steps look towards site-directed mutagenesis of these enzymes. An interesting, and somewhat tangential paper (Figure 13D) [70], discovered the increase catalytic activity of one PETase enzyme with two amino acid mutations allowing PET polymers to sit deeper within the binding complex and coordinate more advantageously with the pi bonds in the benzyl structure of the amino acids in the binding pocket. This ultimately allowed further reduction in mass of PET than the native enzyme.
Taking advantage of bacterial amplification, clustering of enzymes, and their resultant protein amplification could be vital in degradation pathways that circumvent the complexities of isolating individual enzymes or isolating every enzyme responsible in a pathway. For the degradation of PET, one report [71] indicated the use of novel bacterial plasmids in the reduction of terephthalic acid, a final constituent in PET polymers, to vanillin with E. coli MG1655 RARE (reduced aromatic aldehyde reduction). Another paper [72] isolated the pathway to pyruvate in (Pseudoxanthomonas spadix BD-a59) for benzyl precursors. Saddler’s group fashioned a plasmid for the bacteria by choosing the specific enzymes they wanted to express for their vanillin production from many different species (Figure 14A). Choi’s group performed a bioinformatic study on the genome of their bacteria and found upregulation of peroxidase, monooxygenase, and catalase proteins in the presence of benzyl containing compounds which could be possible candidates for PET-compatible enzymes (Figure 14B). Another paper [73] showcasing a sophisticated “multi-omic” bioinformatic study isolated the primary functional enzymes laccase, monooxygenase, dioxygenase, aldehyde dehydrogenase, esterase, and dihydroxy-acid dehydratase in a PVC-degrading strain, “EMBL-1” Klebsiella variicola. Moreover, for NA6/NA66, one report characterized nylon digesting enzymes that digest nylon oligomers to single monomer nylon (5 carbons between amide bonds). It was found that the activities of 6-aminohexanoate dimer hydrolase A/B and endotype-oligomer hydrolase were responsible [74]. It may take time to delineate which enzymes have an overlap in utility so minimization of resources occurs thus maintaining optimal reaction rates and avoidance of steric hindrance for the hypothetical system. Some may have to be partitioned amongst groups of nanoparticles for adequate coverage in various combinations and ratios while others may work well, concomitantly. Hypothetically speaking, the paper’s focus on MPLs and NPLs should help rapid reaction rates that we ideally want to see in an optimized system (surface area/volume ratio). Whether or not there is application to larger mesoplastics and bulk polymers is out of the scope for this review but merits further investigation.
Unfortunately, the enzymes mentioned above may have the potential to induce off-target effects in a LBL system where free radical scission events could degrade the system faster than ideal. It may be beneficial to incorporate radical scavenging or neutralizing proteins in small fractions that trade off the LBL systems’ enzymatic capabilities for long-term stability. If all else, an environmentally friendly layer of antioxidants may suffice for ease of fabrication and efficacy as a second option though the caveat is their limited lifetime since enzymes regenerate their reaction center. Applications of superoxides, alkoxy radicals, and peroxides byproducts are generally short-lived since, in the enzymatic sense, they degrade long-chain polymers and alkanes. Unfortunately, this could cause off-target effects (degradation of the LBL scaffold, the system’s components, etc.). Employing antioxidant enzymes such as (Cu/Zn) superoxide dismutase (SOD), catalase (hydrogen donor needed), and glutathione peroxidase (selenium) could potentially help. As one can see (Figure 14C), many of these enzymes are already expressed in vital plastic polymer degradation pathways and are found resident within human metabolic pathways as well [75]. As for alkoxy radicals, molecular antioxidants like flavonoids may be able to suppress their generation in the system [76]. Laccases, or benzenediol oxygen reductases (copper), may be able to scavenge for a wide variety of phenolic or non-phenolic substances as well as their free radical counterparts. This is vital in the sense that it could neutralize/degrade off target radicals owing to environmental organic pollutants or POPs within MPLs and NPLs [77]. As an aside to other potential byproducts, if there is use of short-chain monooxygenases in a series of steps (plasmid gene cluster) for example, as detailed in Ji’s research group, it can produce carbon dioxide which may make the system inefficient if the gas is produced in copious quantities. This must be mitigated, sequestered, or at least proven as minimally impactful to global carbon dioxide output. Clearly, this will depend on which enzymatic pathways and individual pathways will be in use but, if needed, one such use of metal dependent formate dehydrogenase may be able to sequester carbon dioxide safely [78].
3.2.3. Processing Implementation in Wastewater Management
In terms of the feasibility of implementing nanotechnology into existing civil engineering architecture, we must take careful consideration into the already existing architecture in the wastewater management, waste management, and oceanic clean up. For example, when considering the separation processes in wastewater management, we’ll have to innovate on an apparatus or separation that can safely segregate the enzymatic processes of the nanotechnology, the byproducts, and unreacted MPL/NPL reagents before the efflux goes into the environment. This has to be compatible with existing architecture so as to not lengthen the process of its implementation. A purified inflow would fill a hypothetical reactor where MPL/NPL separation and reaction can take place. In some cases, the first concept for detection and separation in the review could help in the process of particles in a separate vessel by elution that can dislodge the captured particles and concentrate them (perhaps by a high salinity solution). In the main reactor, the magnetic LBL nanoparticle system would be separated from the solution leaving only the byproducts left. Mass separating agents could segregate byproducts that could not be separated by phase. They can then be recycled and used elsewhere in different industries (or discarded if toxic). As for the safer byproducts, they can be incorporated in the efflux from the final clarification process. For errant magnetic NPs, separators between different compartments could magnetically immobilize them before they move on if the initial semipermeable membrane doesn’t suffice (should only allow molecular byproducts to filter through). Connecting pipelines would recycle escaped nanoparticles back but the magnetic field applied to the main reactor should prevent this last resort. Unreacted MPLs and NPLs could be sequestered by a semi-permeable membrane or by simple recycling through the same reaction vessel until desirably safe concentrations are achieved. Taps would be placed at critical areas to monitor conditions via concentration studies and pressure monitors so that membranes aren’t disrupted by too much hydrodynamic force [79].
4. Discussion and Conclusions
Ascertaining the exact composition of MPLs and NPLs is a complex and arduous process. Multiple characterization techniques, computational work, comparison with existing databases and literature as well as replication of protocols is needed to accurately interpret the samples we receive. The heterogeneity and extensive physiochemical changes that occur to these particles in nature as well as passive adsorption of confounding and toxic chemicals complicate the research. Therefore, newer technologies that can assess what we’re dealing with before sensing and remediation of these toxic particles are much needed. Nevertheless, if considerable effort is put into standardizing these processes, it’ll help establish and quicken the proof-of-concepts needed to engineer devices that can differentiate safely remediate these particles. Even here, form (heterogeneity ascertainment) dictates function (remediation with high specificity. Our industrial society is inundated with harmful toxicants and pollutants of all different types from our own activities as humans. With predicted devastating effects, from a toxicological standpoint, it is paramount to divert attention and resources towards solving this litany of issues if we do not further wish to destroy progress as a species and ourselves. Referring back to Leslie’s and Marfella’s reports, plastic particles are circulating within a great deal of human beings causing damage. These reports are just the beginning of elucidating the toxicology of these particles. There is no telling yet what these impacts are on the biosphere as a whole but one comforting fact is for certain: multitudes of research groups across the globe in this seemingly small area of research are working towards a concerted solution and need the support of those involved and those privy to this field.
Author Contributions
Conceptualization of Section 2, S.A.; conceptualization of Section 2 and 3, W.W.; investigation, W.W.; resources, W.W and S.A.; writing—original draft preparation, W.W.; writing—review and editing, W.W.; visualization, W.W.; supervision, S.A.; and project administration, S.A. All authors have read and agreed to the published version of the manuscript.
Funding
This research received no external funding.
Institutional Review Board Statement
Not applicable.
Data Availability Statement
Not applicable.
Acknowledgments
No acknowledgements to report.
Conflicts of Interest
The authors declare no conflicts of interest.
References
- M. Bergmann, L. Gutow, and M. Klages, “Marine anthropogenic litter,” Mar. Anthropog. Litter, pp. 1–447, Jan. 2015. [CrossRef]
- F. Gallo et al., “Marine litter plastics and microplastics and their toxic chemicals components: The need for urgent preventive measures,” Environ. Sci. Eur., vol. 30, no. 1, pp. 1–14, Dec. 2018. [CrossRef]
- Chamas et al., “Degradation Rates of Plastics in the Environment,” ACS Sustain. Chem. Eng., vol. 8, no. 9, pp. 3494–3511, Mar. 2020. [CrossRef]
- Uheida, H. G. Mejía, M. Abdel-Rehim, W. Hamd, and J. Dutta, “Visible light photocatalytic degradation of polypropylene microplastics in a continuous water flow system,” J. Hazard. Mater., vol. 406, Mar. 2021. [CrossRef]
- P. L. Corcoran, M. C. Biesinger, and M. Grifi, “Plastics and beaches: A degrading relationship,” Mar. Pollut. Bull., vol. 58, no. 1, pp. 80–84, 2009. [CrossRef]
- M. Mecozzi, M. Pietroletti, and Y. B. Monakhova, “FTIR spectroscopy supported by statistical techniques for the structural characterization of plastic debris in the marine environment: Application to monitoring studies,” Mar. Pollut. Bull., vol. 106, no. 1–2, pp. 155–161, May 2016. [CrossRef]
- F. Lachmann et al., “Marine Plastic Litter on Small Island Developing States (SIDS),” no. May, pp. 1–76, 2017. [CrossRef]
- ter Halle and J. F. Ghiglione, “Nanoplastics: A Complex, Polluting Terra Incognita,” Environ. Sci. Technol., vol. 55, no. 21, pp. 14466–14469, Nov. 2021. [CrossRef]
- Z. Ren et al., “Weathering of microplastics and their enhancement on the retention of cadmium in coastal soil saturated with seawater,” J. Hazard. Mater., vol. 440, p. 129850, Oct. 2022. [CrossRef]
- M. L. Alharbi, A. A. Basheer, R. A. Khattab, and I. Ali, “Health and environmental effects of persistent organic pollutants,” J. Mol. Liq., vol. 263, pp. 442–453, Aug. 2018. [CrossRef]
- M. Zhao et al., “Adsorption of Different Pollutants by Using Microplastic with Different Influencing Factors and Mechanisms in Wastewater: A Review,” Nanomaterials, vol. 12, no. 13, 2022. [CrossRef]
- T. Atugoda et al., “Interactions between microplastics, pharmaceuticals and personal care products: Implications for vector transport,” Environ. Int., vol. 149, p. 106367, Apr. 2021. [CrossRef]
- Z. Ye et al., “Neurotoxicity of microplastics: A CiteSpace-based review and emerging trends study,” Environ. Monit. Assess., vol. 195, no. 8, p. 960, Aug. 2023. [CrossRef]
- D. Agboola and N. U. Benson, “Physisorption and Chemisorption Mechanisms Influencing Micro (Nano) Plastics-Organic Chemical Contaminants Interactions: A Review,” Front. Environ. Sci., vol. 9, p. 167, May 2021. [CrossRef]
- Koelmans et al., “Nanoplastics in the Aquatic Environment. Critical Review,” Mar. Anthropog. Litter, pp. 325–340, Jan. 2015. [CrossRef]
- H. Shao, Z. Han, N. Krasteva, and D. Wang, “Identification of signaling cascade in the insulin signaling pathway in response to nanopolystyrene particles,” Nanotoxicology, vol. 13, no. 2, pp. 174–188, Feb. 2019. [CrossRef]
- G. G. N. Thushari and J. D. M. Senevirathna, “Plastic pollution in the marine environment,” Heliyon, vol. 6, no. 8, Aug. 2020. [CrossRef]
- M. H. Debruyn and F. A. P. C. Gobas, “A bioenergetic biomagnification model for the animal kingdom,” Environ. Sci. Technol., vol. 40, no. 5, pp. 1581–1587, Mar. 2006. [CrossRef]
- T. S. Galloway, “Micro- and nano-plastics and human health,” Mar. Anthropog. Litter, pp. 343–366, Jan. 2015. [CrossRef]
- H. A. Leslie, M. J. M. van Velzen, S. H. Brandsma, A. D. Vethaak, J. J. Garcia-Vallejo, and M. H. Lamoree, “Discovery and quantification of plastic particle pollution in human blood,” Environ. Int., p. 107199, Mar. 2022. [CrossRef]
- R. Marfella et al., “Microplastics and Nanoplastics in Atheromas and Cardiovascular Events,” N. Engl. J. Med., vol. 390, no. 10, pp. 900–910, Mar. 2024. [CrossRef]
- Asamoah, E. Uurasjärvi, J. Räty, A. Koistinen, M. Roussey, and K. E. Peiponen, “Towards the Development of Portable and In Situ Optical Devices for Detection of Micro-and Nanoplastics in Water: A Review on the Current Status,” Polymers (Basel)., vol. 13, no. 5, pp. 1–30, Mar. 2021. [CrossRef]
- L. Cai et al., “Characteristic of microplastics in the atmospheric fallout from Dongguan city, China: Preliminary research and first evidence,” Environ. Sci. Pollut. Res., vol. 24, no. 32, pp. 24928–24935, Nov. 2017. [CrossRef]
- R. Dris, J. Gasperi, M. Saad, C. Mirande, and B. Tassin, “Synthetic fibers in atmospheric fallout: A source of microplastics in the environment?,” Mar. Pollut. Bull., vol. 104, no. 1–2, pp. 290–293, Mar. 2016. [CrossRef]
- Sandt, J. Waeytens, A. Deniset-Besseau, C. Nielsen-Leroux, and A. Réjasse, “Use and misuse of FTIR spectroscopy for studying the bio-oxidation of plastics,” Spectrochim. Acta Part A Mol. Biomol. Spectrosc., vol. 258, p. 119841, Sep. 2021. [CrossRef]
- Tang, Pik Leung; Forster, Rodney; McCumskay, Rick; Rogerson, Mike; Waller, “Handheld FT-IR Spectroscopy for the Triage of Micro- and Meso-Sized Plastics in the Marine Environment Incorporating an Accelerated Weathering Study and an Aging Estimation,” Spectroscopy. Accessed: Mar. 01, 2022. [Online]. Available: https://www.spectroscopyonline.com/view/handheld-ft-ir-spectroscopy-triage-micro-and-meso-sized-plastics-marine-environment-incorporating-ac.
- V. Nava, M. L. Frezzotti, and B. Leoni, “Raman Spectroscopy for the Analysis of Microplastics in Aquatic Systems,” Appl. Spectrosc., vol. 75, no. 11, pp. 1341–1357, Nov. 2021. [CrossRef]
- “PublicSpectra | Raman Spectral Database.” Accessed: May 04, 2022. [Online]. Available: https://publicspectra.com/.
- P. J. Clunies-Ross, G. P. S. Smith, K. C. Gordon, and S. Gaw, “Synthetic shorelines in New Zealand? Quantification and characterisation of microplastic pollution on Canterbury’s coastlines,” New Zeal. J. Mar. Freshw. Res., vol. 50, no. 2, pp. 317–325, Apr. 2016. [CrossRef]
- R. Gillibert et al., “Raman tweezers for small microplastics and nanoplastics identification in seawater,” Environ. Sci. Technol., vol. 53, no. 15, pp. 9003–9013, Aug. 2019. [CrossRef]
- F. R. M. Ramsperger et al., “Environmental exposure enhances the internalization of microplastic particles into cells,” Sci. Adv., vol. 6, no. 50, Dec. 2020. [CrossRef]
- M. Dong, Q. Zhang, X. Xing, W. Chen, Z. She, and Z. Luo, “Raman spectra and surface changes of microplastics weathered under natural environments,” Sci. Total Environ., vol. 739, p. 139990, Oct. 2020. [CrossRef]
- “Portable Raman Microscopy for Identification of Microplastics.” Accessed: Mar. 04, 2022. [Online]. Available: https://www.azom.com/article.aspx?ArticleID=19941.
- “Analytical Chemistry – A Guide to Proton Nuclear Magnetic Resonance (NMR) – Compound Interest.” Accessed: Mar. 05, 2022. [Online]. Available: https://www.compoundchem.com/2015/02/24/proton-nmr/.
- N. Peez, M. C. Janiska, and W. Imhof, “The first application of quantitative 1H NMR spectroscopy as a simple and fast method of identification and quantification of microplastic particles (PE, PET, and PS),” Anal. Bioanal. Chem., vol. 411, no. 4, pp. 823–833, Feb. 2019. [CrossRef]
- Corti et al., “Thorough Multianalytical Characterization and Quantification of Micro- and Nanoplastics from Bracciano Lake’s Sediments,” Sustain. 2020, Vol. 12, Page 878, vol. 12, no. 3, p. 878, Jan. 2020. [CrossRef]
- M. Fischer and B. M. Scholz-Böttcher, “Simultaneous Trace Identification and Quantification of Common Types of Microplastics in Environmental Samples by Pyrolysis-Gas Chromatography-Mass Spectrometry,” Environ. Sci. Technol., vol. 51, no. 9, pp. 5052–5060, May 2017. [CrossRef]
- Li et al., “Quantification of Nanoplastic Uptake in Cucumber Plants by Pyrolysis Gas Chromatography/Mass Spectrometry,” Environ. Sci. Technol. Lett., vol. 8, no. 8, pp. 633–638, Aug. 2021. [CrossRef]
- J. Jiménez-Lamana, L. Marigliano, J. Allouche, B. Grassl, J. Szpunar, and S. Reynaud, “A Novel Strategy for the Detection and Quantification of Nanoplastics by Single Particle Inductively Coupled Plasma Mass Spectrometry (ICP-MS),” Anal. Chem., vol. 92, no. 17, pp. 11664–11672, Sep. 2020. [CrossRef]
- Bühler and W. Simon, “Curie Point Pyrolysis Gas Chromatography,” J. Chromatogr. Sci., vol. 8, no. 6, pp. 323–329, Jun. 1970. [CrossRef]
- P. Arenas-Guerrero et al., “Determination of the size distribution of non-spherical nanoparticles by electric birefringence-based methods,” Sci. Rep., vol. 8, no. 1, p. 9502, Dec. 2018. [CrossRef]
- M. A. Hanif, N. Ibrahim, F. A. Dahalan, U. F. Md Ali, M. Hasan, and A. A. Jalil, “Microplastics and nanoplastics: Recent literature studies and patents on their removal from aqueous environment,” Sci. Total Environ., vol. 810, p. 152115, 2022. [CrossRef]
- Misra et al., “Water Purification and Microplastics Removal Using Magnetic Polyoxometalate-Supported Ionic Liquid Phases (magPOM-SILPs),” Angew. Chemie Int. Ed., vol. 59, no. 4, pp. 1601–1605, Jan. 2020. [CrossRef]
- Batool and S. Valiyaveettil, “Surface functionalized cellulose fibers – A renewable adsorbent for removal of plastic nanoparticles from water,” J. Hazard. Mater., vol. 413, p. 125301, Jul. 2021. [CrossRef]
- Elkhatib, V. Oyanedel-Craver, and E. Carissimi, “Electrocoagulation applied for the removal of microplastics from wastewater treatment facilities,” Sep. Purif. Technol., vol. 276, p. 118877, Dec. 2021. [CrossRef]
- T. Aslan, S. Arslan, M. Eyvaz, S. Güçlü, E. Yüksel, and İ. Koyuncu, “A novel nanofiber microfiltration membrane: Fabrication and characterization of tubular electrospun nanofiber (TuEN) membrane,” J. Memb. Sci., vol. 520, pp. 616–629, Dec. 2016. [CrossRef]
- K. Rajala, O. Grönfors, M. Hesampour, and A. Mikola, “Removal of microplastics from secondary wastewater treatment plant effluent by coagulation/flocculation with iron, aluminum and polyamine-based chemicals,” Water Res., vol. 183, p. 116045, Sep. 2020. [CrossRef]
- S. Lambert and M. Wagner, “Characterisation of nanoplastics during the degradation of polystyrene,” Chemosphere, vol. 145, p. 265, Feb. 2016. [CrossRef]
- S. K. R. Williams, J. R. Runyon, and A. A. Ashames, “Field-flow fractionation: Addressing the nano challenge,” Anal. Chem., vol. 83, no. 3, pp. 634–642, Feb. 2011. [CrossRef]
- Meier and G. Heinzmann, “Field-Flow Fractionation: A powerful technology for the separation and advanced characterization of proteins, antibodies, viruses, polymers and nano-/microparticles,” Researchgate.Net, no. September, pp. 1–34, 2017, [Online]. Available: https://www.researchgate.net/publication/319505751_Field-Flow_Fractionation_A_powerful_technology_for_the_separation_and_advanced_characterization_of_proteins_antibodies_viruses_polymers_and_nano-microparticles.
- M. Majewsky, H. Bitter, E. Eiche, and H. Horn, “Determination of microplastic polyethylene (PE) and polypropylene (PP) in environmental samples using thermal analysis (TGA-DSC),” Sci. Total Environ., vol. 568, pp. 507–511, Oct. 2016. [CrossRef]
- H. Bitter and S. Lackner, “Fast and easy quantification of semi-crystalline microplastics in exemplary environmental matrices by differential scanning calorimetry (DSC),” Chem. Eng. J., vol. 423, p. 129941, Nov. 2021. [CrossRef]
- P. J. Wlasits, A. Stoellner, G. Lattner, K. Maggauer, and P. M. Winkler, “Size characterization and detection of aerosolized nanoplastics originating from evaporated thermoplastics,” Aerosol Sci. Technol., vol. 56, no. 2, pp. 176–185, 2021. [CrossRef]
- T. Yang, J. Luo, and B. Nowack, “Characterization of Nanoplastics, Fibrils, and Microplastics Released during Washing and Abrasion of Polyester Textiles,” Environ. Sci. Technol., vol. 55, no. 23, pp. 15873–15881, Dec. 2021. [CrossRef]
- S. Mariano, S. Tacconi, M. Fidaleo, M. Rossi, and L. Dini, “Micro and Nanoplastics Identification: Classic Methods and Innovative Detection Techniques,” Front. Toxicol., vol. 0, p. 2, Feb. 2021. [CrossRef]
- W. J. Shim, Y. K. Song, S. H. Hong, and M. Jang, “Identification and quantification of microplastics using Nile Red staining,” Mar. Pollut. Bull., vol. 113, no. 1–2, pp. 469–476, Dec. 2016. [CrossRef]
- T. Maes, R. Jessop, N. Wellner, K. Haupt, and A. G. Mayes, “A rapid-screening approach to detect and quantify microplastics based on fluorescent tagging with Nile Red,” Sci. Rep., vol. 7, no. 1, p. 44501, Mar. 2017. [CrossRef]
- F. Araujo, M. M. Nolasco, A. M. P. Ribeiro, and P. J. A. Ribeiro-Claro, “Identification of microplastics using Raman spectroscopy: Latest developments and future prospects,” Water Res., vol. 142, pp. 426–440, Oct. 2018. [CrossRef]
- Valsesia et al., “Detection, counting and characterization of nanoplastics in marine bioindicators: A proof of principle study,” Microplastics Nanoplastics 2021 11, vol. 1, no. 1, pp. 1–13, Apr. 2021. [CrossRef]
- Schwaferts, R. Niessner, M. Elsner, and N. P. Ivleva, “Methods for the analysis of submicrometer- and nanoplastic particles in the environment,” TrAC Trends Anal. Chem., vol. 112, pp. 52–65, Mar. 2019, Accessed: May 28, 2022. [Online]. Available: https://linkinghub.elsevier.com/retrieve/pii/S0165993618304631.
- R. L. Coppock, M. Cole, P. K. Lindeque, A. M. Queirós, and T. S. Galloway, “A small-scale, portable method for extracting microplastics from marine sediments,” Environ. Pollut., vol. 230, pp. 829–837, Nov. 2017. [CrossRef]
- M. Díaz-Jaramillo, M. S. Islas, and M. Gonzalez, “Spatial distribution patterns and identification of microplastics on intertidal sediments from urban and semi-natural SW Atlantic estuaries,” Environ. Pollut., vol. 273, p. 116398, Mar. 2021. [CrossRef]
- M. Crichton, M. Noël, E. A. Gies, and P. S. Ross, “A novel, density-independent and FTIR-compatible approach for the rapid extraction of microplastics from aquatic sediments,” Anal. Methods, vol. 9, no. 9, pp. 1419–1428, 2017. [CrossRef]
- Thomas, B. Schütze, W. M. Heinze, and Z. Steinmetz, “Sample Preparation Techniques for the Analysis of Microplastics in Soil—A Review,” Sustainability, vol. 12, no. 21, p. 9074, Oct. 2020. [CrossRef]
- T. S. Tofa, K. L. Kunjali, S. Paul, and J. Dutta, “Visible light photocatalytic degradation of microplastic residues with zinc oxide nanorods,” Environ. Chem. Lett., vol. 17, no. 3, pp. 1341–1346, Sep. 2019. [CrossRef]
- S. Sakr and G. Borchard, “Encapsulation of enzymes in layer-by-layer (LbL) structures: Latest advances and applications,” Biomacromolecules, vol. 14, no. 7, pp. 2117–2135, Jul. 2013. [CrossRef]
- J. N. Talbert and J. M. Goddard, “Influence of nanoparticle diameter on conjugated enzyme activity,” Food Bioprod. Process., vol. 91, no. 4, pp. 693–699, Oct. 2013. [CrossRef]
- Y. Ji, G. Mao, Y. Wang, and M. Bartlam, “Structural insights into diversity and n-alkane biodegradation mechanisms of alkane hydroxylases,” Front. Microbiol., vol. 0, p. 58, 2013. [CrossRef]
- R. Wei and W. Zimmermann, “Microbial enzymes for the recycling of recalcitrant petroleum-based plastics: How far are we?,” Microb. Biotechnol., vol. 10, no. 6, pp. 1308–1322, Nov. 2017. [CrossRef]
- P. Austin et al., “Characterization and engineering of a plastic-degrading aromatic polyesterase,” Proc. Natl. Acad. Sci. U. S. A., vol. 115, no. 19, pp. E4350–E4357, May 2018. [CrossRef]
- J. C. Sadler and S. Wallace, “Microbial synthesis of vanillin from waste poly(ethylene terephthalate),” Green Chem., vol. 23, no. 13, pp. 4665–4672, Jul. 2021. [CrossRef]
- J. Choi, H. M. Jin, S. H. Lee, R. K. Math, E. L. Madsen, and C. O. Jeon, “Comparative genomic analysis and benzene, toluene, ethylbenzene, and o-, m-, and p-xylene (BTEX) degradation pathways of Pseudoxanthomonas spadix BD-a59,” Appl. Environ. Microbiol., vol. 79, no. 2, pp. 663–671, Jan. 2013. [CrossRef]
- Z. Zhe, H. Peng, D. Yang, G. Zhang, J. Zhang, and F. Ju, “Polyvinyl Chloride Biodegradation Fuels Survival of Invasive Insect Larva and Intestinal Degrading Strain of Klebsiella,” bioRxiv, p. 2021.10.03.462898, Oct. 2021. [CrossRef]
- K. Yasuhira et al., “6-Aminohexanoate oligomer hydrolases from the alkalophilic bacteria Agromyces sp. strain KY5R and Kocuria sp. strain KY2,” Appl. Environ. Microbiol., vol. 73, no. 21, pp. 7099–7102, Nov. 2007. [CrossRef]
- J. M. Matés, C. Pérez-Gómez, and I. N. De Castro, “Antioxidant enzymes and human diseases,” Clin. Biochem., vol. 32, no. 8, pp. 595–603, Nov. 1999. [CrossRef]
- C. Yu, Z. Shao, B. Liu, Y. Zhang, and S. Wang, “Inhibition of 2-Amino-1-methyl-6-phenylimidazo [4,5-b]pyridine (PhIP) Formation by Alkoxy Radical Scavenging of Flavonoids and Their Quantitative Structure–Activity Relationship in a Model System,” J. Food Sci., vol. 81, no. 8, pp. C1908–C1913, Aug. 2016. [CrossRef]
- L. Arregui et al., “Laccases: Structure, function, and potential application in water bioremediation,” Microb. Cell Factories 2019 181, vol. 18, no. 1, pp. 1–33, Nov. 2019. [CrossRef]
- R. Oliveira et al., “Toward the Mechanistic Understanding of Enzymatic CO2 Reduction,” ACS Catal., vol. 10, no. 6, pp. 3844–3856, Mar. 2020. [CrossRef]
- Tchobanoglous and Metcalf and Eddy Incorporated, Wastewater Engineering: Treatment, Disposal, Reuse, Second. New York London McGraw-Hill, 1979.
Figure 1.
Projection of global plastic production up to the year 2050 and the weights of production estimated by an assortment of continents, countries, unions or regions [2].
Figure 1.
Projection of global plastic production up to the year 2050 and the weights of production estimated by an assortment of continents, countries, unions or regions [2].
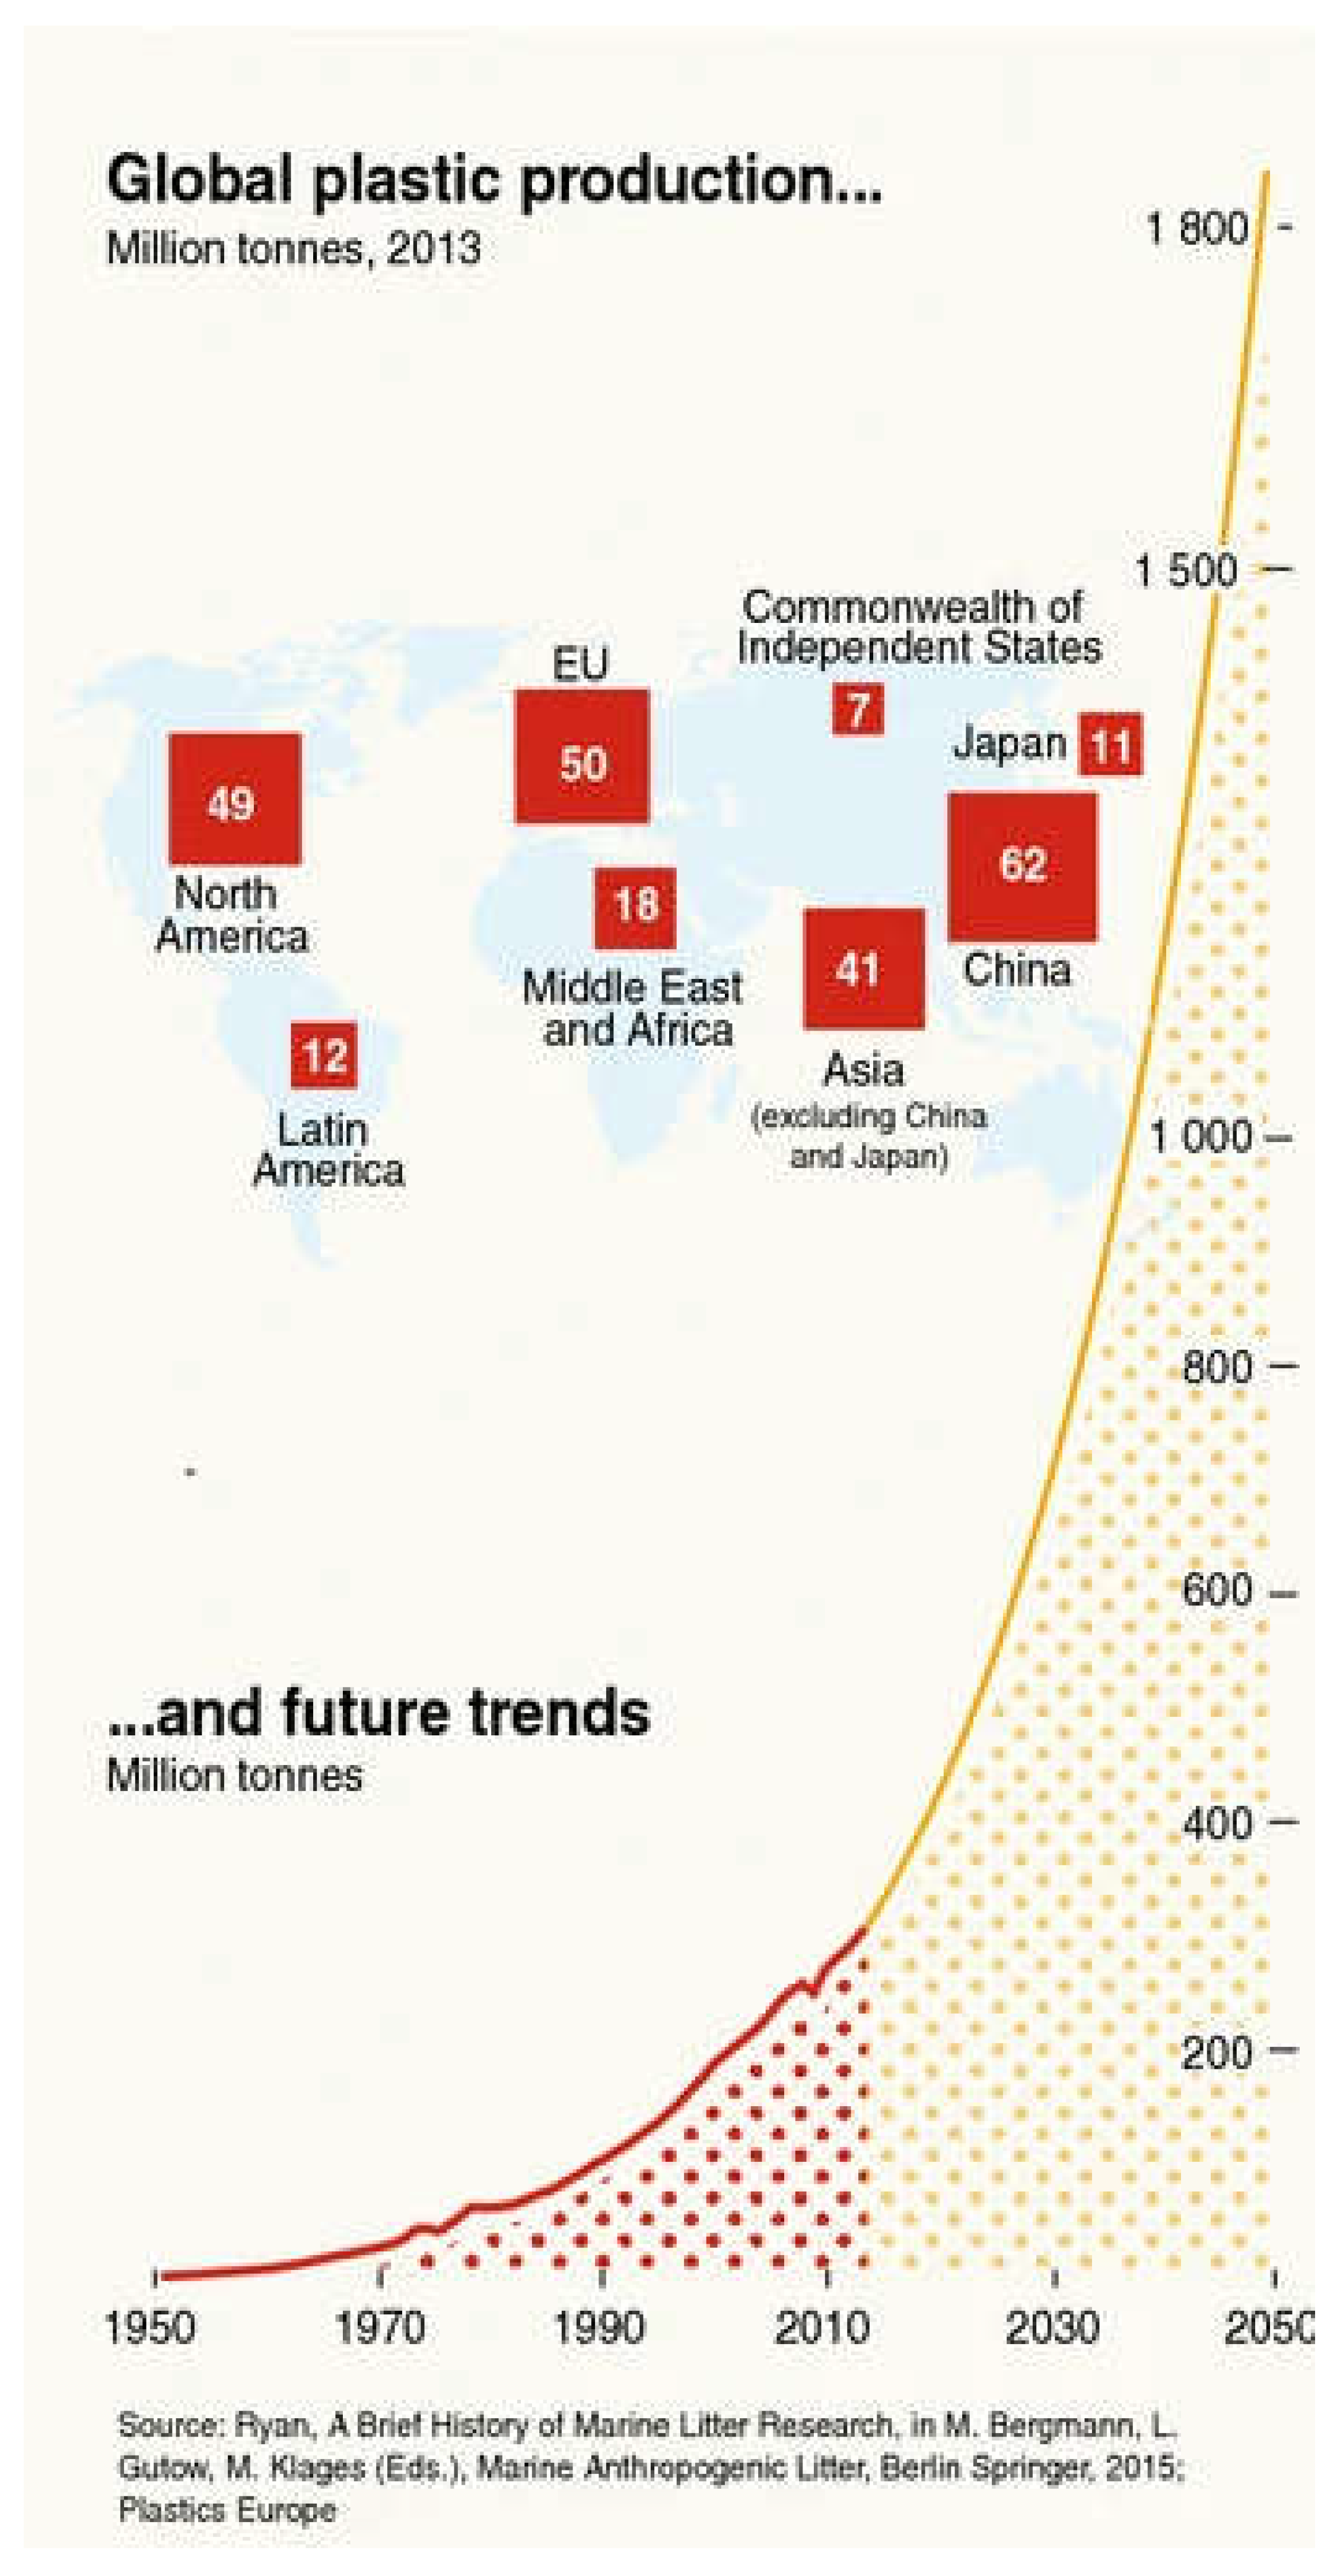
Figure 2.
(A) Extent of different areas of plastic research increasing over time in marine science. (B) Molecular structure and central moieties for PE, PP, NA6, PVC, PET, and PS: the six most common plastics produced in industry [1,7].
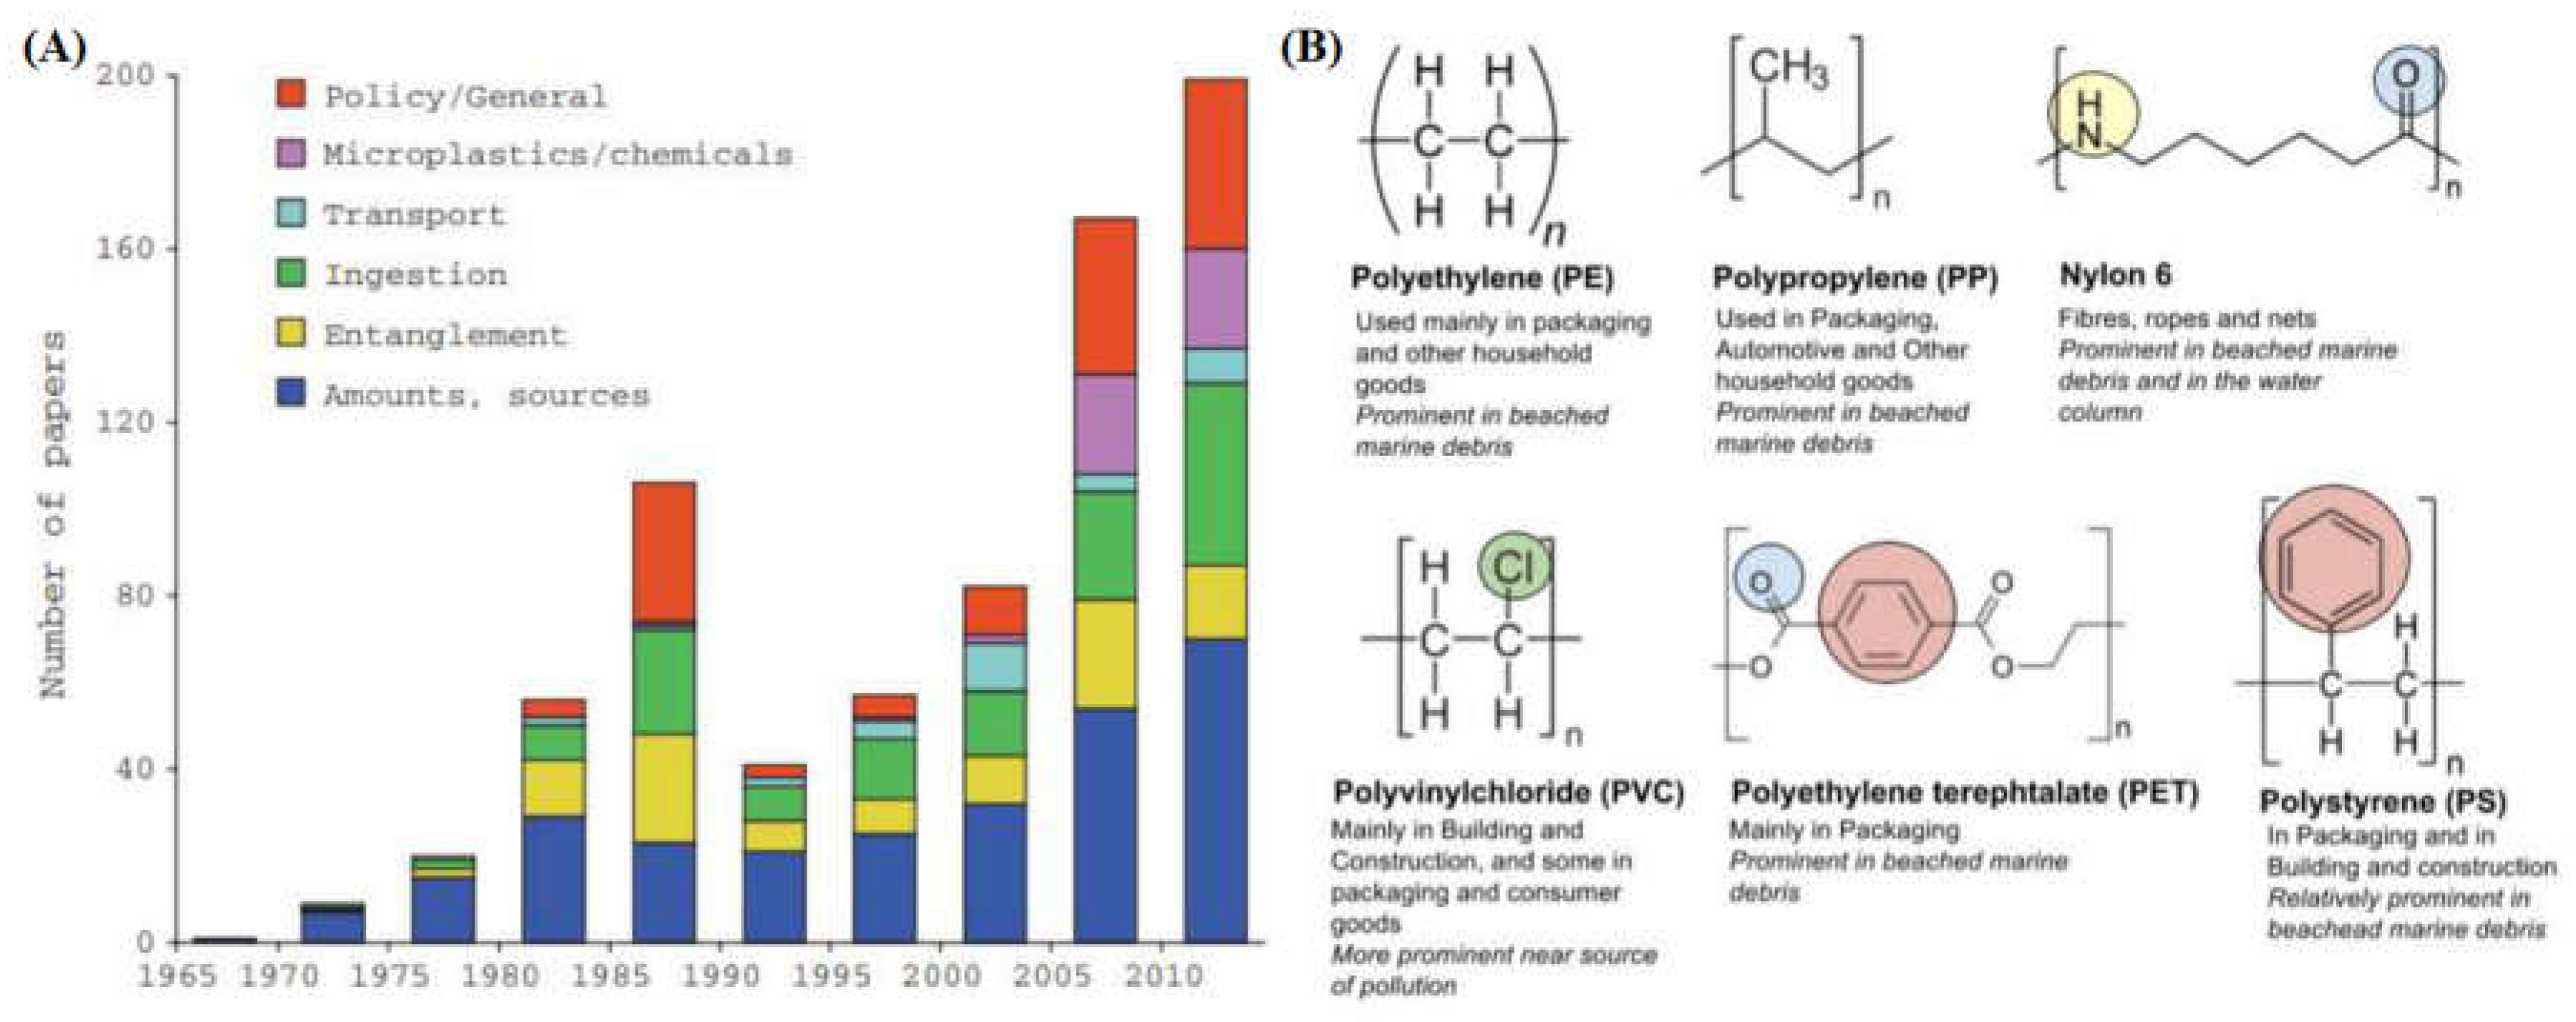
Figure 3.
Plastic concentration was detected by Curie pyrolysis characterization of blood samples from approximately 80% of 22 healthy volunteers. PE, PS, and PET are among the most abundant of plastic type [20].
Figure 3.
Plastic concentration was detected by Curie pyrolysis characterization of blood samples from approximately 80% of 22 healthy volunteers. PE, PS, and PET are among the most abundant of plastic type [20].
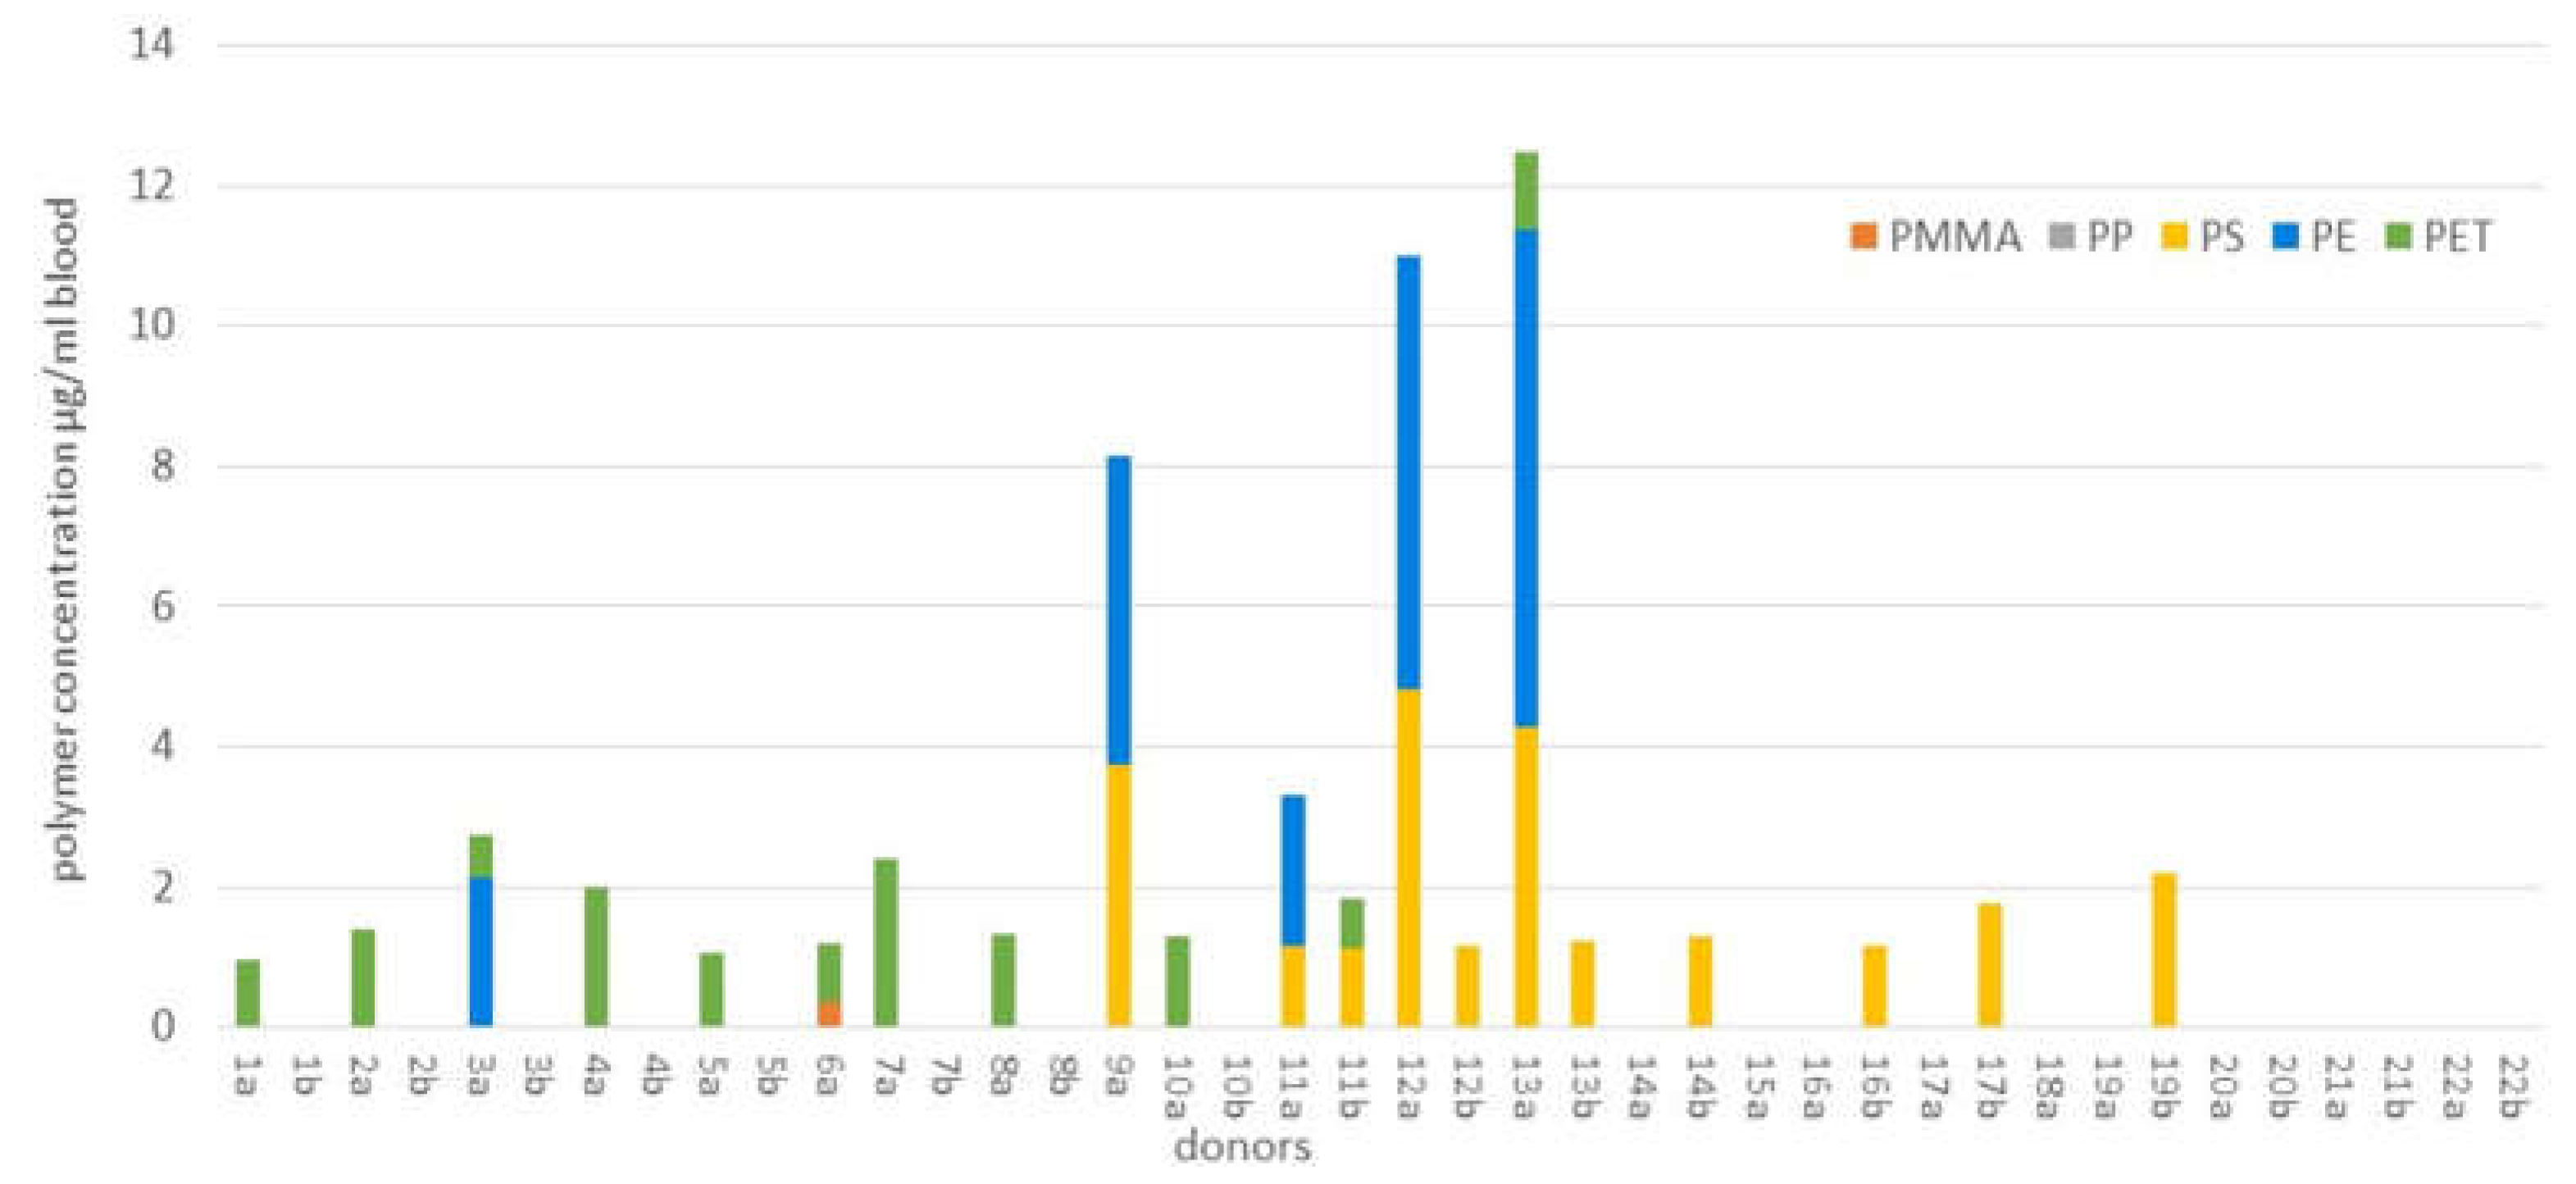
Figure 4.
(A) General ATR-FTIR spectra of PP, HDPE, LDPE, high-density polyethylene terephthalate (HDPET), low-density polyethylene terephthalate (LDPET), OPE (oxidized-PE), NL (Nylon), PS, and TF (p-tetrafluorethylene) (a-i). (B) ATR-FTIR spectra of PP/PET/Nylon/PS. (C) Effect of environmental weathering on PE, PP, and PET MPL FTIR spectra. (D) Particle type of atmospherically deposited MPLs in Dongguan. (E) Extent of atmospheric deposition of MPLs measured in the urban and suburban Parisian landscape [6,22,23,24].
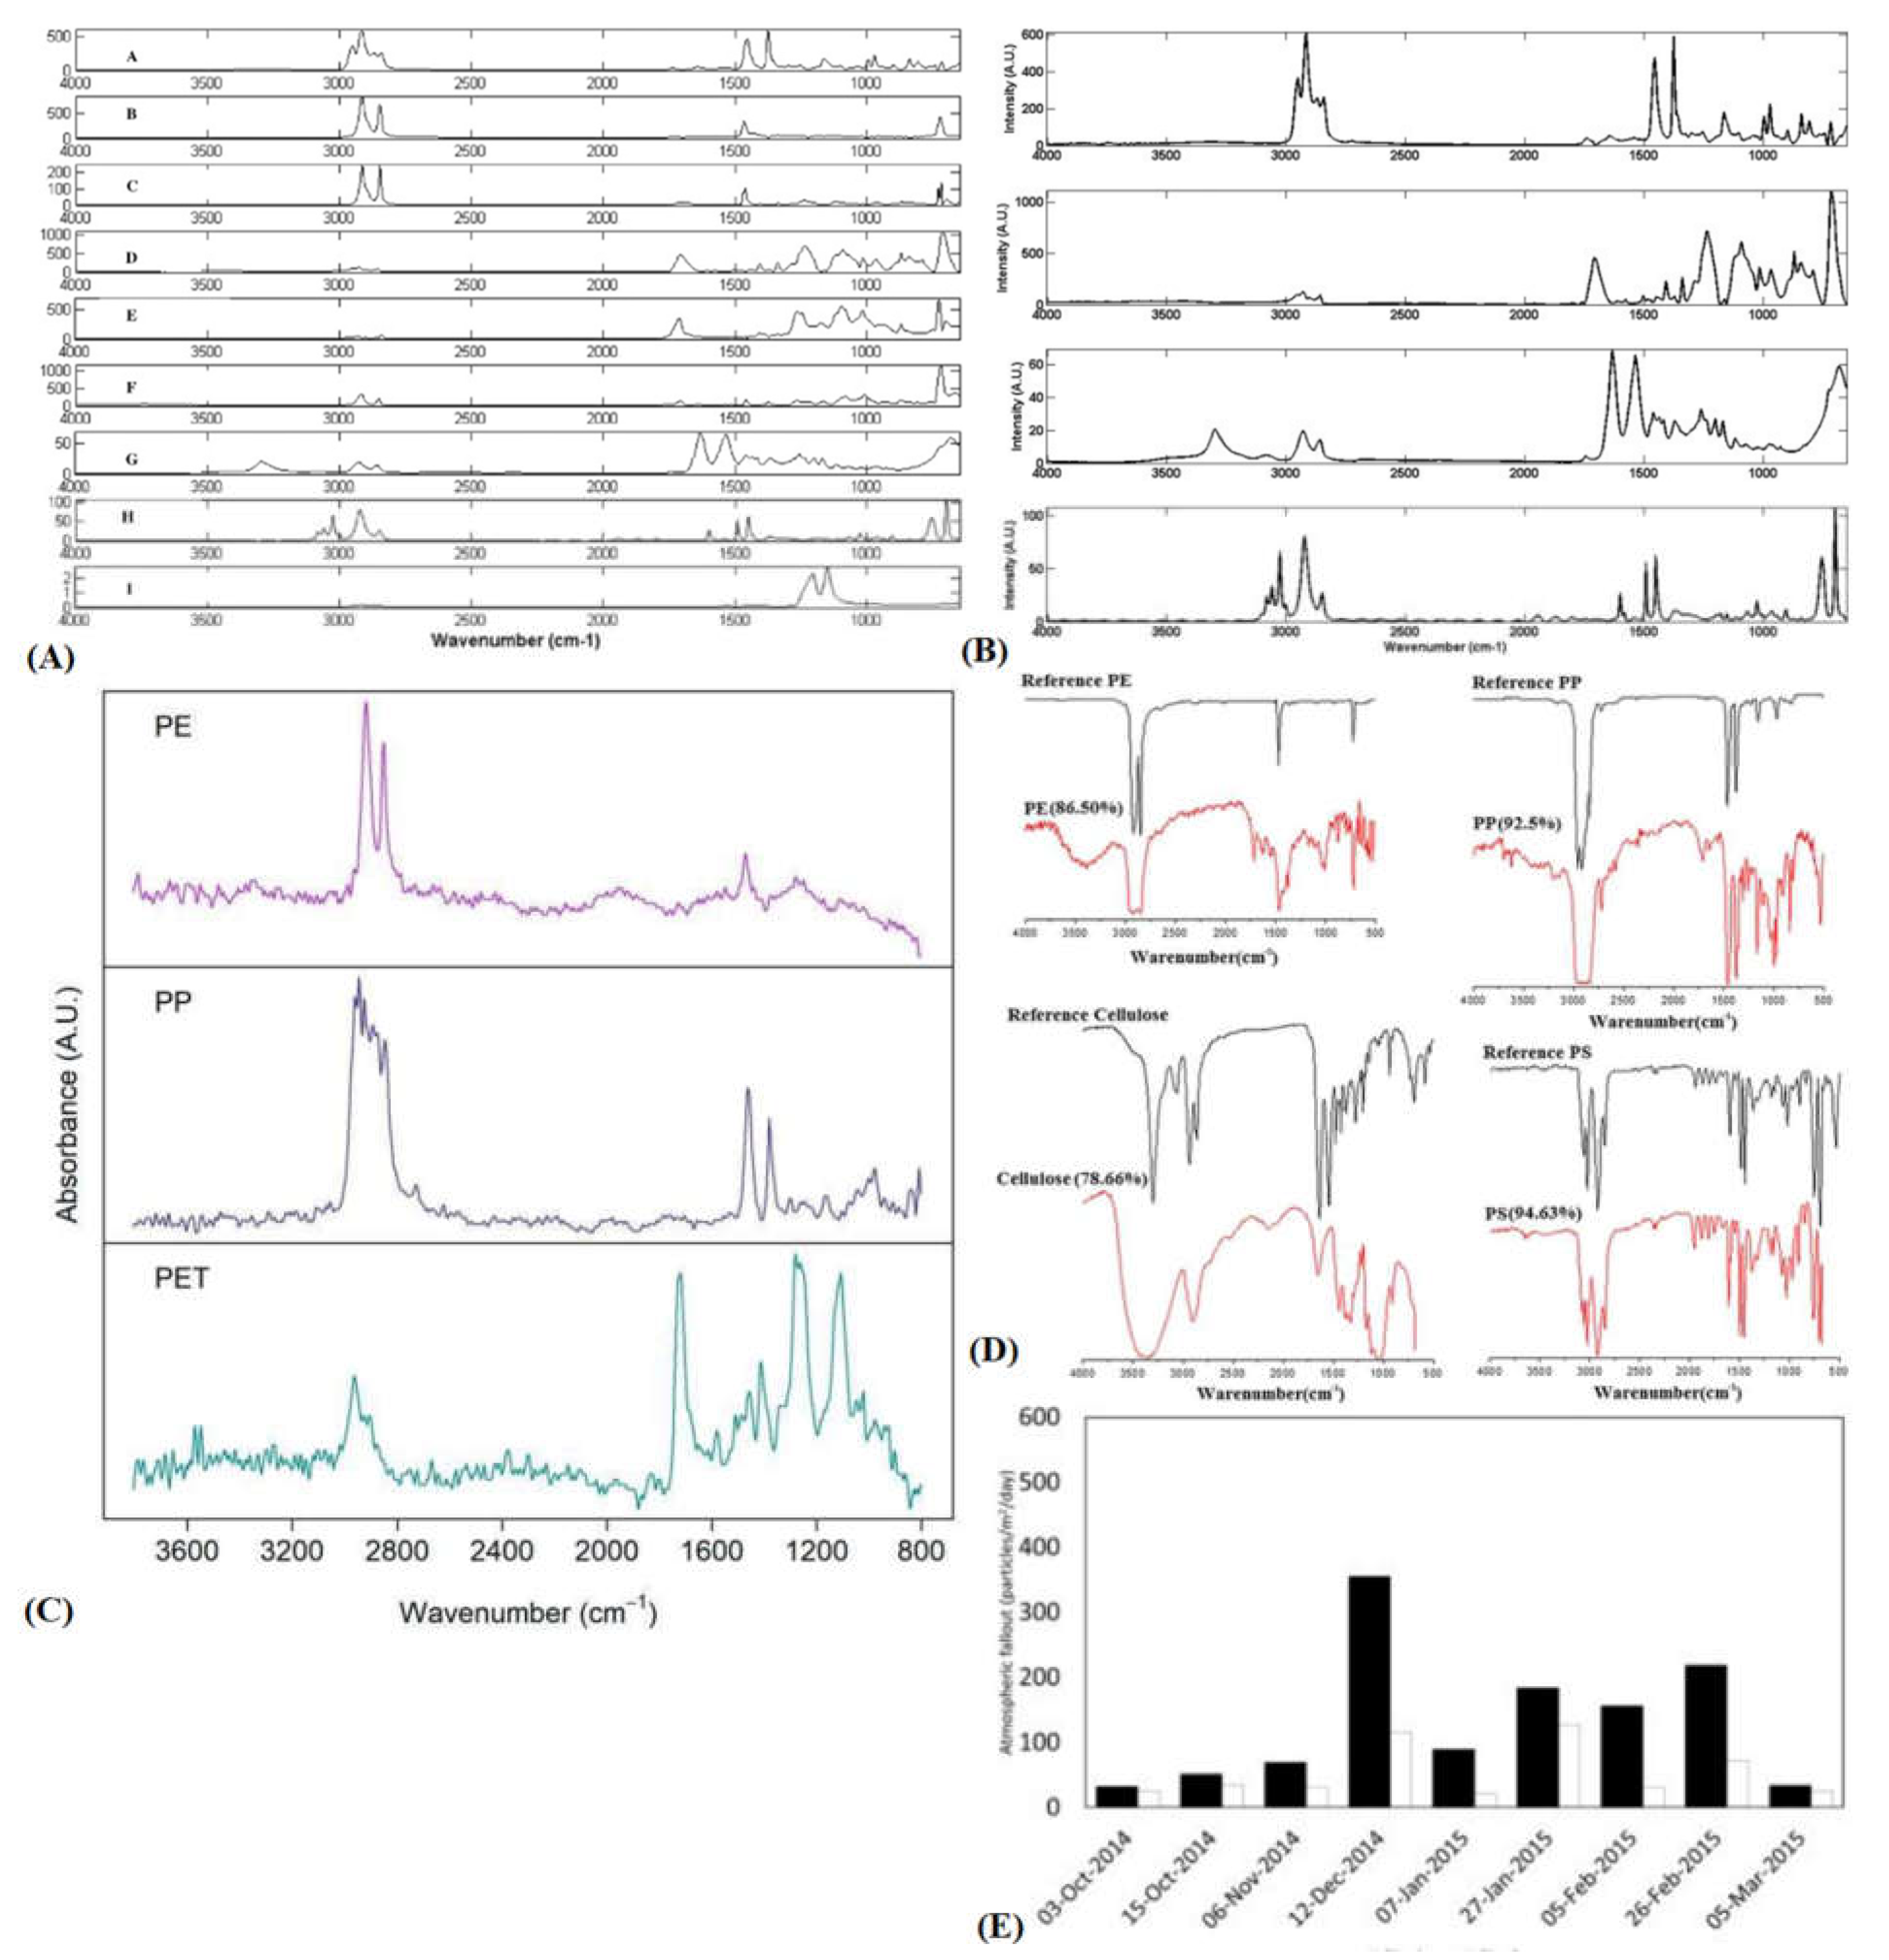
Figure 5.
(A) PP oxidation extent over time: introduction of hydroxyl, carbonyl, and peroxide species. (B) Effects of HDPE, LDPE, PP, and PS mechanical weathering from 0 to 442 hours. (C) Effect of red and green pigment on plastic sample towards lower wave number regions [25,26].
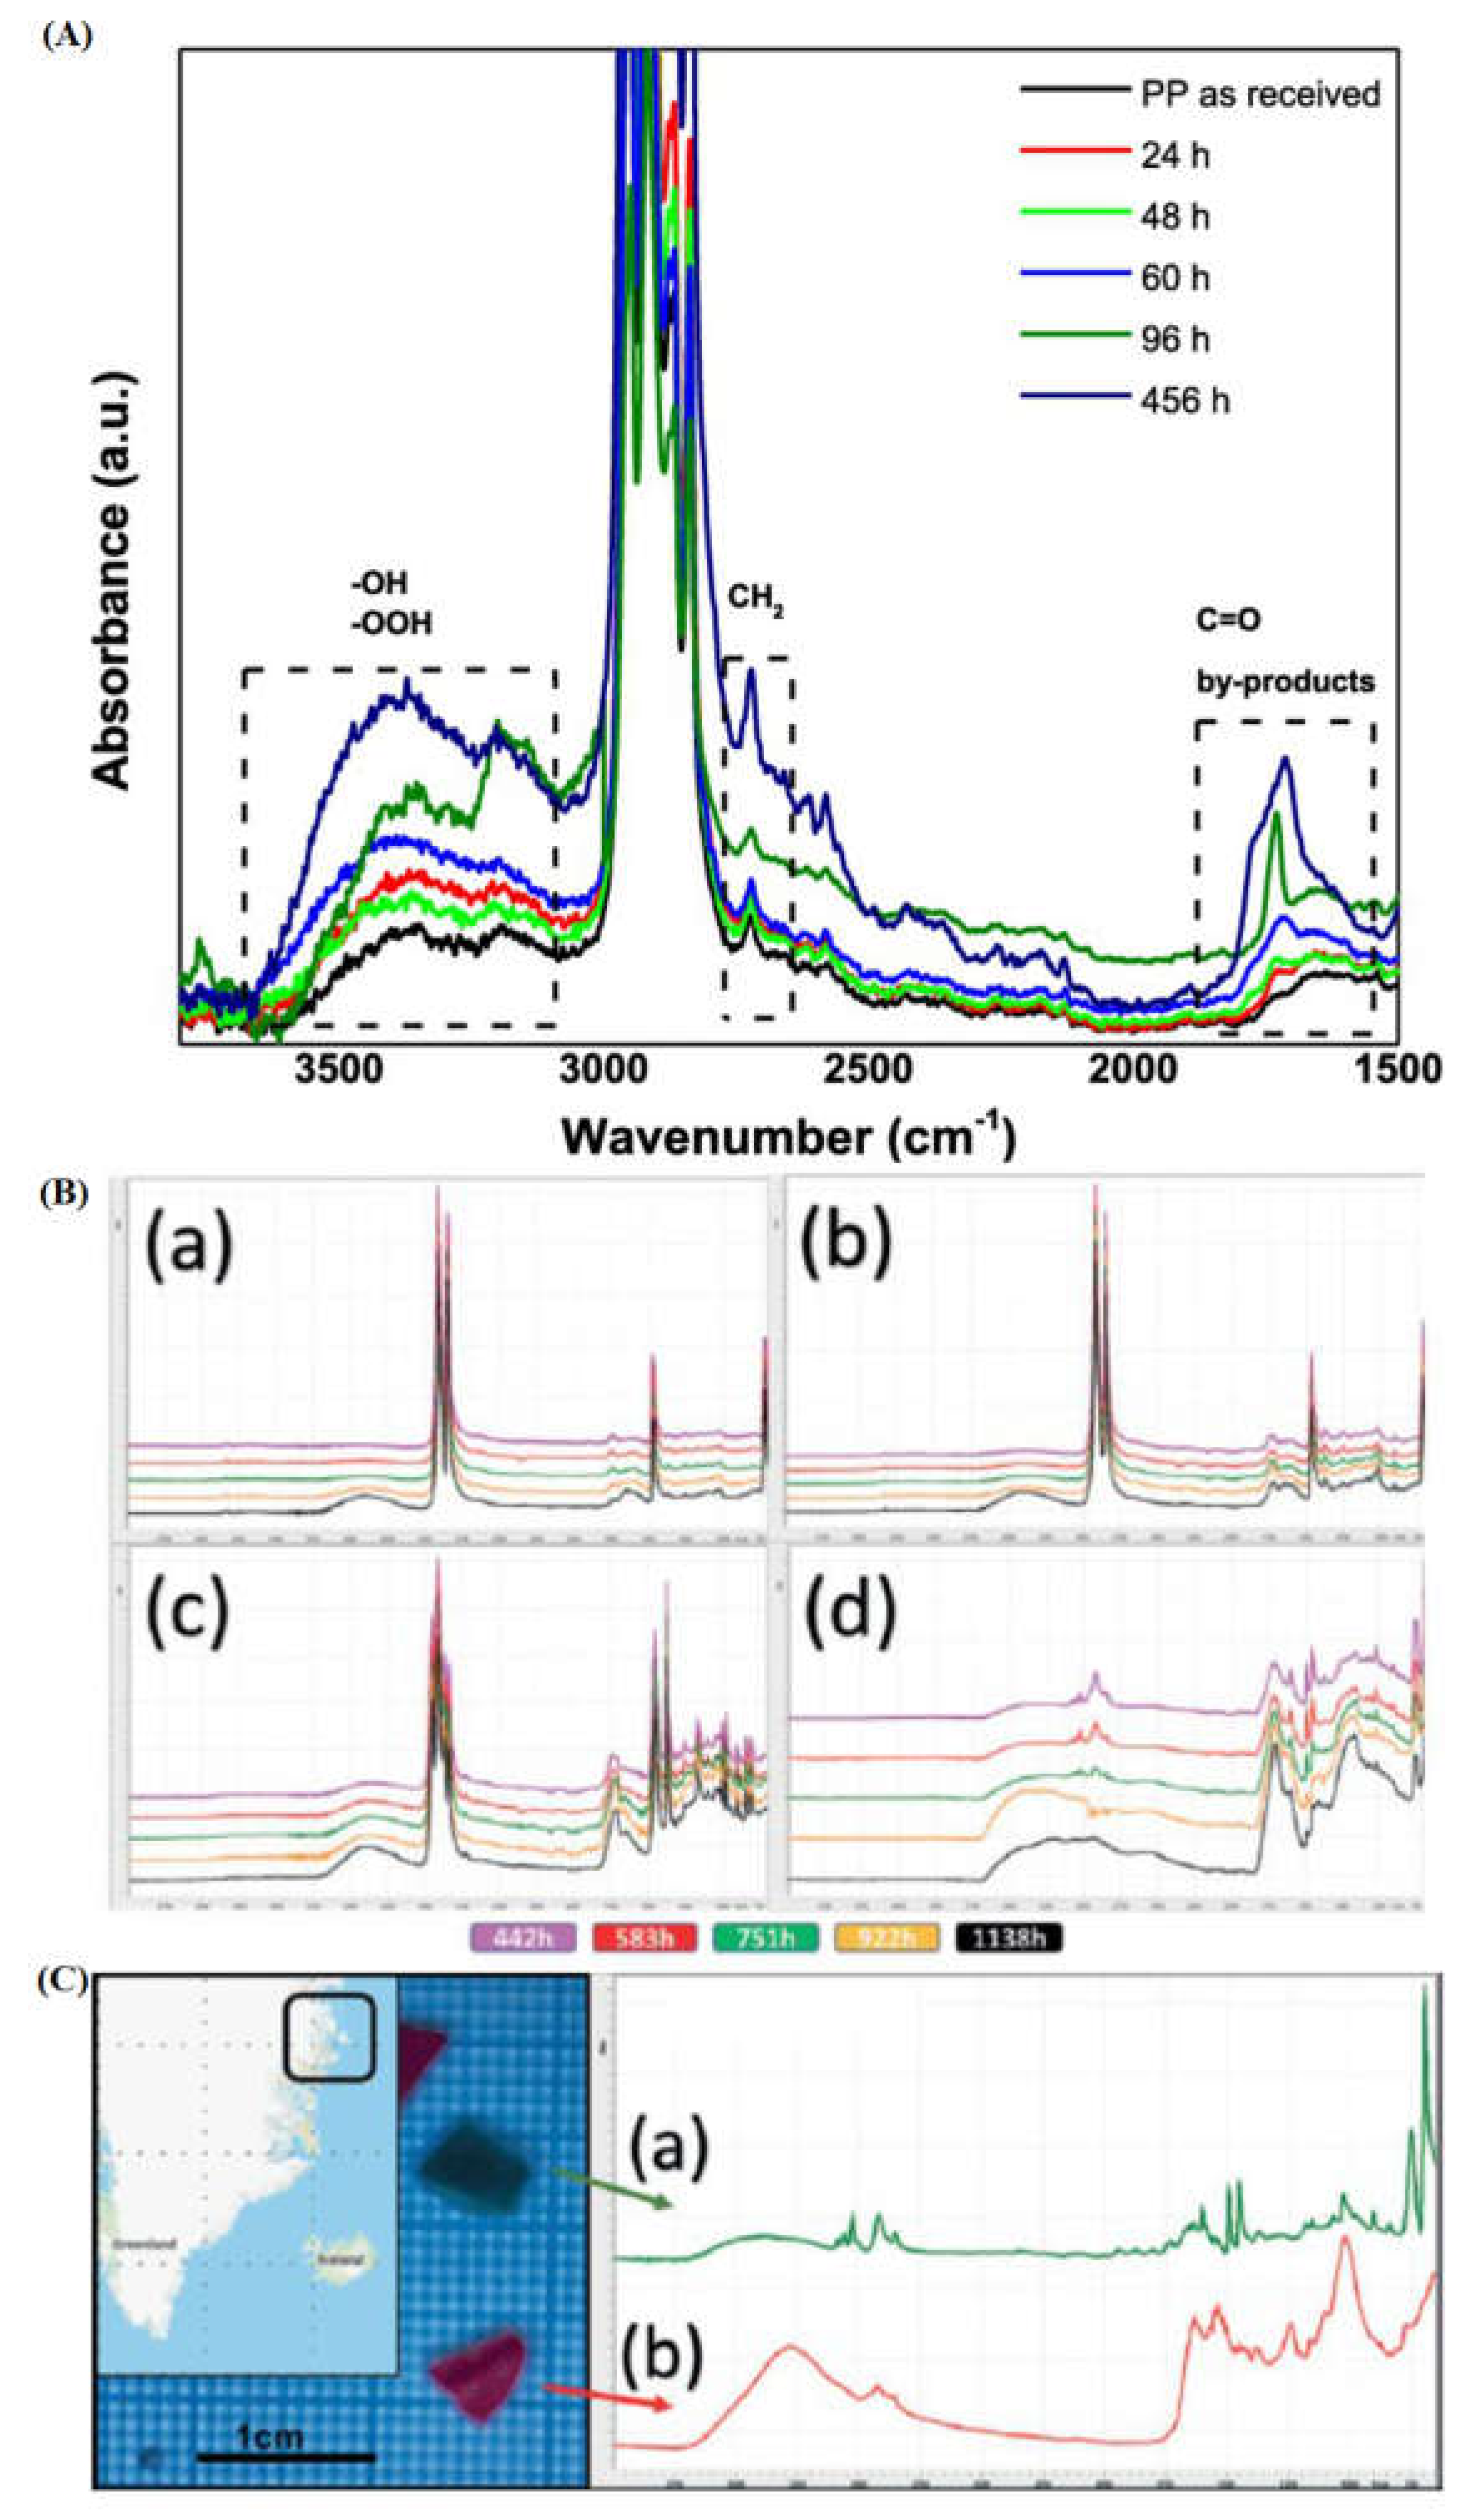
Figure 6.
(A,B) Typical Raman spectra for bulk PE, PP, PS, PET, PVC, and NA6 with notable peaks annotated. (C) Raman of plastic samples from South New Brighton beach compared to native plastics exhibit diminished peaks of intensity. (D) Coastal New Zealand PE/PP/PET plastic particle samples showing uncharacteristic noise. (E) Optical Raman tweezers showcasing PET, PVC, PP, and PMMA MPL identification as well as PA6 and PE NPLs (higher noise in nanoregime). (F) Optical tweezer mode differentiates particle number and size regime due to intensity and noise of signal, respectively [22,28,29,30].
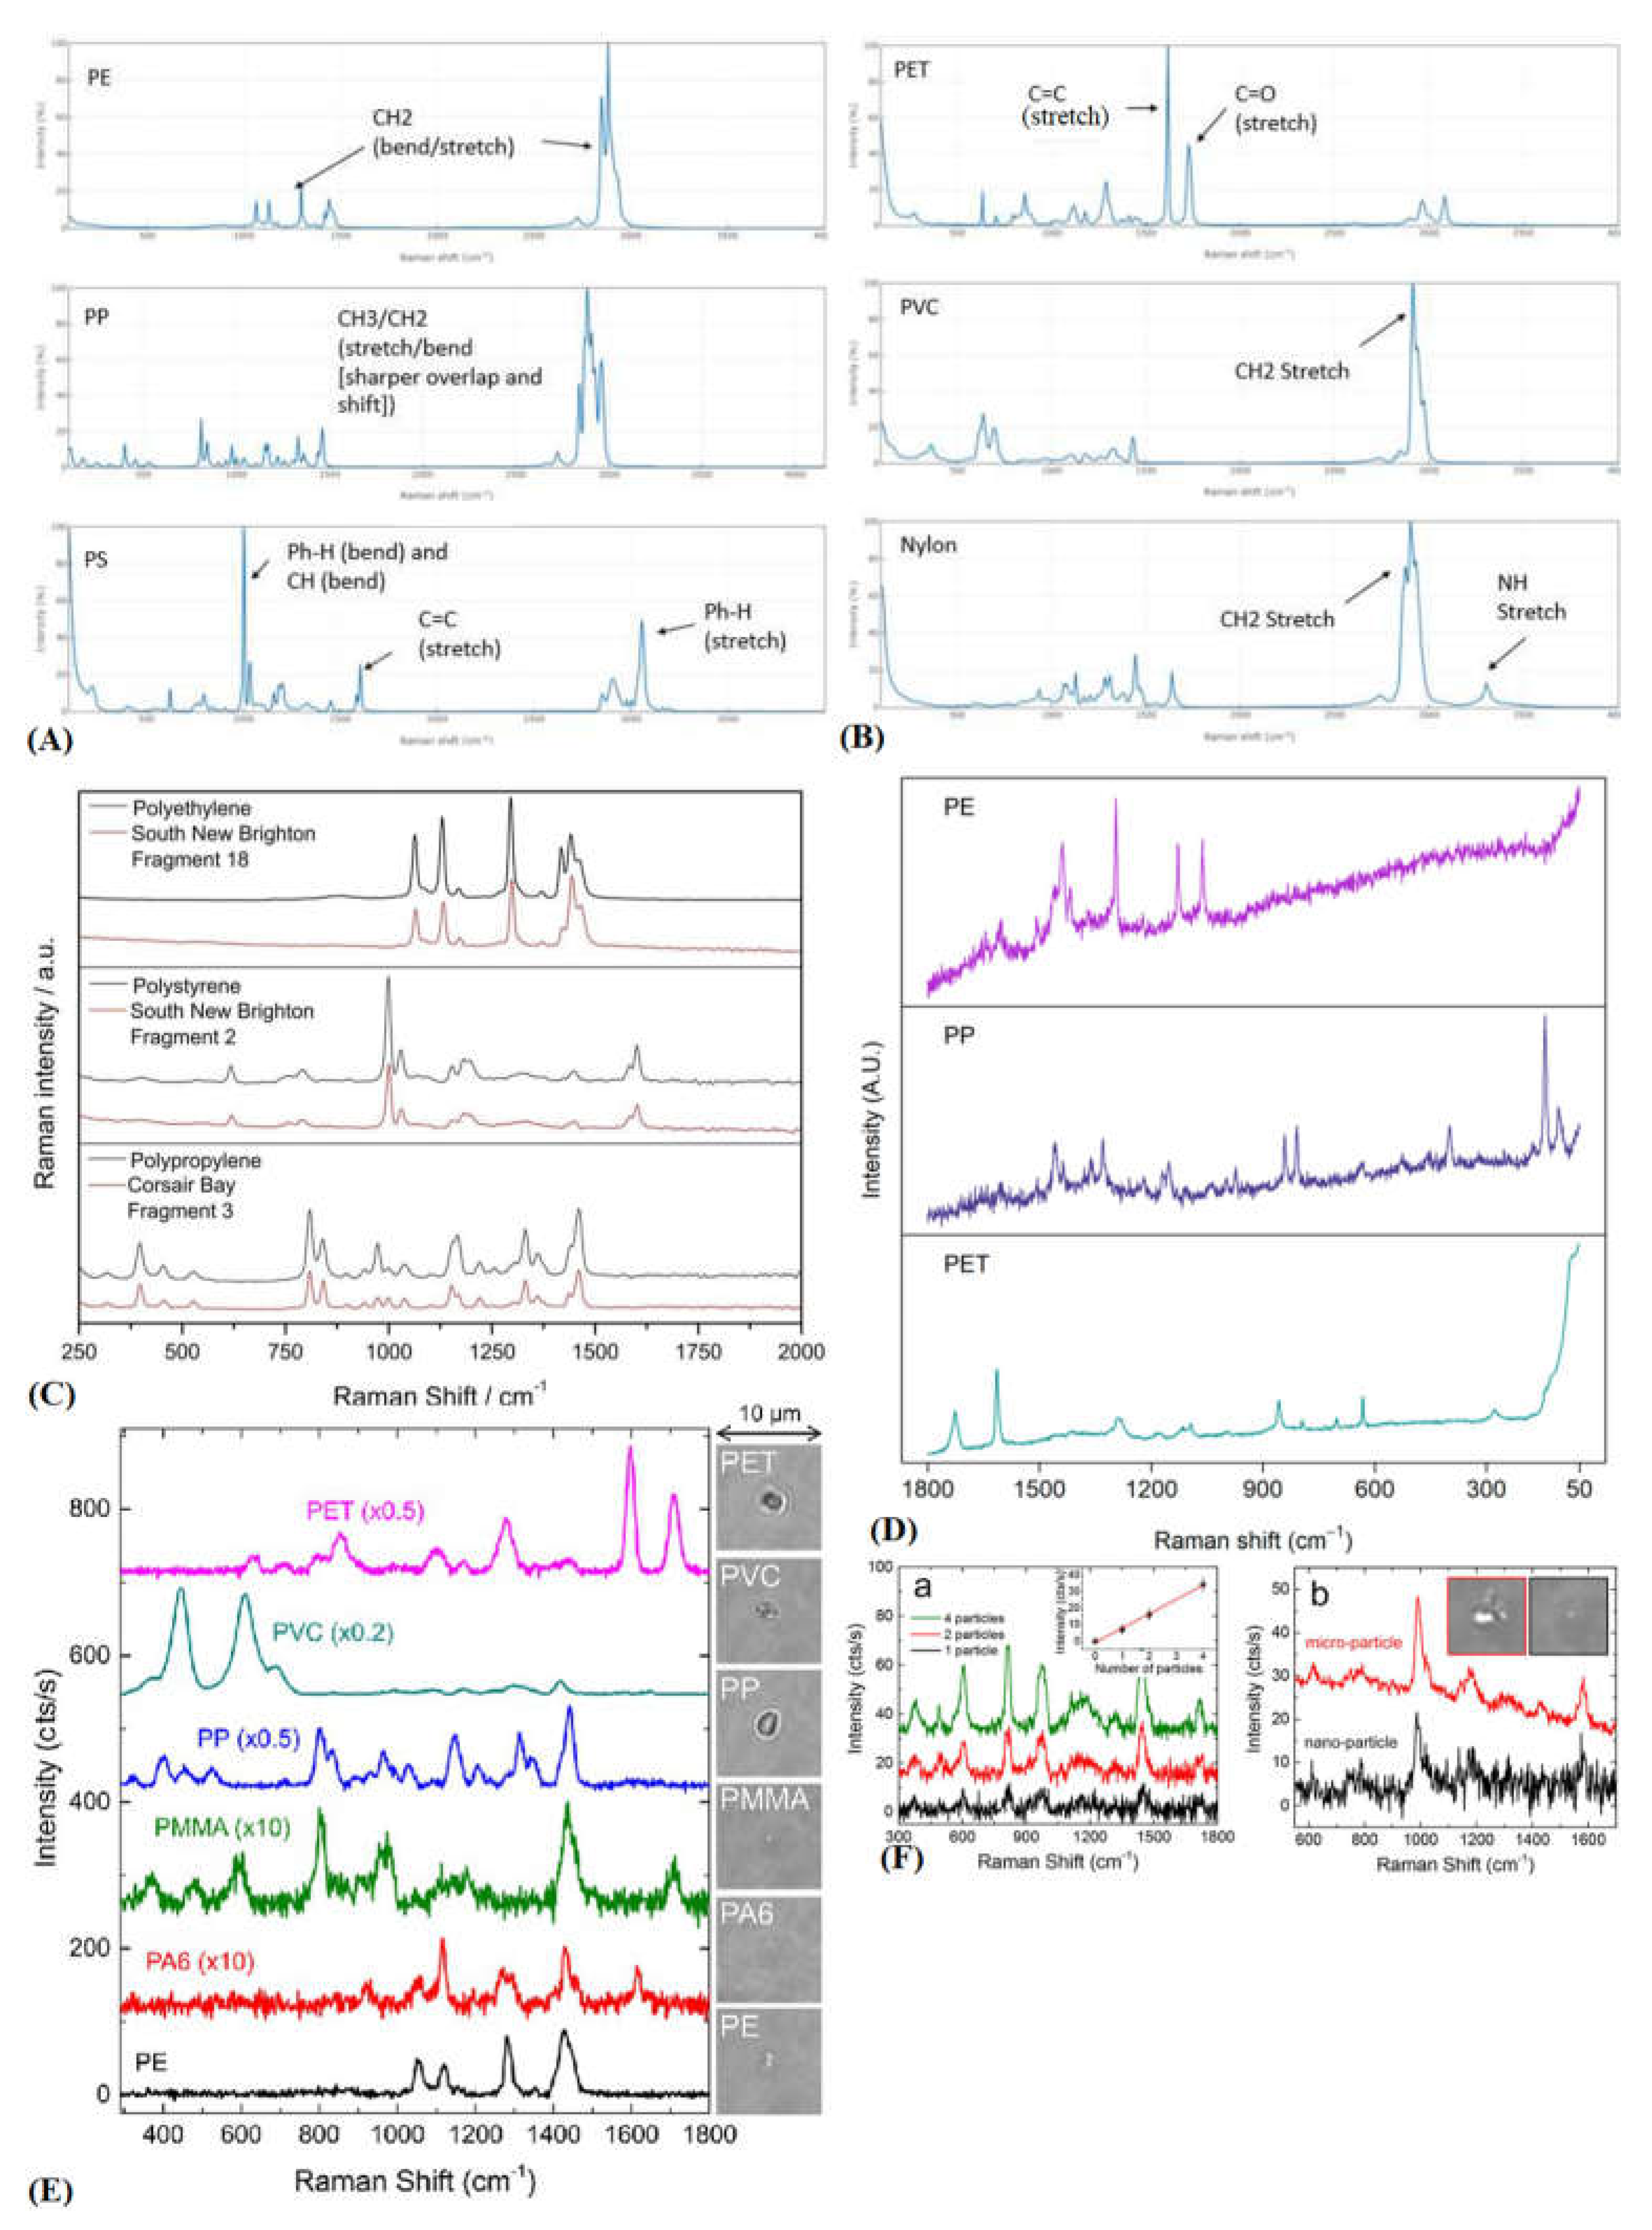
Figure 7.
(A) Raman spectrum of engineered PS nanoparticles incubated with environmental water sample forming detectable eco-corona. (B) Effect of blue pigmentation on lower Raman shift regime in sample of environmental macroscopic plastic particles. (C) Occlusion of characteristic PE peak in MPLs from advanced weathering. (D) Carbonyl peak formation in PE Raman spectra as a function of free radical oxidation [31,32,33].
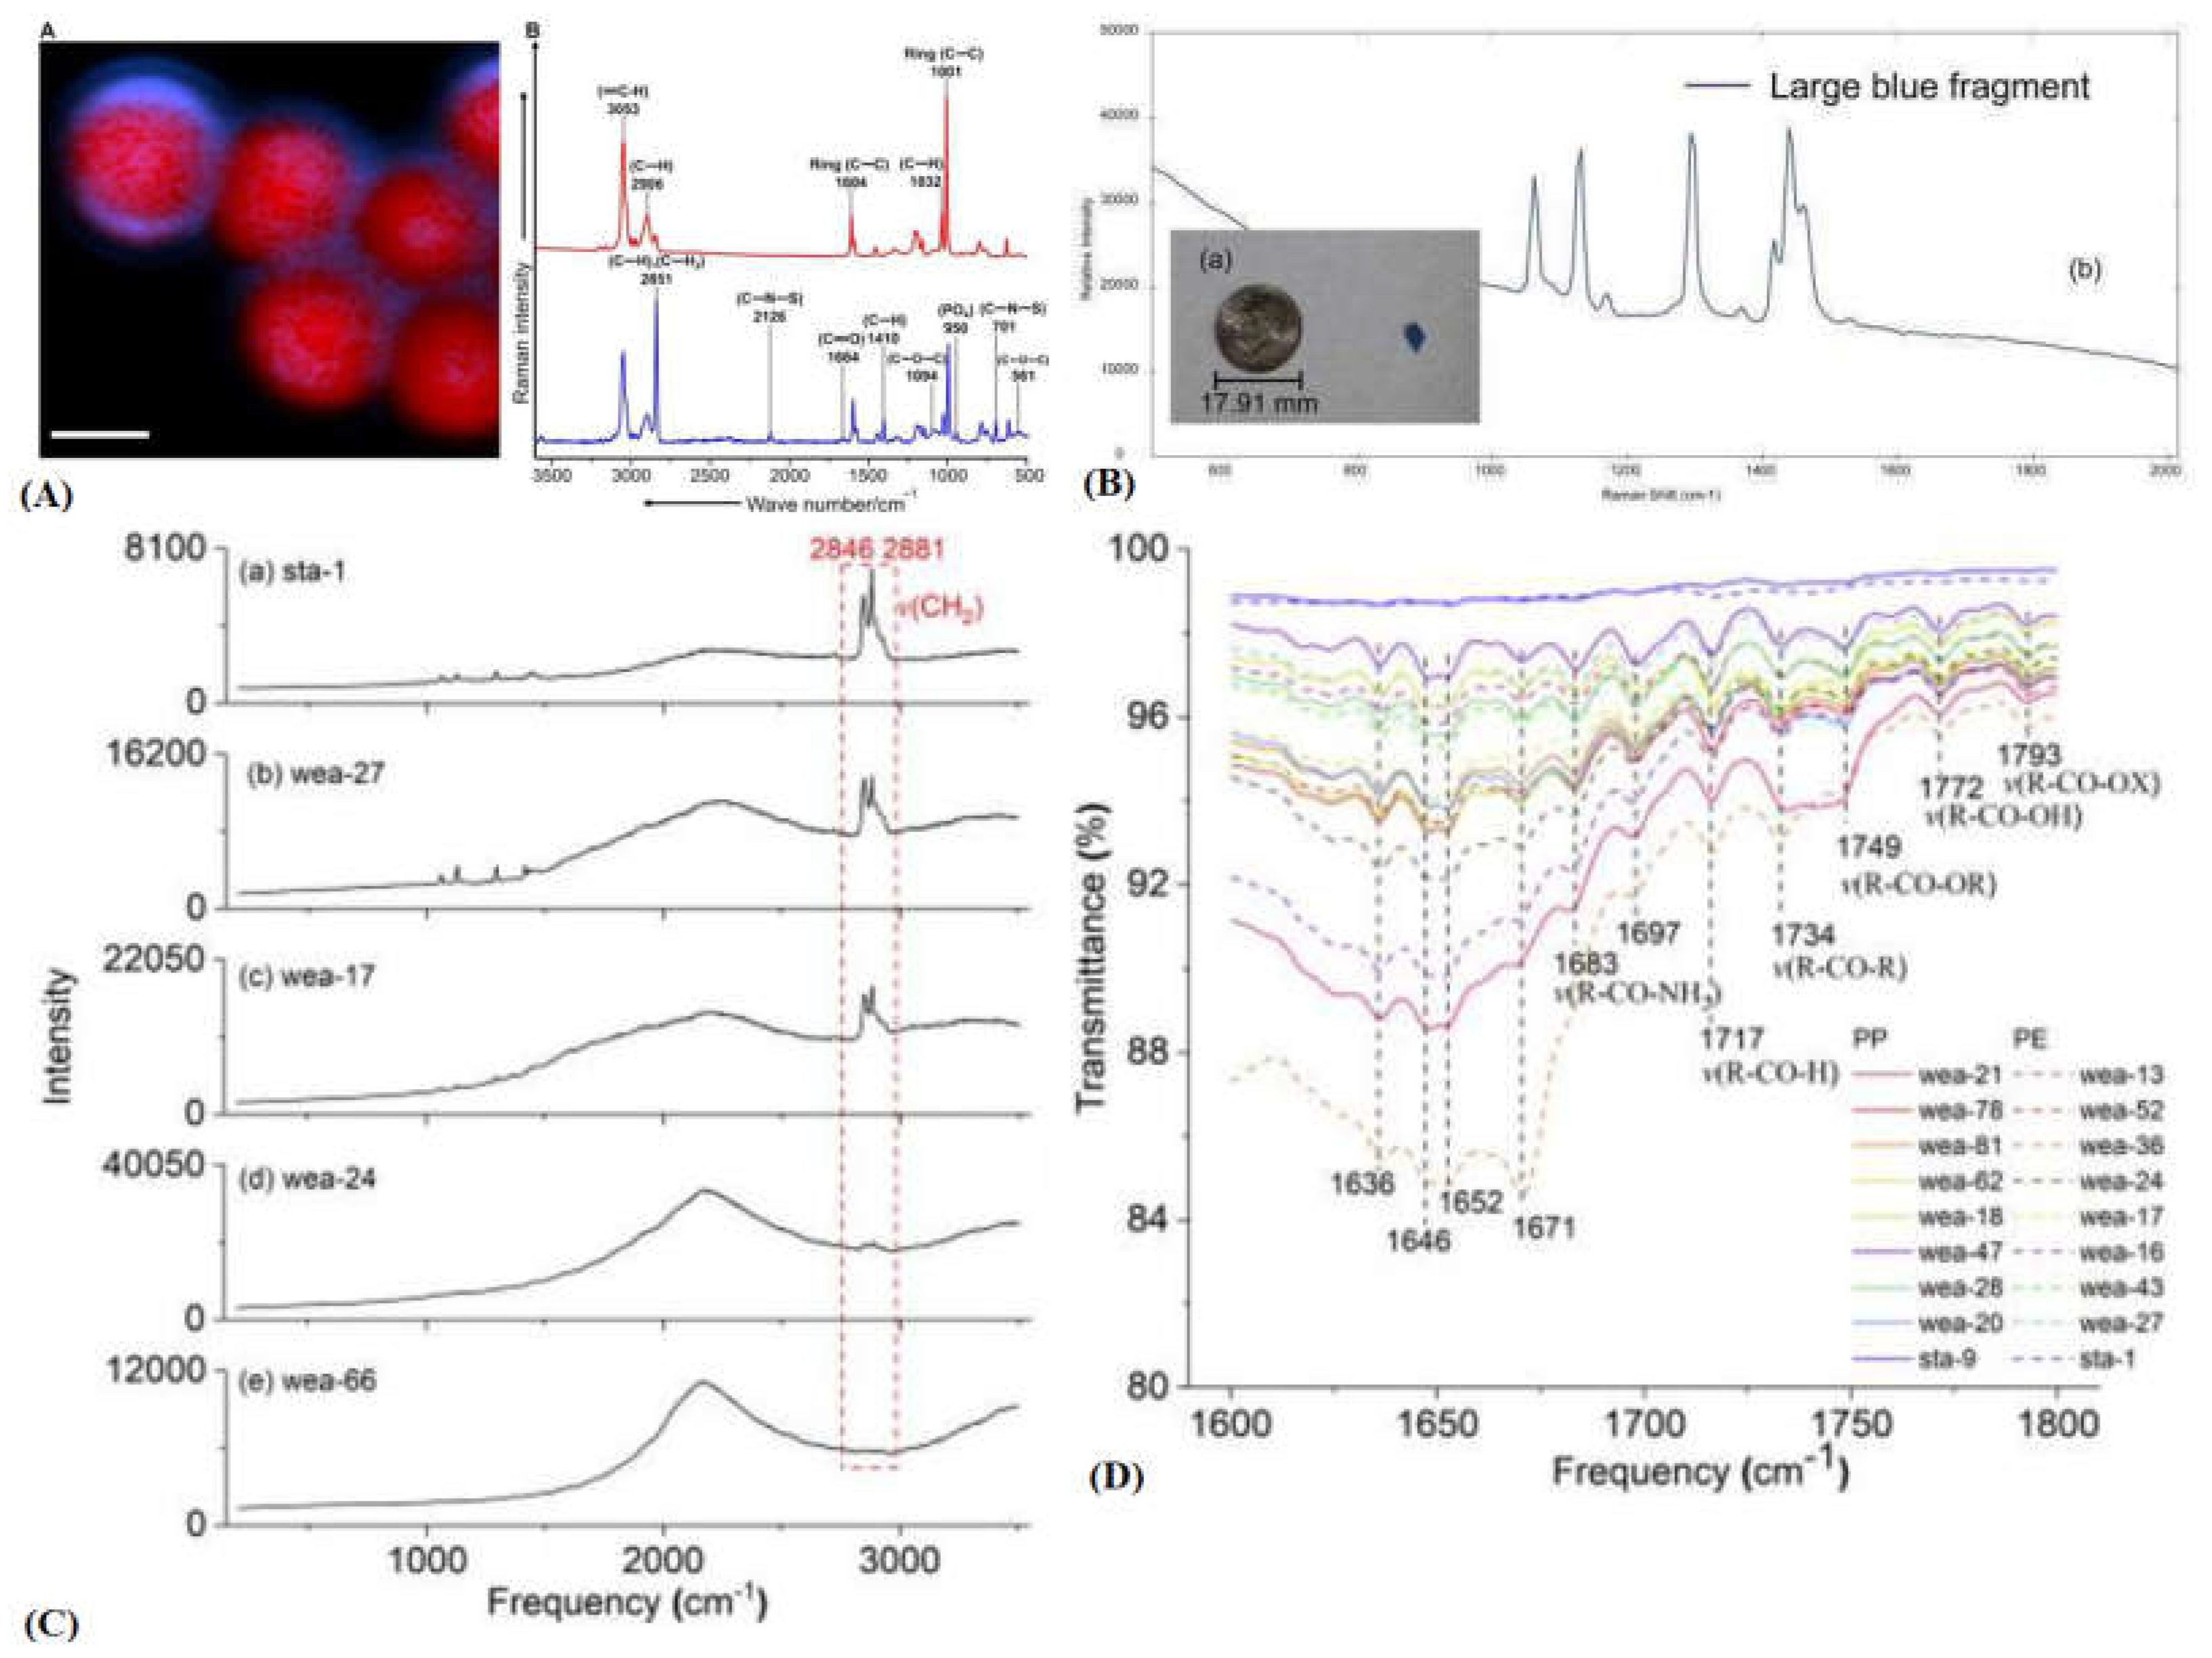
Figure 8.
(A) Typical H-NMR shifts for bond type and functional groups. (B) Formation of oxidation byproducts detected by H-NMR. (C) Curie Pyrolysis of non-spiked and spiked (control) tissue samples revealing concentration of plastics within marine life. (D) Timepoint analysis of extent measured by Curie pyrolysis and ICP-MS. (E) Ionic interactions of COOH-NPLs to positively charged-AuNPs for more accurate quantification and detection down to single particle discrepancy [34,36,37,38,39].
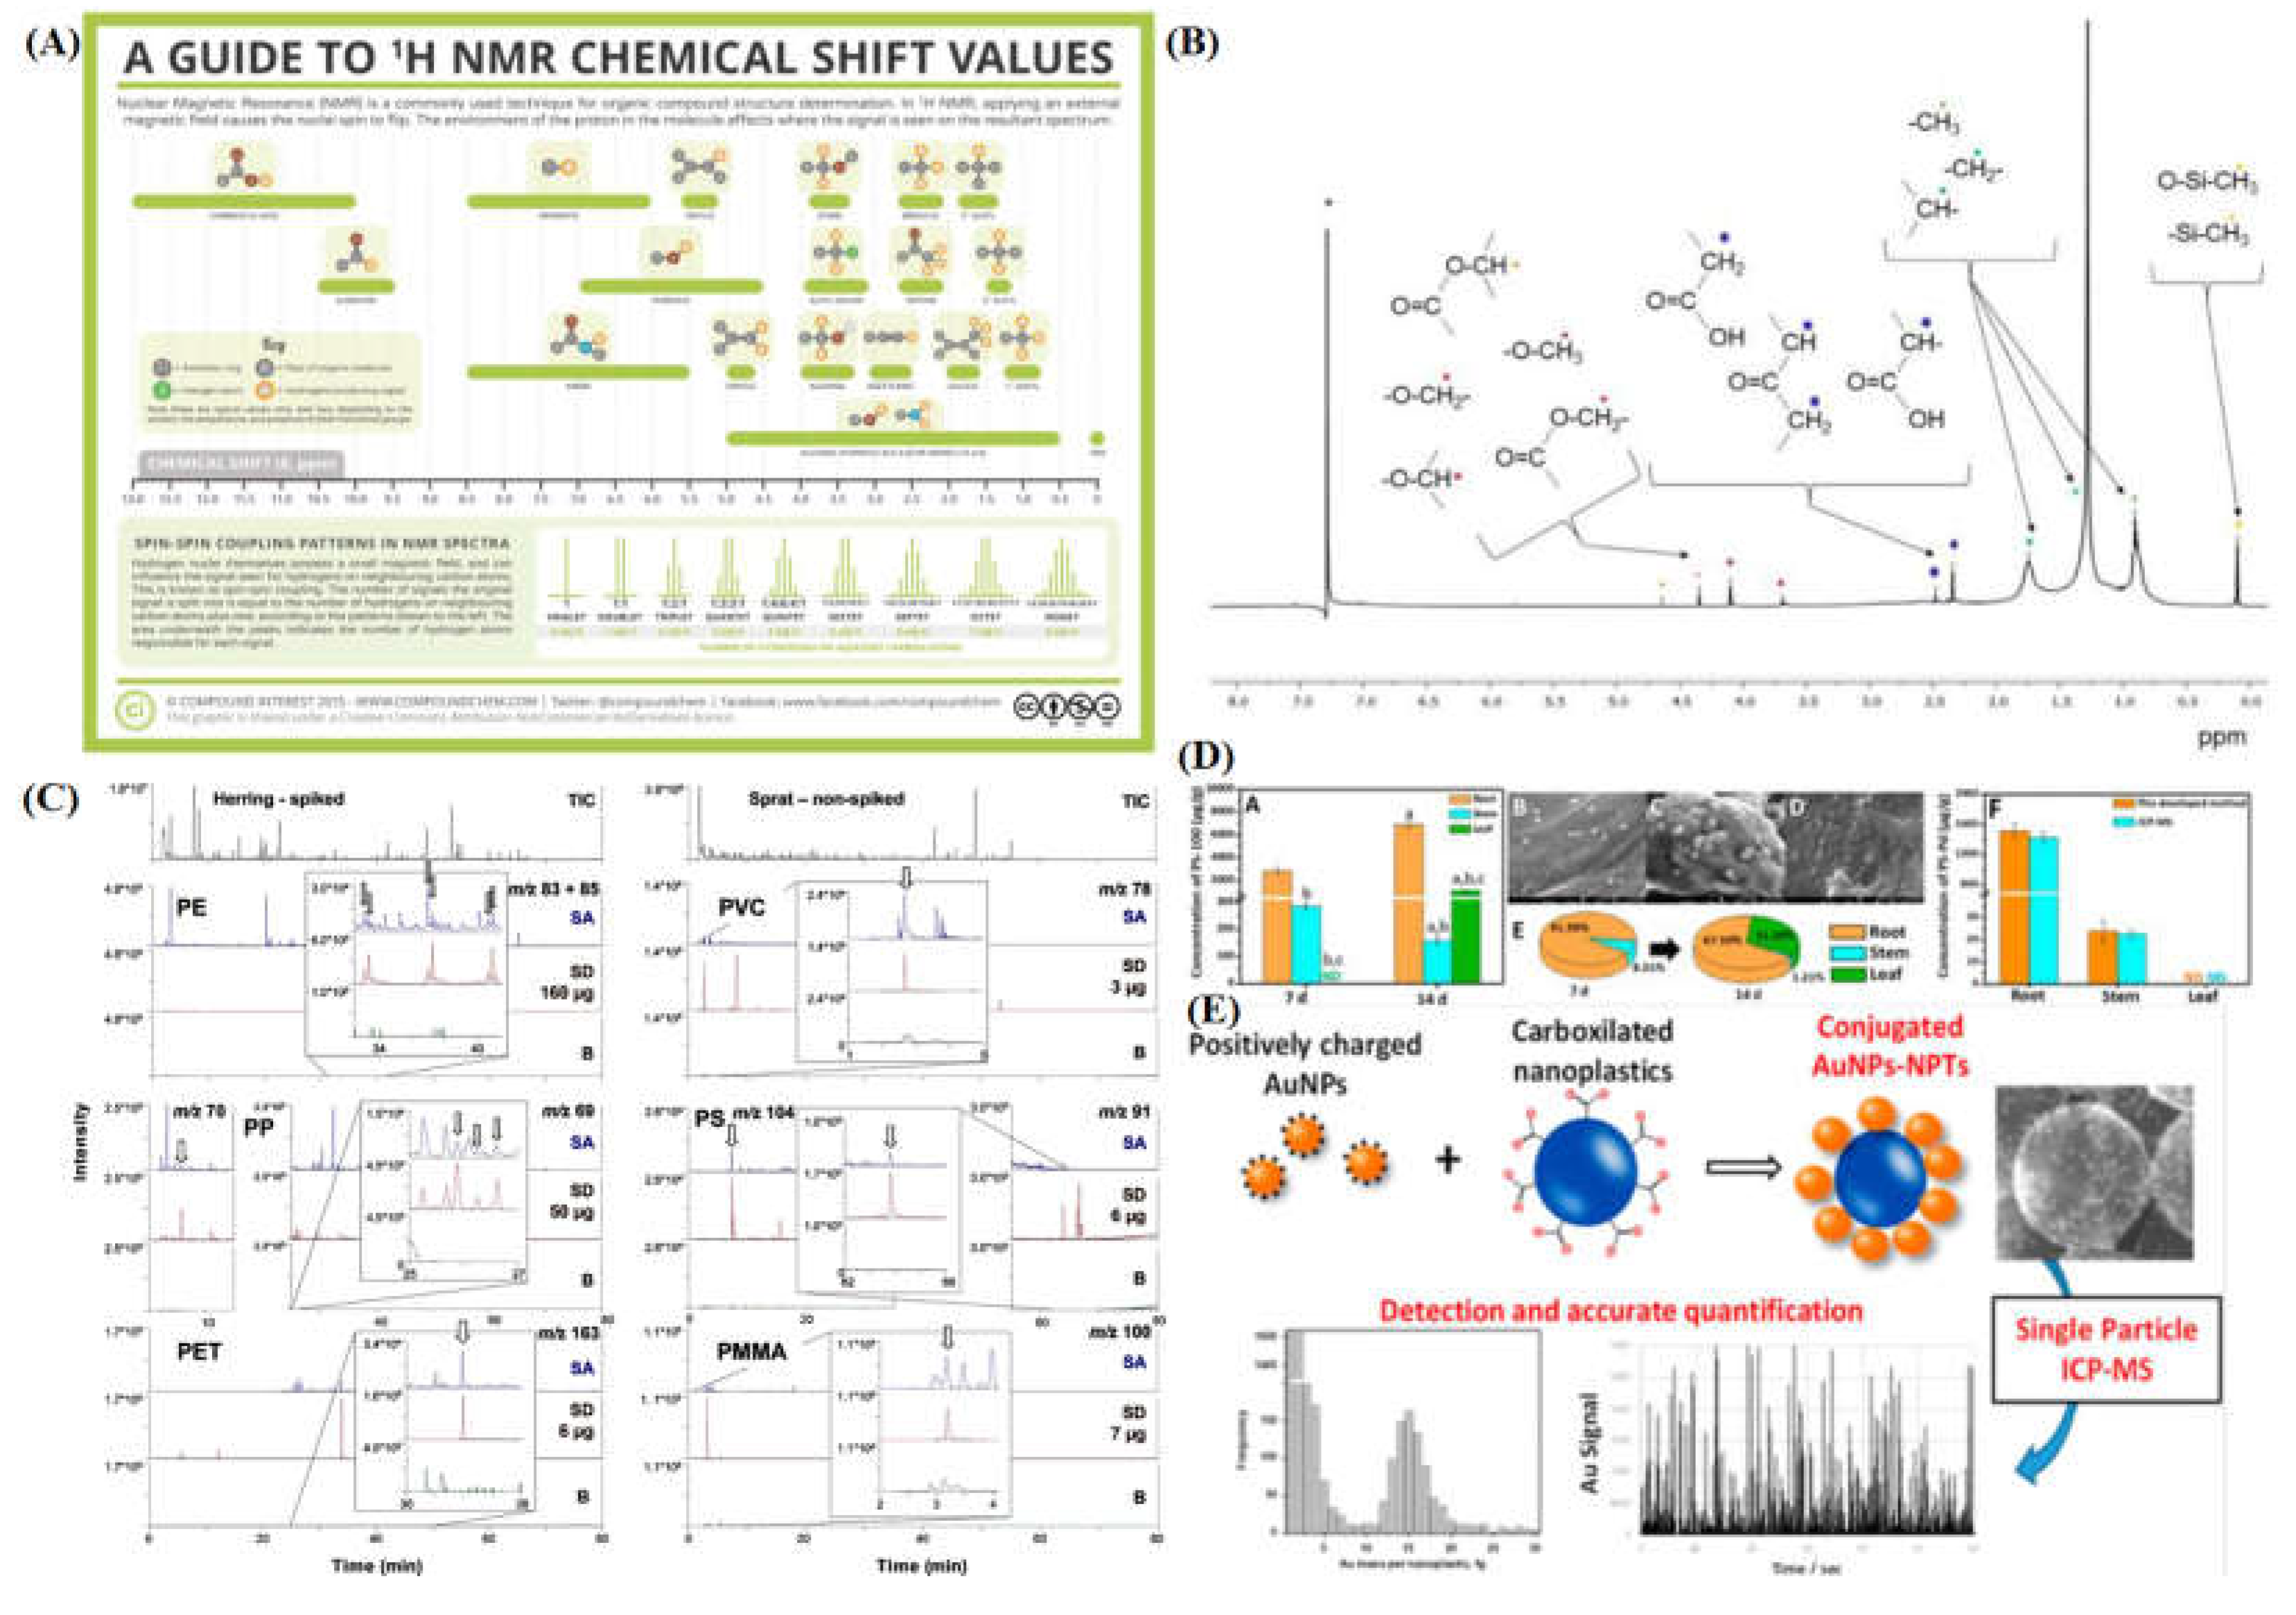
Figure 9.
(A) Diagram of magPOM-SOLP nanoparticles capable of extracting microplastics and other contaminants through magnetic decantation. (B) General setup of cellulose matrix (composite of PEI) filtration. (C) Efficiency of electrocoagulation remediation measured by turbidometry on treatments of spiked MPL wastewater effluent samples over time. (D) NTA of evolved MPL and NPL particle concentration from PS irradiated with UV over time. (E) FFF-MALS general setup featuring parabolic flow aiding in the separation of particles by size and physiochemical nature (when external fields are applied). (F) TGA-DSC analysis of wastewater effluent samples reporting various concentrations of PE, PP, polyamide (PA), PET, polyethersulfone (PES), PVC, and polyurethane (PU) with PE and PP being the clearest signal to giving higher rationale for higher abundance in comparison to the other plastics [43–45,50,51,54.

Figure 10.
(A) SEM images of PE MPLs with noticeable oxidation along their striations and cracks. (B) STXM spatial characterization of bonds present within lab-engineered PET NPLs. (C) Nile red staining of PE plastic particles visible with fluorescence microscopy giving visual discernment in a heterogeneous sample [5,54,56].
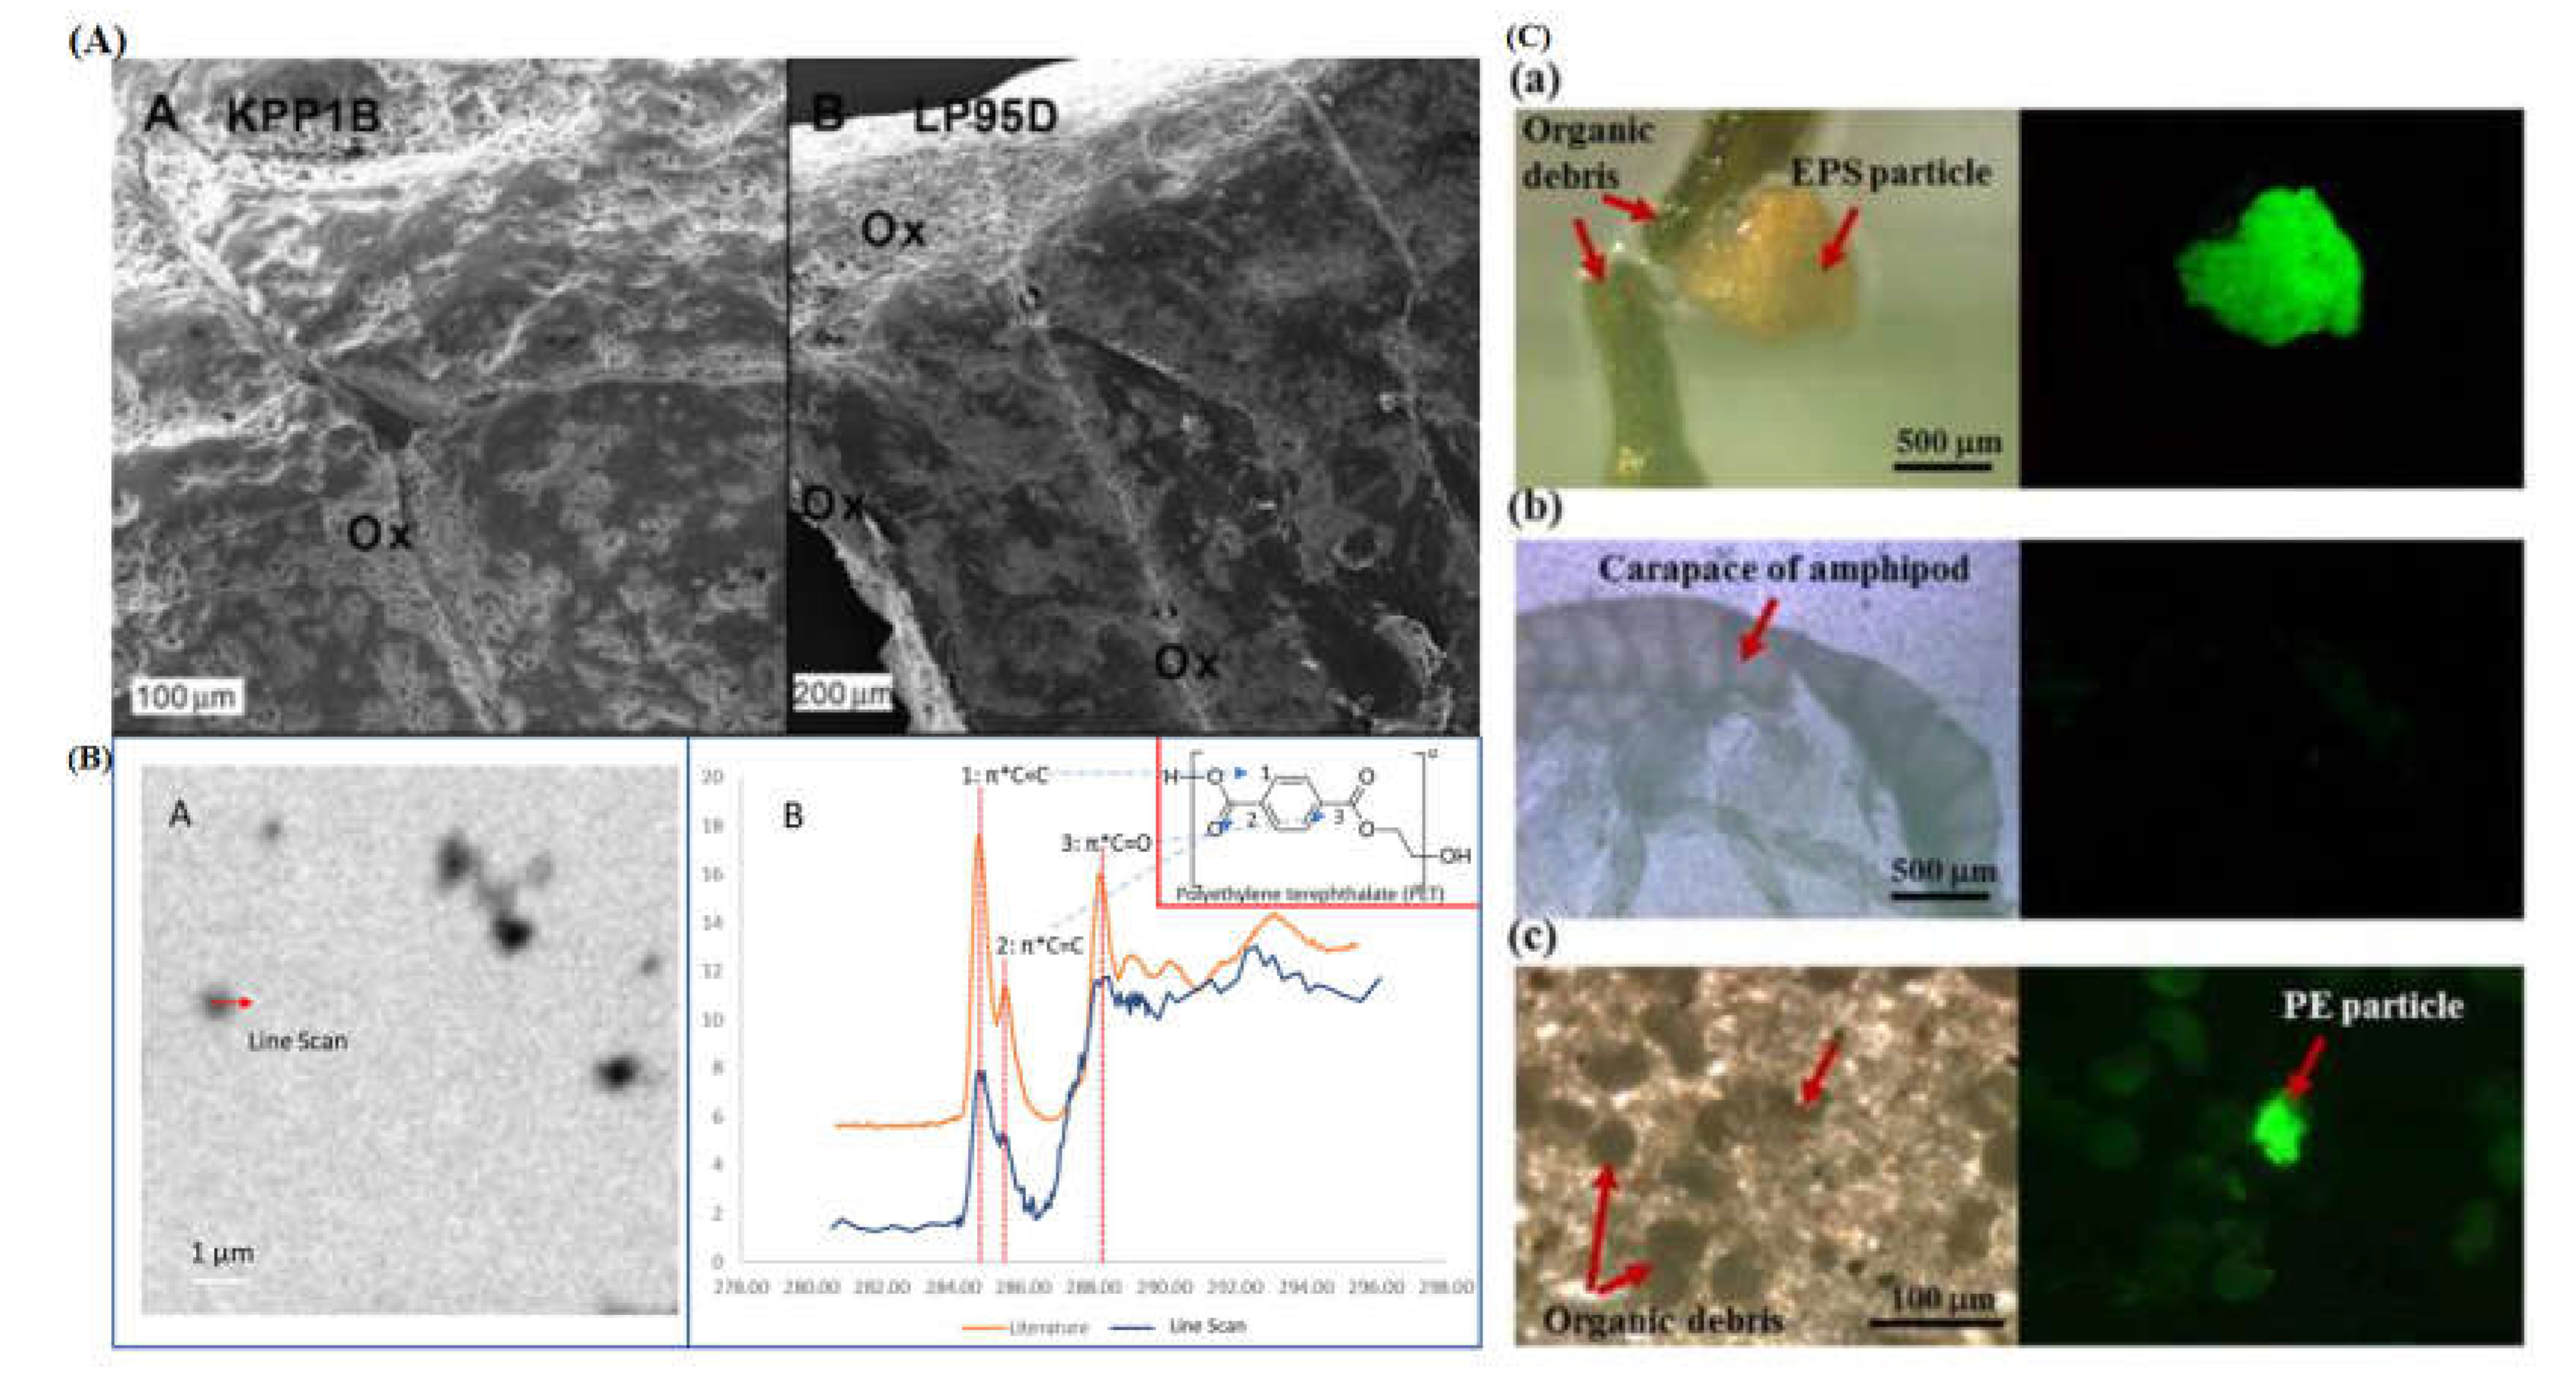
Figure 11.
(A) Fractogram of three treatment groups and a control of C. robusta tissue exposed to 100 nm PS NPLs over time with plus 100 nm results theorized to be aggregation from surface energy minimization. (B) Density separation method efficiently using ZnCl2 to remove various types of MPLs from spiked estuarine sediment. (C) Environmental study measuring the concentration of MPLs per kilogram using an oleophilic separation method [59,61,63].
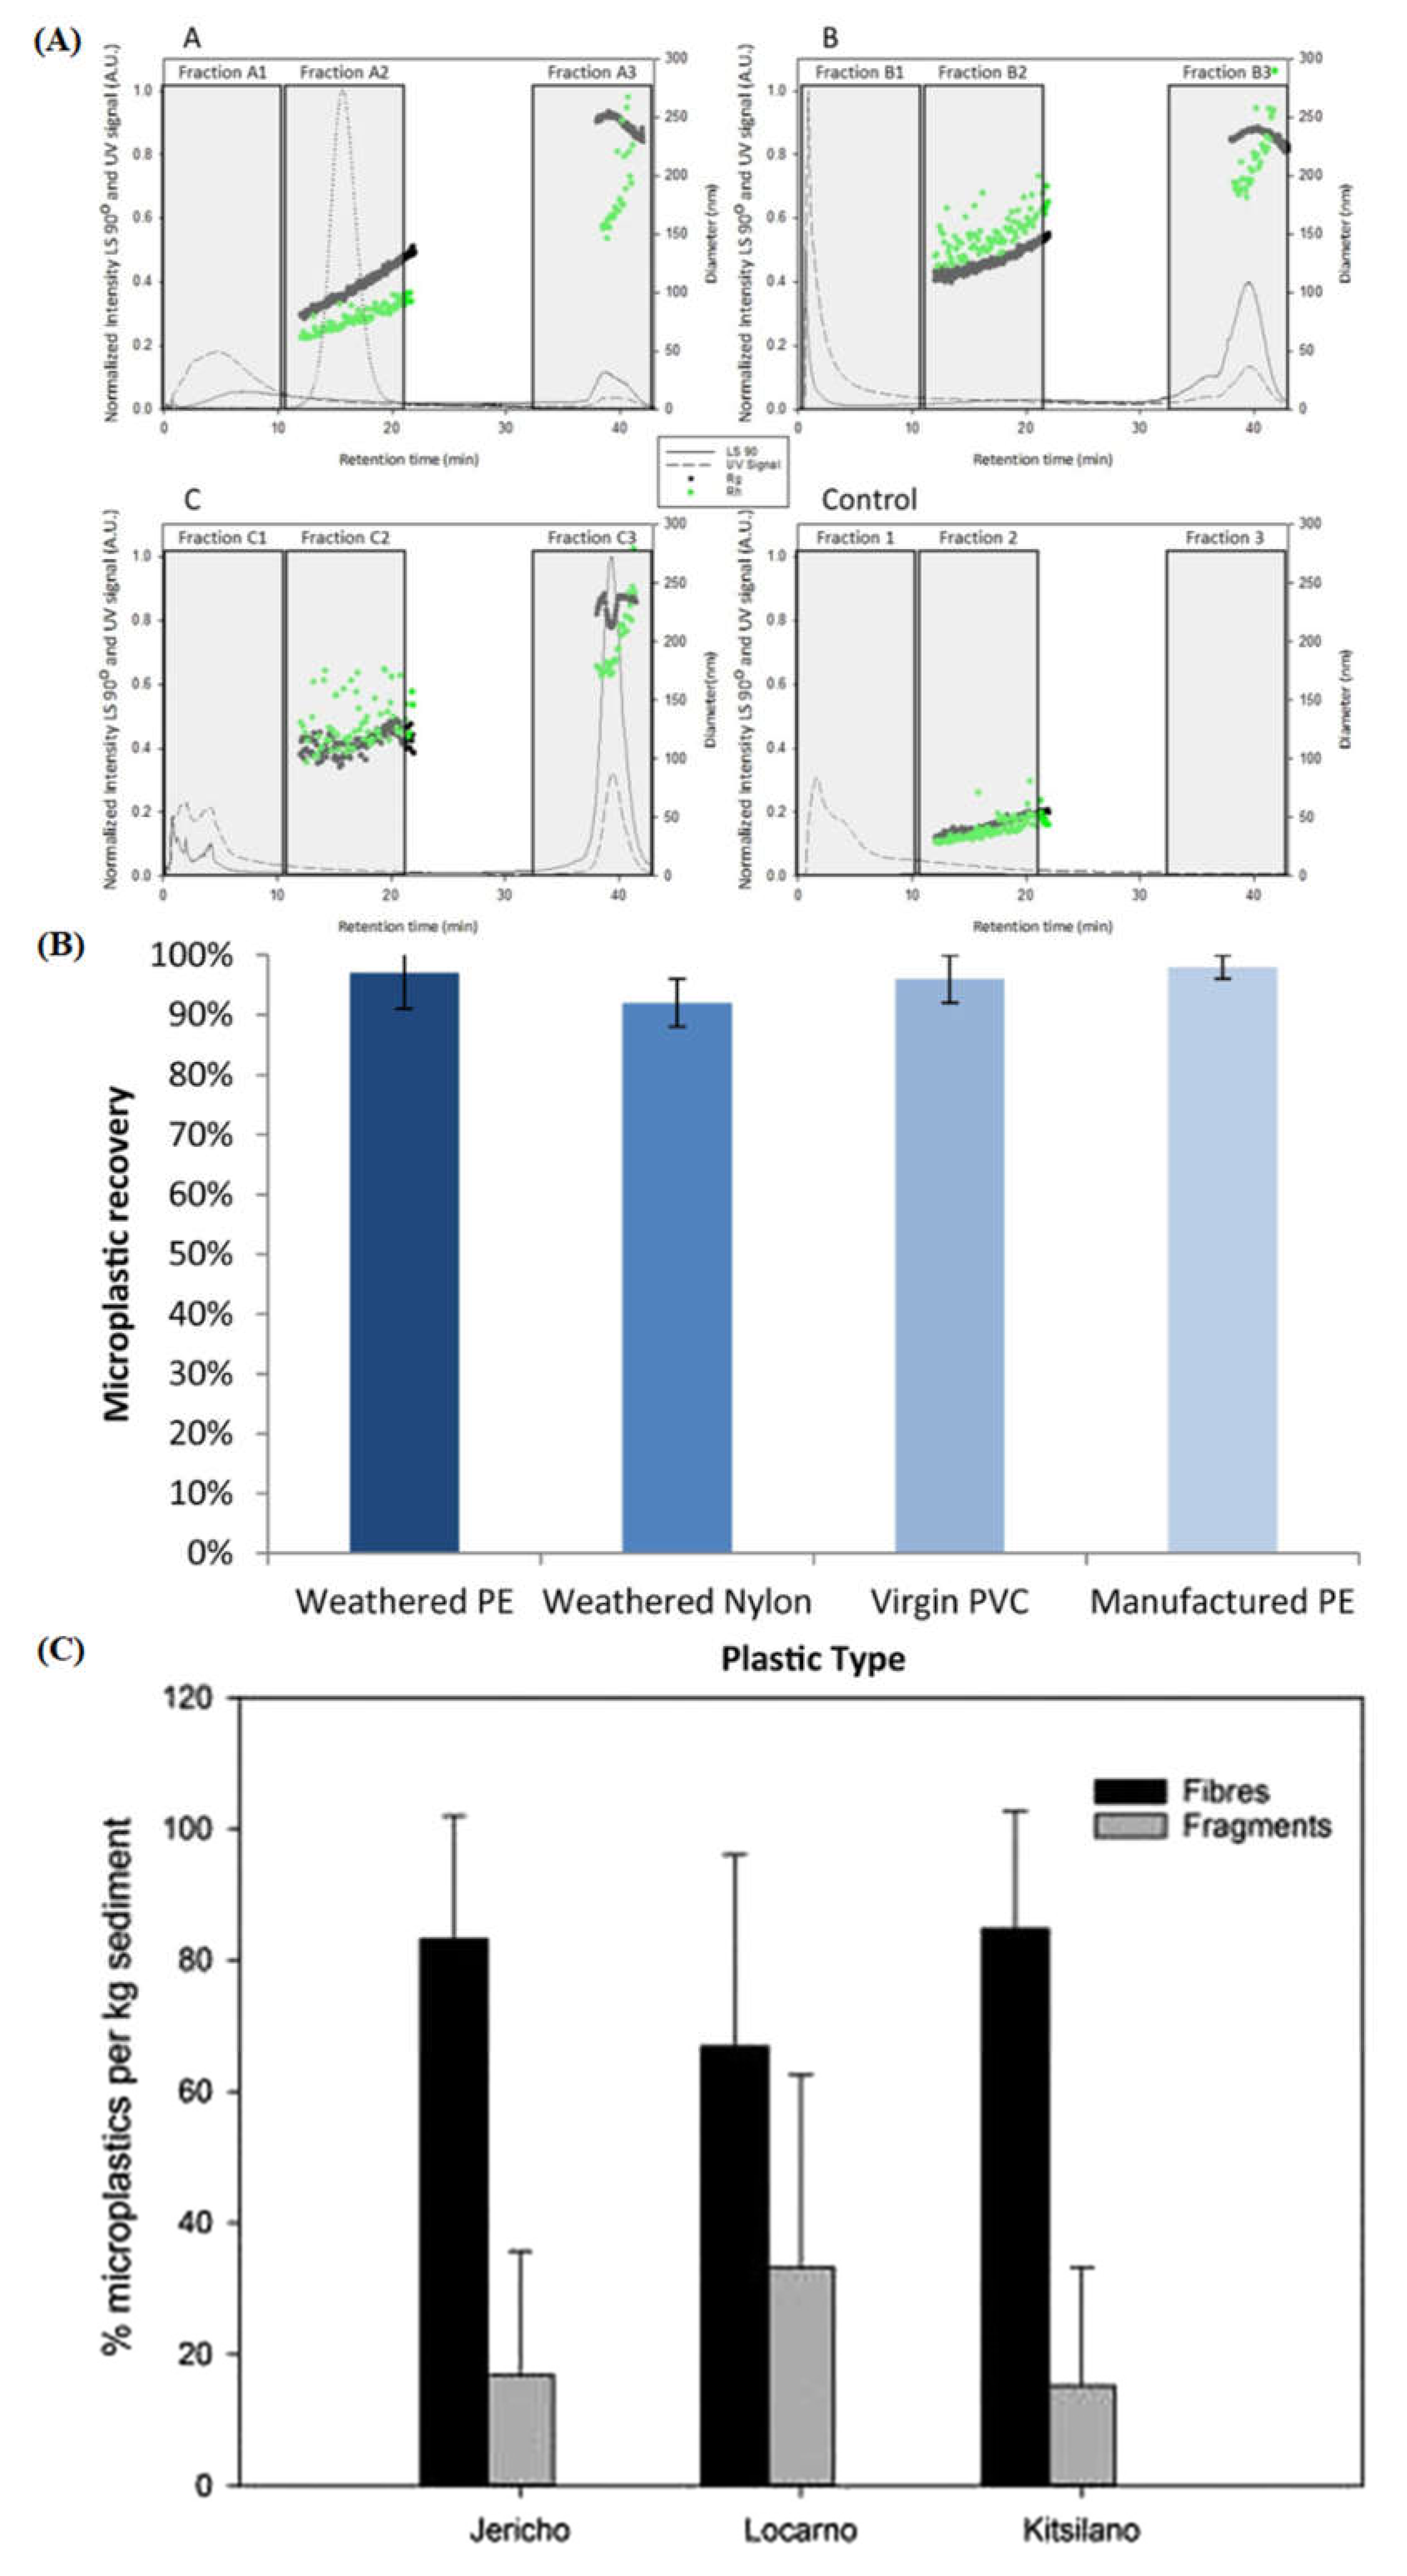
Figure 12.
(A) Volume reduction from ZnO-NR enhanced-photocatalytic degradation of PP MPLs over time analyzed by DLS. (B) GC-MS analysis of byproducts from free radical species produced by photooxidation. (C) Elastic moduli decrease with respect to temperature more pronounced in rate and magnitude from higher concentrations of ZnO in comparison to the control indicating greater physicochemical change in irradiated LDPE due to presence of oxidation [4,65].
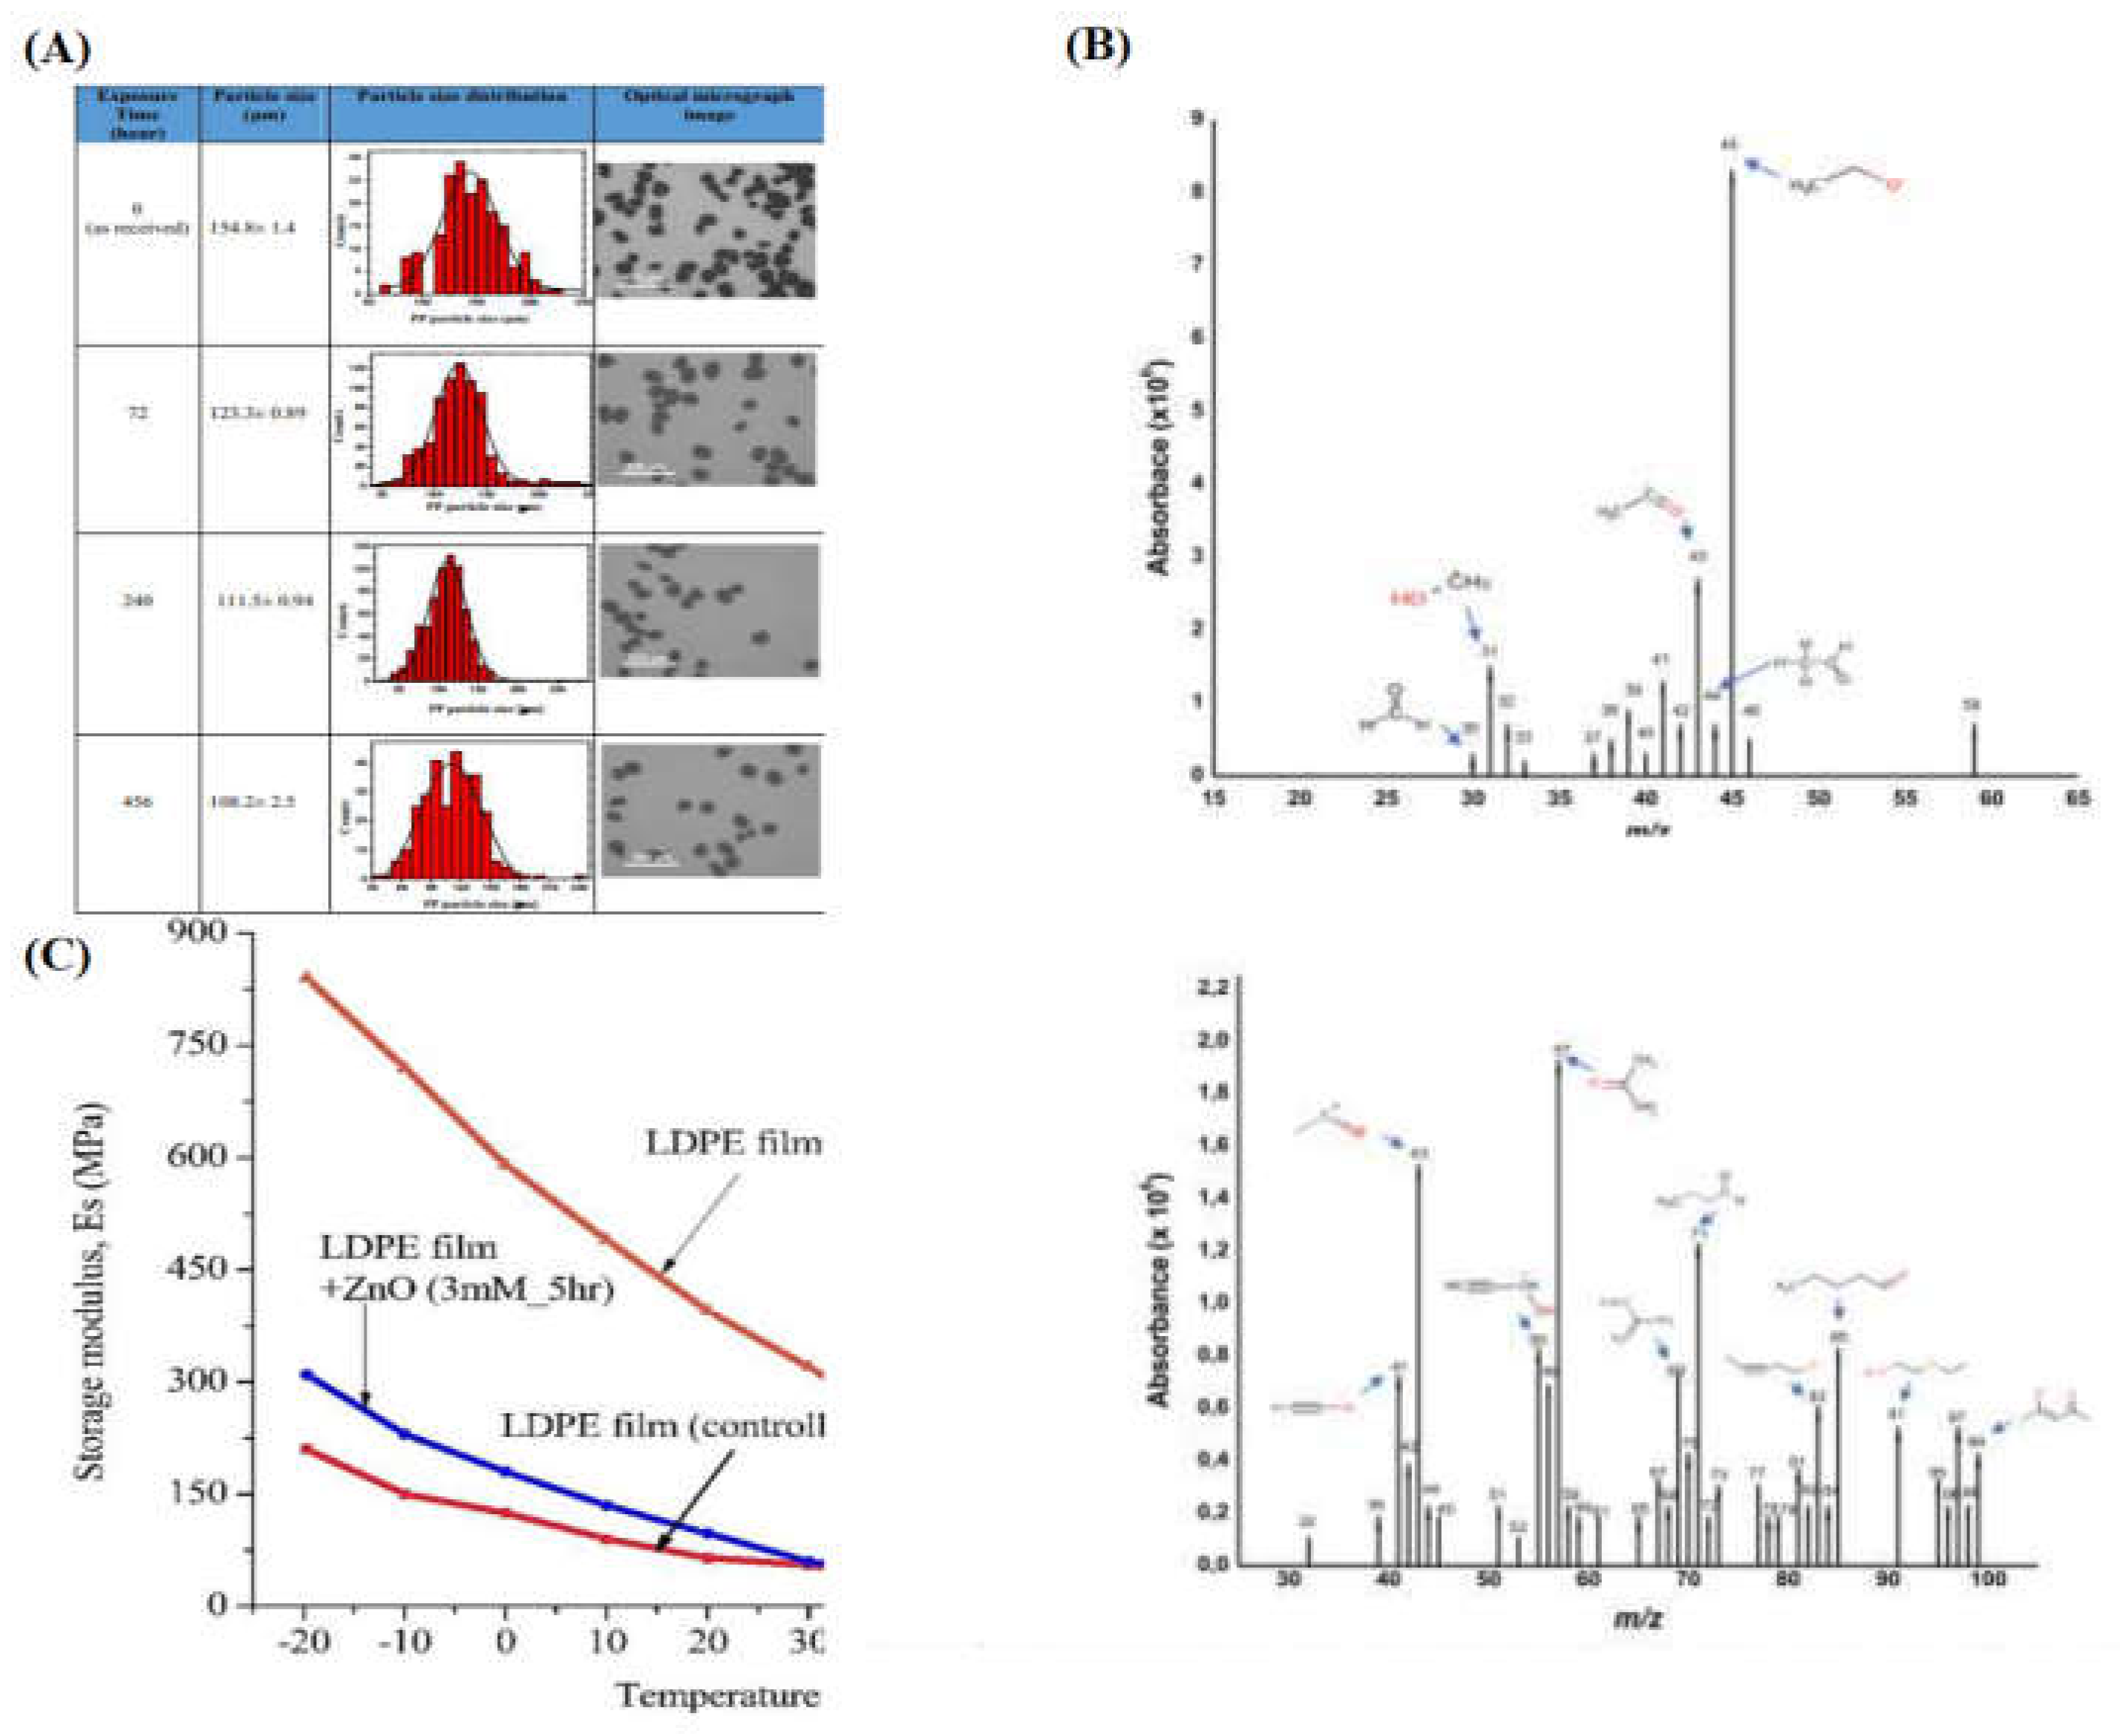
Figure 13.
(A) Layer-by-layer assembly of polycationic/polyanionic molecules onto a charged surface. (B) N-alkane metabolism pathway in Geobacillus thermodentriticans for (C>20) alkanes. (C) "Hxd3" strain of Desulfococcus oleovorans digestion of n-alkanes via fumarate addition. (D) Site-directed mutagenesis of two residues in PETase enzyme binding pocket increases catalytic capability [66,68,70].
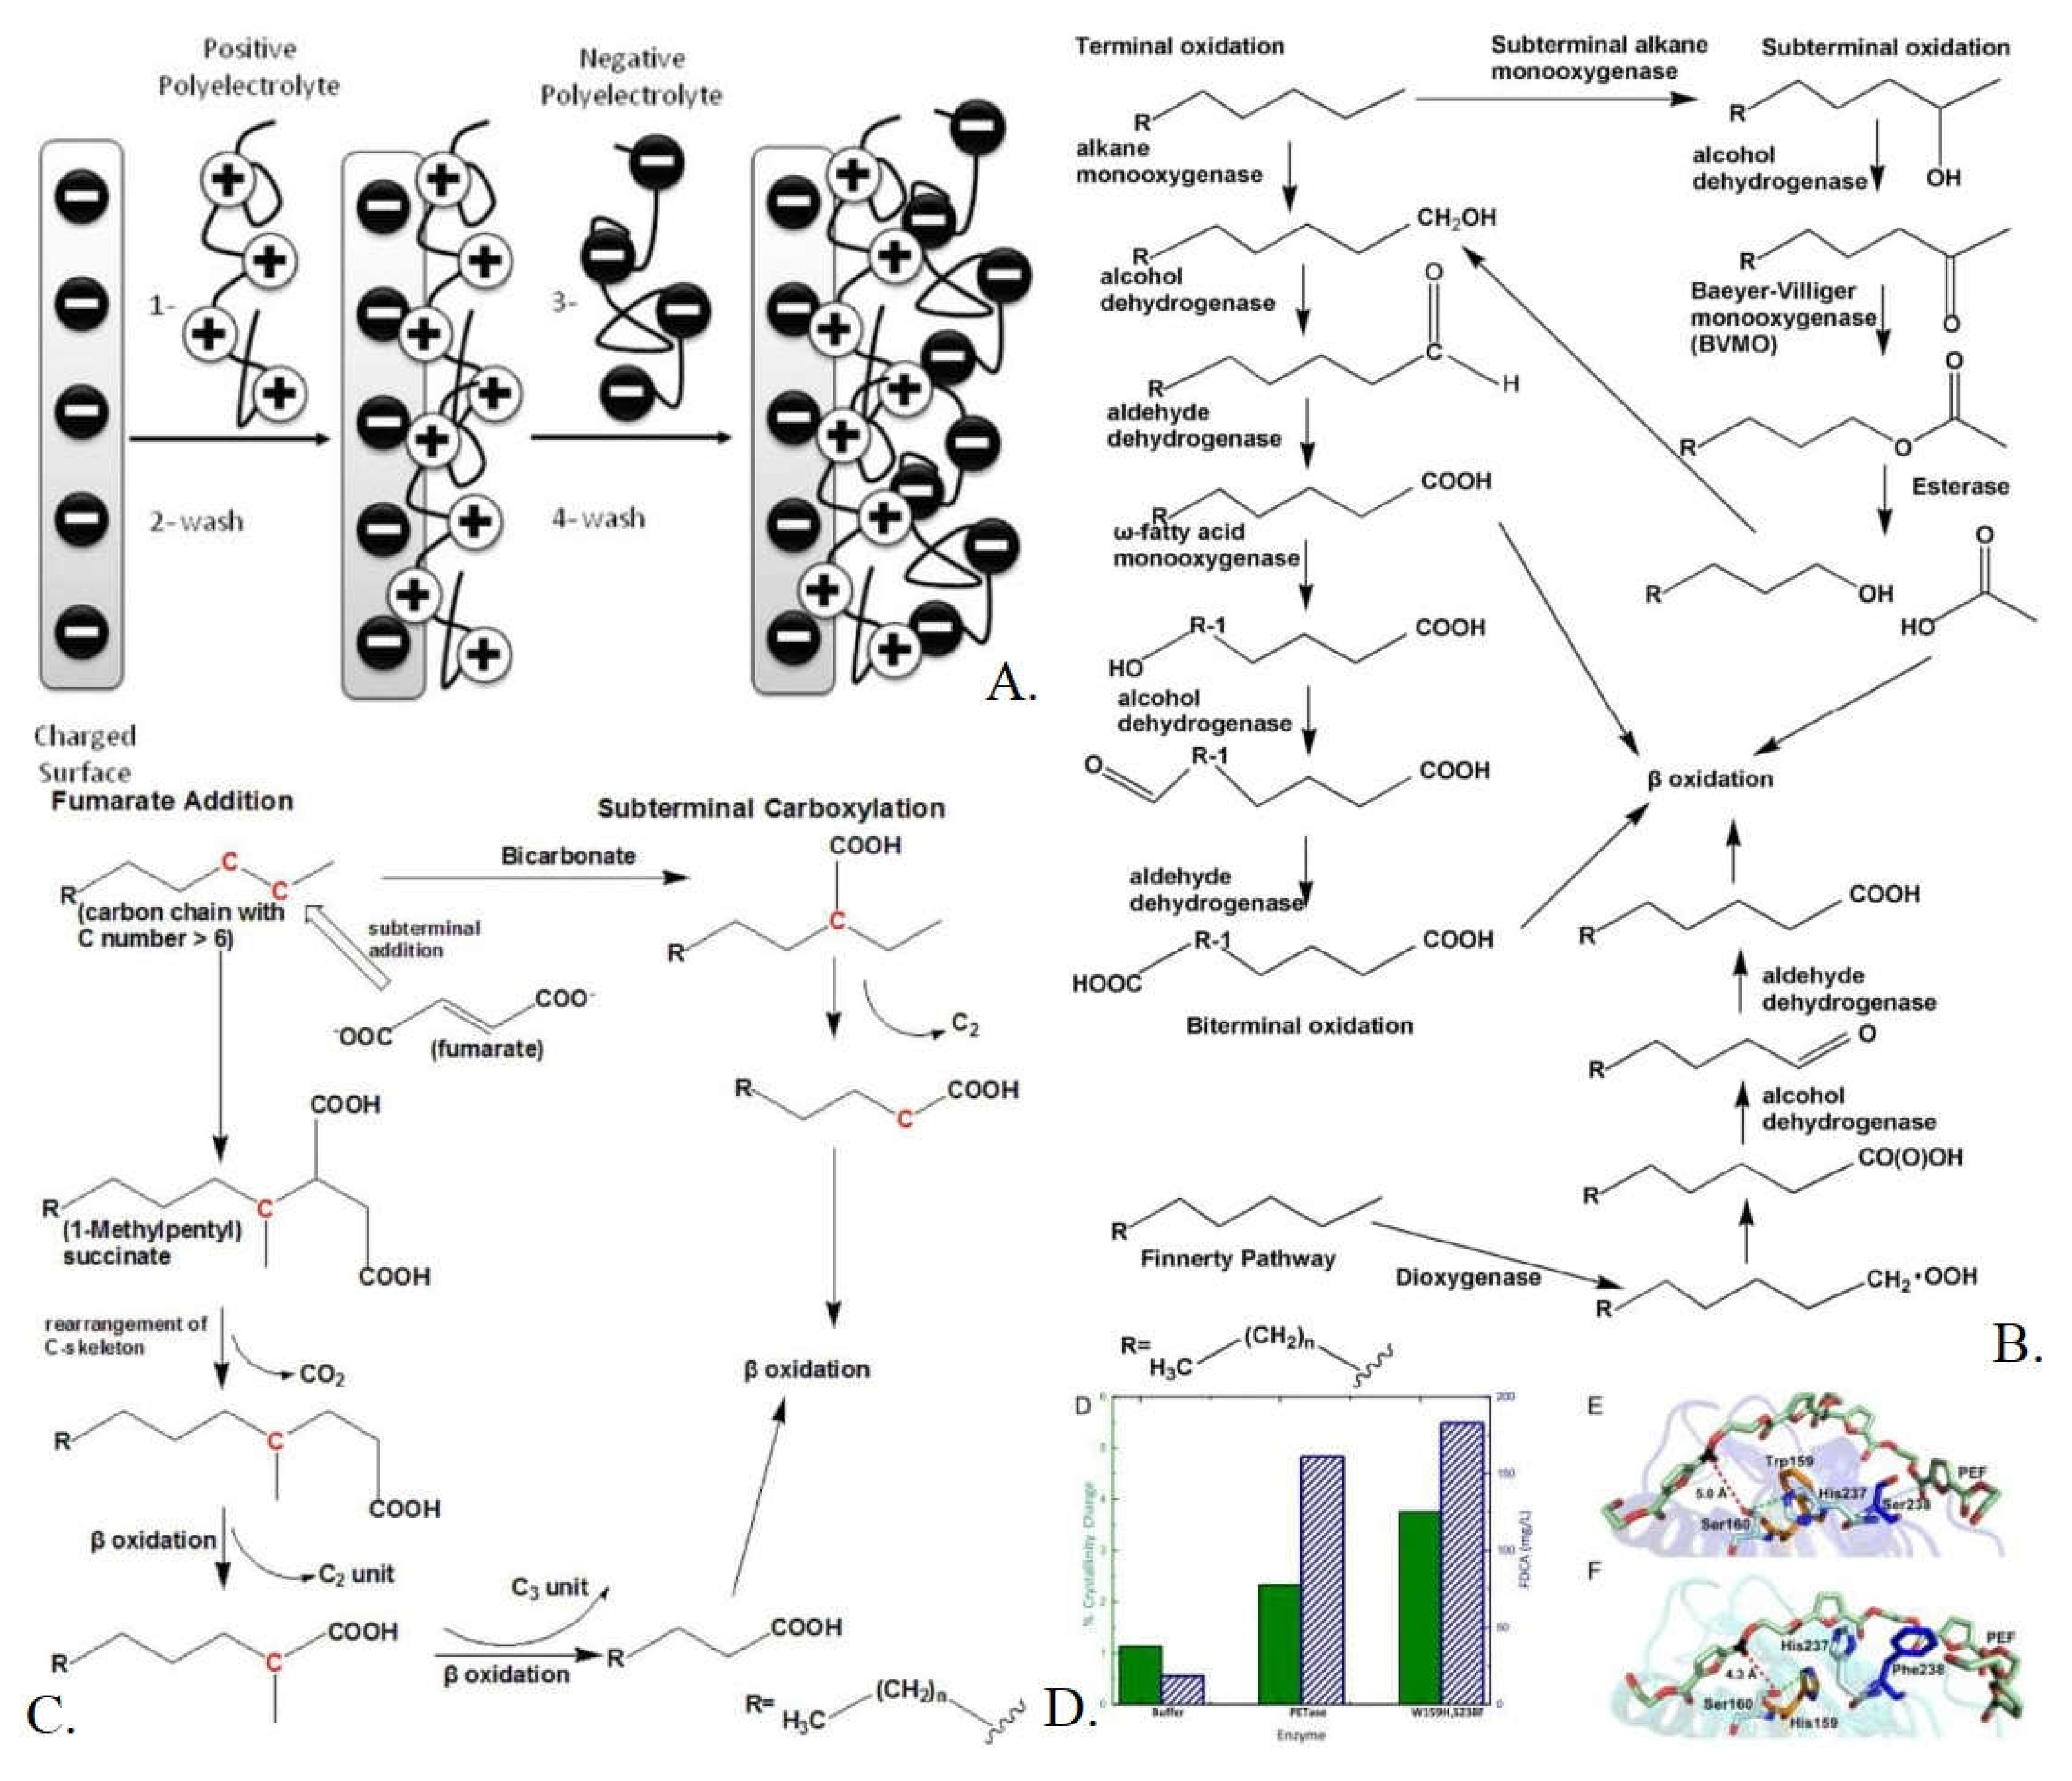
Figure 14.
(A) Terephthalate modification (monomer of TPS) into vanillin for value-added manufacturing. (B) Monomer constituents/enzymes needed for alternate value-added manufacturing for vanillin and pyruvate metabolic pathways in engineered bacterial strains. (C) General example of enzymes responsible for curtailing free radical formation in metabolism as some enzymes proposed may possibly produce them in significant amounts causing system degradation [71,72,75].
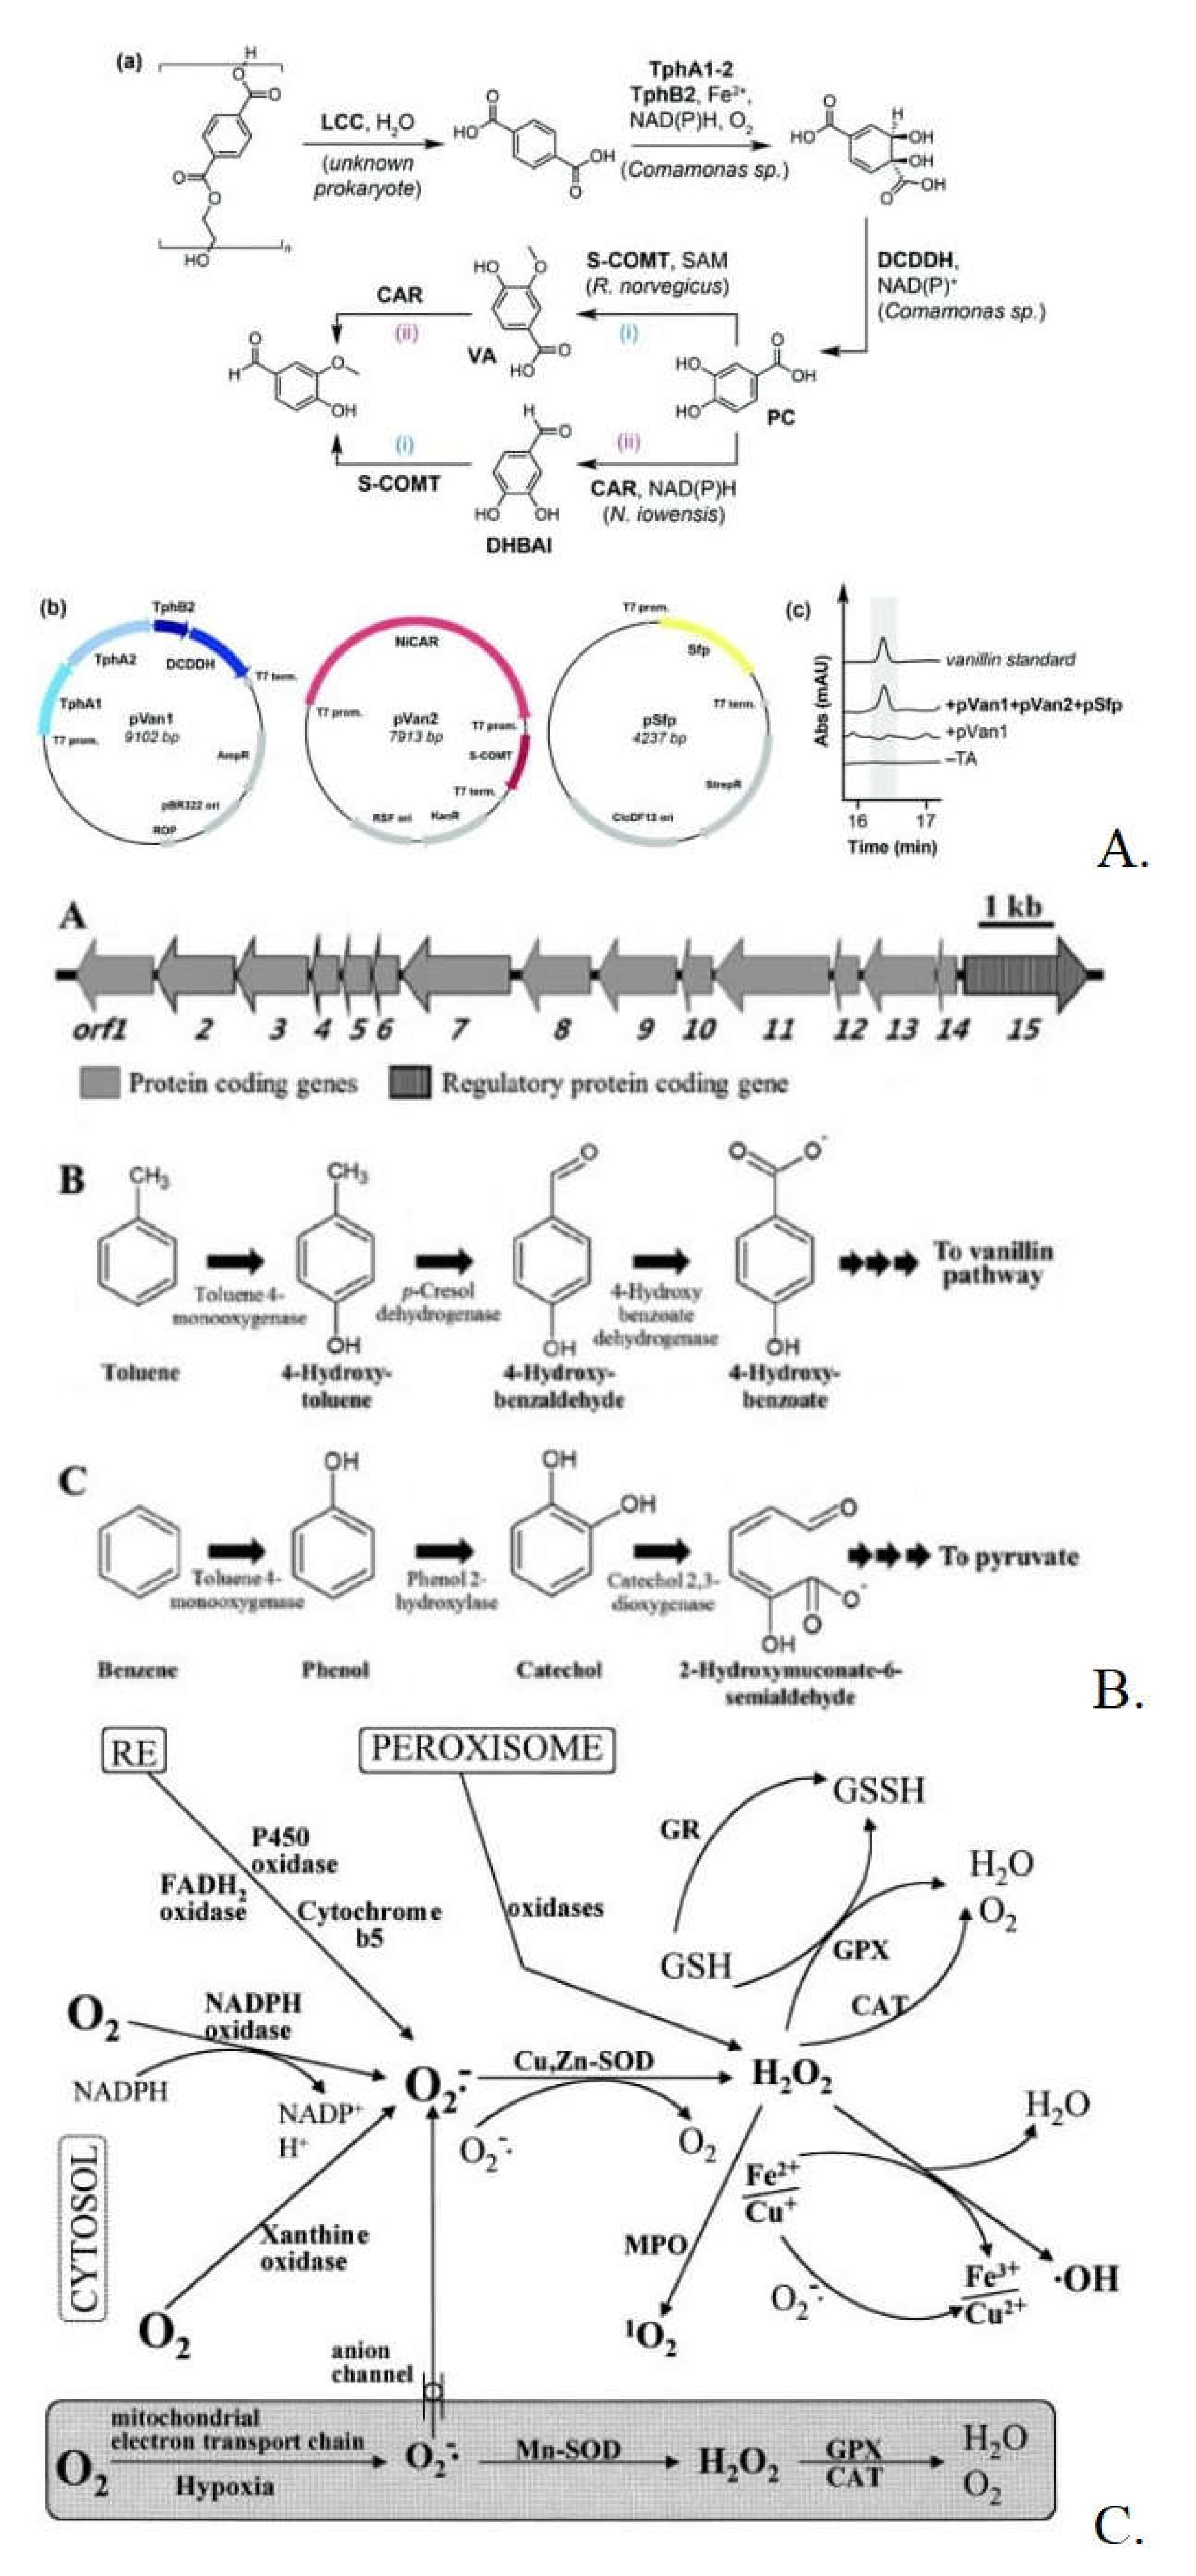
Disclaimer/Publisher’s Note: The statements, opinions and data contained in all publications are solely those of the individual author(s) and contributor(s) and not of MDPI and/or the editor(s). MDPI and/or the editor(s) disclaim responsibility for any injury to people or property resulting from any ideas, methods, instructions or products referred to in the content. |
© 2024 by the authors. Licensee MDPI, Basel, Switzerland. This article is an open access article distributed under the terms and conditions of the Creative Commons Attribution (CC BY) license (http://creativecommons.org/licenses/by/4.0/).
Copyright: This open access article is published under a Creative Commons CC BY 4.0 license, which permit the free download, distribution, and reuse, provided that the author and preprint are cited in any reuse.


