

Submitted:
07 August 2024
Posted:
09 August 2024
You are already at the latest version
Abstract
In recent years, the global energy sector has seen significant transformation, particularly in Europe, with a notable increase in intermittent renewable energy integration. Italy and the European Union (EU) have been among the leaders in this transition, with renewables playing a substantial role in electricity generation as of mid-2020s. The adoption of Battery Energy Storage Systems (BESS) has become crucial for enhancing grid efficiency, sustainability, and reliability by addressing the intermittent renewable sources. This paper investigates the feasibility and economic viability of batteries into wholesale electricity markets as per EU regulation, focusing on the dynamics of very different markets, namely the Day-Ahead Market (DAM) based on system marginal price and the Cross-Border Intra-day Market (XBID) based on continuous trading. A novel model is proposed to enhance BESS operations, leveraging price arbitrage strategies based on zonal price predictions, levelized cost of storage (LCOS), and uncertain bid acceptance in continuous trading. Machine learning and deep learning techniques are applied for price forecasting and bid acceptance prediction, respectively. The study finds that data-driven techniques outperform reference models in price forecasting and bid acceptance prediction (+7-14% accuracy). Regarding market dynamics, the study reveals a higher competitiveness of the continuous market compared to the DAM, particularly with increased risk factor in bids leading to higher profits. This research provides insights into compatibility between continuous markets and BESS, showing substantial improvements in economic profitability and the correlation between risk and profits in the bidding strategy (+9 M€ yearly revenues are obtained with a strategic behavior that reduces by 60% awarded energy).
Keywords:
BESS
; Wholesale Electricity Markets
; DAM
; XBID
; LCOS
; Deep Learning
; Price Prediction
1. Introduction
1.1. Motivation
In recent years, the global energy sector has undergone a radical transformation, with an increasing penetration of renewable energy sources into the production mix. In 2023, renewables accounted for 30.2% of global electricity generation, a figure projected to rise to 41.6% in the coming years according to estimates [1]. In Italy, as well as across Europe, this trend is even more pronounced due to the environmental policies promoted by the European Union (EU). In 2023, renewable energy generation in the EU accounted for 44% of total electricity production, surpassing the 40% mark for the first time. Wind and solar energy continue to drive this growth, producing a record 27% of the EU's electricity in 2023 and achieving their highest annual capacity increments ever [2]. Similarly, in Italy, renewable electricity generation represented 36.8% of demand, aligning with EU data [3].
This shift has spurred the search for innovative technologies to enhance the efficiency, sustainability, and security of the electrical grid.
Most of these challenges can be addressed with the installation of storage technologies, which enable the decoupling of energy production and consumption over time. Storage allows smoothing out fluctuations in electricity supply by variable renewable energy (VRE), decreasing the reliance on conventional thermal power plants for meeting peak load, and reducing renewable curtailment. Additionally, storage technologies can increase power system flexibility by offering ancillary services. Electrochemical batteries, specifically Lithium-Ion Batteries (LIBs), will play a crucial role in the energy transition. LIBs exhibit high energy (75-250 Wh/kg) and power density (150-315 W/kg), high round-trip efficiency (85-95%), low self-discharge rate (0.1-0.3%), and a good lifespan (5-15 years) [4]. Moreover, LIBs have an incredibly low response time (20 milliseconds to seconds [4]), making them ideal for providing ancillary services like primary frequency regulation [5]. Their widespread adoption is further facilitated by technological maturity and a significant cost reduction (-90% from 2010 to 2023 [6]) driven by their use in electronic devices and electric vehicles.
The maturity of LIB technology, coupled with their technical attributes and decreasing costs, positions them as a critical component in the energy transition, facilitating the integration of renewable energy sources and the enhancement of grid reliability.
The opening of these systems to new markets, such as wholesale electricity markets, presents opportunities to capitalize on price fluctuations during periods of high volatility, increasing the potential for value stacking. This means participating in multiple markets to generate diverse revenue streams, thereby maximizing the investment.
Recognizing the importance of storage systems in the energy transition, it becomes crucial to build models capable of optimizing their design and real-time operations to develop an efficient bidding strategy in these markets. These models are essential for assessing the techno-economic benefits arising from optimal storage implementation and guiding the decisions of investors and policymakers.
1.2. Literature Review and Research Gaps
Numerous studies focus on the integration of energy storage systems in renewable energy power systems, such as hybrid PV/wind/BESS configurations. Datta et al. [7] describe various configurations of hybrid systems and their potential to mitigate adverse effects of VRE and to smooth PV output. Rana et al. [8] present comprehensive and significant research conducted on the state-of-the-art hybrid PV-BESS system, giving insights into future directions for further advancement of these types of systems.
Other studies develop optimization models that consider the interaction of storage systems with the ancillary services market (ASM), to understand their technical and economic potential in this context. In the study by Abiodun et al. [9] the profitability of a Concentrating Solar Power (CSP) plant providing spinning reserve in the ASM is analyzed. The model optimizes system operations within both the Day Ahead Market (DAM) and the ASM employing a 72h-rolling-horizon framework where perfect knowledge of day ahead pricing and solar resource availability is assumed. Kumar et al. [10] evaluate the suitability of a dual energy storage system (DESS) made by a battery bank storage (BBS) and pump hydro storage (PHS) integrated in a grid-connected microgrid (MG) for providing frequency ancillary services to the utility grid. Four different operating cases have been considered to achieve the optimal design of the DESS from an economic and technical perspective.
Some studies introduce the possibility of storage systems interacting with different electricity markets. Schwidtal et al. [11] describe a MILP model to optimize the operations of a P2G (Power-to-Gas) system aggregated with PV, considering varying degrees of interaction with the electricity markets. In particular, the revenue coming from DAM, IDM (Intraday Market), secondary reserve, tertiary reserve and passive balancing are contemplated. To formulate the aggregated bidding strategy across these diverse markets, a multi-stage and multi-period optimization approach is used. Fusco et al. [12] deal with the development of hierarchical Energy Management System (EMS) for the Unit Commitment of a single-bus system (PV-BESS) that can participate in the Italian Electricity Day-Ahead (DAM) and Intra-Day (IDM) markets while simultaneously satisfying an internal load. Anyway, the most recent EU platform of the Intra-day market, the cross-border intra-day market (XBID), is neglected and the model focuses only on the auction-based sessions of IDM.
On the other hand, other studies aim to achieve an efficient bidding strategy in the Intra-day market, including the continuous trading sessions part of the XBID platform. Algarvio et al. [13] describe a strategic process for retailers bidding in a wholesale market composed of a day-ahead market, an intraday market, and a balancing market. It considers a market design that involves a hybrid model for the intraday market, based on daily auctions and a continuous procedure. The paper also presents a computational study to illustrate and evaluate both the market design and the strategic bidding process of retailers. Boukas et al. [14], instead, introduce a novel reinforcement learning (RL) framework for the participation of a storage device operator in the continuous Intra-day market. In this study the storage device operator is considered a price-taker, and the strategy aims to maximize the profits received over the entire trading horizon, while considering the operational constraints of the unit, although there are no considerations on the acceptance probabilities of new bids.
From the literature review, it is evident that BESS design and operations optimization in the case of ancillary services provision has been frequently studied. However, few studies have implemented the possibility for storage devices, and in particular BESS, to operate in the wholesale markets, especially the Intra-day market. Furthermore, none of the studies identified have investigated a bidding strategy for the continuous Intra-day market XBID platform, considering the opportunity to submit profitable bids while considering their acceptance probability to function as a price-maker.
1.3. Contribution and Novelty
This work aims to demonstrate the economic profitability and technical feasibility of BESS participation in the wholesale electricity markets common to EU framework. Specifically, the goal is to model BESS operations in the Italian electricity markets with particular attention to the DAM, with a focus on the optimization of the effectiveness of the arbitrage via zonal price (Pz) prediction, and the new platform XBID with the continuous trading, reproducing its behavior and the uncertainty of bid acceptance.
To address these challenges, the BESS and market models are implemented in Python. This work employs a BESS model based on [15], suitable for analyzing a grid-connected BESS that can represent losses and includes the auxiliaries’ load.
For Pz prediction, various machine learning and deep learning models are introduced to develop an efficient arbitrage strategy on the DAM, predicting the most suitable hours to operate in the market.
Additionally, other neural network models are introduced to predict the acceptance of bids submitted by the storage device operator in XBID.
These models are used to determine BESS strategy and real-life operations during a year of activity.
Compared to the works found in the literature, the main novel aspects and contributions provided by this study are as follows:
- Development of a model capable of concurrently representing participation in DAM and XBID, considering the fluctuations in both market prices and the uncertainty given by different price formation mechanisms and bid awards. This model investigates various critical aspects, including identification of the most economically advantageous market and bidding strategy for BESS, and economic assessment of XBID uncertainty based on statistical analyses.
- Development of a tool for predicting Pz to achieve a more realistic simulation of the BESS strategy, avoiding critical assumptions such as perfect knowledge of DAM prices a priori or the use of a persistence model with .
-
Development of a tool to determine the acceptance probability of an offer in XBID to represent the uncertainty in this context. This tool introduces:
- the possibility for the operator to submit new offers, not limited to accepting offers already present in the order book (price-maker);
- the ability to overcome the limitations of statistical data, given that this market was recently added, and the data are insufficient to determine significant trends.
Although this study considers a LIB operating in the Italian electricity markets, its contributions can be extended to other electrical energy storage technologies and regulatory frameworks since the BESS modeling is explained in detail and can be applied to other storage technologies and the regulatory framework is common to EU (Italian price and bid data are adopted).
The remaining sections of the paper are organized as follows. Chapter 2 provides an overview of the Italian electricity market structure and regulation. Chapter 3 introduces the modeling of the battery and its interactions with the electricity markets and prediction tools. Chapter 4 presents the analyzed case studies and discusses the obtained results. Finally, Chapter 5 lists the main findings and offers suggestions for future research.
2. Italian Electricity Markets
The Italian scenario is considered in this research. The scope of this section is to give an overview of the regulations governing the Italian energy markets, DAM and MI. Our focus will be on highlighting the requirements for participating in these markets and their functioning and describing the mechanisms behind the economic compensation of both.
2.1. Structure
The Italian Spot Electricity Market (MPE) facilitates the buying and selling of electricity with physical delivery occurring either on the same calendar day as the negotiation or the following calendar day. This market is managed by the Gestore dei Mercati Energetici (GME).
MPE consists of [16]:
- Mercato del giorno prima (DAM) – Day-Ahead Market (DAM): this market is the one where most of the transactions for electrical energy trading occur.
- Mercato Infragiornaliero (MI) – Intraday Market (IDM): it is the energy market where consumers and producers can modify the dispatch programs defined at DAM closure. Trading on the MI takes place through three MI-A auction sessions and one MI-XBID continuous trading session.
- Mercato dei prodotti giornalieri (MPEG) – Daily Products Market: is the venue for the trading of daily products with the obligation of energy delivery.
- Mercato del servizio di dispacciamento (MSD) – Ancillary Services Market (ASM): is the market utilized by the Italian System Operator (SO) Terna to procure the resources that it requires for managing and monitoring the system relief of intra-zonal congestions, creation of energy reserve, real-time balancing. The MSD consists of a scheduling substage (ex-ante MSD) and Balancing Market (MB).
In Italy, the energy markets DAM and IDM are organized with an hourly resolution [17]. Instead for the ASM, offers are submitted on an hourly-basis during the programming phase MSD ex-ante, while for the Balancing Market BM, offers are activated on a quarter-hourly basis [17].
Regarding spatial granularity, Italian electricity market is divided into seven geographical zones [18], as illustrated in Figure 1.
This research will take the NORD area as the market zone where the analyzed BESS is operating, and the DAM and IDM operations are considered.
2.2. Day-Ahead Market
The Day-Ahead Market (DAM) is the primary platform for electricity sale and purchase transactions. In the DAM, trading is conducted using hourly energy blocks scheduled for delivery the next day. Market participants submit bids and asks, specifying the quantity of electricity and the minimum or maximum price at which they are willing to sell or purchase.
The market operation follows a precise schedule. The DAM sitting opens at 8 a.m. on the ninth day before the delivery day and closes at 12 p.m. on the day preceding the delivery day. The results of the DAM are announced by 12:58 p.m. on the day before delivery. Upon closure, bids and asks are accepted based on the economic merit-order criterion, while also considering the transmission capacity limits between different zones. This structured approach classifies the DAM as an auction market rather than a continuous-trading market.
Pricing within the DAM is determined by the marginal clearing price [16], which varies by zone and is established for each hour through the intersection of demand and supply curves [19], as shown in Figure 2. This pricing mechanism is called System Marginal Pricing:
When transmission capacity limits are reached, these prices are differentiated across zones. Supply offers are valued at their respective zone’s marginal clearing price.
For consuming units within Italian geographical zones, the accepted demand bids are valued at the Prezzo Unico Nazionale (PUN – national single price). The PUN is calculated as the weighted average of the prices of all geographical zones, with the weighting based on the quantities purchased in each zone [17], according with Equations (1) and (2):
With:
Where:
| The quantity of purchase offers o overall accepted as a result of DAM | |
| The total quantity purchased on DAM in the offer zone z related to the zonal withdrawal portfolios | |
| The summation extends to all offers o submitted on DAM concerning the zonal portfolio pf | |
| The summation extends to all zonal portfolios, pf, included in the set APPz comprising the zonal withdrawal portfolios located in the offer zone z |
In the DAM, the Gestore dei Mercati Energetici (GME) functions as the central counterparty, ensuring the integrity and smooth operation of the market. This role includes managing the financial transactions and ensuring that all participants meet their contractual obligations, thereby maintaining market stability and trust.
2.3. Intra-Day Market
The Intraday Market (MI) allows participants to adjust their schedules set in the Day-Ahead Market (DAM) through additional buy or sell bids. Trading in the MI occurs via three MI-A auction sessions (CRIDA) and a continuous trading session, MI-XBID.
2.3.1. MI-A Auction Sessions
During the MI-A auction sessions, alongside the trading of buy and sell bids, intraday interconnection capacity is allocated between all zones of the Italian market and interconnected geographical areas involved in Market Coupling. The specifics of each MI-A session are as follows:
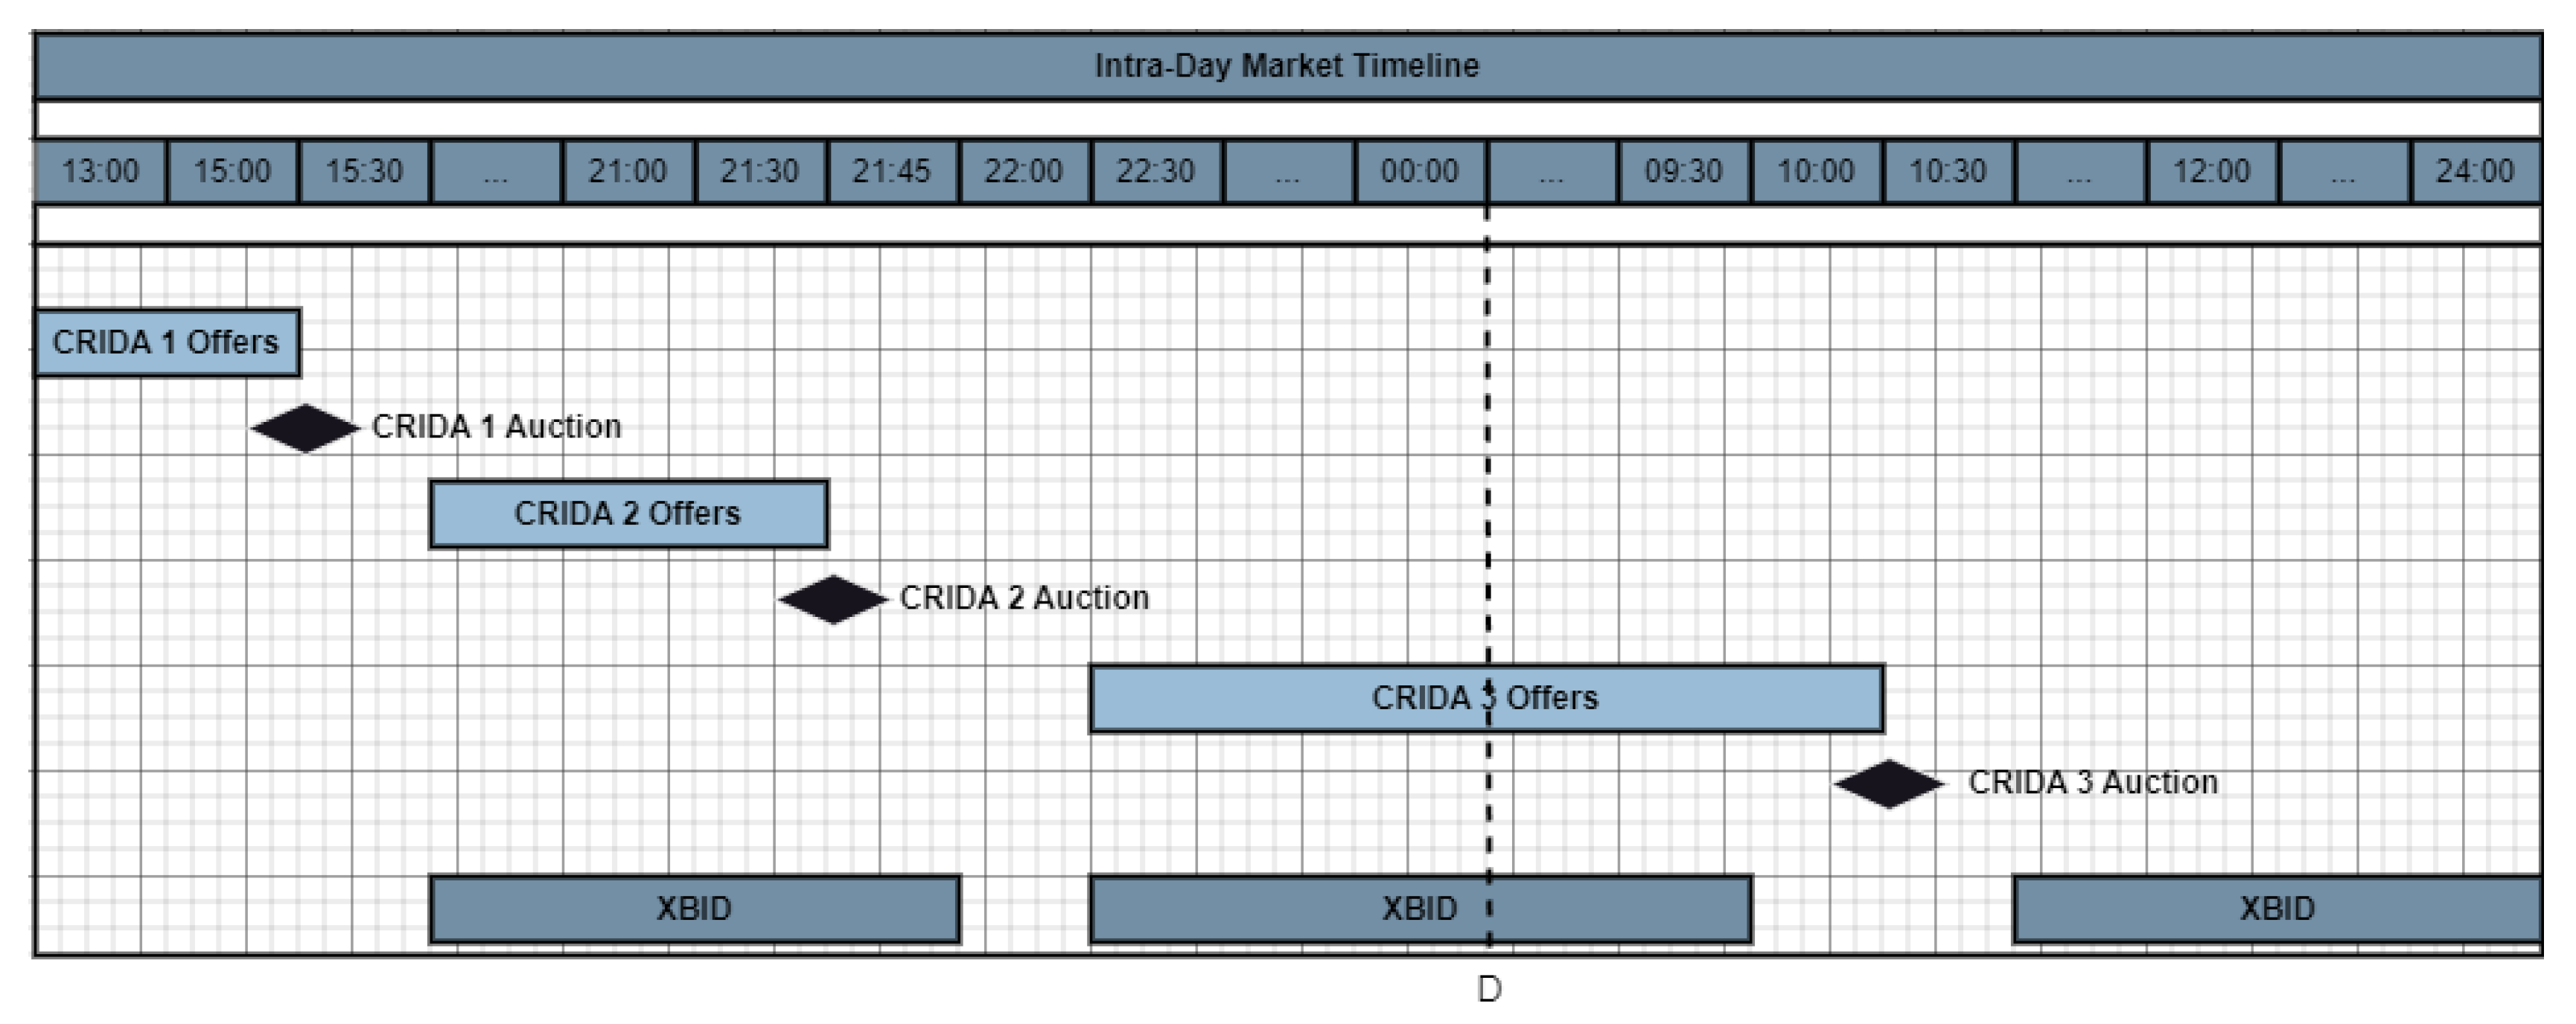
- MI-A1 Session: Opens at 12:55 PM on the day before the delivery day and closes at 3:00 PM on the same day. Results are communicated by 3:30 PM on the day before the delivery day.
- MI-A2 Session: Opens at 12:55 PM on the day before the delivery day and closes at 10:00 PM on the same day. Results are communicated by 10:30 PM on the day before the delivery day.
- MI-A3 Session: Opens at 12:55 PM on the day before the delivery day and closes at 10:00 AM on the delivery day. Results are communicated by 10:30 AM on the delivery day.
The selection of buy and sell bids follows the same criteria as described for DAM. However, unlike the DAM, accepted buy bids are valued at the zonal price.
2.3.2. MI-XBID Continuous Trading Session
The MI-XBID continuous trading session is divided into three phases, wherein buy, and sell bids are traded and intraday interconnection capacity is allocated between all zones of the Italian market and interconnected geographical areas active in XBID. The schedule for each phase is:
- Phase I: Opens at 3:30 PM on D-1 and closes at 9:40 PM on D-1.
- Phase II: Opens at 10:30 PM on D-1 and closes:
- For relevant periods corresponding to the first twelve hours of day D, one hour before each relevant period begins (h-1).
- For relevant periods corresponding to the second twelve hours of day D, at 9:40 AM on day D.
- Phase III: Opens at 10:30 AM on day D and closes one hour before each relevant period begins (h-1).
Buy and sell bids can be submitted by unit and by portfolio. For each phase of continuous trading in MI-XBID, the GME organizes a trading book segmented by geographical and/or virtual zones.
2.3.3. Sequential Conduct of Sessions
The MI-A auction sessions and the phases of the MI-XBID continuous trading session are conducted sequentially and non-overlapping in the following order:
- a)
- MI-A1
- b)
- Phase I MI-XBID
- c)
- MI-A2
- d)
- Phase II MI-XBID
- e)
- MI-A3
- f)
- Phase III MI-XBID
Figure 3.
Sequential Conduct of MI Sessions.
The GME acts as the central counterparty. This research will focus only on the operations on the MI-XBID Continuous Trading Session and not on the MI-A auction sessions.
3. System Modelling
The objective of this section is to delineate the modelling of the battery and of its interactions with electricity markets as well as the models for the prediction of zonal price Pz and for the determination of the acceptance probability in the Intra-Day Market.
3.1. BESS Model
The numerical model of the BESS aims at accurately representing the operation of the BESS while participating in the markets. The model receives and conveniently processes real-world input data, such as electricity market prices and quantities. To optimally represent a real BESS, the model must provide accurate estimates even when the BESS operates at its limits, i.e., power and SOC saturation limits. This will enable the coherent evaluation of the gap between the performance requested from the grid-side and the actual provision of the BESS (e.g., in terms of energy provided on energy requested). Given these premises, the proposed layout of the model [15] is presented in Figure 4.
Input comes from the bidding strategy and is fed to the BESS model. The model considers the presence of electric loads acting as auxiliaries of the operation as described in Figure 5. As can be seen, the electric demand depends on the ambient temperature and the BESS power.
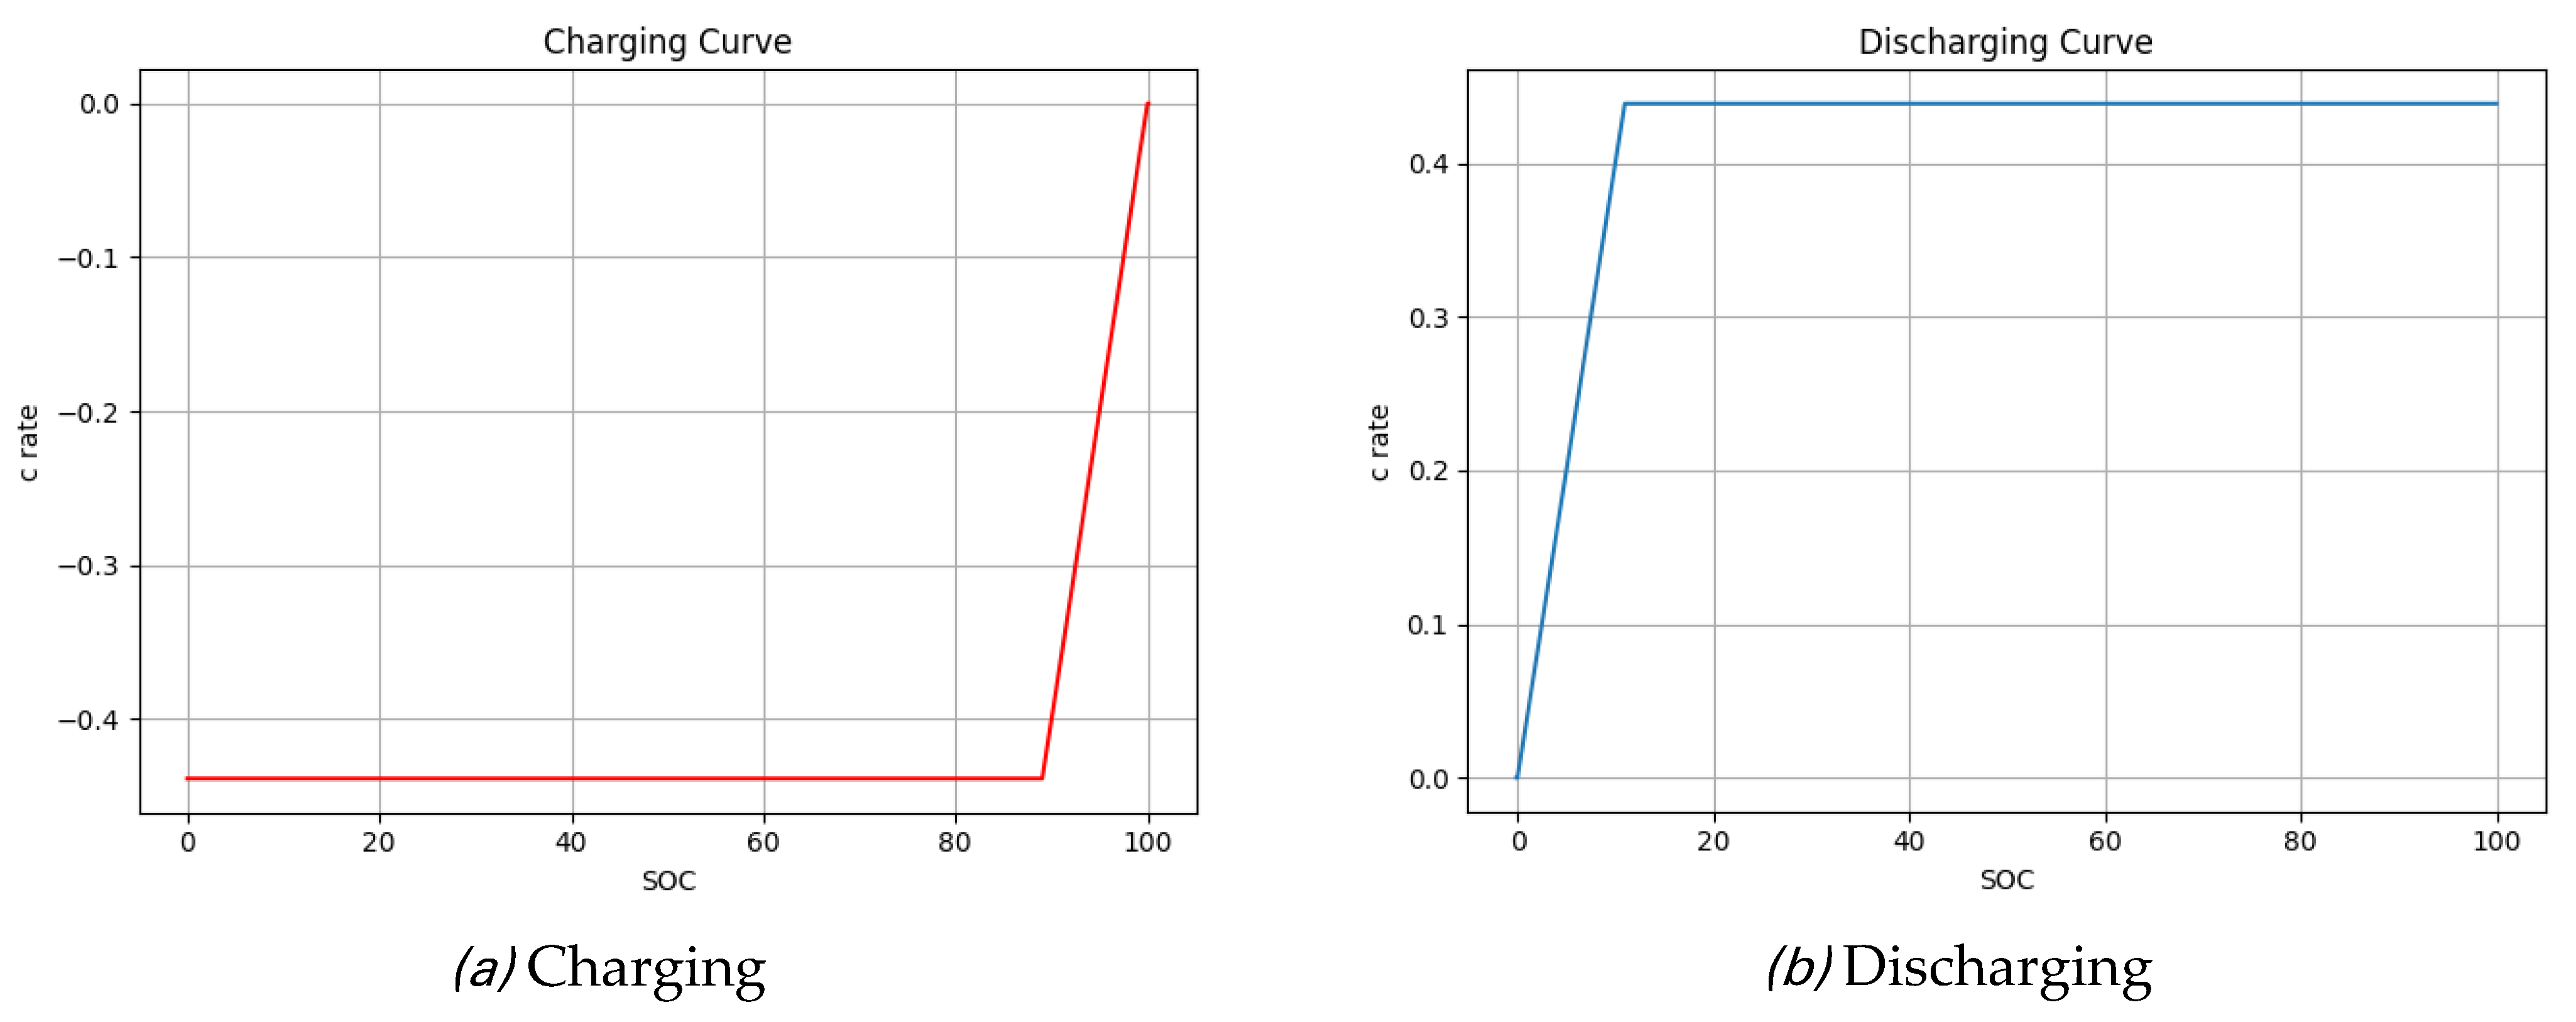
The input is a power setpoint fed to the BESS empirical model. The setpoint is transformed considering ηBESS (considering both the PCS and battery pack), illustrated in Error! Reference source not found., and capability curves (representing the maximum charging and discharging power achievable for each SOC) in Error! Reference source not found.. SOC is updated accordingly, as described in Equation . The outputs are the power requested DC-side and the and the updated SOC. These are fed to a simplified battery management system (BMS) that modifies the inputs conveniently for staying within the operational boundaries (safe operating area [2]). The main outputs of the model are the SOC and the power provided AC-side. This process is repeated for each timestep of the simulation. The outputs are elaborated for supporting the analysis of the results.
Figure 6.
BESS Efficiency.
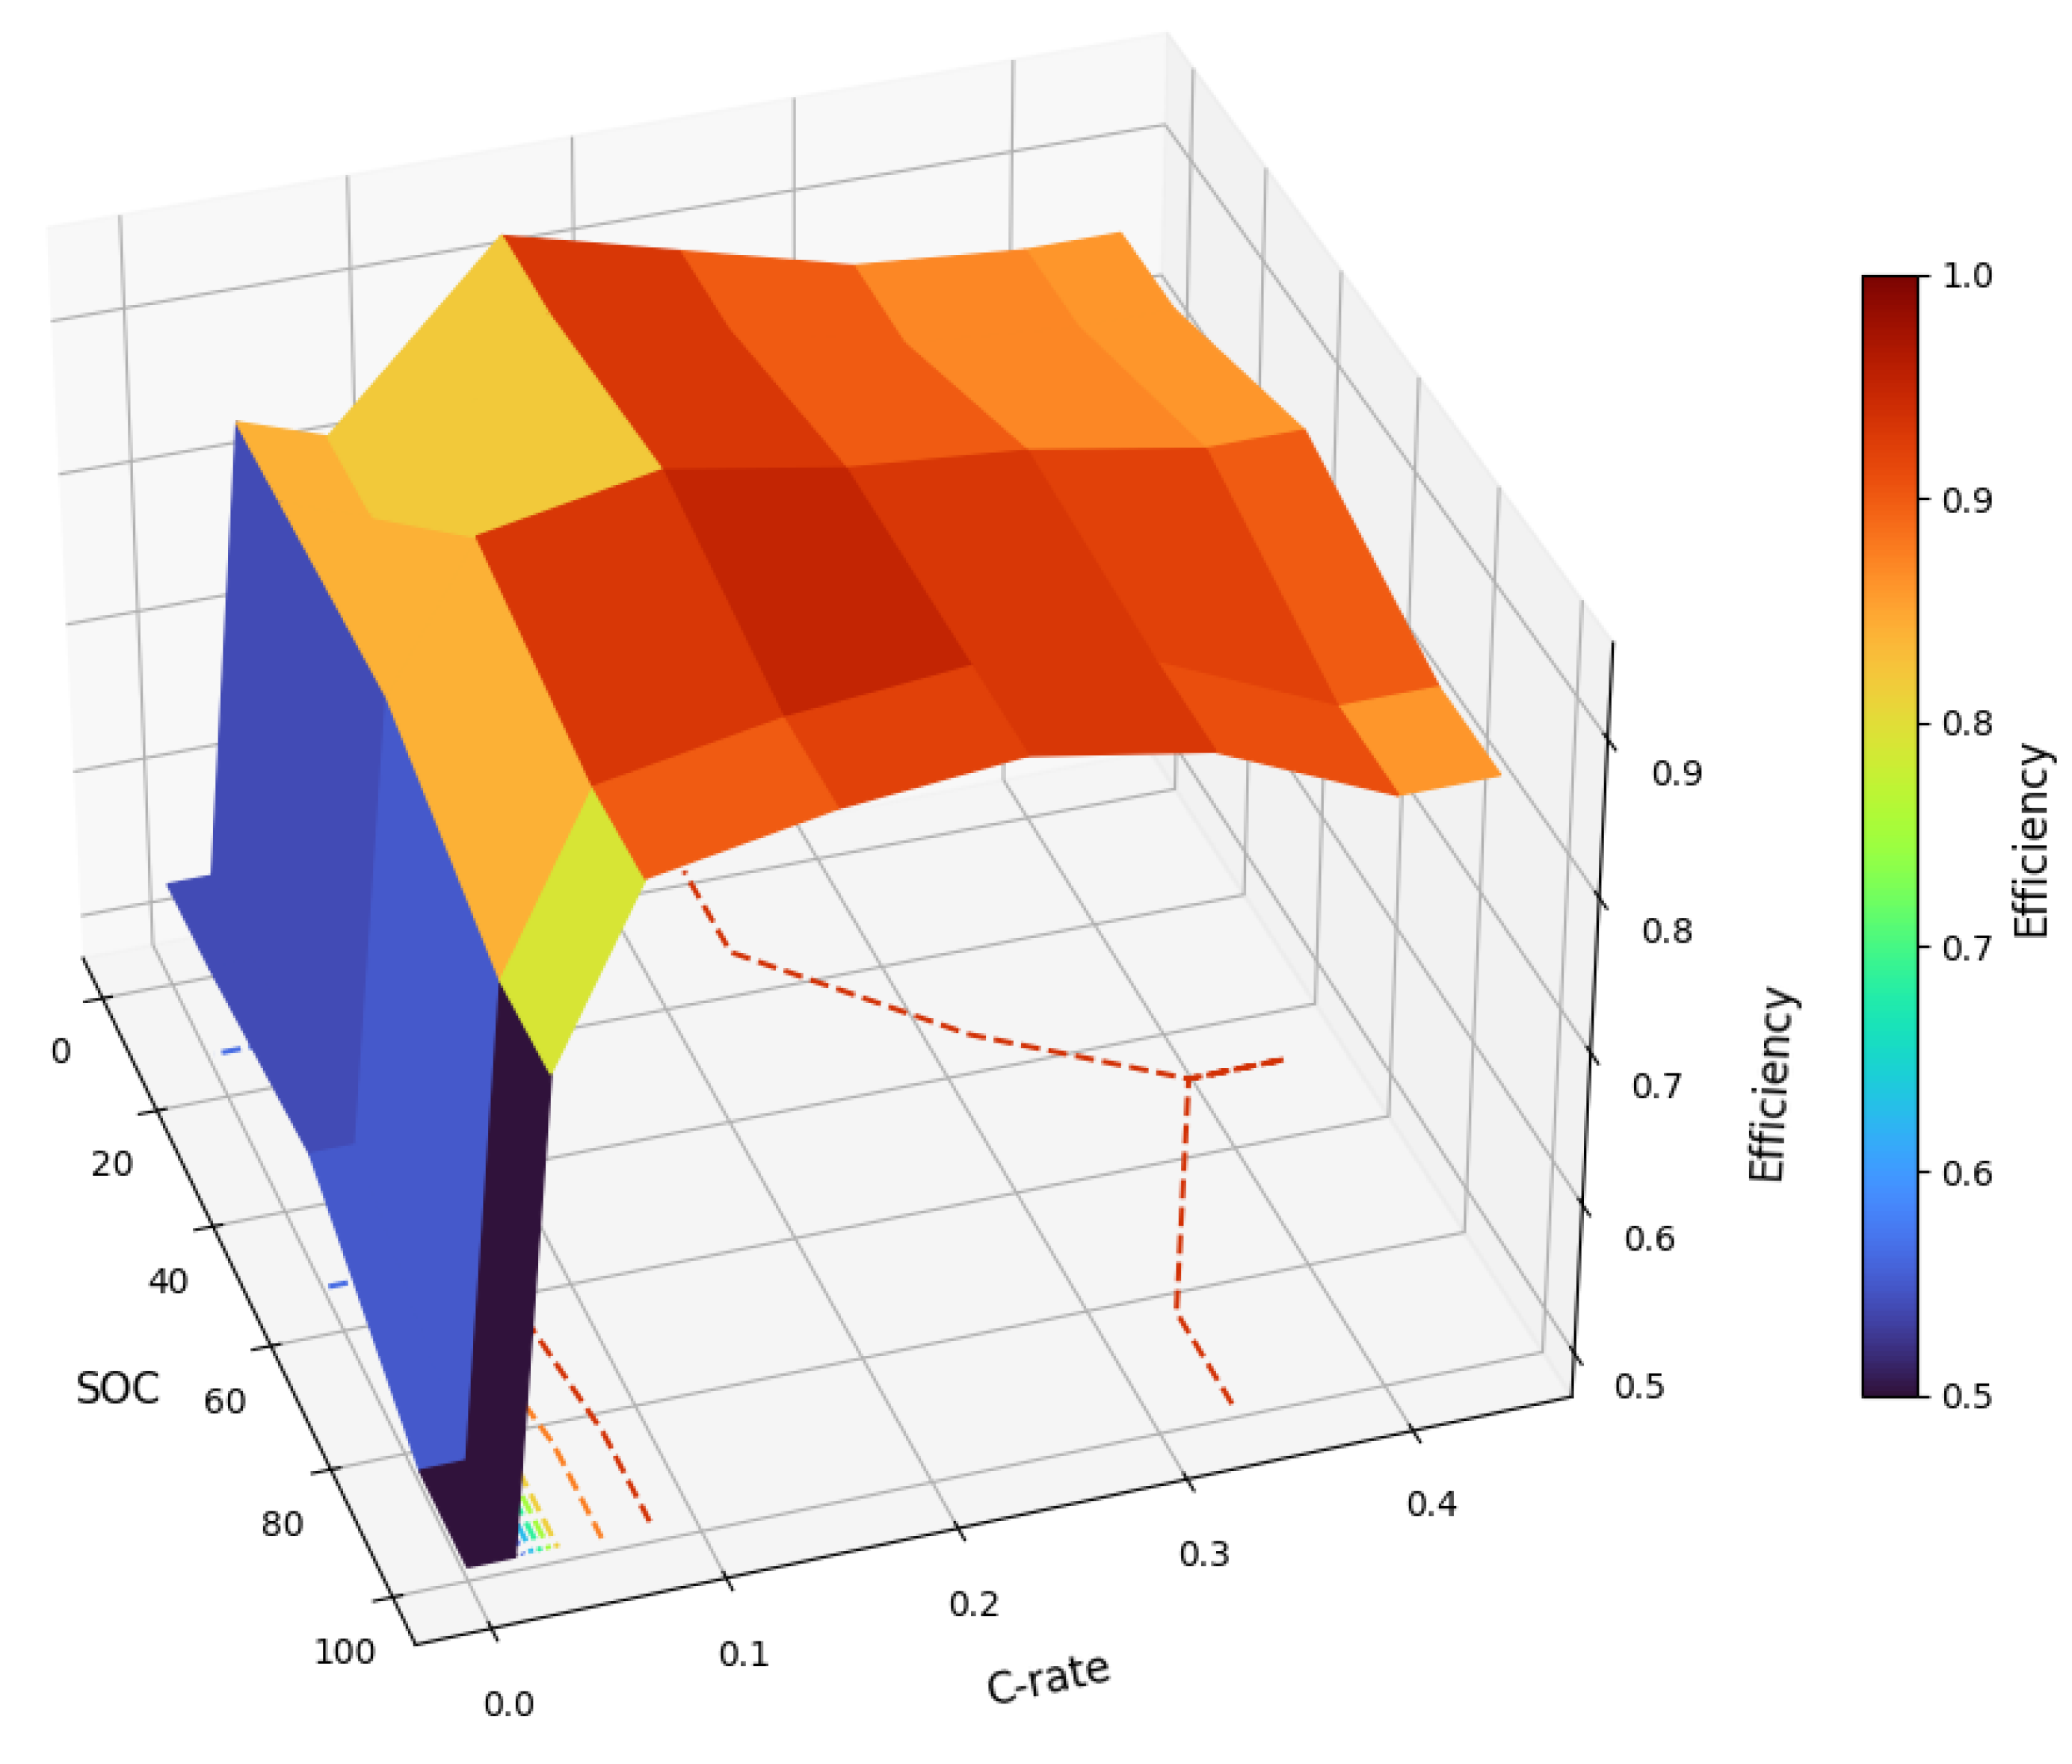
Figure 7.
Capability Curves.
3.2. Day-Ahead Market Model
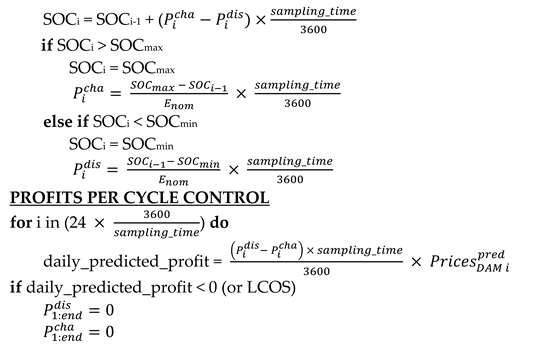
The main goal of the DAM model is to develop an efficient strategy to make energy arbitrage. The term energy arbitrage refers to the possibility of storage systems exploiting DAM spread to generate profits. To achieve this control, the algorithm identifies, by means of a predictive tool based on deep learning model, the minimum and maximum prices of the market each day to set up the proper control logic. To enhance the chances of achieving a positive economic profit, the procedure has a feedback control that checks whether the predicted daily profit is greater than zero, if not considering the Levelized Cost of Storage (LCOS), in case it is not the BESS will not submit any bid for that day.
The LCOS is a metric used to evaluate the overall cost of storing energy over the lifetime of an energy storage system. It is a valuable measure for comparing the economic viability of different energy storage technologies. LCOS is calculated as the total cost of the storage system divided by the total amount of energy stored and released by the system over its lifetime, as expressed in Equation (4):
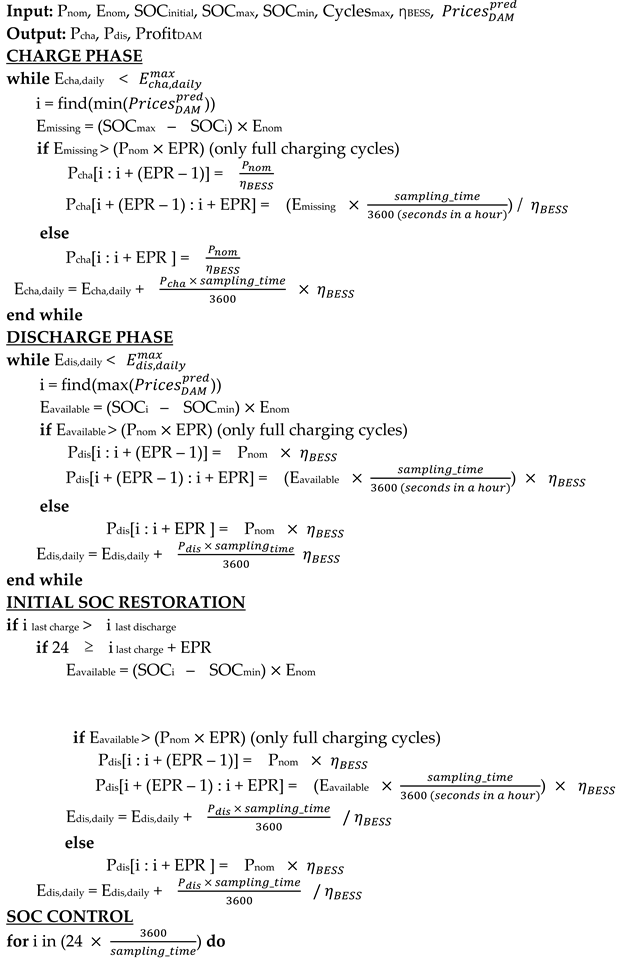
This control logic heavily impacts the arbitrage provision. Algorithm 1 describes the structure of the energy arbitrage on the day-ahead market algorithm in detail.
| Algorithm 1 Day-Ahead Market Energy Arbitrage | |
 | |
 | |
If the outcome is profitable, offers on DAM are structured as follows:
- Selling at a significantly reduced price to secure acceptance of the offer.
- Buying at a substantially higher price to ensure acceptance of the offer.
As already mentioned, the energy arbitrage strategy is based on predicted zonal prices via a neural network model that will be described in the following section.
3.2.1. Deep Learning Pz Prediction Tool
The DL model implemented is a hybrid neural network model that leverages both Long Short-Term Memory (LSTM) and Convolutional Neural Networks (CNN) to capture the temporal dynamics and spatial features of the data. The 83 features used for training the model are listed in Table 1.
The architecture includes layers of bidirectional LSTM, useful for capturing long-term relationships in sequential data [21], and CNN, used to extract local features from sequential data. Batch normalization [22] and dropout layers [23] are added to prevent overfitting and improve generalization.
A distinctive feature of this model is the incremental training of the model. Each day of the simulation, the training set is expanded with newly available data, continuously improving the model’s predictive capability. This incremental process allows the model to quickly adapt to changes in the energy market. The process is shown in Figure 8.
The model was trained using mean squared error (MSE) (see Equation (5)) as the loss function, with the Adam optimizer [24]. Early stopping was implemented to prevent overfitting [25], and a learning rate scheduler was used to improve convergence [26].
To assess the model's efficiency, various metrics are monitored during the tool's utilization. Additionally, the model's performance is compared with a Persistence Model, evaluating both against the actual Pz values. In particular, the metrics evaluated are the Mean Squared Error MSE (Equation (5)), the Root Mean Squared Error RMSE (Equation (6)) and R2 factor (Equation (7)).
3.3. Intra-Day Market – Continuous Trading Market XBID
XBID represents a new opportunity for energy resources, since it occurs slightly before real-time, and it is characterized by continuous trading where a bid is awarded at bid price as soon as it is accepted by another resource. This opens to various bidding strategies. This is a new market, gone live in many EU Member States in 2021: therefore, a statistical analysis of its early stage could be beneficial. It is presented in the next paragraph.
3.3.1. Comprehensive Statistical Analysis
Particular emphasis has been placed on studying and modeling the continuous trading session of the Intra-Day Market. Initially, an extensive statistical analysis of XBID data for the Italian wholesale market has been conducted, reviewing all the public offers submitted. As of the time of authoring this article, these offers total almost fifty million. This analysis is crucial for the subsequent modeling of XBID and the development of a strategy for the participation of the BESS in this market. The analysis involves a detailed examination of various statistical measures, including means μ and standard deviations σ of the bid prices, described in Equation (9) and Equation (10), to understand the central tendencies and variability in the data. Additionally, acceptance rates of offers by price range (Equation (8)) were analyzed to identify the price ranges for successful transactions. Distributions of accepted offers by price were also constructed using Kernel Density Estimation KDE to visualize the frequency and likelihood of different prices being accepted and to better understand the underlying distribution pattern (Equation (11)).
Furthermore, to capture the nuances of the market, these statistics were categorized based on several factors:
- Type of day – Dt: Weekday or Holiday, to account for variations in market behavior due to differences in demand and operational patterns.
- Hour of the day – hD: electricity consumption and prices can vary significantly throughout the day, necessitating a time-based analysis.
- Season – S: Different seasons impact electricity demand and supply conditions, which was factored into the analysis
- Hours in advance of the offer publication – hA: the timing of offer submissions was examined to understand its effect on offer acceptance.
- Type of offer - ot: Selling or buying, to distinguish the different dynamics in the market for sellers and buyers.
Where:
| is the kernel function. | |
| is the bandwidth. | |
| Are the data points. |
This detailed and multifaced analysis provides a thorough understanding of market dynamics, enabling the development of an informed and strategic approach to participating in the XBID market. It allows for the identification of optimal times and conditions for submitting offers and helps in tailoring strategies to maximize the efficiency and profitability of a BESS in the electricity market and it is central in the strategy of price formation for the bidding strategy.
3.3.2. Deep Learning Acceptance Probability Prediction Tool
To model a realistic bidding strategy, as already mentioned, a tool for the acceptance probability prediction has been developed.
The implemented deep learning model is a neural network that combines Bidirectional Long Short-Term Memory (BiLSTM) layers and Convolutional Neural Networks (CNN). This hybrid architecture effectively captures both temporal dynamics and spatial features present in the data.
The dataset used for training the model includes various features such as historical offer data, market data, and categorical data, with detailed descriptions provided in Table 2.
The model architecture leverages the following components:
- Bidirectional LSTM Layers: by processing data bidirectionally, the BiLSTM layers enhance the model’s ability to understand complex temporal patterns.
- Conv1D Layer: the convolution operation helps in identifying significant patterns and trends within smaller windows of the data sequence.
- Batch Normalization and Dropout: Batch normalization layers stabilize and accelerate training by normalizing the input of each layer, as described in Equation (12). Dropout layers randomly deactivate a fraction of neurons during training, making the model more robust.
Where:
| This is the input value for batch normalization at time t. | |
| This is the mean of the batch of input ht. | |
| This is the variance of the batch of input ht. | |
| A small positive value added to avoid division by zero during normalization. | |
| These are parameters learned during training and optimized during training |
- (4)
- Dense Layer: The output layer is a dense layer with a sigmoid activation function, used for binary classification. This layer outputs the probability of offer acceptance and can be represented by Equation (13) that encapsulates the fundamental operation of a neural network layer:
Where:
| This is the output of the neural network layer after applying the activation function σ. | |
| This is the activation function, in this case Sigmoid: , this function squashes the input to a range between 0 and 1 | |
| This represents the weight matrix. It contains the weights that are learned during the training process. | |
| This is the input vector to the layer at time t. | |
| This represents the bias vector. |
The model utilizes Binary cross-entropy loss function (Equation (14)) as metric to optimize that is one of the metrics most suitable for binary classification tasks and model accuracy is monitored during training process.
The model undergoes training over multiple epochs with a large batch size, utilizing the dataset's full potential to ensure stable updates and efficient convergence. Validation data is used to monitor the model's performance and make necessary adjustments to prevent overfitting.
To evaluate the efficiency of the model, relevant metrics are stochastically monitored. Evaluated metrics include Accuracy, that measures the fraction of correctly predicted instances out of total instances (Equation (15)), the Precision, that measures the fraction of true positives among all positive predictions (Equation (16)), Recall (or Sensitivity), that measures the fraction of true positives that were correctly identified (Equation (17)), and lastly the F1-score, that is the harmonic mean of precision and recall and balances these two metrics (Equation (18)).
| Accuracy: | (15) | |
| Precision: | (16) | |
| Recall: | (17) | |
| F1-Score: | (18) |
Given the future strategy of using predicted probabilities for decision-making, it is crucial to evaluate the model in a manner that aligns with this operational context. This involves conducting multiple simulations of stochastic predictions, which mimics how the model would function in the XBID simulation. By measuring the variation in metrics across these simulations, we can gauge the model's resilience to fluctuations in predicted probabilities.
The optimal number of simulations to assess metrics is determined through an iterative process where the number of stochastic simulations is incrementally increased. This continues until a specified metric variation (Equation (19)), falls below a predefined tolerance (ε). This iterative approach ensures that the metrics stabilize sufficiently amidst the variability introduced by different stochastic predictions. Ultimately, it strikes a balance between computational efficiency and the thoroughness needed for robust metric evaluation.
| Condition: | (19) |
Where:
| : | Standard Deviation of the metric values calculated for each simulation |
This methodical evaluation is essential for ensuring the reliability and effectiveness of the model in practical applications, where decisions hinge on probabilistic predictions.
3.3.3. XBID Offer Price Decision Mechanism
With data from the statistical analysis and with the prediction tool, a model of a bidding strategy on XBID has been developed.
Through the historical data analyzed in the previous statistical analysis an appropriate price for the bid is established; for each hour, considering the season and the year, the optimal bid submission interval is identified. Subsequently, the corresponding average price is determined. Using the previously constructed distributions, the price with the highest probability of acceptance is evaluated. In fact, knowing that the Kernel Density Estimation for a given data set is defined as in Equation (3.9), to determine the optimal discharging price, the price range where the probability density is maximized has to be identified. This involves integrating the KDE over different intervals and finding the interval with the maximum integrated density.
The initial lower bound is set equal to the mean price of the selected submission interval augmented of the LCOS and the price ranges are identified as:
The KDE is integrated over each price range, as described in Equation (20):
and from the price range with the highest Area, the optimal discharging price is obtained as in Equation (21):
Before submitting the offer, profit control is introduced, securing a profit downstream from the strategy. This is possible introducing the hypothesis that, for charging offers, the battery acts as price-taker accepting the offer with the price closest to the average present on XBID order book for the hour selected for charging. Furthermore, if the spread between and results non profitable, the is adjusted as in Equation (22):
The flow of the bidding strategy can be seen in Figure 9.
3.3.4. XBID Control Strategy
Energy arbitrage in the XBID market is an advanced strategy designed to profit from energy price fluctuations.
The implemented control strategy combines predictive models, statistical price analysis, and operational enhancement of the Battery Energy Storage System (BESS). By precisely managing charging and discharging operations, this strategy aims to maximize profits from energy arbitrage, effectively capitalizing on market dynamics.
The strategy introduced firstly ensures the feasibility of the battery’s program considering the constraints on the state of charge (SOC) of the battery and adhering to the schedule established in the Day-Ahead Market (DAM). In fact, if the initial SOC is too low, it is adjusted to fall within the operational range to ensure the operability of the BESS. Additionally, the charging phase following an accepted discharging phase must commence within two hours after the discharge. This ensures that the battery capacity is available throughout the day, allowing for multiple discharging phases to occur.
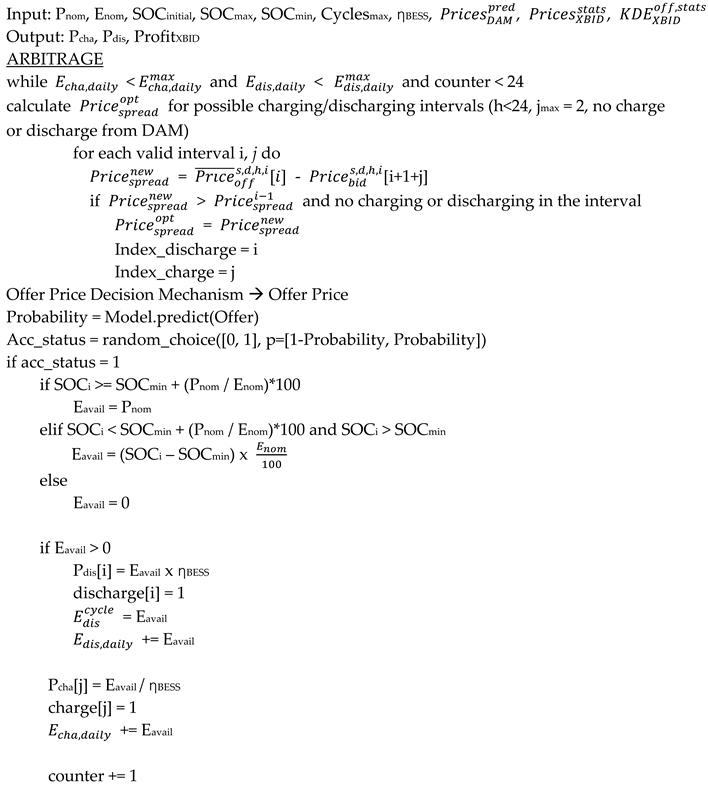
For each hour, the arbitrage opportunity is identified by maximizing the spread between the average price during the discharge period and the bid price during the charging period, which must occur within two hours of the discharge period, and to ensure to not overlap the operations defined on DAM. For the selected hour, a sell bid is submitted, and the probability of its acceptance is evaluated using the previously defined DL Tool. If the bid is accepted, the Battery Energy Storage System (BESS) begins the discharge phase, considering the available energy and system capacity. Simultaneously, a charge offer is accepted from the order book, assuming it is reasonable to accept an offer at an average price, and, at the identified hour, the SOC is restored to prepare the BESS for further arbitrage opportunities.
The control strategy can be summarized by Algorithm 2.
| Algorithm 2 XBID Market Energy Arbitrage | |
 | |
4. Case Studies and Results
All models and simulations consider the period from April 1, 2023, to March 31, 2024, as the simulation period. Data for zonal prices on DAM, prices and quantities traded on XBID, and public offers on XBID were collected from the GME website [16]. The considered BESS is a utility-scale stand-alone BESS with a nominal power of 10 MW and a nominal capacity of 30 MWh, resulting in an Energy-to-Power Ratio (EPR) of 3 (eq(23)), following the model developed by Rancilio et al. [15], as previously introduced.
During this simulation period, market behaviors vary notably. Firstly, due to seasonal price fluctuations. Additionally, the average behavior in 2023 differs significantly from that in 2024. This is evident by simply observing the zonal price trends for the NORD electricity area during the simulation period, as depicted in Figure 10.
Indeed, it is easy to observe that in 2023, the average zonal prices for NORD electrical zone are much higher compared to 2024, specifically at 127.78 €/MWh and 92.32 €/MWh respectively. These characteristics provide a broader understanding of how the models respond to variations in boundary conditions. Furthermore, the analysis of the data highlights not only significant differences in average prices between 2023 and 2024 but also substantial variations in price volatility and frequency of price spike events. These observations are crucial for understanding how forecasting models and simulations respond to dynamic market scenarios, influencing strategic decisions concerning the optimization of energy resources and long-term risk management.
The study's fundamental analysis involves evaluating operational and profitability aspects in two main scenarios: DAM alone and XBID combined with DAM for SOC restoration. Each scenario is further divided into two cases: one with a negligible LCOS and the other where LCOS significantly impacts the operational strategy.
For the evaluation of LCOS, described in Equation (4), data used are shown in Table 3.
Considering these data, the equivalent LCOS is estimated equal to 53.14 €/MWh.
4.1. Day-Ahead Market – DAM
The study initially focused on the investigation and analysis of DAM simulation and the development and implementation of the Deep Learning (DL) Tool for zonal price prediction. The primary objective was to assess the effectiveness and feasibility of BESS operations in the DAM under varying market conditions and the influence of advanced price prediction methodologies.
4.1.1. Deep Learning Pz Prediction Tool
The hybrid neural network model developed for zonal price (Pz) prediction demonstrates notable improvements over the Persistence Model (D-1), although these enhancements do not fully align with the actual Pz values. The performance of the model was assessed using three primary metrics: Mean Squared Error (MSE), Root Mean Squared Error (RMSE), and the R2 factor. These metrics provide a comprehensive understanding of the model's accuracy and reliability in predicting Pz values.
The Mean Squared Error (MSE) metric served as both the loss function during the training process and a primary evaluation metric for assessing the performance of the hybrid neural network model. MSE measures the average of the squares of the errors, representing the differences between the predicted and actual zonal price (Pz) values. Lower MSE values indicate a more accurate model, as they reflect smaller discrepancies between the predicted outcomes and the actual values.
In this evaluation, the hybrid model achieved an MSE of 326.97, which is lower than the Persistence Model's MSE of 378.85. This represents a 13.69% improvement, underscoring the hybrid model's effectiveness. This substantial reduction in MSE can be attributed to several key factors. Firstly, the hybrid model leverages a comprehensive set of features, including historical Pz prices, meteorological data, gas prices, and the Global Horizontal Irradiance (GHI) index. This extensive feature set allows the model to capture the complex interactions and dependencies that influence zonal prices, leading to more accurate predictions. The continuous learning process ensures that the model remains relevant and effective, even as market conditions evolve. Despite these improvements, the remaining MSE of 326.9744 indicates that there is still room for further enhancement in the model's accuracy. While the hybrid architecture improves prediction accuracy, increasing the model's complexity can also lead to overfitting, where the model performs well on training data but less effectively on unseen data. Furthermore, zonal prices are influenced by a wide range of external factors, including regulatory changes, geopolitical events, and economic conditions, which may not be fully captured by the model.
The Root Mean Squared Error (RMSE), offers an interpretable measure of the prediction errors. The hybrid model's RMSE was 18.08, while the Persistence Model's RMSE was 19.46, reflecting a 7.1% improvement. Despite this reduction in prediction errors, the deviations between the predicted and actual values indicate that the model's predictions are not yet perfectly accurate. The slightly better behavior of the hybrid model is shown in Figure 11.
The R2 factor, representing the proportion of the variance in the dependent variable that is predictable from the independent variables, further validates the model's performance. The hybrid model achieved an R2 of 0.624, compared to the Persistence Model's R2 of 0.5643, indicating a 10.58% improvement. While the higher R2 value demonstrates that the hybrid model captures more of the underlying patterns and temporal dynamics in the data, the gap between the model predictions and actual values suggests that some variance remains unexplained.
The hybrid model consistently outperformed the Persistence Model across all evaluation metrics as can be seen in Table 4.
The significant reduction in MSE and RMSE values highlights the enhanced predictive capability of the hybrid model. Additionally, the higher R2 values indicate that the hybrid model provides a better fit to the data, capturing more variance and offering more accurate predictions. However, the improvements, while significant, do not completely align the predicted values with the actual Pz values, indicating that further refinement is necessary.
The results obtained from the hybrid neural network model have several important implications for energy market forecasting and decision-making. The inclusion of meteorological data, such as temperature, precipitation, and wind speed, significantly enhances the model's predictive accuracy. These factors, which influence energy demand and supply, are crucial for accurate Pz predictions. The model's ability to integrate and learn from these diverse data sources underscores its comprehensive approach to forecasting.
Another significant insight from the analysis is that while the DL model does not perfectly predict the exact zonal price values, it identifies trends and price peaks on the DAM. The peaks are crucial for devising an effective arbitrage strategy on the DAM. Indeed, the price predictions will be used to define the charging/discharging times of the BESS, while the bid price will not be influenced by the price model. This is better clarified in the following.
4.1.2. Energy Arbitrage Strategies
To analyze the scenarios on DAM, the energy purchased and sold during the simulation period was examined along with the resulting cycles completed within the same period. Additionally, the profits generated were considered, considering also any energy purchases required to meet the power demanded by auxiliaries in cases where the SOC was insufficient.
To provide a more comprehensive financial analysis, we introduce the Net Present Value (NPV) analysis for the scenarios under discussion. This metric is used to evaluate the profitability of the investment and represents the difference between the present value of cash inflows and the present value of cash outflows over the service life of the BESS. NPV is a widely used tool in capital budgeting and investment planning because it accounts for the time value of money, allowing for the comparison of different investment scenarios. NPV can be calculated using Equation (24):
Where:
| SL | It is the service life of the BESS and can be calculated as |
| i: | It is the discount rate, considered fixed and it is hypothesized to be 5% [4] |
As previously mentioned, the two cases analyzed were:
- Negligible LCOS: LCOS = 0
- Significant LCOS: LCOS = 53.14 €/MWh
The initial conditions were kept constant for both scenarios and are summarized in the table below.

Table 5.
Initial Conditions for DAM Simulations.
| CASE A | CASE B | |
| Simulation Period | From 2023/04/01 to 2024/03/31 | |
| Pnom | 10 MW | |
| Enom | 30 MWh | |
| SOCmin | 5% | |
| SOCmax | 95% | |
| SOCinitial, 0 | 5% | |
| LCOS | 0 €/MWh | 53.14 €/MWh |
The two simulations yielded significantly different results, highlighting the substantial impact of LCOS on DAM market strategy. Specifically, the profits decreased by 92.86% due to the effect of LCOS. This is shown in Table 6 and Table 7.
This decrease with the introduction of the LCOS constraint is primarily attributable to the zonal price trends on the DAM, which do not present favorable conditions for battery application. During the simulation period, the average daily spread between the highest and lowest prices was 70.9 €/MWh, with peaks of 159.44 €/MWh on 22 April 2023, and a low of 9.48 €/MWh on November 12, 2023. This trend is even more pronounced when considering price trends in 2024, where the average spread reaches only 54.94 €/MWh. The reduced profitability under the LCOS constraint underscores the critical influence of price volatility on the economic viability of battery storage in the DAM market. Furthermore, a high number of inactive days increase the relevance of auxiliaries’ power on the profit loss; this can be seen in Figure 13 and Figure 14.
In these graphs, the red lines represent sessions where the profit is negative, clearly illustrating the aforementioned trend.
The resulting NPV, -8.4 M€ for Case A and -10.03 M€ for Case B, is widely negative and demonstrates the unprofitability of energy arbitrage on DAM with considered prices. This is due to the limitations caused by low volatility in DAM zonal prices, as the discounted revenues and operating costs do not cover the initial investment in the battery.
This led to the exploration of new revenue opportunities in the Intra-Day market, particularly with a focus on XBID.
4.2. Intra-Day Market – XBID
The Intra-Day market, and more specifically the XBID market, presents a promising alternative for generating revenue. The XBID market allows for continuous trading and takes advantage of real-time price fluctuations, providing opportunities to capitalize on higher price volatility. This market’s Pay-As-Bid remuneration system further enhances the potential for profitability, as it enables more strategic bidding and better alignment of revenues with the actual market conditions.
4.2.1. Comprehensive Statistical Analysis
The Intra-Day Market has established itself as a crucial tool for operators in planning their production schedules, reaching an all-time high in traded volumes in 2023 (29.1 TWh, up by 3.1 TWh from 2022). As in 2022, these trades were mainly concentrated in auction trading (22.3 TWh, up by 0.4 TWh from 2022), particularly in the MI-A1 segment. However, it was the XBID market that drove overall growth, with over 3.5 million matched trades (more than double from 2022) and nearly 6.8 TWh traded (up by 2.8 TWh). Within the Intra-Day Market, XBID has become the second most liquid segment, accounting for 23% of the total volume (up by 8 percentage points). Regarding the different zones, the modest increase in auction trading volumes was concentrated in both purchasing and selling in the North, which remains the most significant zone in terms of traded quantities, and in the Central North. On the other hand, XBID saw substantial growth on both sides of the market across all zones.
The dynamics and average global price levels on XBID are consistent with those observed on DAM, as shown in Figure 15 and Figure 16.
However, more interesting results that can leverage the potential of this market can be observed by examining the variance of accepted prices. By considering the classification described in 3.3.1, and focusing on the year 2023, which is more useful for simulation purposes and more representative compared to 2022 (which shows abnormal trends), the results are shown in Figure 17.
From this initial analysis, it is evident that the variance already suggests additional earning potential. Furthermore, the analysis indicates that, in all examined cases, the most optimal submission intervals to exploit this advantage are (0, 2] and (2, 4] hours. These intervals consistently show higher deviations, with peaks of up to 80 €, compared to other intervals, indicating greater price volatility. In the context of energy arbitrage, particularly for a BESS, this represents a significant opportunity. For further confirmation of this opportunity, the probabilities of acceptance based on the deviation from the average price were also analyzed, considering intervals of 20 €/MWh, as shown in Figure 18.
From the graphs just shown, it is evident that there are statistical gaps that render this acceptance prediction mechanism unusable in a realistic simulation. Therefore, the price distributions of accepted offers are constructed to serve as a tool for the bidding price decision mechanism. These distributions are created for each hour based on the previously introduced classification and are reported in Figure 19 (for simplicity, they are shown only for hour 12 of each category).
This statistical analysis is an important baseline for future detailed analysis.
4.2.2. Deep Learning Acceptance Probability Prediction Tool
This Deep Learning Acceptance Probability Prediction Tool was developed to address the limitations identified in the statistical analysis described in paragraph 4.2.1. This tool leverages deep learning techniques to overcome these limitations and achieve a more accurate prediction of acceptance probability.
The training process reveals good performance, and it is evident from the results (Figure 20) that the model does not suffer from overfitting. This favorable outcome can be attributed to the incorporation of batch normalization and dropout layers in the neural network architecture. Batch normalization helps in stabilizing and accelerating the training process by normalizing the input layer by adjusting and scaling the activations. Dropout layers, on the other hand, prevent overfitting by randomly dropping units during the training process, ensuring that the network does not become overly reliant on specific nodes and promoting generalization.
The evaluated metrics are reported in Table 8. To ensure a comprehensive view of the model’s performance, the evaluation of the Area Under the ROC Curve (AUC) is added. The ROC, or Receiver Operating Characteristic curve plots the true positive rate against the false positive rate at various threshold settings, and its result is shown in Figure 21.
The evaluation metrics reveal a mixed performance of the neural network. The accuracy of 0.81 is relatively high, suggesting good overall performance. However, the precision 0.58 and recall 0.57 are moderate, indicating potential issues with false positives and false negatives, respectively. The F1-Score of 0.58 reflects a balance but also highlights that there is room for improvement in both precision and recall. Notably, the AUC value of 0.91 is very high, indicating that the model performs exceptionally well in distinguishing between the classes. This suggests that while the threshold for classification might need adjustment to improve precision and recall, the underlying model has a strong capacity for classification.
In conclusion, while the neural network demonstrates promising capabilities, particularly in its discrimination power, further refinements are necessary to enhance precision and recall. These adjustments will ensure a more robust performance across various scenarios, ultimately improving the model’s reliability and effectiveness in practical applications.
4.2.3. XBID Arbitrage Strategy
Similarly to DAM simulation, two scenarios are considered and in Table 9 the initial conditions for both scenarios are provided:
In XBID simulations, the energy acquired to satisfy auxiliary power demand is considered as being bought on the DAM to ensure the satisfaction of the overall system's energy requirements. By treating auxiliary power as a separate purchase on the DAM, the simulation can accurately reflect real-world conditions, providing a more realistic assessment of the system's performance and potential market impacts.
The two scenarios’ simulations provided the results described in following tables.
Table 11.
XBID Case C.
| CASE D | |
| Operative Days | 366 |
| 8702.8 MWh | |
| 7446.33 MWh | |
| N° Total Cycles | 269.15 |
| 226517.09 €/year | |
In comparison to the findings for the DAM, there is an immediately noticeable increase in the number of active days in both scenarios, which span the entire simulation period. This extended activity period results in a substantial increase in the traded volumes. Consequently, the annual cycles rise significantly, reaching 268.8 and 269.15, respectively. Moreover, unlike the results observed for DAM, it appears that the most profitable scenario is Case D, where the LCOS is not negligible. The primary reason for the higher profitability in Case D is attributed to the greater risk assumed in this scenario. By taking on higher risks, the scenario leverages the potential for higher returns, resulting in a considerably higher profit margin. The Revenues from the two scenarios are represented in Figure 22 and Figure 23.
However, the NPV resulting from Case C and Case D is respectively -8.53 M€ and -8.54 M€. The persistent negative NPVs in both scenarios indicate that the project is still not financially feasible under the given conditions. These results can partly be explained by a very conservative bidding strategy in both cases, which tends to optimize the probability of acceptance with a minimal profit risk factor. This cautious approach, while increasing the likelihood of bid acceptance, significantly impacts the project's overall profitability.
To address this, a sensitivity analysis on the bid price was conducted by increasing the risk factor to evaluate its impact and the opportunities it opens for optimizing the bidding strategy on XBID. The analysis aimed to find a balance between bid acceptance probability and potential profitability. By adjusting the risk factor, we explored various scenarios to determine how higher bid prices could improve the financial outlook of the project.
Bid Price Sensitivity Analysis
The analysis considered five different scenarios to evaluate the impact of varying bid prices. The first scenario, referred to as the base case (Case D), served as a benchmark for comparison. In the subsequent scenarios, the selling bids on XBID were incrementally increased by 1 to 5 LCOS, respectively. By systematically increasing the bid prices, the analysis aimed to understand the influence of higher bid levels on the overall bidding strategy. This incremental approach allowed us to observe the corresponding changes in bid acceptance probabilities and potential profitability across different price points. The base case provided a reference point to measure the deviations and improvements observed in the other scenarios.
The results of the sensitivity analysis (Table 12) reveal a clear and consistent trend. As the bid price increases, there is a noticeable reduction in the amount of energy both bought and sold on the XBID market, with a subsequent reduction in the number of operational yearly cycles, that from 269.15 in Case D reduce to 108.38 in Case 5. This trend indicates that higher bid prices result in fewer transactions and less frequent cycling of the storage system. The reduction in operational activity can be attributed to the less frequent engagement of the system in the market at higher price points, as higher prices reduce the likelihood of bid acceptance. However, despite the decrease in operational activity, there is a significant increase in profitability with each increment in bid price. This is evidenced by the substantial rise in total yearly profit and the improvement in NPV, as the yearly profit grows from € 227k for Case D to € 839k, as shown in Figure 24, and NPV improves from -8.54 M€ to +1.54 M€.
These results highlight that while higher bid prices reduce the volume of energy traded and the number of operational cycles, they significantly enhance the financial outcomes of the project. This is likely due to the higher revenue per unit of energy sold, which outweighs the reduction in volume. Consequently, this analysis suggests that adopting a strategy with higher bid prices can make the project more economically viable. By optimizing the bid price, the project can achieve a better balance between operational activity and profitability, ensuring a positive financial return and a sustainable business model in the competitive XBID market.
5. Conclusions and Future Work
This research has developed multiple tools and strategies aimed at modeling an efficient approach to operating within the Italian Wholesale Market. The primary focus has been on analyzing the feasibility and profitability of BESS operations in various scenarios.
First and foremost, the study reveals that the Intra-Day Market, and particularly XBID, offers significant opportunities to exploit the arbitrage capabilities of a battery. The transition from a strategy centered solely on the DAM (Case A and Case B) to a strategy centered on XBID (Case C and Case D) demonstrates a remarkable increase in potential annual earnings – from €19,359.36/year to €226,517.09/year. The first key finding is the complete unprofitability of the DAM, due to its today’s price distribution and spreads. Additionally, the results highlight the fundamental impact of the Bid Price Decision Mechanism on the economic performance of the battery. Optimal scenarios emerge when considering an elevated risk factor (moving from Case 1 to 5), which show high yearly earnings and an increase in NPV. In fact, Case 4 and 5 are the only scenario with sufficient profitability, resulting in a positive NPV (0.28 and 1.54 M€), making this strategies the only economically viable. Increasing the risk factor further could potentially lead to enhanced outcomes, such as higher profits and greater returns on investment. However, it also reduces the acceptance probability of bids, thereby exposing battery operations to higher levels of uncertainty. As a result, while the potential for greater rewards exists, the risks associated with these scenarios could outweigh the benefits, making the operations less stable and predictable.
Looking at the strategies developed for BESS operations, the study reveals that they heavily depend on the efficiency and accuracy of the predictive models introduced. Two key models analyzed in the study are the Pz Prediction Tool and the Acceptance Probability Prediction Tool. The findings indicate that these tools, while capable of outperforming basic strategies, still require further investigation and refinement. The Pz Prediction Tool has shown promise in enhancing decision-making processes for battery operations. Similarly, the Acceptance Probability Prediction Tool aims to predict the likelihood of bid acceptance, thereby optimizing bidding strategies. However, both tools have limitations that need to be addressed to maximize their effectiveness. Further refinement of these predictive models could involve incorporating more comprehensive data sets, improving algorithmic accuracy, and conducting extensive testing across different market conditions. By enhancing these models, the strategies for BESS operations can become more robust, leading to increased profitability and reduced risk.
In future research, market models incorporating quarter-hourly products could be developed to align with the new regulations set to be introduced in the Italian electricity market in 2025 [17]. This shift is significant, as the current study has focused solely on hourly products. By adopting quarter-hourly products, market participants could potentially capitalize on the increased granularity and precision in trading.
The introduction of quarter-hourly products is expected to enhance the ability to exploit the continuous trading market and its inherent price volatility. Furthermore, future simulations could explore a hybrid strategy that engages in arbitrage across both major spot markets, potentially capitalizing on the optimal operational windows of each. Additionally, implementing an aging model for studying the impact of aging induced by each cycle on the bidding strategy could improve the price selection with respect to using the LCOS.
It is worth noting that, in last years, new awareness arose on the pivotal role of energy storage system deployment. This led governments to propose mechanisms to assure a stable and sufficient remuneration for fostering new projects. Another future development could involve integrating the entire process of market participation into the model, including these long-term agreements such as the new mechanism for procurement of storage capacity (MACSE - Meccanismo di Approvvigionamento di Capacità di Stoccaggio Elettrico), the spot market already considered, and ASM, in a revenue stacking approach. This holistic approach would provide a comprehensive view of market dynamics and enhance the strategy's ability to optimize across multiple market segments, thereby potentially increasing profitability and operational efficiency for BESS operations.
[1] SOCmin and SOCmax are introduced to avoid trespassing the BESS capability limits
Author Contributions
Conceptualization, D.A. and G.R..; methodology, D.A.; software, D.A.; validation, D.A., M.S. and A.S.; investigation, F.B., D.A. and G.R; data curation, D.A., M.S., A.S. and F.B.; writing—original draft preparation, D.A.; writing—review and editing, D.A. and G.R.; visualization, D.A. and G.R.; supervision, G.R. All authors have read and agreed to the published version of the manuscript.
Funding
This study was partially carried out within the NEST - Network 4 Energy Sustainable Transition (D.D. n. 1561, 1.10.2022, PE0000021) and received funding under the Piano Nazionale di Ripresa e Resilienza (PNRR), Mission 4 Component 2 Investment 1.3, funded from the European Union - NextGenerationEU. This manuscript reflects only the authors' views and opinions, neither the European Union nor the European Commission can be considered responsible for them.
Institutional Review Board Statement
Not applicable
Informed Consent Statement
Not applicable.
Data Availability Statement
Data will be made available upon request.
Conflicts of Interest
The authors declare no conflicts of interest.
References
- I. E. A. (IEA). Renewables 2023,” Paris. 2024. Available online: https://www.iea.org/reports/renewables-2023 (accessed on 27 May 2024).
- Sarah Brown, D.J.; et al. European Electricity Review: 2023 Data Analysis. 2024. [Google Scholar]
- T. S.p.A., “Consumi Elettrici 2023.
- Kebede, A.A.; Kalogiannis, T.; Van Mierlo, J.; Berecibar, M. A comprehensive review of stationary energy storage devices for large scale renewable energy sources grid integration. Renew. Sustain. Energy Rev. 2022, 159, 112213. [Google Scholar] [CrossRef]
- Prakash, K.; Ali, M.; Siddique, N.I.; Chand, A.A.; Kumar, N.M.; Dong, D.; Pota, H.R. A review of battery energy storage systems for ancillary services in distribution grids: Current status, challenges and future directions. Front. Energy Res. 2022, 10, 971704. [Google Scholar] [CrossRef]
- Energy Agency, I. World Energy Outlook Special Report Batteries and Secure Energy Transitions. Available Online: www.iea.org.
- Datta, U.; Kalam, A.; Shi, J. A review of key functionalities of battery energy storage system in renewable energy integrated power systems. Energy Storage 2021, 3, e224. [Google Scholar] [CrossRef]
- Rana, M.; Uddin, M.; Sarkar, R.; Shafiullah, G.; Mo, H.; Atef, M. A review on hybrid photovoltaic – Battery energy storage system: Current status, challenges, and future directions. J. Energy Storage 2022, 51, 104597. [Google Scholar] [CrossRef]
- Abiodun, K.; Hood, K.; Cox, J.L.; Newman, A.M.; Zolan, A.J. The value of concentrating solar power in ancillary services markets. Appl. Energy 2023, 334, 120518. [Google Scholar] [CrossRef]
- Kumar, D.; Dhundhara, S.; Verma, Y.P.; Khanna, R. Role of optimal sized dual energy storage based microgrid for ancillary service support to utility grid. Sustain. Energy Technol. Assessments 2022, 54, 102675. [Google Scholar] [CrossRef]
- Schwidtal, J.M.; Agostini, M.; Coppo, M.; Bignucolo, F.; Lorenzoni, A. Optimized operation of distributed energy resources: The opportunities of value stacking for Power-to-Gas aggregated with PV. Appl. Energy 2023, 334, 120646. [Google Scholar] [CrossRef]
- Fusco, A.; Gioffré, D.; Leva, S.; Manzolini, G.; Martelli, E.; Moretti, L. Predictive Energy Management System for a PV-BESS system bidding on Day-Ahead and Intra-Day electricity markets. In Proceedings of the 2023 IEEE Belgrade PowerTech, Belgrade, Serbia, 25–29 June 2023; pp. 1–6. [Google Scholar] [CrossRef]
- Algarvio, H.; Lopes, F. Strategic Bidding of Retailers in Wholesale Markets: Continuous Intraday Markets and Hybrid Forecast Methods. Sensors 2023, 23, 1681. [Google Scholar] [CrossRef] [PubMed]
- Boukas, I.; Ernst, D.; Théate, T.; Bolland, A.; Huynen, A.; Buchwald, M.; Wynants, C.; Cornélusse, B. A deep reinforcement learning framework for continuous intraday market bidding. Mach. Learn. 2021, 110, 2335–2387. [Google Scholar] [CrossRef]
- Rancilio, G.; Lucas, A.; Kotsakis, E.; Fulli, G.; Merlo, M.; Delfanti, M.; Masera, M. Modeling a Large-Scale Battery Energy Storage System for Power Grid Application Analysis. Energies 2019, 12, 3312. [Google Scholar] [CrossRef]
- GME. Mercato elettrico a pronti (MPE) - MGP, MI, MPEG, MSD. Available online: https://www.mercatoelettrico.org/it/mercati/mercatoelettrico/mpe.aspx (accessed on 29 May 2024).
- ARERA. Testo Integrato del Dispacciamento Elettrico TIDE. Available online: https://www.arera.it/en/atti-e-provvedimenti/dettaglio/22/685-22 (accessed on 29 May 2024).
- GME. Zones. Available online: https://www.mercatoelettrico.org/en/mercati/mercatoelettrico/Zone.aspx (accessed on 29 May 2024).
- GME, “Vademecum della borsa elettrica italiana.
- Andrea, D. Battery Management Systems for Large Lithium-ion Battery Packs. In EBL-Schweitze; Artech House: London, UK, 2010. [Google Scholar]
- Hua, Y.; Zhao, Z.; Li, R.; Chen, X.; Liu, Z.; Zhang, H. Deep Learning with Long Short-Term Memory for Time Series Prediction. IEEE Commun. Mag. 2019, 57, 114–119. [Google Scholar] [CrossRef]
- Garbin, C.; Zhu, X.; Marques, O. Dropout vs. batch normalization: an empirical study of their impact to deep learning. Multimedia Tools Appl. 2020, 79, 12777–12815. [Google Scholar] [CrossRef]
- Srivastava, N.; Hinton, G.; Krizhevsky, A.; Sutskever, I.; Salakhutdinov, R. Dropout: a simple way to prevent neural networks from overfitting. J. Mach. Learn. Res. 2014, 15, 1929–1958. [Google Scholar]
- Zhang, Z. Improved Adam Optimizer for Deep Neural Networks. In Proceedings of the 2018 IEEE/ACM 26th International Symposium on Quality of Service (IWQoS), Banff, Alberta, Canada, 4–6 June 2018; pp. 1–2. [Google Scholar] [CrossRef]
- Ying, X. An Overview of Overfitting and its Solutions. J Phys Conf Ser 2019, 1168, 022022. [Google Scholar] [CrossRef]
- Jacobs, R.A. Increased rates of convergence through learning rate adaptation. Neural Networks 1988, 1, 295–307. [Google Scholar] [CrossRef]
- Wesley, C.; Frazier, A.W.; Augustine, C. Cost Projections for UtilityScale Battery Storage: 2021 Update. Golden, CO, 2021. Available online: https://www.nrel.gov/docs/fy21osti/79236.pdf (accessed on 22 June 2024).
- Rancilio, G.; Bovera, F.; Merlo, M. Revenue Stacking for BESS: Fast Frequency Regulation and Balancing Market Participation in Italy. Int. Trans. Electr. Energy Syst. 2022, 2022, 1894003. [Google Scholar] [CrossRef]
- Harlow, J.E.; Ma, X.; Li, J.; Logan, E.; Liu, Y.; Zhang, N.; Ma, L.; Glazier, S.L.; Cormier, M.M.E.; Genovese, M.; et al. A Wide Range of Testing Results on an Excellent Lithium-Ion Cell Chemistry to be used as Benchmarks for New Battery Technologies. J. Electrochem. Soc. 2019, 166, A3031–A3044. [Google Scholar] [CrossRef]
Figure 1.
Italian Electrical Zones [18].
Figure 1.
Italian Electrical Zones [18].
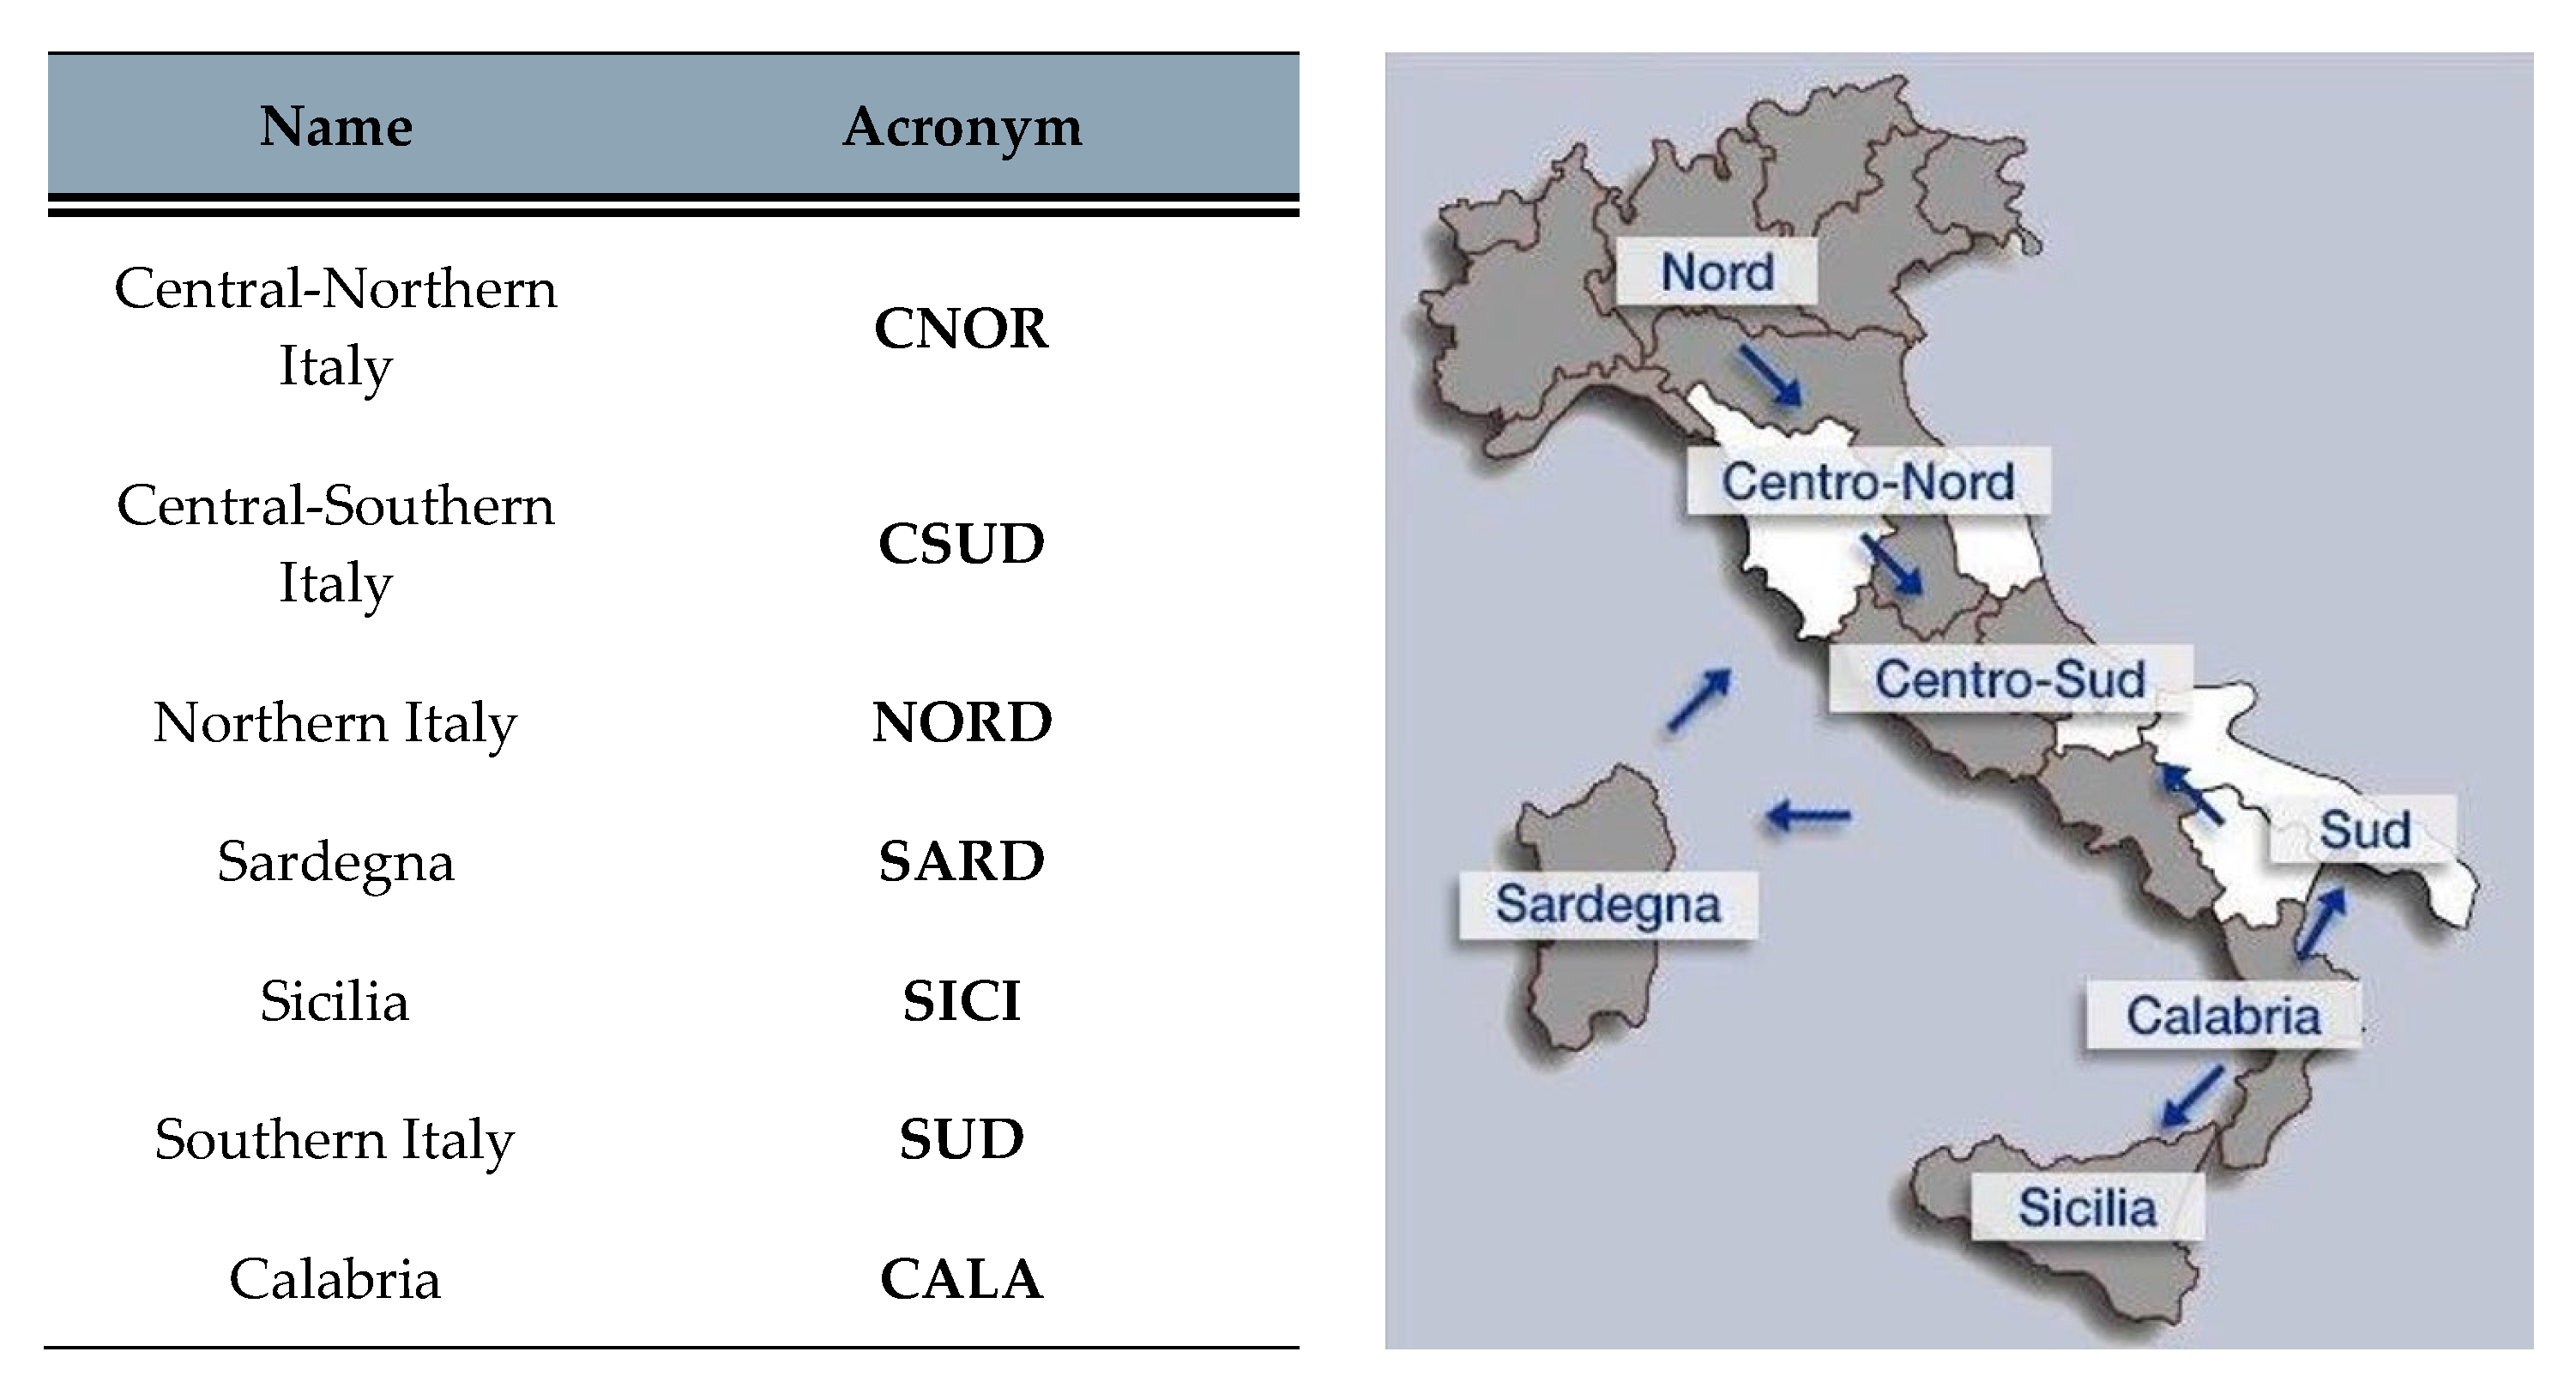
Figure 2.
System Marginal Price.
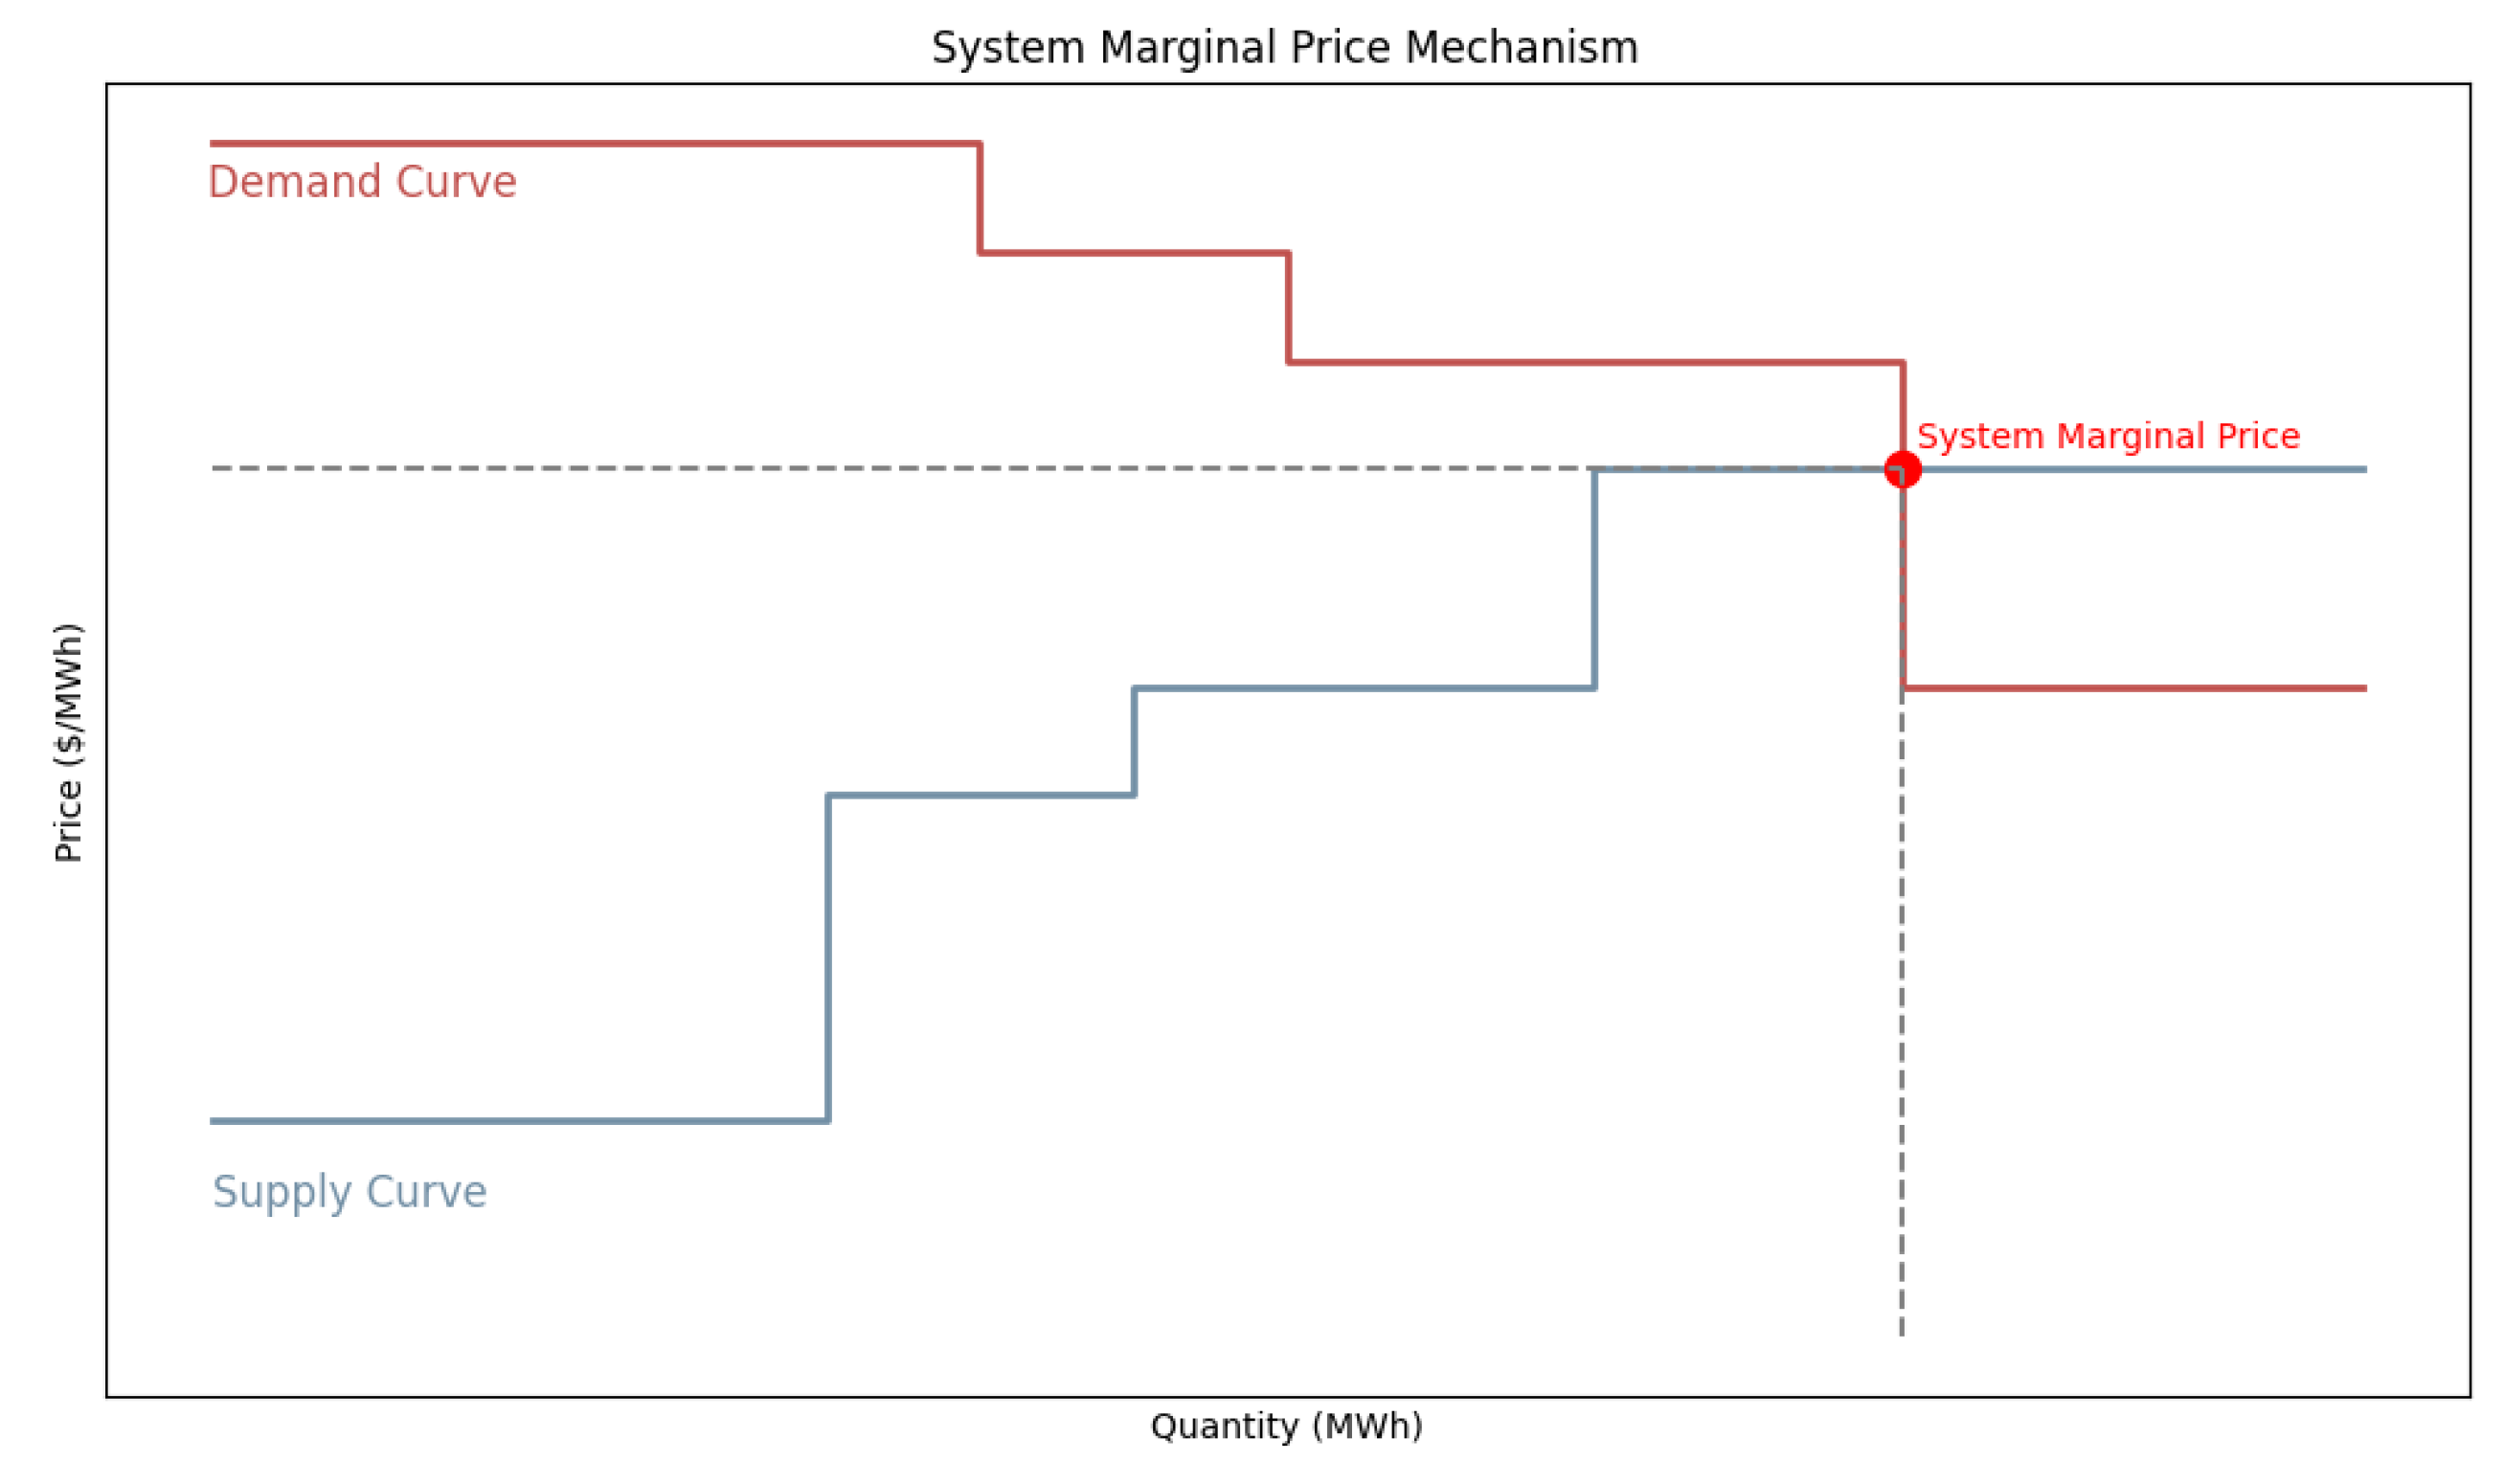
Figure 4.
Simulation process flowchart and BESS + battery management system (BMS) representation.
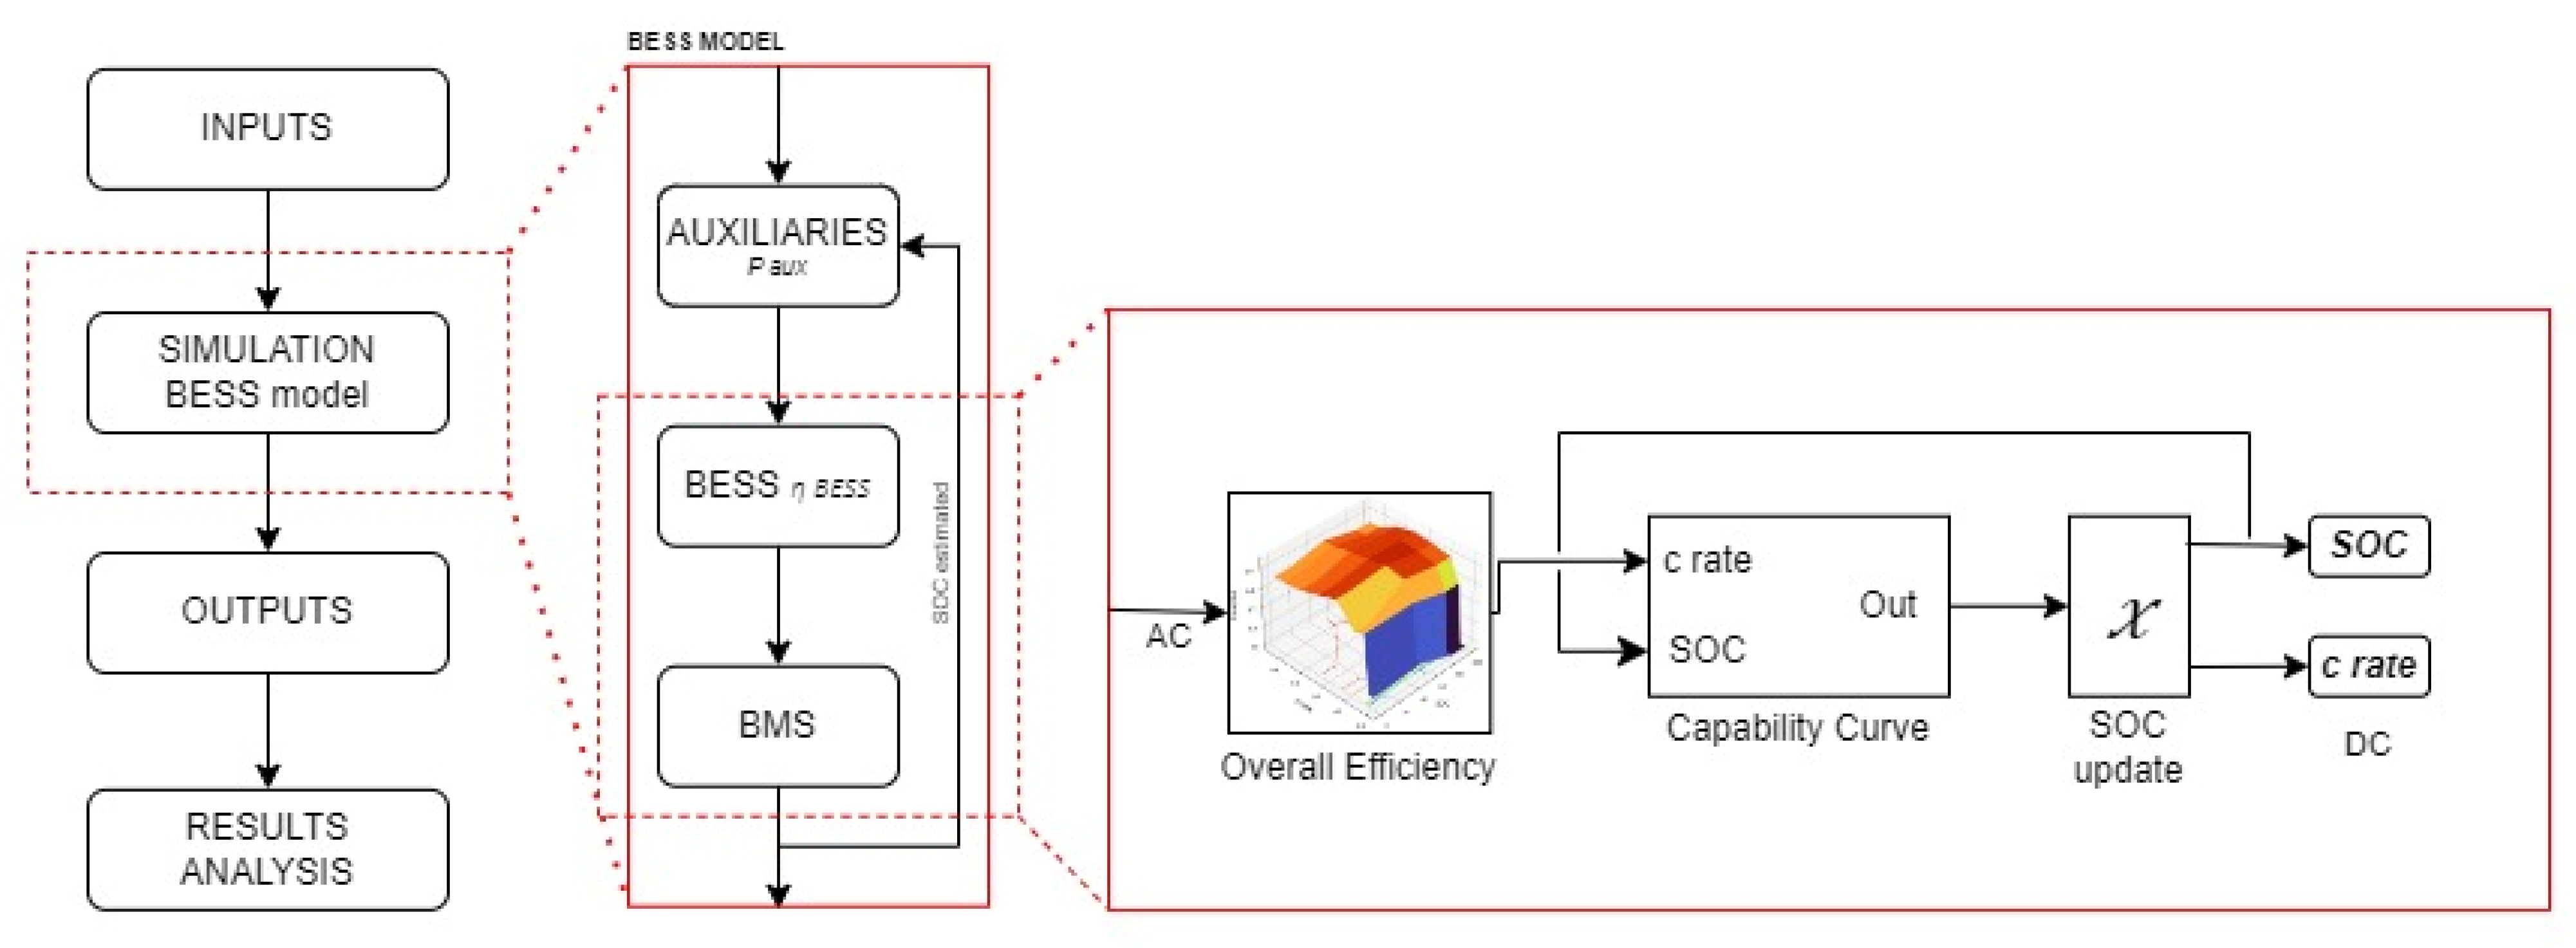
Figure 5.
Auxiliaries' Power Surface.
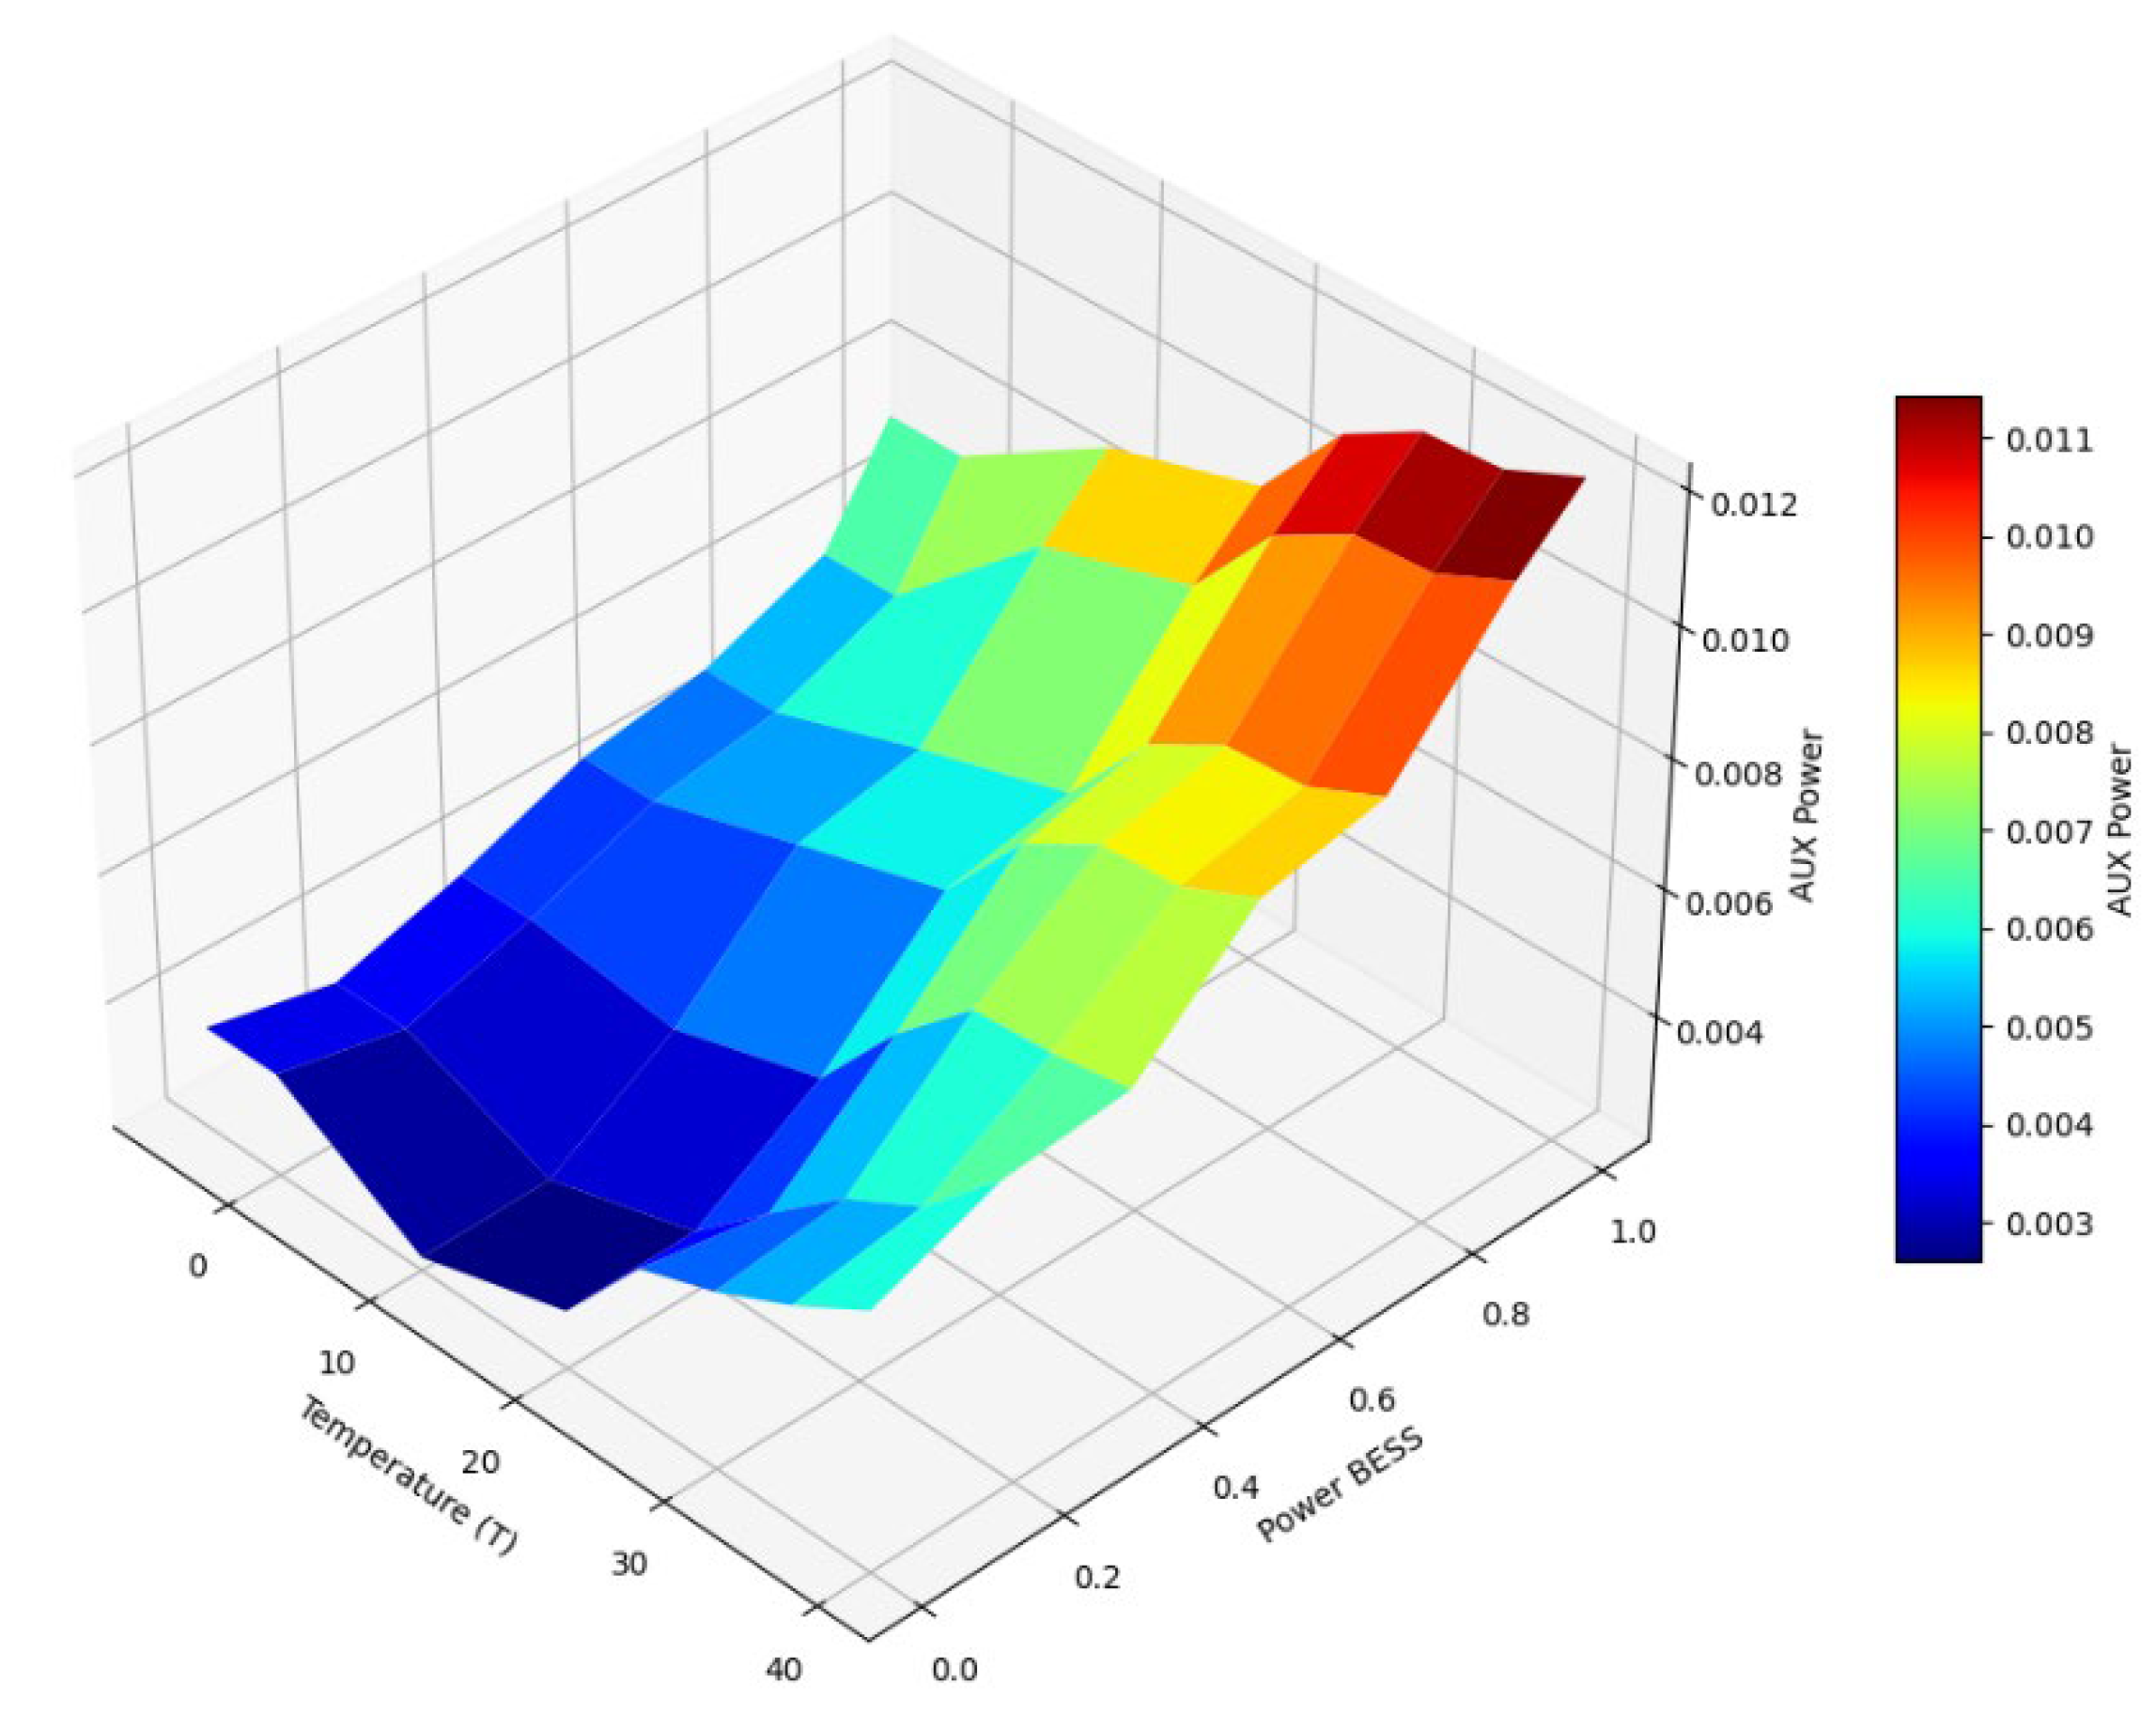
Figure 8.
Flowchart of the training Process.
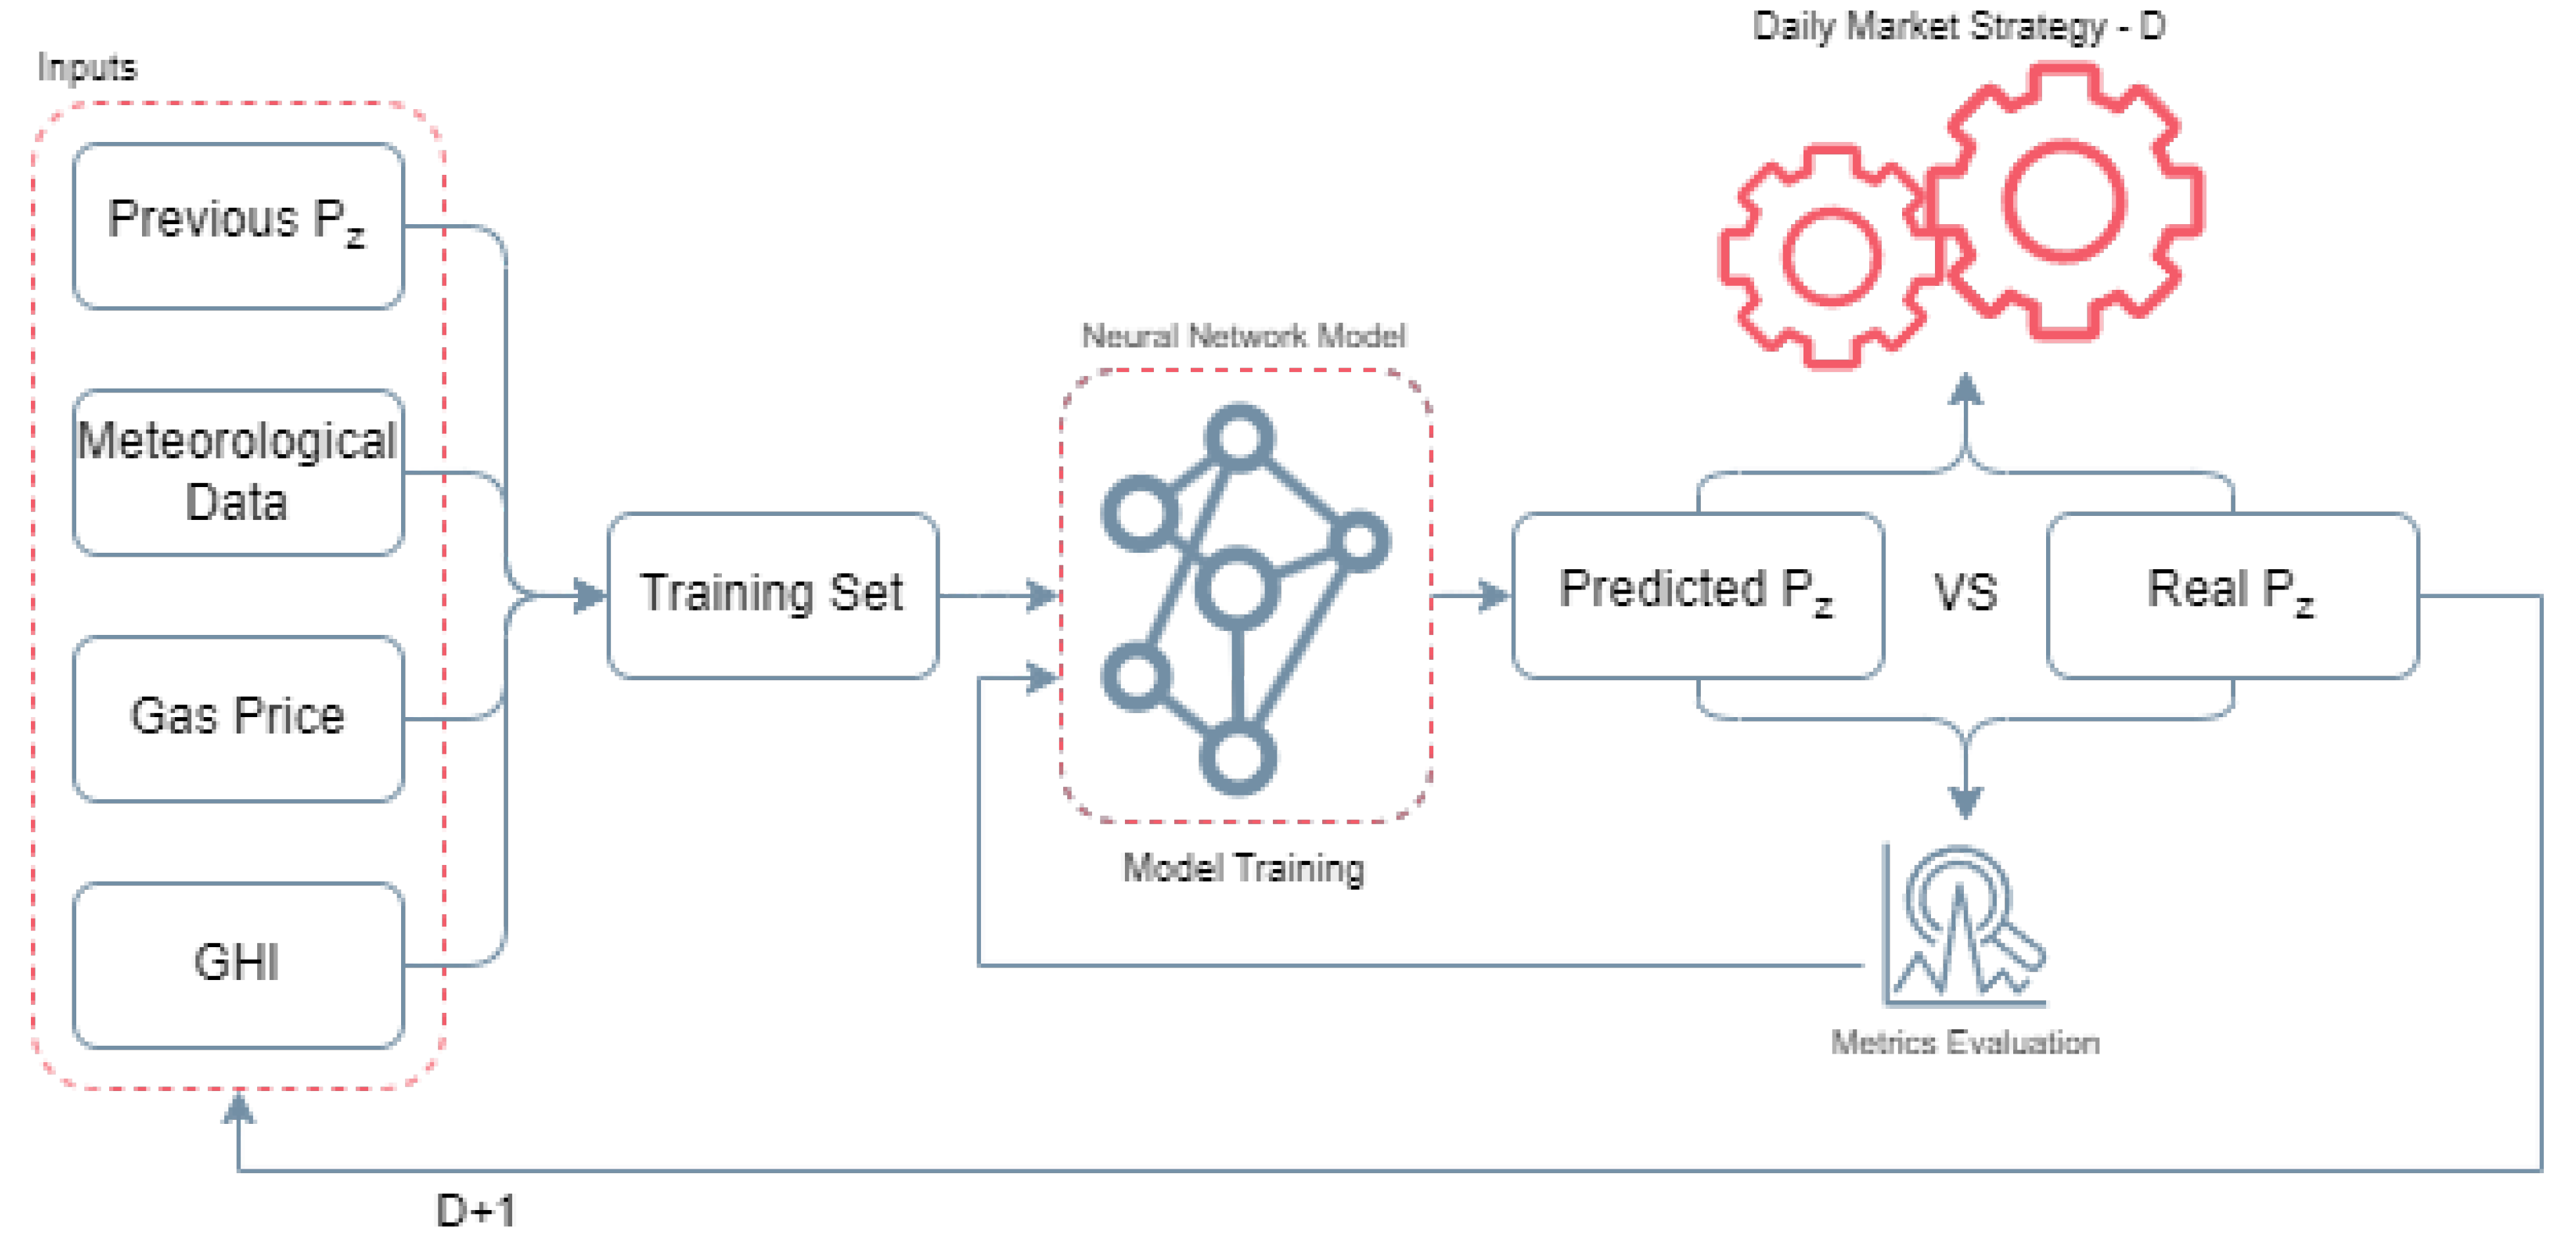
Figure 9.
Flowchart of Offer Price Decision Process.
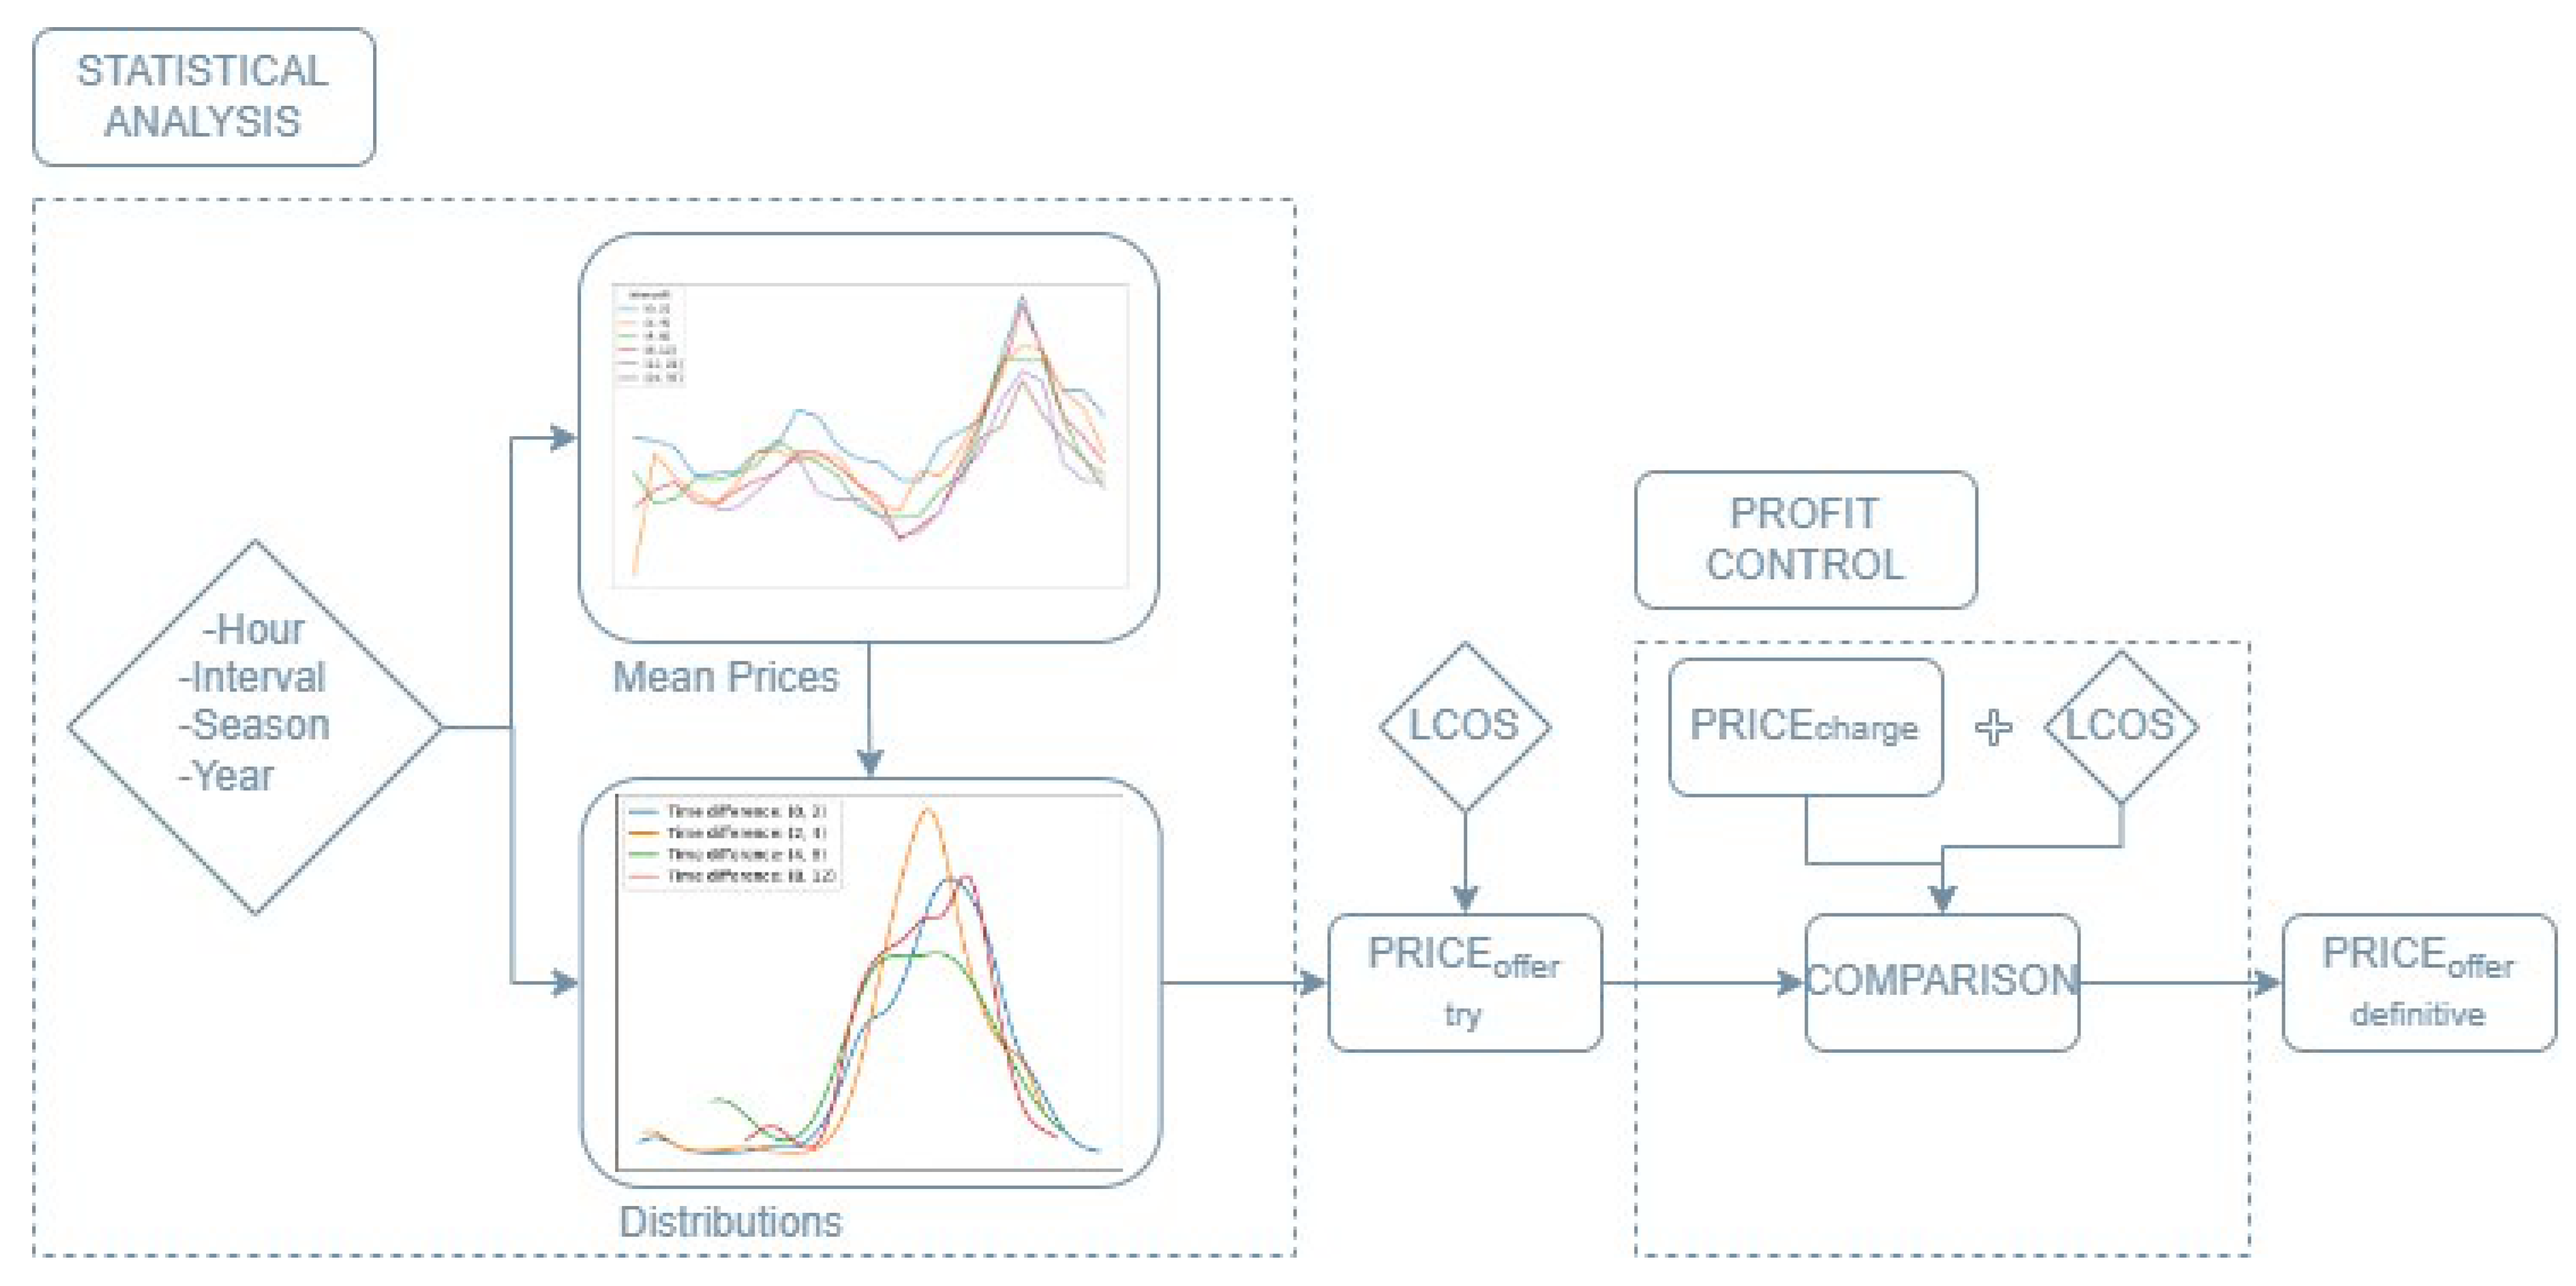
Figure 10.
NORD Zonal Price Trend.
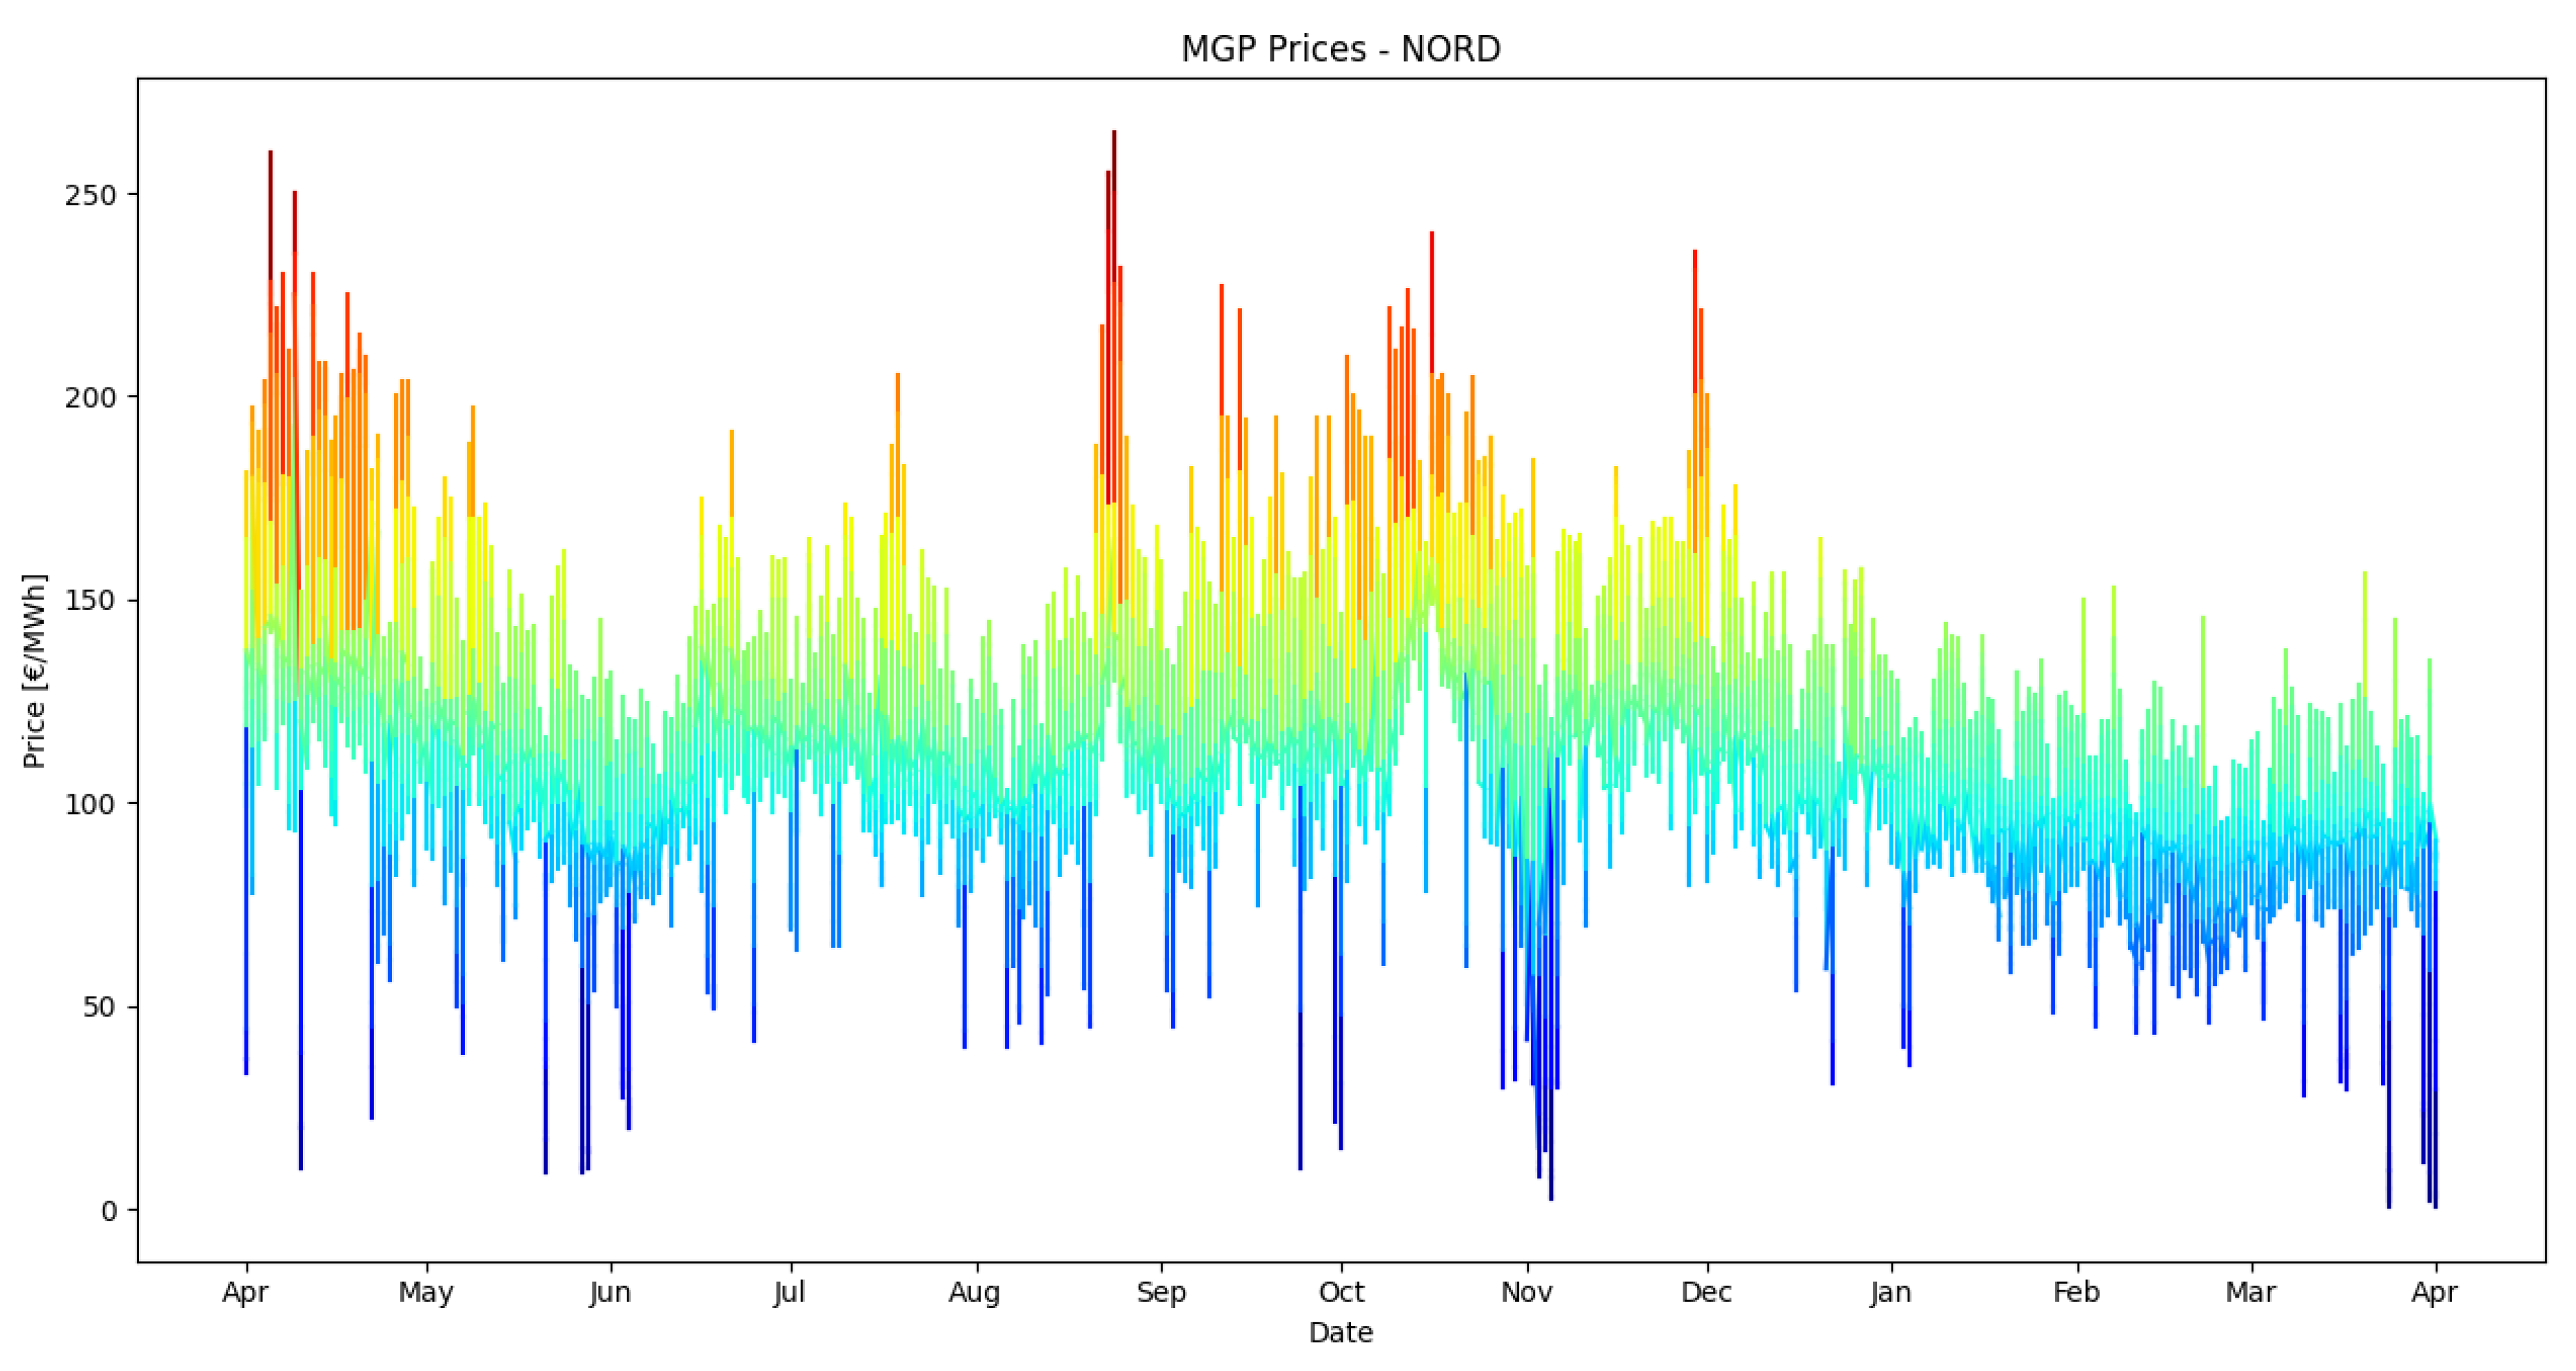
Figure 11.
RMSE over simulation time.
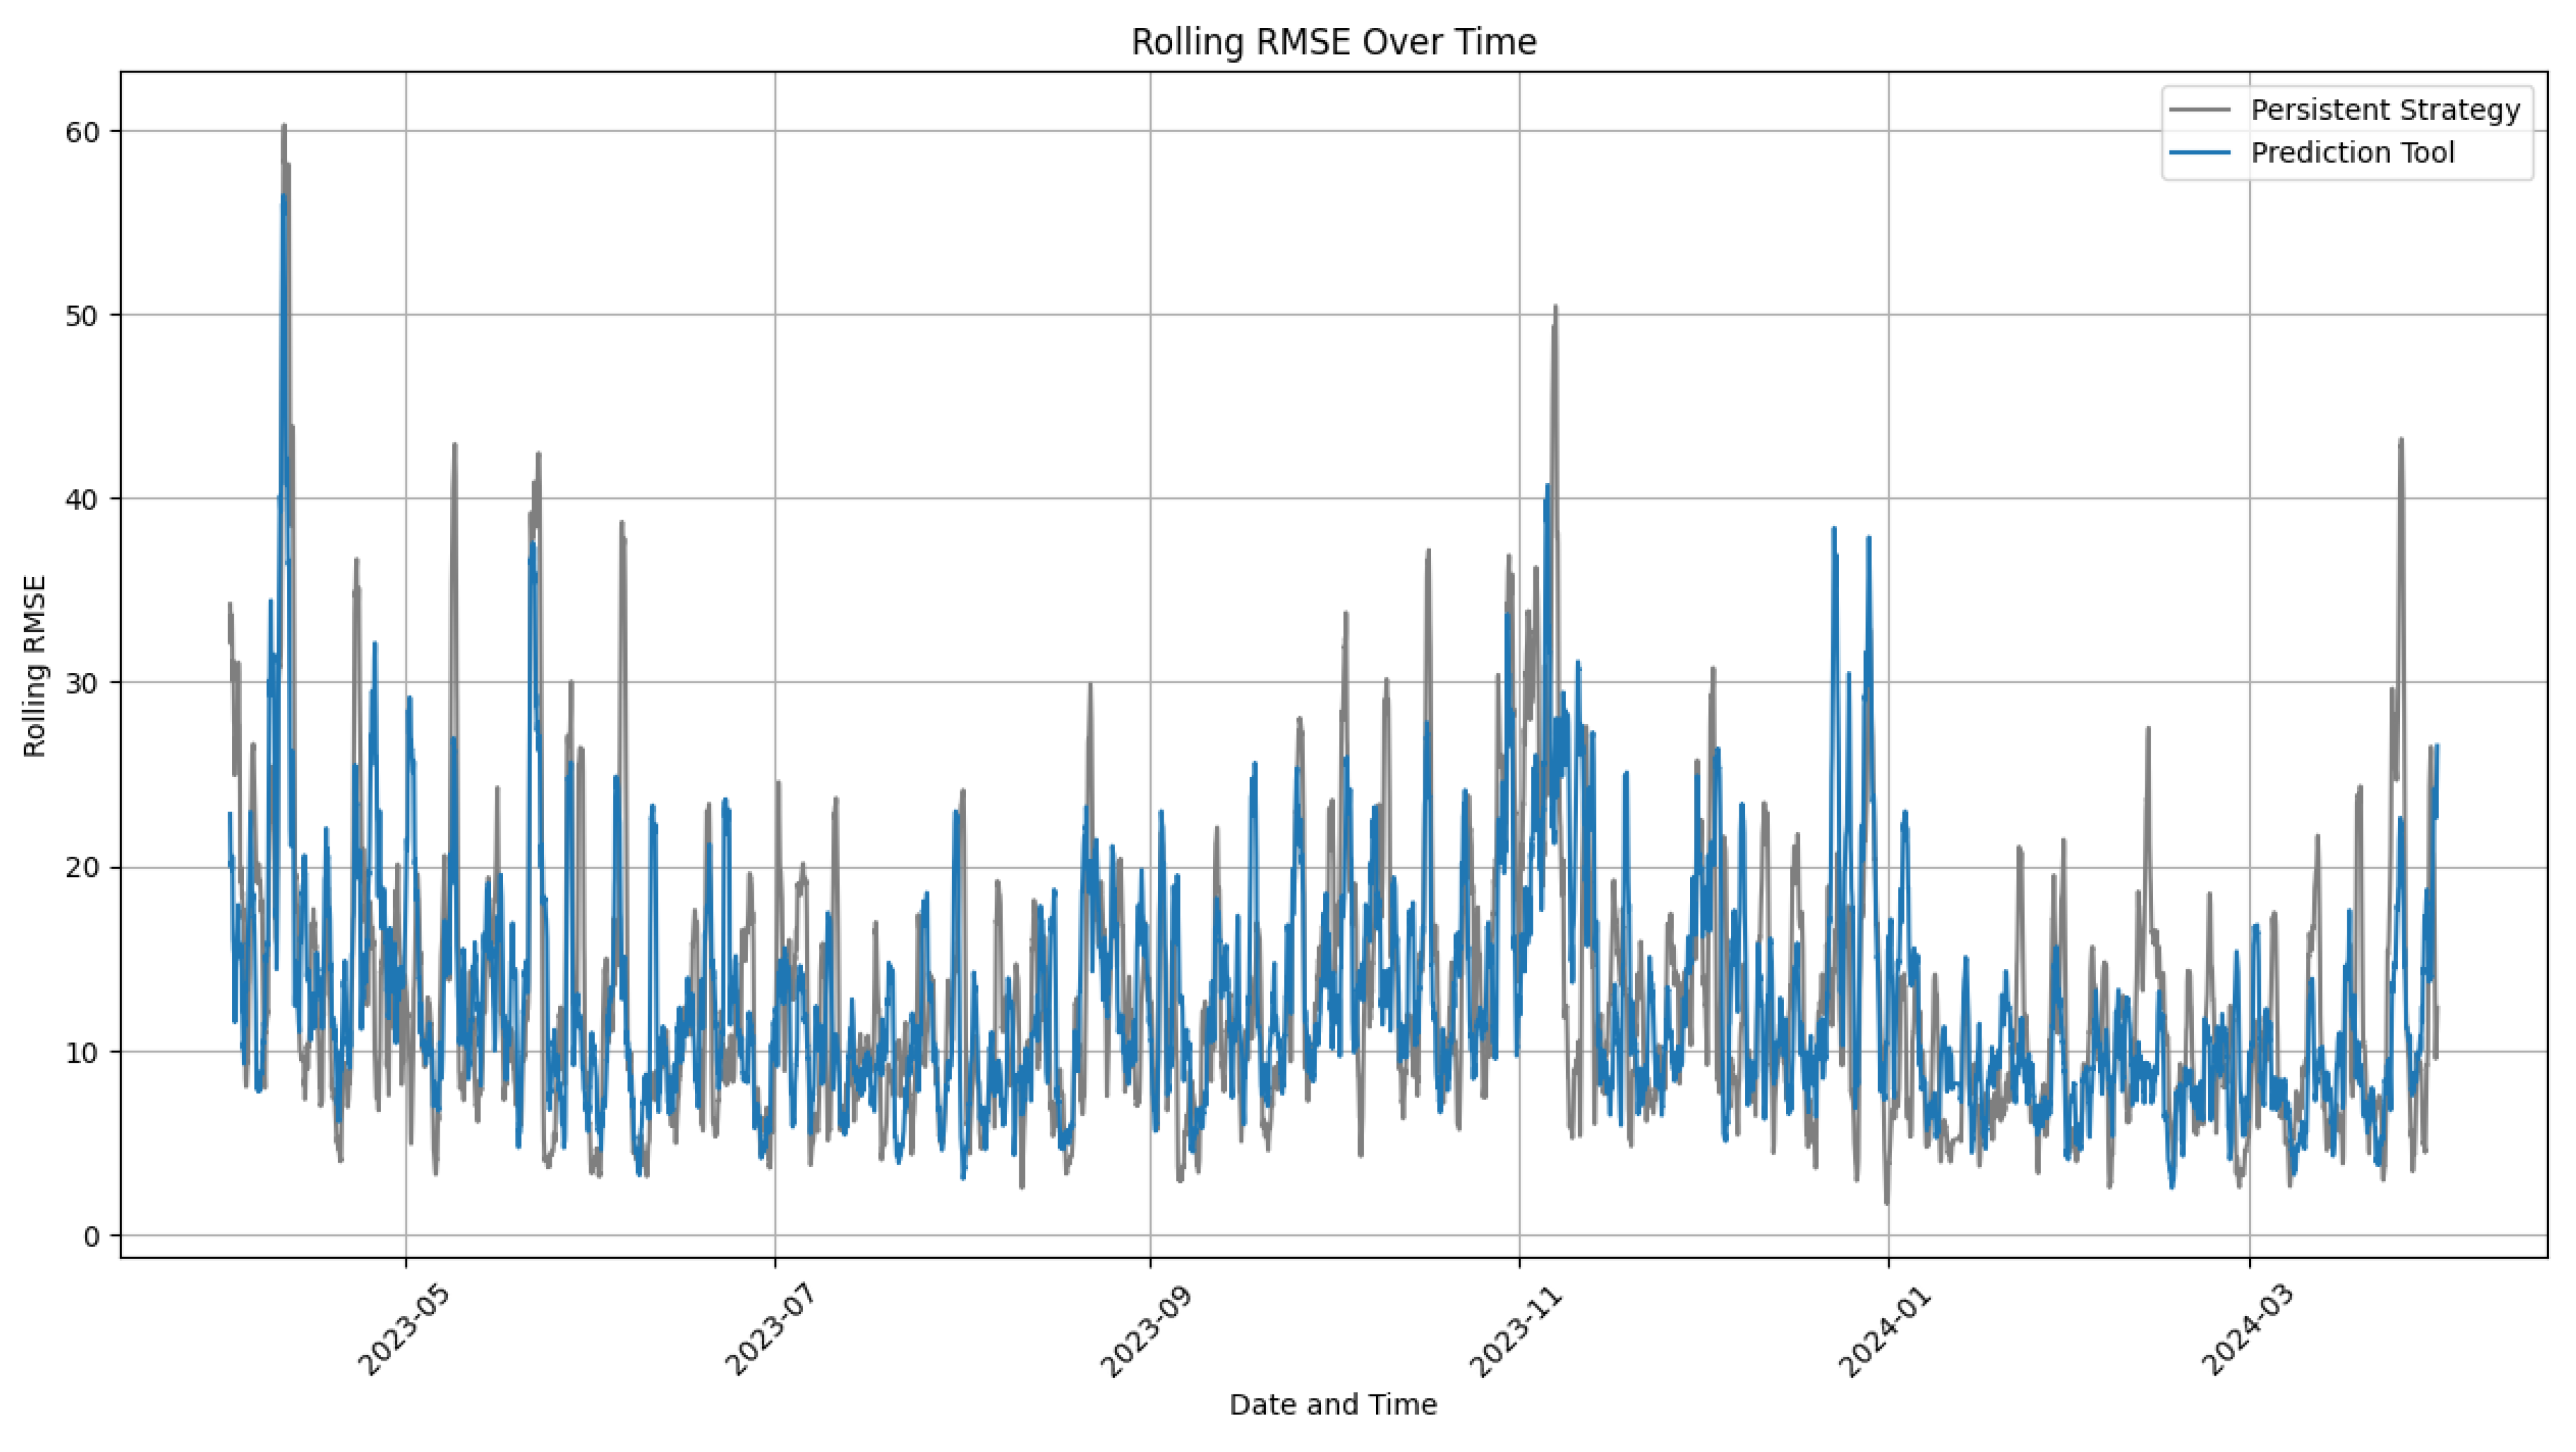
Figure 12.
Comparison of the Strategies Predicted Prices.
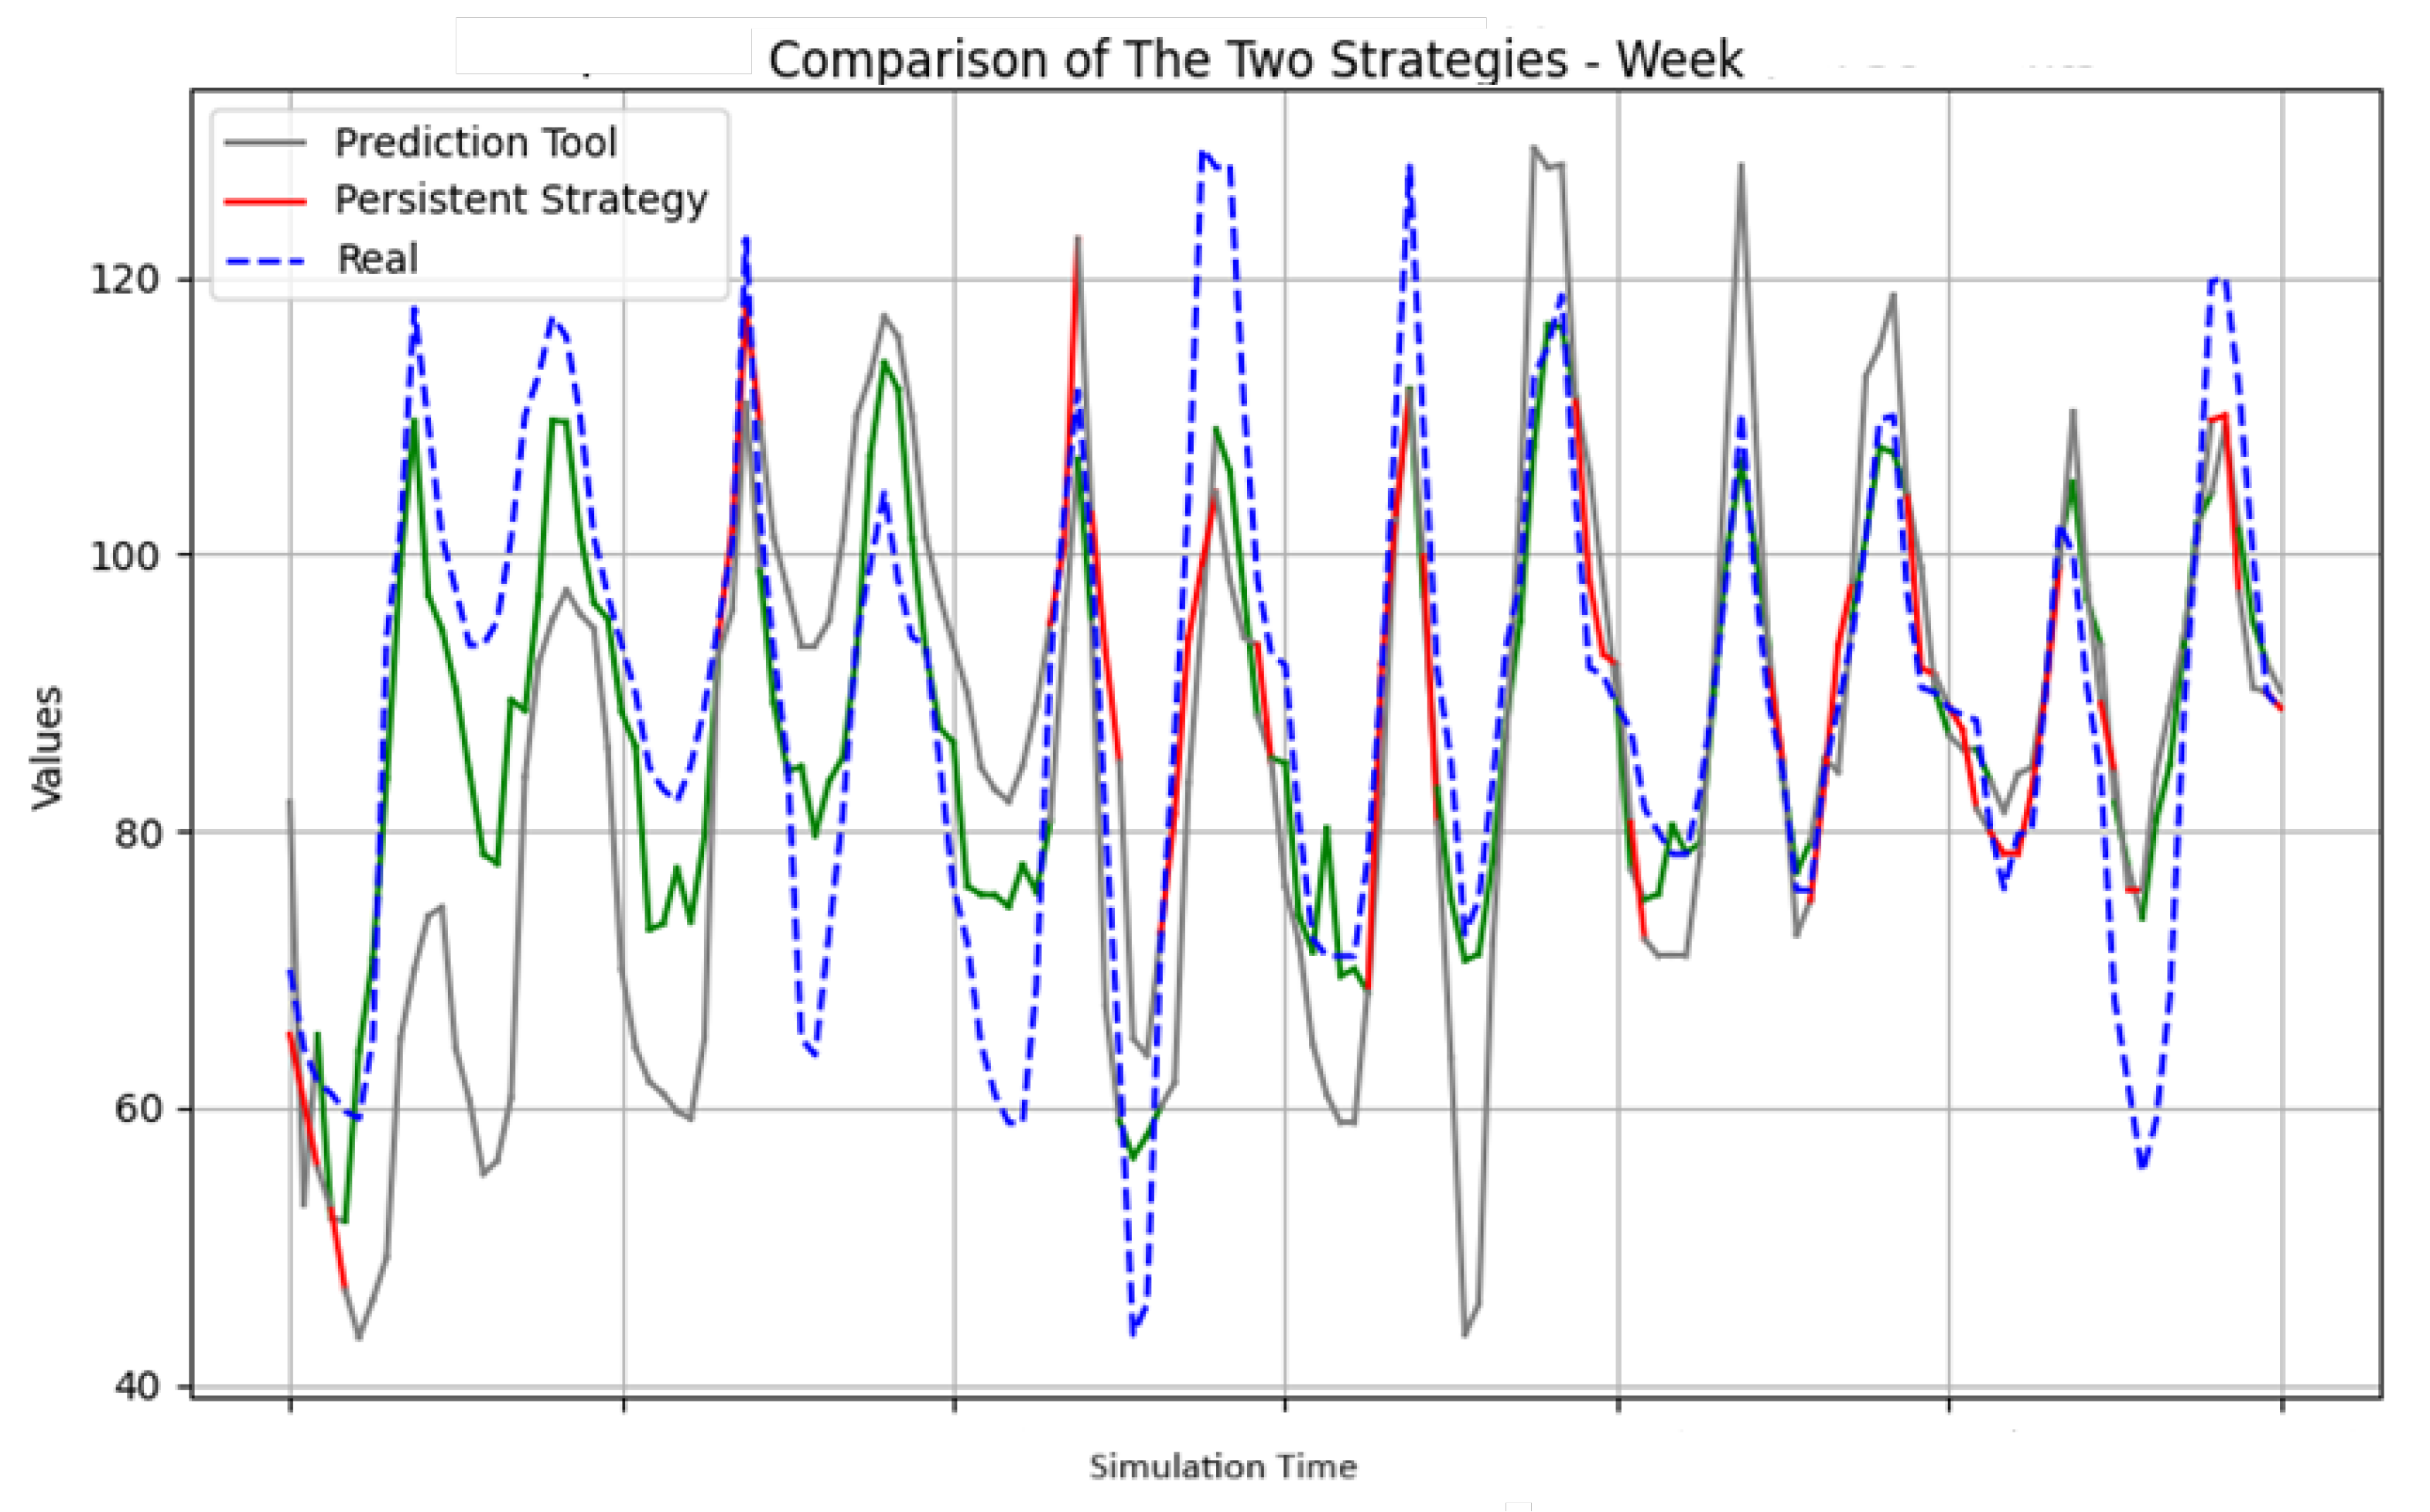
Figure 13.
DAM Profits - Case A.
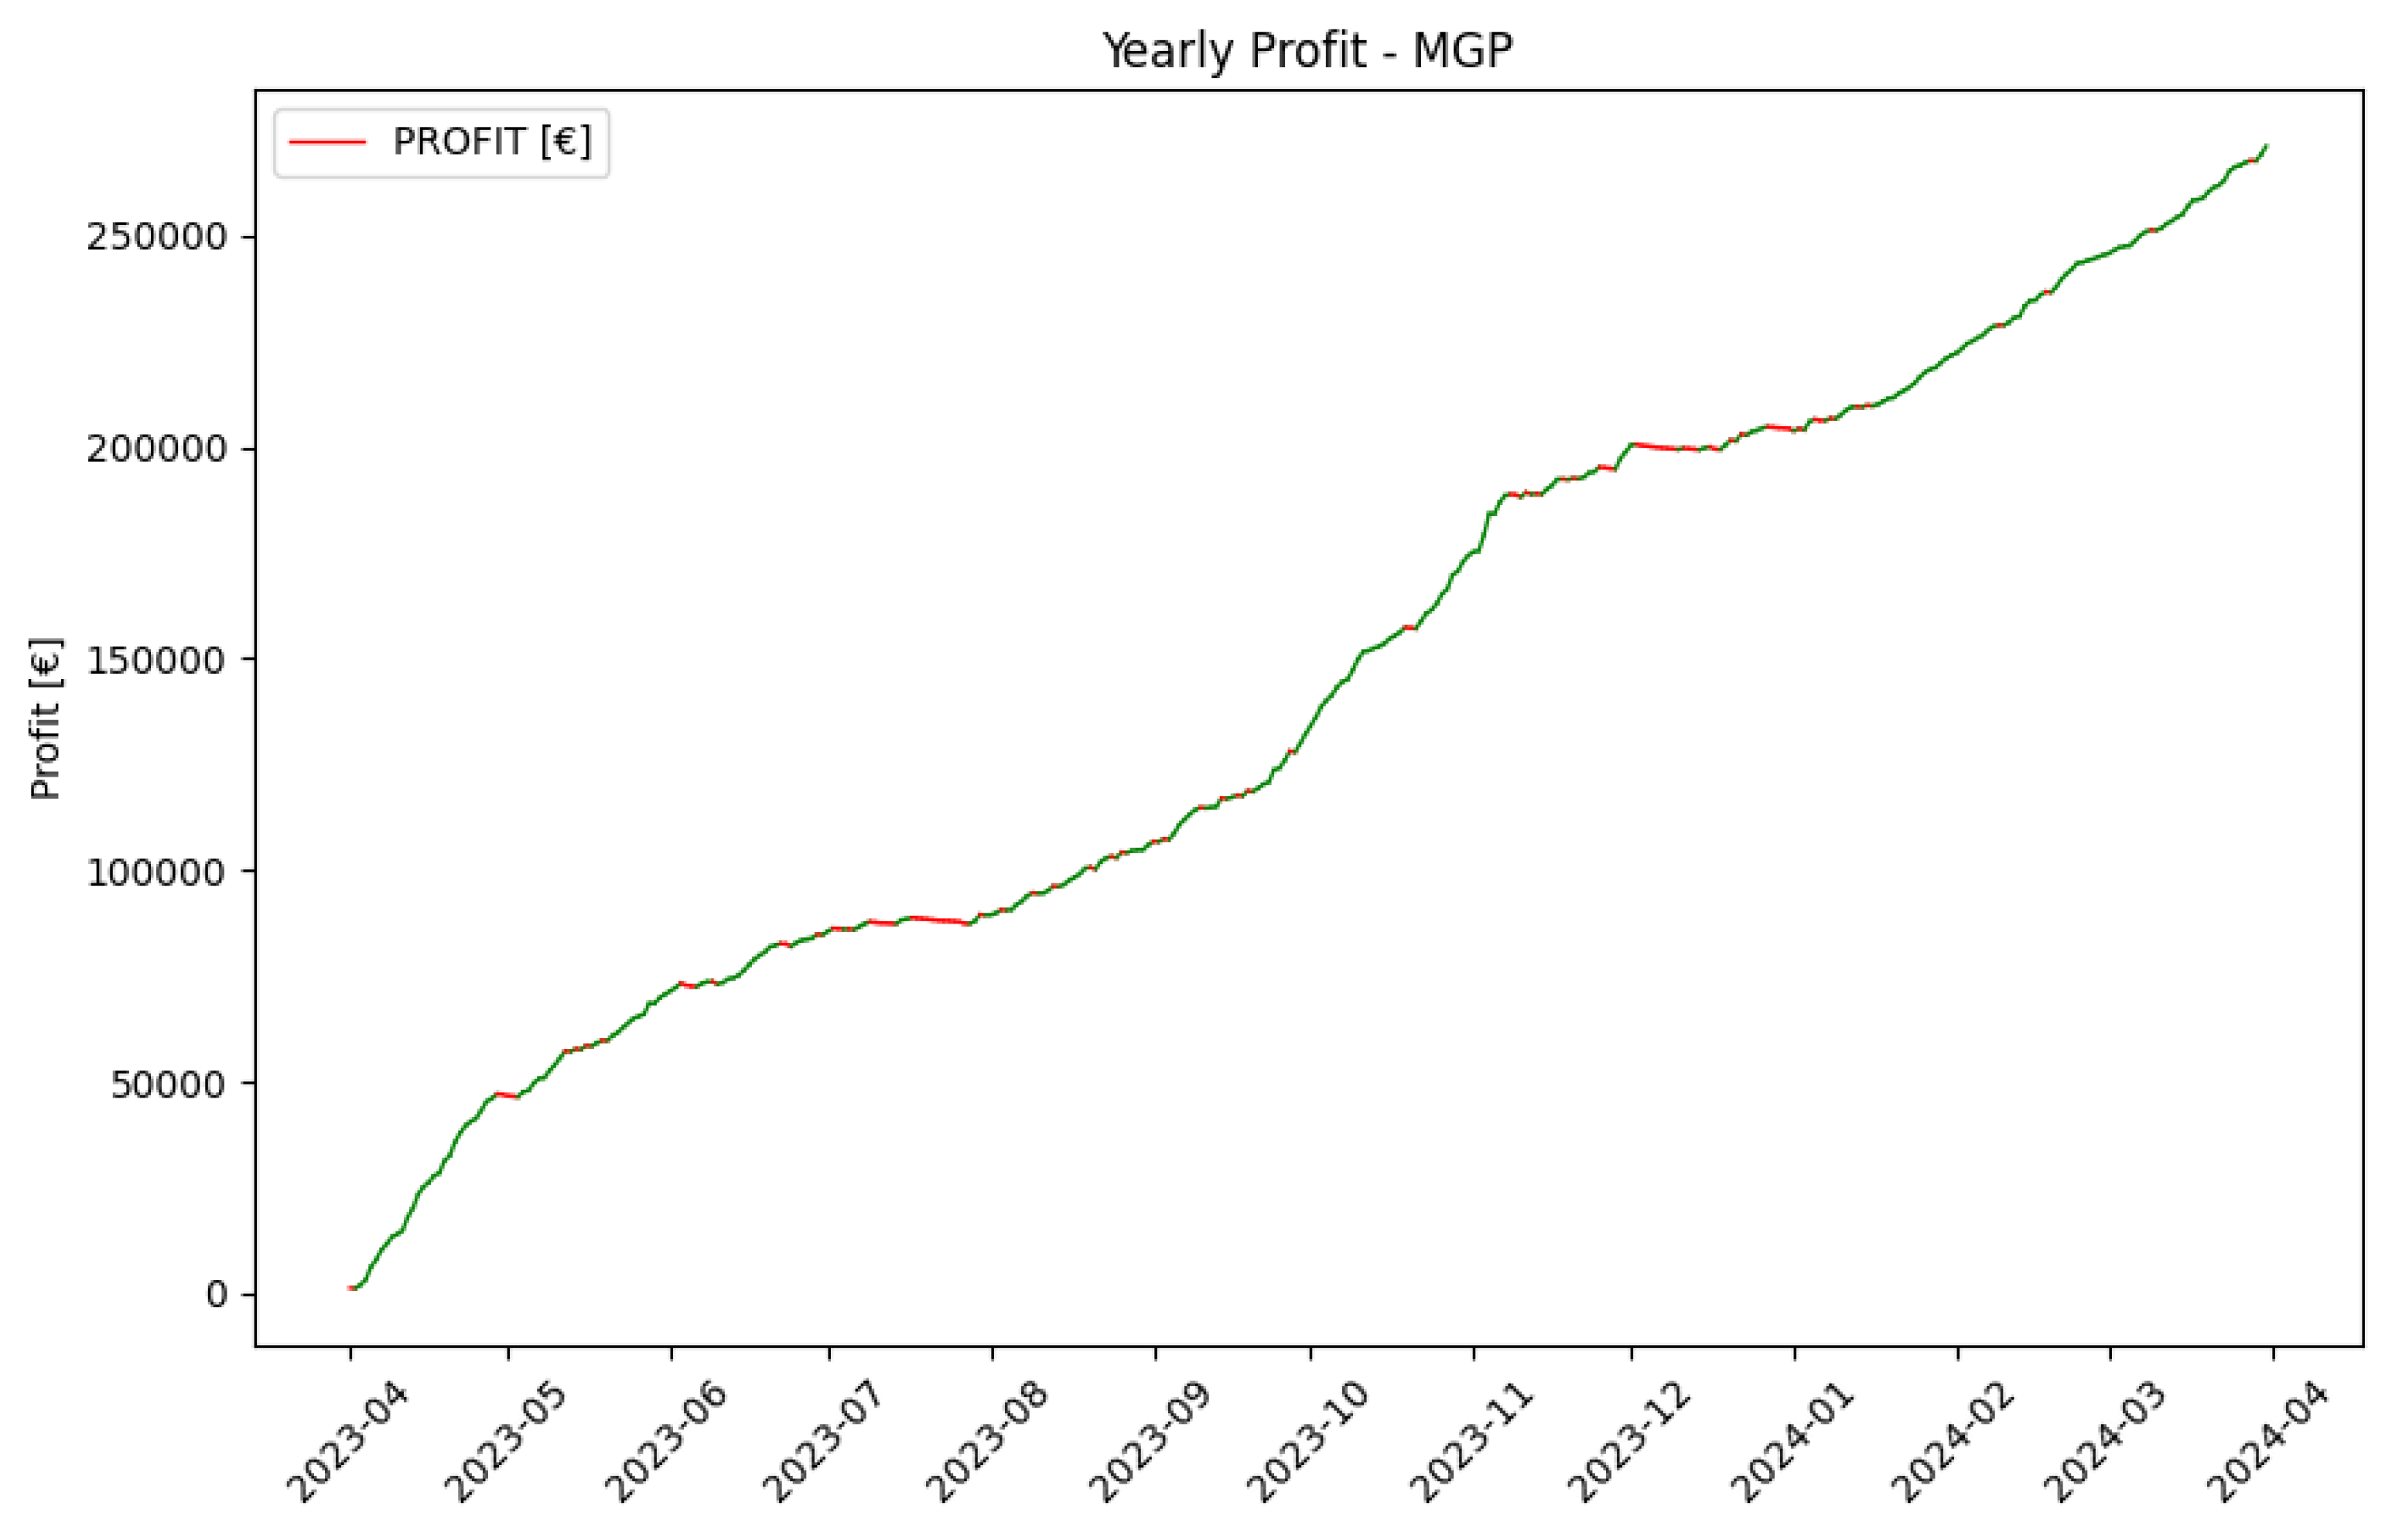
Figure 14.
DAM Profits - Case B.
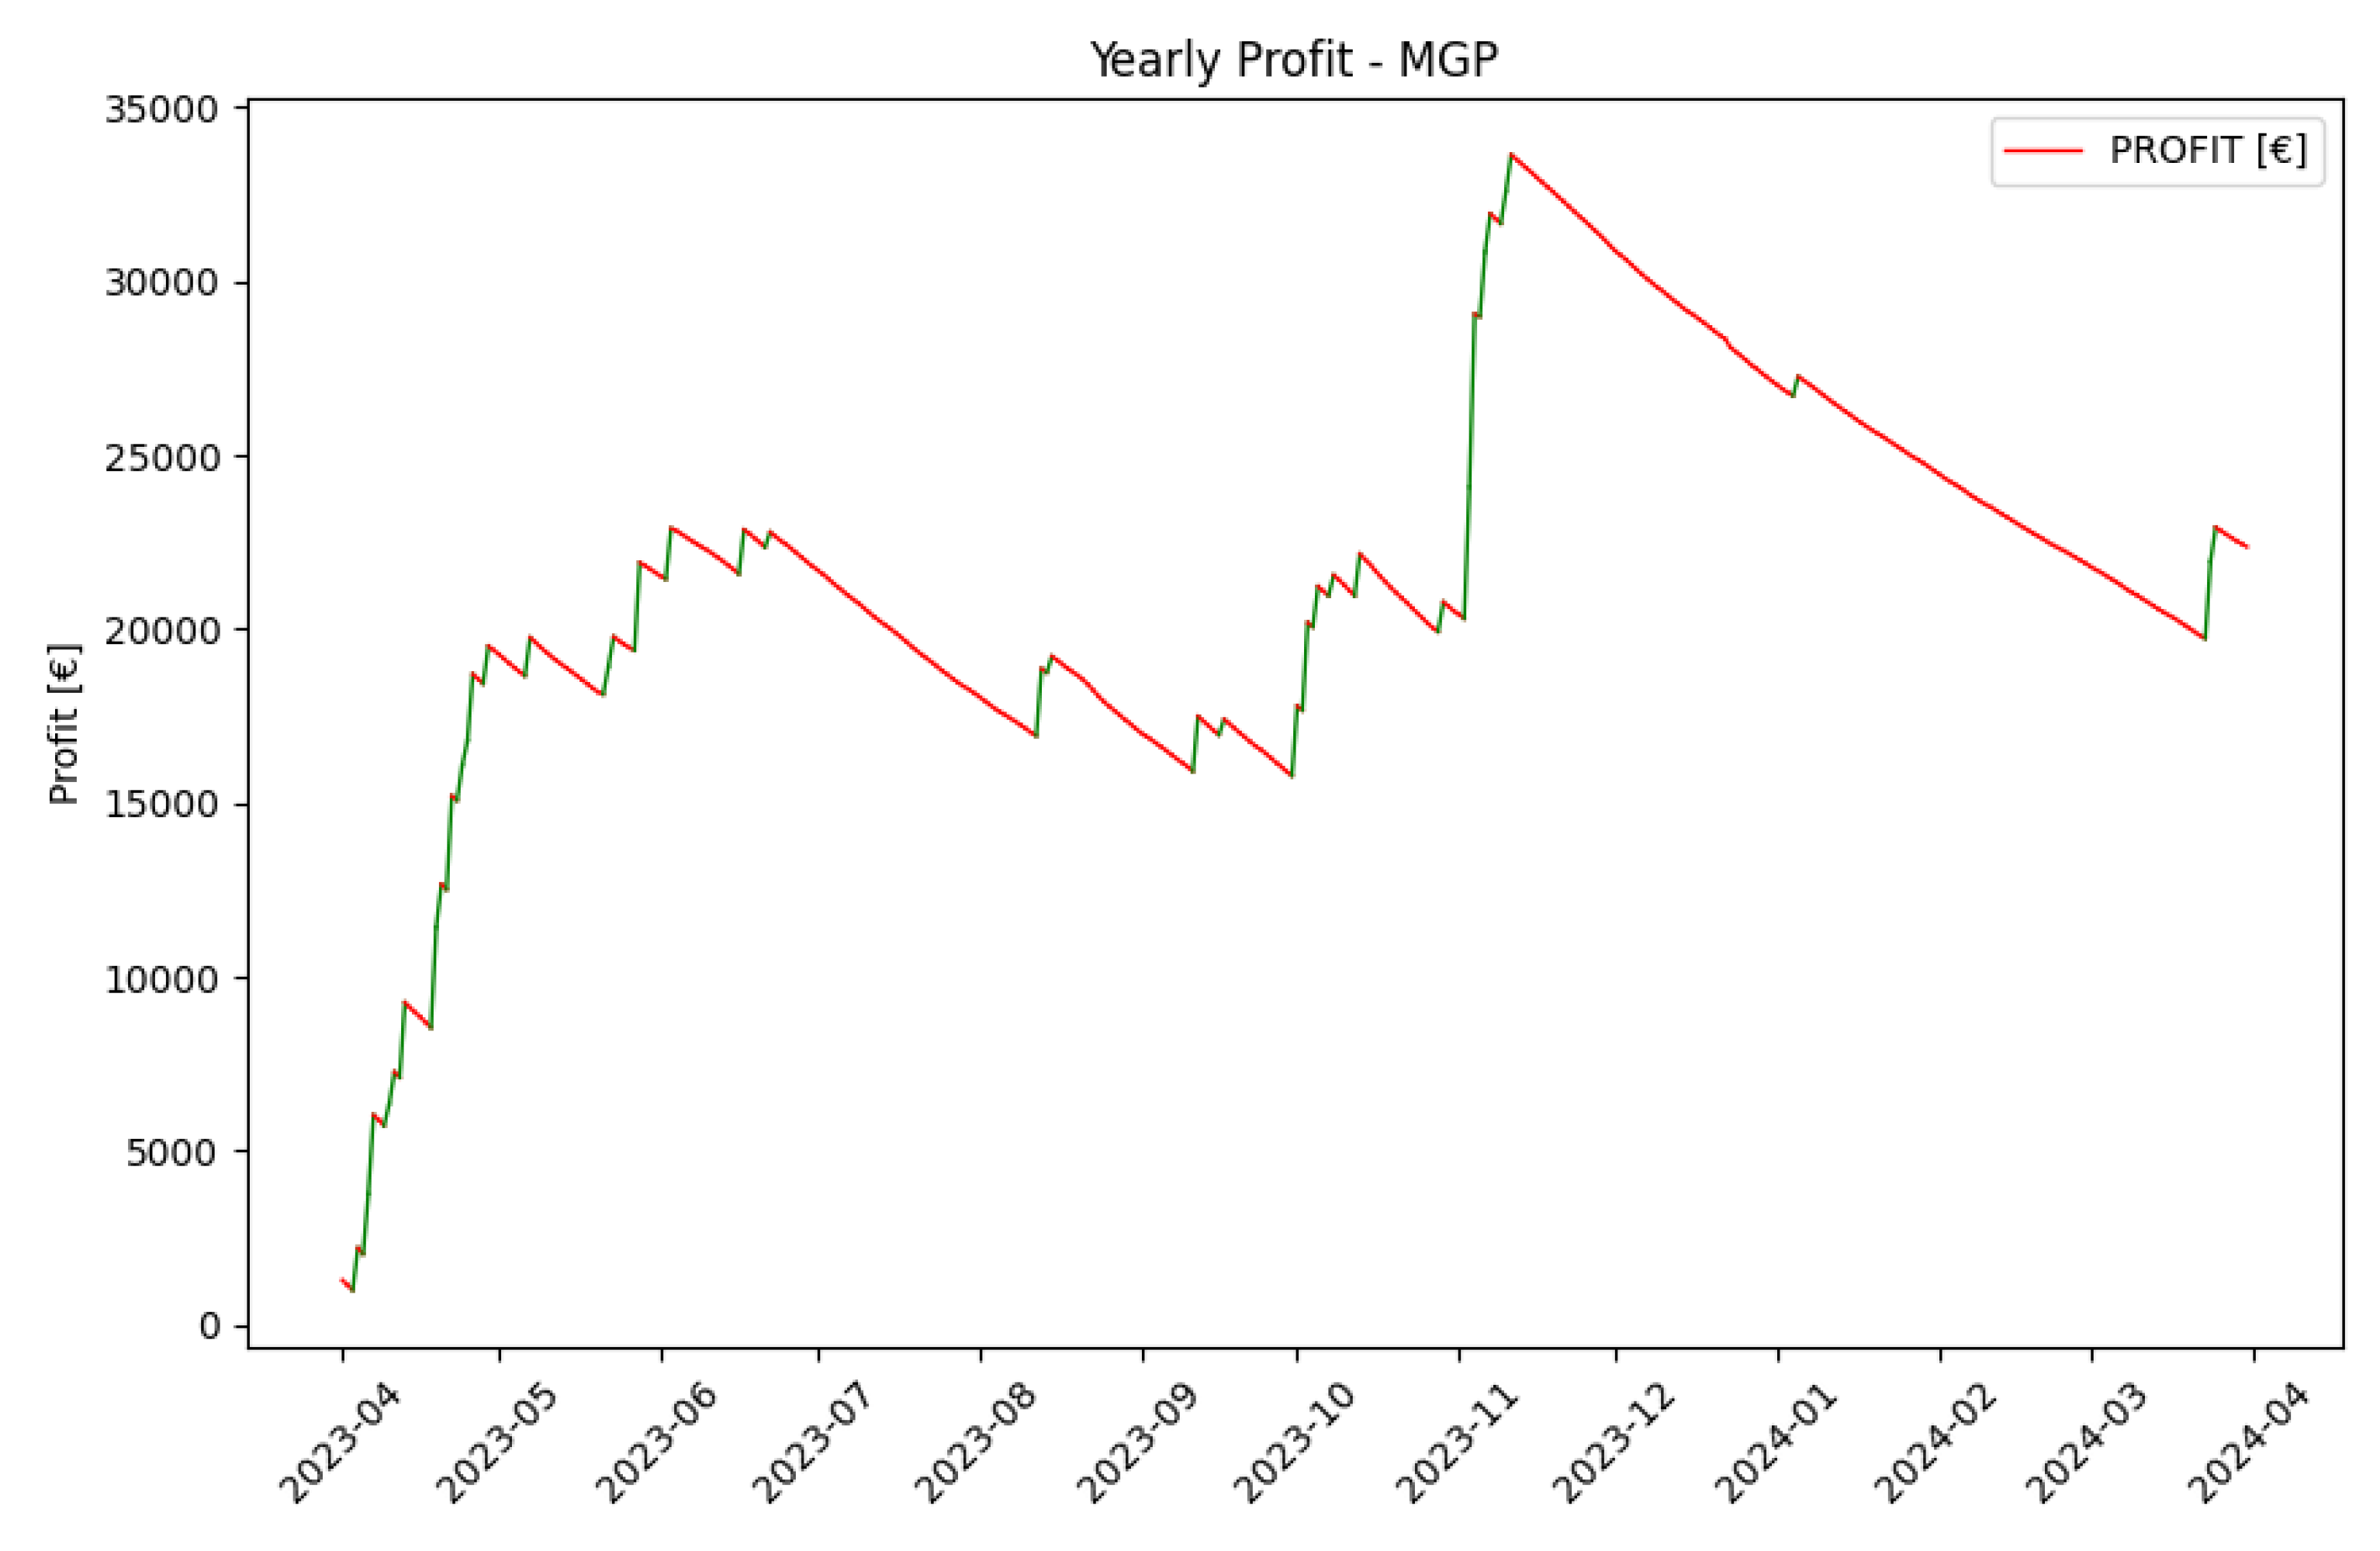
Figure 15.
Global Average NORD XBID Prices – 2022.
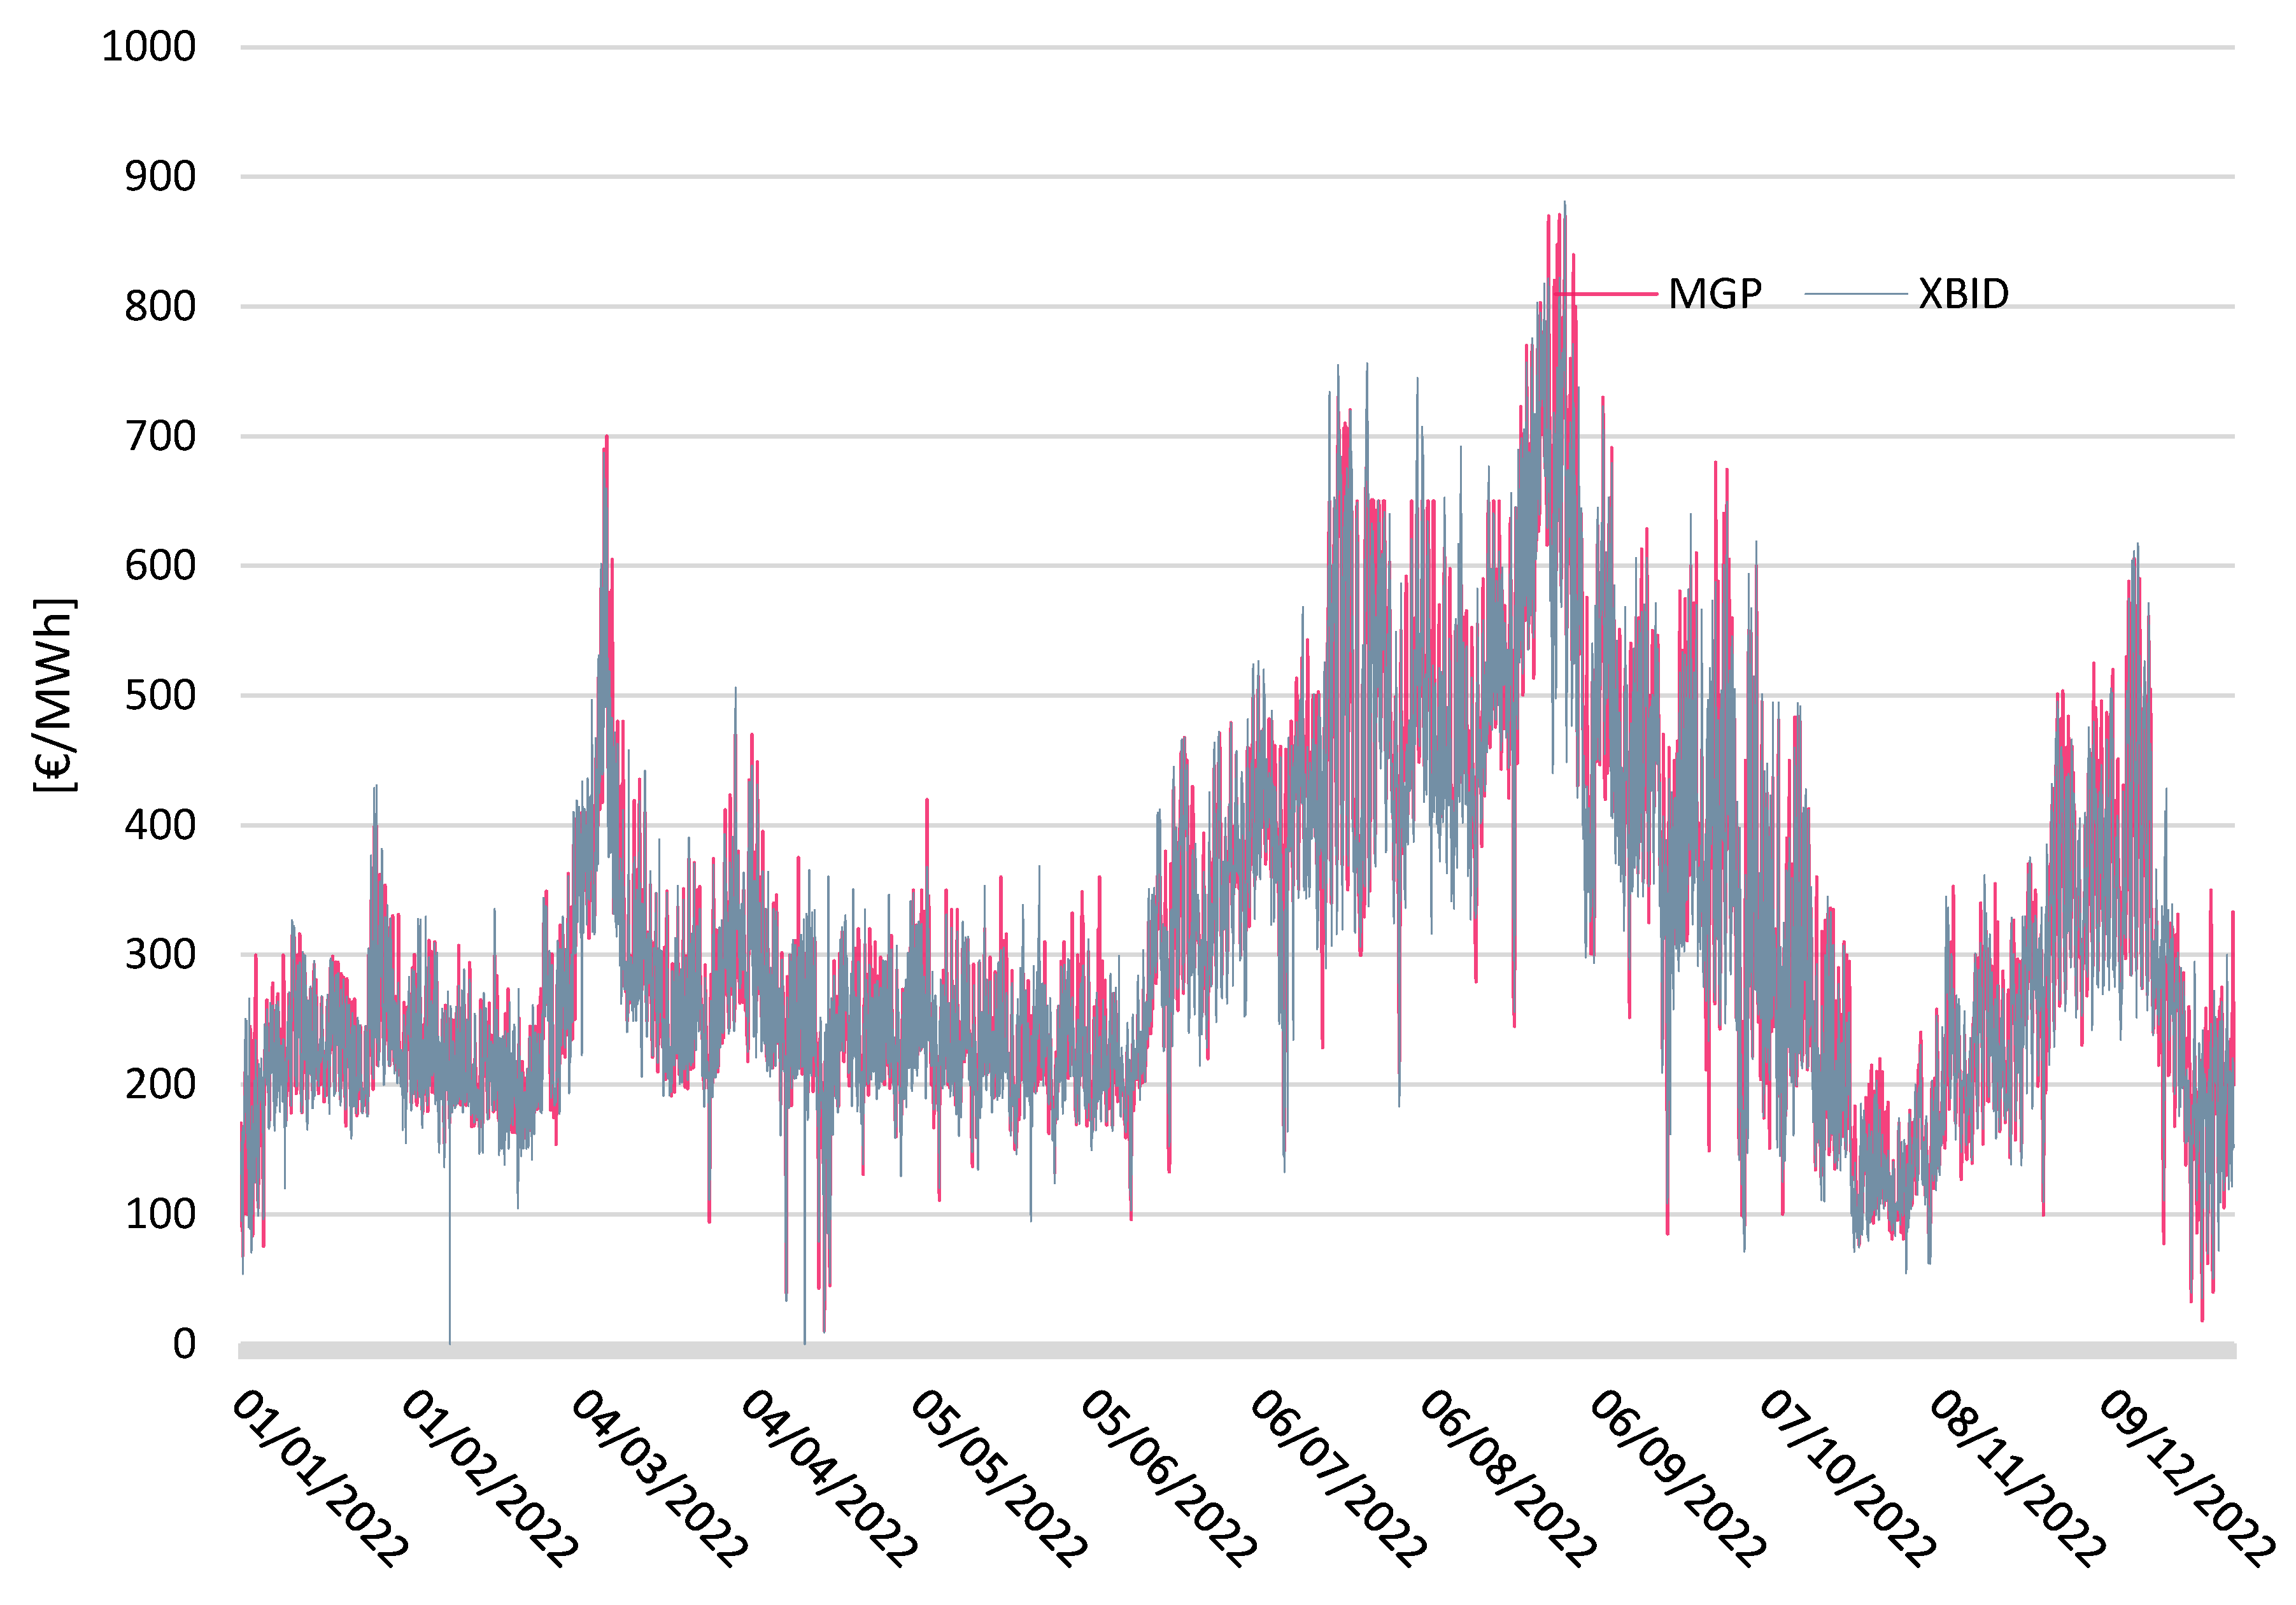
Figure 16.
Global Average NORD XBID Prices – 2023.
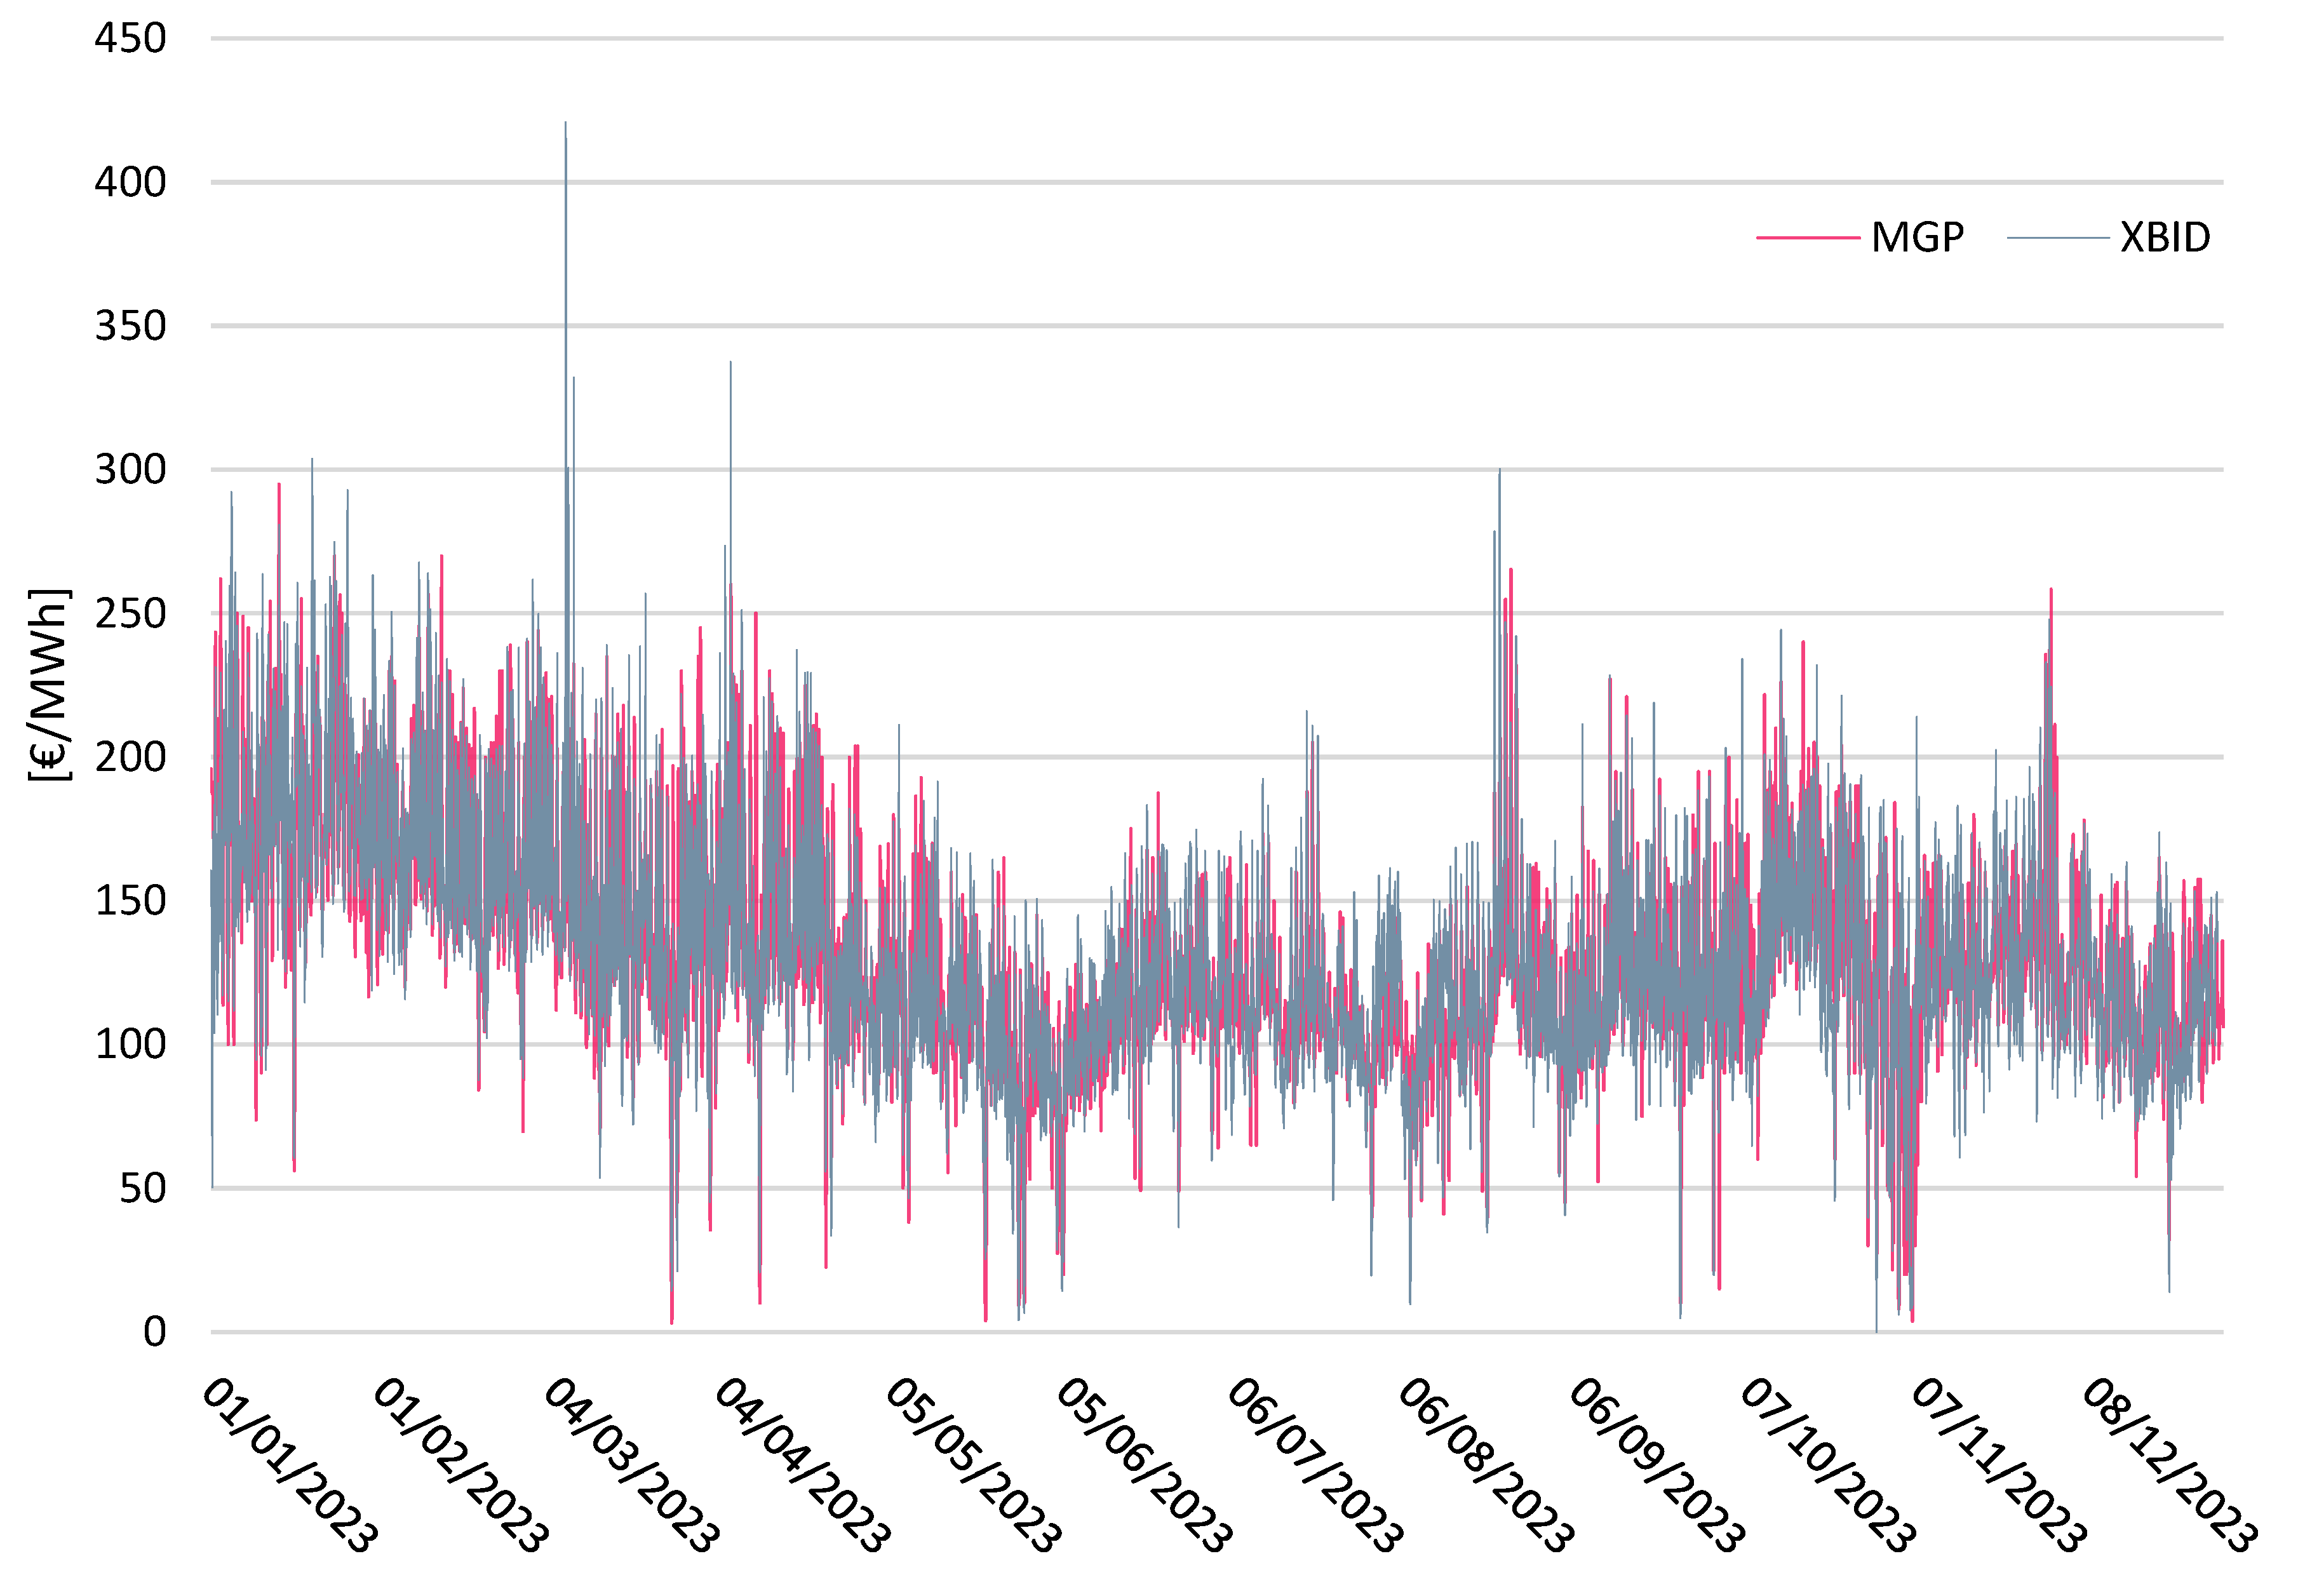
Figure 17.
Standard deviations of Selling Offers by submission interval, day type, season – 2023. X-axis represents the hours of the day, while y-axis represents the standard deviations in €/MWh.
Figure 17.
Standard deviations of Selling Offers by submission interval, day type, season – 2023. X-axis represents the hours of the day, while y-axis represents the standard deviations in €/MWh.
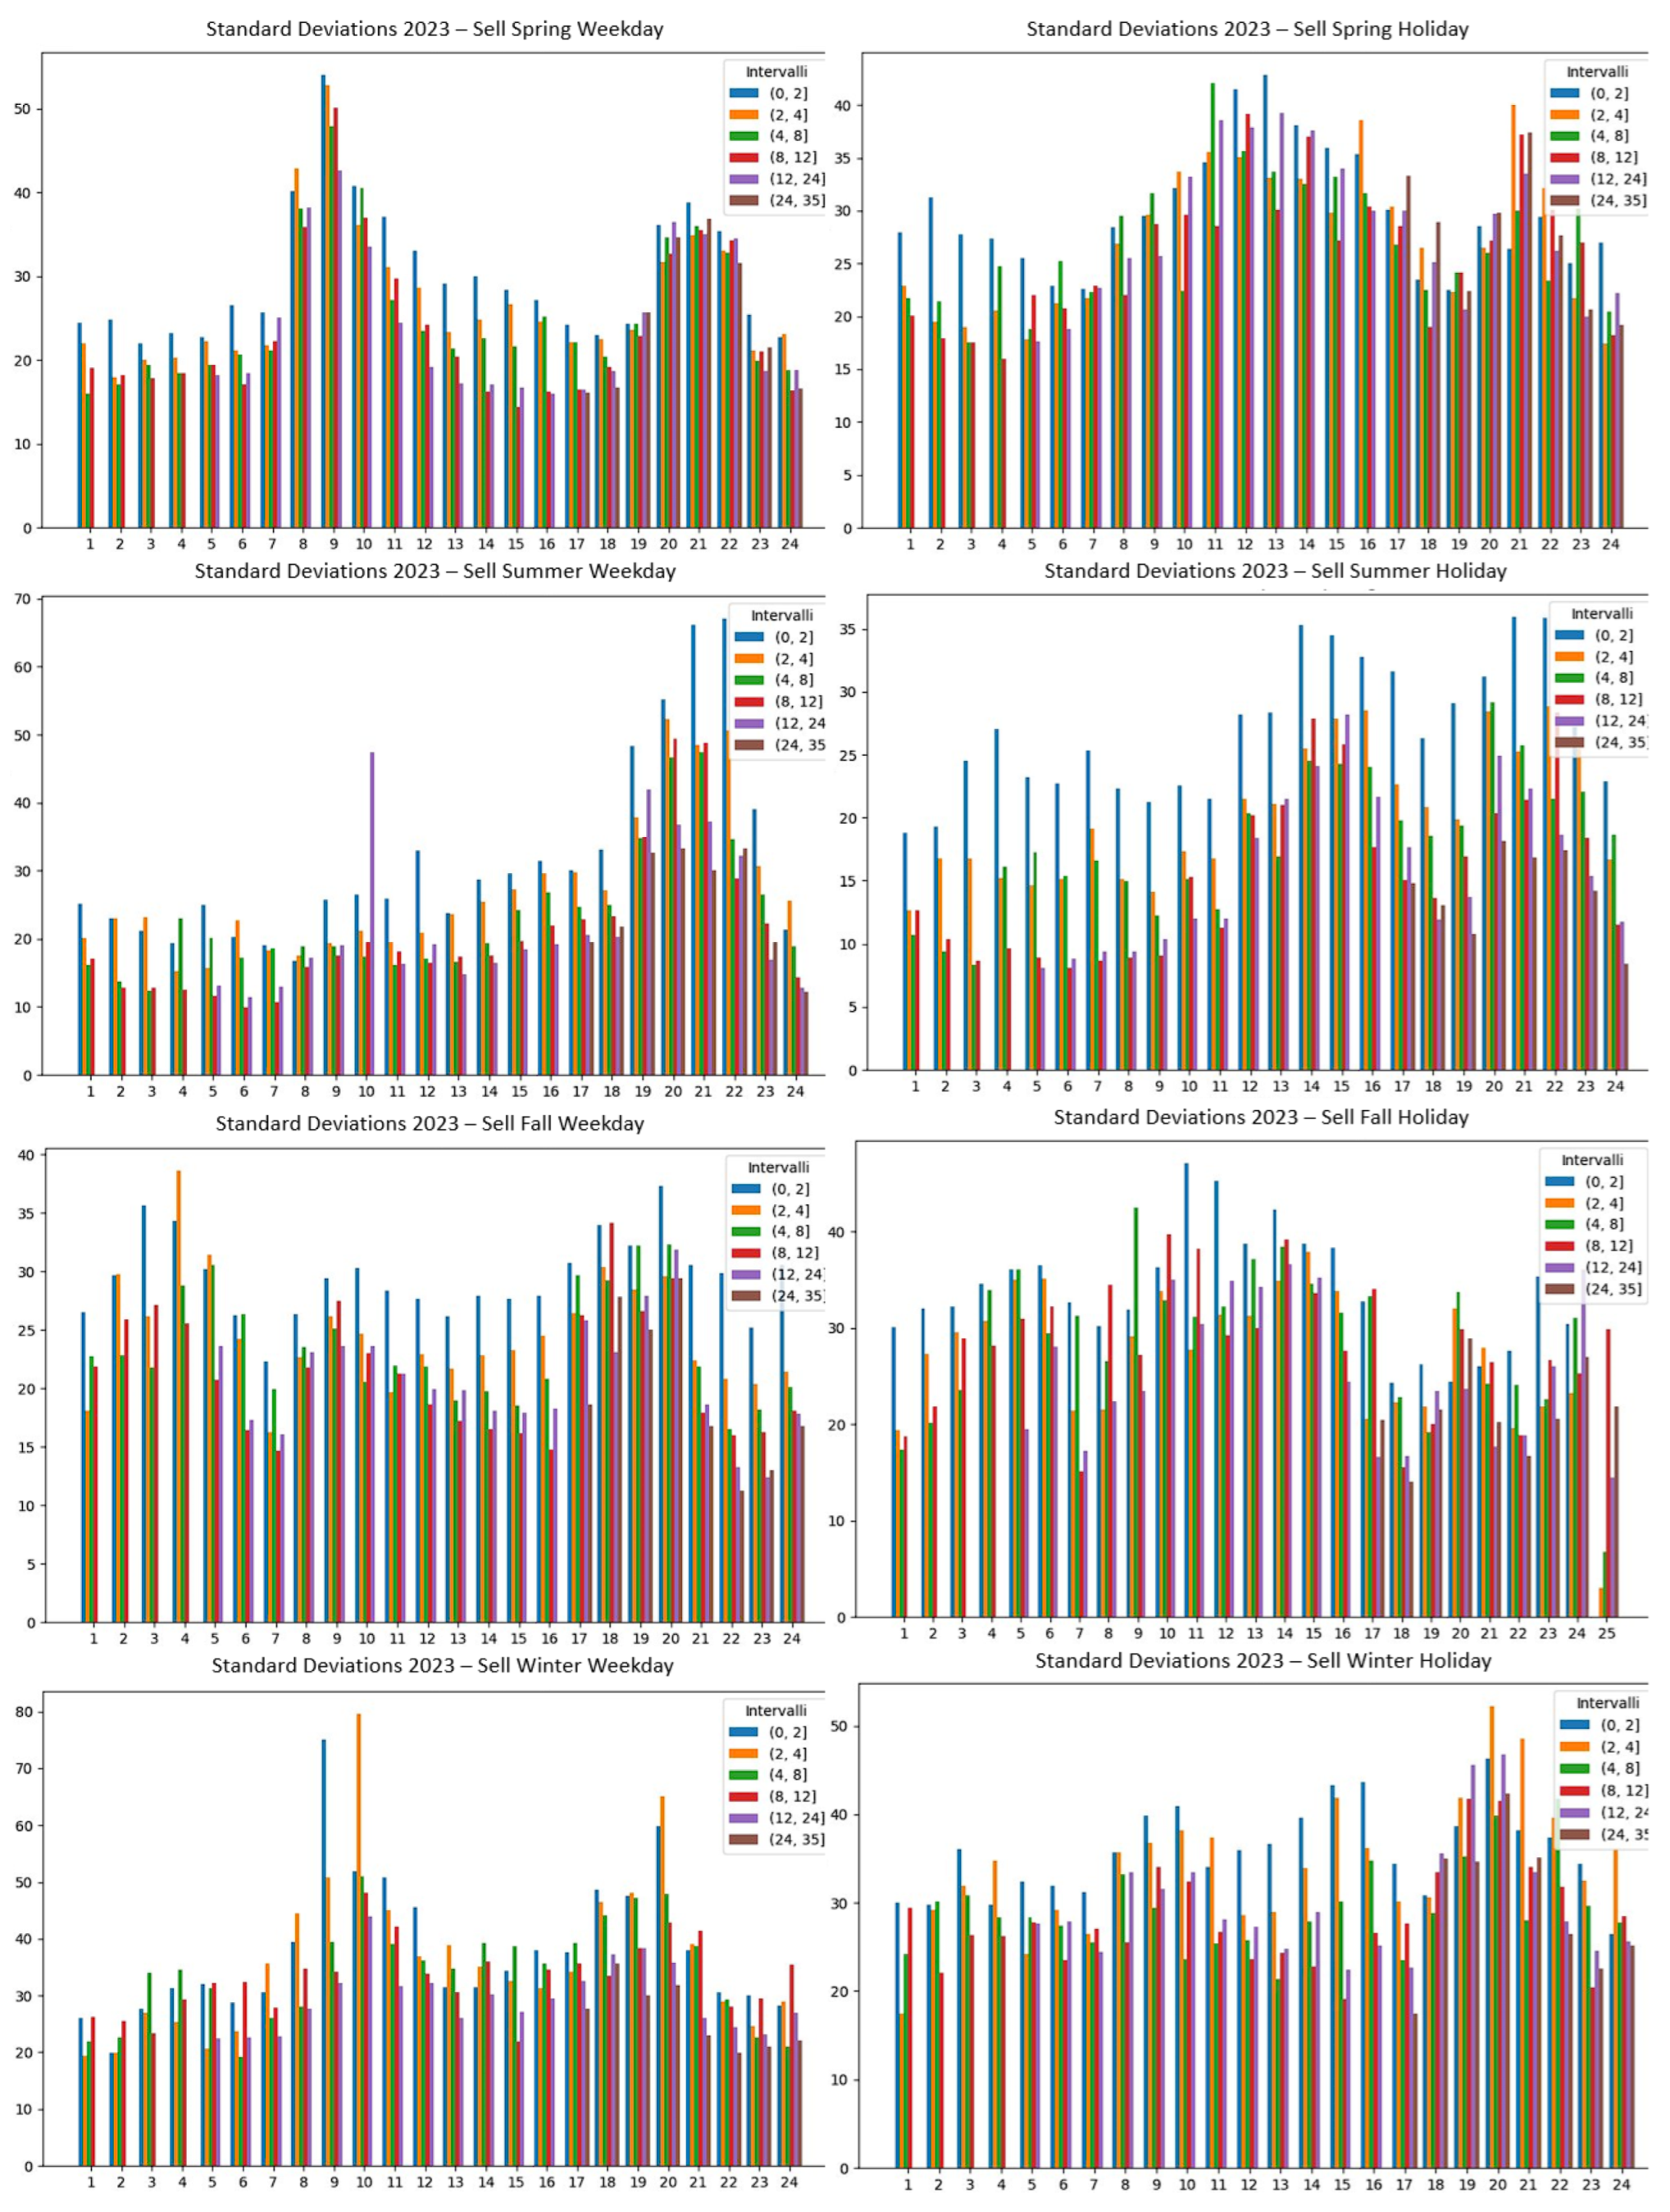
Figure 18.
Acceptance Probabilities in XBID.
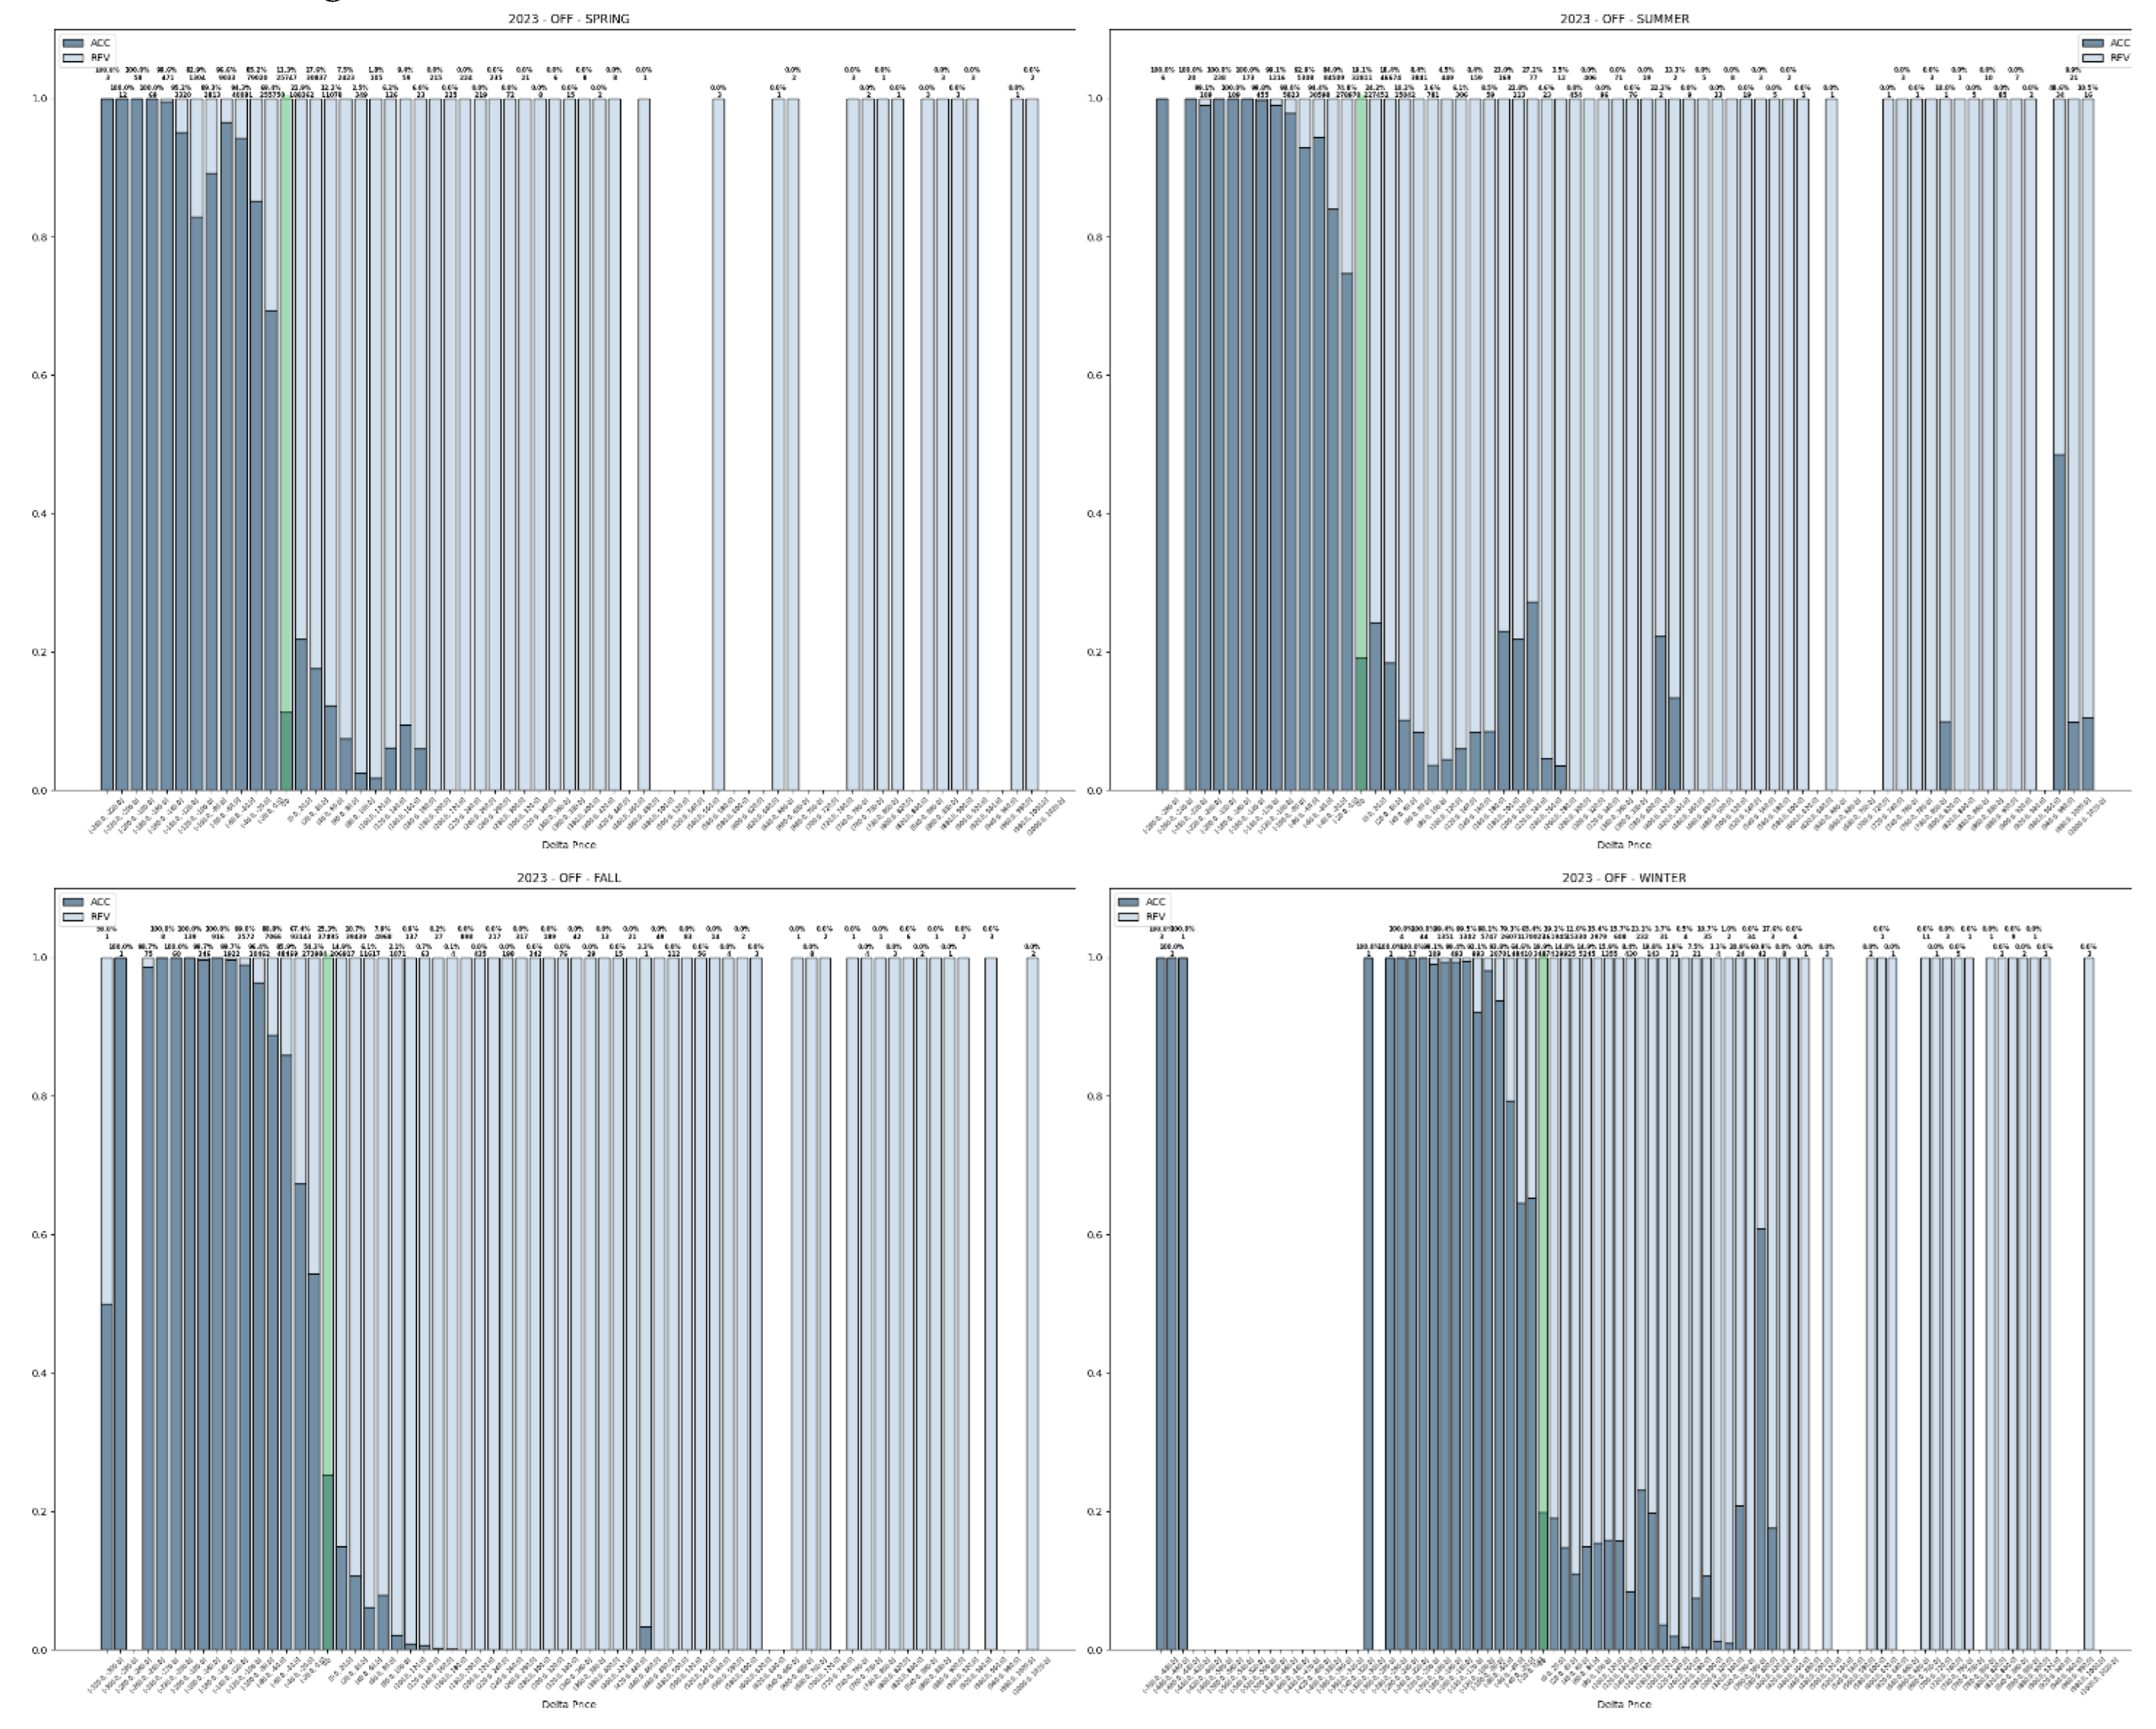
Figure 19.
Accepted Prices Distributions 2023: Submission interval, hour, season, day type (H12).
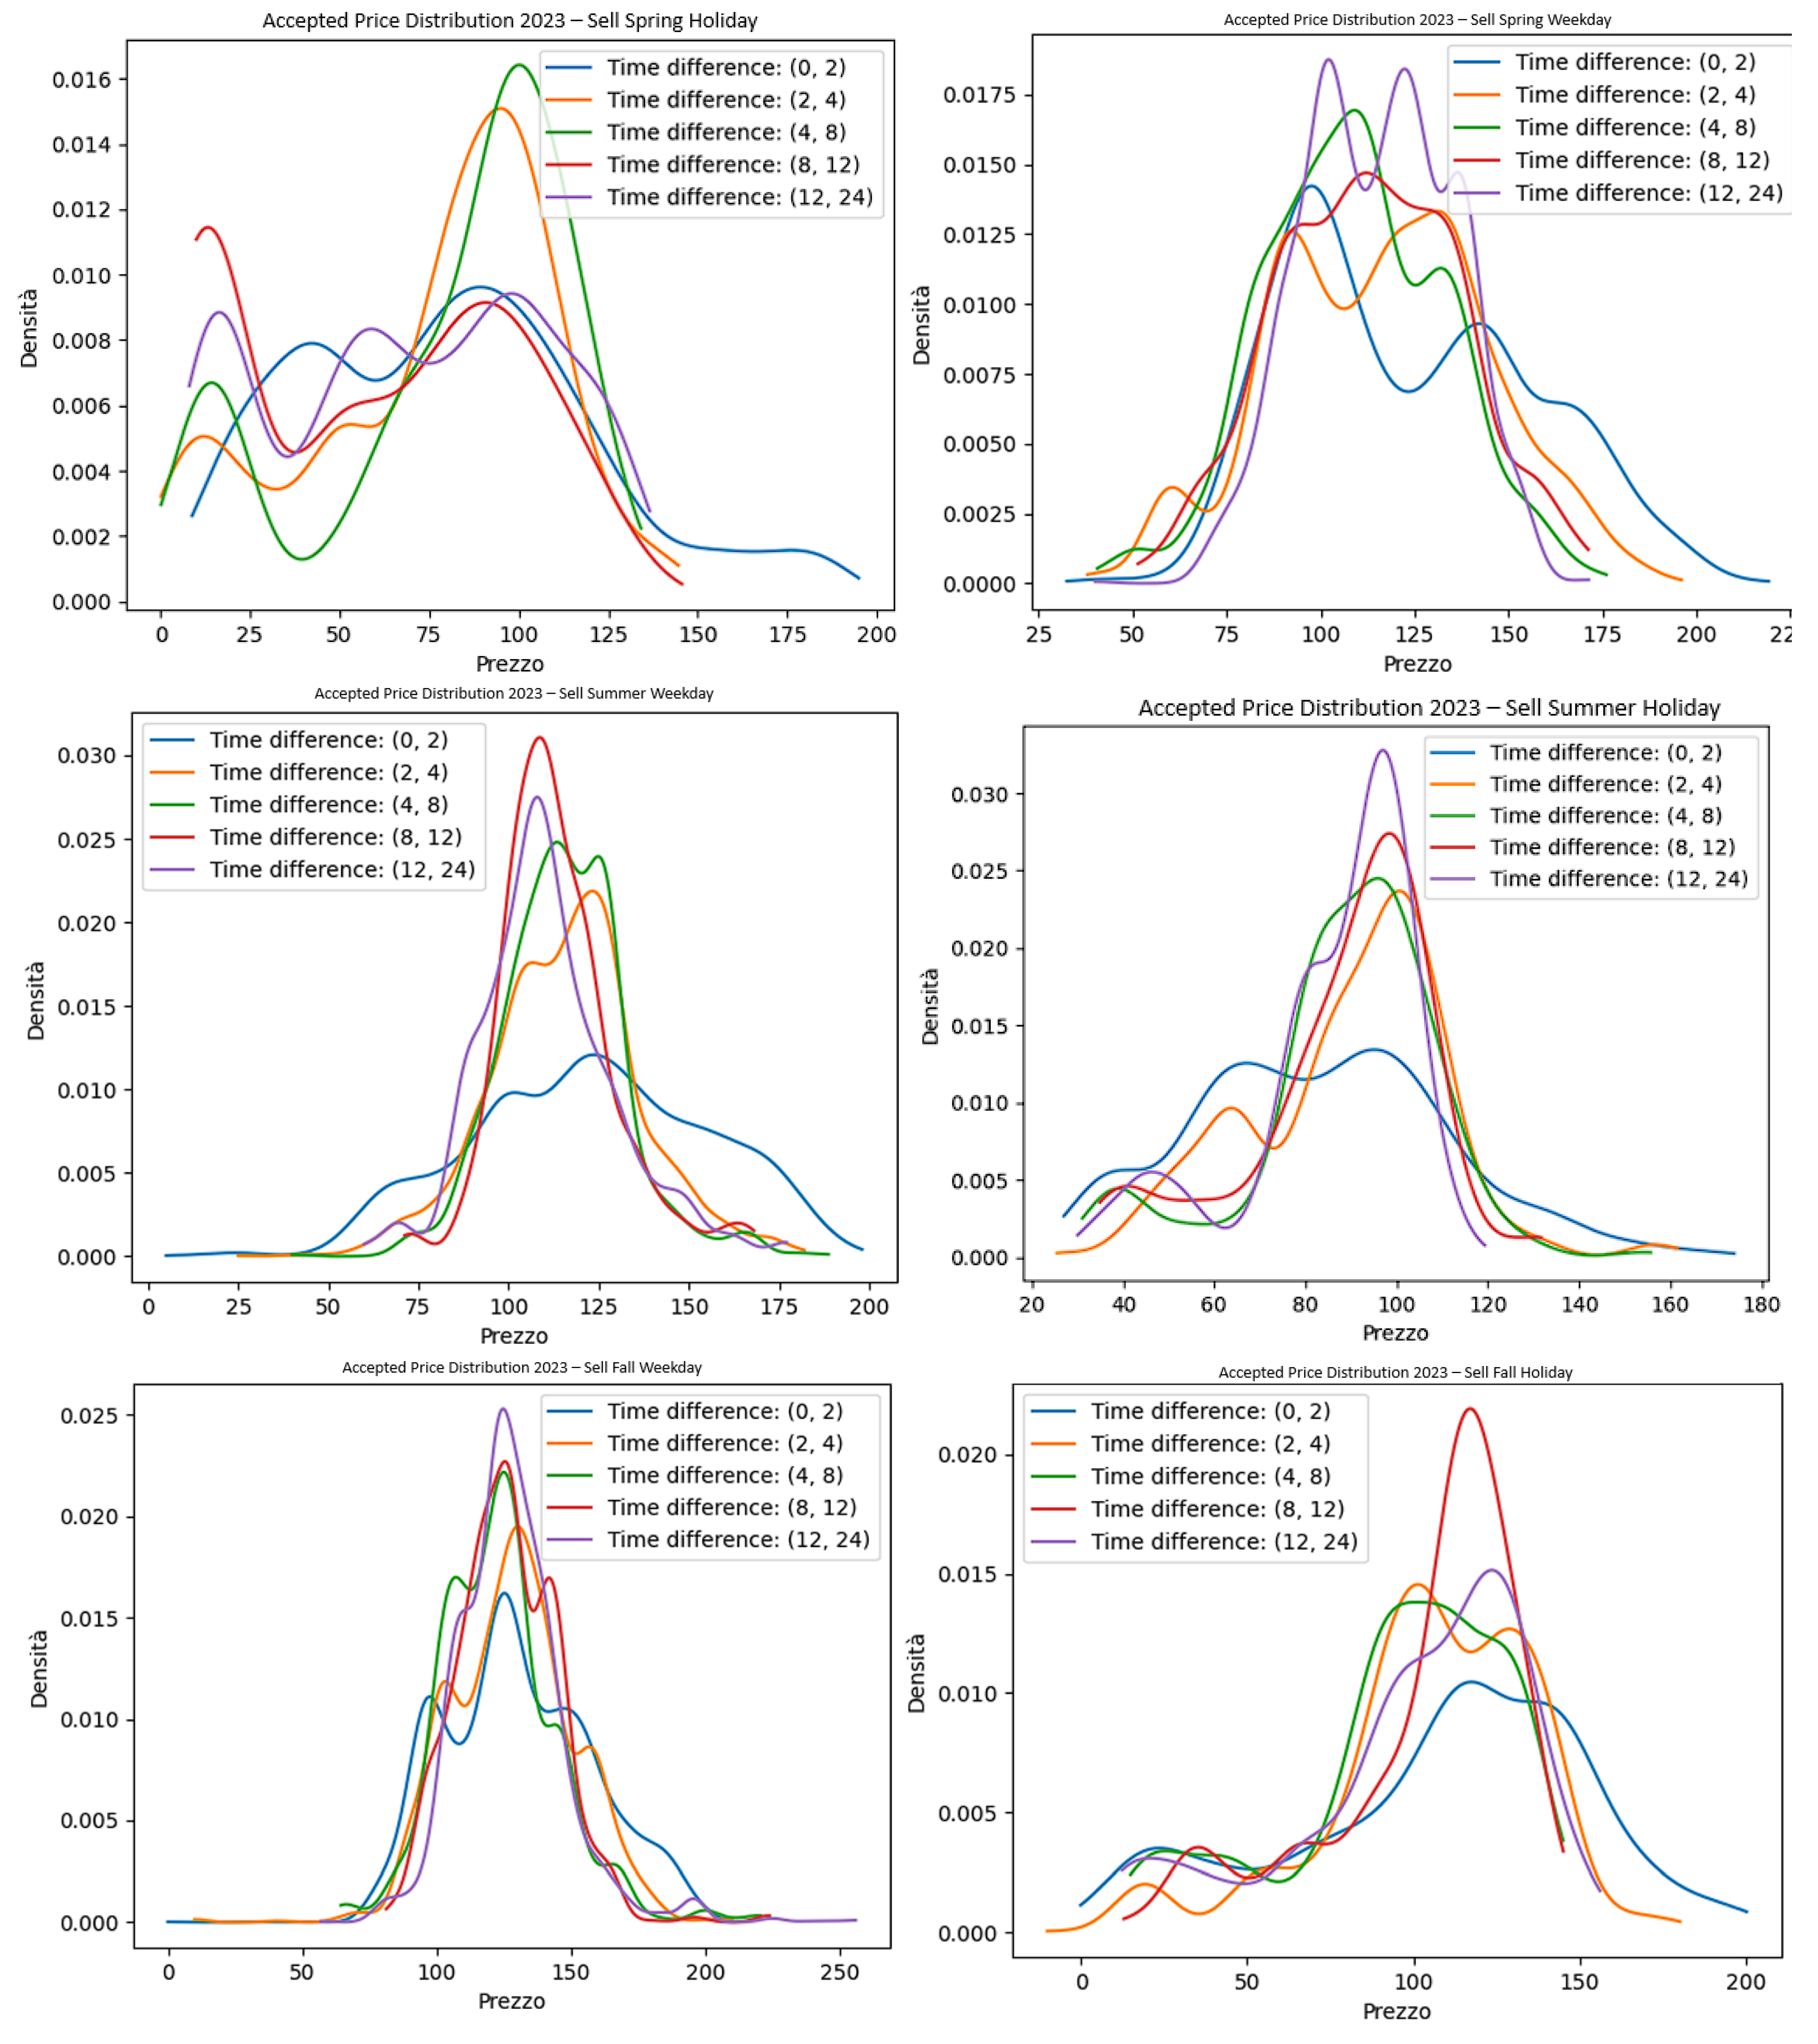
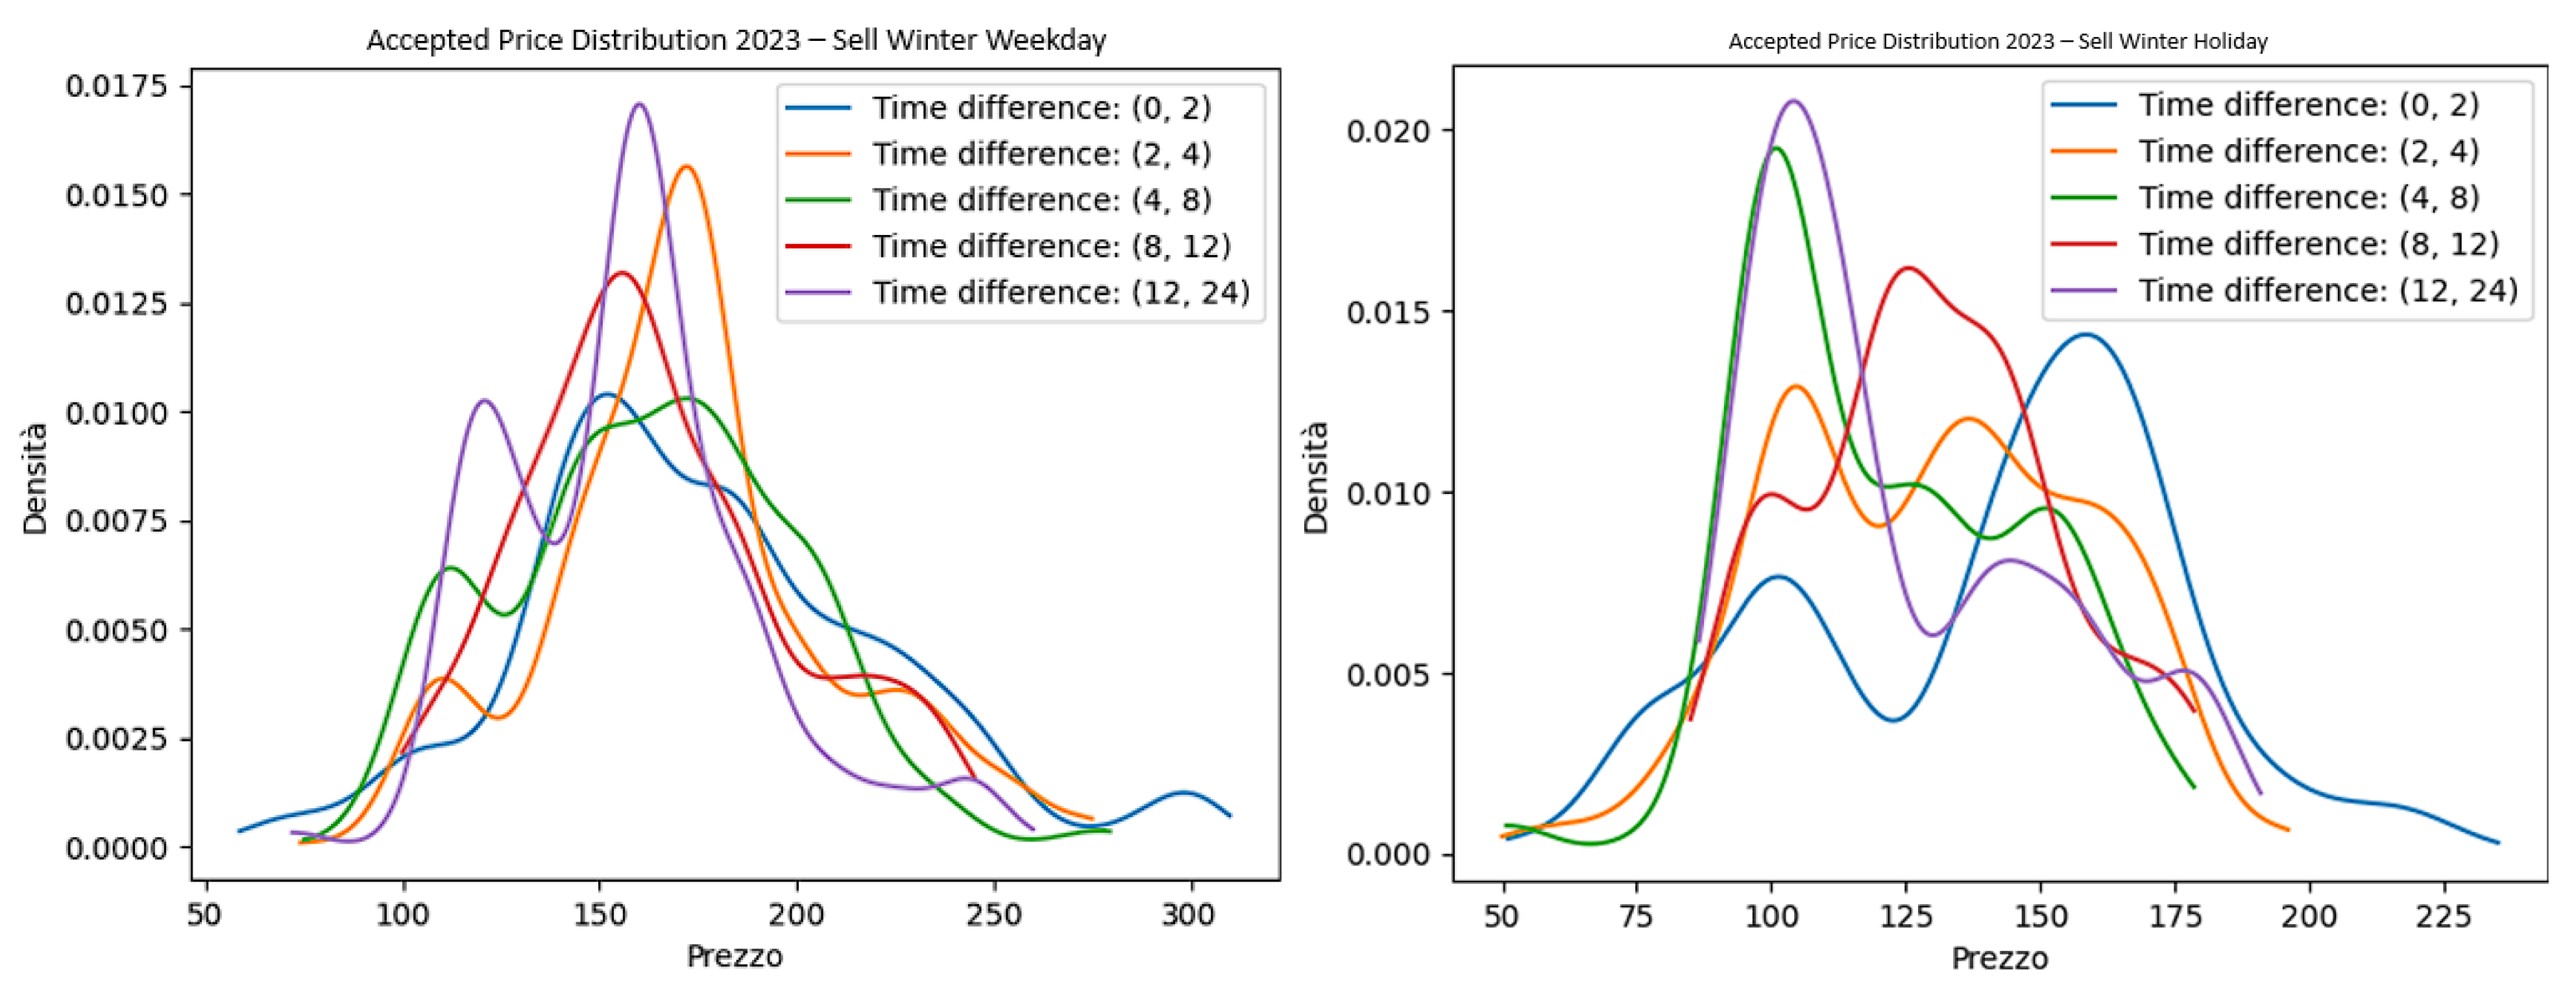
Figure 20.
Training Metrics.
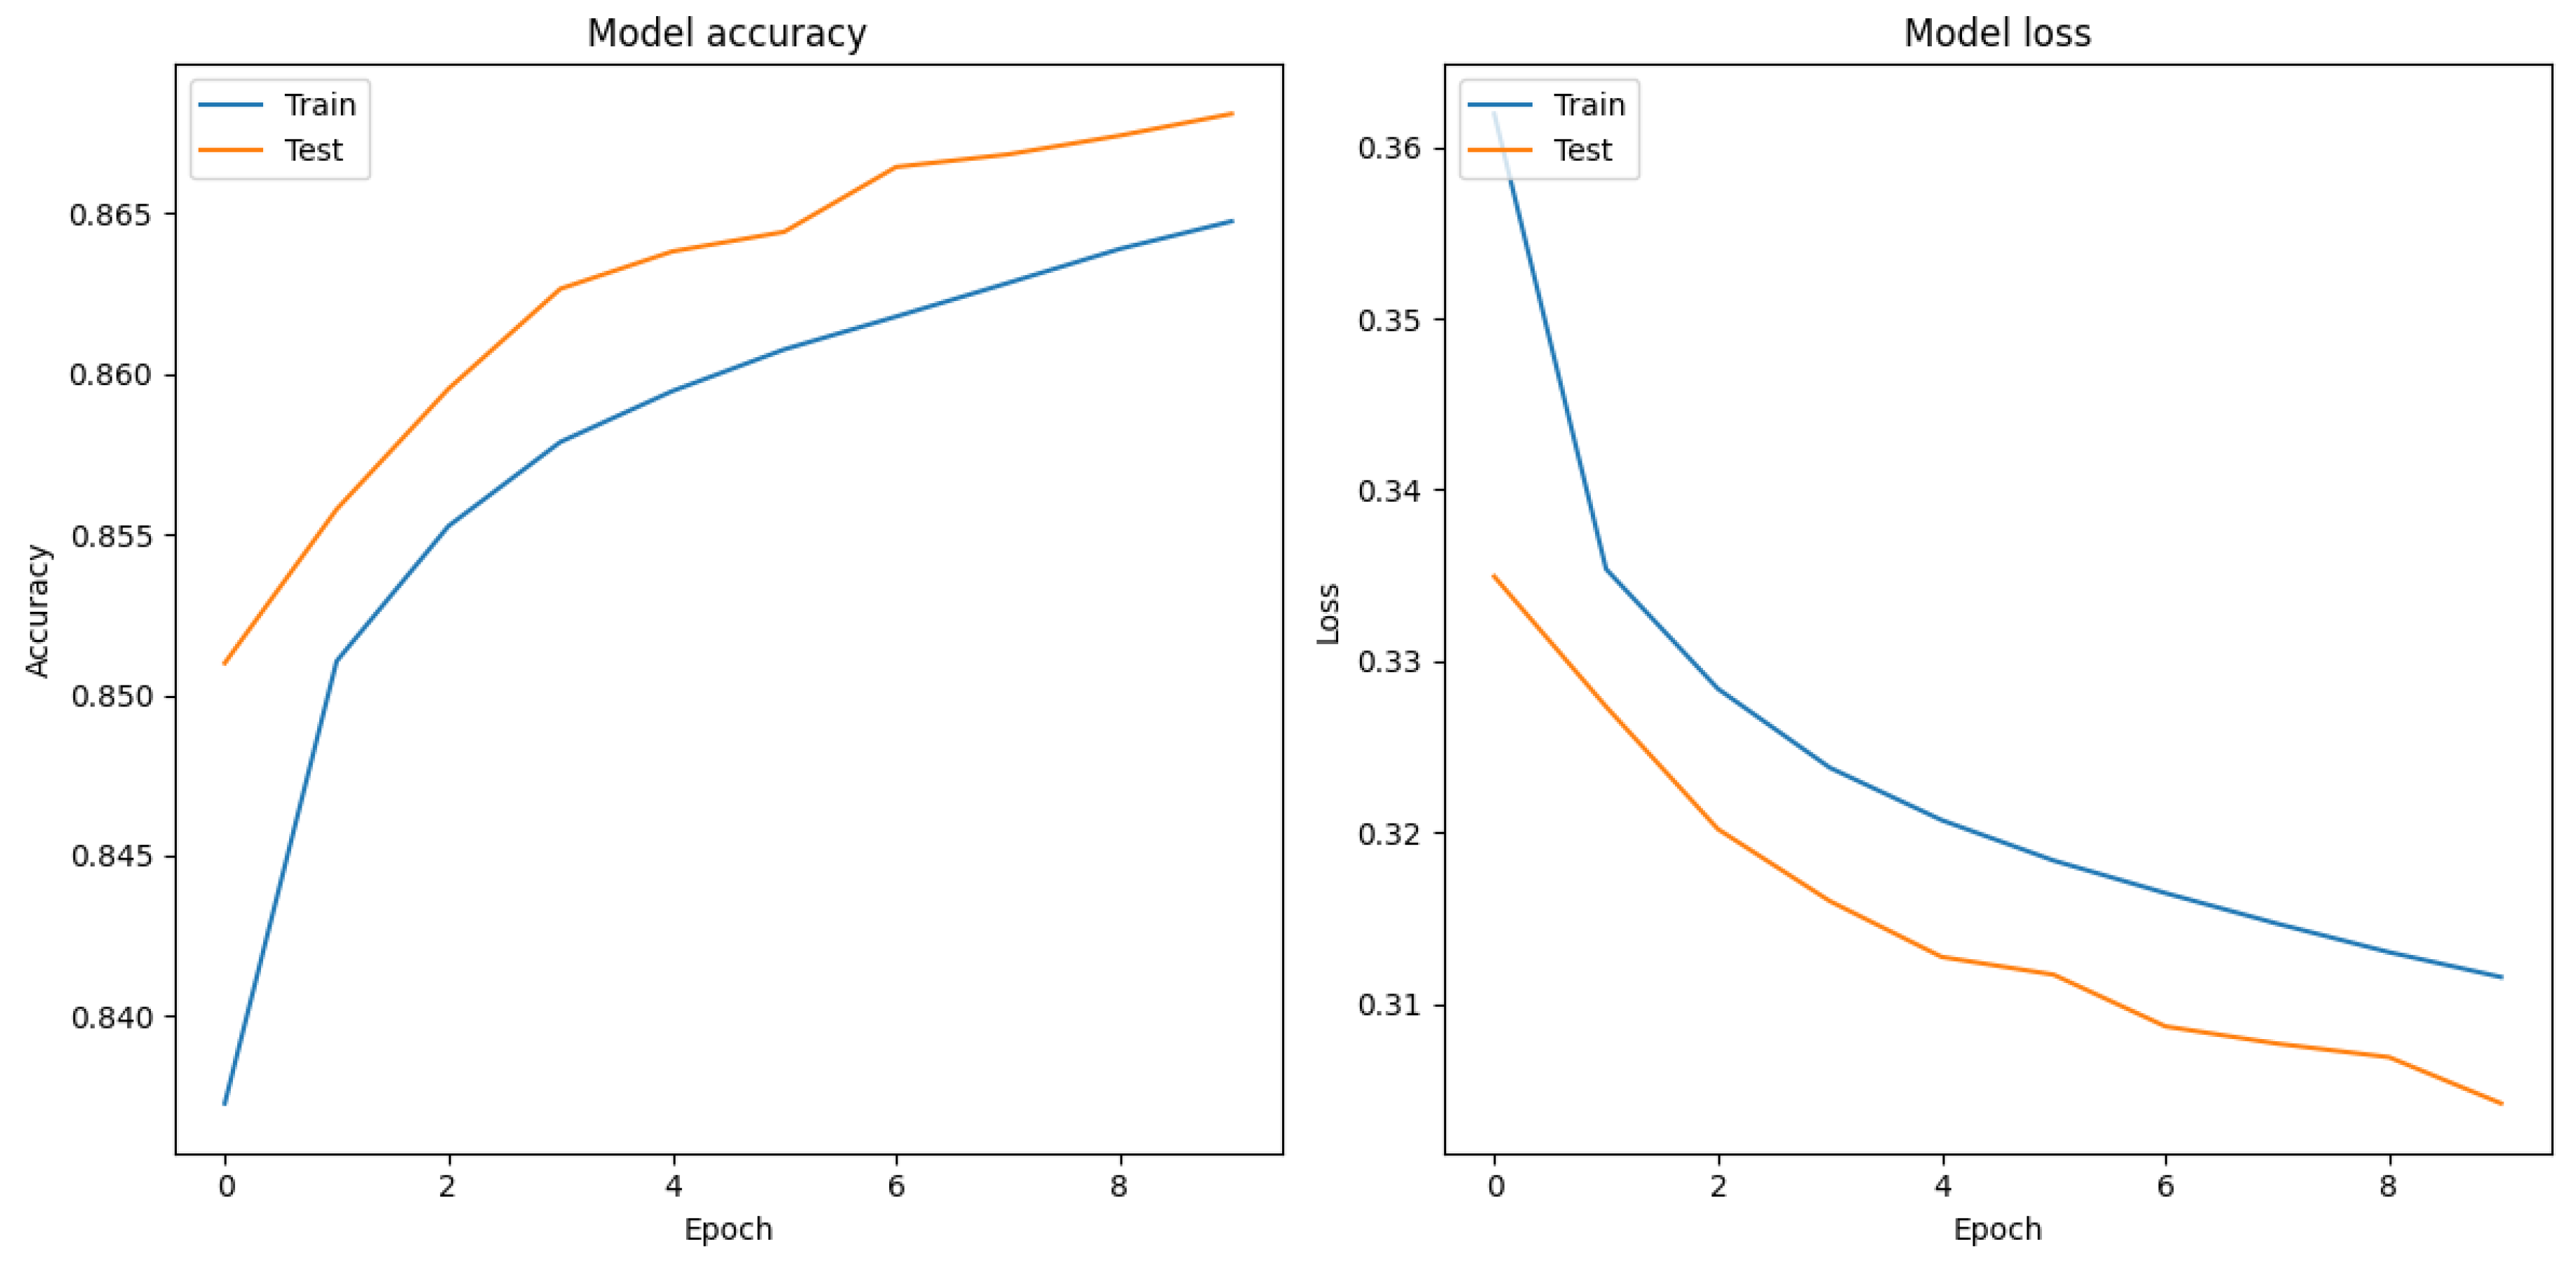
Figure 21.
AUC-ROC Curve.
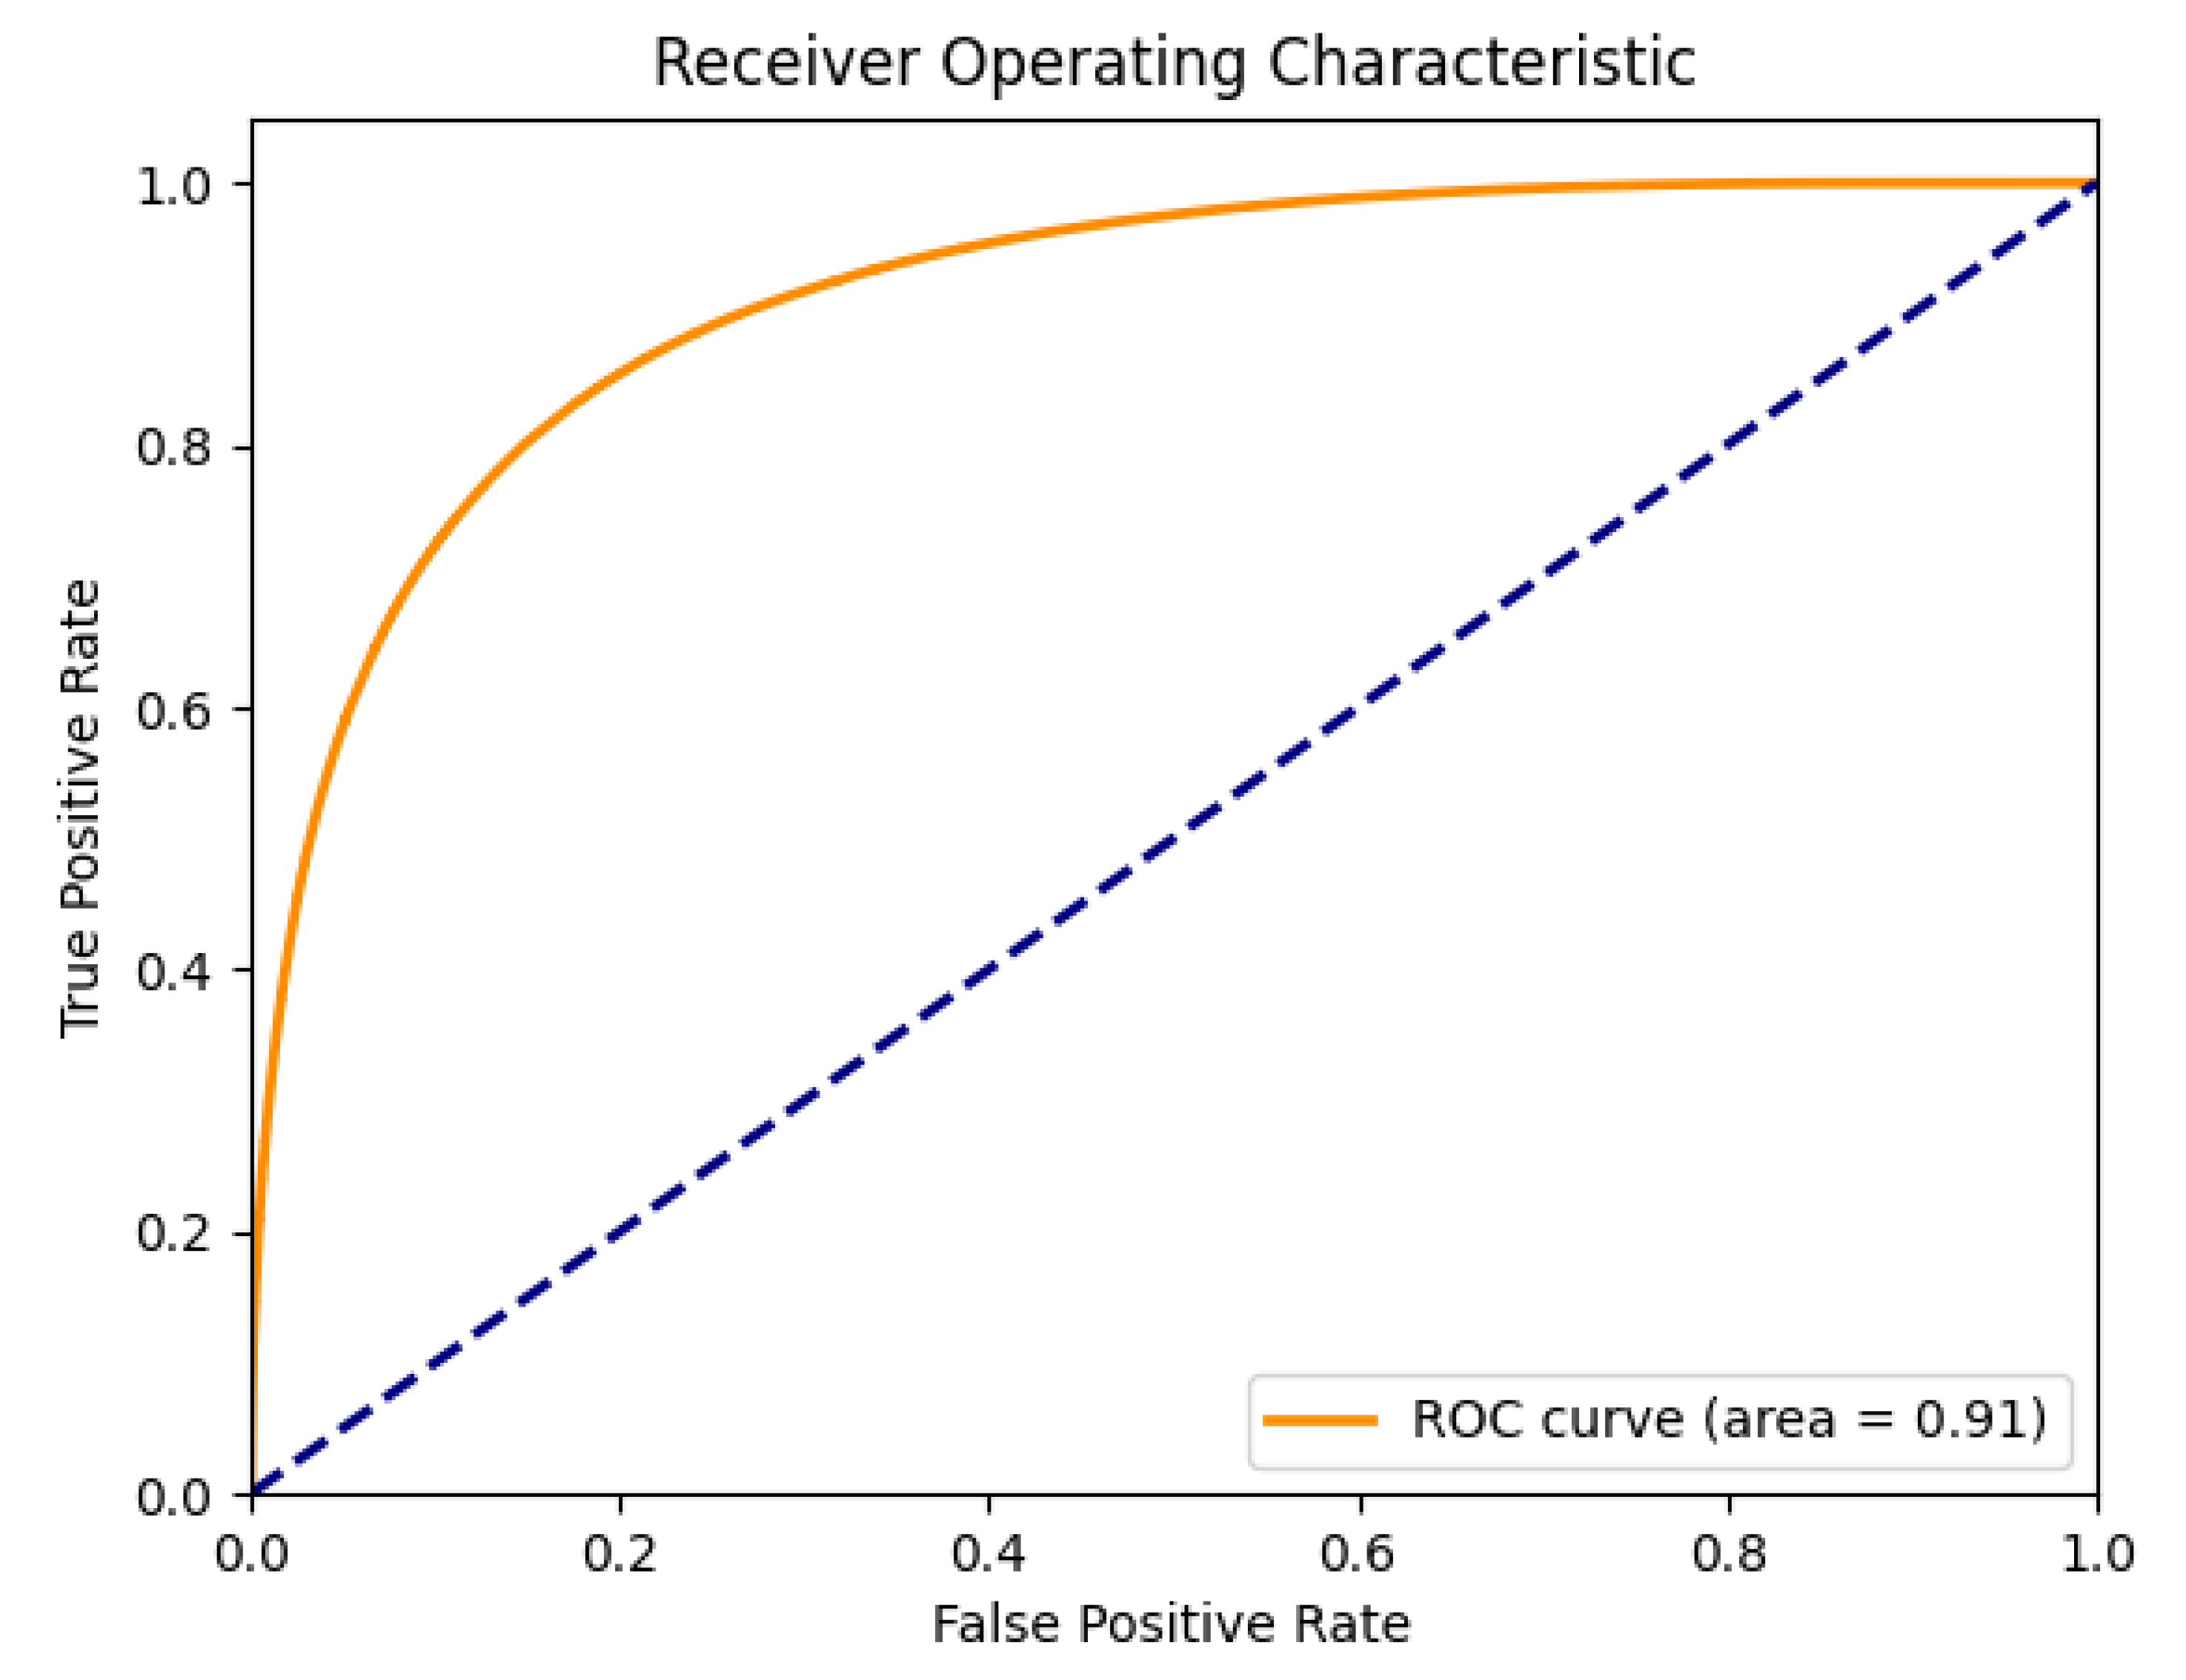
Figure 22.
Case C.
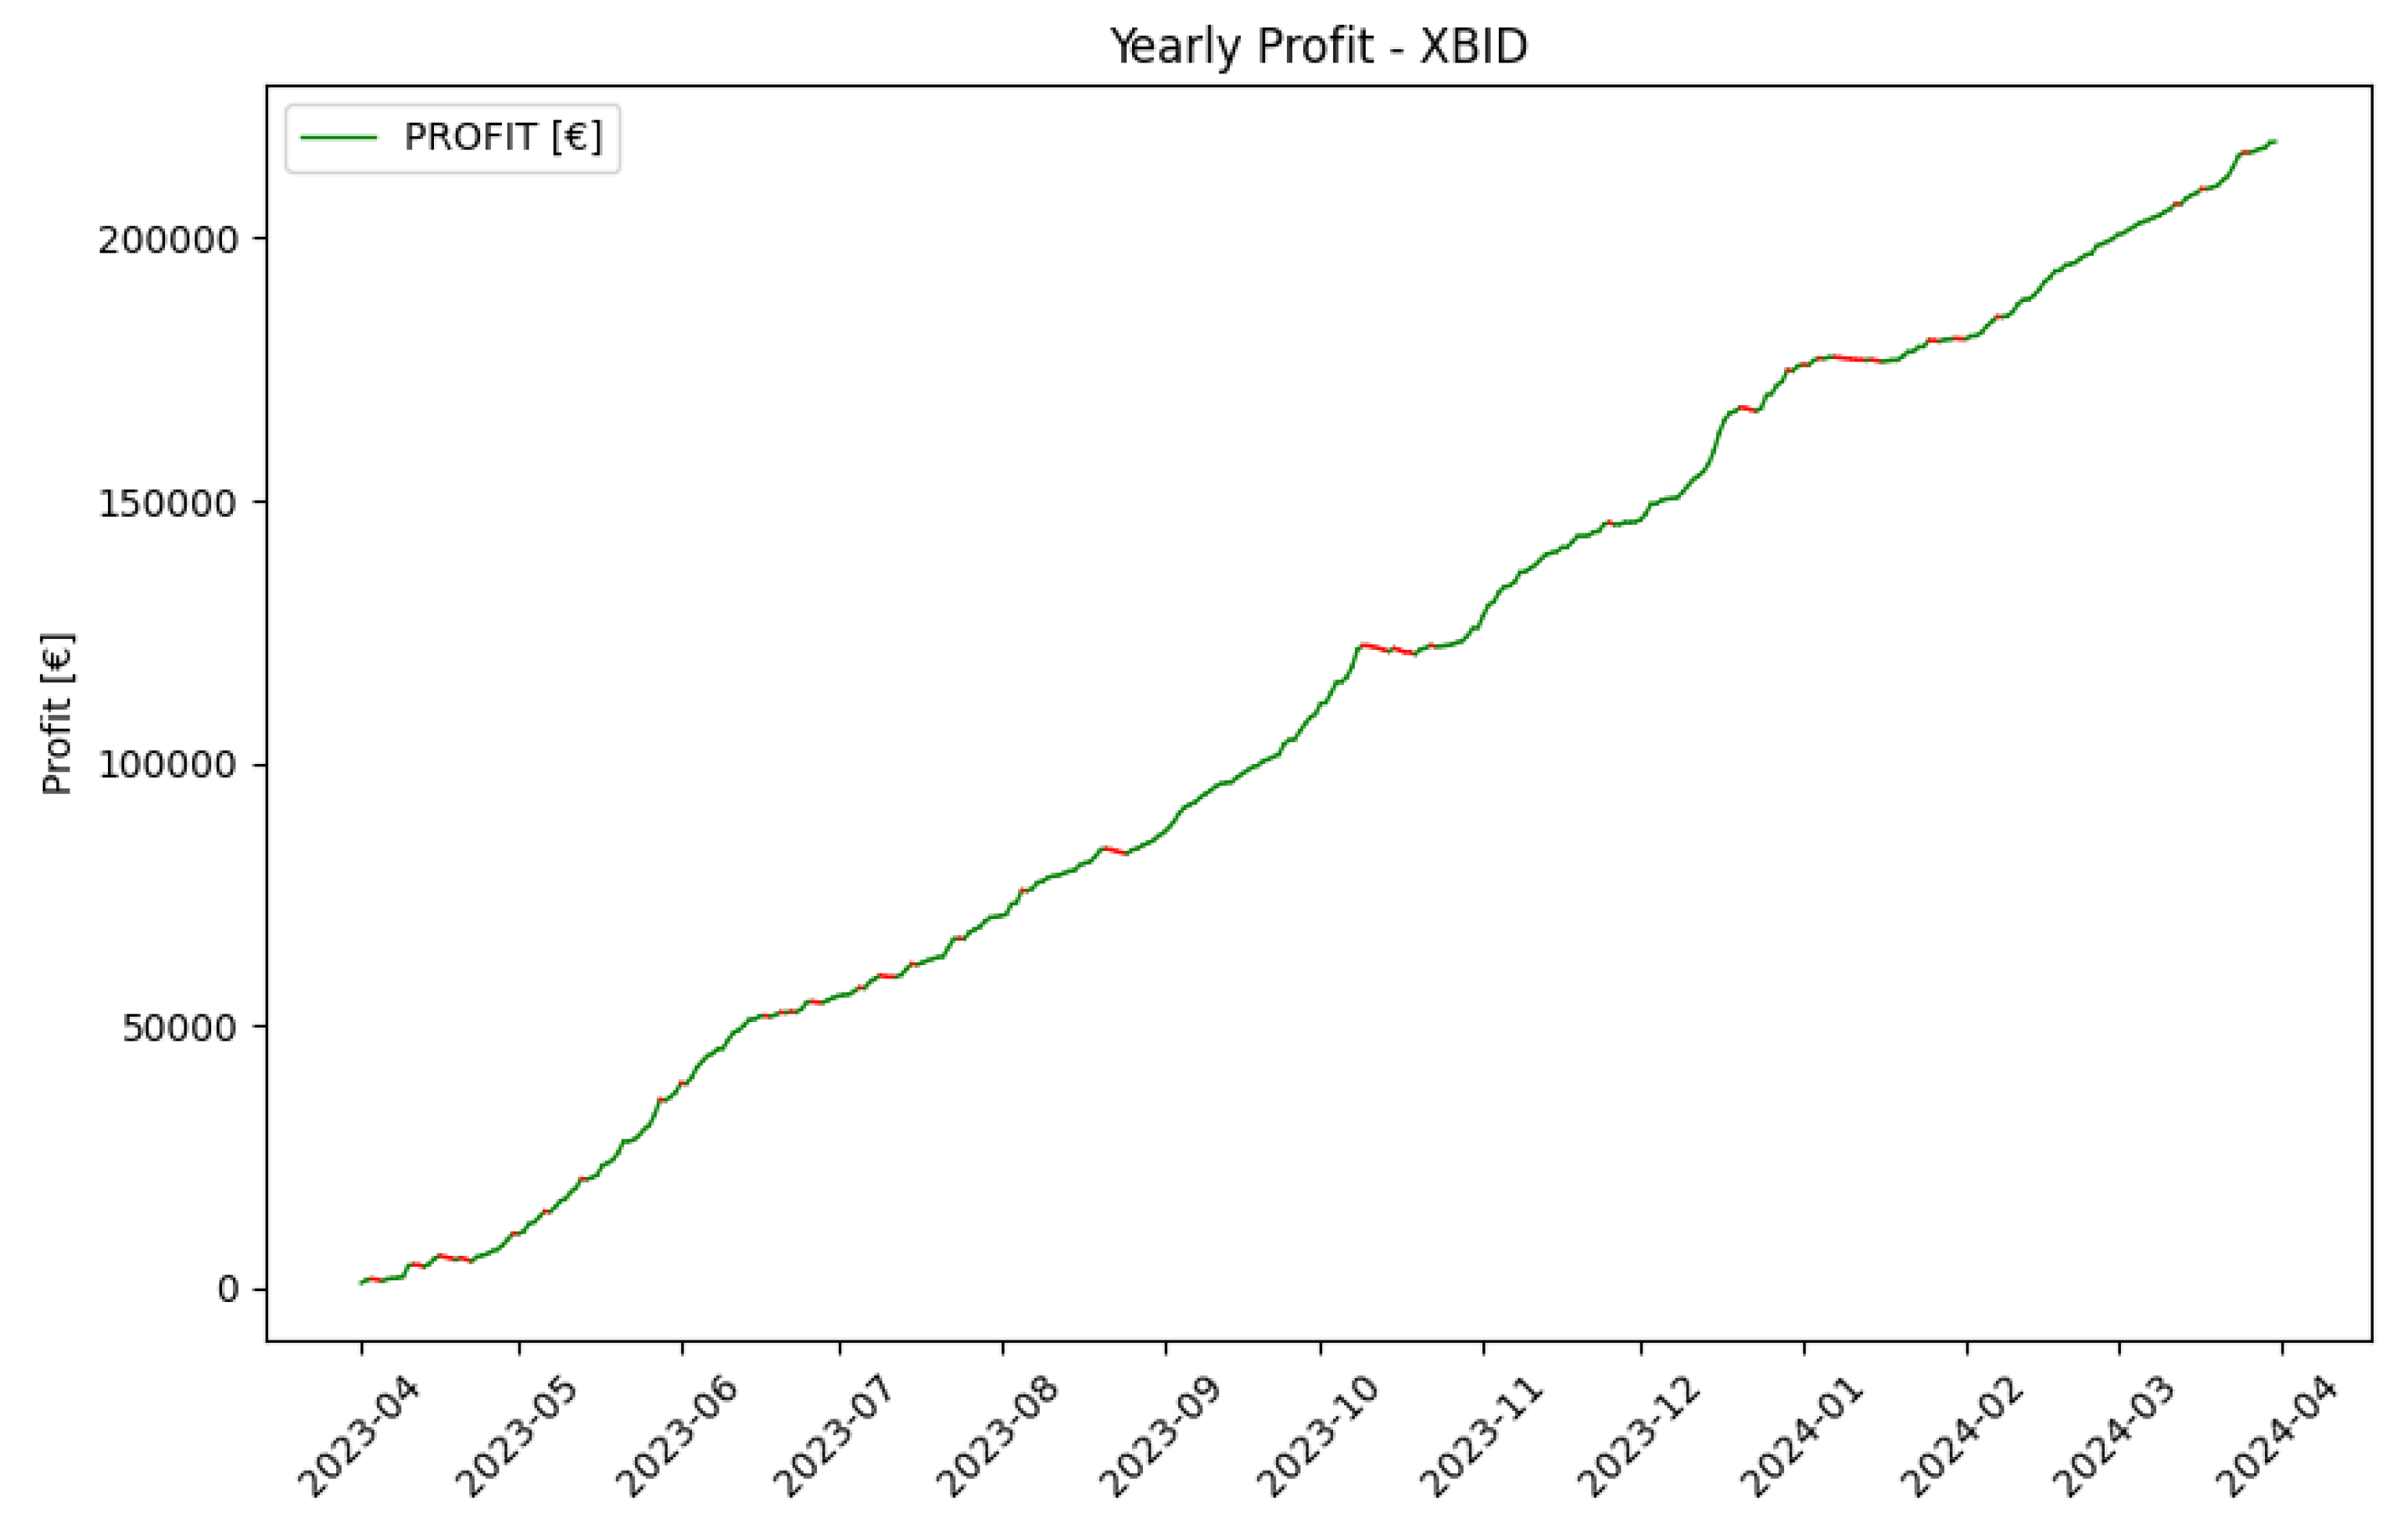
Figure 23.
Case D.
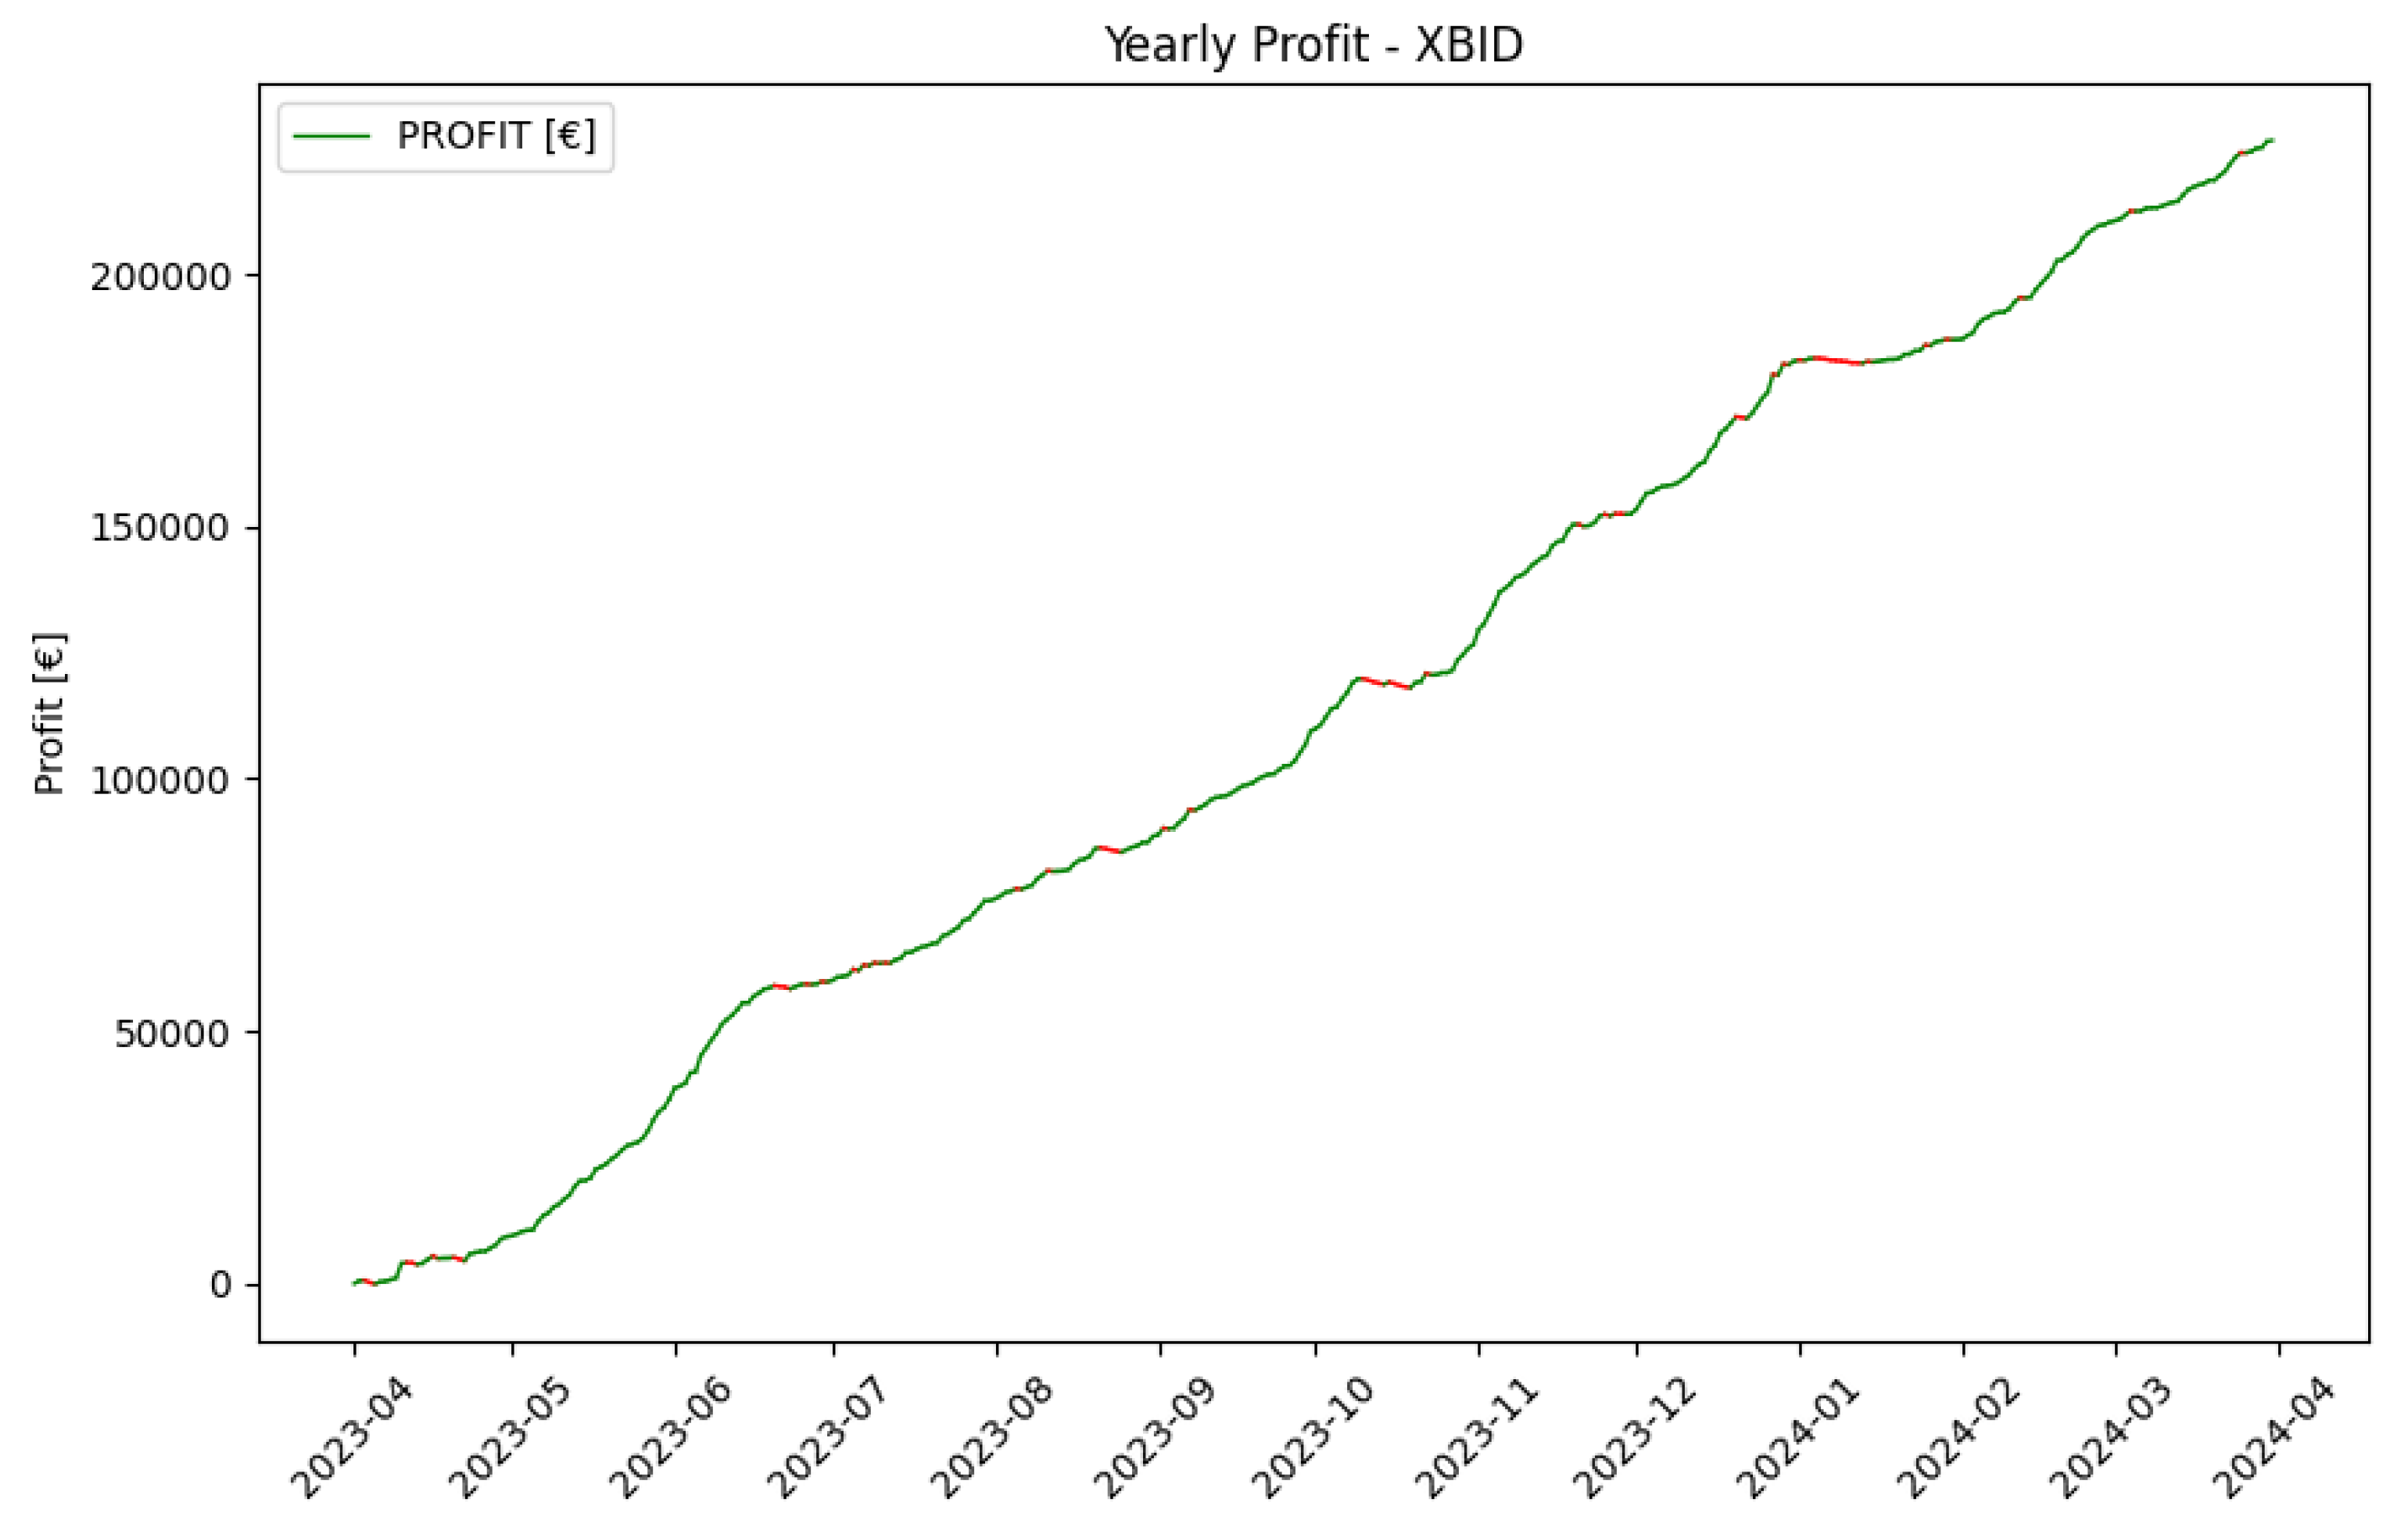
Figure 24.
Scenarios' Revenues.
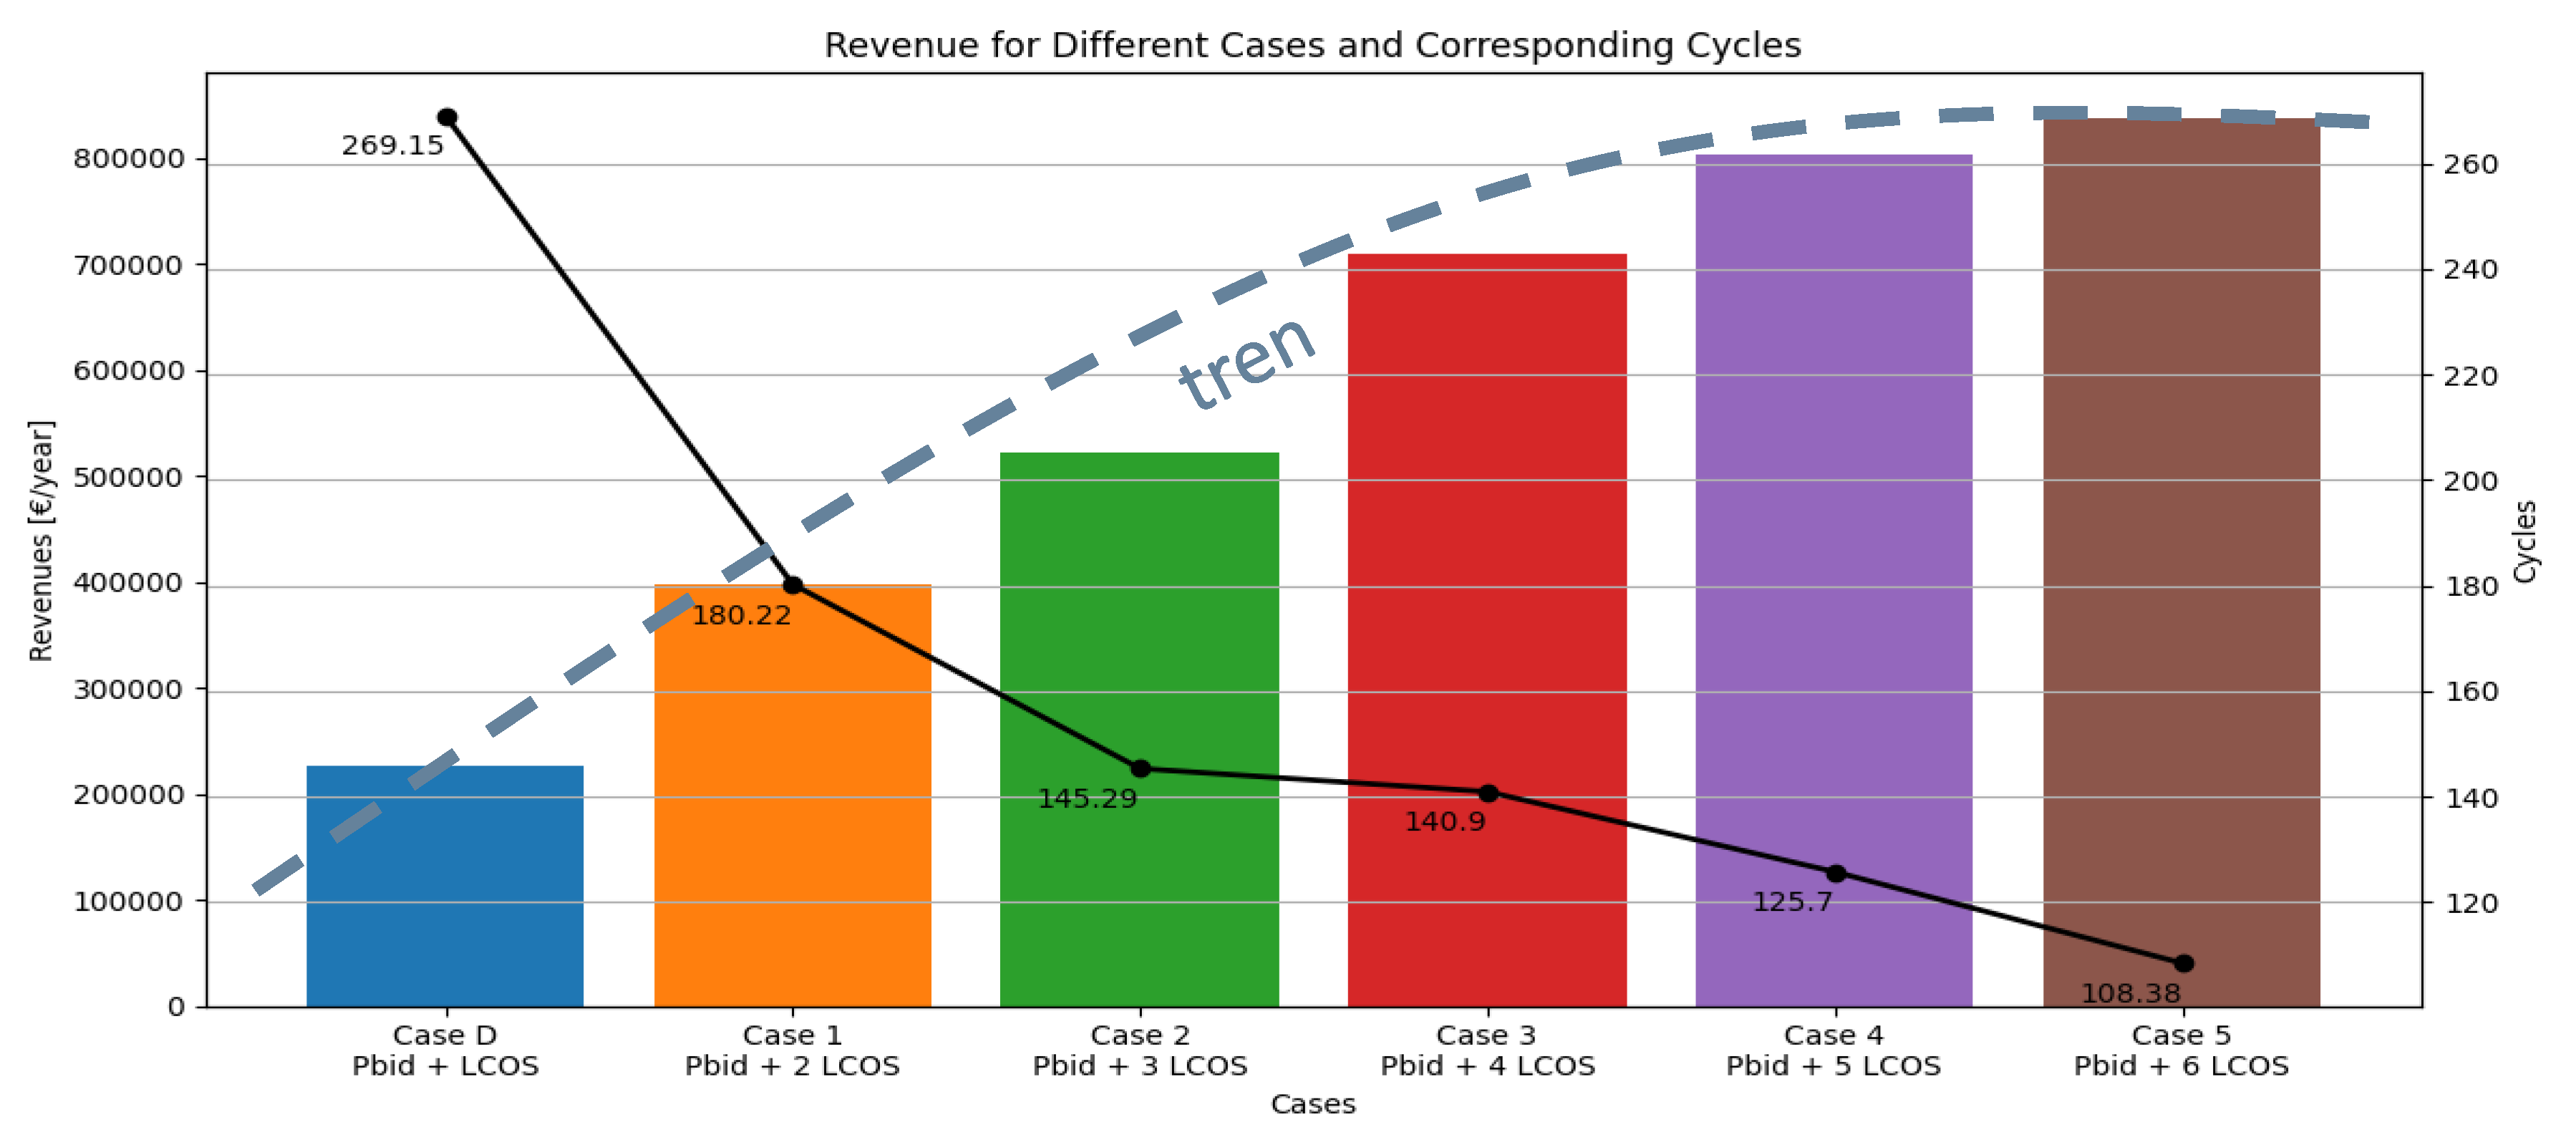
Table 1.
Features for the Zonal Price Prediction DL Tool.
| FEATURES | |
|---|---|
| HOUR | Specify the time of day |
| PREVIOUS DAY Pz | A number of features contain the hourly zonal price values for NORD region for all days up to a week before the given day |
| MEAN Pz | This feature contains the weighted average of the hourly zonal price values of the previous week |
| SEASON | Specify the season of the day in question |
| TYPE OF DAY | HOLI: holiday, WEEK: weekday |
| DAY NUMBER | Progressive number of the day in the year |
| MONTH | Specify the month of the day in question |
| GAS PUN | This feature reports the daily PUN of gas on the given day |
| TEMPERATURE | For each electrical zone into which Italy is divided, the temperature is reported for the hour and the day in question |
| PRECIPITATION | For each electrical zone into which Italy is divided, the precipitation is reported for the hour and the day in question |
| CLOUD COVER | For each electrical zone into which Italy is divided, the cloud coverage is reported for the hour and the day in question |
| WIND SPEED | For each electrical zone into which Italy is divided, the wind speed is reported for the hour and the day in question |
| GHI | For the day in question and the hour, the global horizontal irradiation is reported for the south of Italy |
Table 2.
Features for the Acceptance Probability Prediction DL Tool.
| FEATURES | |
|---|---|
| HOUR | Specify the time of day |
| OFFER TYPE | BID: offer to buy, OFF: offer to sell |
| PRICE | Offer price |
| ZONE | Specify the zone of relevance for the offer |
| TYPE OF DAY | HOLI: holiday, WEEK: weekday |
| INTERVAL | The number of hours in advance of the delivery time when the bid was made |
| SEASON | Specify the season of the day in question |
| PUN | Specify the PUN for the day in exam |
Table 3.
Economical Variables for calculation of LCOS.
| KEY | VALUE | REFERENCE |
| 9 M€ | / | |
| 300 k€/MWh | [3] | |
| 2% CAPEX [k€/MWh/year] | [4] | |
| 3500 | [5] | |
| 300 |
Table 4.
Metrics Evaluation of Pz Prediction Tool.
| PREDICTION TOOL vs PERSISTENT STRATEGY Performances | |||
|---|---|---|---|
| MSE | RMSE | R2 | |
| DL Tool | 326,9744 | 18,0824 | 0,624 |
| Persistence Strategy | 378,8546 | 19,4642 | 0,5643 |
| Improvement | +13,69% | +7,1% | + 10,58% |
Table 6.
DAM CASE A.
| CASE A | |
| Operative Days | 313 |
| 13434.87 MWh | |
| 11438.03 MWh | |
| N° Total Cycles | 414.55 |
| 271085.25 €/year | |
Table 7.
DAM CASE B.
| CASE B | |
| Operative Days | 42 |
| 1918.92 MWh | |
| 1348.6 MWh | |
| N° Total Cycles | 54.46 |
| 19359.36 €/year | |
Table 8.
Model Metrics.
| Model Performance Metrics Performances | |||
|---|---|---|---|
| Accuracy | Precision | Recall | F1-Score |
| 0.81 | 0.58 | 0.57 | 0.58 |
Table 9.
Initial Conditions on XBID.
| CASE C | CASE D | |
| Simulation Period | From 2023/04/01 to 2024/03/31 | |
| Pnom | 10 MW | |
| Enom | 30 MWh | |
| SOCmin (SOCmin and SOCmax are introduced to avoid trespassing the BESS capability limits) | 5% | |
| SOCmax3 | 95% | |
| SOCinitial, 0 | 50% | |
| LCOS | 0 €/MWh | 53.14 €/MWh |
Table 10.
XBID Case C.
| CASE C | |
| Operative Days | 366 |
| 8691.41 MWh | |
| 7436.59 MWh | |
| N° Total Cycles | 268.8 |
| 2188421.27 €/year | |
Table 12.
Sensitivity Analysis Results.
| Sensitivity Analysis Results | ||||||
| CASE D | CASE 1 | CASE 2 | CASE 3 | CASE 4 | CASE 5 | |
| Operative Days | 366 | 366 | 366 | 366 | 366 | 366 |
| 8702.8 MWh | 5827.24 MWh | 4697.76 MWh | 4555.8 MWh | 4064.34 MWh | 3504.36 MWh | |
| 7446.33 MWh | 4985.94MWh | 4019.52 MWh | 3898.05 MWh | 3477.55 MWh | 2998.42 MWh | |
| N° Total Cycles | 269.15 | 180.22 | 145.29 | 140.9 | 125.7 | 108.38 |
| 226517.09 €/year | 396822.9 €/year | 522604.39 €/year | 710443.95 €/year | 803124.87 €/year | 838510.4 €/year | |
| NPV | -8.54 M€ | -6.3 M€ | -4.17 M€ | -1.52 M€ | 0.28 M€ | 1.54 M€ |
Disclaimer/Publisher’s Note: The statements, opinions and data contained in all publications are solely those of the individual author(s) and contributor(s) and not of MDPI and/or the editor(s). MDPI and/or the editor(s) disclaim responsibility for any injury to people or property resulting from any ideas, methods, instructions or products referred to in the content. |
© 2024 by the authors. Licensee MDPI, Basel, Switzerland. This article is an open access article distributed under the terms and conditions of the Creative Commons Attribution (CC BY) license (http://creativecommons.org/licenses/by/4.0/).
Copyright: This open access article is published under a Creative Commons CC BY 4.0 license, which permit the free download, distribution, and reuse, provided that the author and preprint are cited in any reuse.


